Embed Size (px)
Citation preview
ArrayControl™ Spots and Spikes
(Cat #AM1780, AM1781)
Instruction Manual
I. Introduction . . . . . . . . . . . . . . . . . . . . . . . . . . . . . . . . . . . . . . . . . . . . . . . . . . . . . . . . . . . . . . . . . . . . . . . . 1
A. Product Description
B. Kit Components and Storage
C. Materials Not Provided with the Kit
D. Related Products Available from Ambion
II. Using ArrayControl Spots and Spikes . . . . . . . . . . . . . . . . . . . . . . . . . . . . . . . . . . . . . . . . . . . . . . . . . 6
A. Spotting Suggestions
B. Handling the ArrayControl RNA Spikes
C. ArrayControl Dilution Series Examples
III. ArrayControl Applications . . . . . . . . . . . . . . . . . . . . . . . . . . . . . . . . . . . . . . . . . . . . . . . . . . . . . . . . . . 12
A. Using ArrayControl Sense Oligo Spots for Printing Optimization
B. Production of Test Arrays
C. Determining Detection and Sensitivity Limits of a Microarray System
D. Determining the Dynamic Range of a Microarray System
E. Normalization Coefficient(s)
F. Negative Control
G. Creating a Labeled Hybridization Standard
IV. Troubleshooting. . . . . . . . . . . . . . . . . . . . . . . . . . . . . . . . . . . . . . . . . . . . . . . . . . . . . . . . . . . . . . . . . . . . 16
A. None of the Sense Oligo Spots Fluoresce
B. ArrayControl Sense Oligo Spots are Much More Intense than Array Gene Features
C. One or More Sense Oligo Spots Do Not Fluoresce
V. Appendix . . . . . . . . . . . . . . . . . . . . . . . . . . . . . . . . . . . . . . . . . . . . . . . . . . . . . . . . . . . . . . . . . . . . . . . . . . 18
A. Experimental RNA for Use in Microarray Hybridization
B. References
C. ArrayControl Kit Specifications
D. Quality Control
Manual1780M Revision C Revision Date: July 16, 2007
For research use only. Not for use in diagnostic procedures.
Literature Citation
When describing a procedure for publication using this product, we would appreciatethat you refer to it as the ArrayControl™ Kit.
If a paper that cites one of Ambion’s products is published in a research journal, the author(s) may receive afree Ambion T-shirt by sending in the completed form at the back of this instruction manual, along with acopy of the paper.
Warranty and Liability
Applied Biosystems is committed to delivering superior product quality and perfor-mance, supported by industry-leading global service and technical support teams. Warranty information forthe accompanying consumable product is available at www.ambion.com/info/warranty in “Limited Warrantyfor Consumables,” which is subject to the exclusions, conditions, exceptions, and limitations set forth underthe caption “EXCLUSIONS, CONDITIONS, EXCEPTIONS, AND LIMITATIONS” in the full warrantystatement. Please contact Applied Biosystems if you have any questions about our warranties or would likeinformation about post-warranty support.
Ambion/AB Trademarks
Applied Biosystems, AB (Design), Ambion, MEGAscript and RETROscript areregistered trademarks, and ArrayControls, MEGAclear, MessageAmp, NucAway, Poly(A)Purist, and SlideHybare trademarks of Applera Corporation or its subsidiaries in the US and/or certain other countries.
All other trademarks are the sole property of their respective owners.
© 2007 Ambion, Inc. All Rights Reserved.
I.A. Product Description
Introduction
1
I. Introduction
A. Product Description
Microarray analysis can be an extremely powerful tool in gene expres-sion profiling because it can provide data about the expression of hun-dreds or thousands of genes in a single experiment. TheArrayControl™ Spots and Spikes for glass array hybridization are a setof 8 complementary nucleic acids designed for interpretation and vali-dation of microarray hybridization data. ArrayControl
Sense OligoSpots
are spotted or printed onto microarrays along with the experimen-tal sequences. The ArrayControl
RNA
Spikes
are templates for synthesisof labeled cDNA that will hybridize with the ArrayControl Spots. TheRNA Spikes can be mixed with experimental RNA samples before label-ing so that both experimental sequences and the RNA Spikes are labeledsimultaneously. Upon hybridization to a glass microarray, the labeledcDNA mixture will hybridize with nucleic acids on the microarray, pro-ducing experimental data as well as control data. The hybridization datafrom the ArrayControl Spots and Spikes provides a basis for analysis ofthe experimental data.
The ArrayControl sequences were selected from
E. coli
genes that showno sequence similarity to mammalian genomes, based on databasesearches. They were then tested experimentally to make sure that theydo not cross hybridize to each other, or to human or mouse RNAs.
ArrayControl Sense Oligo
Spots
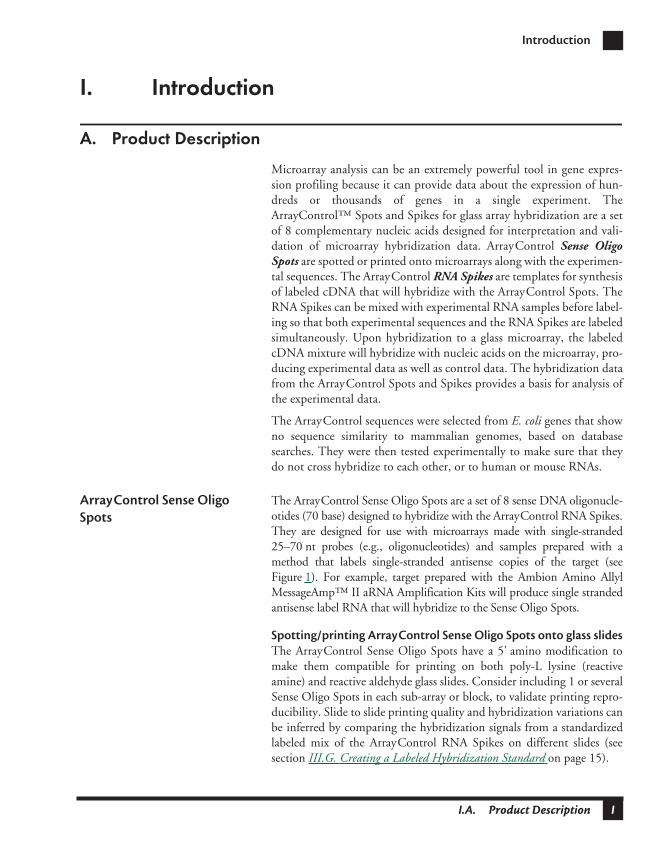
The ArrayControl Sense Oligo Spots are a set of 8 sense DNA oligonucle-otides (70 base) designed to hybridize with the ArrayControl RNA Spikes.They are designed for use with microarrays made with single-stranded25–70 nt probes (e.g., oligonucleotides) and samples prepared with amethod that labels single-stranded antisense copies of the target (seeFigure 1). For example, target prepared with the Ambion Amino AllylMessageAmp™ II aRNA Amplification Kits will produce single strandedantisense label RNA that will hybridize to the Sense Oligo Spots.
Spotting/printing ArrayControl Sense Oligo Spots onto glass slides
The ArrayControl Sense Oligo Spots have a 5' amino modification tomake them compatible for printing on both poly-L lysine (reactiveamine) and reactive aldehyde glass slides. Consider including 1 or severalSense Oligo Spots in each sub-array or block, to validate printing repro-ducibility. Slide to slide printing quality and hybridization variations canbe inferred by comparing the hybridization signals from a standardizedlabeled mix of the ArrayControl RNA Spikes on different slides (seesection
III.G. Creating a Labeled Hybridization Standard
on page 15).
ArrayControl™
I.A. Product Description
2
ArrayControl RNA Spikes
The RNA Spikes are a set of 8 purified RNA transcripts with sequencehomology to the corresponding ArrayControl Spot (e.g., cDNA madefrom RNA Spike 1 will hybridize with Sense Oligo Spot 1). They are3' poly(A) tailed RNAs supplied at a precise concentration. The sizesand base compositions of each RNA Spike are shown in the table below.This information is provided so that precise normalization of fluores-cent signal to RNA Spike length and base composition can be obtained.
Figure 1. Use of ArrayControl Sense Oligo Spots
Labeling during reversetranscription of mRNA
5' AAAA3 '
Labeled cDNA (antisense)TTT T
Labeled cDNA (antisense)
Sense Oligo Spot
Starting Material: mRNA (sense)
5' AAAA3'
5' AAAA3 '
Reverse Transcription (antisense) T7
Labeled aRNA (antisense)
T7
Labeled aRNA (antisense)
Labeling duringtranscription of aRNA
2nd strand synthesis (sense template)T7
Sense Oligo Spot
Hybridization toglass array
Hybridization toglass array
Table 1. RNA Spike Lengths and Base Compositions
RNA Spike Length
Nucleotide Composition
C U A G
1 750 nt 176 199 164 211
2 752 nt 223 177 155 197
3 1000 nt 232 259 166 343
4 1000 nt 235 220 270 275
5 1034 nt 284 231 236 273
6 1250 nt 346 273 279 352
7 1474 nt 411 302 359 402
8 2000 nt 544 427 473 556
I.A. Product Description
Introduction
3
Uses of the ArrayControl
Spots and Spikes
Using arrays spotted with ArrayControl Sense Oligo Spots, the RNASpikes are intended to aid in determining the quality of several differentaspects of a microarray hybridization experiment, including the follow-ing:
• Uniformity and optimization of microarray printing
• As internal indicators for dye normalization
• Defining the limits of sensitivity and selectivity of your microarraysystem. For instance, what is the lowest amount of an RNA tran-script that can be detected at a certain hybridization temperature.
• To define the range of differential expression that can be reliablymeasured on a microarray.
• As negative controls: by leaving 1 or more of the RNA Spikes out ofa labeling reaction, and hybridizing it to a microarray with all 8 ofthe ArrayControl Spots printed.
Figure 2. Image of Microarray Illustrating the Fluorescent Signals from the ArrayControl
Sense Oligo Spots Using Different Ratios of RNA Spikes During Labeling with Cyanine 3 and Cyanine 5 dCTP.
The ArrayControl Sense Oligo Spots were spotted on a glass slide in triplicate. The slide was then used in a dual labeledhybridization containing 2 samples with different amounts of cyanine 3 vs. cyanine 5 labeled RNA Spikes in a back-ground of 5 µg of human total RNA. The table lists the amount of each RNA Spike added to the either the cyanine 3 orcyanine 5 labeling reaction, and the expected and observed ratio of cyanine 5/cyanine 3 hybridization.
Spot 1
Spot 3
Spot 8
Spot 2
Spot 6
Negative
Spot 4
Spot 5
Spot 7
RNA Spike amount added to labeling rxn cyanine 5/ cyanine 3 ratio*
* The RNAs labeled with only cyanine 3 or cyanine 5 are expected to have onlybackground levels of the other dye.
RNA Spike cyanine 5 (pg) cyanine 3 (pg) expected observed
Spike 1 0 500 cyanine 3 0.001
Spike 3 100 500 0.2 0.166
Spike 8 500 0 cyanine 5 397.02
Spike 2 0 500 cyanine 3 0.001
Spike 6 500 100 5.0 5.253
Spike 4 500 500 1.0 1.019
Spike 5 500 500 1.0 1.069
Spike 7 500 0 cyanine 5 448.5
Human RNA 5 x 10⁶ 5 x 10⁶ n/a n/a
ArrayControl™
I.B. Kit Components and Storage
4
B. Kit Components and Storage
C. Materials Not Provided with the Kit
• Microarray spotting or printing buffer
• Glass microarray slides
• cDNA labeling reagents
• Microarray hybridization reagents
• Microarray analysis equipment
D. Related Products Available from Ambion
Cat # Amount Product Storage
AM1780 10 µL ea. RNA Spikes 1–8 (100 ng/µL) below –70°C
7 mL TE Buffer (pH 7.0) –20°C
AM1781 10 µL ea. Array Control Sense Oligo Spots 1–8
(60 µM)
–20°C
MessageAmp™ II aRNA Amplification Kits
see our web or print catalog
Ambion offers a full line of MessageAmp II Kits tailored for different arrayanalysis applications. The MessageAmp II Kit offers maximum flexibility;samples can be amplified using either single- or double-round amplification,and the reagent cocktails are configured to accommodate modification. Forarrays requiring biotin-labeled samples, Ambion offers the MessageAmpII-Biotin
Enhanced
Single Round aRNA Amplification Kit. For preparationof fluorescently-labeled samples, we recommend the Amino Allyl Mes-sageAmp II Kits which are available with and without Cy™3 and Cy5. Bac-terial RNA can be amplified using the MessageAmp II Bacteria RNAAmplification Kit. We also offer the MessageAmp II-96 and Amino AllylMessageAmp II-96 aRNA Amplification Kits for high throughput applica-tions.
RETROscript
®
Kit
Cat #AM1710
First strand cDNA synthesis kit for RT-PCR. When purchased with Super-Taq™, this kit provides reagents, controls and protocols for reverse tran-scription and PCR. Both oligo(dT) and random primers for cDNA primingare included, as is RNase inhibitor.
Amino Allyl cDNA Labeling Kit
Cat #AM1705
The Amino Allyl cDNA Labeling Kit generates cDNA for secondary fluores-cent dye labeling to be used for glass array analysis. It includes all thereagents, except the amine-reactive labeling moiety (e.g. cyanine dyes) for2-step labeling of cDNA. The reaction produces more labeled cDNA, moreefficiently than direct dye incorporation.
NucAway™ Spin Columns
Cat #AM10070
Guaranteed RNase- and DNase-free, Ambion’s NucAway Spin Columnsprovide a fast, efficient way to remove unincorporated nucleotides, and toeffect buffer exchange after probe synthesis and other reactions.
I.D. Related Products Available from Ambion
Introduction
5
MEGAscript
®
Kits
Cat #AM1330–AM1338
High yield transcription kits for production of large amounts of RNA. Byemploying Ambion’s novel, patented MEGAscript technology, these kits useconcentrations of nucleotides that would normally inhibit the RNA poly-merases, resulting in ultra high-yield transcription reactions. Kits are avail-able with T7, SP6, and/or T3 RNA polymerase.
MEGAclear™
Cat #AM1908
MEGAclear purifies RNA from transcription, and other enzymatic reactionsyielding high quality RNA free of unincorporated nucleotides, enzymes andbuffer components with close to 100% recovery of input RNA.
SlideHyb™ Glass Array Hybridization Buffersand Glass Array Hybridization Cassette
see our web or print catalog
There are 3 unique SlideHyb Glass Array Hybridization Buffers; they haveidentical salt and formamide compositions, but differ in hybridization kinet-ics and blocking reagents. Ambion also offers the Glass Array HybridizationCassette for incubation of glass microarray hybridization reactions.
ArrayControl™
II.A. Spotting Suggestions
6
II. Using ArrayControl Spots and Spikes
A. Spotting Suggestions
Each ArrayControl Sense Oligonucleotide Spot is supplied in water at60 µM. Concentrated printing buffer can be added directly to the SenseOligo Spot solutions to prepare them for spotting.
Typical concentra-tions for spotting oligonucleotides are from 10 µM–1 mM.
Follow therecommendation of the facility printing the array, or that of the printingdevice manufacturer regarding printing buffer and DNA concentration.
Array Design or Layout
The 8 ArrayControl Sense Oligo Spots will fill a single column in a96-well plate. Consider printing replicates of the controls to increase sta-tistical confidence and to monitor any variance across the printed area.For easy visual alignment and identification of a microarray pattern, thecontrol spots can be kept together as a control group. You may also wantto include blank features (printing buffer only) as well as additional pos-itive control features in the control group if they are not already presentin your design (i.e. genomic DNA, housekeeping genes, etc.).
Array printing protocols on
the web
Protocols for printing arrays can be found on the following website(among others):
• http://arrayit.com/Products/Substrates/substrates.html
B. Handling the ArrayControl RNA Spikes
Each tube of ArrayControl RNA Spikes contains 1 µg of RNA(100 ng/µL); when diluted, this is enough for hundreds of RNA Spikeadditions to sample labeling reactions. Even though the RNA Spikes aresupplied nuclease-free, they are highly susceptible to degradation bycontaminating RNase. Since they are used in very dilute solutions, eventhe slightest amount of degradation will be a detriment to their use asmicroarray standards. Therefore, use the supplied 100 ng/µL RNASpike stocks only to make dilutions, and keep the remainder at –80˚C.Diluted RNA Spikes can be used for 1 week and then should be dis-carded, particularly if the vial has been frozen and thawed a number oftimes. Ambion recommends making a series of dilutions in severaltubes, and storing them at –80˚C. Then, just before a new experiment,simply thaw those RNA Control Spike dilutions that are needed.
Always plan the dilution protocol for each RNA Spike mix
before
set-ting up your labeling reaction. Rushed calculations just before a labelingreaction inevitably lead to errors immortalized in microarray data.
II.C. ArrayControl Dilution Series Examples
Using ArrayControl Spots and Spikes
7
IMPORTANT
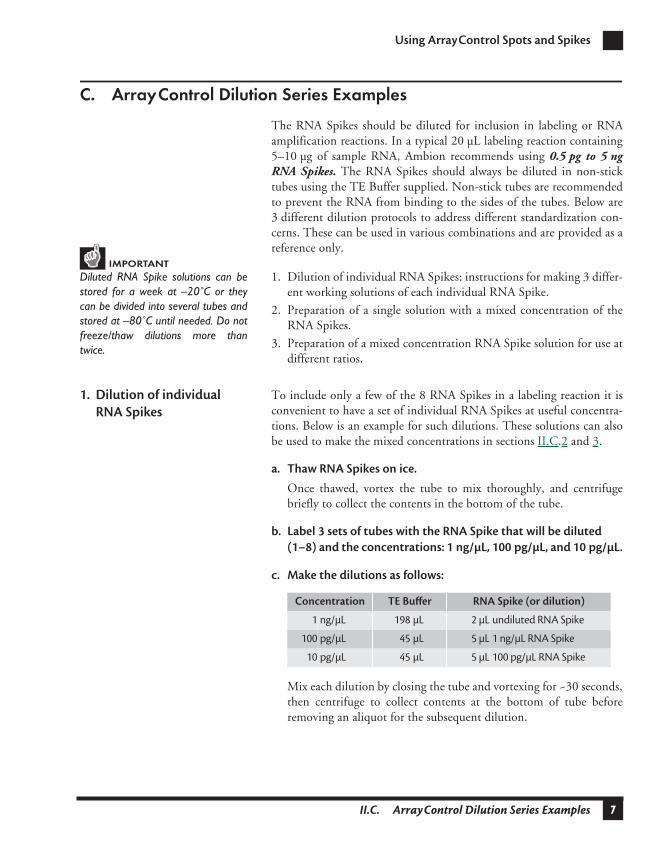
C. ArrayControl Dilution Series Examples
The RNA Spikes should be diluted for inclusion in labeling or RNAamplification reactions. In a typical 20 µL labeling reaction containing5–10 µg of sample RNA, Ambion recommends using
0.5 pg to 5 ngRNA Spikes.
The RNA Spikes should always be diluted in non-sticktubes using the TE Buffer supplied. Non-stick tubes are recommendedto prevent the RNA from binding to the sides of the tubes. Below are3 different dilution protocols to address different standardization con-cerns. These can be used in various combinations and are provided as areference only.
Diluted RNA Spike solutions can bestored for a week at –20˚C or theycan be divided into several tubes andstored at –80˚C until needed. Do notfreeze/thaw dilutions more thantwice.
1. Dilution of individual RNA Spikes: instructions for making 3 differ-ent working solutions of each individual RNA Spike.
2. Preparation of a single solution with a mixed concentration of theRNA Spikes.
3. Preparation of a mixed concentration RNA Spike solution for use atdifferent ratios.
1. Dilution of individual
RNA Spikes
To include only a few of the 8 RNA Spikes in a labeling reaction it isconvenient to have a set of individual RNA Spikes at useful concentra-tions. Below is an example for such dilutions. These solutions can alsobe used to make the mixed concentrations in sections II.C.2 and 3.
a. Thaw RNA Spikes on ice.
Once thawed, vortex the tube to mix thoroughly, and centrifugebriefly to collect the contents in the bottom of the tube.
b. Label 3 sets of tubes with the RNA Spike that will be diluted
(1–8) and the concentrations: 1 ng/µL, 100 pg/µL, and 10 pg/µL.
c. Make the dilutions as follows:
Mix each dilution by closing the tube and vortexing for ~30 seconds,then centrifuge to collect contents at the bottom of tube beforeremoving an aliquot for the subsequent dilution.
Concentration TE Buffer RNA Spike (or dilution)
1 ng/µL 198 µL 2 µL undiluted RNA Spike
100 pg/µL 45 µL 5 µL 1 ng/µL RNA Spike
10 pg/µL 45 µL 5 µL 100 pg/µL RNA Spike
ArrayControl™
II.C. ArrayControl Dilution Series Examples
8
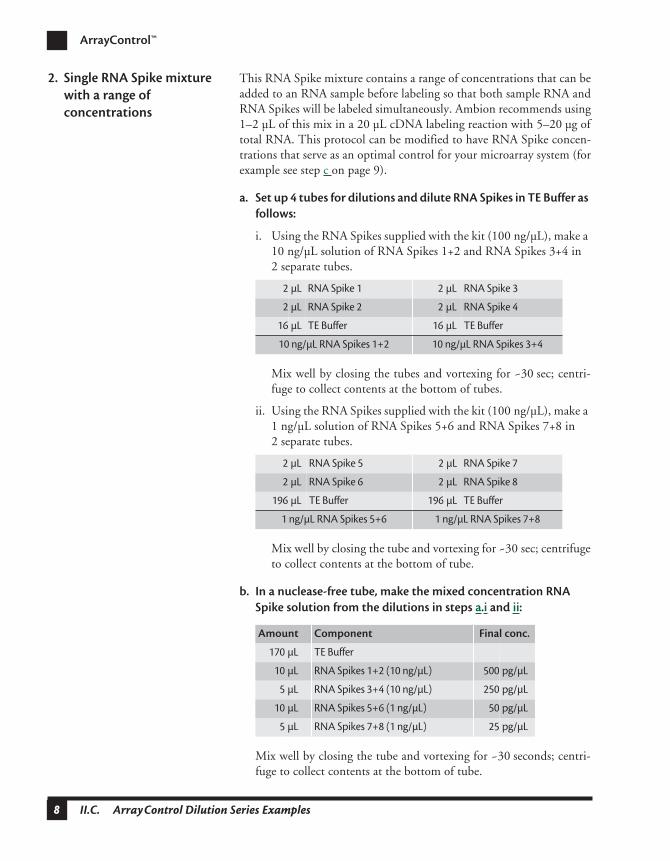
2. Single RNA Spike mixture
with a range of
concentrations
This RNA Spike mixture contains a range of concentrations that can beadded to an RNA sample before labeling so that both sample RNA andRNA Spikes will be labeled simultaneously. Ambion recommends using1–2 µL of this mix in a 20 µL cDNA labeling reaction with 5–20 µg oftotal RNA. This protocol can be modified to have RNA Spike concen-trations that serve as an optimal control for your microarray system (forexample see step c on page 9).
a. Set up 4 tubes for dilutions and dilute RNA Spikes in TE Buffer as
follows:
i. Using the RNA Spikes supplied with the kit (100 ng/µL), make a 10 ng/µL solution of RNA Spikes 1+2 and RNA Spikes 3+4 in 2 separate tubes.
Mix well by closing the tubes and vortexing for ~30 sec; centri-fuge to collect contents at the bottom of tubes.
ii. Using the RNA Spikes supplied with the kit (100 ng/µL), make a 1 ng/µL solution of RNA Spikes 5+6 and RNA Spikes 7+8 in 2 separate tubes.
Mix well by closing the tube and vortexing for ~30 sec; centrifugeto collect contents at the bottom of tube.
b. In a nuclease-free tube, make the mixed concentration RNA
Spike solution from the dilutions in steps a.i and ii:
Mix well by closing the tube and vortexing for ~30 seconds; centri-fuge to collect contents at the bottom of tube.
2 µL RNA Spike 1 2 µL RNA Spike 3
2 µL RNA Spike 2 2 µL RNA Spike 4
16 µL TE Buffer 16 µL TE Buffer
10 ng/µL RNA Spikes 1+2 10 ng/µL RNA Spikes 3+4
2 µL RNA Spike 5 2 µL RNA Spike 7
2 µL RNA Spike 6 2 µL RNA Spike 8
196 µL TE Buffer 196 µL TE Buffer
1 ng/µL RNA Spikes 5+6 1 ng/µL RNA Spikes 7+8
Amount Component Final conc.
170 µL TE Buffer
10 µL RNA Spikes 1+2 (10 ng/µL) 500 pg/µL
5 µL RNA Spikes 3+4 (10 ng/µL) 250 pg/µL
10 µL RNA Spikes 5+6 (1 ng/µL) 50 pg/µL
5 µL RNA Spikes 7+8 (1 ng/µL) 25 pg/µL
II.C. ArrayControl Dilution Series Examples
Using ArrayControl Spots and Spikes
9
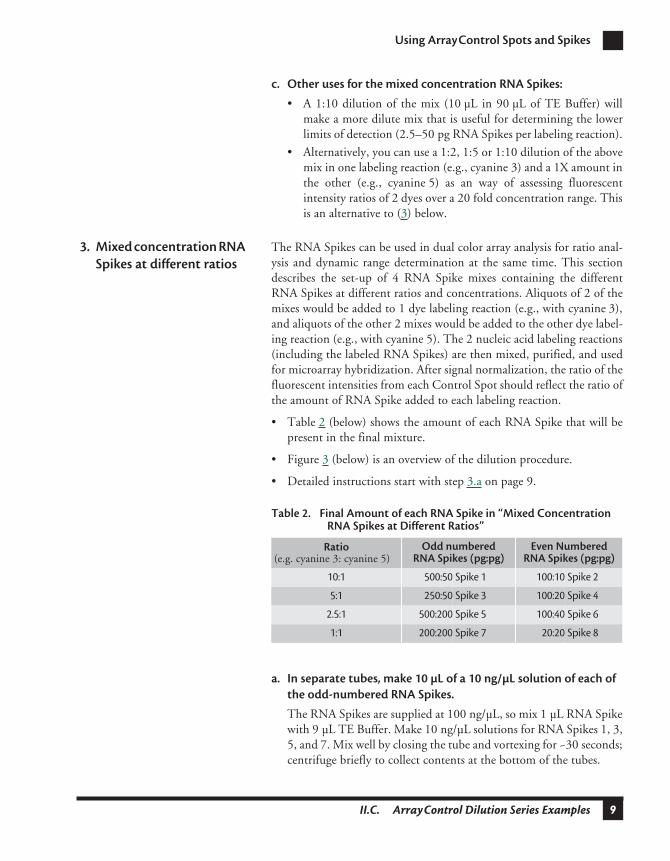
c. Other uses for the mixed concentration RNA Spikes:
• A 1:10 dilution of the mix (10 µL in 90 µL of TE Buffer) willmake a more dilute mix that is useful for determining the lowerlimits of detection (2.5–50 pg RNA Spikes per labeling reaction).
• Alternatively, you can use a 1:2, 1:5 or 1:10 dilution of the abovemix in one labeling reaction (e.g., cyanine 3) and a 1X amount inthe other (e.g., cyanine 5) as an way of assessing fluorescentintensity ratios of 2 dyes over a 20 fold concentration range. Thisis an alternative to (3) below.
3. Mixed concentration RNA
Spikes at different ratios
The RNA Spikes can be used in dual color array analysis for ratio anal-ysis and dynamic range determination at the same time. This sectiondescribes the set-up of 4 RNA Spike mixes containing the differentRNA Spikes at different ratios and concentrations. Aliquots of 2 of themixes would be added to 1 dye labeling reaction (e.g., with cyanine 3),and aliquots of the other 2 mixes would be added to the other dye label-ing reaction (e.g., with cyanine 5). The 2 nucleic acid labeling reactions(including the labeled RNA Spikes) are then mixed, purified, and usedfor microarray hybridization. After signal normalization, the ratio of thefluorescent intensities from each Control Spot should reflect the ratio ofthe amount of RNA Spike added to each labeling reaction.
• Table 2 (below) shows the amount of each RNA Spike that will bepresent in the final mixture.
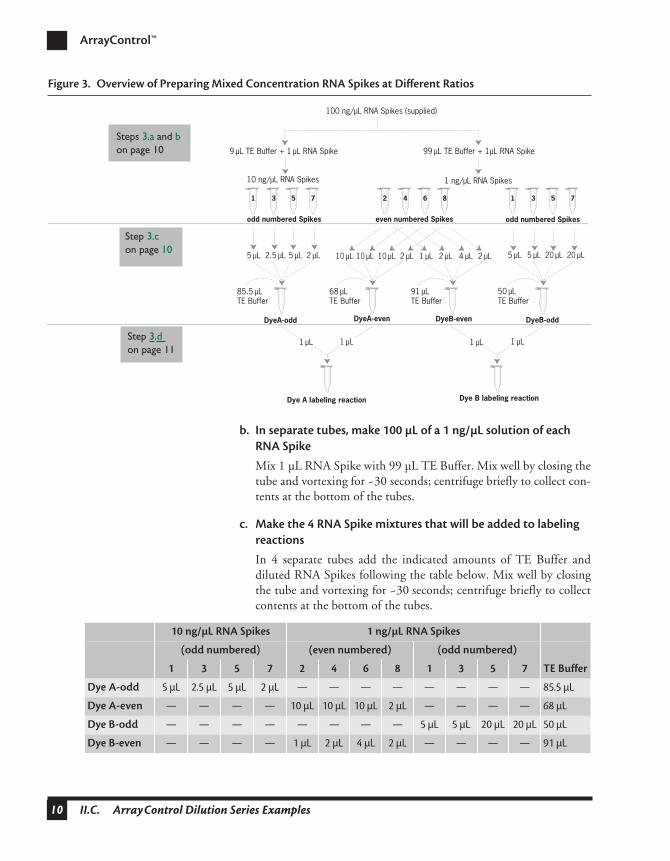
• Figure 3 (below) is an overview of the dilution procedure.
• Detailed instructions start with step 3.a on page 9.
a. In separate tubes, make 10 µL of a 10 ng/µL solution of each of
the odd-numbered RNA Spikes.
The RNA Spikes are supplied at 100 ng/µL, so mix 1 µL RNA Spikewith 9 µL TE Buffer. Make 10 ng/µL solutions for RNA Spikes 1, 3,5, and 7. Mix well by closing the tube and vortexing for ~30 seconds;centrifuge briefly to collect contents at the bottom of the tubes.
Table 2. Final Amount of each RNA Spike in “Mixed Concentration RNA Spikes at Different Ratios”
Ratio
(e.g. cyanine 3: cyanine 5)
Odd numberedRNA Spikes (pg:pg)
Even NumberedRNA Spikes (pg:pg)
10:1 500:50 Spike 1 100:10 Spike 2
5:1 250:50 Spike 3 100:20 Spike 4
2.5:1 500:200 Spike 5 100:40 Spike 6
1:1 200:200 Spike 7 20:20 Spike 8
ArrayControl™
II.C. ArrayControl Dilution Series Examples
10
b. In separate tubes, make 100 µL of a 1 ng/µL solution of each
RNA Spike
Mix 1 µL RNA Spike with 99 µL TE Buffer. Mix well by closing thetube and vortexing for ~30 seconds; centrifuge briefly to collect con-tents at the bottom of the tubes.
c. Make the 4 RNA Spike mixtures that will be added to labeling
reactions
In 4 separate tubes add the indicated amounts of TE Buffer anddiluted RNA Spikes following the table below. Mix well by closingthe tube and vortexing for ~30 seconds; centrifuge briefly to collectcontents at the bottom of the tubes.
Figure 3. Overview of Preparing Mixed Concentration RNA Spikes at Different Ratios
DyeA-odd
Dye A labeling reaction
.
100 ng/µL RNA Spikes (supplied)
9 µL TE Buffer + 1 µL RNA Spike
10 ng/µL RNA Spikes
10 µL 10 µL 10 µL 2 µL 2 µL 4 µL
7531
2 µL5 µL 2.5 µL 5 µL
7531 8642
85.5 µLTE Buffer
.
68 µLTE Buffer
.
91 µLTE Buffer
.
50 µLTE Buffer
even numbered Spikesodd numbered Spikes odd numbered Spikes
99 µL TE Buffer + 1µL RNA Spike
1 ng/µL RNA Spikes
1 µL 2 µL 5 µL 5 µL 20 µL 20 µL
DyeB-odd
1 µL 1 µL 1 µL 1 µL
DyeA-even DyeB-even
Dye B labeling reaction
.
Steps 3.a and b on page 10
Step 3.d on page 11
Step 3.con page 10
10 ng/µL RNA Spikes 1 ng/µL RNA Spikes
(odd numbered) (even numbered) (odd numbered)
1 3 5 7 2 4 6 8 1 3 5 7 TE Buffer
Dye A-odd
5 µL 2.5 µL 5 µL 2 µL — — — — — — — — 85.5 µL
Dye A-even
— — — — 10 µL 10 µL 10 µL 2 µL — — — — 68 µL
Dye B-odd
— — — — — — — — 5 µL 5 µL 20 µL 20 µL 50 µL
Dye B-even
— — — — 1 µL 2 µL 4 µL 2 µL — — — — 91 µL
II.C. ArrayControl Dilution Series Examples
Using ArrayControl Spots and Spikes
11
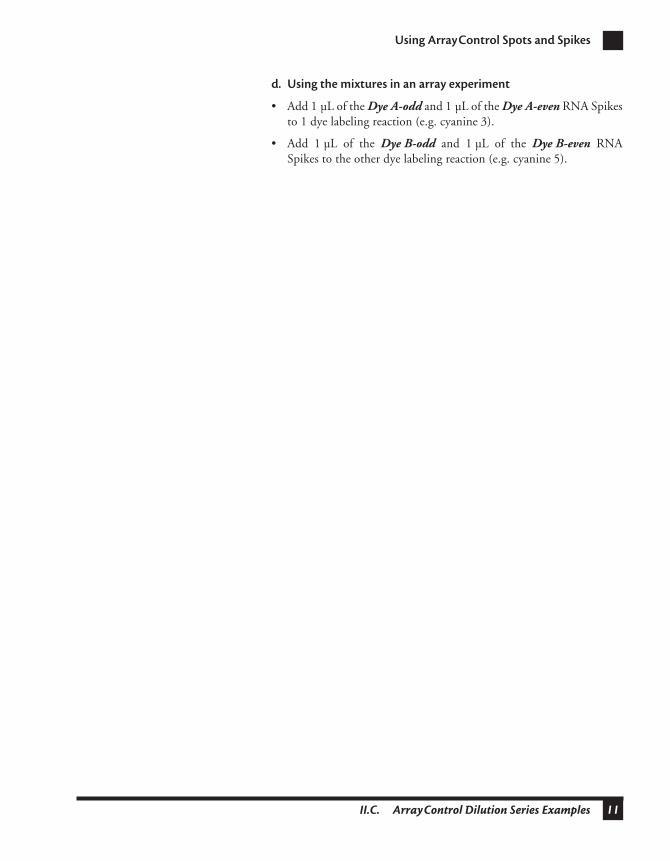
d. Using the mixtures in an array experiment
• Add 1 µL of the
Dye A-odd
and 1 µL of the
Dye A-even
RNA Spikesto 1 dye labeling reaction (e.g. cyanine 3).
• Add 1 µL of the
Dye B-odd
and 1 µL of the
Dye B-even
RNASpikes to the other dye labeling reaction (e.g. cyanine 5).
ArrayControl™
III.A. Using ArrayControl Sense Oligo Spots for Printing Optimization
12
III. ArrayControl Applications
A. Using ArrayControl Sense Oligo Spots for Printing Optimization
ArrayControl Sense Oligo Spots are extremely useful for optimization ofmicroarray production, among their possible applications are the following:
• Identify the optimal DNA concentration for printing
• Verify that DNA carryover is not occurring during printing
• Check printing uniformity
Finding the best DNA
concentration for
spotting/printing arrays
The ArrayControl Sense Oligo Spots are precisely quantified and can beused as standards (with labeled cDNA made from the ArrayControlSpikes) to identify the optimal DNA spotting concentration for yourmicroarray spotting device and glass substrate. A typical experimentwould consist of spotting identical volumes of several ArrayControlSense Oligo Spots diluted to 0.1–1.0 µg/µL in the recommended print-ing/spotting buffer. The array would then be hybridized with labeledcDNA made from ArrayControl RNA Spikes corresponding to theSpots on the array. The hybridization signal should increase with increas-ing DNA concentration up to the point where the glass is saturated withDNA and the hybridization signal plateaus. The optimal DNA spottingconcentration is the one that produces the highest hybridization signal.
Checking for DNA carryover
during microarray
production
To evaluate carryover of DNA between pin washes, dry down an aliquotof Sense Oligo Spots, and then resuspend it to the desired concentrationin 1X printing buffer (e.g., ~10X the concentration that will normallybe used to make arrays). Print part of an array using the high concentra-tion of Sense Oligo Spots as the first DNA deposited on the slide, anduse printing buffer alone for subsequent spots. To evaluate whether thepin washes are adequate between spots, hybridize the test array withlabeled cDNA made from the corresponding ArrayControl Spike. If sig-nal is seen only from spots printed with a high concentration ofArrayControl Spot DNA, and not in subsequent spots, then it can beassumed the wash protocol is sufficient for a lower working concentra-tion during microarray manufacturing.
Checking printing
uniformity
Uniformity of microarray printing can be assayed by spotting replicatesof the Sense Oligo Spots in various locations on the microarray. Thenhybridize the array with labeled cDNA made from a mixture of RNASpikes and experimental RNA. The hybridization signal from the SenseOligo Spots as well as the background signal from each of these spotswould be expected to be identical for an ideal microarray.
III.B. Production of Test Arrays
ArrayControl Applications
13
B. Production of Test Arrays
The Sense Oligo Spots can also be used to make test arrays. Test arraysare useful for evaluating new procedures such as cDNA labeling, RNAamplification, and hybridization and wash reagents. A test array printedwith several house keeping genes and the 8 Sense Oligo Spots can econ-omize resources compared to printing a high-density microarray forprotocol optimization. Test arrays can also be used to determine theoptimal printing parameters as discussed above.
C. Determining Detection and Sensitivity Limits of a Microarray System
Each microarray system (i.e. RNA sample, cDNA labeling method andfluorescent dyes, the microarray itself, hybridization parameters, andscanning instrument) has a different limit of detection and sensitivity.This limit is expressed as the lowest amount of input RNA or cDNAthat gives a reproducibly detectable signal above background. You mayalready know the approximate detection and sensitivity limits for yoursystem, but ArrayControl Spots and Spikes can be used to rigorouslydemonstrate them. The detection limit will be affected by the type [totalor poly(A) RNA] and amount of RNA labeled for microarray hybridiza-tion. Use a “typical” amount of sample RNA to determine the detectionlimit for your system. In other words, if you use 5 µg of total RNA forlabeling and hybridization, then use 5 µg of total RNA when investigat-ing the sensitivity of the ArrayControl RNA Spikes in your system.There are basically 2 ways to evaluate the limit of detection, and theymay yield different results:
a. Titrating RNA Spikes into a labeling reaction before hybridization.
This method will identify a detection limit using controls in a com-plex mixture during both labeling and hybridization.
b. Labeling a single or a few RNA Spikes alone (in the absence of sampleRNA).
This method eliminates the possible competition between controlRNA and experimental RNA for reaction components during label-ing. The labeled control(s) is purified and quantified, then used inhybridizations at known amounts to determine the limit of detectionin the microarray system.
ArrayControl™
III.D. Determining the Dynamic Range of a Microarray System
14
D. Determining the Dynamic Range of a Microarray System
The dynamic range of a microarray system is the range of input labelednucleic acid (mass or fluorescent intensity) that produces a linearhybridization signal. This value is important because relative differencesin fluorescence are valid only when both readings fall within thedynamic range of the system.
Ambion recommends trying a range from 0.5–50,000 pg RNA Spikeswith your RNA sample.
Because the RNA Control Spikes vary inlength, their respective fluorescent signal will be proportional to theirlength when equal molar amounts of each Spike are used. If equal molaramounts of each Spike are labeled, the longest transcripts will containthe greatest number of labeled nucleotides and hence should generatemore signal than a shorter transcript. There will not be a
perfect
corre-lation between RNA Spike length and fluorescent signal because theRNA Spike sequences are different, thus each will have slightly differentlevels of label incorporation relative to length, and different hybridiza-tion kinetics. For very accurate measurements it may be useful to nor-malize the RNA Spikes with respect to size and base composition (seeTable 1 on page 2.)
When dual colored labeling methods are used, the dynamic range foreach fluorophor can be different. An important metric for ratio analysesis the determination of the upper and lower limits of fluorescence inten-sity that produce accurate data. As fluorescence intensity approaches thelower limits of detection, ratio analyses are less predictable. Likewise,when signals are near the upper limit, the ratio observed may not beaccurate. The RNA Spikes can be used to determine the limits for accu-rate ratio analysis.
E. Normalization Coefficient(s)
Because there are differences in the incorporation efficiencies of differ-ent dye labeled nucleotides, and quantum yields of the different fluoro-phors typically vary, direct comparisons of differentially labeled samplesrequire normalization. To normalize the observed ratios of the 2 fluores-cent signals, calculate the correction coefficient using the mean intensityfor all features in an array. There are several different principles to con-sider when calculating a normalization coefficient (Tseng et al. 2001,Kalocasi et al. 2001). A discussion of these approaches is beyond thescope of this Instruction Manual, but the ArrayControl system can beuseful for testing the different approaches.
III.F. Negative Control
ArrayControl Applications
15
F. Negative Control
Add a negative control to any experiment that includes an array with all8 ArrayControl Sense Oligo Spots by simply omitting 1 or 2 RNASpikes from a labeling reaction containing experimental RNA and/ormost of the 8 RNA Spikes. The fluorescent intensity of the hybridiza-tion from the corresponding Sense Oligo Spot on the microarray shouldbe at or even below background (“black holes”) unless there is a problemwith background or spot deposition.
G. Creating a Labeled Hybridization Standard
The ArrayControl RNA Spikes can be labeled separately or as a mix in alabeling reaction that does not include an experimental RNA sample.This can be useful for creating a single uniform hybridization standard,or positive control, that can be included in microarray hybridizations(with or without other RNA Spikes).
For example, set up 2 separate 20 µL reverse transcription reactions thatcontain 25 ng of any 2 ArrayControl RNA Spikes. Include cyanine 5 inone labeling reaction, and include cyanine 3 in the other. After the RNASpikes are labeled, mix them together and purify them using the stan-dard clean-up step used in your laboratory (e.g., NucAway™ Spin Col-umns). Measure the A
260
and dilute the mixture to an appropriateconcentration for hybridization (typically ~1 ng/µL). An identicalamount of this dual labeled hybridization control can be used with eachmicroarray experiment. Any variation in the hybridization signalbetween microarray images can be attributed to the hybridization, themicroarray, or post hybridization handling (e.g., changes in tempera-ture, buffer, wash, microarray quality).
ArrayControl™
IV.A. None of the Sense Oligo Spots Fluoresce
16
IV. Troubleshooting
A. None of the Sense Oligo Spots Fluoresce
If none of the Sense Oligo Spots on a microarray hybridized withlabeled cDNA made from the ArrayControl Spikes produce a hybrid-ization signal, then consider the following suggestions.
Label cDNA with oligo(dT)
or random primers only
Make sure your labeling protocol does not use a mix of gene specificprimers for creating labeled cDNA. The RNA Spikes should be labeledwith oligo(dT) or random primers since they may not hybridize withgene specific primers.
Use 0.5 pg to 5 ng of RNA
Spikes in cDNA labeling
reactions
Using less than 0.5 pg of RNA Spikes may produce a hybridization sig-nal below the useful limit of detection.
B. ArrayControl Sense Oligo Spots are Much More Intense than Array Gene Features
This will be observed when the concentrations of the RNA Spikes arewell above the average amount of mRNA used in the cDNA labelingreaction. It is convenient to have at least 1 “very bright” control for ref-erence. Do this by adding a relatively large mass amount of that RNASpike to the cDNA labeling reaction. Use lower concentrations of theother 7 RNA Spikes so that their hybridization signals are closer to, ormimic the fluorescent intensity ranges represented in the microarray.
C. One or More Sense Oligo Spots Do Not Fluoresce
If some of the Sense Oligo Spots show the expected hybridization signal,but 1 or more Spots on the same microarray do not show any hybridiza-tion signal, then consider the following troubleshooting suggestions.
Error was made in
printing/spotting Sense
Oligo Spots or in pipetting
RNA Spikes
Though it seems obvious, the most likely reason for one or more of theSense Oligo Spots to fail to fluoresce is either an accidental failure toprint one of the Spots on the array, or a pipetting error or accidentalomission of an RNA Spike from one of the dilution steps.
IV.C. One or More Sense Oligo Spots Do Not Fluoresce
Troubleshooting
17
Too little Sense Oligo Spot
was spotted
As the lower limit of detection is approached the signal to noise ratiowill be reduced. For most arrays this limit is about 1.0–2.5 pg per spot.Some array systems are more or less sensitive but if you are using thisamount of RNA Spikes then you may be approaching the limits ofdetection.
Sense Oligo Spot is degraded Although unlikely, it is possible that 1 or more of the Spots is degraded.
RNA Spike is degraded If one or more Sense Oligo Spots do not fluoresce, it is possible that thecorresponding RNA Spike used in the cDNA labeling reaction wasdegraded. The RNA controls can be analyzed on an Agilent 2100 bio-analyzer. The RNA should be intact and represented by a single distinctpeak of the appropriate size.
ArrayControl™
V.A. Experimental RNA for Use in Microarray Hybridization18
V. Appendix
A. Experimental RNA for Use in Microarray Hybridization
Labeled DNA for microarray hybridizations can be prepared from sev-eral different RNA sources, including total RNA, poly(A) selected RNAand amplified antisense RNA (aRNA). The amount of RNA (includingRNA Spikes) needed should be determined empirically with several testexperiments.
Total RNA Total RNA is typically used in the range of 5–20 µg. The exact amountof mRNA in a total RNA sample varies, depending on a number of fac-tors that include cell type or tissues used, metabolic status of cells duringisolation, and most importantly the integrity of the RNA during isola-tion and storage. The expected percentage of mRNA in a total RNAsample is 2–5%. A 5 µg sample of high quality total RNA should con-tain 100–250 ng of mRNA.
Poly(A) selected RNA Poly(A) selected RNA has a much higher ratio of mRNA to rRNA thantotal RNA, but the exact ratio will depend on the enrichment and isola-tion procedure in addition to the factors mentioned above. Differencesin mRNA:rRNA ratios will effect the true amount of mRNA used in alabeling reaction. For example if two 1 µg poly(A) RNA samples arelabeled, but 1 sample contains about 13% rRNA and the other samplehas only 3% rRNA, there will be a 10% difference in the actual amountof labeled mRNA. This can complicate normalization and analysis, par-ticularly for genes that are expressed at levels bordering the detectionlevel. One way to determine the amount of rRNA in mRNA sample isto inspect the sample on an Agilent 2100 bioanalyzer.
Amplified RNA RNA samples can be amplified by in vitro transcribing double-strandedcDNA; this is done when very little RNA is available (Van Gelder1990). Ambion’s MessageAmp™ II aRNA Amplification Kit can beused to amplify insufficient RNA samples. Diluted RNA Spikes can beadded to RNA samples before amplification to monitor RNA amplifica-tion efficiencies and reproducibility. In this application, 1–100 pg ofRNA Spikes would typically be used with 1–5 µg of total RNA to beamplified. ArrayControl RNA Spikes can also be used to determine thesensitivity and amplification efficiency of a given procedure (Madison etal. 1998).

V.B. References
Appendix
19
B. References
Hughes TR, Mao, Jones AR, Burchard J, Marton MJ, Shannon KW, Lefkowitz SM, Ziman M, Schelter JM,Meyer MR, et al. (2001) Expression profiling using microarrays fabricated by an ink-jet oligonucleotide syn-thesizer. Nature Biotechnology 19: 342–347.
Kalocasi P, Shams S (2001) Use of bioinformatics in arrays. Methods Mol Biol 170: 223–236.
Kane MD, Jatkoe TA, Stumpf CR, Lu J, Thomas JD, and Madore SJ(2000) Assessment of the sensitivity andspecificity of oligonucleotide (50mer) microarrays. Nucleic Acids Res 28: 4552–4557.
Lee M-LT, Kuo FC, Whitmore GA, Sklar J (2000) Importance of replication in microarray gene expressionstudies: Statistical methods and evidence from repetitive cDNA hybridizations. Proc Natl Acad Sci USA 97:9834–9839.
Madison RD, Robinson GA (1998) Lambda RNA Internal Standards Quantify Sensitivity and AmplificationEfficiency of Mammalian Gene Expression Profiling. BioTechniques 25(3):504–514.
Tseng GC, Oh MK, Rohlin L, Liao JC, Wong WH (2001) Issues in cDNA microarray analysis: quality filter-ing, channel normalization, models of variations and assessment of gene effects. Nucleic Acids Res 29(12):2549–2557.
Van Gelder, RN, von Xastrow, ME, Yool, A, Dement, DC, Barchas, JD, Eberwine, JH (1990) AmplifiedRNA synthesized from limited quantities of heterogeneous cDNA. Proc Natl Acad Sci USA 87: 1663–1667.
Yue H, Eastman PS, Wang BB, Minor J, Doctolero MH, Nuttall RL, Stack R, Becker JW, Montgomery JR,Vainer M, Johnston R (2001) An evaluation of the performance of cDNA microarrays for detecting changes inglobal mRNA expression. Nucleic Acids Res 29(8):E41–1.
C. ArrayControl Kit Specifications
Contents:
To obtain Material Safety
Data Sheets
• Material Safety Data Sheets (MSDSs) can be printed or downloadedfrom product-specific links on our website at the following address:
www.ambion.com/techlib/msds
• Alternatively, e-mail your request [email protected]. Specify the cata-log or part number(s) of the product(s), and we will e-mail the asso-ciated MSDSs unless you specify a preference for fax delivery.
Cat # Amount Product Storage
AM1780 10 µL ea. RNA Spikes 1–8 below –70°C
7 mL TE Buffer (pH 7.0) –20°C
AM1781 10 µL ea. Array Control Sense Oligo Spots 1–8 –20°C
ArrayControl™
V.D. Quality Control20
• For customers without access to the internet or fax, our technical ser-vice department can fulfill MSDS requests placed by telephone orpostal mail. (Requests for postal delivery require 1–2 weeks for pro-cessing.)
D. Quality Control
Functional Testing ArrayControl Sense Oligo Spots are deposited onto glass slides and arehybridized with cyanine 3 or cyanine 5 labeled cDNA or RNA madefrom the ArrayControl RNA Spikes to verify that a hybridization signalcan be detected.
Nuclease testing Each component is tested in the following nuclease assays:
RNase activity
Meets or exceeds specification when a sample is incubated with32P-labeled RNA and analyzed by PAGE.
Nonspecific endonuclease activity
Meets or exceeds specification when a sample is incubated for 14–16 hrwith 300 ng supercoiled plasmid DNA and analyzed by agarose gel elec-trophoresis.
Exonuclease activity
Meets or exceeds specification when a sample is incubated for 14–16 hrwith 40 ng 32P-labeled Sau3A fragments of pUC19 and analyzed byPAGE.