Embed Size (px)
Citation preview
1
Attitudes towards taxation in Myanmar:INSIGHTS FROM URBAN CITIZENS
James OwenHay Mahn Htun

2
3
Acknowledgements
The authors would like to thank all who contributed to this research and made the publication of this paper possible. This includes the governments of Yangon Region, Shan State, Kayin State, Yangon City Development Committee, and Taunggyi and Hpa-an Development Affairs Organizations (DAO) for their support in undertaking Myanmar’s fi rst City Life Survey and their participation in interviews. We’d also like to thank the citizens of Yangon, Taunggyi and Hpa-an that took part in the City Life Survey.
Particular thanks are due to Myo Aung Htwe and Arkar Soe at the Yangon School of Political Science for their involvement in the City Life Survey design, implementation and analysis. A large number of people within The Asia Foundation have contributed to the City Life Survey and paper publication process and we wish to thank all of them for their guidance, encouragement and patience.
We’d also like to thank those who provided comments on an early draft of the paper: Lachlan McDonald (formerly of the Renaissance Institute), Andrea Smurra (University College London and International Growth Centre), Aye Kyithar Swe (Natural Resource Governance Institute), Andrew J Minto (International Monetary Fund), Jayde Roberts (Fulbright US Scholar and University of Tasmania) and Nan Sandi (International Growth Centre). We have appreciated Wai Yan Myo Myint “Bryan” and Elzemiek Zinkstok for their creativity, flexibility and drive.
Finally, the authors would like to thank our team members for their understanding and good humor at key moments in the report writing process.
4
Preface
Decades of authoritarian rule have left Myanmar with a fractured social contract, best illustrated by the limited provision of government services and the fact that Myanmar has one of the lowest tax takes in the world. This dismal situation is changing, however. Myanmar’s nascent democratic transition since 2011 is bringing about reforms of many outdated, ineffi cient and ineffective governance institutions and practices. People’s expectations of the government and the services it should provide are also rising.
In this context, the great challenge facing the government is how to transform governance institutions and structures to respond to citizens’ needs and aspirations and having the resources to do so. Tax has the potential to be an important, reliable and sustainable source of the revenues needed to meet these rising expectations. In addition, paying taxes has the potential to transform the broken social contract between government and citizens in Myanmar after decades of authoritarian rule. The act of paying taxes represents an expression of a citizen’s relationship with their government and their fellow citizens. It reflects a core duty of citizens which can empower them to make demands of their government to work better.
Yet paying taxes is a new experience to many in Myanmar, and a critical question remains on whether the people of Myanmar are ready for tax reform. There is scant reliable evidence of public attitudes toward paying taxes and of their knowledge of the tax system, and what information we do have is largely based on the perspectives of government offi cials. Their own interactions with citizens and past attempts at reform have resulted in a commonly held view that Myanmar citizens are antitax.
This assumption of the public’s antitax stance needs to be tested to help determine what kind of tax reform policy is possible in Myanmar. As such, in 2017 The Asia Foundation and the Yangon School of Political Science conducted the City Life Survey, the fi rst large scale survey in Myanmar to track public perceptions and lived experiences of urban life. More specifi cally, the survey provides the Foundation with data to systematically assess the tax attitudes of urban citizens in Myanmar and to investigate what they believe and understand about taxes and the tax system.
This report, Attitudes Towards Taxation in Myanmar: Insights from Urban Citizens, draws on data from the survey. It focuses on three of the most important taxes in Myanmar: income tax, commercial tax, and property tax. The report explores the sources of citizens’ attitudes toward taxation, taking into account the actual taxpaying experience and the means through which tax information is communicated to them.
We hope that this report will make a useful contribution to the debate taking place in Myanmar on the role that taxation can play in strengthening the social contract and supporting democratic transition, dispelling assumptions along the way and clarifying potential policy options and some of the more effective ways to engage citizens on these challenging issues.
Kim N. B. Ninh, Ph.D.
Country Representative
The Asia Foundation, Myanmar
5
ContentsACKNOWLEDGEMENTSPREFACELIST OF TERMS
CHAPTER 1. INTRODUCTION 1.1 Myanmar and taxes 1.2 Aims and methods 1.3 Structure
CHAPTER 2. SCOPE OF THE STUDY AND RESEARCH METHODS 2.1 Scope of the study 2.2 Research methods
CHAPTER 3. CITIZENS’ UNDERSTANDING OF THE TAX SYSTEM 3.1 Familiarity with the three taxes 3.2 Understanding of the tax system 3.3 Desire for more information
CHAPTER 4. ATTITUDES TOWARDS TAXATION
CHAPTER 5. THE SOURCE OF CITIZENS’ ATTITUDES TOWARDS TAXATION 5.1 Conceptual framework 5.2 Likely impact on attitudes towards taxation
CHAPTER 6. HOW THE TAXPAYING EXPERIENCE AND GOVERNMENT COMMUNICATION AFFECT TAX ATTITUDES
CHAPTER 7. CONCLUSIONS AND RECOMMENDATIONS 7.1 Conclusions 7.2 Recommendations
ANNEX 1. RESEARCH METHODOLOGYANNEX 2. CITY LIFE SURVEY TAX QUESTIONS
ENDNOTESBIBLIOGRAPHY
346
9101111
121316
18192226
30
404144
46
525354
5660
6367
6
List of termsCOMMERCIAL TAXA tax levied by the government on the purchase of goods and services. In Myanmar, commercial tax is usually charged at 5% of the sales price of goods or services.
ECONOMIC INCIDENCE OF TAXIs an economics term that refers to how the burden of tax (what people must pay) is split between different groups. In economics these groups are categorized as “buyers” and “sellers” of goods or services. It is different to the legal incidence of tax. For example, a restaurant (a seller) has the legal obligation to pay 5% of the value of a consumer’s bill to the government. However, the restaurant does not bear all of the tax burden. It passes some of that burden onto consumers (buyers) in the form of higher prices for their food.
FINEA fi nancial punishment for violating a law, rule or procedure. For example, motorists must pay a fi ne if they are caught violating a traffi c offence, such as not wearing a seatbelt.
FEEA payment to government or a private entity for a particular service. For example, in some cities in Myanmar garbage collection services are only provided to households if they pay a specifi c garbage collection fee.
INCOME TAXA tax levied by the government on the earnings of an individual or business. In Myanmar, as in most countries, the tax rate charged varies with the individual’s level of income. Those earning less than MMK 2 million in one year pay no tax. Income above this amount is taxed at increasing rates, reaching a 25% tax rate on all income above MMK 30 million.
LEGAL INCIDENCE OF TAXRefers to who should pay a tax according to the law. For example, with commercial tax, businesses are legally required to pay the government on behalf of the consumer.
PROGRESSIVE TAXA tax is said to be progressive when the tax rate rises as the tax base rises. For example, an income tax is progressive when the tax rate rises as income rises (i.e. richer people pay a higher % of their income than poorer people).
PROPERTY TAXConsists of a regular tax payment based on a property’s estimated value. In Myanmar, this is calculated from the physical characteristics of a property (e.g. its size and whether it is made of wood or brick) and in some cases where it is located. A tax rate is then applied to this estimate value to arrive at the amount of tax due. It is paid every six months.
PUBLIC GOODSAn economic term that refers to a specifi c set of services that are usually provided by the government and not private businesses. They are usually provided by the government because it is hard to charge people a fee for the use of these services. Services such as street lighting, urban roads and drainage are examples of public goods as they can be enjoyed by users whether or not they have paid for them. In Myanmar, however, some public goods are provided by civil society organizations such as community groups and charities.
RANDOMIZED SAMPLINGRefers to the way in which a sample is selected from the overall population. It is classifi ed as random if each observation (e.g. each person) has the same likelihood of being selected. A sample chosen randomly can provide an unbiased representation of the overall population of interest.
REGRESSIVE TAXA tax is said to be regressive when the tax rate falls as the tax base rises. So, an income tax is regressive when the tax rate falls as income rises (i.e. richer people pay a lower % of their income than poorer people).
RESPONDENTSRefers to people, authorities, businesses, etc. from whom data and information are collected for the use of compiling statistics. For example, in the City Life Survey respondents are the people living in the fi ve urban areas that took part in the survey.
SAMPLEA statistical concept that refers to a set of observations selected from a population. For example, in the City Life Survey the sample refers to the 1,400 people selected from the fi ve urban areas surveyed.
7
SOCIAL CONTRACTRefers to the unwritten obligations between citizens and the state. For instance, citizens are expected to pay tax and the state is expected to provide public goods. The social contract evolves as citizen’s and government’s expectations of each other change.
STAMP DUTYA one-off tax paid on the sale of a property. In Myanmar it is collected by the Internal Revenue Department. It should not be confused with property tax, which is a regular payment that is collected by municipalities to fund municipal government services.
SURVEYAn investigation of the opinions or experience of a group of people, based on a series of questions.
TAX ADMINISTRATIONThe management, direction and supervision of tax laws, rules and procedures for the purposes of collecting tax revenues from taxpayers and businesses. For example, the process of collecting property tax from households and recording the collections.
TAX ATTITUDESRefers to a person’s perceptions and opinions about taxes and the tax system. It is one element of tax morale.
TAX BASEThe overall value of the income or asset that is used to calculate how much tax is due. In the case of property tax, the tax base is the estimated value of a property (calculated in Myanmar according to the physical characteristics of a property, and sometimes its location). The tax rate (X%) is multiplied by the tax base to arrive at the overall amount due to the government.
TAX COMPLIANCERefers to a behavior. Someone is tax compliant if they pay the taxes they legally owe. Someone is considered noncompliant if they fail to pay their taxes, misreport information used to calculate the amount of tax due (e.g., their income) or misreport deductions.
TAXESTaxes are a compulsory payment made by individual taxpayers or businesses to a government agency, the proceeds of which go into the public purse to be allocated according to budget priorities. Unlike fees (e.g., a garbage-collection fee), taxes are not tied to particular government services.
TAX MORALERefers to all the reasons that people pay taxes that are not related to a fear of getting caught and punished for not being tax compliant. It includes motivations to pay taxes such as pride, guilt, shame, responsibility, and a concern for others. Individuals are influenced by unwritten cultural and social rules that encourage some behaviors and discourage others. Tax attitudes are one part of tax morale.
TAX POLICYRefers to the choices made by government on what taxes are to be collected, what amounts to collect, how they will be collected and from whom they will be collected. For example, the decision to set the tax rate for commercial tax of most goods and services at 5%.
TAX RATERefers to the amount of tax a person or business has to pay, usually expressed as a percentage. For example, in Myanmar the tax rate for commercial tax is usually equal to 5% of the sales price of a good or service. The tax rate (X%) is multiplied by the tax base to arrive at the overall amount due to the government.
TAX SALIENCEThe extent to which a tax is noticeable or important to a taxpayer. Salience is influenced by the ease of paying the tax, the regularity of the tax and the amount paid. For example, commercial tax is easy to pay and so some people may not always notice they are paying it.

8
9
CHAPTER 1
Introduction
Taxation has a bad reputation. It is often a dry subject fi lled with technical jargon. Few look forward to the taxpaying experience. Most of the time ignored, when the topic of taxes does come up in the media it is usually in the form of an article about one group or another opposing tax changes. It takes a brave politician to propose even a modest tax increase and an unusual citizen to welcome one.
Such views are heard in many countries, but particularly in Myanmar, where the tax take is among the lowest in the world as a share of GDP. It is widely accepted that citizens are fervently antitax, thanks to decades of military authoritarianism that failed to meet the needs of the people. “Increase taxes? There will be riots on the streets,” warned one senior policy maker. But how accurate are tax offi cials’ and policymakers’ prevailing views of citizens’ attitudes towards taxation? What do citizens really think and know?
These questions matter because taxes matter. Myanmar now fi nds itself in the early stages of a democratic transition and the gradual upgrading of its governance systems. Taxes have the potential to be a key tool in supporting these transformations. They are a sustainable and reliable means to raise government revenues to fund the public goods and services that the people want and need.
Paying taxes is at the heart of the social contract between government and citizen. When people pay taxes, they fulfi l a core duty as citizens. This act can empower them to demand that their government work better. Tax policy and the taxpaying experience also matter because they influence citizens’ views of their government. They can determine whether they see their government as transparent, fair, and accountable or extractive, dismissive, and self-serving.
10
Myanmar and taxes1.1
Decades of deliberate neglect of Myanmar’s tax-administration system have left the country with one of the lowest tax takes in the world. Reforms are under way, but as it stands, Myanmar’s tax revenues in 2016–17 were only 6–7% of GDP. This compares to 10–20% of GDP for countries at similar levels of income.1
Historically the state in Myanmar has relied on rents from natural resource revenues, which have been easier to extract and easier to capture by the ruling elite.4 Taxes are a more diffi cult source of revenue, because they require the acceptance of citizens and businesses. Typically, as citizens are asked to pay more tax, their demands on government grow. This forms part of the unwritten social contract between citizens and the state. As policies change and events unfold, citizen and government expectations of their obligations and duties to one another evolve.5
Myanmar’s low tax take is no accident. Decades of military dictatorship, armed conflict between center and periphery, and the poor provision of public goods and services have left Myanmar with a fractured social contract.7 The state was focused more on social control than on improving the social contract.8
Myanmar now fi nds itself at a historic turning point. The democratic transition, economic reforms, and the peace process present an opportunity for change, albeit with immense obstacles to overcome. Taxes could play a vital role in funding the provision of better public goods and services and building the social contract. This is why it is so important to understand what citizens know about taxes and what their actual attitudes are.
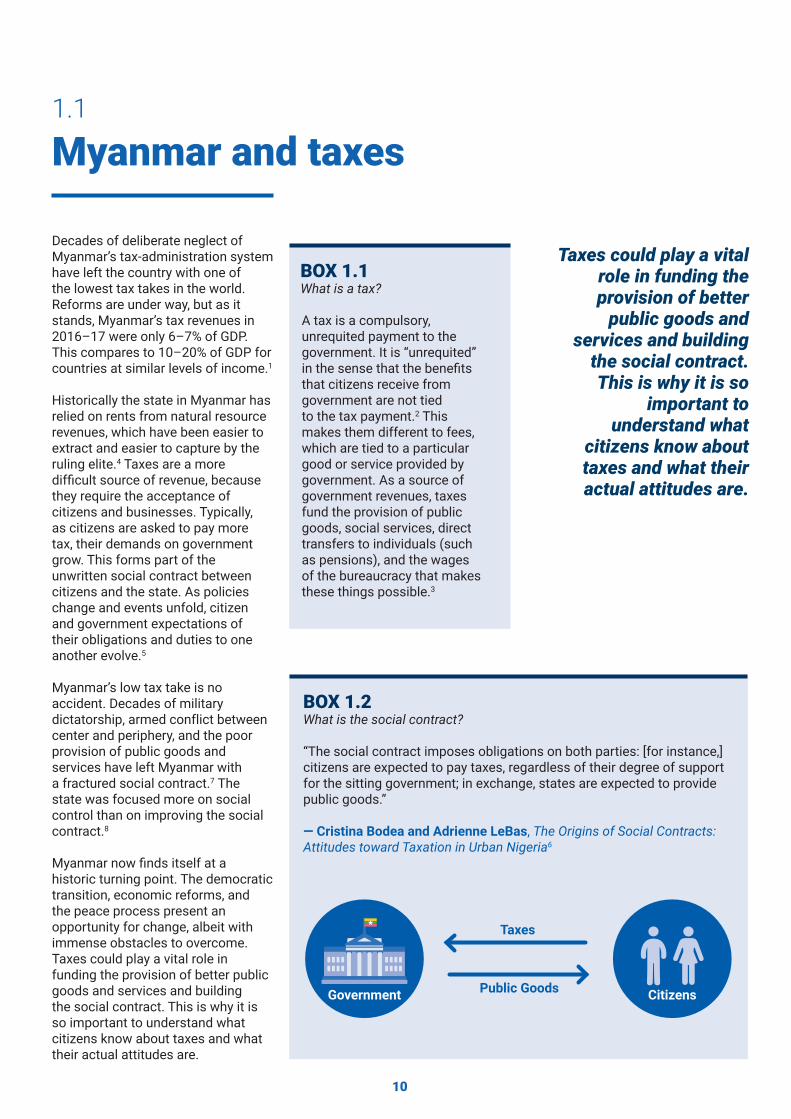
A tax is a compulsory, unrequited payment to the government. It is “unrequited” in the sense that the benefi ts that citizens receive from government are not tied to the tax payment.2 This makes them different to fees, which are tied to a particular good or service provided by government. As a source of government revenues, taxes fund the provision of public goods, social services, direct transfers to individuals (such as pensions), and the wages of the bureaucracy that makes these things possible.3
What is a tax?BOX 1.1
What is the social contract?BOX 1.2
Taxes
Public GoodsGovernment Citizens
“The social contract imposes obligations on both parties: [for instance,] citizens are expected to pay taxes, regardless of their degree of support for the sitting government; in exchange, states are expected to provide public goods.”
— Cristina Bodea and Adrienne LeBas, The Origins of Social Contracts: Attitudes toward Taxation in Urban Nigeria6
Taxes could play a vital role in funding the provision of better
public goods and services and building
the social contract. This is why it is so
important to understand what
citizens know about taxes and what their actual attitudes are.
11
Aims and methods
Structure
1.2
1.3
This paper sets out to systematically assess urban citizens’ tax attitudes in Myanmar. It focuses on three of the most important taxes in Myanmar: income tax, commercial tax, and property tax. Income and commercial taxes are the biggest sources of tax revenue, and property tax is widespread and salient. The study is restricted to citizens living in cities, where exposure to these taxes is greatest.
The paper relies on data from the 2017 City Life Survey undertaken by The Asia Foundation in partnership with the Yangon School of Political Science as part of the Myanmar Strategic Support Program (MSSP).9 The City Life Survey is the first of its kind in Myanmar, tracking public perceptions and lived experiences of urban life.
This survey asked a representative sample of 1,400 female and male citizens from urban areas in Yangon, Hpa-an, and Taunggyi 118 questions
The main fi ndings of the report are found in chapter 4, which assesses urban citizens’ attitudes towards taxation, including the extent to which paying taxes is considered a duty, whether taxes are fair, and whether the rich should pay more than the poor.
Chapter 3 assesses urban citizens’ understanding of taxes and the tax system and what information they want. Chapter 5 presents a conceptual framework that illustrates how a citizen’s interaction with their
related to urban life, work, and governance. These urban areas were chosen to showcase the range of city population sizes, development, and ethnic composition found in Myanmar. Yangon is responsible for most of Myanmar’s tax intake, and the three Yangon townships chosen reflect the diversity of the city. To complement the survey’s quantitative evidence, the research team also conducted qualitative, focus group discussions with 19 residents of Taunggyi and Hpa-an, the capital cities of Shan State and Kayin State respectively.
The research is also supported by key-informant interviews and a survey of government officials’ beliefs about citizens’ attitudes and understanding of taxes, and it is further complemented by over 50 hours of direct experience working with tax collectors and policymakers, as part of The Asia Foundation’s ongoing work to support the reformof property tax in Taunggyi and Hpa-an.10
government and their fellow citizens influences their attitudes towards taxes. Data from the City Life Survey is used to test elements of this framework.
Chapter 6 explores how the taxpaying experience shapes attitudes, and how effective government communication of tax changes can be critical to successful reform. Chapter 7 concludes with a summary of the main fi ndings and a set of recommendations for tax offi cials and policymakers in Myanmar.
A survey is an investigation of the opinions or experience of a group of people, based on a series of questions. They are used by researchers, governments and businesses across the world to provide unbiased information to decision makers. Results of surveys can be compared between places, groups and overtime. It is too expensive to ask everyone questions, so good surveys target just enough of the right people that the researchers are confi dent the results can be generalized to the population of interest (e.g. the residents of Hpa-an city).
What is a survey?BOX 1.3
12
CHAPTER 2
Scope of the study and research methods
To date, there is a lack of comprehensive data on what citizens know about their tax system and how they feel about it. In Myanmar, tax-policy decisions are based on offi cials’ interpretation of largely anecdotal evidence of citizens’ understanding, attitudes and preferences. The only data available is focused on more rural areas. This research seeks to fi ll that gap.
13
Scope of the study2.1
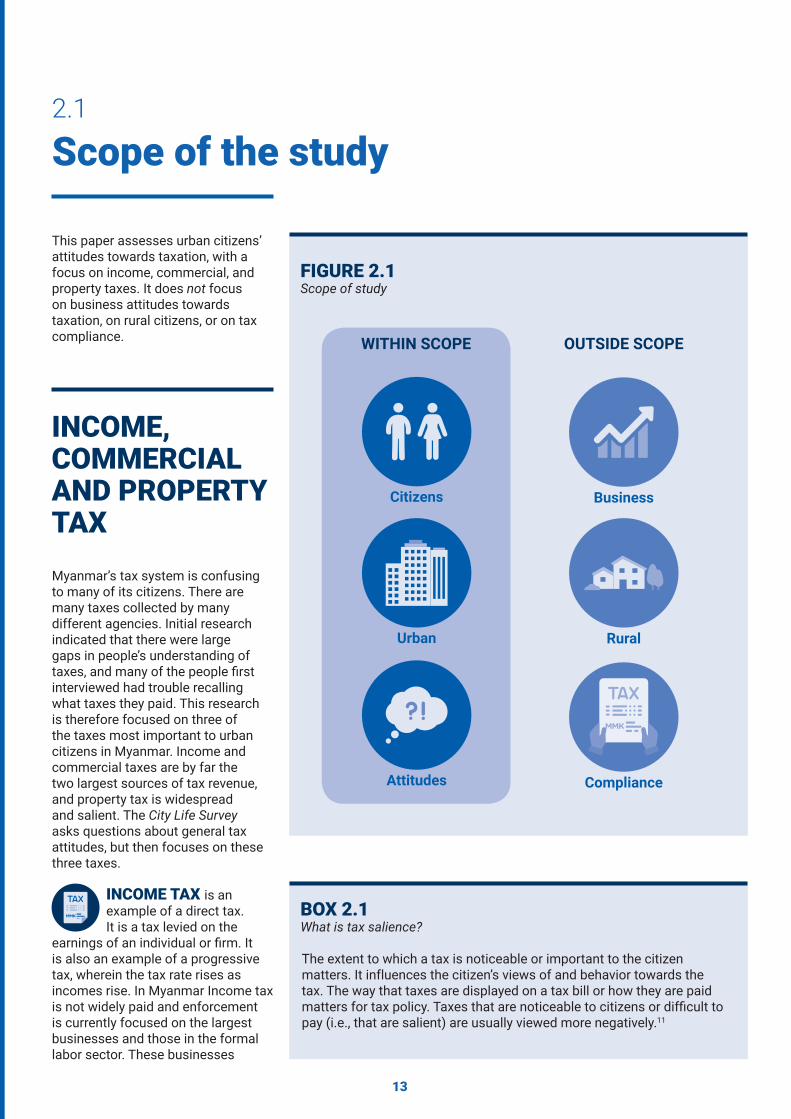
This paper assesses urban citizens’ attitudes towards taxation, with a focus on income, commercial, and property taxes. It does not focus on business attitudes towards taxation, on rural citizens, or on tax compliance.
Scope of studyFIGURE 2.1
Citizens
Urban
Attitudes
WITHIN SCOPE
Business
Rural
Compliance
OUTSIDE SCOPE
Myanmar’s tax system is confusing to many of its citizens. There are many taxes collected by many different agencies. Initial research indicated that there were large gaps in people’s understanding of taxes, and many of the people fi rst interviewed had trouble recalling what taxes they paid. This research is therefore focused on three of the taxes most important to urban citizens in Myanmar. Income and commercial taxes are by far the two largest sources of tax revenue, and property tax is widespread and salient. The City Life Survey asks questions about general tax attitudes, but then focuses on these three taxes.
INCOME TAX is an example of a direct tax. It is a tax levied on the
earnings of an individual or fi rm. It is also an example of a progressive tax, wherein the tax rate rises as incomes rise. In Myanmar Income tax is not widely paid and enforcement is currently focused on the largest businesses and those in the formal labor sector. These businesses
INCOME, COMMERCIAL AND PROPERTY TAX
The extent to which a tax is noticeable or important to the citizen matters. It influences the citizen’s views of and behavior towards the tax. The way that taxes are displayed on a tax bill or how they are paid matters for tax policy. Taxes that are noticeable to citizens or diffi cult to pay (i.e., that are salient) are usually viewed more negatively.11
What is tax salience?BOX 2.1
14
deduct income tax from the salaries they pay to employees, then pass this on to the Internal Revenue Department (IRD).12 This then goes to the Union government budget. Those earning less than MMK 2 million (approx. USD 1,500) in one year pay no tax. Income above this amount is taxed at increasing rates, reaching a 25% tax rate on all income above MMK 30 million (approx. USD 22,400). Tax relief is provided for spouses and children. According to the 2017 Public Expenditure Review, income tax was the most important source of tax revenue, at 3.2% of GDP, in 2016–17.13
COMMERCIAL TAX is an indirect tax on the purchase of goods and
services. It is paid by consumers and businesses. In Myanmar, it is generally charged at a rate of 5% of the sales price of goods or services. In restaurants and bars, the tax is
levied by means of stickers applied to the bill.14 Indirect taxes are usually regressive taxes. The tax paid is the same regardless of the buyer’s ability to pay. But in Myanmar, commercial tax is mainly enforced in urban areas and on the formal or modern sector, so the poorest in Myanmar generally do not pay it. 15 It is collected by the IRD and funds the Union government budget. Commercial tax was the second-most important source of revenue, at 2.6% of GDP, in 2016–17.16,17
PROPERTY TAX consists of a regular tax payment based on
a property’s estimated value. In Myanmar this is calculated from the physical characteristics of a property (e.g. whether it is made of wood or brick) and in some cases where it is located. A tax rate is then applied to this estimate value to arrive at the amount of tax due.18 Property tax
is assessed on all residential and commercial properties in urban areas. It should not be confused with stamp duty or capital gains tax, which are both taxes that are paid on the sale of a property. Practice varies as to whether the property owner or the tenant pays the tax.19 It is a very salient tax, as payment involves direct interaction with a tax collector and occurs regularly, usually every six months.
In the areas studied in this research, property tax is collected by Development Affairs Organizations (DAOs) and the Yangon City Development Committee (YCDC).20
In Yangon, the typical amount collected every six months is MMK 203.00, less than the price of one cup of tea.21 It accounts for a very small share of government tax revenue—approximately 0.03% of GDP in 2013, a fraction of what neighboring countries collect.22
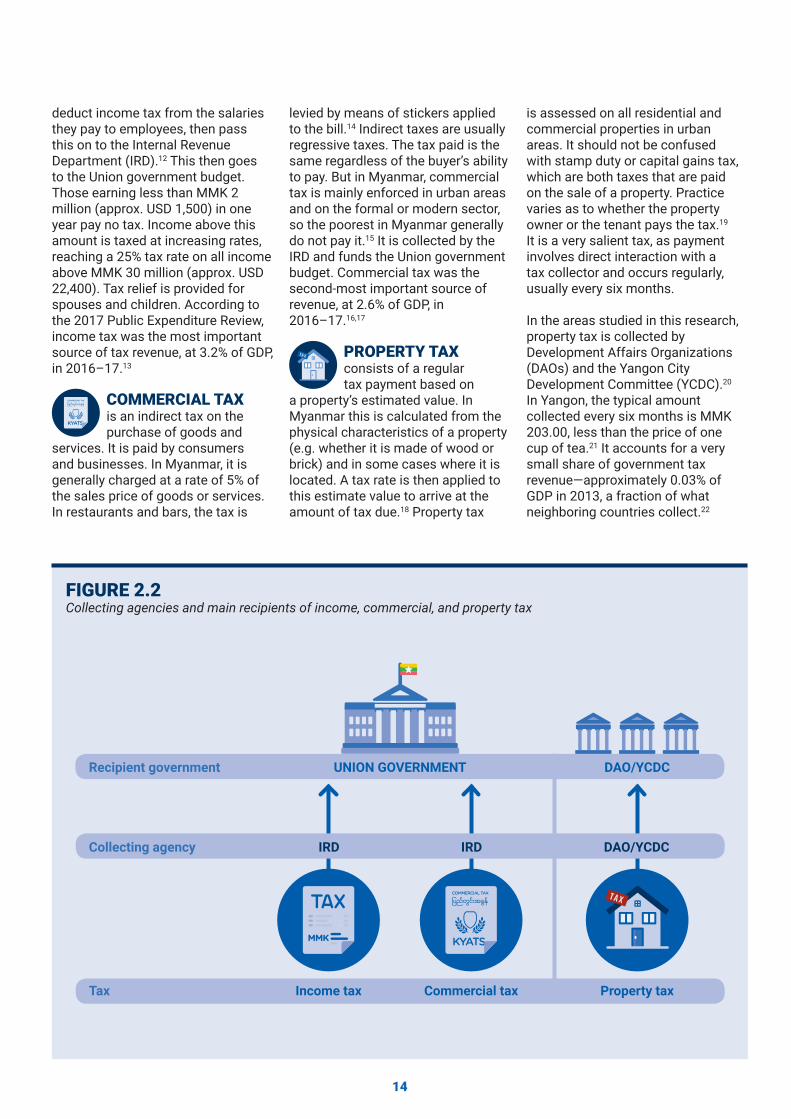
Tax
Recipient government UNION GOVERNMENT DAO/YCDC
Income tax
IRDCollecting agency IRD DAO/YCDC
Commercial tax Property tax
Collecting agencies and main recipients of income, commercial, and property taxFIGURE 2.2
15
CITIZENS’ ATTITUDESThe term citizen implies certain obligations and entitlements vis-à-vis the state. A number of these are set out in Myanmar’s 2008 Constitution, including an obligation to pay taxes (article 389). Citizens pay taxes and fees in several ways:
l As consumers, buying goods or services
l As owners of businesses l As employees l As property owners or occupants
This report does not consider businesses’ attitudes towards taxes, even though businesses are involved in the taxpaying process. The focus of the report is on what citizens as consumers, employees, and homeowners or occupants think about the taxes they pay, the tax system, and the taxpaying experience. The research is focused on formal taxes paid to the Myanmar state. It does not consider informal payments or contributions to nonstate actors, such as ethnic armed groups or charities.
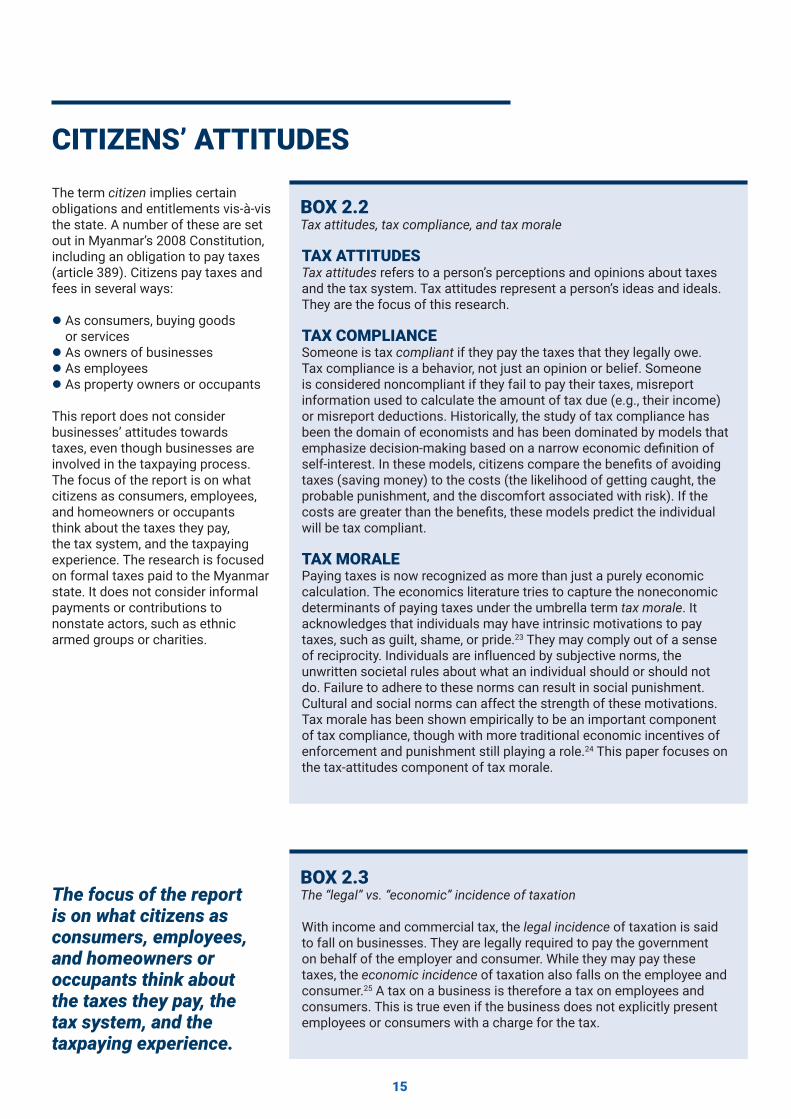
TAX ATTITUDESTax attitudes refers to a person’s perceptions and opinions about taxes and the tax system. Tax attitudes represent a person’s ideas and ideals. They are the focus of this research. TAX COMPLIANCE Someone is tax compliant if they pay the taxes that they legally owe. Tax compliance is a behavior, not just an opinion or belief. Someone is considered noncompliant if they fail to pay their taxes, misreport information used to calculate the amount of tax due (e.g., their income) or misreport deductions. Historically, the study of tax compliance has been the domain of economists and has been dominated by models that emphasize decision-making based on a narrow economic defi nition of self-interest. In these models, citizens compare the benefi ts of avoiding taxes (saving money) to the costs (the likelihood of getting caught, the probable punishment, and the discomfort associated with risk). If the costs are greater than the benefi ts, these models predict the individual will be tax compliant.
TAX MORALEPaying taxes is now recognized as more than just a purely economic calculation. The economics literature tries to capture the noneconomic determinants of paying taxes under the umbrella term tax morale. It acknowledges that individuals may have intrinsic motivations to pay taxes, such as guilt, shame, or pride.23 They may comply out of a sense of reciprocity. Individuals are influenced by subjective norms, the unwritten societal rules about what an individual should or should not do. Failure to adhere to these norms can result in social punishment. Cultural and social norms can affect the strength of these motivations. Tax morale has been shown empirically to be an important component of tax compliance, though with more traditional economic incentives of enforcement and punishment still playing a role.24 This paper focuses on the tax-attitudes component of tax morale.
Tax attitudes, tax compliance, and tax moraleBOX 2.2
With income and commercial tax, the legal incidence of taxation is said to fall on businesses. They are legally required to pay the government on behalf of the employer and consumer. While they may pay these taxes, the economic incidence of taxation also falls on the employee and consumer.25 A tax on a business is therefore a tax on employees and consumers. This is true even if the business does not explicitly present employees or consumers with a charge for the tax.
The “legal” vs. “economic” incidence of taxationBOX 2.3
The focus of the report is on what citizens as consumers, employees, and homeowners or occupants think about the taxes they pay, the tax system, and the taxpaying experience.
16
In Myanmar, cities are not clearly defi ned, and population estimates are not readily available. The 2014 census provides estimates of the population of townships, but many townships include rural areas. For instance, Hpa-an is only 18% urban.30 This research defi nes the term urban area as the urban population of a township—those living in urban wards—according to the 2014 census. As can be seen in annex 1, these urban areas can vary drastically in population size. In some cases, the urban areas are cities in their own right (such as Taunggyi), while in others they are 100% urban townships that make up part of a city (such as in Yangon, Mandalay, Bago, and Nay Pyi Taw). Census estimates of the urban shares of townships can be used to estimate the population of urban areas. These estimates are in-line with data provided by the General Administration Department (see annex 1.)
What is a city in Myanmar?BOX 2.4
CITIZENS LIVING IN URBAN AREASAccording to the 2014 census, 30% of Myanmar’s population lives in urban areas, and its cities are growing in size and complexity.26 We choose to focus on urban citizens for two reasons:27
l Citizens in urban areas tend to have higher levels of education and exposure to the state.28 There tend to be more government services in cities and more exposure to paying taxes, in part due to higher formalization of the economy. Taxation is a technical subject, and initial interviews indicated a low base level of understanding
even among interviewees with high levels of education. To reduce the “noise” (unreliable and invalid data) in the survey, the research focused on urban citizens, as they had the highest likelihood of understanding the questions.
l We assume that in cities there is a stronger link in citizens’ minds between taxes and government services. DAOs and the YCDC are responsible for a broad range of urban services, which they fund through taxes and fees collected from citizens and businesses.29 In rural areas, most government
spending is directed by Union ministries operating at the local level.
The focus on cities means these results may not be representative of the Myanmar population as a whole. The townships and cities surveyed are typical of many in Myanmar. And so, while we cannot establish whether or not they are representative of all cities in Myanmar, the fi ndings are of relevance to those working on urban issues and on taxes (the majority of which are collected in Yangon).
Research methods2.2
This research adopts a mixed-methods approach to understanding urban citizens’ attitudes towards taxation. It draws primarily on the results of a large-scale survey of urban residents in fi ve urban areas of three cities. The survey is intended to be repeated in coming years to allow for comparisons over time. Full details of the methodology are available as annex 1.
As taxation is a subject that can be diffi cult to understand, focus group discussions were conducted to interrogate the results of the survey and provide insights into citizens’ taxpaying experience. The Asia Foundation’s previous work with tax offi cials and policymakers of Myanmar’s municipalities and state and region governments suggested that there was a broad consensus
on citizens’ understanding of and attitudes towards taxation. This research sought to explicitly test some of these views and to identify the magnitude of any gap between the prevailing consensus and reality. A combination of key-informant interviews and small-scale surveys were conducted to understand tax offi cials’ and policymakers’ views of taxpayers. Qualitative fi ndings were
17
translation and backward translation of the survey questions to ensure that they conveyed their intended meaning in the Myanmar language.
TAX COLLECTOR SURVEYA small-scale survey to explicitly test tax offi cials’ and policymakers’ views of public attitudes was developed and administered to four offi cials covering the three cities surveyed. This was later extended to cover 33 municipal policymakers from 14 states and regions. A total of 12 taxation questions were asked to explicitly test how offi cials thought the survey respondents would, on average, answer some of the City Life Survey questions on taxation.
FOCUS GROUP DISCUSSIONSTwo focus groups, in Taunggyi and Hpa-an, were conducted in December 2017. The former consisted of 10 participants (fi ve women and fi ve men) from three wards. The latter included nine participants from nine wards (six women and three men). An open-ended discussion of taxes was followed by a structured set of specifi c questions on taxes and tax attitudes.
INTERVIEWS WITH TAX OFFICIALS Semistructured interviews were conducted with government offi cials working in departments related to the three taxes examined in this report. These interviews were supplemented by group discussions with policymakers, including ministers, MPs, and state directors in Yangon, Taunggyi, and Hpa-an, as part of the MSSP.
LIMITATIONS OF RESEARCH APPROACHThis paper relies primarily on quantitative research gathered as part of the City Life Survey. While the fi ve urban areas are diverse enough to reflect a range of Myanmar’s urban landscapes, they are not representative, in the statistical sense, of all of Myanmar’s urban areas.31 The fi ndings are most generalizable to mid- to large-sized cities. Annex 1 shows that the cities
of Bago, Mawlamyine, Pathein, Myitkyina, Sittwe, Magway, and Sagaing have urban populations that lie between Taunggyi and Hpa-an in size. The fi ndings are not statistically representative of the overall Myanmar population, but may still be indicative of broad trends.
The overall sample is overrepresented by middle age respondents and underrepresented by young respondents, relative to the overall populations in those cities. The available census data on township populations (which in many instances include rural residents) suggests that those aged 20-29 are the least represented in the survey relative to actual populations. Men tended to be more underrepresented than women in this age group. The results displayed in this paper are unweighted according to age or gender, in part due to a lack of reliable data on city populations according to age and gender, and so this should be taken into consideration when interpreting the results.
then compared and triangulated with the main survey fi ndings.
THE CITY LIFE SURVEYThe City Life Survey is the fi rst of its kind in Myanmar, tracking public perceptions and lived experiences of urban life on a multiyear basis. The City Life Survey assesses urban residents’ overall outlook on the urban environment; perceptions of city liveability; access to government services; attitudes towards taxation; work, and economic opportunities; identity, community and political participation; and well-being.
The sample frame for the survey was defi ned as fi ve urban areas within three cities: Hpa-an (city), Taunggyi (city), Kyauktada (township of Yangon City), Thaketa (township of Yangon City), and North Dagon (township of Yangon City). Each of the three chosen cities is the capital of its respective state or region, and they encompass a range of population sizes, levels of development, and ethnic composition. They are considered to be illustrative of Myanmar’s urban landscape, with many of Myanmar’s cities falling within the range of their characteristics. The three townships within Yangon capture some of the diversity of Yangon as a city, ranging from small, downtown Kyauktada (which includes Yangon City Hall) to the large satellite township of North Dagon.
The sampling strategy within these fi ve urban areas consisted of three stages of randomization to ensure that respondents would be statistically representative of each of the fi ve urban areas.
The survey asked 1,400 urban residents 12 demographic questions and 106 substantive questions. The survey design relies on multiple-choice questions. Given the challenges presented by technical tax terminology, signifi cant emphasis was placed on
The sample frame for the survey was defi ned
as fi ve urban areas within three cities: Hpa-
an (city), Taunggyi (city), Kyauktada (township of
Yangon City), Thaketa (township of Yangon
City), and North Dagon (township of
Yangon City).
18
CHAPTER 3
Citizens’ understanding of the tax system
“The incomprehensibility of the tax system is not merely annoying, it is antidemocratic. Because the taxpaying process is confusing, taxpayers are reminded that government can operate beyond the understanding, and therefore the accountability, of the average [citizen]—a violation of the citizenry’s authority over government.”
— Vanessa WilliamsonPaying Taxes: Understanding Americans’ Tax Attitudes32
Tax systems around the world are often poorly understood. The excessive complexity of some tax systems is often compounded by limited efforts on the part of government to provide the information citizens want. This can range from the most basic information on what taxes people are supposed to pay (and how to pay them), to the deeper intricacies of the overall tax system needed to evaluate government policy. The economic damage caused by overly complex tax systems is well documented.33
It is not as widely appreciated that citizens’ limited understanding of taxes and the tax system can also be damaging. Poor understanding can reduce compliance.34 It can fuel suspicion of government tax policy and make otherwise sensible tax reforms more diffi cult. More fundamentally, a tax system that cannot be understood by its citizens is arguably antidemocratic.35
This research marks the fi rst rigorous assessment of urban citizens’ understanding of taxes and the tax system in Myanmar. The City Life Survey contained a number of tests to assess the level of understanding, and focus groups have been used to verify these tests and detail where some of the misunderstanding takes place. In this chapter, understanding is broken down into the following components:
lFamiliarity with the taxes. Have citizens heard of or paid these taxes? lUnderstanding of the tax system. Do citizens recognize which taxes are important and where their tax money goes? Do they understand what happens to those who don’t pay? lDesire for more information. Do citizens want to know more?
19
Share of respondents that have heard of income tax36FIGURE 3.1
Taunggyi
Hpa-an
North Dagon
Thaketa
Kyauktada
TOTAL
n=404
n=151
n=367
n=421
n=57
n=1,400
Yes Don’t know No44% 13% 43%
45%
63% 8% 28%
35%6%59%
74%
55% 10% 35%
2% 25%
17% 38%
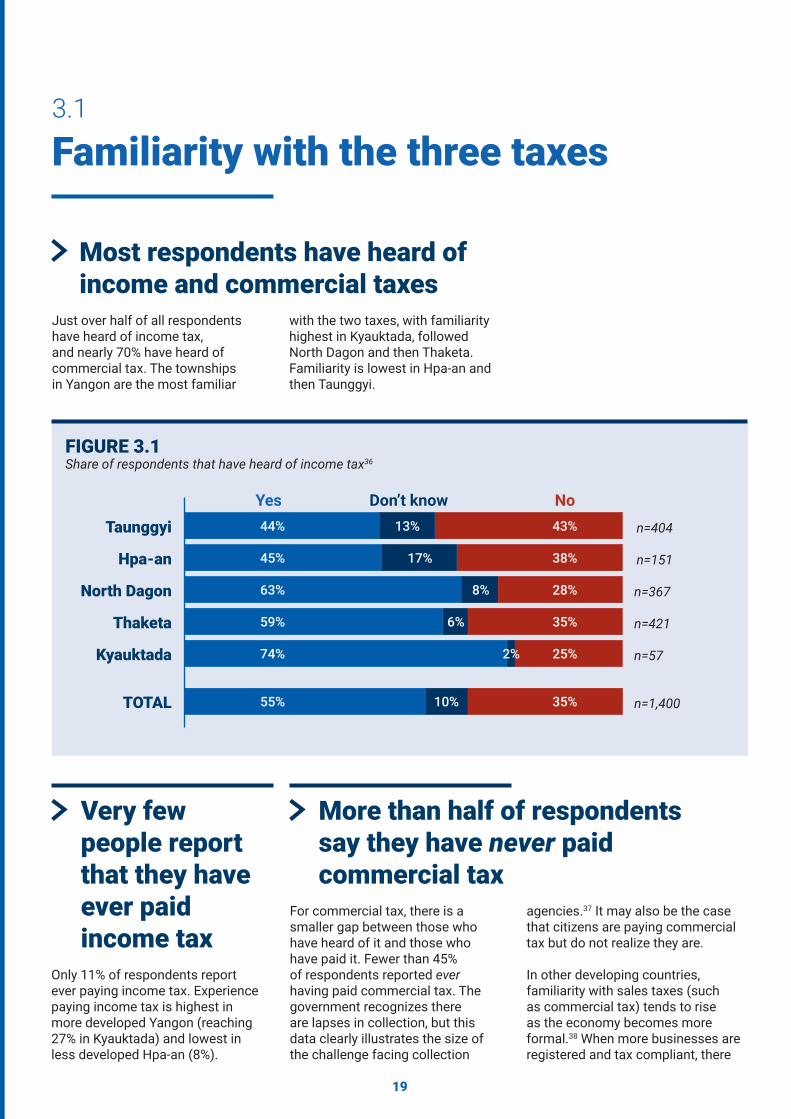
Familiarity with the three taxes3.1
Just over half of all respondents have heard of income tax, and nearly 70% have heard of commercial tax. The townships in Yangon are the most familiar
Only 11% of respondents report ever paying income tax. Experience paying income tax is highest in more developed Yangon (reaching 27% in Kyauktada) and lowest in less developed Hpa-an (8%).
For commercial tax, there is a smaller gap between those who have heard of it and those who have paid it. Fewer than 45% of respondents reported ever having paid commercial tax. The government recognizes there are lapses in collection, but this data clearly illustrates the size of the challenge facing collection
Very few people report that they have ever paid income tax
More than half of respondents say they have never paid commercial tax
Most respondents have heard of income and commercial taxes
with the two taxes, with familiarity highest in Kyauktada, followed North Dagon and then Thaketa. Familiarity is lowest in Hpa-an and then Taunggyi.
agencies.37 It may also be the case that citizens are paying commercial tax but do not realize they are.
In other developing countries, familiarity with sales taxes (such as commercial tax) tends to rise as the economy becomes more formal.38 When more businesses are registered and tax compliant, there
20
is a greater chance that a citizen will experience (and notice) a transaction that involves the payment of a sales tax. We would therefore expect the richer and more developed cities of Yangon and Taunggyi to have higher levels of familiarity with commercial tax. This is borne out by the survey, with 57% of respondents in Hpa-an stating that they have heard of
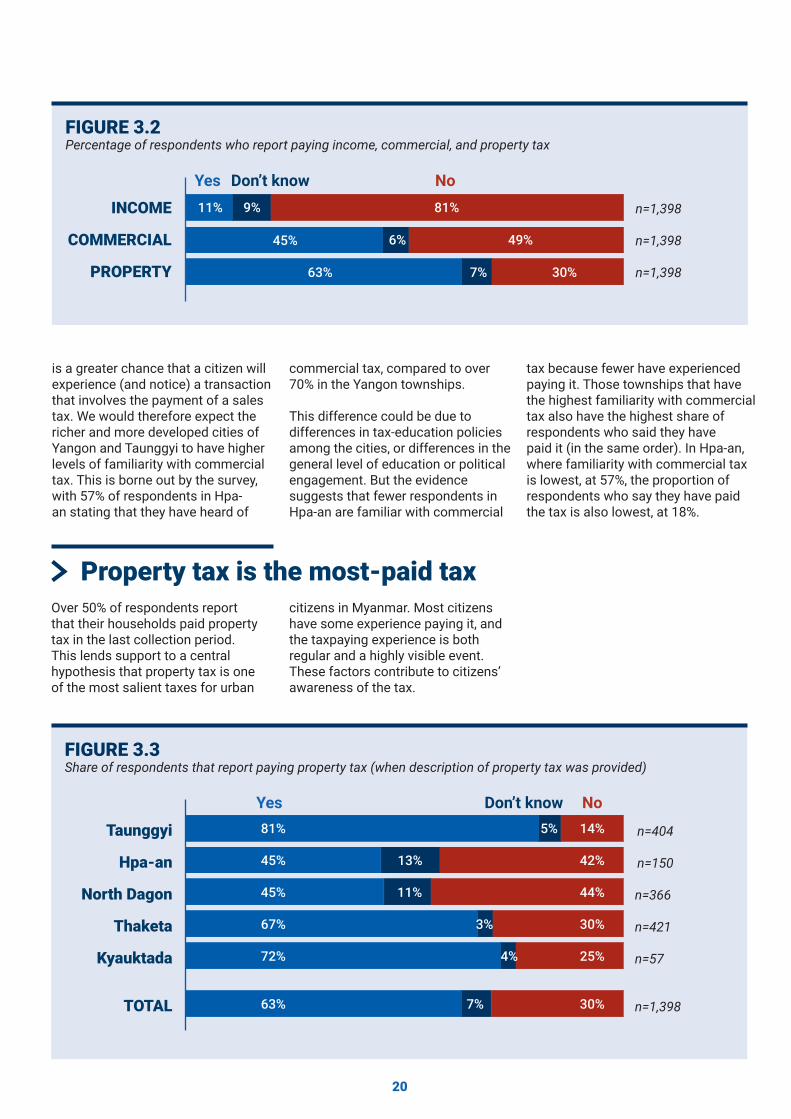
Over 50% of respondents report that their households paid property tax in the last collection period. This lends support to a central hypothesis that property tax is one of the most salient taxes for urban
Percentage of respondents who report paying income, commercial, and property taxFIGURE 3.2
INCOME
COMMERCIAL
PROPERTY
Yes Don’t know No
n=1,398
n=1,398
n=1,398
11%
45% 6% 49%
63% 7% 30%
9% 81%
commercial tax, compared to over 70% in the Yangon townships.
This difference could be due to differences in tax-education policies among the cities, or differences in the general level of education or political engagement. But the evidence suggests that fewer respondents in Hpa-an are familiar with commercial
tax because fewer have experienced paying it. Those townships that have the highest familiarity with commercial tax also have the highest share of respondents who said they have paid it (in the same order). In Hpa-an, where familiarity with commercial tax is lowest, at 57%, the proportion of respondents who say they have paid the tax is also lowest, at 18%.
Property tax is the most-paid tax citizens in Myanmar. Most citizens have some experience paying it, and the taxpaying experience is both regular and a highly visible event. These factors contribute to citizens’ awareness of the tax.
Share of respondents that report paying property tax (when description of property tax was provided) FIGURE 3.3
Taunggyi
Hpa-an
North Dagon
Thaketa
Kyauktada
TOTAL
n=404
n=150
n=366
n=421
n=57
n=1,398
Yes Don’t know No81% 5% 14%
45%
45% 11% 44%
30%3%67%
72%
63% 7% 30%
4% 25%
13% 42%
21
Initial research and survey piloting indicated that some respondents confuse utility bills with property tax, leading to larger numbers saying they have paid property tax than is really the case. This is supported by evidence from the focus group discussions. When asked what taxes they paid, some participants listed utility bills, though they did not specify if they considered these to be property tax.
To test the extent of this problem, two questions were included in the City Life Survey about whether a household or the occupant’s landlord had paid property tax. The fi rst
The survey results show that a signifi cant proportion of households that should be paying property tax are not. The Foundation’s reform work with DAOs indicates that this
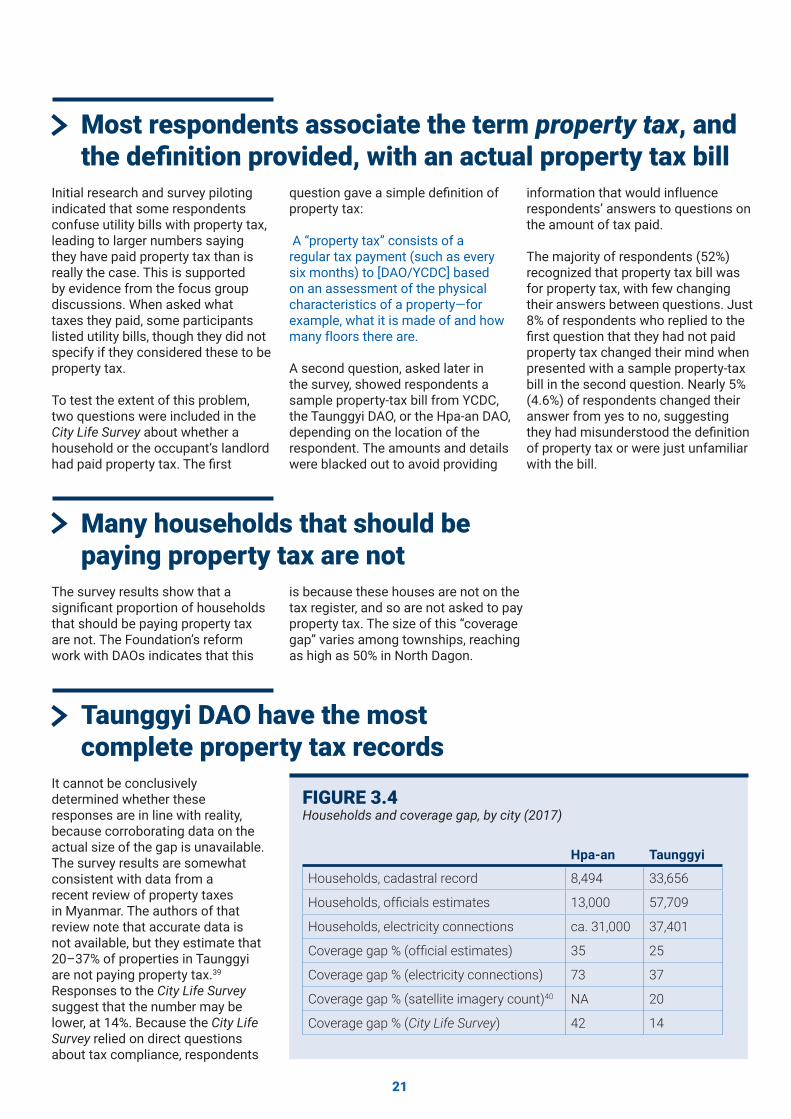
It cannot be conclusively determined whether these responses are in line with reality, because corroborating data on the actual size of the gap is unavailable. The survey results are somewhat consistent with data from a recent review of property taxes in Myanmar. The authors of that review note that accurate data is not available, but they estimate that 20–37% of properties in Taunggyi are not paying property tax.39 Responses to the City Life Survey suggest that the number may be lower, at 14%. Because the City Life Survey relied on direct questions about tax compliance, respondents
Most respondents associate the term property tax, and the defi nition provided, with an actual property tax bill
Many households that should be paying property tax are not
Taunggyi DAO have the most complete property tax records
question gave a simple defi nition of property tax:
A “property tax” consists of a regular tax payment (such as every six months) to [DAO/YCDC] based on an assessment of the physical characteristics of a property—for example, what it is made of and how many floors there are.
A second question, asked later in the survey, showed respondents a sample property-tax bill from YCDC, the Taunggyi DAO, or the Hpa-an DAO, depending on the location of the respondent. The amounts and details were blacked out to avoid providing
information that would influence respondents’ answers to questions on the amount of tax paid.
The majority of respondents (52%) recognized that property tax bill was for property tax, with few changing their answers between questions. Just 8% of respondents who replied to the fi rst question that they had not paid property tax changed their mind when presented with a sample property-tax bill in the second question. Nearly 5% (4.6%) of respondents changed their answer from yes to no, suggesting they had misunderstood the defi nition of property tax or were just unfamiliar with the bill.
is because these houses are not on the tax register, and so are not asked to pay property tax. The size of this “coverage gap” varies among townships, reaching as high as 50% in North Dagon.
Households and coverage gap, by city (2017)FIGURE 3.4
Hpa-an Taunggyi
Households, cadastral record 8,494 33,656
Households, offi cials estimates 13,000 57,709
Households, electricity connections ca. 31,000 37,401
Coverage gap % (offi cial estimates) 35 25
Coverage gap % (electricity connections) 73 37
Coverage gap % (satellite imagery count)40 NA 20
Coverage gap % (City Life Survey) 42 14
22
may have feared punishment and given inaccurate answers.
Yet, in North Dagon and Hpa-an, where many (44% and 42%) said they do not pay property tax, a majority (79% and 66%) also agree that those who do not pay the tax are punished.
This suggests that a fear that truthful answers may lead to punishment is not a factor.
The number of respondents reporting they have not paid property tax in Hpa-an is within the estimates of the coverage gap of the property tax study.
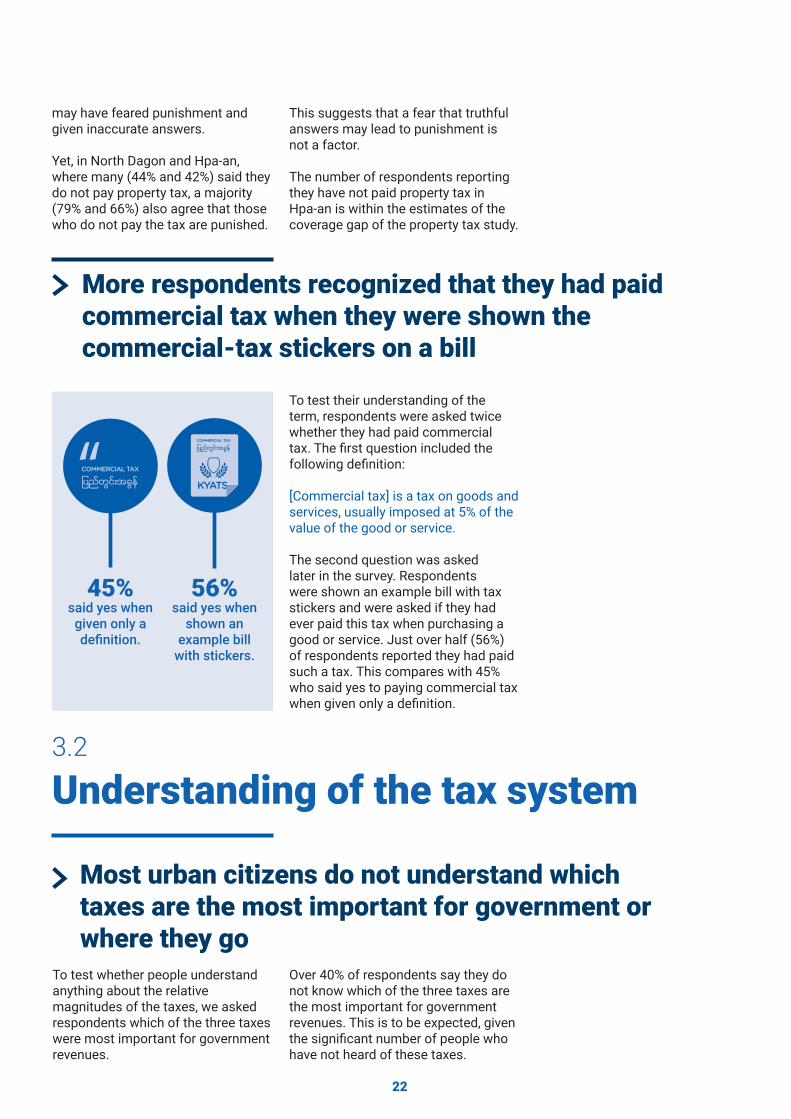
To test their understanding of the term, respondents were asked twice whether they had paid commercial tax. The fi rst question included the following defi nition:
[Commercial tax] is a tax on goods and services, usually imposed at 5% of the value of the good or service.
The second question was asked later in the survey. Respondents were shown an example bill with tax stickers and were asked if they had ever paid this tax when purchasing a good or service. Just over half (56%) of respondents reported they had paid such a tax. This compares with 45% who said yes to paying commercial tax when given only a defi nition.
More respondents recognized that they had paid commercial tax when they were shown the commercial-tax stickers on a bill
45% 56%said yes when given only a defi nition.
said yes when shown an
example bill with stickers.
“
Understanding of the tax system3.2
To test whether people understand anything about the relative magnitudes of the taxes, we asked respondents which of the three taxes were most important for government revenues.
Most urban citizens do not understand which taxes are the most important for government or where they go
Over 40% of respondents say they do not know which of the three taxes are the most important for government revenues. This is to be expected, given the signifi cant number of people who have not heard of these taxes.
23
Share of respondents answering “do not know”FIGURE 3.5
Which level of government receives most of the revenues
from each tax?
Which of these three taxes are most important
for government?
n=1,399
n=1,399
Do not know
60%
44%
Taxes as share of GDP, 2016/17 (%)FIGURE 3.6
Income Tax Property Tax
3.2% 2.6% 0.03%
Commercial Tax
Sources: World Bank,41 Renaissance Institute42
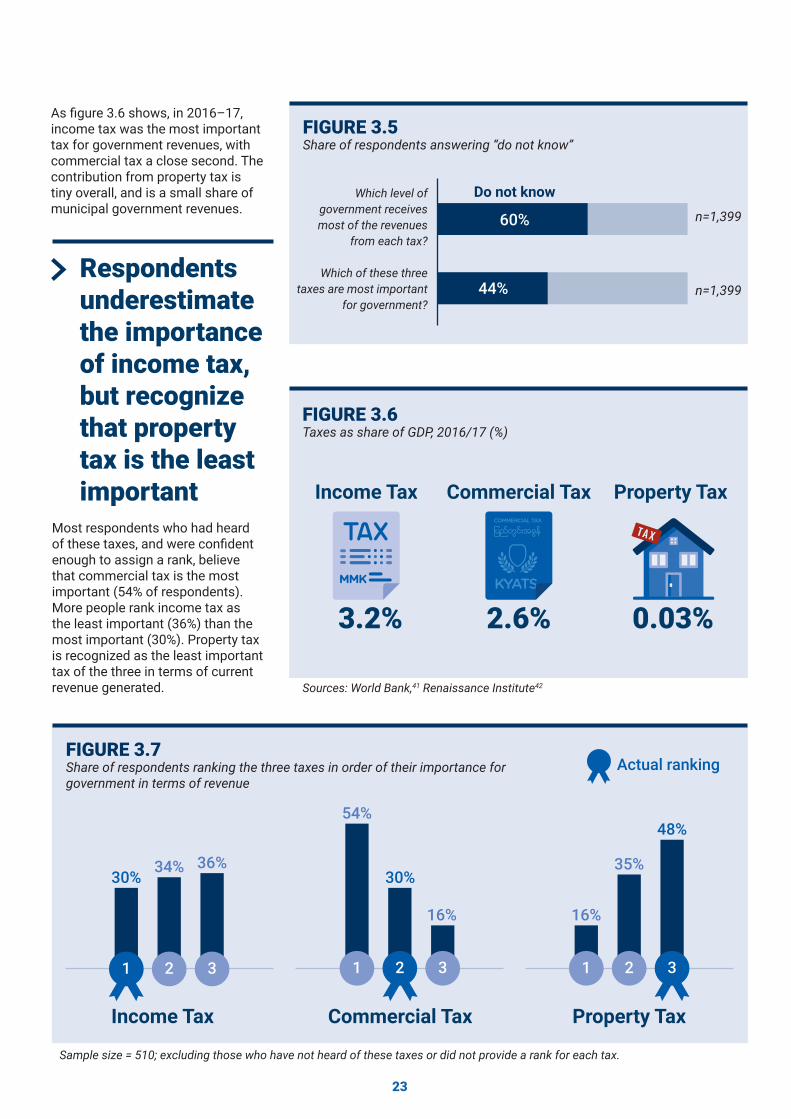
As fi gure 3.6 shows, in 2016–17, income tax was the most important tax for government revenues, with commercial tax a close second. The contribution from property tax is tiny overall, and is a small share of municipal government revenues.
Most respondents who had heard of these taxes, and were confi dent enough to assign a rank, believe that commercial tax is the most important (54% of respondents). More people rank income tax as the least important (36%) than the most important (30%). Property tax is recognized as the least important tax of the three in terms of current revenue generated.
Respondents underestimate the importance of income tax, but recognize that property tax is the least important
Sample size = 510; excluding those who have not heard of these taxes or did not provide a rank for each tax.
Share of respondents ranking the three taxes in order of their importance for government in terms of revenue
FIGURE 3.7Actual ranking
Income Tax Commercial Tax Property Tax
34% 35%30%30%
54%
1
16%
12 2
36%
3
48%
16%
321 3
24
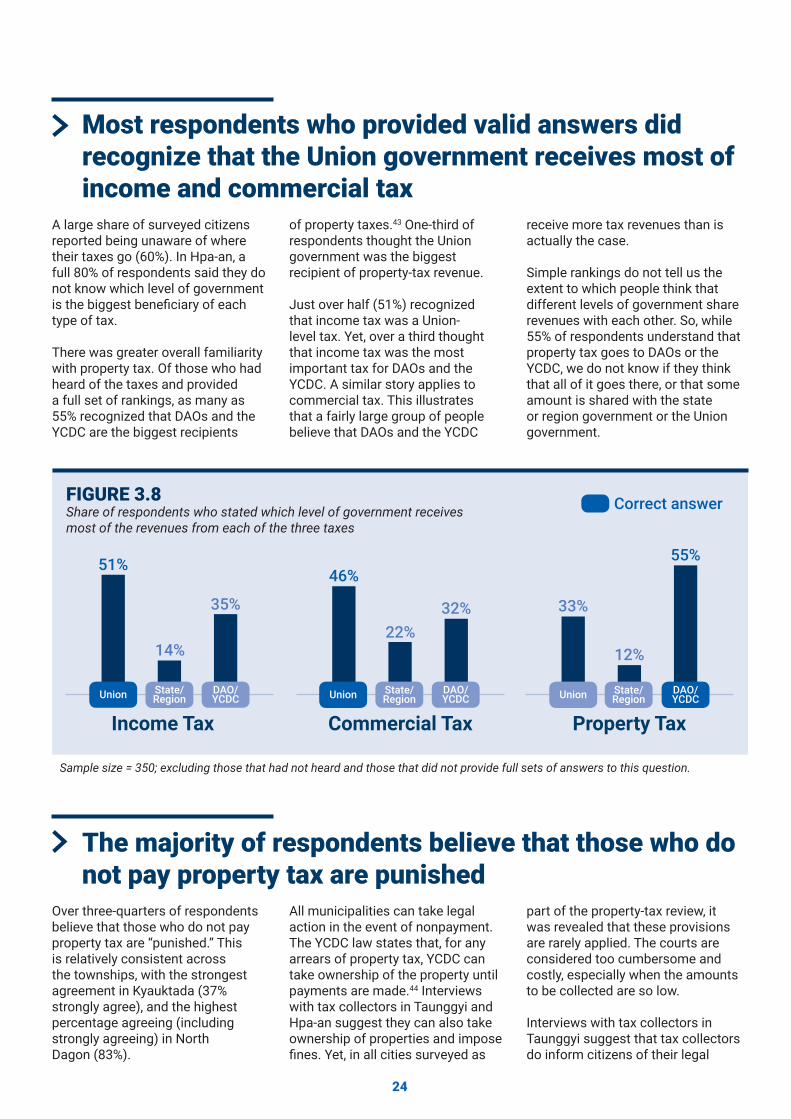
Most respondents who provided valid answers did recognize that the Union government receives most of income and commercial tax
The majority of respondents believe that those who do not pay property tax are punished
A large share of surveyed citizens reported being unaware of where their taxes go (60%). In Hpa-an, a full 80% of respondents said they do not know which level of government is the biggest benefi ciary of each type of tax.
There was greater overall familiarity with property tax. Of those who had heard of the taxes and provided a full set of rankings, as many as 55% recognized that DAOs and the YCDC are the biggest recipients
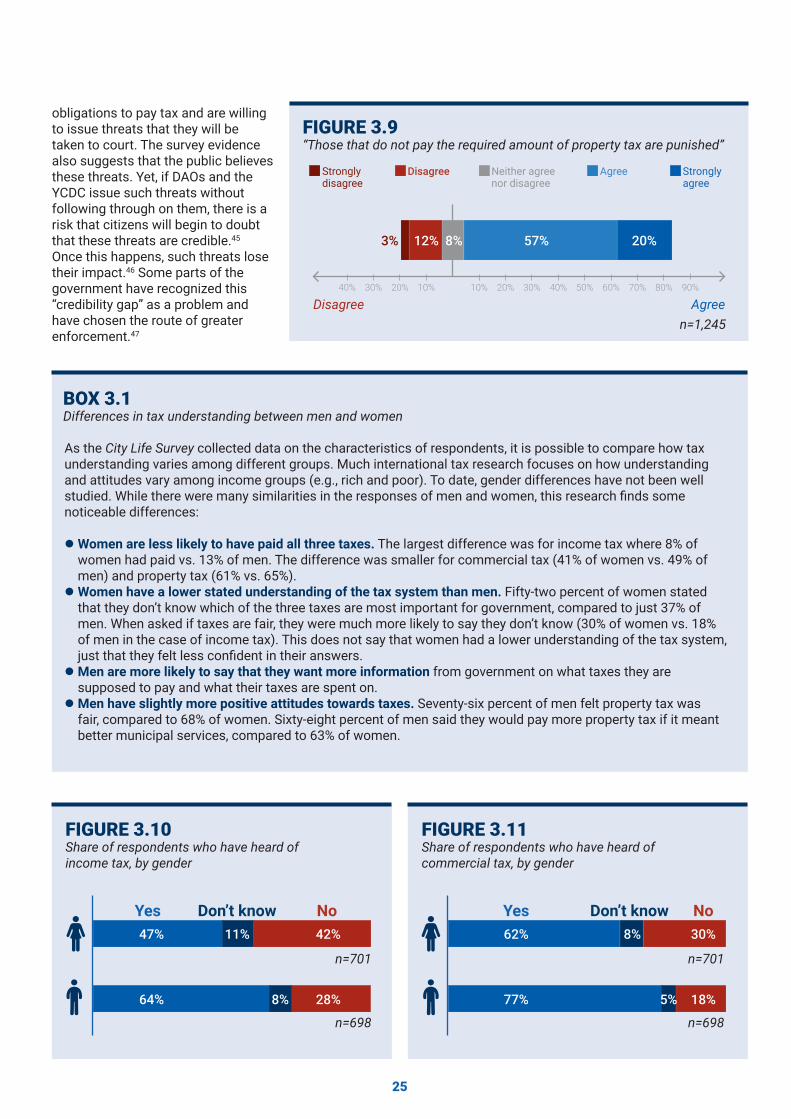
Over three-quarters of respondents believe that those who do not pay property tax are “punished.” This is relatively consistent across the townships, with the strongest agreement in Kyauktada (37% strongly agree), and the highest percentage agreeing (including strongly agreeing) in North Dagon (83%).
of property taxes.43 One-third of respondents thought the Union government was the biggest recipient of property-tax revenue.
Just over half (51%) recognized that income tax was a Union-level tax. Yet, over a third thought that income tax was the most important tax for DAOs and the YCDC. A similar story applies to commercial tax. This illustrates that a fairly large group of people believe that DAOs and the YCDC
Sample size = 350; excluding those that had not heard and those that did not provide full sets of answers to this question.
Share of respondents who stated which level of government receives most of the revenues from each of the three taxes
FIGURE 3.8
55%
Income Tax Commercial Tax Property Tax
51%
14%
35%
46%
32% 33%
12%22%
Union Union UnionState/Region
State/Region
State/Region
DAO/YCDC
DAO/YCDC
DAO/YCDC
Correct answer
receive more tax revenues than is actually the case.
Simple rankings do not tell us the extent to which people think that different levels of government share revenues with each other. So, while 55% of respondents understand that property tax goes to DAOs or the YCDC, we do not know if they think that all of it goes there, or that some amount is shared with the state or region government or the Union government.
All municipalities can take legal action in the event of nonpayment. The YCDC law states that, for any arrears of property tax, YCDC can take ownership of the property until payments are made.44 Interviews with tax collectors in Taunggyi and Hpa-an suggest they can also take ownership of properties and impose fi nes. Yet, in all cities surveyed as
part of the property-tax review, it was revealed that these provisions are rarely applied. The courts are considered too cumbersome and costly, especially when the amounts to be collected are so low.
Interviews with tax collectors in Taunggyi suggest that tax collectors do inform citizens of their legal
25
obligations to pay tax and are willing to issue threats that they will be taken to court. The survey evidence also suggests that the public believes these threats. Yet, if DAOs and the YCDC issue such threats without following through on them, there is a risk that citizens will begin to doubt that these threats are credible.45 Once this happens, such threats lose their impact.46 Some parts of the government have recognized this “credibility gap” as a problem and have chosen the route of greater enforcement.47
As the City Life Survey collected data on the characteristics of respondents, it is possible to compare how tax understanding varies among different groups. Much international tax research focuses on how understanding and attitudes vary among income groups (e.g., rich and poor). To date, gender differences have not been well studied. While there were many similarities in the responses of men and women, this research fi nds some noticeable differences:
l Women are less likely to have paid all three taxes. The largest difference was for income tax where 8% of women had paid vs. 13% of men. The difference was smaller for commercial tax (41% of women vs. 49% of men) and property tax (61% vs. 65%).
l Women have a lower stated understanding of the tax system than men. Fifty-two percent of women stated that they don’t know which of the three taxes are most important for government, compared to just 37% of men. When asked if taxes are fair, they were much more likely to say they don’t know (30% of women vs. 18% of men in the case of income tax). This does not say that women had a lower understanding of the tax system, just that they felt less confi dent in their answers.
l Men are more likely to say that they want more information from government on what taxes they are supposed to pay and what their taxes are spent on.
l Men have slightly more positive attitudes towards taxes. Seventy-six percent of men felt property tax was fair, compared to 68% of women. Sixty-eight percent of men said they would pay more property tax if it meant better municipal services, compared to 63% of women.
Differences in tax understanding between men and womenBOX 3.1
Yes Don’t know No
Share of respondents who have heard of income tax, by gender
FIGURE 3.10
n=701
n=698
47% 11% 42%
28%8%64%
Share of respondents who have heard of commercial tax, by gender
FIGURE 3.11
Yes Don’t know No
n=701
n=698
62% 8% 30%
18%5%77%
“Those that do not pay the required amount of property tax are punished”FIGURE 3.9
Strongly disagree
Disagree Agree Strongly agree
Neither agree nor disagree
Disagree Agree
57% 20%8%12%3%
10% 70% 80% 90%40% 40%20% 60%30%30% 50%20%10%
n=1,245
26
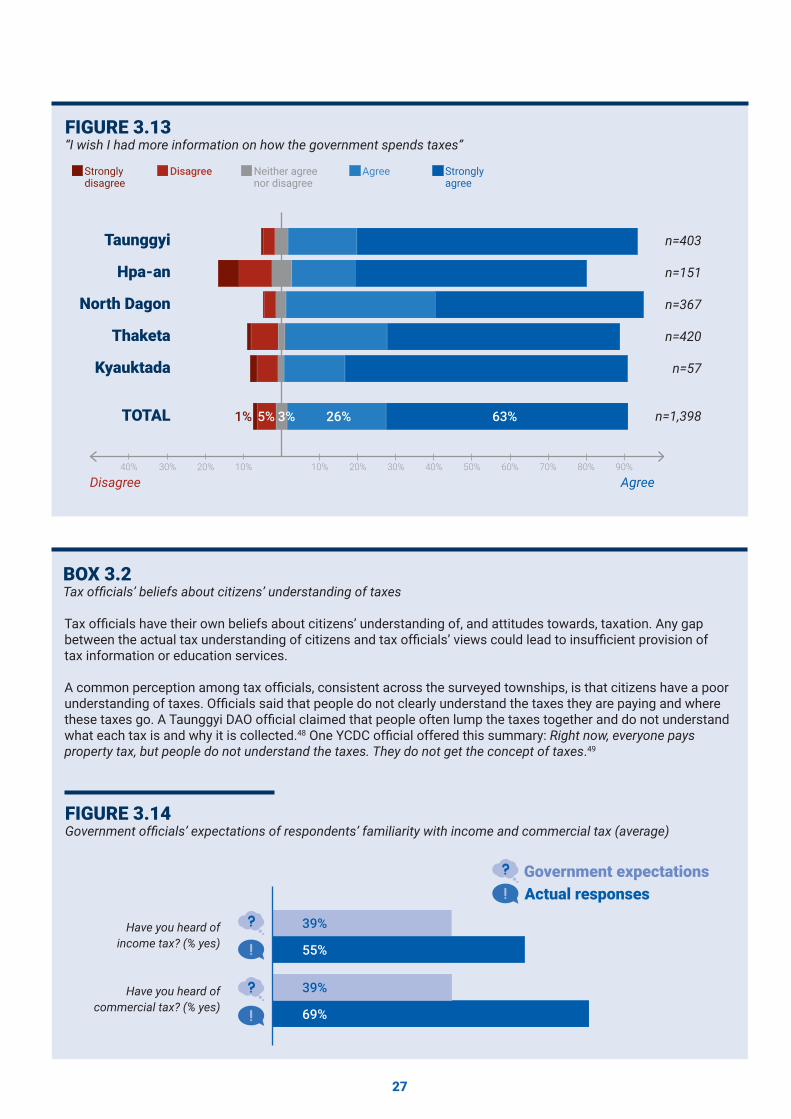
There is a very clear demand for more information on how the government spends taxes
The statement “I wish I had more information on how the government spends taxes” elicited the strongest agreement of all the tax questions in the City Life Survey. In fact, it was one
Desire for more information3.3
of the most agreed-with statements in the entire City Life Survey.
Almost 90% of all responses expressed agreement, with 63%
overall strongly agreeing and over 73% in Kyauktada and Taunggyi. Agreement was lowest in North Dagon, where 54% strongly agreed.
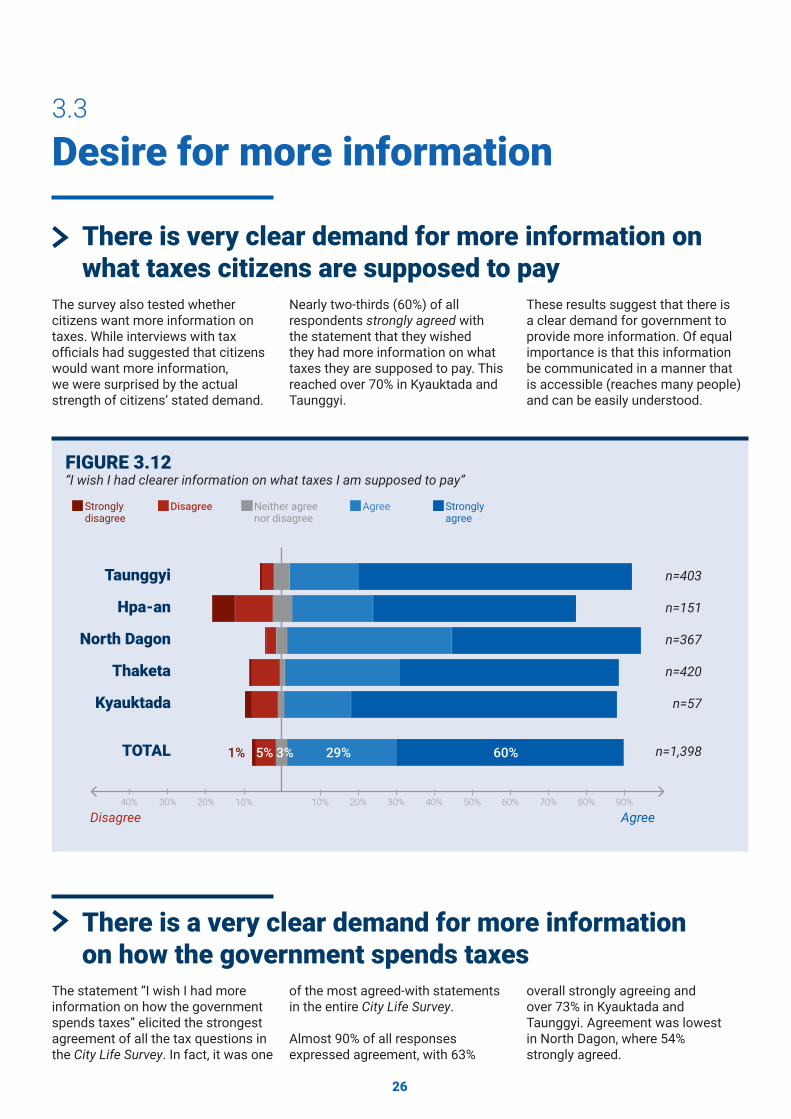
There is very clear demand for more information on what taxes citizens are supposed to pay
The survey also tested whether citizens want more information on taxes. While interviews with tax offi cials had suggested that citizens would want more information, we were surprised by the actual strength of citizens’ stated demand.
Nearly two-thirds (60%) of all respondents strongly agreed with the statement that they wished they had more information on what taxes they are supposed to pay. This reached over 70% in Kyauktada and Taunggyi.
These results suggest that there is a clear demand for government to provide more information. Of equal importance is that this information be communicated in a manner that is accessible (reaches many people) and can be easily understood.
“I wish I had clearer information on what taxes I am supposed to pay”FIGURE 3.12
Strongly disagree
Disagree Agree Strongly agree
Neither agree nor disagree
Disagree Agree10%10%20%30%40% 20% 30% 40% 50% 60% 70% 80% 90%
n=403
n=151
n=367
n=420
n=57
n=1,398
Taunggyi
Hpa-an
North Dagon
Thaketa
Kyauktada
TOTAL 60%29%3%5%1%
27
Tax offi cials have their own beliefs about citizens’ understanding of, and attitudes towards, taxation. Any gap between the actual tax understanding of citizens and tax offi cials’ views could lead to insuffi cient provision of tax information or education services.
A common perception among tax offi cials, consistent across the surveyed townships, is that citizens have a poor understanding of taxes. Offi cials said that people do not clearly understand the taxes they are paying and where these taxes go. A Taunggyi DAO offi cial claimed that people often lump the taxes together and do not understand what each tax is and why it is collected.48 One YCDC offi cial offered this summary: Right now, everyone pays property tax, but people do not understand the taxes. They do not get the concept of taxes.49
Tax offi cials’ beliefs about citizens’ understanding of taxesBOX 3.2
Government expectationsActual responses
Government offi cials’ expectations of respondents’ familiarity with income and commercial tax (average)FIGURE 3.14
Have you heard of income tax? (% yes)
Have you heard of commercial tax? (% yes)
39%
39%
55%
69%
“I wish I had more information on how the government spends taxes”FIGURE 3.13
Strongly disagree
Disagree Agree Strongly agree
Neither agree nor disagree
Disagree Agree10%10%20%30%40% 20% 30% 40% 50% 60% 70% 80% 90%
n=403
n=151
n=367
n=420
n=57
n=1,398
Taunggyi
Hpa-an
North Dagon
Thaketa
Kyauktada
TOTAL 63%26%3%5%1%
28
Another common view among those interviewed is that the public often does not differentiate between paying a tax, a fee, or a fi ne. An offi cial from the YCDC Assessor’s Department said, [Citizens] are not clear between taxes and fees. They don’t know what all these are collected for. But since the amount collected is small, they don’t think much, and just give.50 Mayor U Maung Maung Soe of Yangon echoed this sentiment during a meeting with The Asia Foundation and the Renaissance Institute, remarking, Some citizens conflate taxes, fees and fi nes…[and] we need to educate them on the differences.51 Other offi cials have remarked that some citizens have a better understanding of what fees are for, as they are tied to specifi c government services. Yet, they are less likely to recognize that public services come from the taxes they pay.52
Understanding of taxes is poor not only among the general public but also among many tax offi cials and policymakers. The review of the introduction of a 5% tax on phone credit, covered in chapter 6, identifi ed a misunderstanding of basic tax concepts amongst policy makers, such as the difference between the legal and economic incidence of taxation.53 The Asia Foundation’s work with the Renaissance Institute to reform property tax has revealed that many foundational features of the existing system are not understood by policymakers or tax offi cials.
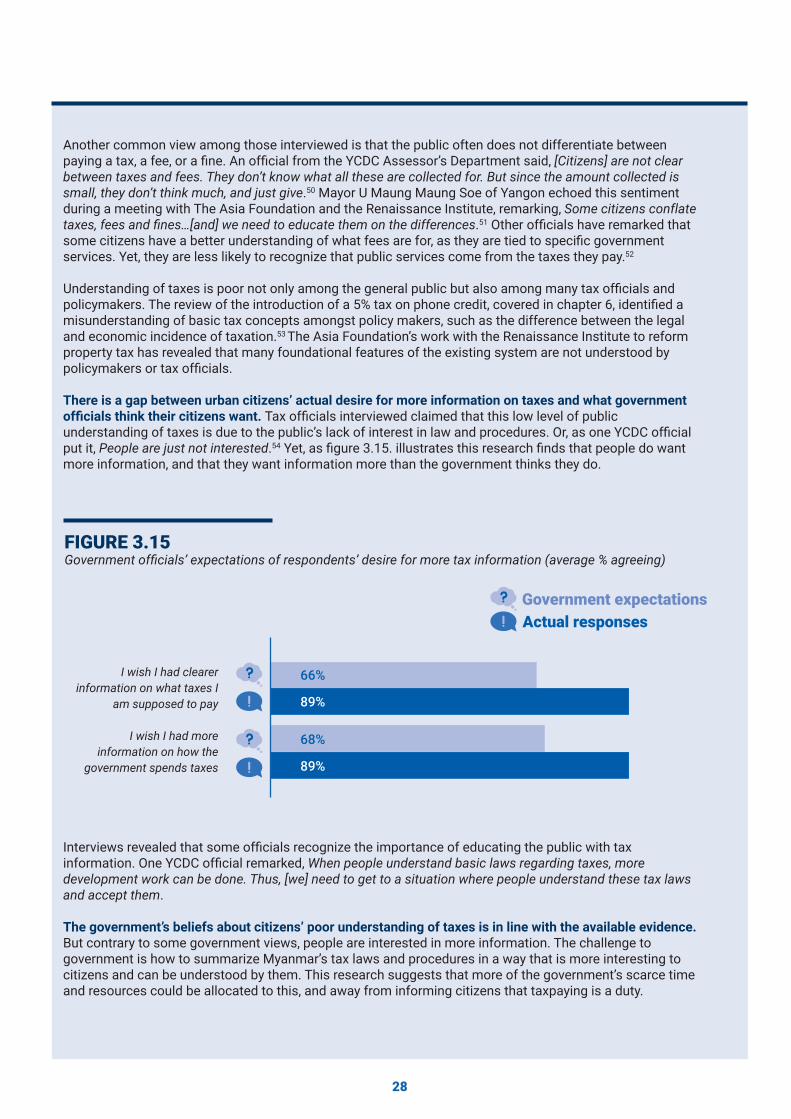
There is a gap between urban citizens’ actual desire for more information on taxes and what government offi cials think their citizens want. Tax offi cials interviewed claimed that this low level of public understanding of taxes is due to the public’s lack of interest in law and procedures. Or, as one YCDC offi cial put it, People are just not interested.54 Yet, as fi gure 3.15. illustrates this research fi nds that people do want more information, and that they want information more than the government thinks they do.
Interviews revealed that some offi cials recognize the importance of educating the public with tax information. One YCDC offi cial remarked, When people understand basic laws regarding taxes, more development work can be done. Thus, [we] need to get to a situation where people understand these tax laws and accept them.
The government’s beliefs about citizens’ poor understanding of taxes is in line with the available evidence. But contrary to some government views, people are interested in more information. The challenge to government is how to summarize Myanmar’s tax laws and procedures in a way that is more interesting to citizens and can be understood by them. This research suggests that more of the government’s scarce time and resources could be allocated to this, and away from informing citizens that taxpaying is a duty.
Government expectationsActual responses
I wish I had clearer information on what taxes I
am supposed to pay
I wish I had more information on how the
government spends taxes
66%
68%
89%
89%
Government offi cials’ expectations of respondents’ desire for more tax information (average % agreeing)FIGURE 3.15
29
Respondents have a low level of understanding of taxes and the tax system.
Government offi cials and policymakers recognize this low level of understanding.
Urban citizens really want more information on what taxes they are supposed to pay and how their taxes are spent.
CHAPTER SUMMARY
30
CHAPTER 4
Attitudes towards taxation
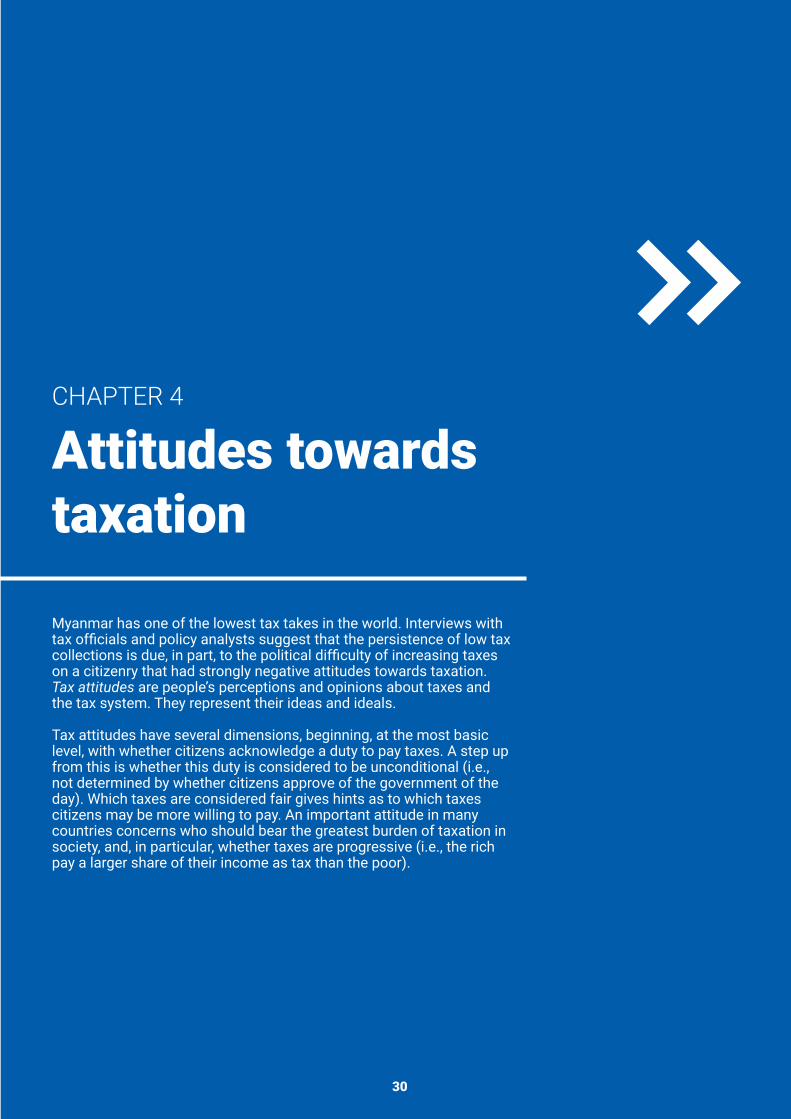
Myanmar has one of the lowest tax takes in the world. Interviews with tax offi cials and policy analysts suggest that the persistence of low tax collections is due, in part, to the political diffi culty of increasing taxes on a citizenry that had strongly negative attitudes towards taxation. Tax attitudes are people’s perceptions and opinions about taxes and the tax system. They represent their ideas and ideals.
Tax attitudes have several dimensions, beginning, at the most basic level, with whether citizens acknowledge a duty to pay taxes. A step up from this is whether this duty is considered to be unconditional (i.e., not determined by whether citizens approve of the government of the day). Which taxes are considered fair gives hints as to which taxes citizens may be more willing to pay. An important attitude in many countries concerns who should bear the greatest burden of taxation in society, and, in particular, whether taxes are progressive (i.e., the rich pay a larger share of their income as tax than the poor).
31
Existing research on tax attitudes in Myanmar
BOX 4.1
This is not the fi rst empirical analysis of citizens’ attitudes towards taxes in Myanmar. Research by the International Growth Centre (IGC) looked at attitudes towards taxation and donations as part of understanding their importance in funding social protection and public goods. Their survey of 1,000 households was conducted in two primarily rural townships in Bago Region and Kayin State.55
Their main fi ndings with respect to tax attitudes were that
l about half of all respondents agreed that the government had the right to tax;
l only 22% of respondents were confi dent that the authorities made sure that everyone paid their fair share of taxes;
l nearly half of respondents were unsure whether their taxes went where they were needed most (although 40% were confi dent); and
l almost half of respondents agreed that it is fair for the taxes they pay to be spent elsewhere in Myanmar.
The following chapter peers into the belief systems of Myanmar urban citizens with respect to specifi c taxes, the tax system, and how their taxes are spent. It retests some of the questions asked by the IGC survey among a decisively more urban set of survey respondents in the capital cities of three states or regions.
It is worth reminding readers that the fi ndings discussed in this chapter refer to citizens’ stated ideals and beliefs. They cannot tell us whether an individual will pay more tax at the moment of
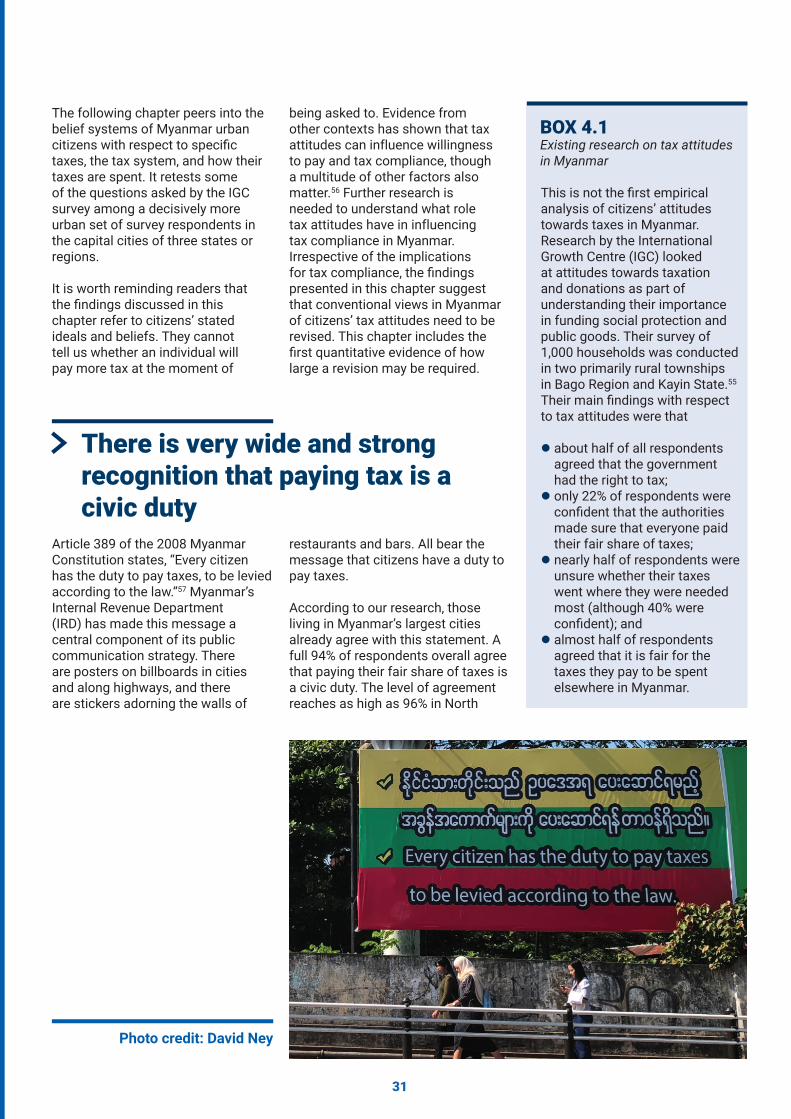
Article 389 of the 2008 Myanmar Constitution states, “Every citizen has the duty to pay taxes, to be levied according to the law.”57 Myanmar’s Internal Revenue Department (IRD) has made this message a central component of its public communication strategy. There are posters on billboards in cities and along highways, and there are stickers adorning the walls of
being asked to. Evidence from other contexts has shown that tax attitudes can influence willingness to pay and tax compliance, though a multitude of other factors also matter.56 Further research is needed to understand what role tax attitudes have in influencing tax compliance in Myanmar. Irrespective of the implications for tax compliance, the fi ndings presented in this chapter suggest that conventional views in Myanmar of citizens’ tax attitudes need to be revised. This chapter includes the fi rst quantitative evidence of how large a revision may be required.
There is very wide and strong recognition that paying tax is a civic duty
restaurants and bars. All bear the message that citizens have a duty to pay taxes.
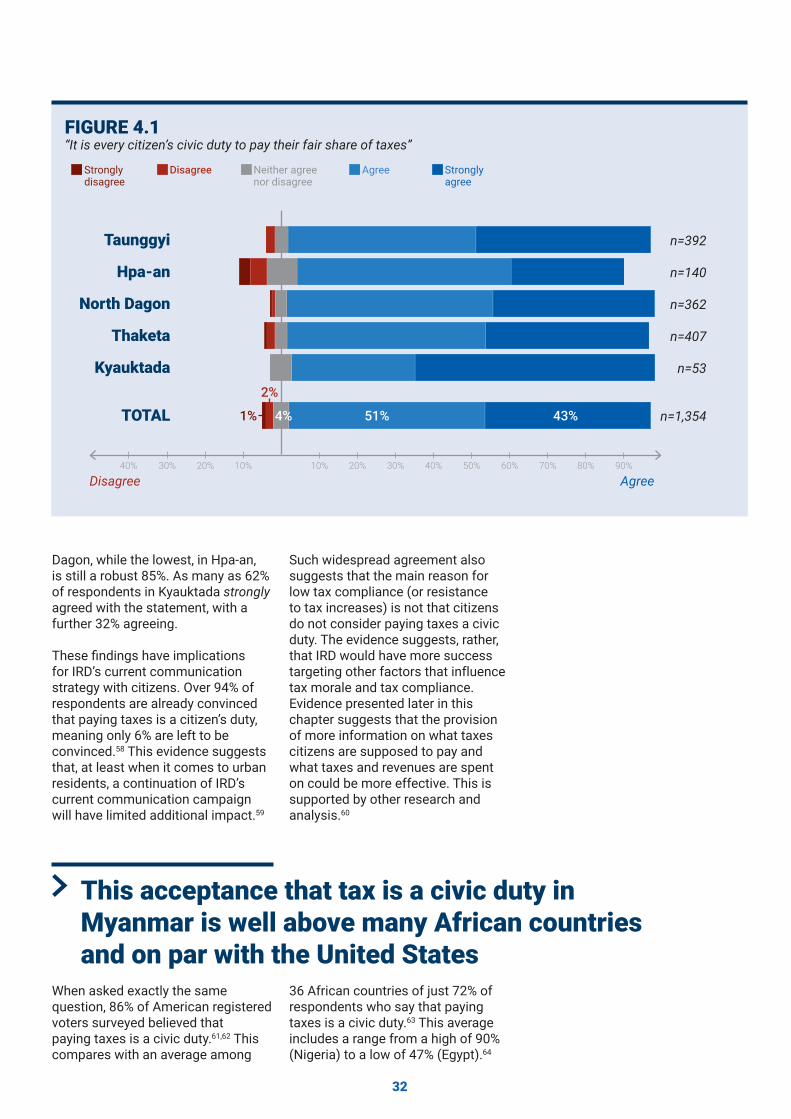
According to our research, those living in Myanmar’s largest cities already agree with this statement. A full 94% of respondents overall agree that paying their fair share of taxes is a civic duty. The level of agreement reaches as high as 96% in North
Photo credit: David Ney
32
Dagon, while the lowest, in Hpa-an, is still a robust 85%. As many as 62% of respondents in Kyauktada strongly agreed with the statement, with a further 32% agreeing.
These fi ndings have implications for IRD’s current communication strategy with citizens. Over 94% of respondents are already convinced that paying taxes is a citizen’s duty, meaning only 6% are left to be convinced.58 This evidence suggests that, at least when it comes to urban residents, a continuation of IRD’s current communication campaign will have limited additional impact.59
Such widespread agreement also suggests that the main reason for low tax compliance (or resistance to tax increases) is not that citizens do not consider paying taxes a civic duty. The evidence suggests, rather, that IRD would have more success targeting other factors that influence tax morale and tax compliance. Evidence presented later in this chapter suggests that the provision of more information on what taxes citizens are supposed to pay and what taxes and revenues are spent on could be more effective. This is supported by other research and analysis.60
This acceptance that tax is a civic duty in Myanmar is well above many African countries and on par with the United States
When asked exactly the same question, 86% of American registered voters surveyed believed that paying taxes is a civic duty.61,62 This compares with an average among
36 African countries of just 72% of respondents who say that paying taxes is a civic duty.63 This average includes a range from a high of 90% (Nigeria) to a low of 47% (Egypt).64
“It is every citizen’s civic duty to pay their fair share of taxes”FIGURE 4.1
Strongly disagree
Disagree Agree Strongly agree
Neither agree nor disagree
Disagree Agree10%10%20%30%40% 20% 30% 40% 50% 60% 70% 80% 90%
n=392
n=140
n=362
n=407
n=53
n=1,354
Taunggyi
Hpa-an
North Dagon
Thaketa
Kyauktada
TOTAL 43%51%4%
2%
1%
33
Over 80% of respondents in the City Life Survey agree that citizens should “always pay their taxes, even if they disagree with the government.” The share of positive answers to this statement is again highest in Yangon and lowest in Taunggyi. Across all urban areas, the share of positive responses is slightly lower than for the question on taxes as a civic duty. Though lower, this fi gure is still high, especially if one considers how unpopular the previous government was with citizens.65
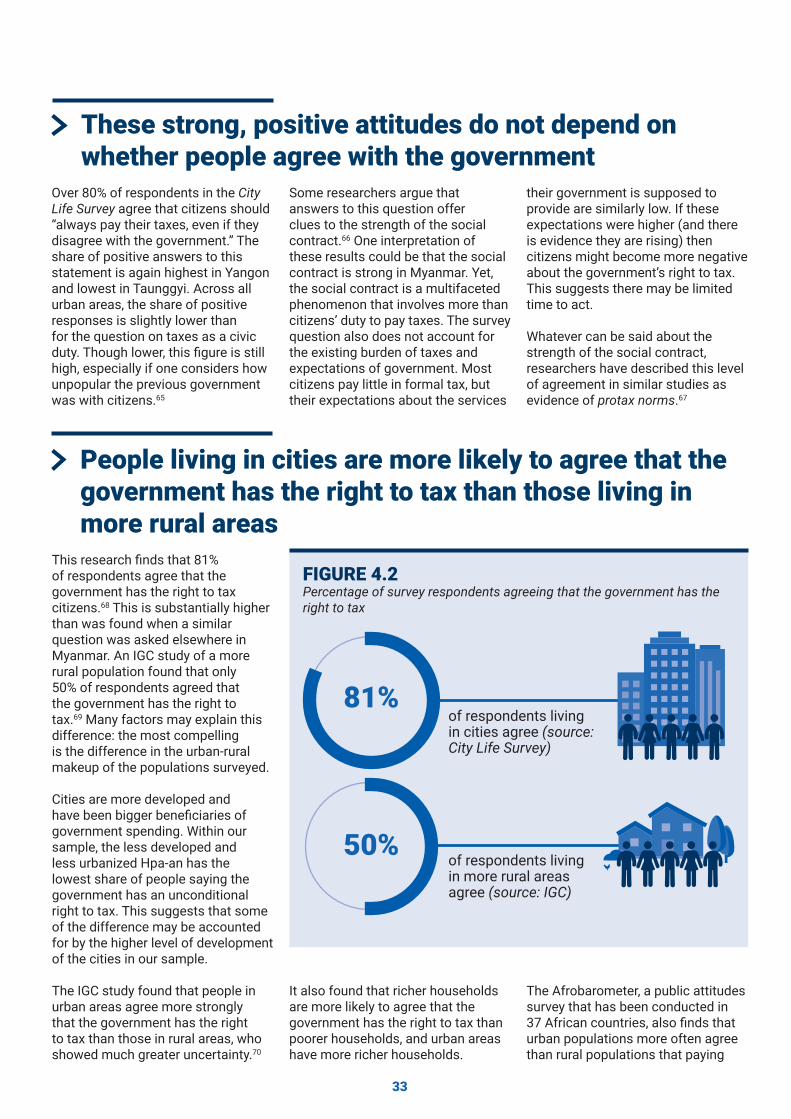
This research fi nds that 81% of respondents agree that the government has the right to tax citizens.68 This is substantially higher than was found when a similar question was asked elsewhere in Myanmar. An IGC study of a more rural population found that only 50% of respondents agreed that the government has the right to tax.69 Many factors may explain this difference: the most compelling is the difference in the urban-rural makeup of the populations surveyed.
Cities are more developed and have been bigger benefi ciaries of government spending. Within our sample, the less developed and less urbanized Hpa-an has the lowest share of people saying the government has an unconditional right to tax. This suggests that some of the difference may be accounted for by the higher level of development of the cities in our sample.
The IGC study found that people in urban areas agree more strongly that the government has the right to tax than those in rural areas, who showed much greater uncertainty.70
These strong, positive attitudes do not depend on whether people agree with the government
People living in cities are more likely to agree that the government has the right to tax than those living in more rural areas
Some researchers argue that answers to this question offer clues to the strength of the social contract.66 One interpretation of these results could be that the social contract is strong in Myanmar. Yet, the social contract is a multifaceted phenomenon that involves more than citizens’ duty to pay taxes. The survey question also does not account for the existing burden of taxes and expectations of government. Most citizens pay little in formal tax, but their expectations about the services
their government is supposed to provide are similarly low. If these expectations were higher (and there is evidence they are rising) then citizens might become more negative about the government’s right to tax. This suggests there may be limited time to act.
Whatever can be said about the strength of the social contract, researchers have described this level of agreement in similar studies as evidence of protax norms.67
Percentage of survey respondents agreeing that the government has the right to tax
FIGURE 4.2
81%
50%
of respondents living in cities agree (source: City Life Survey)
of respondents living in more rural areas agree (source: IGC)
It also found that richer households are more likely to agree that the government has the right to tax than poorer households, and urban areas have more richer households.
The Afrobarometer, a public attitudes survey that has been conducted in 37 African countries, also fi nds that urban populations more often agree than rural populations that paying
34
taxes is a civic duty, but here the variation is much smaller, with 76% of urban residents agreeing, compared to 70% of rural residents.71
The IGC study also includes respondents from areas of
contested governance,72 who may view the government as less legitimate. It fi nds some small (but statistically signifi cant) variation among townships, with respondents in uncontested areas more likely to agree. It should also be noted that
the IGC survey took place in March 2016, after the National League for Democracy (NLD) election victory, but before the new government was sworn in. The City Life Survey took place over one year into the new government.
A majority of respondents consider income, commercial, and property taxes to be fair
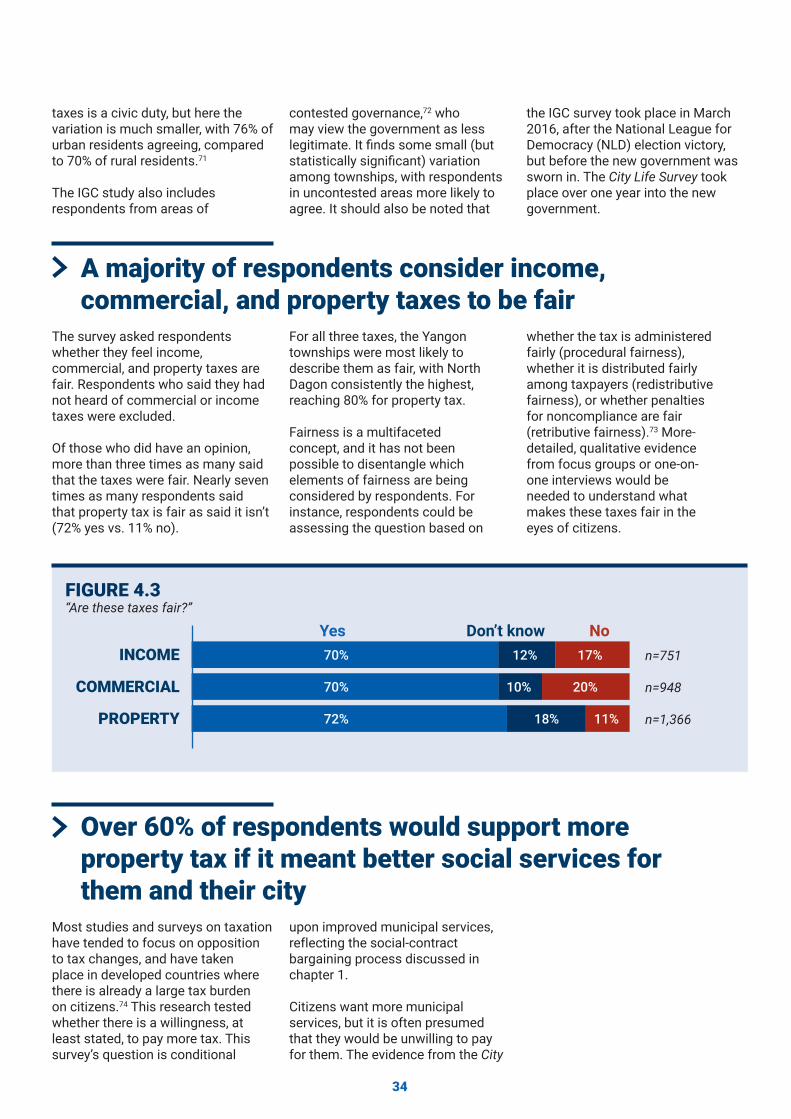
The survey asked respondents whether they feel income, commercial, and property taxes are fair. Respondents who said they had not heard of commercial or income taxes were excluded.
Of those who did have an opinion, more than three times as many said that the taxes were fair. Nearly seven times as many respondents said that property tax is fair as said it isn’t (72% yes vs. 11% no).
INCOME
COMMERCIAL
PROPERTY
Yes Don’t know No70% 12%
10%
18%
17%
20%
11%
70%
72%
“Are these taxes fair?”FIGURE 4.3
n=751
n=948
n=1,366
For all three taxes, the Yangon townships were most likely to describe them as fair, with North Dagon consistently the highest, reaching 80% for property tax.
Fairness is a multifaceted concept, and it has not been possible to disentangle which elements of fairness are being considered by respondents. For instance, respondents could be assessing the question based on
whether the tax is administered fairly (procedural fairness), whether it is distributed fairly among taxpayers (redistributive fairness), or whether penalties for noncompliance are fair (retributive fairness).73 More-detailed, qualitative evidence from focus groups or one-on-one interviews would be needed to understand what makes these taxes fair in the eyes of citizens.
Over 60% of respondents would support more property tax if it meant better social services for them and their city
Most studies and surveys on taxation have tended to focus on opposition to tax changes, and have taken place in developed countries where there is already a large tax burden on citizens.74 This research tested whether there is a willingness, at least stated, to pay more tax. This survey’s question is conditional
upon improved municipal services, reflecting the social-contract bargaining process discussed in chapter 1.
Citizens want more municipal services, but it is often presumed that they would be unwilling to pay for them. The evidence from the City
35
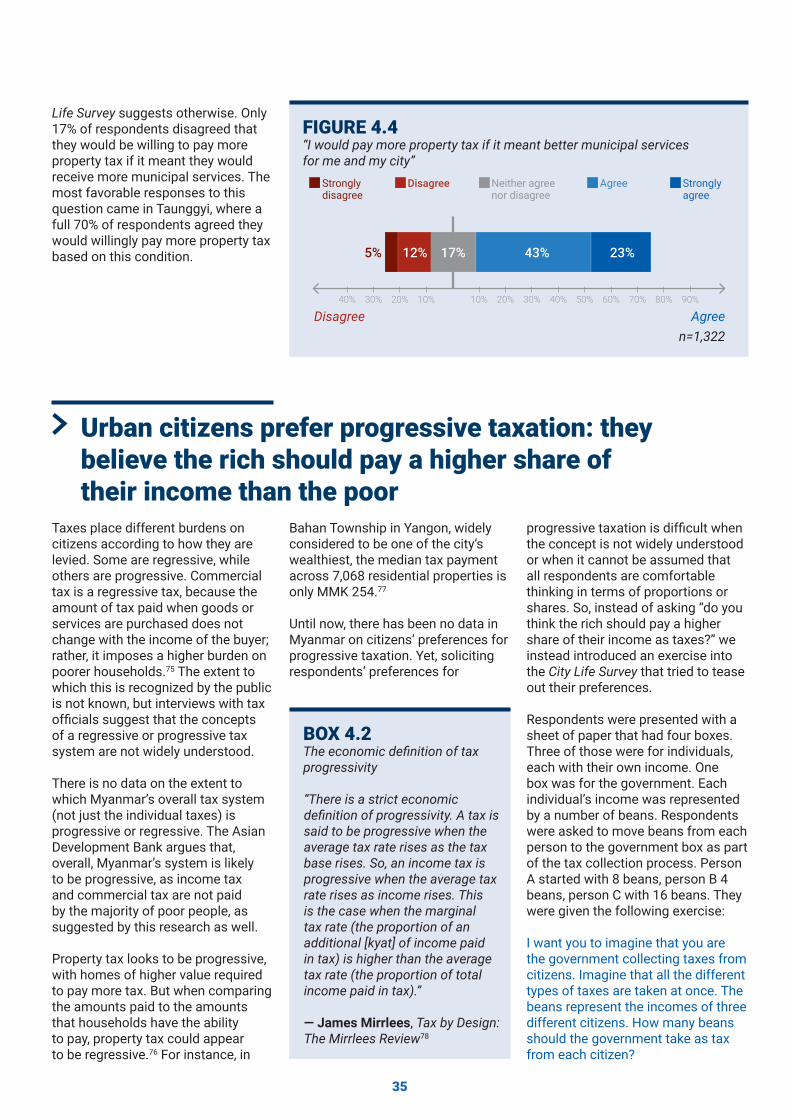
“I would pay more property tax if it meant better municipal services for me and my city”
FIGURE 4.4
Strongly disagree
Disagree Agree Strongly agree
Neither agree nor disagree
Disagreen=1,322
Agree10% 70% 80% 90%40% 40%20% 60%30%30% 50%20%10%
43%17%12%5% 23%
Life Survey suggests otherwise. Only 17% of respondents disagreed that they would be willing to pay more property tax if it meant they would receive more municipal services. The most favorable responses to this question came in Taunggyi, where a full 70% of respondents agreed they would willingly pay more property tax based on this condition.
Urban citizens prefer progressive taxation: they believe the rich should pay a higher share of their income than the poor
Taxes place different burdens on citizens according to how they are levied. Some are regressive, while others are progressive. Commercial tax is a regressive tax, because the amount of tax paid when goods or services are purchased does not change with the income of the buyer; rather, it imposes a higher burden on poorer households.75 The extent to which this is recognized by the public is not known, but interviews with tax offi cials suggest that the concepts of a regressive or progressive tax system are not widely understood.
There is no data on the extent to which Myanmar’s overall tax system (not just the individual taxes) is progressive or regressive. The Asian Development Bank argues that, overall, Myanmar’s system is likely to be progressive, as income tax and commercial tax are not paid by the majority of poor people, as suggested by this research as well.
Property tax looks to be progressive, with homes of higher value required to pay more tax. But when comparing the amounts paid to the amounts that households have the ability to pay, property tax could appear to be regressive.76 For instance, in
The economic defi nition of tax progressivity
BOX 4.2
“There is a strict economic defi nition of progressivity. A tax is said to be progressive when the average tax rate rises as the tax base rises. So, an income tax is progressive when the average tax rate rises as income rises. This is the case when the marginal tax rate (the proportion of an additional [kyat] of income paid in tax) is higher than the average tax rate (the proportion of total income paid in tax).”
— James Mirrlees, Tax by Design: The Mirrlees Review78
Bahan Township in Yangon, widely considered to be one of the city’s wealthiest, the median tax payment across 7,068 residential properties is only MMK 254.77
Until now, there has been no data in Myanmar on citizens’ preferences for progressive taxation. Yet, soliciting respondents’ preferences for
progressive taxation is diffi cult when the concept is not widely understood or when it cannot be assumed that all respondents are comfortable thinking in terms of proportions or shares. So, instead of asking “do you think the rich should pay a higher share of their income as taxes?” we instead introduced an exercise into the City Life Survey that tried to tease out their preferences.
Respondents were presented with a sheet of paper that had four boxes. Three of those were for individuals, each with their own income. One box was for the government. Each individual’s income was represented by a number of beans. Respondents were asked to move beans from each person to the government box as part of the tax collection process. Person A started with 8 beans, person B 4 beans, person C with 16 beans. They were given the following exercise:
I want you to imagine that you are the government collecting taxes from citizens. Imagine that all the different types of taxes are taken at once. The beans represent the incomes of three different citizens. How many beans should the government take as tax from each citizen?
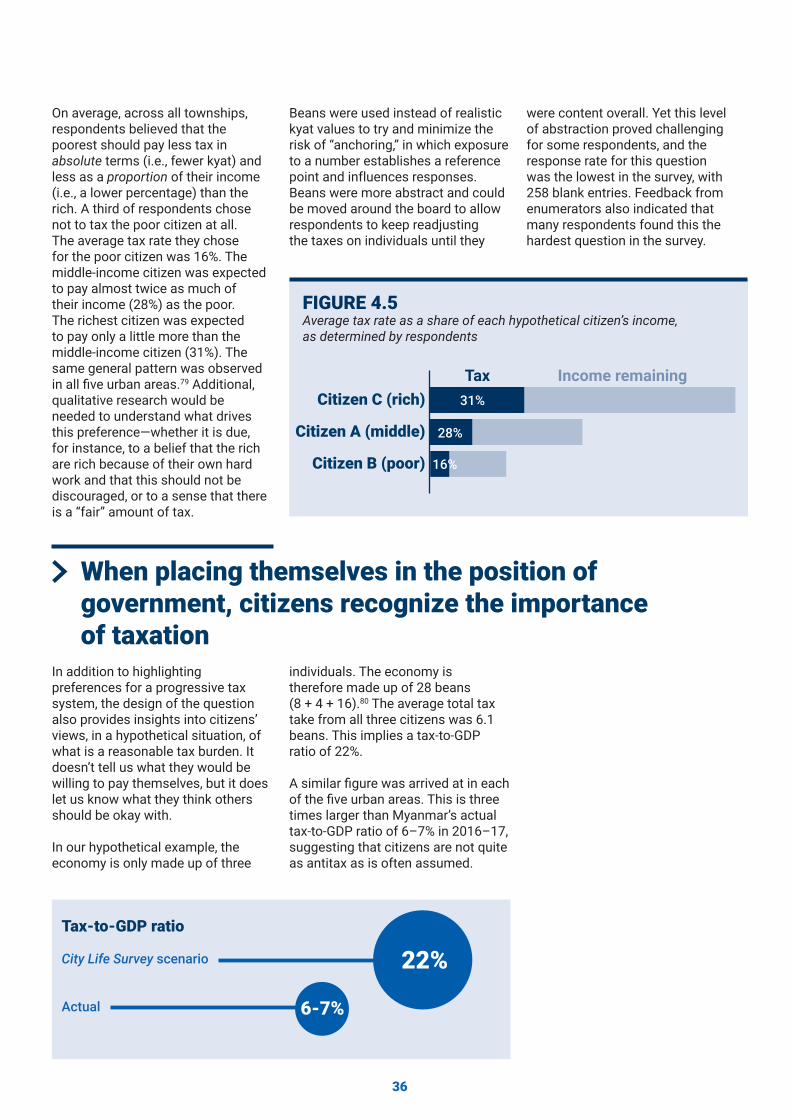
36
Average tax rate as a share of each hypothetical citizen’s income, as determined by respondents
FIGURE 4.5
Tax Income remainingCitizen C (rich)
Citizen A (middle)
Citizen B (poor)
31%
28%
16%
On average, across all townships, respondents believed that the poorest should pay less tax in absolute terms (i.e., fewer kyat) and less as a proportion of their income (i.e., a lower percentage) than the rich. A third of respondents chose not to tax the poor citizen at all. The average tax rate they chose for the poor citizen was 16%. The middle-income citizen was expected to pay almost twice as much of their income (28%) as the poor. The richest citizen was expected to pay only a little more than the middle-income citizen (31%). The same general pattern was observed in all fi ve urban areas.79 Additional, qualitative research would be needed to understand what drives this preference—whether it is due, for instance, to a belief that the rich are rich because of their own hard work and that this should not be discouraged, or to a sense that there is a “fair” amount of tax.
Beans were used instead of realistic kyat values to try and minimize the risk of “anchoring,” in which exposure to a number establishes a reference point and influences responses. Beans were more abstract and could be moved around the board to allow respondents to keep readjusting the taxes on individuals until they
were content overall. Yet this level of abstraction proved challenging for some respondents, and the response rate for this question was the lowest in the survey, with 258 blank entries. Feedback from enumerators also indicated that many respondents found this the hardest question in the survey.
When placing themselves in the position of government, citizens recognize the importance of taxation
In addition to highlighting preferences for a progressive tax system, the design of the question also provides insights into citizens’ views, in a hypothetical situation, of what is a reasonable tax burden. It doesn’t tell us what they would be willing to pay themselves, but it does let us know what they think others should be okay with.
In our hypothetical example, the economy is only made up of three
Tax-to-GDP ratio
City Life Survey scenario
Actual
individuals. The economy is therefore made up of 28 beans (8 + 4 + 16).80 The average total tax take from all three citizens was 6.1 beans. This implies a tax-to-GDP ratio of 22%.
A similar fi gure was arrived at in each of the fi ve urban areas. This is three times larger than Myanmar’s actual tax-to-GDP ratio of 6–7% in 2016–17, suggesting that citizens are not quite as antitax as is often assumed.
22%
6-7%
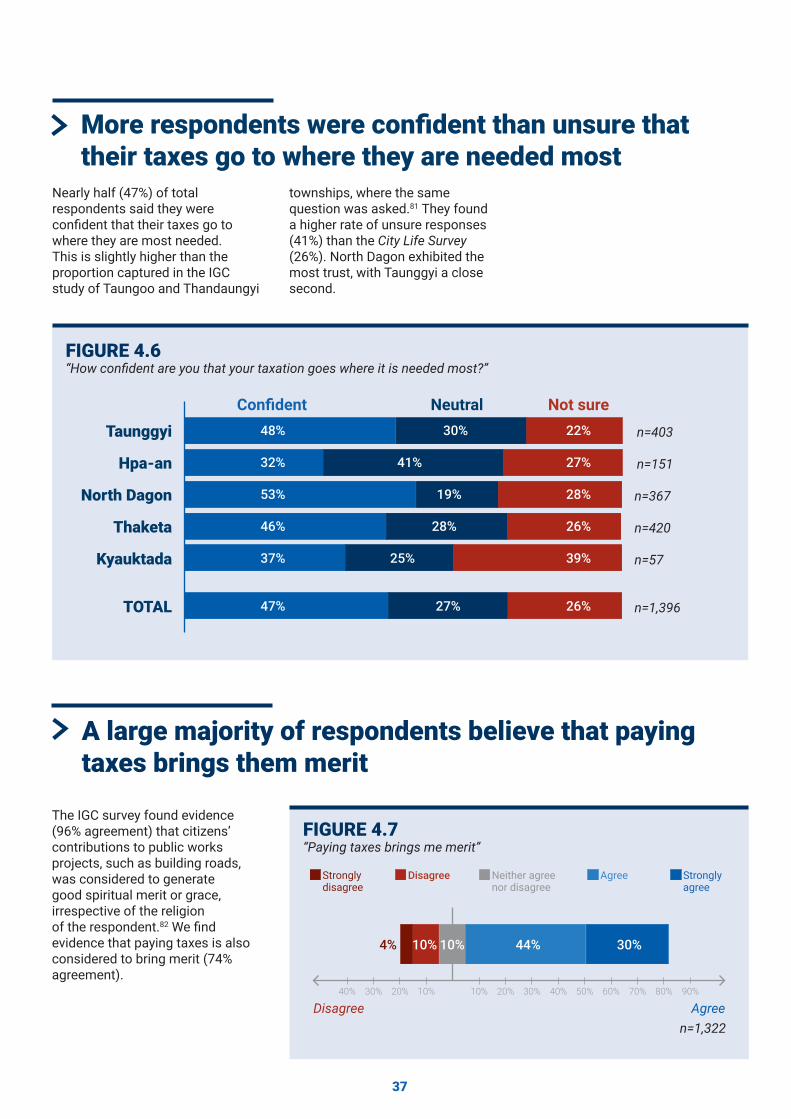
37
“Paying taxes brings me merit”FIGURE 4.7
Strongly disagree
Disagree Agree Strongly agree
Neither agree nor disagree
Disagree Agree10% 70% 80% 90%40% 40%20% 60%30%30% 50%20%10%
n=1,322
44%10%10%4% 30%
Nearly half (47%) of total respondents said they were confi dent that their taxes go to where they are most needed. This is slightly higher than the proportion captured in the IGC study of Taungoo and Thandaungyi
The IGC survey found evidence (96% agreement) that citizens’ contributions to public works projects, such as building roads, was considered to generate good spiritual merit or grace, irrespective of the religion of the respondent.82 We fi nd evidence that paying taxes is also considered to bring merit (74% agreement).
More respondents were confi dent than unsure that their taxes go to where they are needed most
A large majority of respondents believe that paying taxes brings them merit
“How confi dent are you that your taxation goes where it is needed most?”FIGURE 4.6
Taunggyi
Hpa-an
North Dagon
Thaketa
Kyauktada
TOTAL
n=403
n=151
n=367
n=420
n=57
n=1,396
Confi dent Neutral Not sure48% 30% 22%
32%
53% 19% 28%
26%28%46%
37%
47% 27% 26%
25% 39%
41% 27%
townships, where the same question was asked.81 They found a higher rate of unsure responses (41%) than the City Life Survey (26%). North Dagon exhibited the most trust, with Taunggyi a close second.
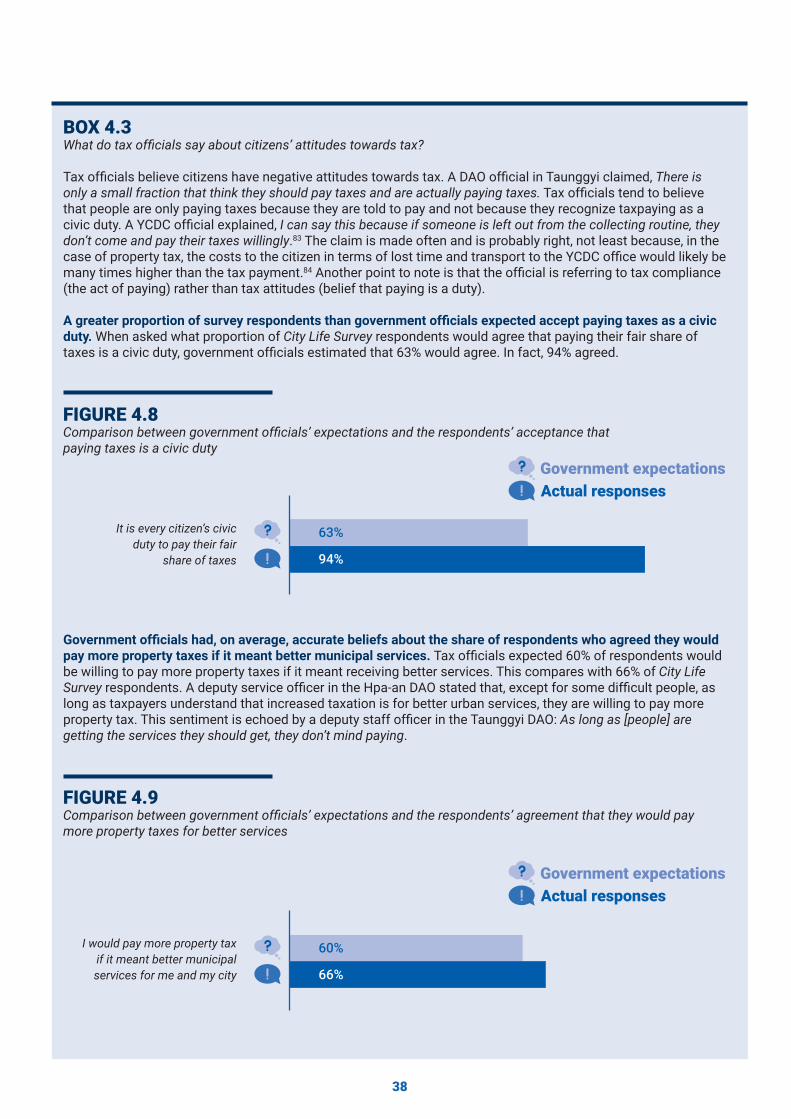
38
Tax offi cials believe citizens have negative attitudes towards tax. A DAO offi cial in Taunggyi claimed, There is only a small fraction that think they should pay taxes and are actually paying taxes. Tax offi cials tend to believe that people are only paying taxes because they are told to pay and not because they recognize taxpaying as a civic duty. A YCDC offi cial explained, I can say this because if someone is left out from the collecting routine, they don’t come and pay their taxes willingly.83 The claim is made often and is probably right, not least because, in the case of property tax, the costs to the citizen in terms of lost time and transport to the YCDC offi ce would likely be many times higher than the tax payment.84 Another point to note is that the offi cial is referring to tax compliance (the act of paying) rather than tax attitudes (belief that paying is a duty).
A greater proportion of survey respondents than government offi cials expected accept paying taxes as a civic duty. When asked what proportion of City Life Survey respondents would agree that paying their fair share of taxes is a civic duty, government offi cials estimated that 63% would agree. In fact, 94% agreed.
What do tax offi cials say about citizens’ attitudes towards tax?BOX 4.3
Comparison between government offi cials’ expectations and the respondents’ acceptance that paying taxes is a civic duty
FIGURE 4.8
Comparison between government offi cials’ expectations and the respondents’ agreement that they would pay more property taxes for better services
FIGURE 4.9
Government offi cials had, on average, accurate beliefs about the share of respondents who agreed they would pay more property taxes if it meant better municipal services. Tax offi cials expected 60% of respondents would be willing to pay more property taxes if it meant receiving better services. This compares with 66% of City Life Survey respondents. A deputy service offi cer in the Hpa-an DAO stated that, except for some diffi cult people, as long as taxpayers understand that increased taxation is for better urban services, they are willing to pay more property tax. This sentiment is echoed by a deputy staff offi cer in the Taunggyi DAO: As long as [people] are getting the services they should get, they don’t mind paying.
Government expectationsActual responses
It is every citizen’s civic duty to pay their fair
share of taxes
63%
94%
Government expectationsActual responses
I would pay more property tax if it meant better municipal services for me and my city
60%
66%
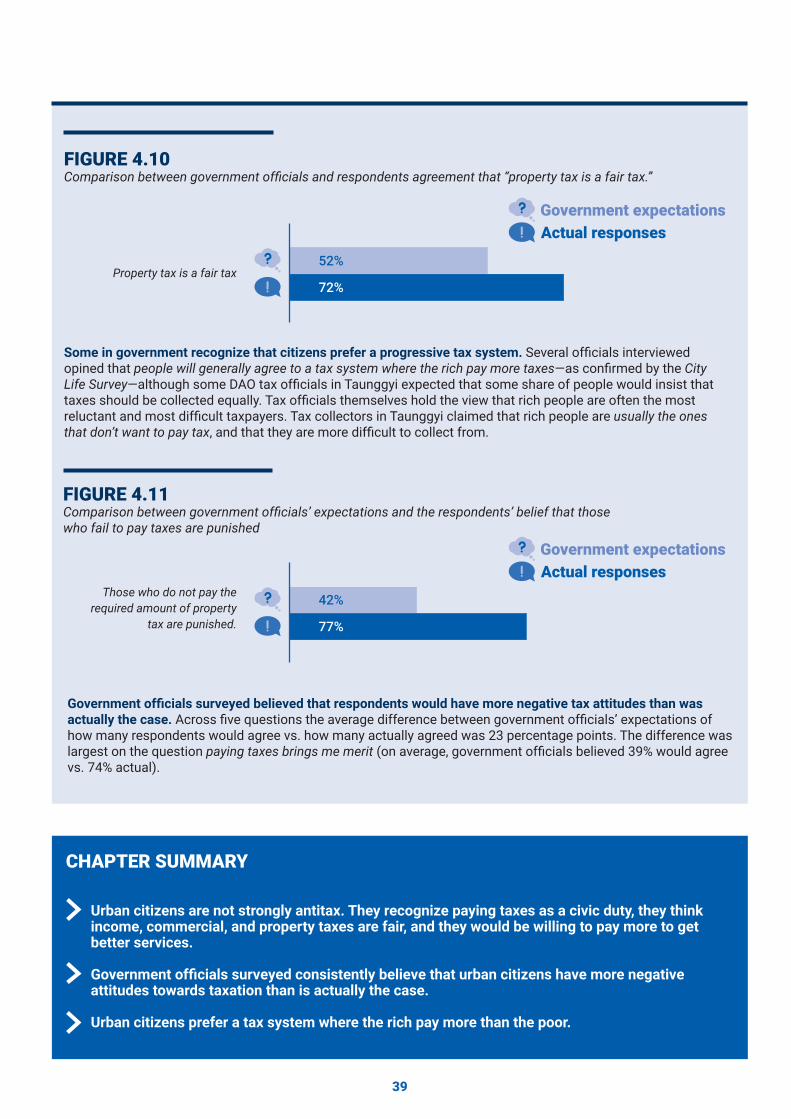
39
Government offi cials surveyed believed that respondents would have more negative tax attitudes than was actually the case. Across fi ve questions the average difference between government offi cials’ expectations of how many respondents would agree vs. how many actually agreed was 23 percentage points. The difference was largest on the question paying taxes brings me merit (on average, government offi cials believed 39% would agree vs. 74% actual).
Government expectationsActual responses
Property tax is a fair tax52%
72%
Comparison between government offi cials and respondents agreement that “property tax is a fair tax.”FIGURE 4.10
Some in government recognize that citizens prefer a progressive tax system. Several offi cials interviewed opined that people will generally agree to a tax system where the rich pay more taxes—as confi rmed by the City Life Survey—although some DAO tax offi cials in Taunggyi expected that some share of people would insist that taxes should be collected equally. Tax offi cials themselves hold the view that rich people are often the most reluctant and most diffi cult taxpayers. Tax collectors in Taunggyi claimed that rich people are usually the ones that don’t want to pay tax, and that they are more diffi cult to collect from.
Urban citizens are not strongly antitax. They recognize paying taxes as a civic duty, they think income, commercial, and property taxes are fair, and they would be willing to pay more to get better services.
Government offi cials surveyed consistently believe that urban citizens have more negative attitudes towards taxation than is actually the case.
Urban citizens prefer a tax system where the rich pay more than the poor.
CHAPTER SUMMARY
Comparison between government offi cials’ expectations and the respondents’ belief that those who fail to pay taxes are punished
FIGURE 4.11
Government expectationsActual responses
Those who do not pay the required amount of property
tax are punished.
42%
77%
40
CHAPTER 5
The source of citizens’ attitudes towards taxation
Findings in the preceding chapter suggest that urban citizens in Myanmar do not have strong antitax attitudes. To many readers, this may seem surprising, especially given Myanmar citizens’ history of distrust of government, and the state’s limited provision of public services. The conceptual framework presented in this chapter offers clues as to where these positive attitudes come from.
Conceptual frameworks are analytical tools used to simplify complex relationships to ease comprehension and to help organize ideas. The following framework illustrates the path by which citizens’ relationship with the state and their fellow citizens shapes their attitudes towards taxation. It builds on a framework developed by Vanessa Williamson that brought together a diverse tax literature and generated novel hypotheses about American attitudes towards taxation.85 Her framework and careful empirical research have shed light on the importance of the taxpaying process and the influence of America’s partisan media in shaping the information received by citizens.86
This paper modifi es that framework to generalize it to a non-American and nondeveloped-country context.87 It focuses on how citizens’ tax attitudes are formed through their interaction with government and their fellow citizens.88 It adds understanding of taxes and the tax system as a factor that will influence attitudes, in line with other research.89
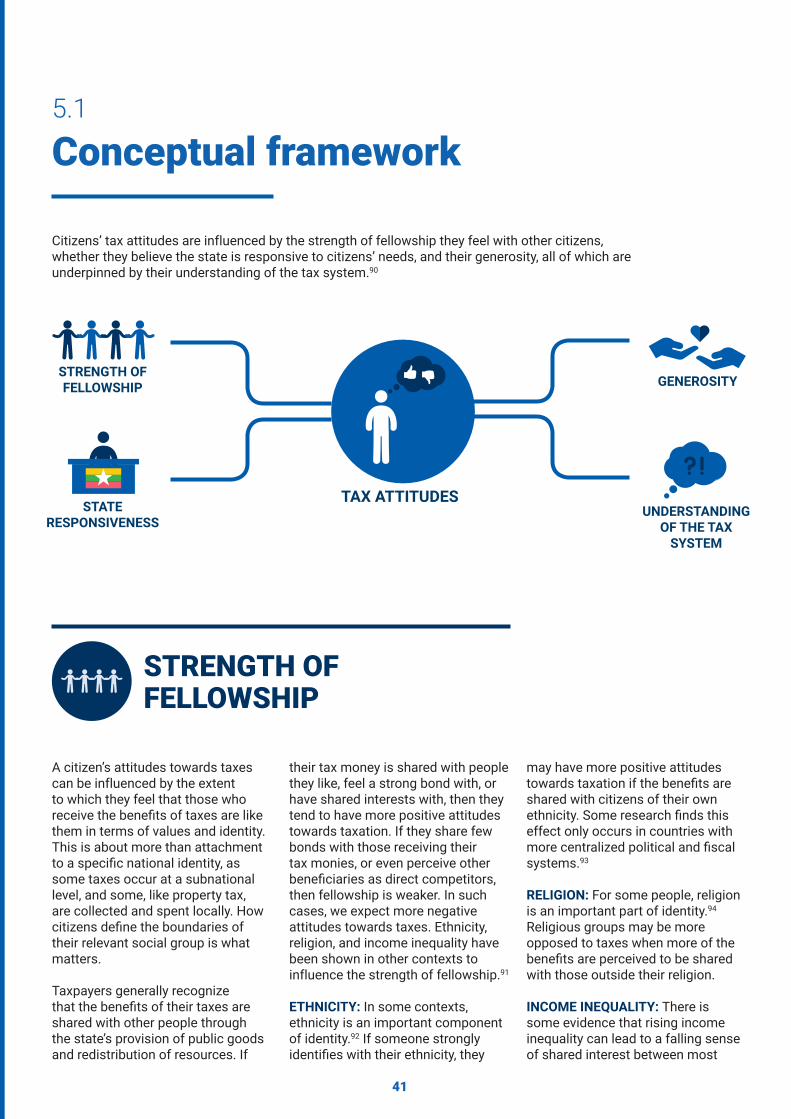
41
STRENGTH OF FELLOWSHIP
Conceptual framework5.1
Citizens’ tax attitudes are influenced by the strength of fellowship they feel with other citizens, whether they believe the state is responsive to citizens’ needs, and their generosity, all of which are underpinned by their understanding of the tax system.90
A citizen’s attitudes towards taxes can be influenced by the extent to which they feel that those who receive the benefi ts of taxes are like them in terms of values and identity. This is about more than attachment to a specifi c national identity, as some taxes occur at a subnational level, and some, like property tax, are collected and spent locally. How citizens defi ne the boundaries of their relevant social group is what matters.
Taxpayers generally recognize that the benefi ts of their taxes are shared with other people through the state’s provision of public goods and redistribution of resources. If
TAX ATTITUDES
STRENGTH OF FELLOWSHIP
STATE RESPONSIVENESS
GENEROSITY
UNDERSTANDING OF THE TAX
SYSTEM
their tax money is shared with people they like, feel a strong bond with, or have shared interests with, then they tend to have more positive attitudes towards taxation. If they share few bonds with those receiving their tax monies, or even perceive other benefi ciaries as direct competitors, then fellowship is weaker. In such cases, we expect more negative attitudes towards taxes. Ethnicity, religion, and income inequality have been shown in other contexts to influence the strength of fellowship.91 ETHNICITY: In some contexts, ethnicity is an important component of identity.92 If someone strongly identifi es with their ethnicity, they
may have more positive attitudes towards taxation if the benefi ts are shared with citizens of their own ethnicity. Some research fi nds this effect only occurs in countries with more centralized political and fi scal systems.93 RELIGION: For some people, religion is an important part of identity.94 Religious groups may be more opposed to taxes when more of the benefi ts are perceived to be shared with those outside their religion. INCOME INEQUALITY: There is some evidence that rising income inequality can lead to a falling sense of shared interest between most
42
people and the wealthy elite. This can reduce willingness to contribute to taxes and public goods.95 In contexts where there is great inequality, or where social mobility is perceived
A recent Asia Foundation review of conflict, development, and aid dynamics noted that “across the country, there is only a limited sense of citizenship based on rights and responsibilities that transcend religious and ethnic divisions.”97 One interpretation of this is that fellowship is weak in Myanmar.
Yet the City Life Survey provides evidence of a strong sense of fellowship at the local level. Across the overall survey sample, 93% agreed that they felt close to people in their neighborhood, and an astonishing 97% felt proud of the city where they lived. In the IGC’s study of more rural respondents, almost half agreed that it was fair to spend the taxes they pay elsewhere in Myanmar. This suggests that the level of government being considered in survey questions does matter to tax attitudes.
The City Life Survey did not try to assess attitudes towards inequality, but it did ask whether respondents felt that an individual who works hard in Myanmar can “get ahead,” which is a standard question about social mobility. The sense of duty to pay taxes appears to be strong, regardless of respondents’ views on social mobility. The vast majority (93%) of those who didn’t agree with the statement “an individual who works hard in Myanmar can get ahead” did agree that paying taxes is a civic duty.
In the cities studied, there is a strong sense of fellowship, but this weakens as citizens think beyond their local area.BOX 5.1
In November 2015, the NLD won a landslide victory that ushered in the fi rst truly democratically elected government in Myanmar’s history (although a quarter of the seats in parliament and control of three key ministries are reserved by law for the military).
A 2017 IRI survey found that 54% of the surveyed population felt that, when it comes to the democratic process in Myanmar, things had gotten better (while 8% felt they had gotten worse).99 The City Life Survey asked respondents whether government had become more responsive to their needs than one year earlier. Sixty-seven
City Life Survey respondents view the government as more responsive than a year earlierBOX 5.2
to be limited, there may be more negative attitudes towards taxation. The relationships between ethnicity, religion, inequality, and
tax attitudes are complex and depend on the importance people place on these forms of identity, which can vary by time and place.96
STATE RESPONSIVENESS
Attitudes towards taxation can also be influenced by the extent to which people perceive their government to be responsive to the needs of the population. At its most basic level, there is the question of whether
the state is perceived as the most legitimate political actor in that area. Even if the state is regarded as legitimate, if it is perceived as corrupt, inept, or only there to benefi t a small elite, then citizens
may have negative attitudes towards taxation. The extent to which it is considered representative, or susceptible to influence by citizens, can also matter to attitudes in democracies.98
43
Myanmar consistently tops the World Giving Index, which ranks countries by the charitable behavior of their citizens.105 They measure this by the extent to which people help strangers, donate money and resources, and volunteer their time to projects that provide public goods or advance social causes. There is strong evidence that people in Myanmar are willing to contribute resources for public goods and social causes. The City Life Survey found that 82% of respondents would volunteer their time to a government initiative if it helped their city.
Many recognize that paying taxes serves a social purpose and helps other people. The IGC found that almost half of respondents (49%) agreed that it is fair that their tax money is spent elsewhere in Myanmar. Seventy-four percent of respondents believe that paying taxes brings them merit. This compares favorably with the IGC survey that found 85% were confi dent that contributions to religious or charitable groups are perceived as spiritually meritorious.106
People in Myanmar are extremely generous.BOX 5.3
percent agreed that the Union government had become more responsive, while 67% felt the same about state and region governments, and 56% about DAOs and the YCDC.
These perceptions do not tell us how responsive governments actually are at this moment. Yet, when asked specifi cally about taxation, more respondents were confi dent that their taxes go where they are needed most (47%) than were unsure (26%). There was more skepticism among rural respondents: the IGC found that 43–51% of respondents were unsure their taxes go where they are needed most. There is much greater confi dence—over 80% in the IGC’s fi ndings—that donations go where they are needed most.100
In Myanmar, state legitimacy is still contested in many parts of the country. This contestation is greatest in more-remote areas, where ethnic groups comprise a greater share of the population.101 Other Asia Foundation research has found that some DAOs collect no taxes in some towns where the government’s authority is contested by ethnic armed groups, sensing that they lack the legitimacy to do so.102 This contestation is greatest outside the state and region capital cities that are the focus of this study.
The only other study in Myanmar to ask whether the state has the right to tax found agreement in only half of surveyed respondents. This study, conducted by the IGC, found small differences between respondents from a contested township and those from an uncontested township.103
These fi ndings are not conclusive, however, and further research is needed on the links between state responsiveness, conceptions of state legitimacy, and tax attitudes in Myanmar.
GENEROSITY
Tax attitudes are informed by the extent to which citizens perceive that other citizens are deserving of their support. Greater generosity and a desire to help those less fortunate can result in a greater appreciation of the value of taxation and more protax attitudes. There is a subtle but important difference between a desire for redistribution and generosity. A citizen can be strongly in favor of taxing the rich to provide more resources for the poor (redistribution), but they may not wish to contribute themselves.104 Generosity is about the individual being willing to bear those costs to support others.
44
As chapter 3 notes, Myanmar citizens have a poor understanding of the tax system. There is limited tax education, and citizens strongly agree that they want more information. Citizens overestimate the amount of tax revenue collected by government, especially DAOs. The low level of understanding, reinforced by the poor quality of tax information circulating around citizens, may be fostering mistrust and undermining citizens’ attitudes towards taxes.
Only 11% of respondents in the City Life Survey pay income tax. The burden of offi cial taxation on most urban citizens is therefore low as a share of their income. While the Myanmar public is not strongly antitax now, it is important to improve citizens’ understanding of taxes and tax policy to maintain support for taxes as the tax burden on citizens increases.
The tax system is poorly understood and may be fueling mistrust in government and undermining attitudes towards taxes.
BOX 5.4
UNDERSTANDING OF THE TAX SYSTEM
When a tax system is overly complex, or when the public doesn’t understand it well, citizens are more likely to be suspicious of changes in tax policy. Citizens are more likely to view the system as unfair, suspecting that others are benefi ting while they lose out. A tax system that people don’t understand is one that they are more likely to inadvertently not comply with. This can leave citizens with greater mental anguish over concerns that they may be breaking the law.107,108
This chapter sets out a conceptual framework that identifi es how four key variables can influence tax attitudes. It uses evidence from the City Life Survey to assess whether each of these factors is having a positive or negative impact on tax attitudes in Myanmar’s cities.
Government offi cials tend to argue that it is diffi cult to collect taxes in Myanmar because citizens have historically received few services from the state (i.e., the state has not been responsive to people’s needs). Few services were provided to
Likely impact on tax attitudes in Myanmar
5.2
citizens, though many urban citizens now believe that the government has become more responsive.
The overall effect of fellowship on tax attitudes is ambiguous: citizens feel strong connections with people in their city, but this feeling weakens as they think beyond their local area. If citizens had a better understanding of the tax system and tax policy changes, they would likely have more positive attitudes towards taxation. While they are not strongly antitax now, it is important to improve citizens’ understanding of taxes and
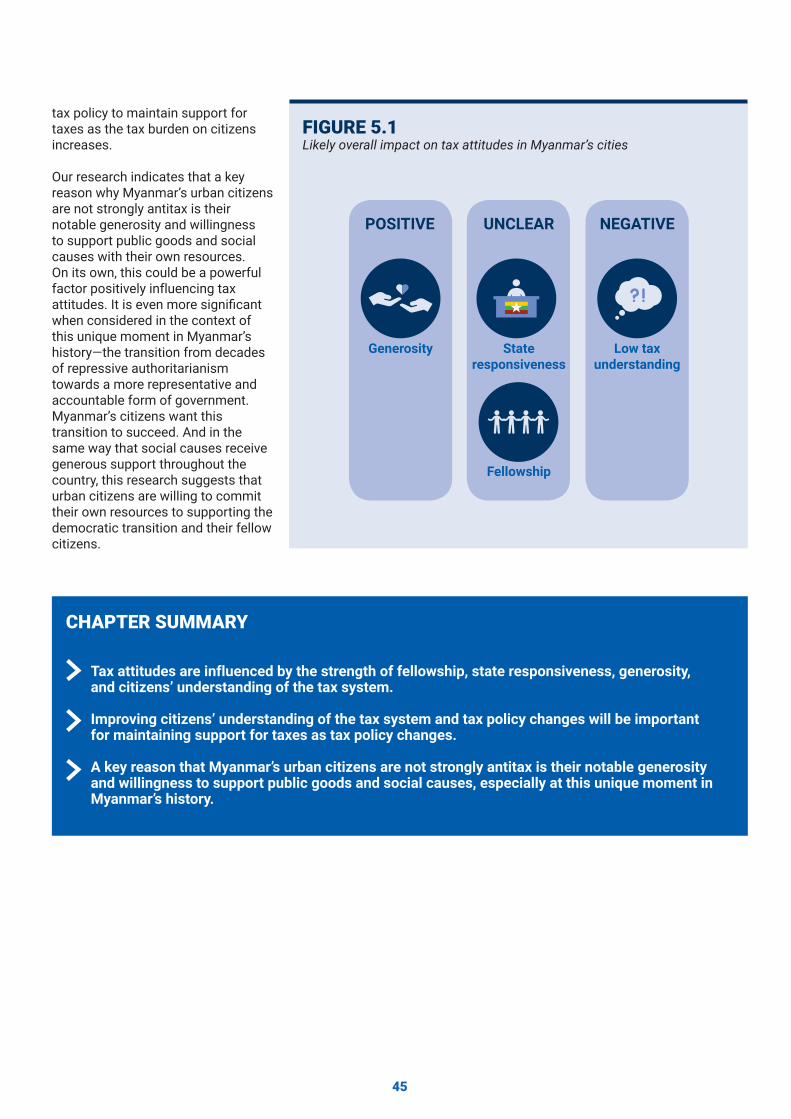
45
Likely overall impact on tax attitudes in Myanmar’s citiesFIGURE 5.1
tax policy to maintain support for taxes as the tax burden on citizens increases.
Our research indicates that a key reason why Myanmar’s urban citizens are not strongly antitax is their notable generosity and willingness to support public goods and social causes with their own resources. On its own, this could be a powerful factor positively influencing tax attitudes. It is even more signifi cant when considered in the context of this unique moment in Myanmar’s history—the transition from decades of repressive authoritarianism towards a more representative and accountable form of government. Myanmar’s citizens want this transition to succeed. And in the same way that social causes receive generous support throughout the country, this research suggests that urban citizens are willing to commit their own resources to supporting the democratic transition and their fellow citizens.
Generosity
Fellowship
State responsiveness
Low tax understanding
Tax attitudes are influenced by the strength of fellowship, state responsiveness, generosity, and citizens’ understanding of the tax system.
Improving citizens’ understanding of the tax system and tax policy changes will be important for maintaining support for taxes as tax policy changes.
A key reason that Myanmar’s urban citizens are not strongly antitax is their notable generosity and willingness to support public goods and social causes, especially at this unique moment in Myanmar’s history.
CHAPTER SUMMARY
POSITIVE UNCLEAR NEGATIVE
46
CHAPTER 6
How the taxpaying experience and government communication affect tax attitudes
The preceding chapters have illustrated that while Myanmar’s urban citizens have a poor understanding of the tax system, they are not antitax. Chapter 5 gives clues as to why this is the case. This chapter presents a conceptual framework that explains how citizens develop their views, with a focus on how information reaches them. This framework helps explain why the way government communicates with people is a critical ingredient in the creation of tax attitudes.
People’s attitudes towards their government, fellow citizens, and taxation are derived from information that is based on personal experience and information received from others.
Citizens’ attitudes towards their government and fellow citizens are influenced by their personal experiences. These can range from a conversation with an MP at a rally, to having to pay a bribe to acquire a driver’s license, to buying goods from a shopkeeper of another ethnicity. All such interactions shape people’s beliefs about the world they live in, including whether they feel bonds to the people around them, are generous, and consider the state responsive. The following section focuses on the taxpaying experience as an influence on tax attitudes.
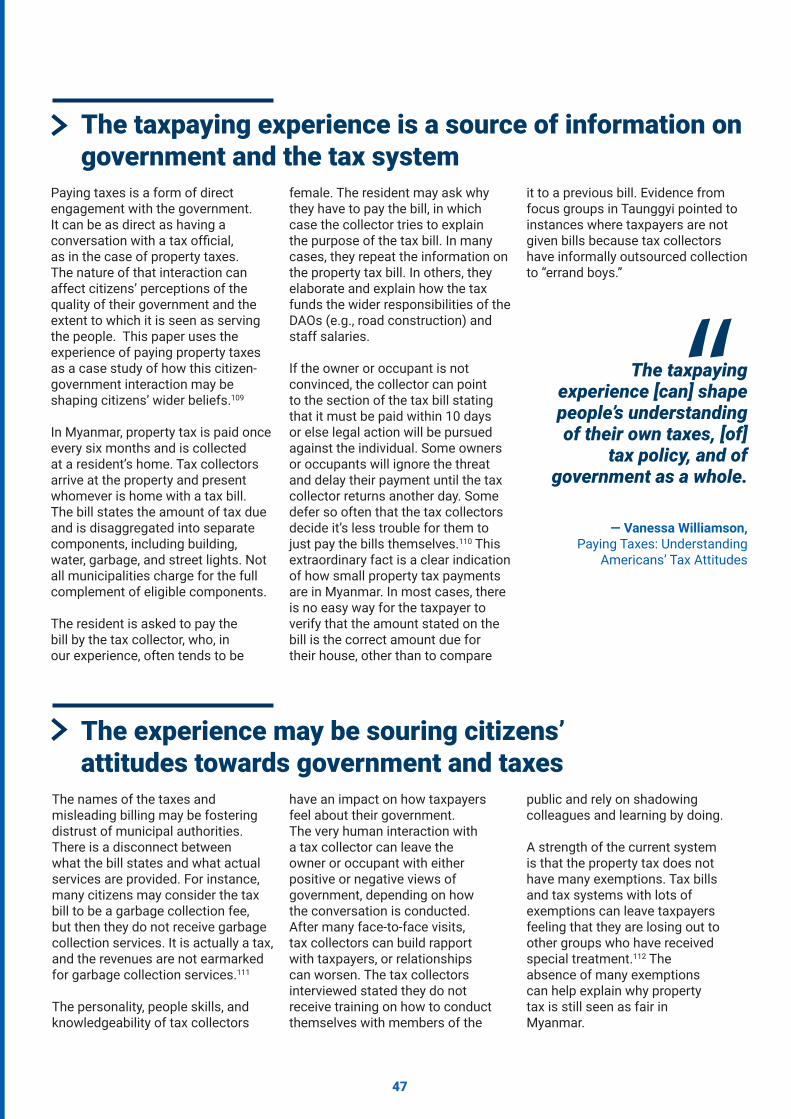
47
Paying taxes is a form of direct engagement with the government. It can be as direct as having a conversation with a tax offi cial, as in the case of property taxes. The nature of that interaction can affect citizens’ perceptions of the quality of their government and the extent to which it is seen as serving the people. This paper uses the experience of paying property taxes as a case study of how this citizen-government interaction may be shaping citizens’ wider beliefs.109
In Myanmar, property tax is paid once every six months and is collected at a resident’s home. Tax collectors arrive at the property and present whomever is home with a tax bill. The bill states the amount of tax due and is disaggregated into separate components, including building, water, garbage, and street lights. Not all municipalities charge for the full complement of eligible components.
The resident is asked to pay the bill by the tax collector, who, in our experience, often tends to be
The names of the taxes and misleading billing may be fostering distrust of municipal authorities. There is a disconnect between what the bill states and what actual services are provided. For instance, many citizens may consider the tax bill to be a garbage collection fee, but then they do not receive garbage collection services. It is actually a tax, and the revenues are not earmarked for garbage collection services.111
The personality, people skills, and knowledgeability of tax collectors
The taxpaying experience is a source of information on government and the tax system
The experience may be souring citizens’ attitudes towards government and taxes
“The taxpaying experience [can] shape people’s understanding of their own taxes, [of]
tax policy, and of government as a whole.
— Vanessa Williamson, Paying Taxes: Understanding
Americans’ Tax Attitudes
female. The resident may ask why they have to pay the bill, in which case the collector tries to explain the purpose of the tax bill. In many cases, they repeat the information on the property tax bill. In others, they elaborate and explain how the tax funds the wider responsibilities of the DAOs (e.g., road construction) and staff salaries.
If the owner or occupant is not convinced, the collector can point to the section of the tax bill stating that it must be paid within 10 days or else legal action will be pursued against the individual. Some owners or occupants will ignore the threat and delay their payment until the tax collector returns another day. Some defer so often that the tax collectors decide it’s less trouble for them to just pay the bills themselves.110 This extraordinary fact is a clear indication of how small property tax payments are in Myanmar. In most cases, there is no easy way for the taxpayer to verify that the amount stated on the bill is the correct amount due for their house, other than to compare
have an impact on how taxpayers feel about their government. The very human interaction with a tax collector can leave the owner or occupant with either positive or negative views of government, depending on how the conversation is conducted. After many face-to-face visits, tax collectors can build rapport with taxpayers, or relationships can worsen. The tax collectors interviewed stated they do not receive training on how to conduct themselves with members of the
public and rely on shadowing colleagues and learning by doing.
A strength of the current system is that the property tax does not have many exemptions. Tax bills and tax systems with lots of exemptions can leave taxpayers feeling that they are losing out to other groups who have received special treatment.112 The absence of many exemptions can help explain why property tax is still seen as fair in Myanmar.
it to a previous bill. Evidence from focus groups in Taunggyi pointed to instances where taxpayers are not given bills because tax collectors have informally outsourced collection to “errand boys.”
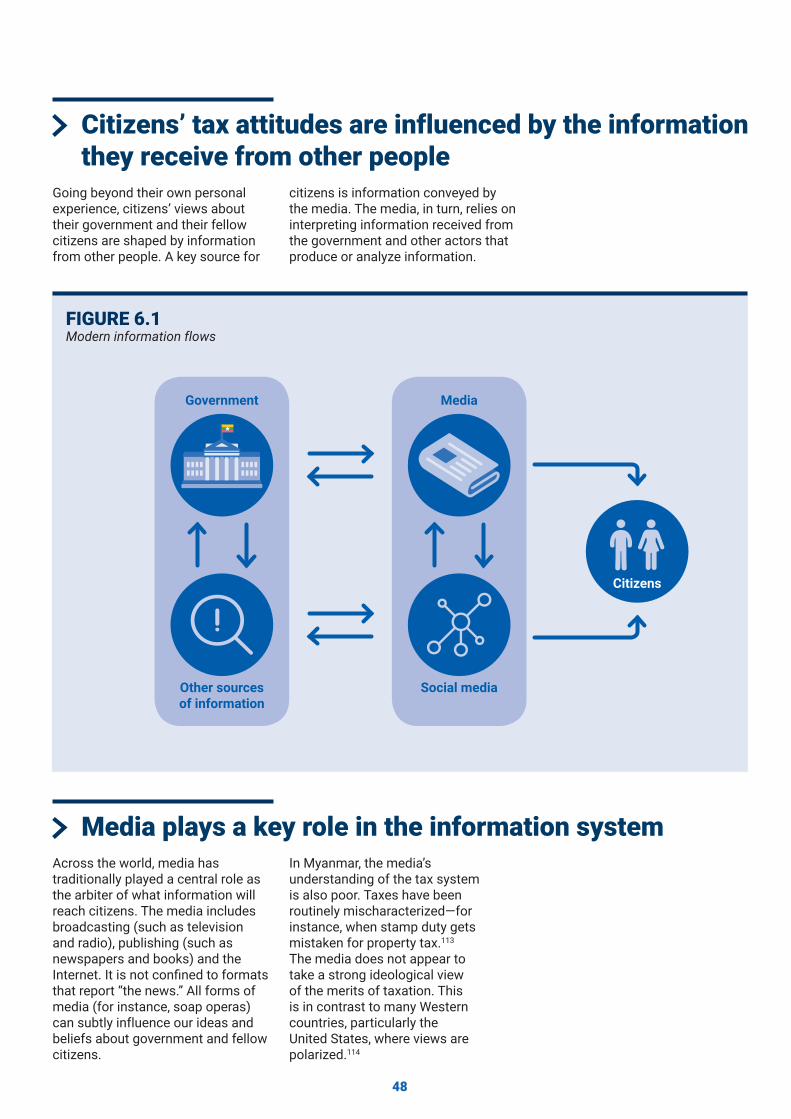
48
Going beyond their own personal experience, citizens’ views about their government and their fellow citizens are shaped by information from other people. A key source for
Across the world, media has traditionally played a central role as the arbiter of what information will reach citizens. The media includes broadcasting (such as television and radio), publishing (such as newspapers and books) and the Internet. It is not confi ned to formats that report “the news.” All forms of media (for instance, soap operas) can subtly influence our ideas and beliefs about government and fellow citizens.
Citizens’ tax attitudes are influenced by the information they receive from other people
Media plays a key role in the information system
citizens is information conveyed by the media. The media, in turn, relies on interpreting information received from the government and other actors that produce or analyze information.
Modern information flowsFIGURE 6.1
Other sources of information
Social media
Government Media
Citizens
In Myanmar, the media’s understanding of the tax system is also poor. Taxes have been routinely mischaracterized—for instance, when stamp duty gets mistaken for property tax.113 The media does not appear to take a strong ideological view of the merits of taxation. This is in contrast to many Western countries, particularly the United States, where views are polarized.114
49
While there are direct channels of communication between all these sources of information and citizens, media has historically played a strong fi ltering role. With the rise of social media such as Facebook, traditional media’s grip on this role may be loosening.115 Actors can now bypass the traditional media and reach a large number of people directly through social media platforms. As box 6.1 illustrates, for a signifi cant number of people, social media is becoming the primary conduit through which they receive information.
Government is the source of much of the information on how government currently works, what changes are taking place, and how this all
These other sources of information are diverse and diffi cult to categorize. They include political parties, CSOs, think tanks, academia, religious fi gures, public intellectuals, and celebrities. The roles that three of these groups (could) play in the tax information system are summarized below.
l In Myanmar, the main political parties do not yet have clearly articulated policies on taxes. There is no obvious partisan split
Social media is changing the way information reaches people
Government is a critical source of information, especially when it comes to taxes
There are many “other sources of information” that act as important messengers, but they also have a limited understanding of the tax system
affects citizens. In the conceptual framework under discussion, “government” refers to the elected government and the bureaucracy.117
In Myanmar, more people now rely on Facebook as a source of news and information than on newspapers. This is even though only 25% of the population uses Facebook. Of those who use Facebook, 38% get most or all of their news and information there. Some of this information is from traditional news outlets, simply shared on Facebook; but some of it is information directly from the government, CSOs, or analysts, as when a user directly follows the page of an MP they like. Much of the information is fi ltered through a citizen’s online peers.116
But traditional sources still play an important role. Focus groups that were part of this research revealed that some citizens still put more trust in traditional media sources, with some participants going so far as to describe Facebook as “fake news.” And the use of Facebook varies. In Hpa-an, participants were less likely to use Facebook, and preferred to receive updates from government “in the real world.”
The rise of Facebook as a source of news and informationBOX 6.1
The government’s critical role in tax education and policy communication is discussed in more detail later in this chapter.
as there is in many Western countries, where conservative parties tend to favor lower taxes and liberal parties prefer higher taxes.
l Think tanks, or policy institutes, analyze government policy and share their fi ndings with the public and policymakers. In Myanmar, a number of think tanks have begun to address tax issues—for instance, the Renaissance Institute’s review
of Myanmar’s property tax system, the Open Myanmar Initiative’s online budget dashboard, and Spectrum’s work on the Citizen’s Budget.
l CSOs, such as religious and charitable groups, are active in communities throughout Myanmar. They are trusted messengers, and could play a bigger role in disseminating information about government plans and policy changes regarding taxes.118,119
50
Academic research in the fi elds of sociology, psychology, and behavioral economics has shown that the messenger can be as important as the message in changing people’s attitudes and decision-making. People are receptive to ideas from some people and groups and not from others. This goes beyond rationally valuing information from more credible sources. People assign greater importance and credibility to information that comes from people like them and people whom they like. They discount information from those they don’t like or view as different. This is why advertising companies use famous people to promote their brands. The implications are that government communications on tax policy and tax education could be made more effective using messengers that the public likes and trusts. 120,121
The importance of the messengerBOX 6.2
Current tax education services largely serve businesses. A Taunggyi IRD offi cial reported that businesses of the same trade can meet at the township offi ce once or twice a month for tax training.122 Yangon tax offi cials also reported giving talks and tax trainings in private-sector factories and to auditors.123 IRD has taxpayer service centers in Yangon and Mandalay through which both businesses and citizens can seek tax information.124
Historically, the government has not seen as its role educating citizens on taxes and the tax system.125 Yet, there are signs this is changing, albeit slowly. When asked about what tax education is available to the public, tax offi cials claimed to have
Some may have the view that ignorance is bliss: the less citizens know about the tax system, the less they will oppose sensible tax reforms. This is a risky strategy. As government offi cials are all too aware, taxes are highly political. Citizens are right to be skeptical that policy changes will automatically
Limited tax education creates an information vacuum that is fi lled with inaccurate information or rumor
Low tax understanding and poor government communication on tax issues make tax reform harder and undermine trust in government
tax information available on their websites. The offi cials complained that a majority of the public is unaware of this, and that only businesses use the websites to get information. To increase usage, the IRD is redesigning its website to be more user friendly. The FAQ section of the YCDC’s website also provides information on what property tax is and what components it includes; however, there is still room for improvement. While there is a section entitled “why is [property tax] necessary to be paid,” no information is provided.126
Overall, tax education for citizens is almost nonexistent. It is rarely concise or engaging. It is rarely provided through media that can be
accessed by most of the public—relying, for example, on websites when most of the population has no experience using a web browser.127 As the government fails to fulfi l its role as messenger, the information gap is fi lled in by other sources. Yet, they also have only limited or inaccurate information to share.
The sum of all these factors is poor-quality information on the tax system circulating among citizens. This survey has demonstrated that there is a large gap between what urban citizens know and what they want to know about the taxes they pay and the overall tax system. Continuing current government policies will only perpetuate this gap.
benefi t them. When government fails to control the narrative around a policy change, it creates a vacuum that can be fi lled by inaccurate information, speculation, and rumor.
With social media on the rise, these alternative narratives of what a policy means for citizens
can spread very quickly. Once they reach a critical mass of citizens, the effort needed to dispel them can be much greater than the effort needed to communicate effectively about the policy from the beginning. This makes the fi rst moves by the government important. A clear communication strategy should set
51
On May 18, 2015, the Ministry of Communications and Information Technology informed the three main telecom providers in Myanmar that by June 1 they would be required to charge a 5% commercial tax on mobile top-up cards.129
The introduction of such a tax was sensible tax policy. It is one of the easiest commercial taxes to collect and administer. It would also remove the arbitrary distinction between telecom services and other services, bringing telecoms in line with the existing Union Tax Law. It represented one of the few easy-win tax reforms in Myanmar, and was welcomed by international tax experts.
But there were shortcomings in the way the policy change was communicated to the businesses and consumers it would affect. Consumers were left confused about the rationale for the introduction and how the tax would be paid. The tax should technically have already been enforced, but there had been varying levels of compliance among telecommunications fi rms prior to the announcement.
The telecommunications fi rms were instructed to be the messengers of the tax-policy change. They were given a short time to deliver the message and limited guidance.
After negative media coverage, parliament voted to suspend the introduction until the next fi scal year. Even when it was enacted, in April 2016, there were still questions in government as to who would bear the burden of the tax. Just one day after the tax was implemented, Speaker U Win Myint of the Pyithu Hluttaw urged the government to consider whether the tax was appropriate.130 While many people voiced their frustration with having to pay more, their opposition was not absolute.
“People’s views are varied. Some think that more taxes should be collected and put towards benefi cial causes. Others are saying that the tax should not be charged to people who are already poor. Still, it would be fi ne if [the government] could explain to the people why the taxes are needed and how they will be used.”
— U Nay Soe, Nay Pyi Taw–based business owner.131
Case study: a “tax on talking”BOX 6.3
The taxpaying experience may be undermining trust in government and making it harder to collect taxes.
The combination of poor understanding, limited tax education, and poorly communicated tax-policy changes can result in signifi cant suspicion of tax reform.
Poorly communicated tax policy can damage citizens’ attitudes towards government more broadly and undermine their existing tax attitudes.
CHAPTER SUMMARY
“For many people, tax is a complex subject, and this
complexity has been shown to contribute to
noncompliance.… Ways to make it easier to comply
include the use of plain language in
communications and simplifying forms and tax
laws where possible.
— Keith WalshUnderstanding Taxpayer Behaviour:
New Opportunities for Tax Administration128
out what messages are going to be delivered, by whom, and in what order and at what time.
Historically, the Myanmar government has been weak in communicating tax-policy changes. Box 6.3. offers one example of a policy that left citizens surprised when it was introduced, unsure how the policy would work, and unclear about what it was for. When a rationale for reform is given, it is not always articulated in a way that will resonate with ordinary citizens, or even with other policymakers.
52
CHAPTER 7
Conclusions and recommendations
This chapter summarizes the fi ndings of this analysis of tax attitudes in Myanmar and offers recommendations for government. The research has focused on urban citizens, but its conclusions and recommendations have wider applicability. The fi ndings are relevant to anyone interested in tax policy and how citizens think about a key relationship with the state.
53
Conclusions7.1
Myanmar’s urban citizens do not exhibit strong antitax attitudes, contrary to the views of many tax offi cials and policymakers. Almost all respondents (94%) agreed that paying taxes is a civic duty. Eighty-one percent agreed that citizens should pay taxes even if they don’t agree with the government. Income, commercial, and property taxes are considered fair. Citizens say they would pay more property tax if government improved service delivery, a view recognized by government offi cials. Government offi cials surveyed believed that City Life Survey respondents would have more negative tax attitudes than was actually the case. But some policymakers interviewed were more positive.
The state has historically been unresponsive to citizens’ needs, but urban citizens believe things are improving. Nearly half of respondents said they were confi dent their taxes go where they are needed most (26% said they were not sure). With a new, democratically elected government in power, between 56% and 67% of respondents agreed that government had become more responsive to their needs than one year earlier.
Myanmar’s citizens are extremely generous with their time and resources and are willing to fund public goods and social causes. Myanmar consistently tops the World Giving Index in terms of charitable behavior. There is a long history of citizens pooling their resources to fund public goods and social causes. Paying taxes is one way to contribute to public goods, and three-quarters of respondents felt paying taxes brings them merit.
Poor understanding of taxes and poor communication of tax-policy changes are fostering mistrust of government. Only 55% of respondents have heard of income tax, with 69% familiar with commercial tax. Sixty percent of respondents said they did not understand which level of government receives most of the revenue from each tax. When they did answer, they overestimated the revenues of DAOs and the YCDC, which leads to mistrust. Government has provided little tax education to citizens. Government tax-policy changes are rarely communicated with a clear rationale that appeals to citizens’ attitudes or interests. This means inaccurate information reaches citizens. This worsens taxpayer behavior and makes tax reform harder.
“Myanmar people are charitable, and they have a willingness to pay more tax. The issue is that at the moment they do
not trust the [government], because there is not enough transparency or
accountability. The public wants to be involved, and they want more
information.
— Daw Nang Thuzar Win, Kayin State Hluttaw Deputy Speaker
Citizens want more information on taxes and the tax system. Almost 90% of all respondents wished they had more information on what taxes they are supposed to pay. Eighty-nine percent wished they had more information on where their taxes are spent. The fi ndings offer strong support for the Myanmar government’s publication of Citizen’s Budgets at the Union and state and region level. Not all state and region governments have committed to this, however, and little information is available at the municipal level. Think tanks, CSOs, and the media have played a limited role to date, but they are increasingly recognizing the importance of taxes, tax analysis, and tax education for Myanmar’s development.
Improving the taxpaying experience by providing more information will enhance positive interactions between government and citizens. Current property-tax bills are misleading. Focus groups revealed that tax collectors can be rude and ill-informed about where tax revenue is spent. They receive no training in how to best engage the public, and they lack access to budget information.
Myanmar’s policymakers face a careful balancing act with tax reform. If tax-policy changes are implemented without more careful attention to their design and how they are communicated, the stock of good will could be used up very quickly. But too much caution or inaction could have the same effect. If tax reforms are not made during this moment of greater acceptance, government will miss out on the revenues that can fund the government services that are needed to meet the public’s rising expectations.
54
Tax offi cials do not have much control over many of the factors that influence citizens’ attitudes towards taxes, but they can influence citizens’ understanding of taxes, they can improve the taxpaying experience, they can show where tax money goes, and they can ensure that changes are communicated better. The following recommendations for government can make tax reform more viable and improve citizens’ general perceptions of their government. They help government be seen by citizens as transparent, accountable, and there to serve the public’s needs.
Recommendations7.2
1.
2.
3.
4.
5.
Seize the moment and be more ambitious in tax reform. This research fi nds evidence that, at this historic moment in Myanmar’s transition, urban citizens are more open to tax reform than is often claimed. It is critical, however, that reform be kept in line with collecting agencies’ limited administrative capabilities.
Improve citizens’ understanding of the tax system.
l Avoid making the tax system overly complex. Complexity can worsen taxpayer behavior and can be antidemocratic. Once a tax system has grown too complex, it is hard to reverse the process.
l Improve tax education. Citizens want to know what they are supposed to pay, how much they should pay, and to whom it goes. This information can help reduce citizens’ concerns about corruption and government ineptitude.
l Show citizens what taxes are spent on. Recent government efforts to produce the Citizen’s Budget are a strong step in the right direction in terms of increasing the information available to citizens and doing so in an accessible manner. Citizen’s Budgets on their own are unlikely to be suffi cient to meet the demand, and other alternatives should also be explored. The government should consider the important role that CSOs, think tanks, and the media can play to help inform citizens.
Ensure that tax-policy changes are informed by a more realistic understanding of citizens’ attitudes, preferences, and taxpaying experience. This report has demonstrated how perceptions about citizens’ attitudes can be inaccurate. Tax reformers should seek to better understand citizens’ attitudes before designing (and then communicating) tax changes.
INTERNAL REVENUE DEPARTMENT
1.
2.
3.
Alter the current communication campaign that focuses on taxes as a civic duty. At least in the cities studied, there is strong evidence that citizens recognize that taxes are a civic duty. The value added by continuing the existing strategy in such cities is limited.
Shift the communication campaign to educate citizens about what taxes they are supposed to pay, how to pay them, and where they are spent. There is clear demand from citizens for this information, and evidence from other contexts shows that it can improve taxpaying behavior. Other messages could include explaining the role taxes play in improving people’s lives and supporting Myanmar’s development. What messages will best resonate with citizens and which will improve tax attitudes or tax compliance need further testing.
Commission research into businesses’ attitudes towards taxation and their views of the taxpaying experience. This report has shown that many perceptions of citizens’ attitudes are incomplete at best. It is likely that some perceptions of businesses’ attitudes are also inaccurate.
This might involve consultations, focus groups, or surveys like those this research has drawn on.
Improve the taxpaying experience. Recognize the important role that tax collectors and offi cials play in their personal interactions with citizens. Provide guidance and training in how to engage with the public in a more informative and service-orientated manner.
Improve the way government communicates tax policy. All policy changes should have a clear communications strategy. These should identify the target audience for communications. Key messages should be developed, including a clear rationale for the policy change that appeals to citizens. Evidence should support this. Messages should be in a language that is easily understood by the audience. Different audiences may require different messages. The strategy should also consider who will be the most effective messengers, what medium to use, and what messages should be released at what time.
55
MUNICIPAL GOVERNMENT
Prioritize reform efforts towards adding more houses to the tax register. Property taxes are currently viewed as fair. But if property taxes are raised from their currently very low levels, the gap will widen between households that pay the tax and those that are not on the register. To make the system fairer, more households should be added to the register before all households are asked to pay more.
Develop training modules for tax collectors in each state and region. Once developed, these can be rolled out across all municipalities within a state or region. The modules should include training in engaging with the public and managing diffi cult conversations. It should also teach tax collectors to more accurately convey how the DAO spends its tax revenues. Tax collectors tend to be young women, so such training is important to reduce their risk of harm or intimidation.
Publish spending information in formats that are engaging and can be understood by citizens. This could include traditional approaches such as posters and meetings with citizens, or newer approaches such as social media or mobile applications. Tax bills are a key channel of communication. Experiment with different forms of tax bills that present the information citizens want and help improve their attitude towards taxes and government more broadly.
1.
2.
3.
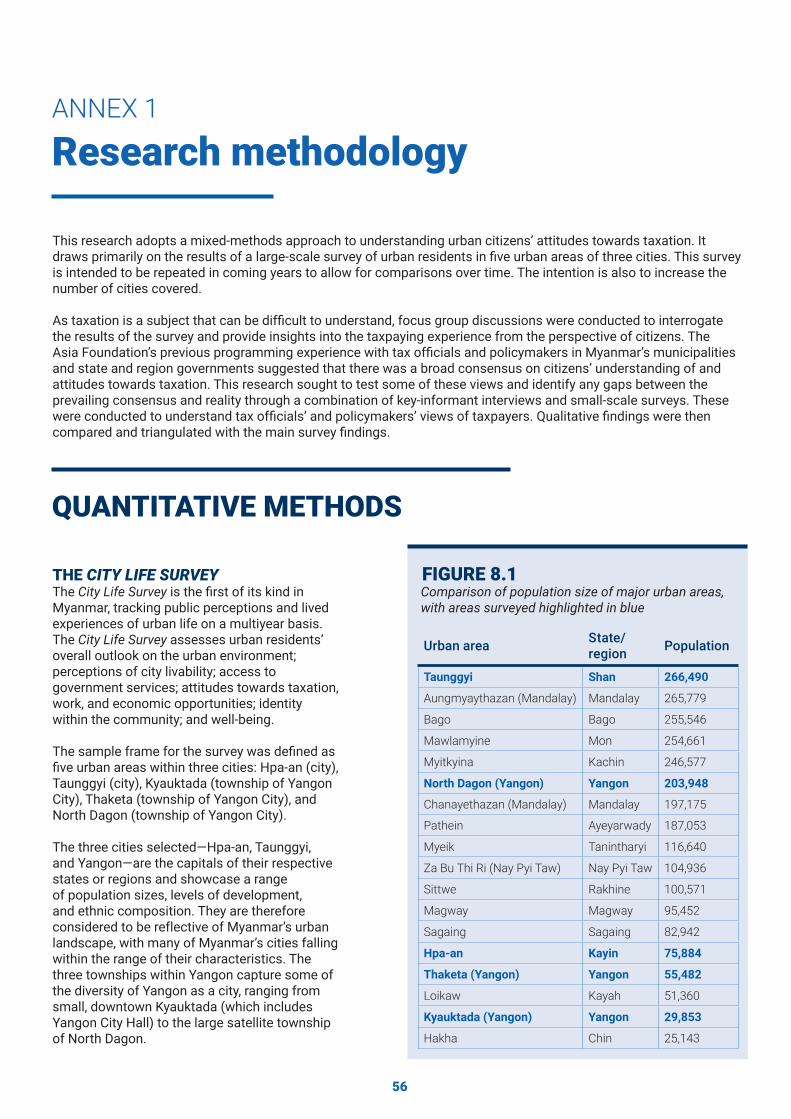
56
This research adopts a mixed-methods approach to understanding urban citizens’ attitudes towards taxation. It draws primarily on the results of a large-scale survey of urban residents in fi ve urban areas of three cities. This survey is intended to be repeated in coming years to allow for comparisons over time. The intention is also to increase the number of cities covered.
As taxation is a subject that can be diffi cult to understand, focus group discussions were conducted to interrogate the results of the survey and provide insights into the taxpaying experience from the perspective of citizens. The Asia Foundation’s previous programming experience with tax offi cials and policymakers in Myanmar’s municipalities and state and region governments suggested that there was a broad consensus on citizens’ understanding of and attitudes towards taxation. This research sought to test some of these views and identify any gaps between the prevailing consensus and reality through a combination of key-informant interviews and small-scale surveys. These were conducted to understand tax offi cials’ and policymakers’ views of taxpayers. Qualitative fi ndings were then compared and triangulated with the main survey fi ndings.
THE CITY LIFE SURVEYThe City Life Survey is the fi rst of its kind in Myanmar, tracking public perceptions and lived experiences of urban life on a multiyear basis. The City Life Survey assesses urban residents’ overall outlook on the urban environment; perceptions of city livability; access to government services; attitudes towards taxation, work, and economic opportunities; identity within the community; and well-being.
The sample frame for the survey was defi ned as fi ve urban areas within three cities: Hpa-an (city), Taunggyi (city), Kyauktada (township of Yangon City), Thaketa (township of Yangon City), and North Dagon (township of Yangon City).
The three cities selected—Hpa-an, Taunggyi, and Yangon—are the capitals of their respective states or regions and showcase a range of population sizes, levels of development, and ethnic composition. They are therefore considered to be reflective of Myanmar’s urban landscape, with many of Myanmar’s cities falling within the range of their characteristics. The three townships within Yangon capture some of the diversity of Yangon as a city, ranging from small, downtown Kyauktada (which includes Yangon City Hall) to the large satellite township of North Dagon.
Research methodologyANNEX 1
QUANTITATIVE METHODS
Comparison of population size of major urban areas, with areas surveyed highlighted in blue
FIGURE 8.1
Urban area State/region Population
Taunggyi Shan 266,490
Aungmyaythazan (Mandalay) Mandalay 265,779
Bago Bago 255,546
Mawlamyine Mon 254,661
Myitkyina Kachin 246,577
North Dagon (Yangon) Yangon 203,948
Chanayethazan (Mandalay) Mandalay 197,175
Pathein Ayeyarwady 187,053
Myeik Tanintharyi 116,640
Za Bu Thi Ri (Nay Pyi Taw) Nay Pyi Taw 104,936
Sittwe Rakhine 100,571
Magway Magway 95,452
Sagaing Sagaing 82,942
Hpa-an Kayin 75,884
Thaketa (Yangon) Yangon 55,482
Loikaw Kayah 51,360
Kyauktada (Yangon) Yangon 29,853
Hakha Chin 25,143
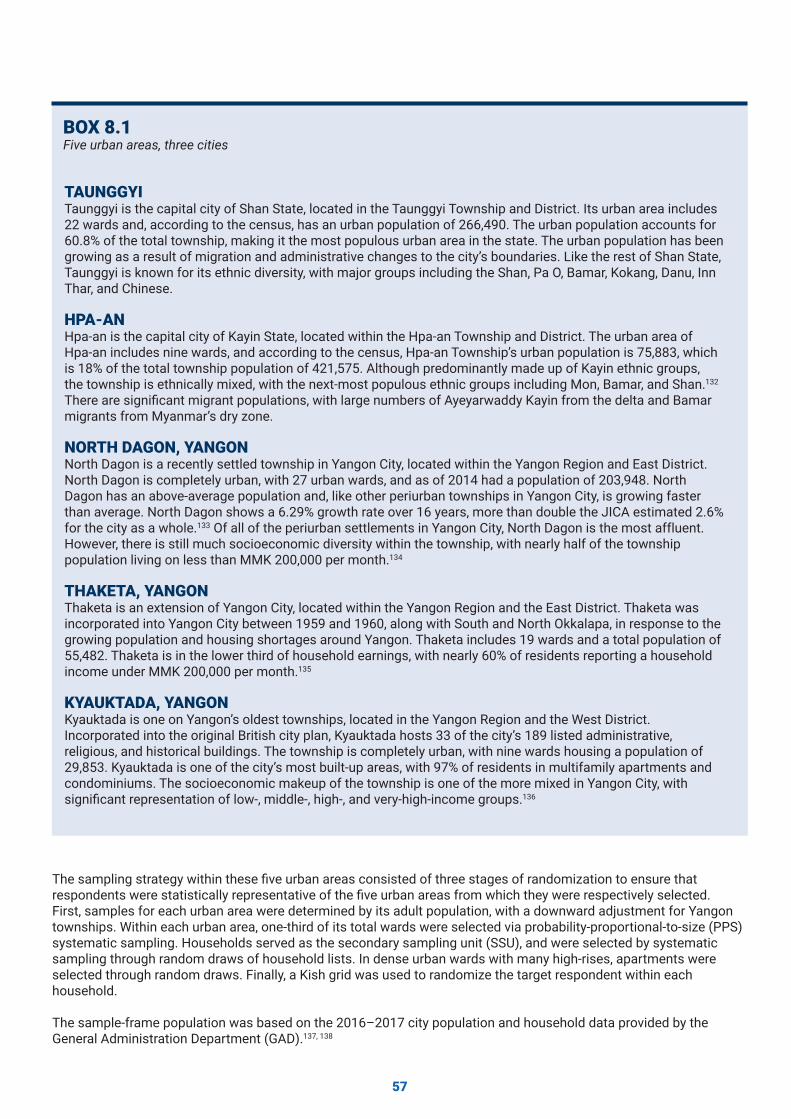
57
The sampling strategy within these fi ve urban areas consisted of three stages of randomization to ensure that respondents were statistically representative of the fi ve urban areas from which they were respectively selected. First, samples for each urban area were determined by its adult population, with a downward adjustment for Yangon townships. Within each urban area, one-third of its total wards were selected via probability-proportional-to-size (PPS) systematic sampling. Households served as the secondary sampling unit (SSU), and were selected by systematic sampling through random draws of household lists. In dense urban wards with many high-rises, apartments were selected through random draws. Finally, a Kish grid was used to randomize the target respondent within each household.
The sample-frame population was based on the 2016–2017 city population and household data provided by the General Administration Department (GAD).137, 138
TAUNGGYITaunggyi is the capital city of Shan State, located in the Taunggyi Township and District. Its urban area includes 22 wards and, according to the census, has an urban population of 266,490. The urban population accounts for 60.8% of the total township, making it the most populous urban area in the state. The urban population has been growing as a result of migration and administrative changes to the city’s boundaries. Like the rest of Shan State, Taunggyi is known for its ethnic diversity, with major groups including the Shan, Pa O, Bamar, Kokang, Danu, Inn Thar, and Chinese.
HPA-ANHpa-an is the capital city of Kayin State, located within the Hpa-an Township and District. The urban area of Hpa-an includes nine wards, and according to the census, Hpa-an Township’s urban population is 75,883, which is 18% of the total township population of 421,575. Although predominantly made up of Kayin ethnic groups, the township is ethnically mixed, with the next-most populous ethnic groups including Mon, Bamar, and Shan.132 There are signifi cant migrant populations, with large numbers of Ayeyarwaddy Kayin from the delta and Bamar migrants from Myanmar’s dry zone.
NORTH DAGON, YANGONNorth Dagon is a recently settled township in Yangon City, located within the Yangon Region and East District. North Dagon is completely urban, with 27 urban wards, and as of 2014 had a population of 203,948. North Dagon has an above-average population and, like other periurban townships in Yangon City, is growing faster than average. North Dagon shows a 6.29% growth rate over 16 years, more than double the JICA estimated 2.6% for the city as a whole.133 Of all of the periurban settlements in Yangon City, North Dagon is the most affluent. However, there is still much socioeconomic diversity within the township, with nearly half of the township population living on less than MMK 200,000 per month.134
THAKETA, YANGONThaketa is an extension of Yangon City, located within the Yangon Region and the East District. Thaketa was incorporated into Yangon City between 1959 and 1960, along with South and North Okkalapa, in response to the growing population and housing shortages around Yangon. Thaketa includes 19 wards and a total population of 55,482. Thaketa is in the lower third of household earnings, with nearly 60% of residents reporting a household income under MMK 200,000 per month.135
KYAUKTADA, YANGONKyauktada is one on Yangon’s oldest townships, located in the Yangon Region and the West District. Incorporated into the original British city plan, Kyauktada hosts 33 of the city’s 189 listed administrative, religious, and historical buildings. The township is completely urban, with nine wards housing a population of 29,853. Kyauktada is one of the city’s most built-up areas, with 97% of residents in multifamily apartments and condominiums. The socioeconomic makeup of the township is one of the more mixed in Yangon City, with signifi cant representation of low-, middle-, high-, and very-high-income groups.136
Five urban areas, three citiesBOX 8.1
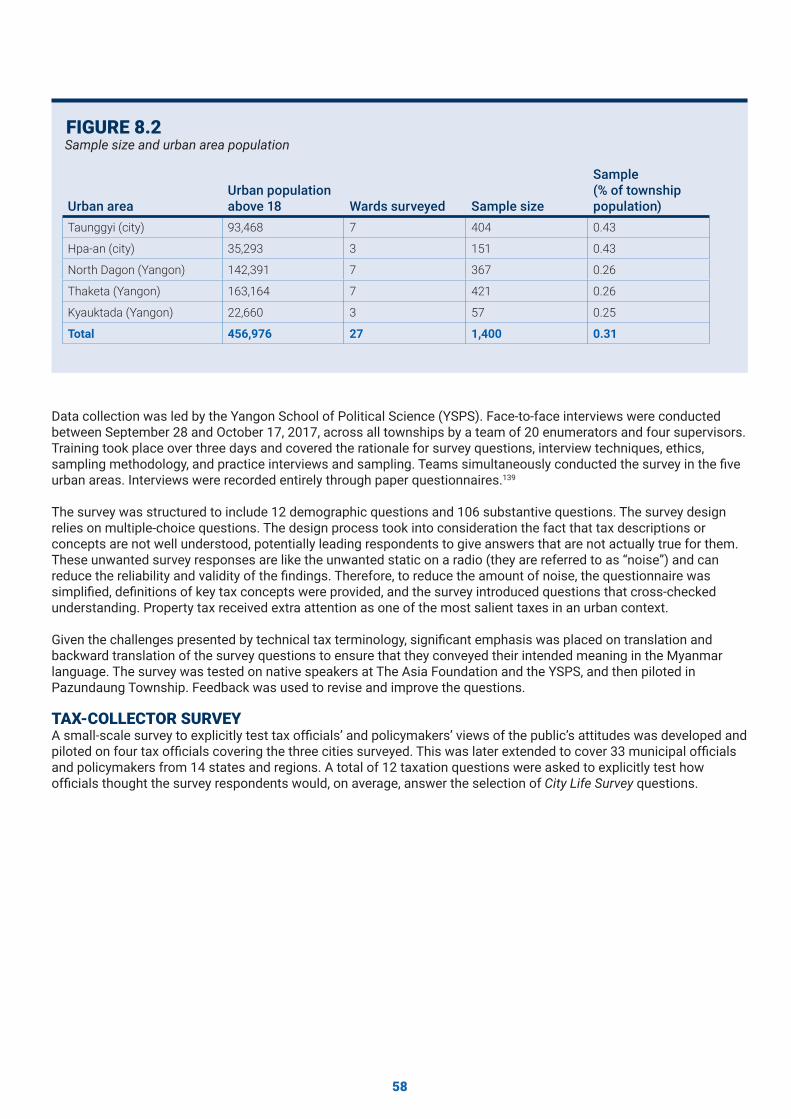
58
Sample size and urban area populationFIGURE 8.2
Urban areaUrban population above 18 Wards surveyed Sample size
Sample (% of township population)
Taunggyi (city) 93,468 7 404 0.43
Hpa-an (city) 35,293 3 151 0.43
North Dagon (Yangon) 142,391 7 367 0.26
Thaketa (Yangon) 163,164 7 421 0.26
Kyauktada (Yangon) 22,660 3 57 0.25
Total 456,976 27 1,400 0.31
Data collection was led by the Yangon School of Political Science (YSPS). Face-to-face interviews were conducted between September 28 and October 17, 2017, across all townships by a team of 20 enumerators and four supervisors. Training took place over three days and covered the rationale for survey questions, interview techniques, ethics, sampling methodology, and practice interviews and sampling. Teams simultaneously conducted the survey in the fi ve urban areas. Interviews were recorded entirely through paper questionnaires.139
The survey was structured to include 12 demographic questions and 106 substantive questions. The survey design relies on multiple-choice questions. The design process took into consideration the fact that tax descriptions or concepts are not well understood, potentially leading respondents to give answers that are not actually true for them. These unwanted survey responses are like the unwanted static on a radio (they are referred to as “noise”) and can reduce the reliability and validity of the fi ndings. Therefore, to reduce the amount of noise, the questionnaire was simplifi ed, defi nitions of key tax concepts were provided, and the survey introduced questions that cross-checked understanding. Property tax received extra attention as one of the most salient taxes in an urban context.
Given the challenges presented by technical tax terminology, signifi cant emphasis was placed on translation and backward translation of the survey questions to ensure that they conveyed their intended meaning in the Myanmar language. The survey was tested on native speakers at The Asia Foundation and the YSPS, and then piloted in Pazundaung Township. Feedback was used to revise and improve the questions.
TAX-COLLECTOR SURVEYA small-scale survey to explicitly test tax offi cials’ and policymakers’ views of the public’s attitudes was developed and piloted on four tax offi cials covering the three cities surveyed. This was later extended to cover 33 municipal offi cials and policymakers from 14 states and regions. A total of 12 taxation questions were asked to explicitly test how offi cials thought the survey respondents would, on average, answer the selection of City Life Survey questions.
59
QUALITATIVE METHODSFOCUS GROUP DISCUSSIONSTwo focus groups were conducted in December 2017. The Taunggyi group included 10 participants (fi ve women and fi ve men) from three wards. The Hpa-an group included nine participants from nine wards (six women and three men).
An open-ended discussion of taxes was followed by a structured set of specifi c questions on taxation and tax attitudes. Questions sought to test what citizens understand as being a tax, what taxes are for, who is responsible for paying them, and what opinions people have of them. Questions about the taxpaying experience were included. Respondents were also asked how they access information, including where they get their news, what information they receive from their municipality, and how much they trust various sources. INTERVIEWS WITH TAX OFFICIALS Semistructured interviews were conducted with government offi cials working in departments related to the three taxes examined in this report. This included two IRD offi cials, from Yangon and Taunggyi, and six tax offi cials from Yangon and Hpa-an. Respondents included a DAO tax collector, DAO Deputy Staff Offi cer, DAO Assistant Director, DAO Executive Offi cer, the head of the YCDC Assessor’s Department and Tax Collectors, the YCDC head of Land Administration and City Planning. Respondents from different levels of the hierarchy whose work covered the urban areas surveyed were selected for their direct experience working on tax issues.
Semistructured interviews were supplemented by group discussions with policymakers (including ministers, MPs, and state directors) in Yangon, Taunggyi, and Hpa-an as part of the MSSP. These included the mayor of Yangon, development affairs ministers of Taunggyi and Hpa-an, the vice speaker of the Kayin Hluttaw, and members of the Kayin Public Accounts Committee and the Development Affairs Committee.
LIMITATIONS OF RESEARCH APPROACHThis paper relies primarily on quantitative research gathered as part of the pilot City Life Survey. Its fi ndings are based on a sample of fi ve urban areas in three cities. While these urban areas are diverse enough to reflect a range of Myanmar’s urban landscape, they are not representative, in the statistical sense, of all of Myanmar’s urban areas.140 The fi ndings are most generalizable to middle- to large-sized cities. Annex 1 shows that the cities of Bago, Mawlamyine, Pathein, Myitkyina, Sittwe, Magway, and Sagaing have urban populations that lie between Taunggyi and Hpa-an in size. The fi ndings are not statistically representative of the overall Myanmar population, but they may still be indicative of broad trends.
A detailed statistical or econometric analysis of the causal links between variables is beyond the scope of this study. A limitation of quantitative surveys and the multiple-choice format this research relies on is that it can be unclear whether people have understood the questions being asked. Even in countries with higher average levels of education and longer exposure to tax concepts, taxation has been diffi cult to survey.141 We have taken steps to simplify the survey and reduce the likelihood of inaccurate answers. Most questions allow for a “don’t know” or “prefer not to say” response, and respondents did not appear unwilling to select these answers: for some questions, over 50% said they did not know. It is reasonable to assume, though, that as the level of tax understanding improves, some of the responses to the tax-attitudes questions will change.
The overall sample is overrepresented by middle age respondents and underrepresented by young respondents, relative to the overall populations in those cities. The available census data on township populations (which in many instances include rural residents) suggests that those aged 20-29 are the least represented in the survey relative to actual populations. Men tended to be more underrepresented than women in this age group. The results displayed in this paper are unweighted according to age or gender, in part due to a lack of reliable data on city populations according to age and gender, and so this should be taken into consideration when interpreting the results.
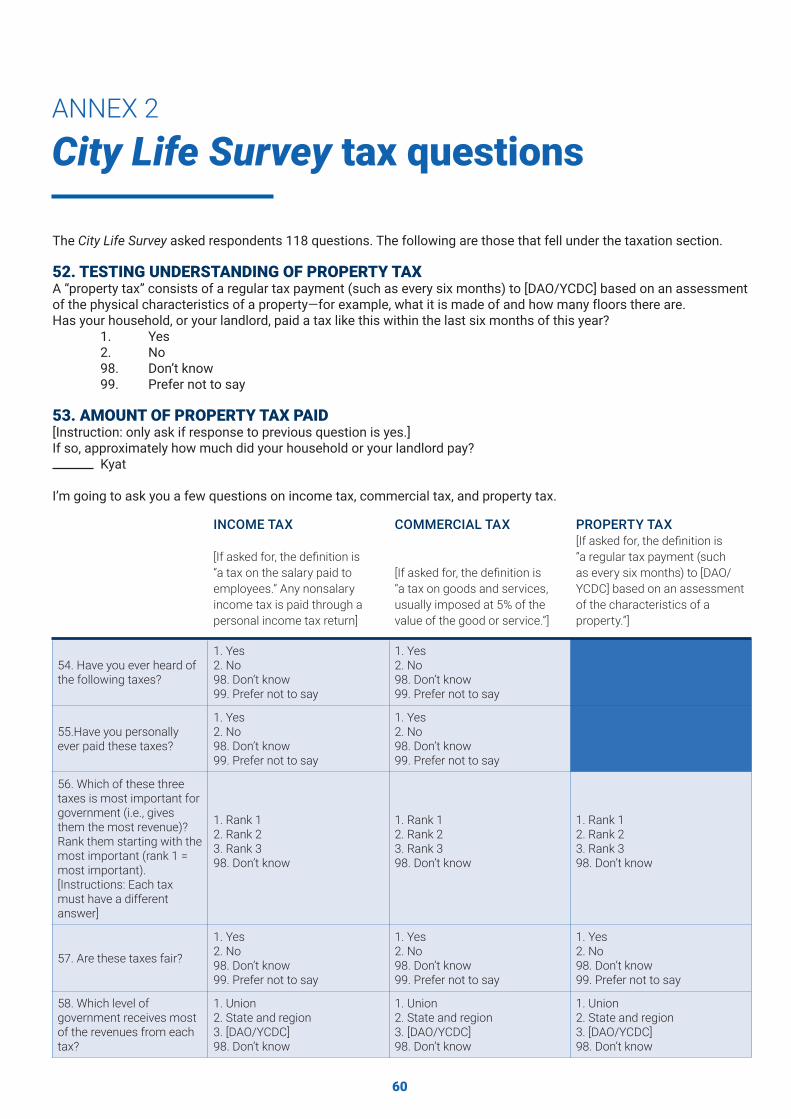
60
The City Life Survey asked respondents 118 questions. The following are those that fell under the taxation section.
52. TESTING UNDERSTANDING OF PROPERTY TAXA “property tax” consists of a regular tax payment (such as every six months) to [DAO/YCDC] based on an assessment of the physical characteristics of a property—for example, what it is made of and how many floors there are.Has your household, or your landlord, paid a tax like this within the last six months of this year? 1. Yes 2. No 98. Don’t know 99. Prefer not to say
53. AMOUNT OF PROPERTY TAX PAID[Instruction: only ask if response to previous question is yes.]If so, approximately how much did your household or your landlord pay? Kyat
I’m going to ask you a few questions on income tax, commercial tax, and property tax.
City Life Survey tax questionsANNEX 2
INCOME TAX
[If asked for, the defi nition is “a tax on the salary paid to employees.” Any nonsalary income tax is paid through a personal income tax return]
COMMERCIAL TAX
[If asked for, the defi nition is “a tax on goods and services, usually imposed at 5% of the value of the good or service.”]
PROPERTY TAX[If asked for, the defi nition is “a regular tax payment (such as every six months) to [DAO/YCDC] based on an assessment of the characteristics of a property.”]
54. Have you ever heard of the following taxes?
1. Yes2. No98. Don’t know99. Prefer not to say
1. Yes2. No98. Don’t know99. Prefer not to say
55.Have you personally ever paid these taxes?
1. Yes2. No98. Don’t know99. Prefer not to say
1. Yes2. No98. Don’t know99. Prefer not to say
56. Which of these three taxes is most important for government (i.e., gives them the most revenue)? Rank them starting with the most important (rank 1 = most important).[Instructions: Each tax must have a different answer]
1. Rank 12. Rank 23. Rank 398. Don’t know
1. Rank 12. Rank 23. Rank 398. Don’t know
1. Rank 12. Rank 23. Rank 398. Don’t know
57. Are these taxes fair?
1. Yes2. No98. Don’t know99. Prefer not to say
1. Yes2. No98. Don’t know99. Prefer not to say
1. Yes2. No98. Don’t know99. Prefer not to say
58. Which level of government receives most of the revenues from each tax?
1. Union 2. State and region3. [DAO/YCDC]98. Don’t know
1. Union 2. State and region3. [DAO/YCDC]98. Don’t know
1. Union 2. State and region3. [DAO/YCDC]98. Don’t know
61
59. FAMILIARITY WITH PROPERTY TAX BILLI’m now going to show you a document from [city DAO/YCDC]. [Instruction: display property tax receipt from relevant city DAO or YCDC].
Has your household or your landlord paid this tax within the last six months of this year? 1. Yes 2. No 98. Don’t know 99. Prefer not to say
[Instructions: record if the interviewer recognizes the document as a property tax bill]
60. AMOUNT OF PROPERTY TAX PAID[Instruction: only ask if response to previous question is yes.]If so, approximately how much did your household or your landlord pay? Kyat
61. COMMERCIAL TAX
I’m now going to show you an example bill and tax sticker. [Instruction: display example restaurant bill with tax stickers attached—point to the tax stickers.]
Have you ever paid this tax as part of ordering a good or service?
1. Yes 2. No 98. Don’t know 99. Prefer not to say
To what extent do you agree with the following statements?
STRONGLY AGREE AGREE
NEITHER AGREE NOR DISAGREE
DISAGREE STRONGLY DISAGREE
PREFER NOT TO SAY
62. It is every citizen’s civic duty to pay their fair share of taxes.
63. Citizens should always pay their taxes, even if they disagree with the government.
64. I would pay more property tax if it meant better municipal services for me and my city.
65. Most of my neighbors pay property tax.
66. Those who do not pay the required amount of property tax are punished.
62
67. PREFERENCES FOR PROGRESSIVE TAX SYSTEMIn the following exercise, I want you to imagine that you are the government collecting taxes from citizens. Imagine that all the different types of taxes are taken at once. The beans represent the incomes of three different citizens. How many beans should the government take as tax from each citizen?
[Instructions: Person A starts with eight beans, person B with four beans, person C with 16 beans. Government starts with zero beans. Instruct the interviewer to move the beans they wish to collect as taxes from the citizen boxes to the government box]
[Instructions: Record how many beans are in each box at the end of the exercise]Citizen A : beansCitizen B : beansCitizen C : beansGovernment : beans
68. TRUST IN THE USE OF TAX REVENUEHow confi dent are you that your taxes go where they are needed most? 1. Unsure 2. Neutral 3. Confi dent
To what extent do you agree with the following statements:
Citizen A Citizen B Citizen C Government
STRONGLY AGREE AGREE
NEITHER AGREE NOR DISAGREE
DISAGREE STRONGLY DISAGREE
PREFER NOT TO SAY
69. I wish I had clearer information on what taxes I am supposed to pay..
70. I wish I had more information on how the government spends taxes.
71. Paying taxes brings me merit.
63
Endnotes1. World Bank Group, Myanmar Public Expenditure Review 2017: Fiscal Space for Economic Growth, (Yangon: World
Bank, 2017).2. Defi nition from Organization for Economic Cooperation and Development (OECD), Glossary of Tax Terms,
accessed December 20, 2017, http://www.oecd.org/ctp/glossaryoftaxterms.htm.3. However, in many developing-country contexts, tax money is also diverted to serve the private interests of
government offi cials.4. David Pick, Htwe Htwe Thein, “Development failure and the resource curse: the case of Myanmar,” International
Journal of Sociology and Social Policy 30, no. 5/6 (2010): 267–279. 5. Cristina Bodea and Adrienne LeBas, The Origins of Social Contracts: Attitudes toward Taxation in Urban Nigeria,
CSAE Working Paper WPS/2013-02 (Oxford: Centre for the Study of African Economies, University of Oxford, 2013).
6. Cristina Bodea and Adrienne LeBas, The Origins of Social Contracts: Attitudes toward Taxation in Urban Nigeria, CSAE Working Paper WPS/2013-02 (Oxford: Centre for the Study of African Economies, University of Oxford, 2013).
7. Adam Burke et al., The Contested Areas of Myanmar: Subnational Conflict, Aid, and Development (Yangon: The Asia Foundation, 2017).
8. Jonathan Bogais, Myanmar: The Transition from Social Control to Social Contract, part of the essay series “Civilianizing” the State in the MENA and Asia-Pacifi c Regions (Washington, DC: Middle East Institute, 2016).
9. Funding for the MSSP is provided by the governments of the UK, Australia, and Switzerland.10. This component of MSSP is in partnership with the Renaissance Institute, a local policy institute.11. Raj Chetty, Adam Looney, and Kory Kroft, “Salience and Taxation: Theory and Evidence,” American Economic
Review 99, no. 4 (2009): 1145–1177.12. Income tax is more complicated than is suggested. It includes nonemployment income and business income
from overseas sources, with variations according to the individual’s tax residency.13. World Bank, Public Expenditure Review 2017.14. Businesses often charge the 5% to customers but do not always apply the tax stickers.15. Zaw Oo et al., Fiscal Management in Myanmar, ADB Economics Working Paper Series No. 434 (Mandaluyong City,
Philippines: Asian Development Bank, 2015).16. After income and commercial tax, all remaining taxes accounted for only 0.6% of GDP.17. World Bank, Public Expenditure Review 2017.18. This can include land or just the physical property. Approaches to property valuation vary in Myanmar, but include
building material, area, and location. Property tax tends to be collected every six months.19. Lachlan McDonald and Arkar Hein, Managing the Challenges of Rapid Urbanisation: A Review of the Existing
Property Tax System in Myanmar, (Yangon: The Renaissance Institute, 2017).20. These municipal governments are able to raise their own revenues, such as property taxes, and spend them on
urban services, such as roads, drainage, garbage-collection services, public parks, and street lights. 21. McDonald and Hein, Managing the Challenges.22. Ibid.23. Nadja Dwenger et al., “Extrinsic and Intrinsic Motivations for Tax Compliance: Evidence from a Field Experiment
in Germany,” American Economic Journal: Economic Policy 8, no. 3 (2016): 203–232. 24. Erzo F. P. Luttmer and Monica Singhal, “Tax Morale,” Journal of Economic Perspectives 28, no. 4 (Fall 2014):
149–168.25. James Mirrlees et al., Tax by Design, vol. 2 of The Mirrlees Review (Oxford: Oxford University Press, 2011).26. Ministry of Labour, Immigration, and Population, “Thematic Report on Migration and Urbanization,” Census Report
Volume 4-D in 2014 Myanmar Population and Housing Census (Ministry of Labour, Immigration, and Population, 2016).
27. In Myanmar, urban and rural are classifi ed as a distinction between an urban ward and a village tract. The City Life Survey took place in three townships in Yangon and representative wards of the urban areas of Taunggyi and Hpa-an.
28. Ministry of Labour, Immigration, and Population, “Thematic Report on Education,” Census Report Volume 4-H in 2014 Myanmar Population and Housing Census (Ministry of Labor, Immigration, and Population, 2017).
29. Matthew Arnold et al., Municipal Governance in Myanmar: An Overview of Development Affairs Organizations, Subnational Governance in Myanmar Discussion Paper Series No. 7 (Yangon: The Asia Foundation, 2015).
64
30. Data for the 2014 Myanmar Population and Housing Census can be found on the Myanmar Information Management Unit census data page, http://themimu.info/census-data (baseline data, census data, SR, district, township)
31. They were not selected at random from the full list of urban areas. They have been chosen as illustrative cites.32. Vanessa Williamson, “Paying Taxes: Understanding Americans’ Tax Attitudes,” doctoral dissertation, Harvard
University, Graduate School of Arts and Sciences, 2015.33. Mirlees et al., Tax by Design.34. Keith Walsh, “Understanding Taxpayer Behaviour—New Opportunities for Tax Administration,” Economic and
Social Review 43, no. 3 (Autumn 2012).35. Vanessa Williamson, “Paying Taxes: Understanding Americans’ Tax Attitudes,” doctoral dissertation, Harvard
University, Graduate School of Arts and Sciences, 2015.36. Not all urban areas appear to add up to 100%. This is because the fi gures are rounded to the nearest whole
number.37. Htoo Thant, “Gov’t to Collect More Commercial Tax,” Myanmar Times, July 18, 2017. 38. In Myanmar, fi rms may be formal in some respects but not others. For instance, anecdotal evidence from
Taunggyi, Hpa-an, and Yangon suggests that most businesses receive a license to operate from the DAO. But this does not imply that they are fully compliant with IRD rules for the payment of commercial tax.
39. McDonald and Hein, Managing the Challenges.40. This count of properties was undertaken in Taunggyi’s smallest ward as part of the MSSP program.41. World Bank, Public Expenditure Review 2017.42. McDonald and Hein, Managing the Challenges.43. DAOs and the YCDC collect all property tax revenues. At the end of the year, unspent revenues are transferred to
the states and regions and then the Union government. 44. McDonald and Hein, Managing the Challenges.45. One interpretation of these fi ndings is that respondents used a broad defi nition of punishment and considered
actions such as a verbal warning from a tax collector as punishment.46. Luttmer and Singhal, “Tax Morale.”47. Htin Lynn Aung, “New rules, incentives will boost taxpayer numbers,” Myanmar Times, November 7, 2017.48. Interview with a Taunggyi DAO offi cial on October 18, 2017. 49. Interview with a YCDC offi cial from the City Planning and Land Administration Department on October 30, 2017. 50. Interview with a YCDC offi cial from the Assessor’s Department on October 26, 2017. 51. Meeting with Mayor of Yangon, YCDC offi cials, Renaissance Institute and The Asia Foundation on June 19, 2017.52. Interview with an IRD offi cial in Taunggyi on September 14, 2017. 53. Htoo Thant, “Speaker urges review of 5pc telco tax,” Myanmar Times, April 4, 2016.54. Ibid. 55. Taungoo Township, in northeast Bago Region, and Thandaungyi Township were selected for their geographical
proximity but different historical experiences of varying levels of government control and contestation. The sample was stratifi ed to be composed of 40% urban respondents and 60% rural respondents.
56. Walsh, “Understanding Taxpayer Behavior.”57. Constitution of the Republic of the Union of Myanmar (2008) (Nay Pyi Taw: Ministry of Information, September
2008), http://www.wipo.int/edocs/lexdocs/laws/en/mm/mm009en.pdf. 58. The City Life Survey asked respondents, “To what extent to you agree with the following statement—it is every
citizen’s civic duty to pay their fair share of taxes.” “Civic duty” was translated into Myanmar as “pyithu tarwun,” which roughly translates to the duty (tarwun) of someone who resides within the state (pyithu).
59. We cannot verify what impact the campaign has already had, but it is clear from these results that continuing the focus on “tax is a duty” is unlikely to be of much value in cities like those surveyed.
60. Gerard McCarthy, “Duty isn’t enough to boost tax revenue,” Myanmar Times, September 19, 2016. 61. The same survey found that this was consistent across party lines, with 79% of Trump supporters regarding
paying taxes as a “civic duty.”62. CNN and ORC International, 2016 Presidential Race Poll (CNN and ORC International, October 3, 2016).63. The exact wording used is different, but the report authors describe it as a “civic duty” question.64. Thomas Isbell, Tax compliance: Africans affi rm civic duty but lack trust in tax department, Afrobarometer Policy
Paper No. 43 (Afrobarometer, December 2017).65. The NLD won 77% of contested seats, compared to 10% for the incumbent Union Solidarity and Development
Party. See Guy Dinmore and Wade Guyitt, “Final results confi rm scale of NLD election victory,” Myanmar Times, November 23, 2015.
66. Bodea and LeBas, Origins of Social Contracts.67. Ibid.68. The question “citizens should always pay their taxes, even if they disagree with the government” is a measure of
the government’s unconditional right to tax.
65
69. Gerard McCarthy, Building on what’s there: Insights on social protection and public goods provision from central-east Myanmar, Working Paper S-53308-MYA-2 (Yangon: International Growth Centre, 2016)
70. Ibid.71. Isbell, Tax compliance.72. Areas where there is competition for authority over territory, resources, and the local population.73. Mick Moore and Wilson Prichard, How Can Governments of Low-Income Countries Collect More Tax Revenue?
ICTD Working Paper 70 (Brighton, UK: Institute of Development Studies, 2017).74. Williamson, “Paying Taxes.”75. In Myanmar, however, the poorest are less likely to be involved in a transaction where commercial tax is actually
applied, implying that, overall, commercial tax is not as regressive as it might fi rst seem.76. Property values are an imperfect proxy for income77. McDonald and Hein, Managing the Challenges.78. James Mirrlees, Stuart Adam, Tim Besley, Richard Blundell, Stephen Bond, Robert Chote, Malcolm Gammie, Paul
Johnson, Gareth Myles, and James M. Poterba. Tax by Design. Vol. 2 of The Mirrlees Review. Oxford: Oxford University Press, 2011.
79. In Taunggyi, we have less confi dence in how respondents were guided through this question by enumerators. A large number of respondents (over 40%) chose not to answer the question. Three respondents wanted some citizens to pay all but one bean each, suggesting they misunderstood the question (or just have a very strong preference for socialism).
80. We can compute GDP using the “income approach” by simply adding up the incomes of the three individuals.81. McCarthy, Building on what’s there.82. Ibid.83. Ibid. 84. The typical (median) property-tax payment in Yangon is MMK 203 (less than USD 0.20), and so in most cases
such an action would be a poor use of society’s resources.85. Williamson, “Paying Taxes.”86. Ibid.87. Ibid.88. Tax understanding is so low in Myanmar that in most cases it is premature to talk about citizens having specifi c
policy preferences.89. Abubakari Abdul-Razak and Christopher Jwayire Adafula, “Evaluating taxpayers’ attitude and its influence on tax
compliance decisions in Tamale, Ghana,” Journal of Accounting and Taxation 5, no. 3 (September 2013): 48–57.90. Many other factors likely influence tax attitudes, but these have been identifi ed by the literature as important, with
modifi cations, for the Myanmar context.91. Williamson, “Paying Taxes.”92. Evan S. Lieberman and Gwyneth H. McClendon, “The Ethnicity–Policy Preference Link in Sub-Saharan Africa,”
Comparative Political Studies 46, no. 5 (2012): 574–602.93. Luttmer and Singhal, “Tax Morale.”94. Amartya Sen, Identity and Violence: The Illusion of Destiny (New York: W.W. Norton & Company, 2006).95. Lisa Anderson, Jennifer Mellor, and Jeffrey Milyo, “Inequality and public good provision: An experimental
analysis,” Journal of Behavioral and Experimental Economics [formerly the Journal of Socio-Economics] 37, no. 3 (2008): 1010–1028.
96. Sen, Identity and Violence.97. Burke, Contested Areas of Myanmar, 20.98. Thomas J. Rudolph and Jillian Evans, “Political Trust, Ideology, and Public Support for Government Spending,”
American Journal of Political Science 49, no. 3 (July 2005): 660–671.99. Center for Insights in Survey Research, “Survey of Burma/Myanmar Public Opinion, March 9–April 1, 2017,”
website of the International Republican Institute, http://www.iri.org/sites/default/fi les/flip_docs/2014%20April%203%20Survey%20of%20Burma%20Public%20Opinion,%20December%2024,%202013-February%201,%202014.pdf.
100. McCarthy, Building on what’s there.101. Burke, Contested Areas of Myanmar.102. Jared Bissenger, Local Economic Governance in Myanmar (Yangon: The Asia Foundation, 2017).103. McCarthy, Building on what’s there.104. Williamson, “Paying Taxes.”105. Karla Pequenino, “Myanmar again named world’s most generous country,” CNN, October 26, 2016.106. McCarthy, Building on what’s there.107. William G. Gale, Tax Simplifi cation: Issues and Options, testimony submitted to the U.S. House of Representatives,
Committee on Ways and Means, Subcommittee on Oversight, Subcommittee on Select Revenue Estimates, July 17, 2001.
66
108. Walsh, “Understanding Taxpayer Behavior.”109. These are drawn from The Asia Foundation’s experience of working with property-tax collectors in Taunggyi, Hpa-
an, Pathein, and Myaungmya. These fi ndings are documented in McDonald and Hein, Managing the Challenges.110. This is a result of the small amount of tax collected—the equivalent in value, on average, of two cups of tea each
six months in Taunggyi—and incentives within the DAO to ensure that all collection targets are met. 111. McDonald and Hein, Managing the Challenges.112. Williamson, “Paying Taxes.”113. Phyo Wai Kyaw, “Sentiment in Mandalay property sector dampened by high tax rates,” Myanmar Times, August 8,
2017.114. Williamson, “Paying Taxes.”115. “Social media” refers to online platforms that enable easier communication between networks of people.116. Center for Insights in Survey Research, “Survey of Burma/Myanmar Public Opinion.”117. Political parties (apart from those in elected roles, such as MPs) are considered “other sources of information.”118. McCarthy, Building on what’s there.119. These groups often play a more direct role in getting information to citizens (i.e., the information does not pass
through the media) than is suggested in this simplifi ed model. 120. World Bank Group, World Development Report 2015: Mind, Society, and Behavior (Washington, DC: World Bank
Group, 2014).121. David Halpern et al., MINDSPACE: Influencing behaviour through public policy (London: Institute for Government,
2010).122. Interview with an IRD offi cial in Taunggyi on September 14, 2017.123. This prioritization is in line with IRD’s sequencing of tax reforms, with an initial focus on increasing compliance
among the largest taxpayers, such as through the establishment of the Large Taxpayers Offi ce.124. Interview with IMF offi cial on November 7, 2017.125. Interview with IMF offi cial on November 7, 2017.126. YCDC website, “Frequently Asked Questions & Answers,” question 21, accessed December 29, 2017,
http://www.ycdc.gov.mm/mobile_pages.php?pagename=FAQ. 127. For many people in Myanmar, Facebook is the Internet.128. Walsh, “Understanding Taxpayer Behavior.”129. Myat Noe Oo, “‘Tax on talking’ sparks backlash,” Myanmar Times, May 22, 2015.130. Thant, “Speaker urges review.”131. Ibid.132. Hpa-an SEA Report, pg. 50 (2017)133. Japan International Cooperation Agency (JICA) and Yangon City Development Committee, A Strategic Urban
Development Plan of Greater Yangon, Final Report (Yangon: JICA, 2013).134. Ibid.135. Ibid.136. Ibid.137. Since one-tenth of the population lives in the Yangon area, more samples were drawn from Hpa-an and Taunggyi,
and the sample size from Tharkata and North Dagon was reduced. 138. This population data differs from that which can be calculated from the 2014 census.139. Quality controls were implemented throughout the data-collection process, with a total of 22% of the interviews
subject to either direct observation or a return visit or phone call.140. They were not selected at random from the full list of urban areas. They have been chosen as illustrative cites.141. Williamson, “Paying Taxes.”
67
BibliographyAbdul-Razak, Abubakari, and Christopher Jwayire Adafula. “Evaluating taxpayers’ attitude and its influence on tax
compliance decisions in Tamale, Ghana.” Journal of Accounting and Taxation 5, no. 3 (September 2013): 48–57. http://www.academicjournals.org/journal/JAT/article-abstract/ED937DB41302.
Anderson, Lisa, Jennifer Mellor, and Jeffrey Milyo. “Inequality and public good provision: An experimental analysis.” Journal of Behavioral and Experimental Economics [formerly the Journal of Socio-Economics] 37, no. 3 (2008): 1010–1028. https://doi.org/10.1016/j.socec.2006.12.073.
Arnold, Matthew, Ye Thu Aung, Susanne Kempel, and Kyi Pyar Chit Saw. Municipal Governance in Myanmar: An Overview of Development Affairs Organizations. Subnational Governance in Myanmar Discussion Paper Series No. 7. Yangon: The Asia Foundation, 2015. https://asiafoundation.org/publication/municipal-governance-in-myanmar/.
Aung, Htin Lynn. “New rules, incentives will boost taxpayer numbers.” Myanmar Times, November 7, 2017. https://www.mmtimes.com/news/new-rules-incentives-will-boost-taxpayer-numbers.html.
Bissenger, Jared. Local Economic Governance in Myanmar. Yangon: The Asia Foundation, 2017. https://asiafoundation.org/publication/local-economic-governance-in-myanmar/.
Bodea, Cristina, and Adrienne LeBas. The Origins of Social Contracts: Attitudes toward Taxation in Urban Nigeria. CSAE Working Paper WPS/2013-02. Oxford: Centre for the Study of African Economies, University of Oxford, 2013. https://ideas.repec.org/p/csa/wpaper/2013-02.html.
Bogais, Jonathan. Myanmar: The Transition from Social Control to Social Contract. Part of the essay series “Civilianizing” the State in the MENA and Asia-Pacifi c Regions. Washington, DC: Middle East Institute, 2016. http://www.mei.edu/content/map/myanmar-transition-social-control-social-contract.
Burke, Adam, Nicola Williams, Patrick Barron, Kim Jolliffe, and Thomas Carr. The Contested Areas of Myanmar: Subnational Conflict, Aid, and Development. Yangon: The Asia Foundation, 2017. https://asiafoundation.org/publication/contested-areas-myanmar-subnational-conflict-aid-development/.
Center for Insights in Survey Research. “Survey of Burma/Myanmar Public Opinion, March 9–April 1, 2017.” Website of the International Republican Institute. http://www.iri.org/sites/default/fi les/2017-8-22_burma_poll_english.pdf.
Chetty, Raj, Adam Looney, and Kory Kroft. “Salience and Taxation: Theory and Evidence.” American Economic Review 99, no. 4 (2009): 1145–1177. https://www.aeaweb.org/articles?id=10.1257/aer.99.4.1145.
CNN and ORC International. 2016 Presidential Race Poll. CNN and ORC International, October 3, 2016. http://i2.cdn.turner.com/cnn/2016/images/10/03/2016.race.pdf.
Constitution of the Republic of the Union of Myanmar (2008). Nay Pyi Taw: Ministry of Information, September 2008. http://www.wipo.int/edocs/lexdocs/laws/en/mm/mm009en.pdf.
Dinmore, Guy, and Wade Guyitt. “Final results confi rm scale of NLD election victory.” Myanmar Times, November 23, 2015. https://www.mmtimes.com/national-news/17747-fi nal-results-confi rm-scale-of-nld-election-victory.html.
Dwenger, Nadja, Henrik Kleven, Imran Rasul, and Johannes Rincke. “Extrinsic and Intrinsic Motivations for Tax Compliance: Evidence from a Field Experiment in Germany.” American Economic Journal: Economic Policy 8, no. 3 (2016): 203–232. https://www.aeaweb.org/articles?id=10.1257/pol.20150083.
Gale, William G. Tax Simplifi cation: Issues and Options. Testimony submitted to the U.S. House of Representatives, Committee on Ways and Means, Subcommittee on Oversight, Subcommittee on Select Revenue Estimates, July 17, 2001. https://www.brookings.edu/testimonies/tax-simplifi cation-issues-and-options/.
68
Halpern, David, Dominic King, Ivo Vlaev, Michael Hallsworth, and Paul Dolan. MINDSPACE: Influencing behaviour through public policy. (London: Institute for Government, 2010). https://www.instituteforgovernment.org.uk/publications?fi eld_themes_tid=All&fi eld_themes_tid=All&sort_bef_combine=fi eld_publication_date_value+DESC&fi eld_publication_date_preset=All&combine=influencing+behaviour+through+public+policy&fi eld_publication_authors_nid=All.
Isbell, Thomas. Tax compliance: Africans affi rm civic duty but lack trust in tax department. Afrobarometer Policy Paper No. 43. Afrobarometer, December 2017. http://www.afrobarometer.org/publications/pp43-tax-compliance-africans-affi rm-civic-duty-lack-trust-tax-department.
Japan International Cooperation Agency (JICA) and Yangon City Development Committee. A Strategic Urban Development Plan of Greater Yangon. Final Report. Yangon: JICA, 2013. http://open_jicareport.jica.go.jp/pdf/12122511.pdf.
Kyaw, Phyo Wai. “Sentiment in Mandalay property sector dampened by high tax rates.” Myanmar Times, August 8, 2017. http://www.mmtimes.com/index.php/business/property-news/27158-sentiment-in-mandalay-property-sector-dampened-by-high-tax-rates.html.
Lieberman, Evan S., and Gwyneth H. McClendon. “The Ethnicity–Policy Preference Link in Sub-Saharan Africa.” Comparative Political Studies 46, no. 5 (2012): 574–602. https://doi.org/10.1177/0010414012463876.
Luttmer, Erzo F. P., and Monica Singhal. “Tax Morale.” Journal of Economic Perspectives 28, no. 4 (Fall 2014): 149–168. https://www.aeaweb.org/articles?id=10.1257/jep.28.4.149.
McCarthy, Gerard. Building on what’s there: Insights on social protection and public goods provision from central-east Myanmar. Working Paper S-53308-MYA-2. Yangon: International Growth Centre, 2016. https://www.theigc.org/person/gerard-mccarthy/.
McCarthy, Gerard. “Duty isn’t enough to boost tax revenue.” Myanmar Times, September 19, 2016. https://www.mmtimes.com/opinion/22597-duty-isn-t-enough-to-boost-tax-revenue.html.
McDonald, Lachlan, and Arkar Hein. Managing the Challenges of Rapid Urbanisation: A Review of the Existing Property Tax System in Myanmar. Yangon: The Renaissance Institute, 2017. https://rimyanmar.org/en/publication/managing-challenges-rapid-urbanisation-review-existing-property-tax-system-myanmar-0.
Ministry of Labour, Immigration, and Population. “Thematic Report on Education.” Census Report Volume 4-H in 2014 Myanmar Population and Housing Census. Ministry of Labor, Immigration, and Population, 2017.
https://reliefweb.int/sites/reliefweb.int/fi les/resources/4H_Education_web_12june_3.pdf.
Ministry of Labour, Immigration, and Population. “Thematic Report on Migration and Urbanization.” Census Report Volume 4-D in 2014 Myanmar Population and Housing Census. Ministry of Labor, Immigration, and Population, 2016. http://myanmar.unfpa.org/sites/default/fi les/pub-pdf/Migration_insidepages_FINAL_lowrespreview.pdf.
Ministry of Labour, Immigration, and Population. The 2014 Myanmar Population and Housing Census. Ministry of Labor, Immigration, and Population, 2016. http://themimu.info/sites/themimu.info/fi les/documents/BaselineData_Census_Dataset_SR_District_Township_MIMU_16Jun2016_ENG.xlsx.
Mirrlees, James, Stuart Adam, Tim Besley, Richard Blundell, Stephen Bond, Robert Chote, Malcolm Gammie, Paul Johnson, Gareth Myles, and James M. Poterba. Tax by Design. Vol. 2 of The Mirrlees Review. Oxford: Oxford University Press, 2011. https://www.ifs.org.uk/publications/5353.
Moore, Mick, and Wilson Prichard. How Can Governments of Low-Income Countries Collect More Tax Revenue? ICTD Working Paper 70. Brighton, UK: Institute of Development Studies, 2017. http://www.ictd.ac/publication/2-working-papers/187-how-can-governments-of-low-income-countries-collect-more-tax-revenue.
Oo, Myat Noe. “‘Tax on talking’ sparks backlash.” Myanmar Times, May 22, 2015. https://www.mmtimes.com/business/technology/14625-tax-on-talking-sparks-backlash.html.
69
Oo, Zaw, Cindy Joelene, Paul Minoletti, Phoo Pwint Phyu, Kyi Pyar Chit Saw, Ngu Wah Win, Ian Porter, Mari Oye, and Andrea Smurra. Fiscal Management in Myanmar. ADB Economics Working Paper Series No. 434. Mandaluyong City, Philippines: Asian Development Bank, 2015. https://www.adb.org/publications/fi scal-management-myanmar.
Organization for Economic Cooperation and Development (OECD). Glossary of Tax Terms. Accessed December 20, 2017. http://www.oecd.org/ctp/glossaryoftaxterms.htm.
Pequenino, Karla. “Myanmar again named world’s most generous country.” CNN, October 26, 2016. http://edition.cnn.com/2016/10/26/world/world-generosity-index-caf-2016/index.html.
Pick, David, and Htwe Htwe Thein. “Development failure and the resource curse: the case of Myanmar.” International Journal of Sociology and Social Policy 30, no. 5/6 (2010): 267–279. https://doi.org/10.1108/01443331011054235.
Rudolph, Thomas J., and Jillian Evans. “Political Trust, Ideology, and Public Support for Government Spending.” American Journal of Political Science 49, no. 3 (July 2005): 660–671. https://www.jstor.org/stable/3647738?seq=1#page_scan_tab_contents.
Sen, Amartya. Identity and Violence: The Illusion of Destiny. New York: W.W. Norton & Company, 2006.
Thant, Htoo. “Gov’t to Collect More Commercial Tax.” Myanmar Times, July 18, 2017. https://www.mmtimes.com/business/26854-gov-t-to-collect-more-commercial-tax.html.
Thant, Htoo. “Speaker urges review of 5pc telco tax.” Myanmar Times, April 4, 2016. https://www.mmtimes.com/business/technology/19814-speaker-urges-review-of-5pc-telco-tax.html.
Walsh, Keith. “Understanding Taxpayer Behaviour—New Opportunities for Tax Administration.” Economic and Social Review 43, no. 3 (Autumn 2012): 451–475. https://www.revenue.ie/en/corporate/documents/research/understanding-taxpayer-behaviour.pdf.
Williamson, Vanessa. “Paying Taxes: Understanding Americans’ Tax Attitudes.” Doctoral dissertation, Harvard University, Graduate School of Arts and Sciences, 2015. http://nrs.harvard.edu/urn-3:HUL.InstRepos:17464404.
World Bank Group. Myanmar Public Expenditure Review 2017: Fiscal Space for Economic Growth. Yangon: World Bank, 2017. http://www.worldbank.org/en/country/myanmar/publication/myanmar-public-expenditure-review-2017.
World Bank Group. World Development Report 2015: Mind, Society, and Behavior. Washington, DC: World Bank Group, 2014. http://www.worldbank.org/en/publication/wdr2015.
70
HEADQUARTERS 465 California Street, 9th Floor | San Francisco, CA 94104 USA
Tel: 415-982-4640 | [email protected]
MYANMAR No. 11, Ko Min Ko Chin Yeik Thar Street | Bahan Township
Yangon, Myanmar | Tel: [email protected]
www.asiafoundation.org