Embed Size (px)
Citation preview
IberoamericanJournalofIndustrialEngineering,Florianópolis,SC,Brasil,v.8,n.16,p.196-211,2016.
AVALIATION OF CARBON CREDITS ON SUGARCANE INDUSTRIES: PROPOSED METHODOLOGY AND CASE STUDY IN NORTHEAST BRAZIL
Miguel Otavio B C. Melo1 Bruno L.Vilar2 Luiz G. Cabral3
Ricardo M. Silva4 Marcia B. Fonseca5
ABSTRACT: The market for Carbon Credits presents itself as a source of obtaining financing for agribusiness industries, providing a new source of financial operations capable of generating an expansion of cash flow. These financial resources could be via marketing products through the use of Green Marketing, or simply employing aspects of social and environmental responsibility. The main companies in Brazil are the sugar mills, paper, pulp, timber accompanied to a lesser extent by government initiatives. Even registering a considerable amount of negotiation is still a largely unexplored market for the sugarcane and the alcohol sector. The purpose of this paper is to present a methodology for evaluation of carbon credits in the sugarcane industry estimating the financial potential of these projects, and present a case study in Northeast Brazil. There is a potential volume of carbon credits the company's annual turnover U$ 170 million in the case study analysed. Keywords: Clean Development Mechanism. Carbon Credits. Sustainability in the sugarcane industries. Energy Efficiency.
1Center University UNITA. Av. Portugal, 584, Caruaru, PE, Brazil. E-mail: [email protected] 2Federal University of Paraiba, Cidade Universitária, João Pessoa, PB, Brazil. E-mail: [email protected] 3Center University UNITA. Av. Portugal, 584, Caruaru, PE, Brazil. E-mail: [email protected] 4Federal University of Paraiba, Cidade Universitária, João Pessoa – PB, Brazil. E-mail: [email protected] 5Federal University of Paraiba. Cidade Universitária, João Pessoa – PB, Brazil. E-mail: [email protected]
IberoamericanJournalofIndustrialEngineering,Florianópolis,SC,Brasil,v.8,n.16,p.196-211,2016.
197
1 INTRODUCTION
In the last century the scientific community has initiated a series of studies and
debates on consumption of fossil fuels in the context of climate change. The earth poles
regions suffer strongly from the destruction of the ozone layer since they lose a big part of
their ice caps that are important for biodiversity and for the control of sea levels. The main
target is to reduce global CO2 emissions to 3.7 Gt/a in 2050, thus limiting global average
temperature increase to below 2°C (TESKE et al., 2011). In the last decade many researches
were realized about technical processes to CO2 reduction in many countries like German,
USA, Swedish, Netherlands (SANDS; SCHUMAKER, 2009; MILLS; JACOBSON, 2011;
MLENICL, 2012; MARTINEZ; SILVEIRA, 2013; ROSENOW, 2013). Many sectors of
activities like vehicles, building, illumination and transport were analysed and also the
definition of zero carbon ( ÜRGE-VORSATZ et al., 2009; RAUX, 2010; RAUX et al., 2010,
MILLS, 2011; BERRY et al., 2013).
Due to this problem the United Nations established in 2008 the Kyoto Protocol. This
protocol determines the creation of three flexible mechanisms, which aims to assist countries
in meeting their goals. The first mechanism is about the Emissions Trading Scheme in which
a country attending the Protocol to achieve a reduction in emissions to a level below its target
can transfer their surplus carbon credits to another country that has not achieved the same
goal. The second was the Clean Development Mechanism (CDM) which seeks to encourage
investments in developed countries considered in developping nations by buying direct credit
or finance projects to capture Greenhouse Gas Emissions (GGE) (GIOMETTI et al., 2008).
The carbon Credits providing a new source of financial operations capable of
generating an expansion of cash flow via marketing products through the use of green
marketing or simply employing aspects of environmental responsibility (GALLAHER et al.,
2009)
In Brazil this market is the sugar, paper, pulp, timber and plants in general, followed
to a lesser extent by government initiatives like the substitution of refrigerators and energy
efficiency industrial studies (VENDRUSCULO; QUEIROZ, 2009; MELO et al., 2012).
According to the ecosystem marketplace in 2010 the trading volume of carbon credits in the
IberoamericanJournalofIndustrialEngineering,Florianópolis,SC,Brasil,v.8,n.16,p.196-211,2016.
198
world was US$ 114,3 million and it still a largely unexplored market for the sugarcane sector
in Brazil (ECOSYSTEM, 2012).
The aim of this paper is to present a methodology for evaluation of carbon credits in
the sugarcane industry estimating the financial potential of these projects and present a case
study in Northeast Brazil.
2 THEORETICAL ANALYSIS
The nomenclature of carbon credits was adopted because of the gases such as methane
(CH4), nitrous oxide (N2O), sulfur hexafluoride (SF6) and the families of carbides and hydro-
fluoro-carbons (HFCs) in ton of carbon dioxide (CO2). Each kind of gas is equivalent to an
amount of CO2. It is used as a carbon dioxide equivalent converter in which the variation
depends on the degree of difficulty of absorption of the gas by the proposed project,
structured according to the Kyoto Protocol. HCs emerged with the purpose to solve the
externalities interventions generated by human actions on the environment. The following
section will explain how this process took place.
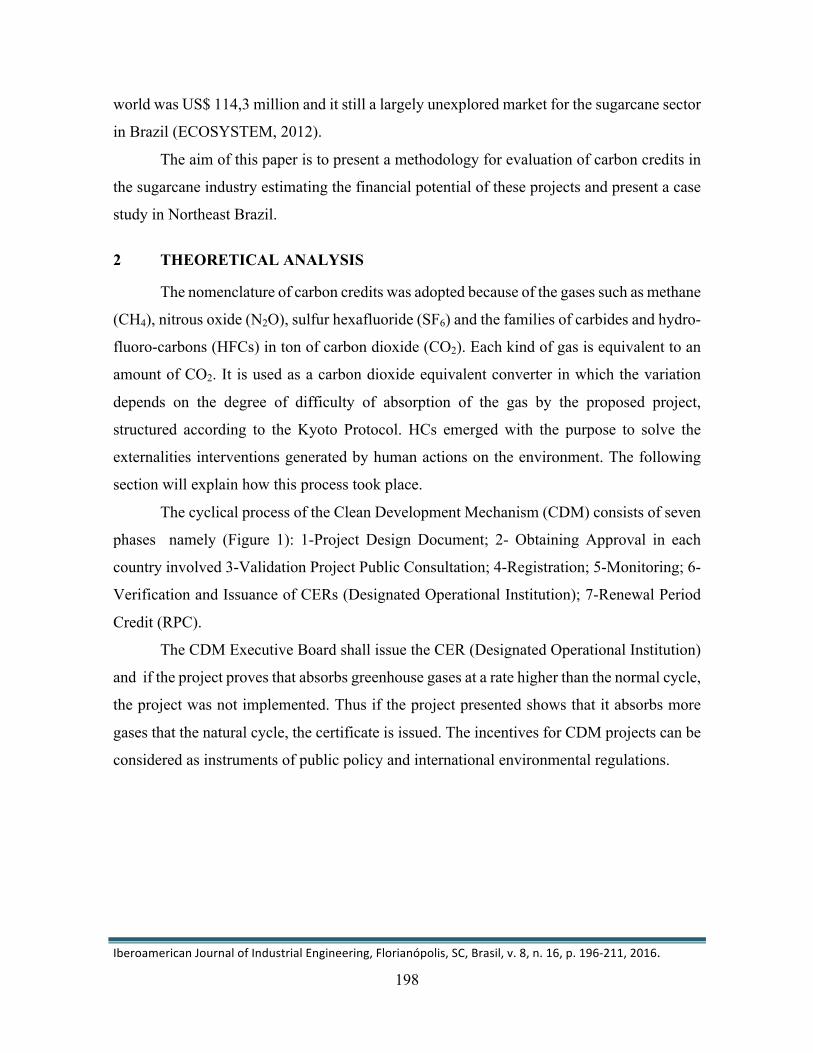
The cyclical process of the Clean Development Mechanism (CDM) consists of seven
phases namely (Figure 1): 1-Project Design Document; 2- Obtaining Approval in each
country involved 3-Validation Project Public Consultation; 4-Registration; 5-Monitoring; 6-
Verification and Issuance of CERs (Designated Operational Institution); 7-Renewal Period
Credit (RPC).
The CDM Executive Board shall issue the CER (Designated Operational Institution)
and if the project proves that absorbs greenhouse gases at a rate higher than the normal cycle,
the project was not implemented. Thus if the project presented shows that it absorbs more
gases that the natural cycle, the certificate is issued. The incentives for CDM projects can be
considered as instruments of public policy and international environmental regulations.
IberoamericanJournalofIndustrialEngineering,Florianópolis,SC,Brasil,v.8,n.16,p.196-211,2016.
199
Figure 1 – Flow of Clean Development Mechanism (CDM) Source: Carbon Marketwatch, 2010.
Due to the creation of this instrument, we sought to induce in the productive sector
best practices of Greenhouse Gas Emissions (GGE) reduction and encourage the
development of the securities market. Thus, for the actual functioning of the market as well
as to encourage new competitors, it is necessary to integrate this mechanism with other policy
instruments, both nationally (federal, state and municipal) and internationally.
According to Seiffert (2009) the entire process of issuance of CERs has a similarity
with the certification of management systems according to the normative model of the
International for Standardization Organizations (ISO). Thus, different agents are directly and
indirectly involved with the project approval, in order to maintain the credibility of the entire
certification process of Carbon Credits.
Step 1 - Project Design Document
Step 2 - Obtaining Approval in Each Country Involved
Step 3 - Validation Project Public Consultation
Step 4: Registration; (CDM Executive Council )
Step 5 - Monitoring
Step 6 - Verification and Issuance of CERs (Designated Operational institution)
Step7 -: Renewal Period Credit (RPC)
IberoamericanJournalofIndustrialEngineering,Florianópolis,SC,Brasil,v.8,n.16,p.196-211,2016.
200
2.1 Market Profile of Carbon Credits
According to the report State of the Voluntary Carbon Markets 2012, in 2011 the
transactions of carbon credits in the voluntary market reached a turnover of $ 576 million,
second only to the year 2008, when it negotiated a volume of US$ 776 million
(ECOSYSTEM MARKETPLACE, 2012). According to the UN Convention on Climate
Change (UNFCCC), the average growth rate of the number of validated projects is 14 % per
year in the timeline of the last five years.
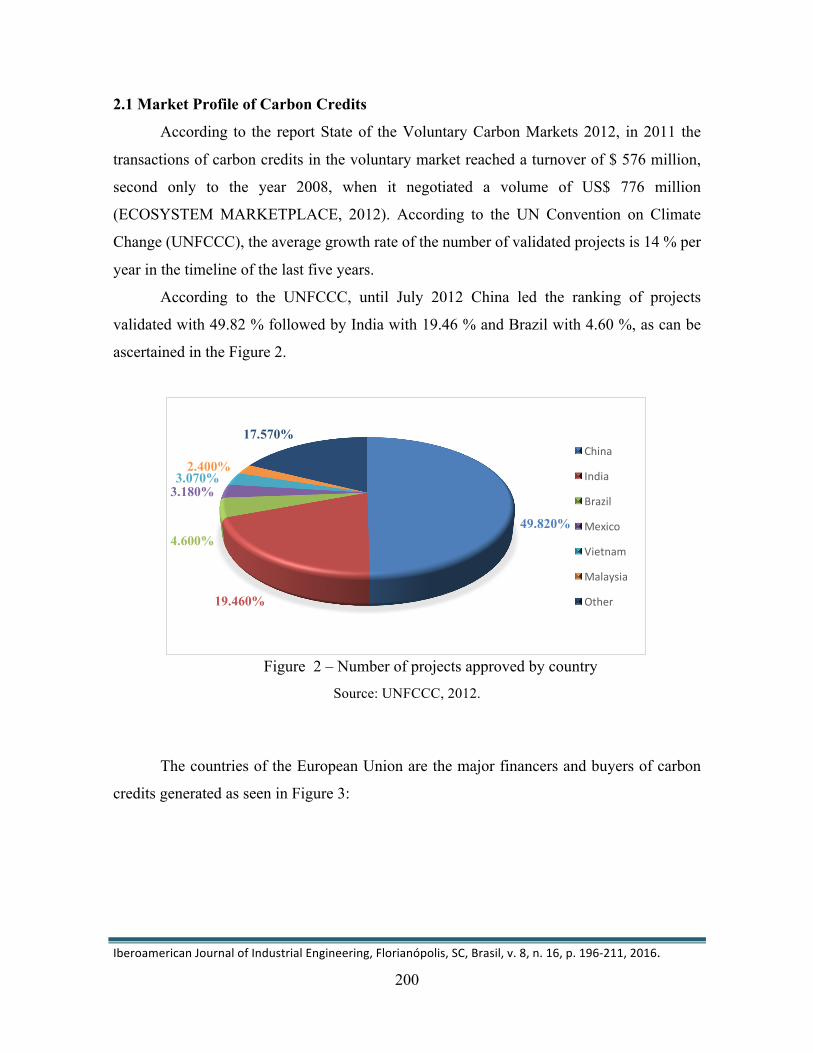
According to the UNFCCC, until July 2012 China led the ranking of projects
validated with 49.82 % followed by India with 19.46 % and Brazil with 4.60 %, as can be
ascertained in the Figure 2.
Figure 2 – Number of projects approved by country
Source: UNFCCC, 2012.
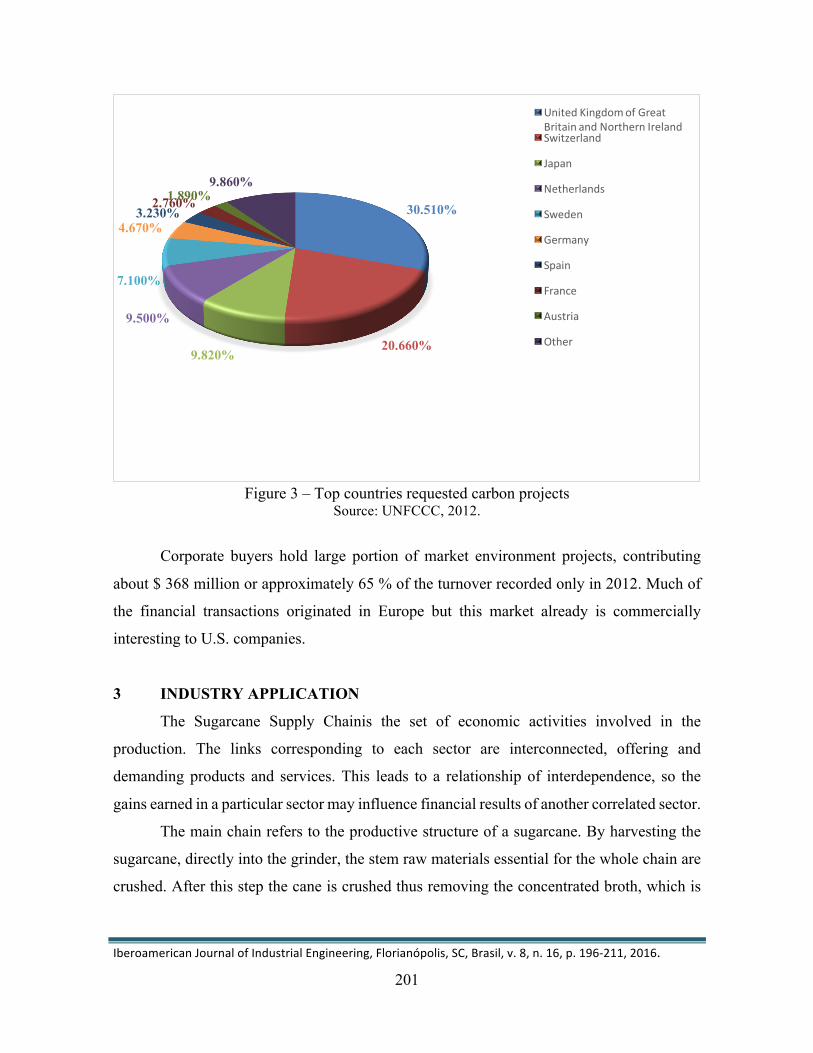
The countries of the European Union are the major financers and buyers of carbon
credits generated as seen in Figure 3:
49.820%
19.460%
4.600%
3.180%3.070%
2.400%
17.570%China
India
Brazil
Mexico
Vietnam
Malaysia
Other
IberoamericanJournalofIndustrialEngineering,Florianópolis,SC,Brasil,v.8,n.16,p.196-211,2016.
201
Figure 3 – Top countries requested carbon projects
Source: UNFCCC, 2012.
Corporate buyers hold large portion of market environment projects, contributing
about $ 368 million or approximately 65 % of the turnover recorded only in 2012. Much of
the financial transactions originated in Europe but this market already is commercially
interesting to U.S. companies.
3 INDUSTRY APPLICATION
The Sugarcane Supply Chainis the set of economic activities involved in the
production. The links corresponding to each sector are interconnected, offering and
demanding products and services. This leads to a relationship of interdependence, so the
gains earned in a particular sector may influence financial results of another correlated sector.
The main chain refers to the productive structure of a sugarcane. By harvesting the
sugarcane, directly into the grinder, the stem raw materials essential for the whole chain are
crushed. After this step the cane is crushed thus removing the concentrated broth, which is
30.510%
20.660%9.820%
9.500%
7.100%
4.670%3.230%
2.760%1.890%9.860%
UnitedKingdomofGreatBritainandNorthernIrelandSwitzerland
Japan
Netherlands
Sweden
Germany
Spain
France
Austria
Other
IberoamericanJournalofIndustrialEngineering,Florianópolis,SC,Brasil,v.8,n.16,p.196-211,2016.
202
directed to the boil resulting in honey. This generates sugar, as well as produce by-product:
molasses or honey (HIRATSUKA, 2009).
Finally, the chain originates downstream for the majority of by-products in the main
chain. This has achieved considerable diversity in recent years, such as organic fertilizer or
vinasse originating segregation of sugar and alcohol. Another consequence is the filter cake,
residue from the manufacturing process of sugar. However, within the main chain there is a
noticeable segregation in two systems: agriculture and industrial.
3.1 Agricultural Process
According to Oliveira et al., (2011) the planning of activities to be implemented in
the culture of sugar cane should range from planting to harvesting by considering primordial
future economic exploitation.
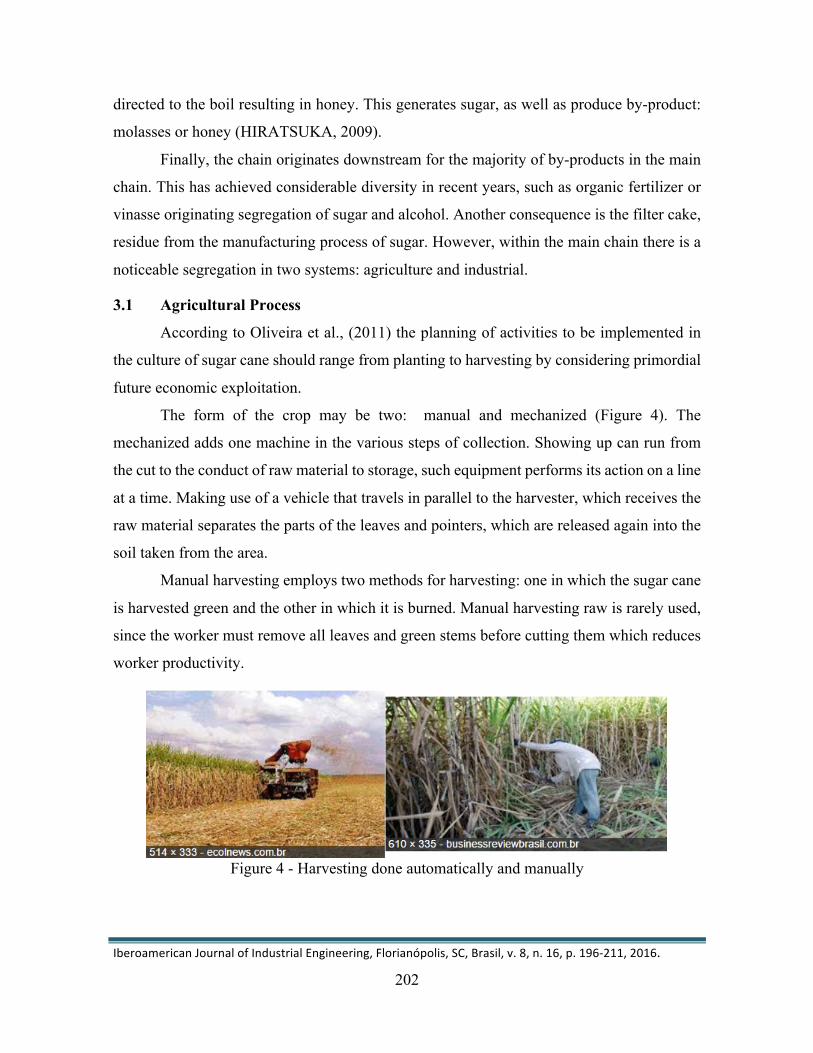
The form of the crop may be two: manual and mechanized (Figure 4). The
mechanized adds one machine in the various steps of collection. Showing up can run from
the cut to the conduct of raw material to storage, such equipment performs its action on a line
at a time. Making use of a vehicle that travels in parallel to the harvester, which receives the
raw material separates the parts of the leaves and pointers, which are released again into the
soil taken from the area.
Manual harvesting employs two methods for harvesting: one in which the sugar cane
is harvested green and the other in which it is burned. Manual harvesting raw is rarely used,
since the worker must remove all leaves and green stems before cutting them which reduces
worker productivity.
Figure 4 - Harvesting done automatically and manually
IberoamericanJournalofIndustrialEngineering,Florianópolis,SC,Brasil,v.8,n.16,p.196-211,2016.
203
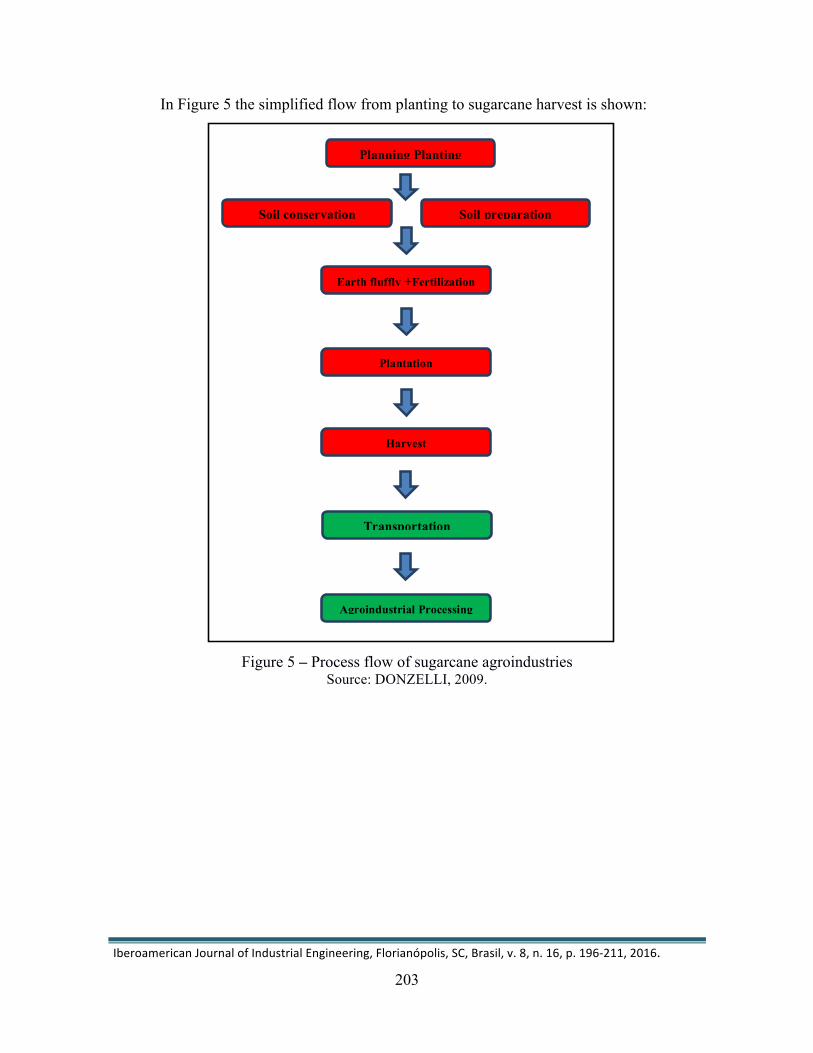
In Figure 5 the simplified flow from planting to sugarcane harvest is shown:
Figure 5 – Process flow of sugarcane agroindustries Source: DONZELLI, 2009.
Planning Planting
Soil conservation Soil preparation
Earth fluffly +Fertilization
Plantation
Harvest
Transportation
Agroindustrial Processing
IberoamericanJournalofIndustrialEngineering,Florianópolis,SC,Brasil,v.8,n.16,p.196-211,2016.
204
3.2 Industrial System
After harvesting, the sugar cane is transported to the plant which lies between 30 and
50 miles from the crop area because if the distance is much greater there is a reduction in
levels of sucrose plants
Inside of this sector there are distilleries specialized in the production of ethanol. They
produce molasses from the distillation of alcohol and itsby products found among the vinasse
or stillage. For a long time, this product was treated as a waste problem of the plants since it
had no way of storing. However in the last decade, it has begun to be widely used as a
fertilizer in sugarcane and supply to market as organic fertilizer.
3.3 Obtaining carbon credits in the agricultural phase
The sugarcane plants like any other production system generates economic and social
benefits, but it also generates harm especially to nature by producing polluting residues. The
the plantation absorbs large amounts of CO2 gas in the medium term, and it does not
contribute to the greenhouse effect, since the same amount absorbed is eliminated again in a
new cycle.
However there are two facts. The first point refers to the gas absorbed during the
maturation period which rather than being retained within the plant biochemical structure is
released almost instantaneously upon firing. This generates a concentration of the polluting
gases in the regions of operation. The second point is that the CO2 released also eliminates
chemicals used in farming, as well as heavy metals that could harm the health of surrounding
communities.
However the harvesting done manually becomes more interesting for agribusiness,
provided some modifications and adaptations in the system of collection are made, in
addition to improvements in the working class.
Thus the removal process can generate fires in the area of carbon credits to be
characterized as carbon sinks. A sink can be any process activity or mechanism which has
the property of absorbing and retaining the atmosphere of greenhouse gases (FAIRBAIRN,
2012). According Buckeridge (2007) it was analysed in laboratory some varieties of cane
sugar the CO2 retention power, and found that a single plant cane held about 1.2 kg of CO2
in its composition.
IberoamericanJournalofIndustrialEngineering,Florianópolis,SC,Brasil,v.8,n.16,p.196-211,2016.
205
4 METHODS AND MODELS
The case study was conducted in the Northeast Brazil in the state of Paraiba. The
company holds a production capacity of about 6,000 (six thousand) bags of 50kg of sugar a
day. The main product is crushed sugar which accounts for 80 % of production, followed by
the VHP (very high purity sugar) to 15 % which is intended for export because its
manufacturing process complies with the laws of different countries.
Besides sugar production the plant also produces some kinds of anhydrous and
hydrated alcohol. The company has an area of 13.9 thousand hectares divided between
industries and the planting of sugar cane.
4.1 Proposed Methodology for the calculation of the economic gain (VGeP1) for the
carbon absorbed by sugarcane
For the calculation, it will be considered the total area devoted to cultivation of cane
sugar. According to Buckeridge (2007) a plant of sugarcanes one year old, dehydrated,
weights on average 2.5 kg. In this weight 1.5 kg refers to the stem, which concentrates sugars
employed in the process of producing sugar and ethanol.
To construct the model we assume that the plant is in an artificial environment in the
laboratory. At least 40% of the stem is composed of carbon. A healthy plant is about 0.6 kg
(600 grams) of carbon. As the study was conducted in natural environment conditions,
exposed to adverse weather and soil, it was assumed that each stem holds twice the amount
of carbon. Each plant has 1.2 kg of carbon and that became the total sugar or alcohol
(BUCKERIDGE, 2007).
To find the total number of plants per hectare (10,000 m2) we used the following
equation:
𝑃"# =#%%&
𝑥 #%%(
(1)
Where:
PH1 = Number of plants in one hectare
D = Distance between plants of the same row
E = spacing between rows
IberoamericanJournalofIndustrialEngineering,Florianópolis,SC,Brasil,v.8,n.16,p.196-211,2016.
206
After finding PH1 it was necessary to locate the existing plants in the total cultivated area of
the plant.
NTotal = PH1 x HP (2)
Where:
Ntotal = Total cultivated plants
PH1 = Number of plants per hectare
HP = Hectares planted
It was assumed that each plant of sugarcane absorbed 1.2 kg of carbon dioxide
(BUCKERIDGE, 2007). thus:
TAC1 = 1.2kg x NTotal... (3)
Where:
TAC1 = Total absorbed tons of CO2
From the data obtained in the previous phases, it was possible to calculate the
Economic Value of Gain (VGep1) of sugarcane mill considering the level of absorption of
planting. In designing this study, it was taken as the equivalence factor of 1 ton of CO2
(TAC1) generating 1 Carbon Credit (MANTOVANI, 2012). Thus, to find TAC1 in tons of
carbon absorbed provided the generation units of Carbon Credits (CCP1), from the formula
developed and adapted to obtain economic gain described (FINCO, 2006).
VGeP1 = CCP1 x TC1P (4)
Where:
VGeP1 = value economic gain in 1 project
CCP1 = Carbon Credits (Units)
TC1 P = market price for carbon credit
From the data obtained in developing this work, it is possible to obtain the VGep1
multiplying the amount of carbon credits (CCP1) by the market price of carbon recorded in
official bodies.
IberoamericanJournalofIndustrialEngineering,Florianópolis,SC,Brasil,v.8,n.16,p.196-211,2016.
207
5 RESULTS
According to the data provided by the company, it was used the distance of 0.40 m
between plants of the same groove and 1.20 m spacing between the grooves, spread over an
area of 6,900 hectares of cultivation.
To find the total number of plants per hectare (10,000 m2) we used the equation (1),
where PH1 = Number of plants in one hectare; D = Distance between plants of the same row
and E = spacing between rows
𝑃"# =100𝐷 𝑥
100𝐸
𝑃"# =#%%%./%
𝑥 #%%#.0%
(5)
PH1 =250 x 83.33 plants/hectare. (6)
PH1 =20,832.50 plants/hectare. (7)
Thus there are 20,832.50 plants distributed in an area of 10,000 m2. In possession of
this information it is possible to find the amount of cultivated plants by applying to 6,900
hectares:
NTotal =20,832.50 x 6,900=143,744,250 plants. (8)
143,744,250 (one hundred forty three million seven hundred forty four thousand and
two hundred fifty) plants are grown in an area of 69 million m2 (sixty and ninety million
square meters).
As mentioned in the previous section, it was considered that all the crop is
homogeneous with respect to the cultivated varieties which will hold in its physico-chemical
structure about 1.2 kg CO2 per plant. The CO2 absorbed is:
TAC1 = 1.2 Kg x 143,744,250 (9)
TAC1 = 172,493.10 tons. CO2 absorbed (10)
The whole area cultivated with sugar cane absorbed about 172,493.10 tons. CO2
absorbed and by equation 4 it was obtain the value of Gain Economic (VGep2). To construct
this value, it is considered that 1 ton of CO2 is 1 credit carbon.
IberoamericanJournalofIndustrialEngineering,Florianópolis,SC,Brasil,v.8,n.16,p.196-211,2016.
208
VGep1 = 172,493.10 x US$ 6.19* = US$ 1,067,732.30 (11)
* Quotation Carbon Credit
Thus, the plant may contribute an increase in its annual gross revenue of
VGep1 = US$ 1,067,732.30 which could substantially contribute to the company's financial
results.
6 CONCLUSION
The international carbon credit market was formulated to encourage the
implementation of more sustainable production models, associated with the change of
perception on the part of the productive sector, which is no longer seen only as an input for
its activities, thus starting to act more Effective way within companies, by providing
resources capable of maintaining and enhancing the conservation of the environment. This
case study project has the capacity to contribute an increase in its annual gross revenue and
would benefit the sugarcane industry in the Northeast Brazil that uses this initiative.
It is noteworthy that Brazil is being structured to build a functioning structure capable
of subsidizing the productive sector in registering its projects in this market. For this purpose,
the Interministerial Commission for Climate was created to select the eligible projects for the
United nations Registry Council, thus acting more effectively within the international
community, as well as increasing income generation in the domestic economy.
This methodology will be of great utility to the Brazil sugarcane industry management
by making information for sustainable strategic planning and would also contribute to the
economic viability of eliminating the step of burning the sugarcane agro-industrial process.
Acknowledgements. This paper was developed in the scope of a Research Project financed
by Brazilian Agency CNPq (Conselho Nacional de Desenvolvimento Científico e
Tecnológico).
IberoamericanJournalofIndustrialEngineering,Florianópolis,SC,Brasil,v.8,n.16,p.196-211,2016.
209
AVALIAÇÃO DE CRÉDITOS DE CARBONO EM INDÚSTRIAS DE CANA: PROPOSTA DE METODOLOGIA E ESTUDO DE CASO NO NORDESTE DO
BRASIL RESUMO: O mercado de Créditos de Carbono se apresenta como uma fonte de financiamento para as indústrias do agronegócio, proporcionando uma nova fonte de operações financeiras capazes de gerar uma expansão do fluxo de caixa. Estes recursos financeiros podem ser gerados através de produtos de uso de Marketing Verde, ou simplesmente empregando aspectos de responsabilidade social e ambiental. As principais empresas do Brasil são as usinas de açúcar, papel, celulose, madeira acompanhada em menor medida por iniciativas governamentais. Mesmo tendo registro de uma quantidade considerável de negociação ainda é um mercado em grande parte inexplorado para a cana-de-açúcar e o setor de álcool. O objetivo deste trabalho é apresentar uma metodologia para avaliação de créditos de carbono na indústria de cana-de-açúcar, estimando o potencial financeiro desses projetos, e apresentar um estudo de caso no Nordeste do Brasil. Há um volume potencial de créditos de carbono no volume de negócios anual da empresa de U $ 170 milhões no estudo de caso analisado. Palavras-chave: Mecanismo de Desenvolvimento Limpo. Créditos de Carbono. Sustentabilidade nas indústrias de cana-de-açúcar. Eficiência energética.
IberoamericanJournalofIndustrialEngineering,Florianópolis,SC,Brasil,v.8,n.16,p.196-211,2016.
210
REFERENCES
TESKE, S.; PREGGER, T.; SIMON, S.; NAEGLER, T.; GRAUS, W.; LINS, C. (2011). Energy [R]evolution 2010: a sustainable world energy outlook. Energy Efficiency, vol. 4, pp.409–433.doi: 10.1007/s12053-010-9098-y ROSENOW, J. (2013). The politics of the German CO2-Building Rehabilitation Programme. Energy Efficiency, vol. 6, pp 219-238. doi.10.1007/s12053-012-9181-7 SANDS, R.; SCHUMACHER, K. (2009). Economic Comparison of Greenhouse Gas Mitigation Options in Germany. Energy Efficiency, vol. 2, pp 17-36. doi.10.1007/s12053-008-9031-9 MILLS, E.; JACOBSON, A. (2011). From Carbon to Light: A New Framework for Estimating Greenhouse Gas Emissions Reductions from Replacing Fuel-Based Lighting with LED systems. Energy Efficiency, vol.4, pp 523-546.doi.10.1007/s12053-011-9121-y MARTINEZ, C.; SILVEIRA, S. (2013). Energy efficiency and CO2 emissions in Swedish manufacturing industries. Energy Efficiency, vol. 6, pp. 117-133, doi.10.1007/s12053-012-9159-5 MLECNICK, E. (2012). Defining Nearly Zero-Energy Housing in Belgium and the Netherlands. Energy Efficiency, vol. 5, pp 411-431.doi.10.1007/s12053-011-9138-2 RAUX, C. (2010).The Potential for CO2 Emissions Trading in Transport: the Case of Personal Vehicles and Freight. Energy Efficiency, vol. 3, pp 133-148. doi.10.1007/s12053-009-9065-7 ÜRGE-VORSATZ. D.; NOVIKOVA, A.; KÖPPEL, S. (2009). Bottom–Up Assessment of potentials and Costs of CO2 Emission Mitigation in the Buildings Sector: Insights into the Missing Elements. Energy Efficiency, vol. 2, pp 293-316. doi.10.1007/s12053-009-9051-0 MILLS, E. (2011). Building Commissioning: A Golden Opportunity for Reducing Energy Costs and Greenhouse Gas Emissions in the United States. Energy Efficiency, vol. 4, pp 145-173.doi. 10.1007/s12053-011-9116-8 RAUX, C.; LEE-GOSSELIN, MARTIN E.H. (2010). Transport, energy and greenhouse gases: perspectives on demand limitation. Guest editorial. Energy Efficiency, vol. 3, pp 111-113. doi.10.1007/s12053-009-9068-4 BERRY, S.; DAVIDSON, K.; SAMAN, W. (2013). Defining Zero Carbon and Zero Energy Homes from a Performance-Based Regulatory Perspective. Energy Efficiency, August 2013. doi.10.1007/s12053-013-9225-7 GIOMETTI, A.MOREIRA, H (2008). Kyoto Protocol and the possibilities of insertion of Brazil in the Clean Development Mechanism through projects in clean energy (in Portuguese). Contexto int. [online].vol.30, n.1, pp. 9-47.ISSN 0102-8529. GALLAHER, M.; DELHOTAL, K.; PETRUSA, J. (2009) Estimating the Potential CO2 Mitigation from Agricultural Energy Efficiency in the United States. Energy Efficiency, vol 2, pp 207-220. doi. 10.1007/s12053-008-9039-1 VENDRUSCULO, E.; QUEIROZ, G.(2009). Life Cycle Cost Analysis of Energy Efficiency Design Options for Refrigerators in Brazil. Energy Efficiency, vol. 2, pp 271-286. doi. 10.1007/s12053-008-9034-6
IberoamericanJournalofIndustrialEngineering,Florianópolis,SC,Brasil,v.8,n.16,p.196-211,2016.
211
MELO, MIGUEL O.; CAMPELO, S.; SILVA, L. (2012). Industries energy efficiency analyses in northeast. Brazil: Proposal of methodology and case studies. International Journal of Industrial Engineering: Theory, Applications and Theory, vol. 18, n. 9. ECOSYSTEM MARKETPLACE AND BLOOMBERG. (2011). New Energy Finance.Developing Dimension: state of the voluntary Carbon markets 2012. New York. SEIFFERT, M. (2009). Carbon Market and the Kyoto Protocol: Business Opportunities in Search of Sustainability (in Portuguese). São Paulo: Atlas. Brazil HIRATSUKA, A. (2009). Analysis of environmental and economic impacts on multimodal transport. (MSc Dissertation) (in Portuguese), University State Paulista, Faculty of Engineering IlhaSolteira, 2009. OLIVEIRA, A.; RUBIM, R.; FERNANDES, P.; PRELLWITZ, W.; AZEVEDO, P. (2011). Economic evaluation of cane sugar-tillage compared to conventional in Goytacazes-RJ (in Portuguese). Review Vértices, vol. 13 FAIRBAIRN, M.; PAULA, T.; CORDEIRO, G.; AMERICANO, B.; FILHO, R.T. (2012). Evaluation of partial clinker replacement by sugar cane bagasse ash: CO2 emission reductions and potential for carbon credits. Review IBRACON de Estruturas e Materiais, vol. 5. BUCKERIDGE. M. (2007) Carbon sequestration, cane sugar and Cinderella Effect (in Portuguese). Revista Eletrônica de Jornalismo Científico com Ciência. n° 105. MANTOVANI, E.C.; MALDONADO, M.R.; ANTONIO, A.C. et al., (2012). Carbon Credit: Sustainable Investment (in Portuguese). Review Alumni, vol.2. FINCO, M. V. A.; RODRIGUES, W.; RODRIGUES, I. A. Amazônia legal brasileira e o mercado de créditos de carbono: perspectivas para o Estado de Tocantins. Amazônia ciência & desenvolvimento. vol. 2, numero 3, July/Deco 2006. Disponible in: http://www.bancoamazonia.com.br/bancoamazonia2/Revista/revistaamazonia03.htm.
Originais recebidos em: 08/01/2016 Aceito para publicação em: 18/12/2016