Embed Size (px)
Citation preview

Branko Bijeljic
Ann Muggeridge
Martin Blunt
Dispersion in Porous Media from Pore-scale Network Simulation
Dept. of Earth Science and Engineering,Imperial College,
London

OVERVIEW
• Dispersion in Porous Media (Motivation)
• Network Model
• Asymptotic Dispersion: Model vs. Experiments
• Pre-asymptotic Dispersion: Model vs. CTRW
• Conclusions

MIXING of FLOWING FLUIDS in POROUS MEDIA
Pore scale mixing processes are COMPLEX:
What is the correct macroscopic description?

MOTIVATION
Describe macroscopic dispersion using a Lagrangian-based pore network model over a wide range of Peclet numbers (0<Pe<105)
• Aquifers
• Contaminant transport
• Oil reservoirs:
• Tracers
• Development of gas/oil miscibility
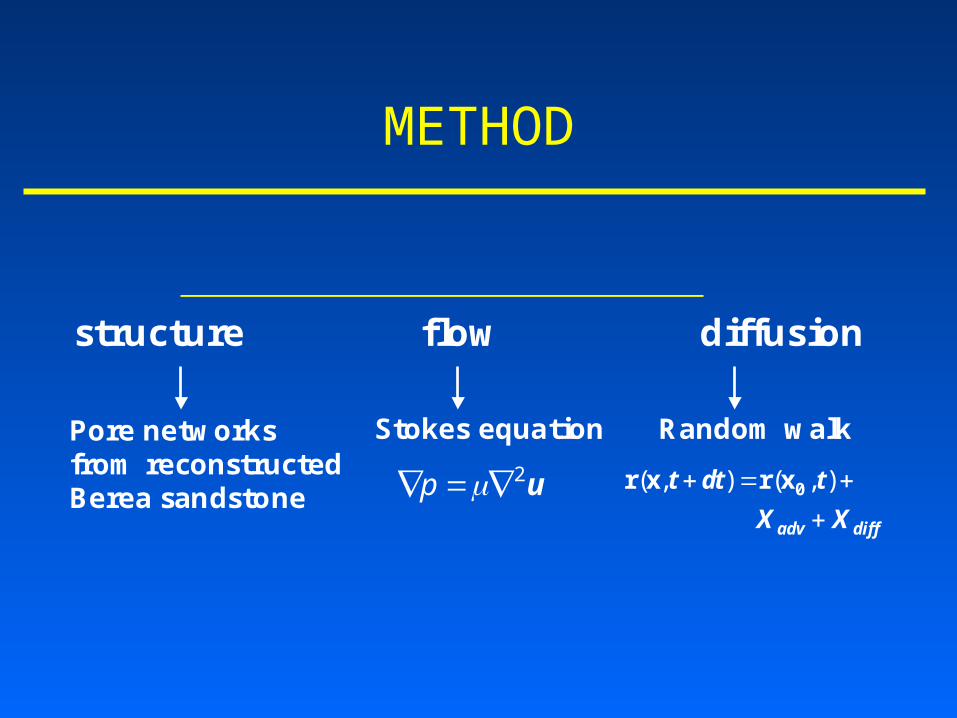
METHOD
Pore networks from reconstructed Berea sandstone
Stokes equation Random walk
diffadv XX
tdtt
),(),( 0xrxru2 p
structure flow diffusion

Pore network representation
Berea sandstonesample (3mmX3mm)
geologically equivalent network
diamond lattice network (60x60)
LARGE SCALE
Process-based reconstruction

Algorithm
1. Calculate mean velocity in each pore throat by invoking volume balance at each pore
2. Use analytic solution to determine velocity profile in each pore throat
3. In each time step particles move bya. Advectionb. Diffusion
4. Impose rules for mixing at junctions5. Obtain asymptotic dispersion coefficient

MIXING RULES at JUNCTIONS
Diffusio n
Flo w
Pe >>1 Pe<<1
- area weighted rule ~ Ai / Ai ;- assign a new site at random; - forwards and backwards
- flowrate weighted rule ~ Fi / Fi ;- assign a new site at random &
move by udt;- only forwards

Simulation (DL , Pe=0.1)
Random velocity field in heterogeneous network
0
2
4
6
8
10
12
-2 0 2 4 6 8
X(mm)
Y(m
m)
periodic boundary conditions
injection line
mean flow direction

Comparison with experiments asymptotic DL
(0<Pe<105)
- network model, reconstructed Berea sandstone
- Dullien, 1992, various sandstones- Gist and Thompson, 1990, various sandstones- Legatski and Katz, 1967, various sandstones
- Pfannkuch, 1963, unconsolidated bead packs- Seymour and Callaghan, 1997, bead packs- Khrapitchev and Callaghan, 2003, bead packs
21PePePe
FD
D
m
L
- Frosch et al., 2000, various sandstones
1.0E-02
1.0E-01
1.0E+00
1.0E+01
1.0E+02
1.0E+03
1.0E+04
1.0E+05
1.0E-02 1.0E-01 1.0E+00 1.0E+01 1.0E+02 1.0E+03 1.0E+04 1.0E+05
Pe
DL/D
m
Bijeljic et al. WRR, Nov 2004

Comparison with experiments: DL - Boundary-
layer dispersion
21PePePe
FD
D
m
L
1
1.1
1.2
1.3
1.4
1.5
1.6
1.7
1.8
1.9
2
0 1 2 3 4 5 6 7 8 9 10 11 12
study number
po
we
r-la
w c
oe
ffic
ien
t
1 - Bijeljic et al. 2004 network model, reconstructed Berea sandstone 2 - Brigham et al., 1961, Berea sandstone3 - Salter and Mohanty, 1982, Berea sandstone4 - Yao et al., 1997, Vosges sandstone5 - Kinzel and Hill, 1989, Berea sandstone6 - Sorbie et al., 1987, Clashach sandstone7 - Gist and Thompson, 1990, various sandstones8 - Gist and Thompson, 1990, Berea sandstone9 - Kwok et al., 1995, Berea sandstone, liquid radial flow10 - Legatski and Katz, 1967, various sandstones, gas flow11 - Legatski and Katz, 1967, Berea sandstone, gas flow12 - Pfannkuch, 1963, unconsolidated bead packs
10<Pe<400; L = 1.19

Comparison with experiments asymptotic DT
(0<Pe<105)
- network model, reconstructed Berea sandstone
- Dullien, 1992, various sandstones- Gist and Thompson, 1990, various sandstones- Legatski and Katz, 1967, various sandstones
- Frosch et al., 2000, various sandstones
- Harleman and Rumer, 1963 (+); (-); - Gunn and Pryce, 1969 (□); - Han et al. 1985 (○)
- Seymour and Callaghan, 1997 () - Khrapitchev and Callaghan, 2003 (∆,◊).
1.0E-02
1.0E-01
1.0E+00
1.0E+01
1.0E+02
1.0E+03
1.0E+04
1.0E+05
1.0E-02 1.0E-01 1.0E+00 1.0E+01 1.0E+02 1.0E+03 1.0E+04 1.0E+05
Pe
DT/D
m
10<Pe<400; T = 0.94
Pe>400; T = 0.89

Pre-asymptotic regime
Pe =10000
Pe =1000
Pe =100
Pe =10
Pe =1
0.1
1
10
100
1000
10000
100000
1 10 100 1000 10000 100000
Number of pores traversed
DL
/Dm
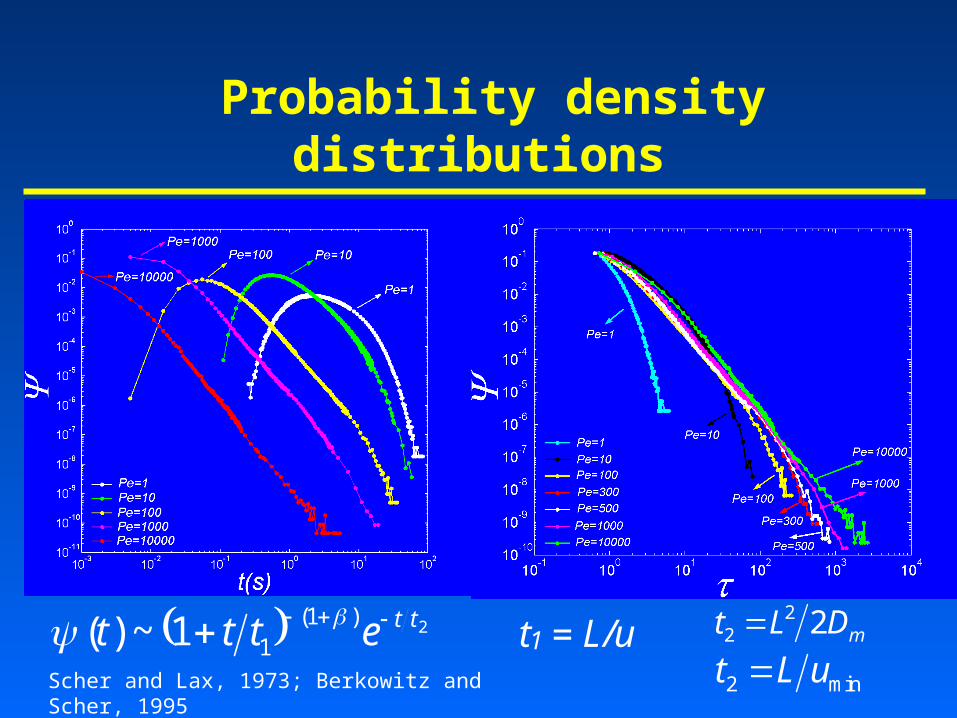
Probability density distributions
mDLt 222
min2 uLt 2)1(
11~)( ttettt t1 = L/u Scher and Lax, 1973; Berkowitz and Scher, 1995

Comparison with CTRW theory
= 1.80 2)1(11~)( ttettt
mDLt 222 t1 = L/u

Comparison with CTRW theory
DL/Dm ~ Pe 2- = 3- = 1.2
For 2>>1: For > t2/t1 :
DL/Dm ~ Pe for Pe > Pecrit
1.0E-02
1.0E-01
1.0E+00
1.0E+01
1.0E+02
1.0E+03
1.0E+04
1.0E+05
1.0E-02 1.0E-01 1.0E+00 1.0E+01 1.0E+02 1.0E+03 1.0E+04 1.0E+05
Pe
DL
/Dm
L = 1.19
Dentz et al., 2004
DL/Dm ~ Pe3- for Pecrit > Pe >>1

CONCLUSIONS
-Unique network simulation model able to predict variation of DL,T/D m vs Peclet over the range0<Pe<105.
- A very good agreement with the experimental datain the restricted diffusion, boundary-layer and mechanical dispersion regimes.
- The boundary-layer dispersion regime is related to the CTRW exponent 1.80 where = 3-.
- The cross-over to a linear regime for Pe>400 is due to a transition from a diffusion-controlled late-time cut-off, to one governed by a minimum typical flow speed umin.

THANKS!

Structure-flow relationship
0
100
200
300
400
500
600
0 4 8 12 16 20 24 28 32 36 40 44 48
mean throat radius(m)
freq
uen
cy throat size distribution - uncorrelated
average throat radius, rav = 11.05m
0
20
40
60
80
100
120
140
160
0 4 8 12 16 20 24 28 32 36 40 44 48
mean throat radius(m)
me
an
th
roa
t ve
loc
ity(
mm
/s)
velocity distribution
maximum velocities are in the throats of intermediate radii