Embed Size (px)
Citation preview

Category Report
BusinessIntelligence
NUMBER OF REVIEWS
696NUMBER OF VENDORSEVALUATED
13REPORT GENERATED
March 2018
Dundas BI
SAS BI
Tableau
TIBCO Business Intelligence
Oracle BI Solutions
SAP BI
IBM Cognos Platform
Qlik
BOARD
MicroStrategy BI
Microsoft BI
WebFOCUS
Zoho Reports

Business Intelligence Category Report
Table ofContentsData Quadrant...................................................................................................................7
Category Overview ......................................................................................................8
Vendor Capability Summary .............................................................................. 10
Vendor Capabilities.................................................................................................... 12
Product Feature Summary .................................................................................. 18
Product Features ........................................................................................................20
Emotional Footprint Summary .......................................................................26
Emotional Footprint.................................................................................................28
How to Use the ReportInfo-Tech’s Category Reports provide a comprehensive evaluation of popular products in theBusiness Intelligence market. This buyer’s guide is designed to help prospective purchasers makebetter decisions by leveraging the experiences of real users.
The data in this report is collected from real end users, meticulously verified for veracity,exhaustively analyzed, and visualized in easy to understand charts and graphs. Each product iscompared and contrasted with all other vendors in their category to create a holistic, unbiased viewof the product landscape.
Use this report to determine which product is right for your organization. For highly detailed reportson individual products, see Info-Tech’s Product Scorecard.
2

Category Report
SoftwareDirectoryBUSINESS INTELLIGENCESOFTWARE
Selecting software can be overwhelming andone of the biggest challenges facingorganizations is understanding themarketplace and identifying all of the availablevendors and products. The Software Directoryis a comprehensive list of all relevant softwarevendors in a particular category. Use this pageto create the right vendor shortlist by exploringall of the options available to yourorganization.
Business Intelligence Software
1010data Analytical Platform 5000fish Inc Yurbi Acorn Performance Analyzer
ActivePivot In-Memory Analytical Platform Adaptive Insights Adaptive Suite Algorithmic Digital Solutions
Alteryx APOS Arcadia Data
Arcplan Enterprise Ascend BI Asset Answers
Attunity Visibility (formerly Appfluent) Balanced Insight Birst BI Platform
BIspoke Bissantz DeltaMaster Bitam Artus
BMC TrueSight BOARD CALUMO
CAMMS Power Data Centrifuge Analytics Coldwater Technology B-Metrics
Collectivei Column Technologies BI comScore Digital Analytix Enterprise
Corvil Cubeware C8 Platform Datapine
Decision Management Suite Dell BI Deltek wInsight Analytics
Domo Dundas BI Dunnhumby PriceStrat
3

Category Report
SoftwareDirectoryBUSINESS INTELLIGENCESOFTWARE
Selecting software can be overwhelming andone of the biggest challenges facingorganizations is understanding themarketplace and identifying all of the availablevendors and products. The Software Directoryis a comprehensive list of all relevant softwarevendors in a particular category. Use this pageto create the right vendor shortlist by exploringall of the options available to yourorganization.
Business Intelligence Software
ElegantJ BI Eloqua Insight Encore Prophix
Enertia Entrinsik Informer E-WorkBook
ExtraHop Platform Factual Enterprise Fulcrum Analytics
Geckoboard GoodData Heap Analytics
Host Analytics EPM suite HP Business Intelligence Solutions IBM Advanced Analytics
IBM Cognos Platform IBM i2 Analyst's Notebook IBM Watson Analytics
InetSoft Style Intelligence Infonea Inovalon INDICES
IronRock Solutions Jack Henry Business Intelligence & FinancialPerformance JDA Business Intelligence
Jedox Jinfonet Software JReport KNIME Analytics Platform
KnowledgeTree Lavastorm Leadspace
Logi Analytics Looker BI Lumina Analytica
Magnitude BI Solutions MammothDB Master Merchant System Overture
4

Category Report
SoftwareDirectoryBUSINESS INTELLIGENCESOFTWARE
Selecting software can be overwhelming andone of the biggest challenges facingorganizations is understanding themarketplace and identifying all of the availablevendors and products. The Software Directoryis a comprehensive list of all relevant softwarevendors in a particular category. Use this pageto create the right vendor shortlist by exploringall of the options available to yourorganization.
Business Intelligence Software
McKesson Performance Analytics Microsoft BI MicroStrategy BI
MITS Distributor Analytics Movio Media NGS-IQ
On Demand Analytics SIFT Oniqua Analytics Solution (OAS) OpenText Analytics
Optimizer+ Oracle BI Solutions Panorama Necto
PARIS BI Solutions Pentaho Planalytics Weatherize
Polyvista Business Intelligence Profitbase Suite Prognoz Platform
Push Intelligence Platform Pyramid Analytics BI Office Qlik
ReachForce RJMetrics Robust Designs CUBOT
Saasabi Salesforce Einstein Analytics sales-i
Salient Collaborative Intelligence Suite (CIS) SAP BI SAS BI
Silvon Stratum Analytics Sisense SpagoBI
Steelwedge S&OP Insight SurveyGizmo SurveyMonkey
5

Category Report
SoftwareDirectoryBUSINESS INTELLIGENCESOFTWARE
Selecting software can be overwhelming andone of the biggest challenges facingorganizations is understanding themarketplace and identifying all of the availablevendors and products. The Software Directoryis a comprehensive list of all relevant softwarevendors in a particular category. Use this pageto create the right vendor shortlist by exploringall of the options available to yourorganization.
Business Intelligence Software
Sweetspot Tableau TARGIT Decision Suite
TCM Business Intelligence Software Temenos Business Intelligence Solution The Diver Platform
Theoris Vision Software TIBCO Business Intelligence Tidemark
Tour de Force BI UNIT4 Business Analytics Upsight Analytics
Vanguard Studio vCube BI Visibility Business Intelligence Analyzers
WebFOCUS Wunderdata XL Cubed
Xtraction Solutions Yellowfin ZAP Business Intelligence
Zoho Reports
6

Business Intelligence Category Report
SOFTWARE REVIEWS
Data QuadrantAssess vendor and product performance at a glance and use the Software ReviewsData Quadrant to identify which products and vendors are leadings the pack andwhich are trailing.
PRO
DUCT
FEA
TURE
S AN
D SA
TISF
ACTI
ON
6.6
8.2
VENDOR EXPERIENCE AND CAPABILITIES6.1 9.1
PRODUCT INNOVATOR
FOLLOWER
LEADER
SERVICE STAR
Dundas BI
WebFOCUS
Tableau
Zoho Reports
Qlik
BOARD
MicroStrategy BI
TIBCO Business Intelligence
SAS BIMicrosoft BI
IBM Cognos Platform
SAP BI
Oracle BI Solutions
BusinessIntelligenceThe Software Reviews Data Quadrant evaluates and ranks products based on feedbackfrom IT and business professionals. The placement of a software in the Data Quadrantindicates its relative ranking as well as its categorization.
The Complete SoftwareExperienceWhen distilled down, the software experience is shaped by both the experience with thesoftware and the relationship with the vendor. Evaluating enterprise software along thesetwo dimensions provides a comprehensive understanding of the product and helpsidentify vendors that can deliver on both.
ProductFeatures andSatisfactionThe satisfaction is captured inthe overall satisfaction score,which is driven by the likelihoodof users to recommend thesoftware, combined with usersatisfaction across top productfeatures.
VendorExperience andCapabilitiesThe vendor relationship is calculated ina weighted average of the satisfactionscores tied to vendor capabilities (e.g.software implementation, training,customer support, product roadmap) aswell as emotional response ratingstoward the vendor (e.g. trustworthy,respectful, fair).
Note: The axes ranges are dynamically adjusted based onminimum and maximum values in the dataset.
7

Business Intelligence Category Report
CategoryOverview
This page provides a high level summary of product performance within the Business Intelligence category. Products are ranked by a composite satisfaction score (CompositeScore) that averages four different areas of evaluation: Net Emotional Footprint, Vendor Capabilities, Product Features, and Likeliness to Recommend. The Net EmotionalFootprint Score measures user emotional response ratings of the vendor (e.g. trustworthy, respectful, fair).
Use this data to get a sense of the field, and to see how the products you’re considering stack up.
RANK VENDOR COMPOSITE SCORE NET EMOTIONALFOOTPRINT
NET EMOTIONALFOOTPRINT DISTRIBUTION
VENDORCAPABILITIES
PRODUCTFEATURES
LIKELINESS TORECOMMEND
NUMBER OFREVIEWS
2018 Dundas BI 8.6/10 +862% NEGATIVE 88% POSITIVE
81% 77% 87% 33
2018 WebFOCUS 8.0/10 +792% NEGATIVE 81% POSITIVE
74% 73% 78% 11
2018 Tableau 8.2/10 +783% NEGATIVE 81% POSITIVE
79% 77% 80% 123
2018 Zoho Reports 8.0/10 +764% NEGATIVE 80% POSITIVE
75% 74% 81% 31
2018 Qlik 7.7/10 +753% NEGATIVE 78% POSITIVE
76% 71% 76% 64
6 MicroStrategy BI 7.6/10 +735% NEGATIVE 78% POSITIVE
75% 72% 78% 27
6 BOARD 7.8/10 +735% NEGATIVE 78% POSITIVE
73% 77% 82% 24
8 TIBCO Business Intelligence 7.1/10 +6510% NEGATIVE 75% POSITIVE
73% 71% 69% 23
9 SAS BI 7.2/10 +5710% NEGATIVE 67% POSITIVE
73% 71% 74% 29
10 Microsoft BI 7.2/10 +5613% NEGATIVE 69% POSITIVE
77% 69% 76% 124
AVERAGE SCORES 7.5/10 +667% NEGATIVE 73% POSITIVE
74% 72% 76% 48
8

Business Intelligence Category Report
CategoryOverview
This page provides a high level summary of product performance within the Business Intelligence category. Products are ranked by a composite satisfaction score (CompositeScore) that averages four different areas of evaluation: Net Emotional Footprint, Vendor Capabilities, Product Features, and Likeliness to Recommend. The Net EmotionalFootprint Score measures user emotional response ratings of the vendor (e.g. trustworthy, respectful, fair).
Use this data to get a sense of the field, and to see how the products you’re considering stack up.
RANK VENDOR COMPOSITE SCORE NET EMOTIONALFOOTPRINT
NET EMOTIONALFOOTPRINT DISTRIBUTION
VENDORCAPABILITIES
PRODUCTFEATURES
LIKELINESS TORECOMMEND
NUMBER OFREVIEWS
11 IBM Cognos Platform 6.8/10 +519% NEGATIVE 60% POSITIVE
70% 68% 74% 36
12 SAP BI 6.4/10 +4612% NEGATIVE 58% POSITIVE
65% 66% 66% 64
13 Oracle BI Solutions 6.4/10 +3819% NEGATIVE 57% POSITIVE
68% 67% 70% 40
AVERAGE SCORES 7.5/10 +667% NEGATIVE 73% POSITIVE
74% 72% 76% 48
VENDORS WITH INSUFFICIENT DATA
-- Pentaho -- +5811% NEGATIVE 69% POSITIVE
-- -- 73% 13
-- SurveyMonkey -- +87-- NEGATIVE 87% POSITIVE
-- -- 85% 6
-- Birst BI Platform -- +576% NEGATIVE 63% POSITIVE
-- -- 83% 6
-- Yellowfin -- +4826% NEGATIVE 74% POSITIVE
-- -- 82% 5
-- Alteryx -- +941% NEGATIVE 95% POSITIVE
-- -- 90% 5
-- 1010data Analytical Platform -- +94-- NEGATIVE 94% POSITIVE
-- -- 85% 4
9

Business Intelligence Category Report
Vendor Capability Summary This page summarizes user satisfaction with a variety of vendor capabilities regarding their product offering(s). Lookfor strong and consistent performance across the board when assembling your shortlist, and follow-up on areas ofconcern during the evaluation and negotiation processes.
= Highest Score
= Lowest Score
VENDOROVERALLCAPABILITYSATISFACTION
BUSINESS VALUECREATED
BREADTH OFFEATURES
QUALITY OFFEATURES
PRODUCTSTRATEGY ANDRATE OFIMPROVEMENT
USABILITY ANDINTUITIVENESS
VENDORSUPPORT
EASE OF DATAINTEGRATION
EASE OF ITADMINISTRATION
EASE OFCUSTOMIZATION
AVAILABILITYAND QUALITY OFTRAINING
EASE OFIMPLEMENTATION
Dundas BI 81% 83% 82% 80% 83% 76% 90% 77% 82% 83% 73% 84%
Tableau 79% 81% 80% 82% 79% 82% 77% 79% 74% 77% 80% 78%
Microsoft BI 77% 81% 78% 83% 75% 76% 75% 76% 80% 78% 69% 68%
Qlik 76% 75% 77% 79% 76% 77% 72% 79% 78% 75% 71% 74%
Zoho Reports 75% 83% 78% 78% 73% 71% 71% 77% 77% 72% 69% 78%
MicroStrategy BI 75% 82% 80% 77% 69% 72% 69% 79% 75% 71% 79% 69%
WebFOCUS 73% 72% 78% 73% 65% 73% 83% 75% 72% 72% 69% 80%
BOARD 73% 77% 77% 77% 72% 73% 66% 74% 70% 74% 71% 73%
SAS BI 73% 82% 74% 73% 73% 78% 71% 73% 72% 65% 63% 78%
TIBCO Business Intelligence 73% 75% 78% 76% 71% 76% 72% 76% 65% 68% 71% 65%
CATEGORY AVERAGE 74% 77% 76% 76% 72% 73% 73% 74% 73% 72% 71% 72%
VENDORS WITH INSUFFICIENT DATA
10

Business Intelligence Category Report
Vendor Capability Summary This page summarizes user satisfaction with a variety of vendor capabilities regarding their product offering(s). Lookfor strong and consistent performance across the board when assembling your shortlist, and follow-up on areas ofconcern during the evaluation and negotiation processes.
= Highest Score
= Lowest Score
VENDOROVERALLCAPABILITYSATISFACTION
BUSINESS VALUECREATED
BREADTH OFFEATURES
QUALITY OFFEATURES
PRODUCTSTRATEGY ANDRATE OFIMPROVEMENT
USABILITY ANDINTUITIVENESS
VENDORSUPPORT
EASE OF DATAINTEGRATION
EASE OF ITADMINISTRATION
EASE OFCUSTOMIZATION
AVAILABILITYAND QUALITY OFTRAINING
EASE OFIMPLEMENTATION
IBM Cognos Platform 70% 72% 69% 73% 67% 64% 70% 69% 71% 71% 72% 71%
Oracle BI Solutions 67% 70% 69% 67% 66% 68% 69% 64% 71% 71% 65% 62%
SAP BI 65% 70% 66% 69% 65% 62% 62% 66% 67% 61% 63% 60%
CATEGORY AVERAGE 74% 77% 76% 76% 72% 73% 73% 74% 73% 72% 71% 72%
VENDORS WITH INSUFFICIENT DATA
1010data Analytical Platform 79% 75% 81% 63% 75% 88% 81% 83% 75% 83% 83% 100%
5000fish Inc Yurbi 89% 100% 75% 100% 100% 100% 75% 75% 100% 100% 75% 75%
Pentaho 76% 87% 81% 80% 70% 81% 64% 81% 73% 83% 67% 50%
Birst BI Platform 69% 80% 75% 65% 65% 70% 70% 75% 70% 79% 55% 50%
SurveyMonkey 86% 90% 88% 88% 75% 92% 81% 88% 100% 83% 75% 92%
Alteryx 76% 90% 80% 75% 75% 70% 75% 85% 75% 65% 75% 70%
Yellowfin 85% 85% 85% 85% 90% 90% 90% 80% 85% 80% 81% 81%
11

Business Intelligence Category Report
Vendor CapabilitySatisfaction
This section provides detailed information on user satisfaction for each vendor capability regarding their product offering(s). Use these pages to dig deeper into areas ofparticular interest or concern.
Vendor CapabilitiesThis table lists and briefly describes all vendor capabilities that are evaluated in the Business Intelligence software category. For your convenience, youwill also find longer descriptions of the capabilities under the capability subheadings in the subsequent pages.
Business Value Created The ability to bring value to the organization.
Breadth of Features The ability to perform a wide variety of tasks.
Quality of Features The ability to perform at or above industry standards.
Product Strategy and Rate of Improvement The ability to adapt to market change.
Usability and Intuitiveness The ability to reduce training due to intuitive design.
Vendor Support The ability to receive timely and sufficient support.
Ease of Data Integration The ability to seamlessly integrate data.
Ease of IT Administration Ease of use of the backend user interface.
Ease of Customization The ability to scale the solution to a business’ unique needs.
Availability and Quality of Training Quality training allows employees to take full advantage of the software.
Ease of Implementation The ability to implement the solution without unnecessary disruption.
Business Value CreatedThe underlying purpose of software is to create value for employees, customers, partners and ultimately shareholders. As a result, it is imperative thatany software selection be aligned with the organization’s needs and deliver enough business value to justify the cost. The data below highlights thesatisfaction level associated with the business value derived from various product offerings. Use this information to identify the software thatconsistently creates business value for its customers.
ZOHO REPORTSTOP PRODUCT
Delights 43%
HighlySatisfies 46%
AlmostSatisfies 11%
Disappoints --
83 %Business Value
Created
2 Dundas BI 83%
3 SAS BI 82%
4 MicroStrategy BI 82%
5 Tableau 81%
6 Microsoft BI 81%
7 BOARD 77%
8 TIBCO Business Intelligence 75%
9 Qlik 75%
10 WebFOCUS 72%
CATEGORY AVERAGE 77%

Business Intelligence Category Report
Vendor CapabilitySatisfaction
This section provides detailed information on user satisfaction for each vendor capability regarding their product offering(s). Use these pages to dig deeper into areas ofparticular interest or concern.
Breadth of FeaturesUsers prefer to work with feature rich software that enables them to perform diverse series of tasks as opposed to one they find restrictive. The databelow highlights the satisfaction level associated with the breadth of features from various product offerings. Use this information to identify whichsoftware offers valuable comprehensive functionality that extends beyond the basic level.
DUNDAS BITOP PRODUCT
Delights 42%
HighlySatisfies 42%
AlmostSatisfies 15%
Disappoints --
82 %Breadth ofFeatures
2 MicroStrategy BI 80%
3 Tableau 80%
4 Zoho Reports 78%
5 Microsoft BI 78%
6 TIBCO Business Intelligence 78%
7 WebFOCUS 78%
8 BOARD 77%
9 Qlik 77%
10 SAS BI 74%
CATEGORY AVERAGE 76%
Quality of FeaturesFeature quality is just as important as quantity. Software needs to do what you’re purchasing it to do, easily, intuitively, reliably, and effectively. Use thedata in this section to gauge whether or not a product follows through on the marketing hype by delivering high quality features.
MICROSOFT BITOP PRODUCT
Delights 55%
HighlySatisfies 28%
AlmostSatisfies 14%
Disappoints 4%
83 %Quality of Features
2 Tableau 82%
3 Dundas BI 80%
4 Qlik 79%
5 Zoho Reports 78%
6 BOARD 77%
7 MicroStrategy BI 77%
8 TIBCO Business Intelligence 76%
9 IBM Cognos Platform 73%
10 SAS BI 73%
CATEGORY AVERAGE 76%

Business Intelligence Category Report
Vendor CapabilitySatisfaction
This section provides detailed information on user satisfaction for each vendor capability regarding their product offering(s). Use these pages to dig deeper into areas ofparticular interest or concern.
Product Strategy and Rate of ImprovementPurchasing software can be a significant commitment, so it’s important to know if your vendor is serious about the need for constant improvementand deliberate strategic direction. Vendors who don’t stay on top of emerging needs and trends won’t enable you to meet your business goals. Use thedata in this section to separate innovators from imposters.
DUNDAS BITOP PRODUCT
Delights 42%
HighlySatisfies 48%
AlmostSatisfies 9%
Disappoints --
83 %Product Strategy
and Rate ofImprovement
2 Tableau 79%
3 Qlik 76%
4 Microsoft BI 75%
5 Zoho Reports 73%
6 SAS BI 73%
7 BOARD 72%
8 TIBCO Business Intelligence 71%
9 MicroStrategy BI 69%
10 IBM Cognos Platform 67%
CATEGORY AVERAGE 72%
Usability and IntuitivenessEnd user learning curves cost the organization money. Pay attention to your end users’ technical ability to determine how important UX is in yourpurchase.
TABLEAUTOP PRODUCT
Delights 46%
HighlySatisfies 39%
AlmostSatisfies 14%
Disappoints 1%
82 %Usability andIntuitiveness
2 SAS BI 78%
3 Qlik 77%
4 TIBCO Business Intelligence 76%
5 Dundas BI 76%
6 Microsoft BI 76%
7 BOARD 73%
8 WebFOCUS 73%
9 MicroStrategy BI 72%
10 Zoho Reports 71%
CATEGORY AVERAGE 73%

Business Intelligence Category Report
Vendor CapabilitySatisfaction
This section provides detailed information on user satisfaction for each vendor capability regarding their product offering(s). Use these pages to dig deeper into areas ofparticular interest or concern.
Vendor SupportThe importance of vendor support will vary for each organization depending on internal capabilities, but there will always be issues that only thevendor can resolve. Use the data in this section to see which vendors tend to under-service their product and which will offer quality support.
DUNDAS BITOP PRODUCT
Delights 73%
HighlySatisfies 15%
AlmostSatisfies 12%
Disappoints --
90 %Vendor Support
2 WebFOCUS 83%
3 Tableau 77%
4 Microsoft BI 75%
5 TIBCO Business Intelligence 72%
6 Qlik 72%
7 Zoho Reports 71%
8 SAS BI 71%
9 IBM Cognos Platform 70%
10 Oracle BI Solutions 69%
CATEGORY AVERAGE 73%
Ease of Data IntegrationThe ability to integrate with other systems is increasingly important; without this, manual data loading and extraction can be time-consuming andprone to error. Use this section to see which vendors will cause headaches and which will make data integration easy.
TABLEAUTOP PRODUCT
Delights 37%
HighlySatisfies 44%
AlmostSatisfies 18%
Disappoints 1%
79 %Ease of DataIntegration
2 Qlik 79%
3 MicroStrategy BI 79%
4 Zoho Reports 77%
5 Dundas BI 77%
6 TIBCO Business Intelligence 76%
7 Microsoft BI 76%
8 WebFOCUS 75%
9 BOARD 74%
10 SAS BI 73%
CATEGORY AVERAGE 74%

Business Intelligence Category Report
Vendor CapabilitySatisfaction
This section provides detailed information on user satisfaction for each vendor capability regarding their product offering(s). Use these pages to dig deeper into areas ofparticular interest or concern.
Ease of IT AdministrationAdministrative interfaces don’t get the same attention as those built for end users, but they shouldn’t be clunky or unintuitive. Use the data in thissection to determine which vendors make administration easy, so that your IT personnel can resolve issues and perform configurations efficiently andeffectively.
DUNDAS BITOP PRODUCT
Delights 45%
HighlySatisfies 42%
AlmostSatisfies 9%
Disappoints 3%
82 %Ease of IT
Administration
2 Microsoft BI 80%
3 Qlik 78%
4 Zoho Reports 77%
5 MicroStrategy BI 75%
6 Tableau 74%
7 SAS BI 72%
8 WebFOCUS 72%
9 IBM Cognos Platform 71%
10 Oracle BI Solutions 71%
CATEGORY AVERAGE 73%
Ease of CustomizationOut-of-the-box functionality often isn’t enough, especially for niche or industry-specific software, and the reason you’re buying rather than building is tosave time and money in the first place. Don’t get bogged down in a difficult customization; use the data in this section to make sure you can easilyachieve the functionality you need for your particular situation.
DUNDAS BITOP PRODUCT
Delights 47%
HighlySatisfies 38%
AlmostSatisfies 16%
Disappoints --
83 %Ease of
Customization
2 Microsoft BI 78%
3 Tableau 77%
4 Qlik 75%
5 BOARD 74%
6 Zoho Reports 72%
7 WebFOCUS 72%
8 IBM Cognos Platform 71%
9 Oracle BI Solutions 71%
10 MicroStrategy BI 71%
CATEGORY AVERAGE 72%

Business Intelligence Category Report
Vendor CapabilitySatisfaction
This section provides detailed information on user satisfaction for each vendor capability regarding their product offering(s). Use these pages to dig deeper into areas ofparticular interest or concern.
Availability and Quality of TrainingEffective and readily available training enables users to get the most out of the software you’ve chosen. Use this section to make sure your vendor’straining programs and materials measure up.
TABLEAUTOP PRODUCT
Delights 40%
HighlySatisfies 44%
AlmostSatisfies 15%
Disappoints 1%
80 %Availability and
Quality of Training
2 MicroStrategy BI 79%
3 Dundas BI 73%
4 IBM Cognos Platform 72%
5 Qlik 71%
6 BOARD 71%
7 TIBCO Business Intelligence 71%
8 WebFOCUS 69%
9 Microsoft BI 69%
10 Zoho Reports 69%
CATEGORY AVERAGE 71%
Ease of ImplementationChoosing the right software is only the first step. Successfully implementing the new solution is necessary in order to realize its full value and promoteend user adoption. Use the data in this section to determine which software is easy to implement, and which may jeopardize your goals by causingtrouble in this stage.
DUNDAS BITOP PRODUCT
Delights 59%
HighlySatisfies 25%
AlmostSatisfies 13%
Disappoints 3%
84 %Ease of
Implementation
2 WebFOCUS 80%
3 Zoho Reports 78%
4 SAS BI 78%
5 Tableau 78%
6 Qlik 74%
7 BOARD 73%
8 IBM Cognos Platform 71%
9 MicroStrategy BI 69%
10 Microsoft BI 68%
CATEGORY AVERAGE 72%

Business Intelligence Category Report
Product Feature Summary This page summarizes user satisfaction with a variety of product features. While strong and consistent performanceacross the board is desirable, you may be willing to tolerate low scores on features that don’t impact your primary usecase or core objectives. Use this high-level data to help plan and structure your product evaluation.
= Highest Score
= Lowest Score
VENDOROVERALLFEATURESATISFACTION
BI PLATFORMADMINISTRATION BI SECURITY COLLABORATION
DATAINTEGRATIONAND ETL
INTELLIGENTALERTS ANDNOTIFICATIONS
METADATAMANAGEMENT MOBILE
OPERATIONALREPORTINGCAPABILITIES
PERSONALIZEDEXECUTIVEDASHBOARDS
PREDICTIVE ANDWHAT-IFANALYSIS
SELF-SERVICEAND AD HOCCAPABILITIES
Tableau 77% 77% 76% 74% 77% 75% 76% 76% 81% 81% 77% 78%
Dundas BI 77% 83% 83% 73% 73% 78% 70% 67% 83% 86% 70% 77%
BOARD 77% 79% 76% 72% 77% 67% 82% 71% 82% 83% 76% 76%
Zoho Reports 74% 73% 75% 73% 74% 71% 71% 72% 78% 77% 71% 78%
WebFOCUS 73% 69% 75% 72% 78% 72% 75% 56% 75% 83% 69% 72%
MicroStrategy BI 72% 78% 75% 70% 72% 71% 76% 66% 76% 74% 65% 69%
SAS BI 71% 68% 75% 73% 70% 68% 72% 66% 73% 68% 73% 70%
TIBCO Business Intelligence 71% 69% 67% 73% 69% 70% 69% 55% 77% 78% 77% 73%
Qlik 71% 73% 69% 72% 72% 68% 69% 68% 74% 73% 71% 70%
Microsoft BI 69% 70% 69% 65% 70% 66% 68% 72% 73% 73% 67% 70%
CATEGORY AVERAGE 73% 74% 73% 69% 73% 69% 71% 68% 76% 75% 71% 71%
18

Business Intelligence Category Report
Product Feature Summary This page summarizes user satisfaction with a variety of product features. While strong and consistent performanceacross the board is desirable, you may be willing to tolerate low scores on features that don’t impact your primary usecase or core objectives. Use this high-level data to help plan and structure your product evaluation.
= Highest Score
= Lowest Score
VENDOROVERALLFEATURESATISFACTION
BI PLATFORMADMINISTRATION BI SECURITY COLLABORATION
DATAINTEGRATIONAND ETL
INTELLIGENTALERTS ANDNOTIFICATIONS
METADATAMANAGEMENT MOBILE
OPERATIONALREPORTINGCAPABILITIES
PERSONALIZEDEXECUTIVEDASHBOARDS
PREDICTIVE ANDWHAT-IFANALYSIS
SELF-SERVICEAND AD HOCCAPABILITIES
IBM Cognos Platform 68% 72% 75% 65% 67% 66% 66% 61% 75% 67% 69% 65%
Oracle BI Solutions 67% 68% 69% 66% 70% 66% 69% 63% 68% 69% 66% 61%
SAP BI 66% 70% 69% 60% 70% 61% 66% 61% 74% 64% 64% 66%
CATEGORY AVERAGE 73% 74% 73% 69% 73% 69% 71% 68% 76% 75% 71% 71%
VENDORS WITH INSUFFICIENT DATA
5000fish Inc Yurbi 89% 100% 75% 100% 100% 75% 75% 75% 100% 100% 75% 100%
1010data Analytical Platform 71% 63% 63% 81% 75% 58% 75% 75% 75% 67% 67% 75%
Pentaho 69% 60% 75% 67% 70% 83% 50% 63% 70% 75% 81% 75%
SurveyMonkey 85% 81% 75% 90% 79% 80% 83% 85% 92% 90% 79% 95%
Birst BI Platform 66% 70% 65% 55% 65% 65% 70% 75% 75% 60% 65% 70%
Yellowfin 83% 81% 88% 75% 75% 81% 81% 88% 81% 81% 88% 94%
Alteryx 71% 75% -- 88% 100% 50% 75% -- 50% 0 75% 75%
19

Business Intelligence Category Report
Product Feature Satisfaction This section provides detailed information on user satisfaction for each product feature.Use these pages to dig deeper into areas of particular interest or concern.
Product FeaturesThis table lists and describes all the features that are evaluated in the Business Intelligence software category. For your convenience, thesedescriptions are repeated under the feature subheadings in the subsequent pages.
BI Platform Administration Centralized console to manage BI portal administration. Management metrics and reportsto provide insight into usage, resource utilization, security, and other activities.
BI Security Includes data access control and classification, entitlement standards, data transmission,and data storage restrictions.
Collaboration Includes ability to view, share and direct work between co-workers in real or near real-time.
Data Integration and ETL Integration of data from multiple sources, merging systems and applications for a unifiedview of a company's data assets. Includes data warehousing and Extract-Transform-Load.
Intelligent Alerts andNotifications
Ability to create, manage, send and receive notifications, enhancing efficiency andproductivity.
Metadata ManagementA metadata layer makes reporting easy and eliminates the need for coding and SQL,allowing users and report writers to see and access information in simple businesslanguage.
Mobile Ability to support multiple devices, OSes and platforms using mobile optimized, HTML-based web access and/or native applications.
Operational ReportingCapabilities Real-time detailed reporting to support operational business processes.
Personalized ExecutiveDashboards Displays actionable key performance indicators (KPIs) for corporate officers.
Predictive and What-If Analysis The ability to accurately identify future outcomes using data, statistical algorithms, andmachine learning.
Self-Service and Ad HocCapabilities
Selected user groups are able to interact with BI data, slice and dice, and find answers ontheir own.
BI Platform AdministrationCentralized console to manage BI portal administration. Management metrics and reports to provide insight into usage, resource utilization, security,and other activities.
DUNDAS BITOP PRODUCT
Delights 44%
HighlySatisfies 44%
AlmostSatisfies 13%
Disappoints --
83%BI Platform
Administration
2 BOARD 79%
3 MicroStrategy BI 78%
4 Tableau 77%
5 Zoho Reports 73%
6 Qlik 73%
7 IBM Cognos Platform 72%
8 Microsoft BI 70%
9 SAP BI 70%
10 WebFOCUS 69%
CATEGORY AVERAGE 74%
20

Business Intelligence Category Report
Product Feature Satisfaction This section provides detailed information on user satisfaction for each product feature.Use these pages to dig deeper into areas of particular interest or concern.
BI SecurityIncludes data access control and classification, entitlement standards, data transmission, and data storage restrictions.
DUNDAS BITOP PRODUCT
Delights 48%
HighlySatisfies 42%
AlmostSatisfies 6%
Disappoints 3%
83%BI Security
2 Tableau 76%
3 BOARD 76%
4 Zoho Reports 75%
5 SAS BI 75%
6 MicroStrategy BI 75%
7 IBM Cognos Platform 75%
8 WebFOCUS 75%
9 SAP BI 69%
10 Oracle BI Solutions 69%
CATEGORY AVERAGE 73%
CollaborationIncludes ability to view, share and direct work between co-workers in real or near real-time.
TABLEAUTOP PRODUCT
Delights 27%
HighlySatisfies 47%
AlmostSatisfies 26%
Disappoints 1%
74%Collaboration
2 SAS BI 73%
3 Dundas BI 73%
4 TIBCO Business Intelligence 73%
5 Zoho Reports 73%
6 BOARD 72%
7 WebFOCUS 72%
8 Qlik 72%
9 MicroStrategy BI 70%
10 Oracle BI Solutions 66%
CATEGORY AVERAGE 69%
21

Business Intelligence Category Report
Product Feature Satisfaction This section provides detailed information on user satisfaction for each product feature.Use these pages to dig deeper into areas of particular interest or concern.
Data Integration and ETLIntegration of data from multiple sources, merging systems and applications for a unified view of a company's data assets. Includes data warehousingand Extract-Transform-Load.
WEBFOCUSTOP PRODUCT
Delights 22%
HighlySatisfies 67%
AlmostSatisfies 11%
Disappoints --
78%Data Integration
and ETL
2 Tableau 77%
3 BOARD 77%
4 Zoho Reports 74%
5 Dundas BI 73%
6 Qlik 72%
7 MicroStrategy BI 72%
8 Microsoft BI 70%
9 SAS BI 70%
10 Oracle BI Solutions 70%
CATEGORY AVERAGE 73%
Intelligent Alerts and NotificationsAbility to create, manage, send and receive notifications, enhancing efficiency and productivity.
DUNDAS BITOP PRODUCT
Delights 33%
HighlySatisfies 44%
AlmostSatisfies 22%
Disappoints --
78%Intelligent Alertsand Notifications
2 Tableau 75%
3 WebFOCUS 72%
4 MicroStrategy BI 71%
5 Zoho Reports 71%
6 TIBCO Business Intelligence 70%
7 Qlik 68%
8 SAS BI 68%
9 BOARD 67%
10 IBM Cognos Platform 66%
CATEGORY AVERAGE 69%
22

Business Intelligence Category Report
Product Feature Satisfaction This section provides detailed information on user satisfaction for each product feature.Use these pages to dig deeper into areas of particular interest or concern.
Metadata ManagementA metadata layer makes reporting easy and eliminates the need for coding and SQL, allowing users and report writers to see and access informationin simple business language.
BOARDTOP PRODUCT
Delights 39%
HighlySatisfies 50%
AlmostSatisfies 11%
Disappoints --
82%Metadata
Management
2 Tableau 76%
3 MicroStrategy BI 76%
4 WebFOCUS 75%
5 SAS BI 72%
6 Zoho Reports 71%
7 Dundas BI 70%
8 TIBCO Business Intelligence 69%
9 Qlik 69%
10 Oracle BI Solutions 69%
CATEGORY AVERAGE 71%
MobileAbility to support multiple devices, OSes and platforms using mobile optimized, HTML-based web access and/or native applications.
TABLEAUTOP PRODUCT
Delights 36%
HighlySatisfies 38%
AlmostSatisfies 20%
Disappoints 4%
76%Mobile
2 Zoho Reports 72%
3 Microsoft BI 72%
4 BOARD 71%
5 Qlik 68%
6 Dundas BI 67%
7 MicroStrategy BI 66%
8 SAS BI 66%
9 Oracle BI Solutions 63%
10 SAP BI 61%
CATEGORY AVERAGE 68%
23

Business Intelligence Category Report
Product Feature Satisfaction This section provides detailed information on user satisfaction for each product feature.Use these pages to dig deeper into areas of particular interest or concern.
Operational Reporting CapabilitiesReal-time detailed reporting to support operational business processes.
DUNDAS BITOP PRODUCT
Delights 39%
HighlySatisfies 55%
AlmostSatisfies 6%
Disappoints --
83%OperationalReporting
Capabilities
2 BOARD 82%
3 Tableau 81%
4 Zoho Reports 78%
5 TIBCO Business Intelligence 77%
6 MicroStrategy BI 76%
7 IBM Cognos Platform 75%
8 WebFOCUS 75%
9 SAP BI 74%
10 Qlik 74%
CATEGORY AVERAGE 76%
Personalized Executive DashboardsDisplays actionable key performance indicators (KPIs) for corporate officers.
DUNDAS BITOP PRODUCT
Delights 53%
HighlySatisfies 34%
AlmostSatisfies 9%
Disappoints --
86%Personalized
ExecutiveDashboards
2 WebFOCUS 83%
3 BOARD 83%
4 Tableau 81%
5 TIBCO Business Intelligence 78%
6 Zoho Reports 77%
7 MicroStrategy BI 74%
8 Qlik 73%
9 Microsoft BI 73%
10 Oracle BI Solutions 69%
CATEGORY AVERAGE 75%
24

Business Intelligence Category Report
Product Feature Satisfaction This section provides detailed information on user satisfaction for each product feature.Use these pages to dig deeper into areas of particular interest or concern.
Predictive and What-If AnalysisThe ability to accurately identify future outcomes using data, statistical algorithms, and machine learning.
TIBCO BUSINESSINTELLIGENCETOP PRODUCT
Delights 31%
HighlySatisfies 46%
AlmostSatisfies 23%
Disappoints --
77%Predictive and
What-If Analysis
2 Tableau 77%
3 BOARD 76%
4 SAS BI 73%
5 Zoho Reports 71%
6 Qlik 71%
7 Dundas BI 70%
8 IBM Cognos Platform 69%
9 WebFOCUS 69%
10 Microsoft BI 67%
CATEGORY AVERAGE 71%
Self-Service and Ad Hoc CapabilitiesSelected user groups are able to interact with BI data, slice and dice, and find answers on their own.
ZOHO REPORTSTOP PRODUCT
Delights 21%
HighlySatisfies 63%
AlmostSatisfies 11%
Disappoints --
78%Self-Service and
Ad Hoc Capabilities
2 Tableau 78%
3 Dundas BI 77%
4 BOARD 76%
5 TIBCO Business Intelligence 73%
6 WebFOCUS 72%
7 SAS BI 70%
8 Qlik 70%
9 Microsoft BI 70%
10 MicroStrategy BI 69%
CATEGORY AVERAGE 71%
25

Business Intelligence Category Report
EmotionalFootprintSummary
The Net Emotional Footprint measures high-level user sentiment towards particular product offerings. It aggregates emotional response ratings for various dimensions of the vendor-client relationshipand product effectiveness, creating a powerful indicator of overall user feeling toward the vendor and product. While purchasing decisions shouldn’t be based on emotion, it’s valuable to know what kindof emotional response the vendor you’re considering elicits from their users.
-4 -3 -2 -1NEGATIVE
+1NEUTRAL
+2 +3 +4POSITIVE
EMOTIONAL SPECTRUM SCALE %POSITIVE
%NEGATIVE
EMOTIONALFOOTPRINT- =
-100 to 20 +21 to +40 +41 to +60 +61 to +81 +81 to +100
INCLUDESPRODUCTENHANCEMENTS
97% INTEGRITY 96% CONTINUALLYIMPROVING 94% WASTES TIME 6% PERFORMANCE
RESTRICTING 6% VENDOR'SINTEREST FIRST 4%
RESPECTFUL 91% EFFICIENT 91% EFFECTIVE 91% DESPISED 9%CHARGES FORPRODUCTENHANCEMENTS
9% ROADBLOCK TOINNOVATION 9%
PERFORMANCEENHANCING 90% ENABLES
PRODUCTIVITY 90% CONTINUALLYIMPROVING 89% OVER PROMISED 10% GREEDY 8% HARDBALL
TACTICS 7%
ENABLESPRODUCTIVITY 100% SECURITY
PROTECTS 91% RELIABLE 91% VENDOR'SINTEREST FIRST 17%
VENDORFRIENDLYPOLICIES
14% FRUSTRATING 13%
TRUSTWORTHY 90% FAIR 85% ENABLESPRODUCTIVITY 84% OVER PROMISED 10% ROADBLOCK TO
INNOVATION 8% HARDBALLTACTICS 7%
PERFORMANCEENHANCING 92% RESPECTFUL 91% ENABLES
PRODUCTIVITY 88% OVER PROMISED 40% COMMODITYFEATURES 17% HARDBALL
TACTICS 15%
RESPECTFUL 91% ENABLESPRODUCTIVITY 88% TRUSTWORTHY 86% VENDOR'S
INTEREST FIRST 29% OVER PROMISED 21% HARDBALLTACTICS 14%
INTEGRITY 93% PERFORMANCEENHANCING 93% ENABLES
PRODUCTIVITY 93% OVER PROMISED 25%LEVERAGESINCUMBENTSTATUS
21% SELFISH 20%
TRANSPARENT 82% UNIQUEFEATURES 79% SECURITY
PROTECTS 79%VENDORFRIENDLYPOLICIES
33% FRUSTRATING 25% DESPISED 20%
HELPSINNOVATE 80% RESPECTFUL 80% CONTINUALLY
IMPROVING 78% OVER PROMISED 29% GREEDY 22% VENDOR'SINTEREST FIRST 18%
VENDOR NET EMOTIONALFOOTPRINT
NET EMOTIONALFOOTPRINT DISTRIBUTION
STRONGESTPOSITIVE EMOTIONS
STRONGESTNEGATIVE EMOTIONS
Dundas BI +862% NEGATIVE 88% POSITIVE
WebFOCUS +792% NEGATIVE 81% POSITIVE
Tableau +783% NEGATIVE 81% POSITIVE
Zoho Reports +764% NEGATIVE 80% POSITIVE
Qlik +753% NEGATIVE 78% POSITIVE
BOARD +735% NEGATIVE 78% POSITIVE
MicroStrategy BI +735% NEGATIVE 78% POSITIVE
TIBCO Business Intelligence +6510% NEGATIVE 75% POSITIVE
SAS BI +5710% NEGATIVE 67% POSITIVE
Microsoft BI +5613% NEGATIVE 69% POSITIVE
26

Business Intelligence Category Report
EmotionalFootprintSummary
The Net Emotional Footprint measures high-level user sentiment towards particular product offerings. It aggregates emotional response ratings for various dimensions of the vendor-client relationshipand product effectiveness, creating a powerful indicator of overall user feeling toward the vendor and product. While purchasing decisions shouldn’t be based on emotion, it’s valuable to know what kindof emotional response the vendor you’re considering elicits from their users.
-4 -3 -2 -1NEGATIVE
+1NEUTRAL
+2 +3 +4POSITIVE
EMOTIONAL SPECTRUM SCALE %POSITIVE
%NEGATIVE
EMOTIONALFOOTPRINT- =
-100 to 20 +21 to +40 +41 to +60 +61 to +81 +81 to +100
ENABLESPRODUCTIVITY 80% RESPECTFUL 79% RELIABLE 74% OVER PROMISED 35% VENDOR'S
INTEREST FIRST 19% GREEDY 15%
RESPECTFUL 75% RELIABLE 72% PERFORMANCEENHANCING 72% HARDBALL
TACTICS 23% VENDOR'SINTEREST FIRST 23% WASTES TIME 21%
RESPECTFUL 87% SECURITYPROTECTS 70% PERFORMANCE
ENHANCING 70% OVER PROMISED 36% VENDOR'SINTEREST FIRST 36%
CHARGES FORPRODUCTENHANCEMENTS
35%
VENDOR NET EMOTIONALFOOTPRINT
NET EMOTIONALFOOTPRINT DISTRIBUTION
STRONGESTPOSITIVE EMOTIONS
STRONGESTNEGATIVE EMOTIONS
IBM Cognos Platform +519% NEGATIVE 60% POSITIVE
SAP BI +4612% NEGATIVE 58% POSITIVE
Oracle BI Solutions +3819% NEGATIVE 57% POSITIVE
APPRECIATESINCUMBENTSTATUS
100% RESPECTFUL 100% TRUSTWORTHY 100% GREEDY 100% DECEPTIVE 50%CHARGES FORPRODUCTENHANCEMENTS
25%
RESPECTFUL 100% EFFICIENT 100% EFFECTIVE 100%
TRUSTWORTHY 75% INTEGRITY 75% FAIR 75% VENDOR'SINTEREST FIRST 50% DECEPTIVE 50% OVER PROMISED 50%
INSPIRING 100%INCLUDESPRODUCTENHANCEMENTS
100% HELPSINNOVATE 100% OVER PROMISED 33%
INSPIRING 75%INCLUDESPRODUCTENHANCEMENTS
75% HELPSINNOVATE 75% DECEPTIVE 33% GREEDY 33% HARDBALL
TACTICS 33%
HELPSINNOVATE 100% CONTINUALLY
IMPROVING 100% SAVES TIME 100%
VENDORS WITH INSUFFICIENT DATA
Pentaho +5811% NEGATIVE 69% POSITIVE
SurveyMonkey +87-- NEGATIVE 87% POSITIVE
Birst BI Platform +576% NEGATIVE 63% POSITIVE
Alteryx +941% NEGATIVE 95% POSITIVE
Yellowfin +4826% NEGATIVE 74% POSITIVE
1010data Analytical Platform +94-- NEGATIVE 94% POSITIVE
27

Business Intelligence Category Report
Emotional Footprint This section digs deeper into the emotional connection between software vendors and users, displaying user responses to a variety of specific “emotional spectrum” scenarios that express dimensionsof the vendor-client relationship and product effectiveness. These scenarios are organized thematically by category. Use this information to understand the details behind each vendor’s Net EmotionalFootprint score, and to target areas of particular interest or concern.
-4 -3 -2 -1NEGATIVE
+1NEUTRAL
+2 +3 +4POSITIVE
EMOTIONAL SPECTRUM SCALE %POSITIVE
%NEGATIVE
EMOTIONALFOOTPRINT- =
-100 to 20 +21 to +40 +41 to +60 +61 to +81 +81 to +100
CATEGORY
ServiceExperienceGood service matters. The last thing you need isto be disrespected by your software vendor, or toget bogged down by their ineptitude or neglect.This section displays data related to quality andeffectiveness of service, so you can knowwhether you’ll be treated well before and afteryou’ve made the purchase.
Service ExperienceDisrespectful vs. Respectful
DISTRIBUTION -- 6% 94%
DISTRIBUTION -- 9% 91%
DISTRIBUTION -- 9% 91%
DISTRIBUTION -- 9% 91%
DISTRIBUTION -- 12% 88%
DISTRIBUTION 4% 9% 87%
DISTRIBUTION 6% 6% 88%
DISTRIBUTION 2% 14% 83%
DISTRIBUTION 7% 7% 87%
DISTRIBUTION -- 21% 79%
DISTRIBUTION 2% 14% 84%
1 Dundas BI +94
2 MicroStrategy BI +91
3 BOARD +91
4 WebFOCUS +91
5 Tableau +88
6 Zoho Reports +83
7 TIBCO Business Intelligence +82
8 Qlik +81
9 Oracle BI Solutions +80
10 IBM Cognos Platform +79
CATEGORY AVERAGE +82
28

Business Intelligence Category Report
Emotional Footprint This section digs deeper into the emotional connection between software vendors and users, displaying user responses to a variety of specific “emotional spectrum” scenarios that express dimensionsof the vendor-client relationship and product effectiveness. These scenarios are organized thematically by category. Use this information to understand the details behind each vendor’s Net EmotionalFootprint score, and to target areas of particular interest or concern.
-4 -3 -2 -1NEGATIVE
+1NEUTRAL
+2 +3 +4POSITIVE
EMOTIONAL SPECTRUM SCALE %POSITIVE
%NEGATIVE
EMOTIONALFOOTPRINT- =
-100 to 20 +21 to +40 +41 to +60 +61 to +81 +81 to +100
Service ExperienceBureaucratic vs. Efficient
DISTRIBUTION -- 10% 90%
DISTRIBUTION 9% -- 91%
DISTRIBUTION 4% 13% 83%
DISTRIBUTION -- 22% 78%
DISTRIBUTION 5% 14% 81%
DISTRIBUTION 4% 17% 78%
DISTRIBUTION 4% 20% 76%
DISTRIBUTION 13% 13% 75%
DISTRIBUTION 13% 15% 72%
DISTRIBUTION 13% 25% 63%
DISTRIBUTION 9% 18% 73%
1 Dundas BI +90
2 WebFOCUS +82
3 BOARD +79
4 MicroStrategy BI +78
5 Qlik +76
6 Zoho Reports +74
7 Tableau +72
8 TIBCO Business Intelligence +62
9 Microsoft BI +59
10 SAS BI +50
CATEGORY AVERAGE +65
Service ExperienceNeglectful vs. Caring
DISTRIBUTION -- 9% 91%
DISTRIBUTION -- 16% 84%
DISTRIBUTION -- 21% 79%
DISTRIBUTION -- 22% 78%
DISTRIBUTION 2% 18% 79%
DISTRIBUTION 6% 13% 81%
DISTRIBUTION 9% 9% 83%
DISTRIBUTION 9% 26% 65%
DISTRIBUTION 15% 20% 65%
DISTRIBUTION 13% 30% 57%
DISTRIBUTION 8% 23% 70%
1 WebFOCUS +91
2 Dundas BI +84
3 Qlik +79
4 MicroStrategy BI +78
5 Tableau +77
6 TIBCO Business Intelligence +75
7 BOARD +74
8 Zoho Reports +56
9 Microsoft BI +50
10 Oracle BI Solutions +44
CATEGORY AVERAGE +62
29

Business Intelligence Category Report
Emotional Footprint This section digs deeper into the emotional connection between software vendors and users, displaying user responses to a variety of specific “emotional spectrum” scenarios that express dimensionsof the vendor-client relationship and product effectiveness. These scenarios are organized thematically by category. Use this information to understand the details behind each vendor’s Net EmotionalFootprint score, and to target areas of particular interest or concern.
-4 -3 -2 -1NEGATIVE
+1NEUTRAL
+2 +3 +4POSITIVE
EMOTIONAL SPECTRUM SCALE %POSITIVE
%NEGATIVE
EMOTIONALFOOTPRINT- =
-100 to 20 +21 to +40 +41 to +60 +61 to +81 +81 to +100
Service ExperienceFrustrating vs. Effective
DISTRIBUTION -- 9% 91%
DISTRIBUTION 3% 13% 84%
DISTRIBUTION 2% 14% 83%
DISTRIBUTION 4% 12% 84%
DISTRIBUTION 4% 17% 78%
DISTRIBUTION 4% 17% 78%
DISTRIBUTION 6% 19% 75%
DISTRIBUTION 6% 27% 67%
DISTRIBUTION 13% 17% 70%
DISTRIBUTION 15% 25% 60%
DISTRIBUTION 10% 18% 72%
1 WebFOCUS +91
2 Dundas BI +81
3 Qlik +81
4 Tableau +80
5 MicroStrategy BI +74
6 BOARD +74
7 TIBCO Business Intelligence +69
8 IBM Cognos Platform +61
9 Zoho Reports +57
10 Microsoft BI +45
CATEGORY AVERAGE +62
Service ExperienceWastes Time vs. Saves Time
DISTRIBUTION 6% 13% 81%
DISTRIBUTION 4% 18% 79%
DISTRIBUTION 5% 17% 79%
DISTRIBUTION 4% 17% 78%
DISTRIBUTION -- 27% 73%
DISTRIBUTION 4% 22% 74%
DISTRIBUTION 4% 22% 74%
DISTRIBUTION 6% 19% 75%
DISTRIBUTION 12% 18% 70%
DISTRIBUTION 19% 19% 63%
DISTRIBUTION 9% 21% 70%
1 Dundas BI +75
2 Tableau +75
3 Qlik +74
4 Zoho Reports +74
5 WebFOCUS +73
6 MicroStrategy BI +70
7 BOARD +70
8 TIBCO Business Intelligence +69
9 Microsoft BI +58
10 SAS BI +44
CATEGORY AVERAGE +61
30

Business Intelligence Category Report
Emotional Footprint This section digs deeper into the emotional connection between software vendors and users, displaying user responses to a variety of specific “emotional spectrum” scenarios that express dimensionsof the vendor-client relationship and product effectiveness. These scenarios are organized thematically by category. Use this information to understand the details behind each vendor’s Net EmotionalFootprint score, and to target areas of particular interest or concern.
-4 -3 -2 -1NEGATIVE
+1NEUTRAL
+2 +3 +4POSITIVE
EMOTIONAL SPECTRUM SCALE %POSITIVE
%NEGATIVE
EMOTIONALFOOTPRINT- =
-100 to 20 +21 to +40 +41 to +60 +61 to +81 +81 to +100
CATEGORY
ConflictResolutionDisagreements are inevitable, but knowing yourvendor will handle them reasonably, fairly, andamiably can give you peace of mind. Use thedata in this section to understand which vendorswill behave professionally when conflict arises.
Conflict ResolutionLack Of Integrity vs. Integrity
DISTRIBUTION -- 4% 96%
DISTRIBUTION -- 10% 90%
DISTRIBUTION 7% -- 93%
DISTRIBUTION -- 14% 86%
DISTRIBUTION -- 14% 86%
DISTRIBUTION 5% 8% 87%
DISTRIBUTION -- 20% 80%
DISTRIBUTION 5% 14% 81%
DISTRIBUTION -- 34% 66%
DISTRIBUTION 9% 20% 70%
DISTRIBUTION 5% 18% 77%
1 Dundas BI +96
2 WebFOCUS +90
3 TIBCO Business Intelligence +86
4 MicroStrategy BI +86
5 Zoho Reports +86
6 Tableau +82
7 Qlik +80
8 BOARD +76
9 IBM Cognos Platform +66
10 Microsoft BI +61
CATEGORY AVERAGE +72
31

Business Intelligence Category Report
Emotional Footprint This section digs deeper into the emotional connection between software vendors and users, displaying user responses to a variety of specific “emotional spectrum” scenarios that express dimensionsof the vendor-client relationship and product effectiveness. These scenarios are organized thematically by category. Use this information to understand the details behind each vendor’s Net EmotionalFootprint score, and to target areas of particular interest or concern.
-4 -3 -2 -1NEGATIVE
+1NEUTRAL
+2 +3 +4POSITIVE
EMOTIONAL SPECTRUM SCALE %POSITIVE
%NEGATIVE
EMOTIONALFOOTPRINT- =
-100 to 20 +21 to +40 +41 to +60 +61 to +81 +81 to +100
Conflict ResolutionVendor Friendly Policies vs. Client FriendlyPolicies
DISTRIBUTION -- 7% 93%
DISTRIBUTION 2% 15% 83%
DISTRIBUTION -- 19% 81%
DISTRIBUTION 5% 10% 86%
DISTRIBUTION 7% 7% 87%
DISTRIBUTION 4% 12% 84%
DISTRIBUTION -- 30% 70%
DISTRIBUTION 14% 5% 82%
DISTRIBUTION 17% 15% 69%
DISTRIBUTION 9% 34% 56%
DISTRIBUTION 10% 16% 73%
1 Dundas BI +93
2 Qlik +81
3 MicroStrategy BI +81
4 BOARD +81
5 TIBCO Business Intelligence +80
6 Tableau +80
7 WebFOCUS +70
8 Zoho Reports +68
9 Microsoft BI +52
10 IBM Cognos Platform +47
CATEGORY AVERAGE +63
Conflict ResolutionSelfish vs. Altruistic
DISTRIBUTION -- 14% 86%
DISTRIBUTION 5% 17% 78%
DISTRIBUTION 5% 19% 76%
DISTRIBUTION -- 29% 71%
DISTRIBUTION -- 33% 67%
DISTRIBUTION 5% 27% 68%
DISTRIBUTION -- 40% 60%
DISTRIBUTION 20% -- 80%
DISTRIBUTION 6% 41% 53%
DISTRIBUTION 13% 28% 59%
DISTRIBUTION 7% 28% 65%
1 Dundas BI +86
2 Tableau +73
3 BOARD +71
4 Qlik +71
5 MicroStrategy BI +67
6 Zoho Reports +63
7 WebFOCUS +60
8 TIBCO Business Intelligence +60
9 IBM Cognos Platform +47
10 Microsoft BI +46
CATEGORY AVERAGE +58
32

Business Intelligence Category Report
Emotional Footprint This section digs deeper into the emotional connection between software vendors and users, displaying user responses to a variety of specific “emotional spectrum” scenarios that express dimensionsof the vendor-client relationship and product effectiveness. These scenarios are organized thematically by category. Use this information to understand the details behind each vendor’s Net EmotionalFootprint score, and to target areas of particular interest or concern.
-4 -3 -2 -1NEGATIVE
+1NEUTRAL
+2 +3 +4POSITIVE
EMOTIONAL SPECTRUM SCALE %POSITIVE
%NEGATIVE
EMOTIONALFOOTPRINT- =
-100 to 20 +21 to +40 +41 to +60 +61 to +81 +81 to +100
Conflict ResolutionBig Fat Liars vs. Trustworthy
DISTRIBUTION -- 10% 90%
DISTRIBUTION -- 10% 90%
DISTRIBUTION 4% 4% 93%
DISTRIBUTION -- 14% 86%
DISTRIBUTION -- 14% 86%
DISTRIBUTION 1% 13% 86%
DISTRIBUTION 5% 10% 86%
DISTRIBUTION 7% 13% 80%
DISTRIBUTION -- 27% 73%
DISTRIBUTION 3% 34% 63%
DISTRIBUTION 4% 18% 78%
1 Qlik +90
2 WebFOCUS +90
3 Dundas BI +89
4 Zoho Reports +86
5 MicroStrategy BI +86
6 Tableau +85
7 BOARD +81
8 TIBCO Business Intelligence +73
9 SAS BI +73
10 IBM Cognos Platform +60
CATEGORY AVERAGE +73
Conflict ResolutionUnfair vs. Fair
DISTRIBUTION -- 10% 90%
DISTRIBUTION -- 14% 86%
DISTRIBUTION -- 14% 86%
DISTRIBUTION -- 15% 85%
DISTRIBUTION 4% 11% 86%
DISTRIBUTION 4% 12% 84%
DISTRIBUTION -- 23% 77%
DISTRIBUTION 7% 13% 80%
DISTRIBUTION 9% 17% 74%
DISTRIBUTION 3% 31% 66%
DISTRIBUTION 5% 20% 74%
1 WebFOCUS +90
2 BOARD +86
3 MicroStrategy BI +86
4 Qlik +85
5 Dundas BI +82
6 Tableau +80
7 Zoho Reports +77
8 TIBCO Business Intelligence +73
9 Microsoft BI +65
10 IBM Cognos Platform +63
CATEGORY AVERAGE +69
33

Business Intelligence Category Report
Emotional Footprint This section digs deeper into the emotional connection between software vendors and users, displaying user responses to a variety of specific “emotional spectrum” scenarios that express dimensionsof the vendor-client relationship and product effectiveness. These scenarios are organized thematically by category. Use this information to understand the details behind each vendor’s Net EmotionalFootprint score, and to target areas of particular interest or concern.
-4 -3 -2 -1NEGATIVE
+1NEUTRAL
+2 +3 +4POSITIVE
EMOTIONAL SPECTRUM SCALE %POSITIVE
%NEGATIVE
EMOTIONALFOOTPRINT- =
-100 to 20 +21 to +40 +41 to +60 +61 to +81 +81 to +100
CATEGORY
Negotiation andContractNegotiation doesn’t have to be adversarial. Bothparties are always looking to get the best deal,but finding a vendor who will work with yourather than against makes it more likely you’llboth be happy with the results. Use the data inthis section to determine which vendors willnegotiate pleasantly and in good faith.
Negotiation and ContractGreedy vs. Generous
DISTRIBUTION -- 9% 91%
DISTRIBUTION -- 17% 83%
DISTRIBUTION -- 33% 67%
DISTRIBUTION 3% 28% 69%
DISTRIBUTION 14% 7% 79%
DISTRIBUTION 8% 23% 68%
DISTRIBUTION 18% 9% 73%
DISTRIBUTION 5% 35% 60%
DISTRIBUTION 17% 25% 58%
DISTRIBUTION 22% 18% 59%
DISTRIBUTION 12% 25% 62%
1 Dundas BI +91
2 Zoho Reports +83
3 WebFOCUS +67
4 Qlik +66
5 MicroStrategy BI +65
6 Tableau +60
7 SAS BI +55
8 BOARD +55
9 TIBCO Business Intelligence +41
10 Microsoft BI +37
CATEGORY AVERAGE +50
34

Business Intelligence Category Report
Emotional Footprint This section digs deeper into the emotional connection between software vendors and users, displaying user responses to a variety of specific “emotional spectrum” scenarios that express dimensionsof the vendor-client relationship and product effectiveness. These scenarios are organized thematically by category. Use this information to understand the details behind each vendor’s Net EmotionalFootprint score, and to target areas of particular interest or concern.
-4 -3 -2 -1NEGATIVE
+1NEUTRAL
+2 +3 +4POSITIVE
EMOTIONAL SPECTRUM SCALE %POSITIVE
%NEGATIVE
EMOTIONALFOOTPRINT- =
-100 to 20 +21 to +40 +41 to +60 +61 to +81 +81 to +100
Negotiation and ContractDeceptive vs. Transparent
DISTRIBUTION -- 17% 83%
DISTRIBUTION 4% 9% 87%
DISTRIBUTION 3% 14% 83%
DISTRIBUTION -- 22% 78%
DISTRIBUTION 9% 9% 82%
DISTRIBUTION 7% 14% 79%
DISTRIBUTION 5% 20% 75%
DISTRIBUTION 8% 17% 75%
DISTRIBUTION 4% 25% 71%
DISTRIBUTION 12% 31% 58%
DISTRIBUTION 9% 24% 68%
1 Zoho Reports +83
2 Dundas BI +83
3 Qlik +80
4 WebFOCUS +78
5 SAS BI +73
6 MicroStrategy BI +72
7 BOARD +70
8 TIBCO Business Intelligence +67
9 Tableau +67
10 IBM Cognos Platform +46
CATEGORY AVERAGE +59
Negotiation and ContractOver Promised vs. Under Promised
DISTRIBUTION -- 27% 73%
DISTRIBUTION -- 33% 67%
DISTRIBUTION 4% 35% 61%
DISTRIBUTION 10% 23% 67%
DISTRIBUTION 10% 28% 62%
DISTRIBUTION 6% 44% 50%
DISTRIBUTION 25% 8% 67%
DISTRIBUTION 21% 29% 50%
DISTRIBUTION 29% 20% 51%
DISTRIBUTION 20% 45% 35%
DISTRIBUTION 19% 27% 54%
1 SAS BI +73
2 WebFOCUS +67
3 Dundas BI +57
4 Tableau +57
5 Qlik +52
6 Zoho Reports +44
7 TIBCO Business Intelligence +42
8 MicroStrategy BI +29
9 Microsoft BI +22
10 SAP BI +15
CATEGORY AVERAGE +35
35

Business Intelligence Category Report
Emotional Footprint This section digs deeper into the emotional connection between software vendors and users, displaying user responses to a variety of specific “emotional spectrum” scenarios that express dimensionsof the vendor-client relationship and product effectiveness. These scenarios are organized thematically by category. Use this information to understand the details behind each vendor’s Net EmotionalFootprint score, and to target areas of particular interest or concern.
-4 -3 -2 -1NEGATIVE
+1NEUTRAL
+2 +3 +4POSITIVE
EMOTIONAL SPECTRUM SCALE %POSITIVE
%NEGATIVE
EMOTIONALFOOTPRINT- =
-100 to 20 +21 to +40 +41 to +60 +61 to +81 +81 to +100
Negotiation and ContractVendor's Interest First vs. Client's InterestFirst
DISTRIBUTION 4% 4% 91%
DISTRIBUTION -- 21% 79%
DISTRIBUTION -- 22% 78%
DISTRIBUTION -- 27% 73%
DISTRIBUTION 4% 23% 73%
DISTRIBUTION 17% 8% 75%
DISTRIBUTION 17% 17% 67%
DISTRIBUTION 5% 40% 55%
DISTRIBUTION 18% 24% 57%
DISTRIBUTION 19% 27% 54%
DISTRIBUTION 13% 23% 64%
1 Dundas BI +87
2 Qlik +79
3 WebFOCUS +78
4 SAS BI +73
5 Tableau +69
6 TIBCO Business Intelligence +58
7 Zoho Reports +50
8 BOARD +50
9 Microsoft BI +39
10 IBM Cognos Platform +35
CATEGORY AVERAGE +50
Negotiation and ContractHardball Tactics vs. Friendly Negotiation
DISTRIBUTION -- 9% 91%
DISTRIBUTION -- 22% 78%
DISTRIBUTION 7% 14% 79%
DISTRIBUTION 6% 22% 72%
DISTRIBUTION 7% 21% 73%
DISTRIBUTION 9% 18% 73%
DISTRIBUTION 15% 15% 70%
DISTRIBUTION 8% 33% 58%
DISTRIBUTION 8% 35% 58%
DISTRIBUTION 14% 21% 64%
DISTRIBUTION 12% 21% 67%
1 Dundas BI +91
2 WebFOCUS +78
3 Qlik +72
4 Zoho Reports +66
5 Tableau +66
6 SAS BI +64
7 BOARD +55
8 TIBCO Business Intelligence +50
9 IBM Cognos Platform +50
10 MicroStrategy BI +50
CATEGORY AVERAGE +55
36

Business Intelligence Category Report
Emotional Footprint This section digs deeper into the emotional connection between software vendors and users, displaying user responses to a variety of specific “emotional spectrum” scenarios that express dimensionsof the vendor-client relationship and product effectiveness. These scenarios are organized thematically by category. Use this information to understand the details behind each vendor’s Net EmotionalFootprint score, and to target areas of particular interest or concern.
-4 -3 -2 -1NEGATIVE
+1NEUTRAL
+2 +3 +4POSITIVE
EMOTIONAL SPECTRUM SCALE %POSITIVE
%NEGATIVE
EMOTIONALFOOTPRINT- =
-100 to 20 +21 to +40 +41 to +60 +61 to +81 +81 to +100
CATEGORY
Strategy andInnovationYour vendor’s attitude toward innovation isimportant; if they aren’t at least keeping pacewith market directions and trends, they certainlywon’t be enabling you to get ahead. Use the datain this section to gauge whether your vendorappreciates the need to innovate and the extentto which they’ll support you to do the same.
Strategy and InnovationRoadblock To Innovation vs. Helps Innovate
DISTRIBUTION 3% 6% 91%
DISTRIBUTION -- 17% 83%
DISTRIBUTION 2% 15% 83%
DISTRIBUTION 4% 13% 83%
DISTRIBUTION 9% 5% 86%
DISTRIBUTION 9% 9% 82%
DISTRIBUTION 8% 13% 80%
DISTRIBUTION 10% 10% 80%
DISTRIBUTION 7% 20% 73%
DISTRIBUTION 6% 27% 67%
DISTRIBUTION 7% 16% 77%
1 Dundas BI +88
2 BOARD +83
3 Tableau +81
4 MicroStrategy BI +79
5 Zoho Reports +77
6 WebFOCUS +73
7 Qlik +72
8 Microsoft BI +70
9 SAS BI +66
10 IBM Cognos Platform +61
CATEGORY AVERAGE +70
37

Business Intelligence Category Report
Emotional Footprint This section digs deeper into the emotional connection between software vendors and users, displaying user responses to a variety of specific “emotional spectrum” scenarios that express dimensionsof the vendor-client relationship and product effectiveness. These scenarios are organized thematically by category. Use this information to understand the details behind each vendor’s Net EmotionalFootprint score, and to target areas of particular interest or concern.
-4 -3 -2 -1NEGATIVE
+1NEUTRAL
+2 +3 +4POSITIVE
EMOTIONAL SPECTRUM SCALE %POSITIVE
%NEGATIVE
EMOTIONALFOOTPRINT- =
-100 to 20 +21 to +40 +41 to +60 +61 to +81 +81 to +100
Strategy and InnovationStagnant vs. Continually Improving
DISTRIBUTION -- 6% 94%
DISTRIBUTION 1% 10% 89%
DISTRIBUTION -- 13% 87%
DISTRIBUTION 9% 9% 82%
DISTRIBUTION 5% 20% 75%
DISTRIBUTION 12% 10% 78%
DISTRIBUTION 9% 18% 73%
DISTRIBUTION 7% 21% 71%
DISTRIBUTION 9% 22% 70%
DISTRIBUTION 7% 27% 67%
DISTRIBUTION 9% 15% 76%
1 Dundas BI +94
2 Tableau +88
3 BOARD +87
4 Zoho Reports +73
5 Qlik +70
6 Microsoft BI +66
7 WebFOCUS +64
8 TIBCO Business Intelligence +64
9 MicroStrategy BI +61
10 SAS BI +60
CATEGORY AVERAGE +68
Strategy and InnovationCharges For Product Enhancements vs.Includes Product Enhancements
DISTRIBUTION -- 3% 97%
DISTRIBUTION 4% 13% 83%
DISTRIBUTION 4% 13% 82%
DISTRIBUTION -- 23% 77%
DISTRIBUTION 4% 17% 78%
DISTRIBUTION 7% 20% 73%
DISTRIBUTION 5% 25% 70%
DISTRIBUTION 13% 13% 73%
DISTRIBUTION 7% 29% 64%
DISTRIBUTION 9% 27% 64%
DISTRIBUTION 8% 19% 73%
1 Dundas BI +97
2 MicroStrategy BI +79
3 Tableau +78
4 Zoho Reports +77
5 BOARD +74
6 SAS BI +66
7 Qlik +65
8 Microsoft BI +60
9 TIBCO Business Intelligence +57
10 WebFOCUS +55
CATEGORY AVERAGE +64
38
Business Intelligence Category Report
Emotional Footprint This section digs deeper into the emotional connection between software vendors and users, displaying user responses to a variety of specific “emotional spectrum” scenarios that express dimensionsof the vendor-client relationship and product effectiveness. These scenarios are organized thematically by category. Use this information to understand the details behind each vendor’s Net EmotionalFootprint score, and to target areas of particular interest or concern.
-4 -3 -2 -1NEGATIVE
+1NEUTRAL
+2 +3 +4POSITIVE
EMOTIONAL SPECTRUM SCALE %POSITIVE
%NEGATIVE
EMOTIONALFOOTPRINT- =
-100 to 20 +21 to +40 +41 to +60 +61 to +81 +81 to +100
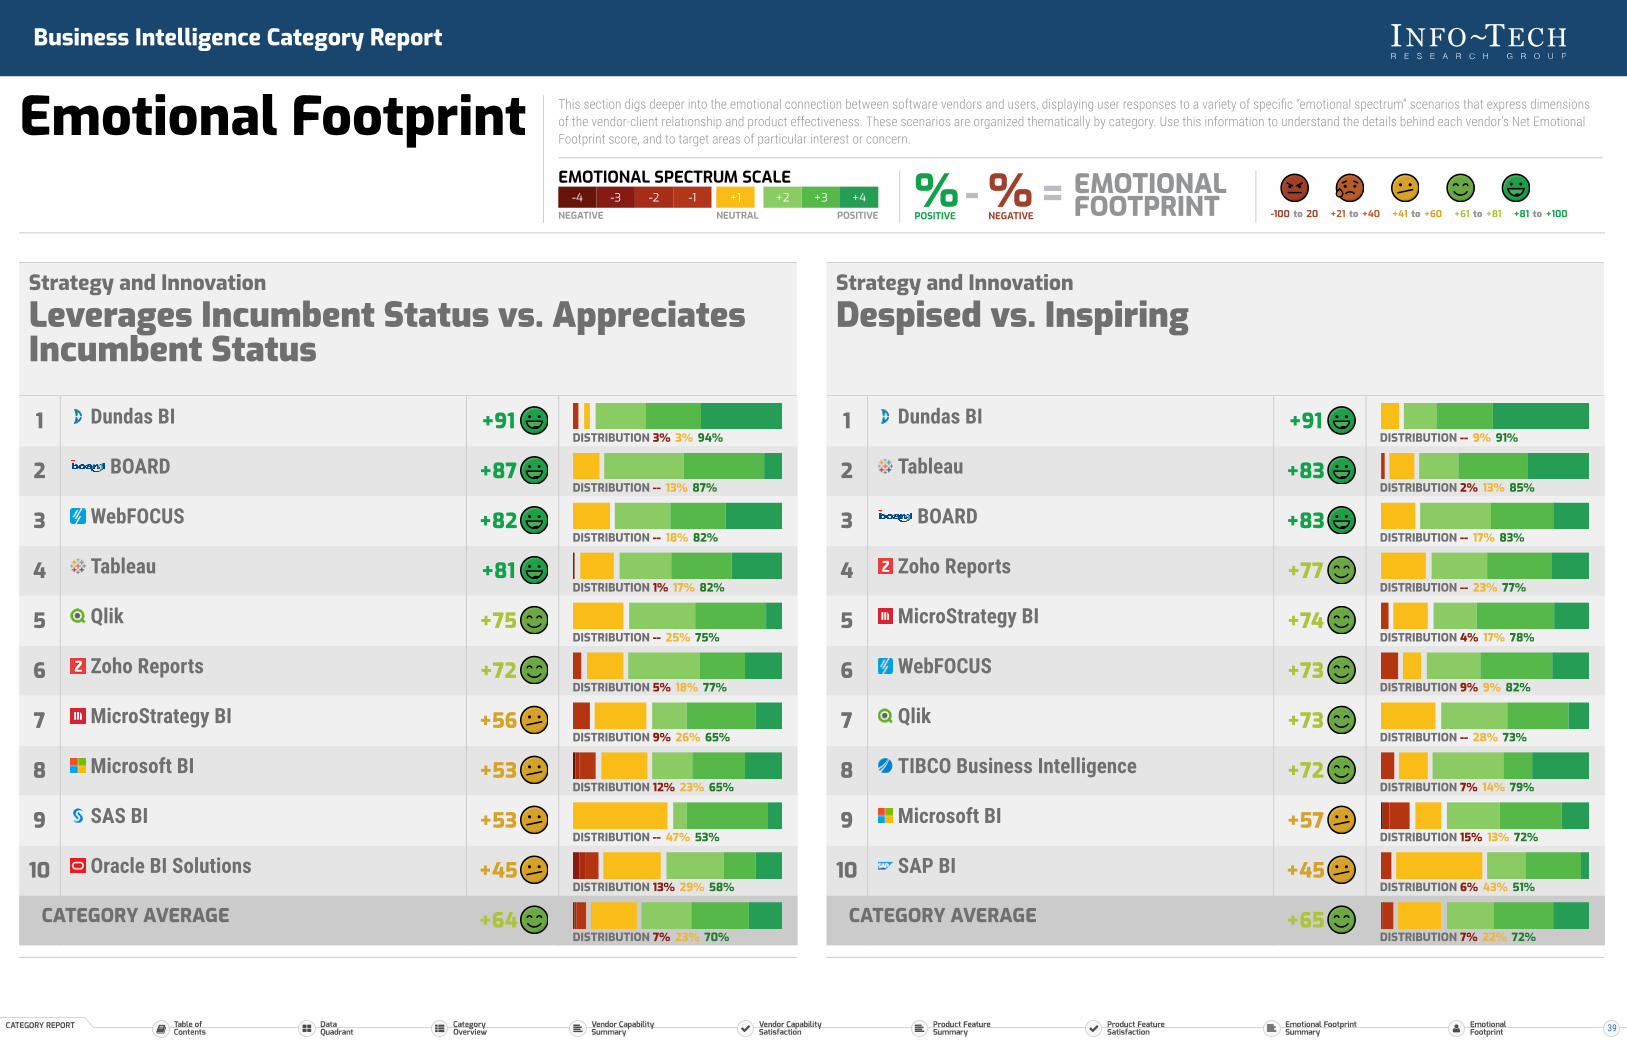
Strategy and InnovationLeverages Incumbent Status vs. AppreciatesIncumbent Status
DISTRIBUTION 3% 3% 94%
DISTRIBUTION -- 13% 87%
DISTRIBUTION -- 18% 82%
DISTRIBUTION 1% 17% 82%
DISTRIBUTION -- 25% 75%
DISTRIBUTION 5% 18% 77%
DISTRIBUTION 9% 26% 65%
DISTRIBUTION 12% 23% 65%
DISTRIBUTION -- 47% 53%
DISTRIBUTION 13% 29% 58%
DISTRIBUTION 7% 23% 70%
1 Dundas BI +91
2 BOARD +87
3 WebFOCUS +82
4 Tableau +81
5 Qlik +75
6 Zoho Reports +72
7 MicroStrategy BI +56
8 Microsoft BI +53
9 SAS BI +53
10 Oracle BI Solutions +45
CATEGORY AVERAGE +64
Strategy and InnovationDespised vs. Inspiring
DISTRIBUTION -- 9% 91%
DISTRIBUTION 2% 13% 85%
DISTRIBUTION -- 17% 83%
DISTRIBUTION -- 23% 77%
DISTRIBUTION 4% 17% 78%
DISTRIBUTION 9% 9% 82%
DISTRIBUTION -- 28% 73%
DISTRIBUTION 7% 14% 79%
DISTRIBUTION 15% 13% 72%
DISTRIBUTION 6% 43% 51%
DISTRIBUTION 7% 22% 72%
1 Dundas BI +91
2 Tableau +83
3 BOARD +83
4 Zoho Reports +77
5 MicroStrategy BI +74
6 WebFOCUS +73
7 Qlik +73
8 TIBCO Business Intelligence +72
9 Microsoft BI +57
10 SAP BI +45
CATEGORY AVERAGE +65
39

Business Intelligence Category Report
Emotional Footprint This section digs deeper into the emotional connection between software vendors and users, displaying user responses to a variety of specific “emotional spectrum” scenarios that express dimensionsof the vendor-client relationship and product effectiveness. These scenarios are organized thematically by category. Use this information to understand the details behind each vendor’s Net EmotionalFootprint score, and to target areas of particular interest or concern.
-4 -3 -2 -1NEGATIVE
+1NEUTRAL
+2 +3 +4POSITIVE
EMOTIONAL SPECTRUM SCALE %POSITIVE
%NEGATIVE
EMOTIONALFOOTPRINT- =
-100 to 20 +21 to +40 +41 to +60 +61 to +81 +81 to +100
CATEGORY
Product ImpactSoftware needs to reliably enable yourperformance and productivity. Use the data inthis section to see which vendors will propel youforward and which will be deadweight you’ll needto carry.
Product ImpactUnreliable vs. Reliable
DISTRIBUTION -- 9% 91%
DISTRIBUTION -- 10% 90%
DISTRIBUTION 2% 10% 88%
DISTRIBUTION -- 17% 83%
DISTRIBUTION -- 18% 82%
DISTRIBUTION -- 19% 81%
DISTRIBUTION -- 25% 75%
DISTRIBUTION 7% 14% 79%
DISTRIBUTION 3% 23% 74%
DISTRIBUTION 4% 25% 72%
DISTRIBUTION 3% 19% 78%
1 Zoho Reports +91
2 WebFOCUS +90
3 Tableau +86
4 MicroStrategy BI +83
5 Qlik +82
6 Dundas BI +81
7 BOARD +75
8 TIBCO Business Intelligence +72
9 IBM Cognos Platform +71
10 SAP BI +68
CATEGORY AVERAGE +75
40

Business Intelligence Category Report
Emotional Footprint This section digs deeper into the emotional connection between software vendors and users, displaying user responses to a variety of specific “emotional spectrum” scenarios that express dimensionsof the vendor-client relationship and product effectiveness. These scenarios are organized thematically by category. Use this information to understand the details behind each vendor’s Net EmotionalFootprint score, and to target areas of particular interest or concern.
-4 -3 -2 -1NEGATIVE
+1NEUTRAL
+2 +3 +4POSITIVE
EMOTIONAL SPECTRUM SCALE %POSITIVE
%NEGATIVE
EMOTIONALFOOTPRINT- =
-100 to 20 +21 to +40 +41 to +60 +61 to +81 +81 to +100
Product ImpactRestricts Productivity vs. Enables Productivity
DISTRIBUTION -- -- 100%
DISTRIBUTION -- 10% 90%
DISTRIBUTION 1% 9% 90%
DISTRIBUTION -- 13% 88%
DISTRIBUTION 7% -- 93%
DISTRIBUTION 3% 9% 88%
DISTRIBUTION 4% 8% 88%
DISTRIBUTION 2% 13% 84%
DISTRIBUTION 3% 17% 80%
DISTRIBUTION 8% 15% 77%
DISTRIBUTION 4% 13% 83%
1 Zoho Reports +100
2 WebFOCUS +90
3 Tableau +89
4 BOARD +88
5 TIBCO Business Intelligence +86
6 Dundas BI +85
7 MicroStrategy BI +84
8 Qlik +82
9 IBM Cognos Platform +77
10 Microsoft BI +69
CATEGORY AVERAGE +78
Product ImpactPerformance Restricting vs. PerformanceEnhancing
DISTRIBUTION -- 8% 92%
DISTRIBUTION -- 10% 90%
DISTRIBUTION 2% 8% 90%
DISTRIBUTION 7% -- 93%
DISTRIBUTION -- 17% 83%
DISTRIBUTION 6% 9% 84%
DISTRIBUTION 8% 8% 83%
DISTRIBUTION 7% 18% 75%
DISTRIBUTION 4% 24% 71%
DISTRIBUTION 5% 23% 72%
DISTRIBUTION 5% 15% 80%
1 BOARD +92
2 WebFOCUS +90
3 Tableau +88
4 TIBCO Business Intelligence +86
5 Zoho Reports +83
6 Dundas BI +78
7 MicroStrategy BI +75
8 Microsoft BI +68
9 Qlik +67
10 SAP BI +67
CATEGORY AVERAGE +75
41

Business Intelligence Category Report
Emotional Footprint This section digs deeper into the emotional connection between software vendors and users, displaying user responses to a variety of specific “emotional spectrum” scenarios that express dimensionsof the vendor-client relationship and product effectiveness. These scenarios are organized thematically by category. Use this information to understand the details behind each vendor’s Net EmotionalFootprint score, and to target areas of particular interest or concern.
-4 -3 -2 -1NEGATIVE
+1NEUTRAL
+2 +3 +4POSITIVE
EMOTIONAL SPECTRUM SCALE %POSITIVE
%NEGATIVE
EMOTIONALFOOTPRINT- =
-100 to 20 +21 to +40 +41 to +60 +61 to +81 +81 to +100
Product ImpactCommodity Features vs. Unique Features
DISTRIBUTION -- 17% 83%
DISTRIBUTION -- 20% 80%
DISTRIBUTION 2% 16% 81%
DISTRIBUTION -- 21% 79%
DISTRIBUTION 3% 16% 81%
DISTRIBUTION -- 24% 76%
DISTRIBUTION 7% 14% 79%
DISTRIBUTION 8% 13% 79%
DISTRIBUTION 11% 21% 67%
DISTRIBUTION 17% 13% 71%
DISTRIBUTION 7% 20% 72%
1 Zoho Reports +83
2 WebFOCUS +80
3 Tableau +79
4 SAS BI +79
5 Dundas BI +78
6 Qlik +76
7 TIBCO Business Intelligence +72
8 MicroStrategy BI +71
9 Microsoft BI +56
10 BOARD +54
CATEGORY AVERAGE +65
Product ImpactSecurity Frustrates vs. Security Protects
DISTRIBUTION -- 9% 91%
DISTRIBUTION -- 10% 90%
DISTRIBUTION 3% 6% 91%
DISTRIBUTION 3% 18% 79%
DISTRIBUTION 7% 14% 79%
DISTRIBUTION 4% 25% 71%
DISTRIBUTION 8% 17% 75%
DISTRIBUTION 4% 24% 71%
DISTRIBUTION 11% 16% 72%
DISTRIBUTION 13% 17% 70%
DISTRIBUTION 7% 19% 74%
1 Zoho Reports +91
2 WebFOCUS +90
3 Dundas BI +88
4 Tableau +76
5 SAS BI +72
6 BOARD +67
7 MicroStrategy BI +67
8 Qlik +67
9 Microsoft BI +61
10 Oracle BI Solutions +57
CATEGORY AVERAGE +67
42