Embed Size (px)
Citation preview
8/3/2019 Cellular Proliferation in the Urorectal Septation
http://slidepdf.com/reader/full/cellular-proliferation-in-the-urorectal-septation 1/12
J. Anat. (2005) 207, pp353–364
© Anatomical Society of Great Britain and Ireland 2005
BlackwellPublishing, Ltd.
Cellular proliferation in the urorectal septation complexof the human embryo at Carnegie stages 13–18: a nucleararea-based morphometric analysisJosep Nebot-Cegarra1, Pere Jordi Fàbregas1 and Inma Sánchez-Pérez
2
1
Unitat d’Anatomia i d’Embriologia, Departament de Ciències Morfològiques, and 2
Unitat de Bioestadística, Departament de
Pediatria, d’Obstetrícia i Ginecologia i de Medicina Preventiva, Facultat de Medicina, Universitat Autònoma de Barcelona (UAB),
Bellaterra, Spain
Abstract
In order to analyse the patterns of cellular proliferation both in the mesenchyme of the urorectal septum (URS)
and in the adjacent territories (posterior urogenital mesenchyme, anterior intestinal mesenchyme and cloacal folds
mesenchyme), as well as their contribution to the process of cloacal division, a computer-assisted method was used
to obtain the nuclear area of 3874 mesenchymal cells from camera lucida drawings of nuclear contours of selected
sections of human embryos [Carnegie stages (CSs) 13–18]. Based on changes in the size of the nucleus during thecellular cycle, we considered proliferating cells in each territory to be those with a nuclear area over the 75th per-
centile. The URS showed increasing cell proliferation, with proliferation patterns that coincided closely with cloacal
folds mesenchyme, and with less overall proliferation than urogenital and intestinal mesenchymes. Furthermore,
at CS 18, we observed the beginning of the rupture in the cloacal membrane; however, no fusion has been demon-
strated either between the URS and the cloacal membrane or between the cloacal folds. The results suggest that
cloacal division depends on a morphogenetic complex where the URS adjacent territories could determine septal
displacement at the time that their mesenchymes could be partially incorporated within the proliferating URS.
Key words
cellular nucleus; cloaca; computer-assisted method; development; urorectal septum.
Introduction
The mesenchymal structure that separates the lumen of
the urogenital sinus or its derivatives from the anorectum
at the cloaca is known as the urorectal septum (URS)
(Rogers et al. 2002) and is superficially coated with
respective epithelial layers. Some authors do not con-
sider it an independent structure but merely the
confluence of the urogenital sinus and hindgut mesen-
chymes (van der Putte & Neeteson, 1983; Penington &
Hutson, 2003).
Increased knowledge of the normal human embryonic
cloaca septation, aside from any advance in develop-
mental science, will enhance our understanding of the
caudal malformations associated with cloacal alterations
(Paidas et al. 1999), such as the URS malformation sequ-
ence (Escobar et al. 1987; Wheeler et al. 1997; Gripp
et al. 1999; Wheeler & Weaver, 2001; He et al. 2004). In
this way, the appearance of caudal malformations has
been related to injuries either to the hindgut endoderm
or to the primitive streak mesoderm region (Alles & Sulik,
1993; Mesrobian et al. 1994) and to alterations in the
key factors of the cloacal septation (Mills & Pergament,
1997; Kimmel et al. 2000; Roberts, 2000; Ince et al.
2002; Jo Mauch & Albertine, 2002; Dravis et al. 2004).
Classically, the cloacal septation has been interpreted
as the consequence of a crescenteric coronal fold
(Tourneaux’s fold) descent towards the cloacal mem-
brane (Tourneux, 1888), of the midline fusion of two
lateral cloacal folds (Rathke’s plicae) (Rathke, cited by
Nievelstein et al. 1998), or, in an integrating theory, as
the confluence of these three folds (Stephens, 1981;
Larsen, 2003; Dravis et al. 2004). In a more recent approach,
Correspondence
Dr Josep Nebot-Cegarra, Unitat d’Anatomia i d’Embriologia,
Departament de Ciències Morfològiques, Facultat de Medicina,
Universitat Autònoma de Barcelona, 08193 Bellaterra, Spain.
Accepted for publication 5 July 2005
8/3/2019 Cellular Proliferation in the Urorectal Septation
http://slidepdf.com/reader/full/cellular-proliferation-in-the-urorectal-septation 2/12
Cellular proliferation in the urorectal septation complex, J. Nebot-Cegarra et al.
© Anatomical Society of Great Britain and Ireland 2005
354
the importance of URS growth has diminished and its
formation is considered to be a consequence of the
embryonic caudal folding that closes the angle of the
cloacal ceiling (Kluth et al. 1995; Nievelstein et al. 1998),
allowing the confrontation of the mesenchymal layers
of the allantois/urogenital sinus and yolk sac/hindgut
(Nievelstein et al. 1998; Paidas et al. 1999; Penington &
Hutson, 2003) and their later fusion (Nievelstein et al.
1998). Nevertheless, studies that observe the classical
point of view, explaining cloacal division as the result
of URS active growth, are still appearing (Mesrobian
et al. 1994; Kromer, 1996, 1999; Qi et al. 2000c, 2002;
Dravis et al. 2004; Hynes & Fraher, 2004). Whichever
mechanism is responsible for cloacal septation, it seems
clear that during the embryonic period there is a pro-
gressive approximation between the tip of the URS and
the cloacal membrane. This seems to be due to a com-
bination of events resulting in a transformation of the
relative position of different structures (van der Putte
& Neeteson, 1983; Kluth & Lambrecht, 1997; Nievelstein
et al. 1998; Paidas et al. 1999) and not only to the growth
of the URS (Kromer, 1996).
There is no consensus on whether the URS and cloacal
membrane fuse together. Whereas some authors have
observed this to be true in mice (Kimmel et al. 2000),
rats (Qi et al. 2000b,c, 2002; Bai et al. 2004) and humans
(Kromer, 1996; Ince et al. 2002), others have observed
that the cloacal membrane ruptures before any contact
with the URS has taken place, as in humans (van der
Putte, 1986; Nievelstein et al. 1998; Paidas et al. 1999),
mice (Sasaki et al. 2004) and pigs (van der Putte &
Neeteson, 1983). On the other hand, shortly after the
disappearance of the cloacal membrane, a secondary
occlusion of the anorectum has been described (O’Rahilly,
1978; van der Putte, 1986; O’Rahilly & Müller, 1992;
Nievelstein et al. 1998).
It seems evident that the process of cloacal septation
is still a controversial matter and new approaches are
needed to obtain more discriminative data. Because
changes in the morphology of the embryonic structures
are the result of embryonic cell dynamics (Qi et al.
2000a), cell proliferation appears to be a key factor in
determining whether the URS displays harmonic or
different growth patterns in relation to adjacent
mesenchymal territories, which could suggest passive
or active involvement in cloacal septation. Without these
data, interpretations are always excessively conditioned
by diverse factors, such as the reference points used,
the orientation of the histological section or the subtle
differences between species (Qi et al. 2000c). For these
reasons, and due to the absence of any studies that,
directly or indirectly, tackle the human cloacal septa-
tion process based on cellular proliferation, we were
encouraged to produce the present work.
To overcome the limitations of working with previ-
ously stained human embryo sections from an embryo-
logical collection, we have designed a methodology
that is able to determine the proliferating state of each
cell in accordance with the relative position of the
value of its nuclear area in relation to all the cells of its
population. We have named this methodology ‘cell
proliferation estimation based on nuclear area (CPEB-
ONA)’ and it is based on the fact that nuclear DNA and
histones are duplicated entirely in the S phase (Meshi
et al. 2000), consequently producing a progressive
increase of the nuclear size throughout the S phase
with respect to G0/G1 phase cells that has been verified
both in normal and in cancer cells (Nagl, 1977; Ormerod,
2000; Savatier et al. 2003; Miller et al. 2004). Based on
this fact it is reasonable to assert that, in a determinate
cell population the subgroup of cells with larger nuclei
includes the cells that are more likely to be in a state
of proliferation. We have carried out the study in the
interval of the embryonic period where the division of
the human cloaca takes place [Carnegie stages (CSs)
13–18] (Paidas et al. 1999). In this time interval the
mesodermal layers are still not organized, either in the
urogenital sinus and its derivates or in the anorectum
(Nievelstein et al. 1998), making the comparative study
between the various mesenchymal cellular populations
easier.
In summary, the aim of this work was to evaluate the
proliferation dynamics of different cell populations
related to cloacal septation by means of nuclear area
morphometry, in order gain a better understanding of
the involvement of each in this developmental process.
Materials and methods
Embryos
The study was carried out on a graded series of normal
human embryos belonging to the Bellaterra Collection
(Prof. Doménech Mateu). They were classified accord-
ing to O’Rahilly & Müller (1987).
The embryos were fixed in 10% buffered formalin,
embedded in paraffin and serially sectioned in the
transverse plane. Developmental data of the specimen
8/3/2019 Cellular Proliferation in the Urorectal Septation
http://slidepdf.com/reader/full/cellular-proliferation-in-the-urorectal-septation 3/12
Cellular proliferation in the urorectal septation complex, J. Nebot-Cegarra et al.
© Anatomical Society of Great Britain and Ireland 2005
355
as well as information on section thickness and histo-
logical staining are given in Table 1.
Descriptive conventions
In each embryo, four mesenchymal territories were
delimited: three of them in the midline of the caudal
end [preseptal, septal (URS) and postseptal] and the
fourth, constituted by a right and a left component,
in a lateral position at the cloacal walls. The borders
between the septal and the other territories were
obtained in each embryo after a meticulous analysis of
all the sections of the embryonic caudal end with the
occasional aid of linear reconstructions of the central
territories performed from lines obtained on the
sections between the centroids of the lumens of the
urogenital and digestive adjacent visceri. The centroids
were determined using Image Tool 3.0. (UTHSCSA, San
Antonio, TX, USA), available at http://ddsdx.uthscsa.edu/
dig/download.html.
We named the preseptal territory the posterior uro-
genital mesenchyme (PUM), which corresponds to the
posterior mesenchyme of the allantoic diverticulum (CS
13), the primary urogenital sinus (CSs 15–16), the sec-
ondary urogenital sinus (CS 17) and its derivatives (CS
18). The postseptal territory, named the anterior intes-
tinal mesenchyme (AIM), comprises the mesenchyme
localized in the anterior wall of the yolk-sac/hindgut
(CS 13) and the hindgut (CSs 15–18). The mesenchyme
that continues the PUM and AIM caudally, under the
celomic cavity, was considered as the septal territory
and we called it the URS based on its position separating
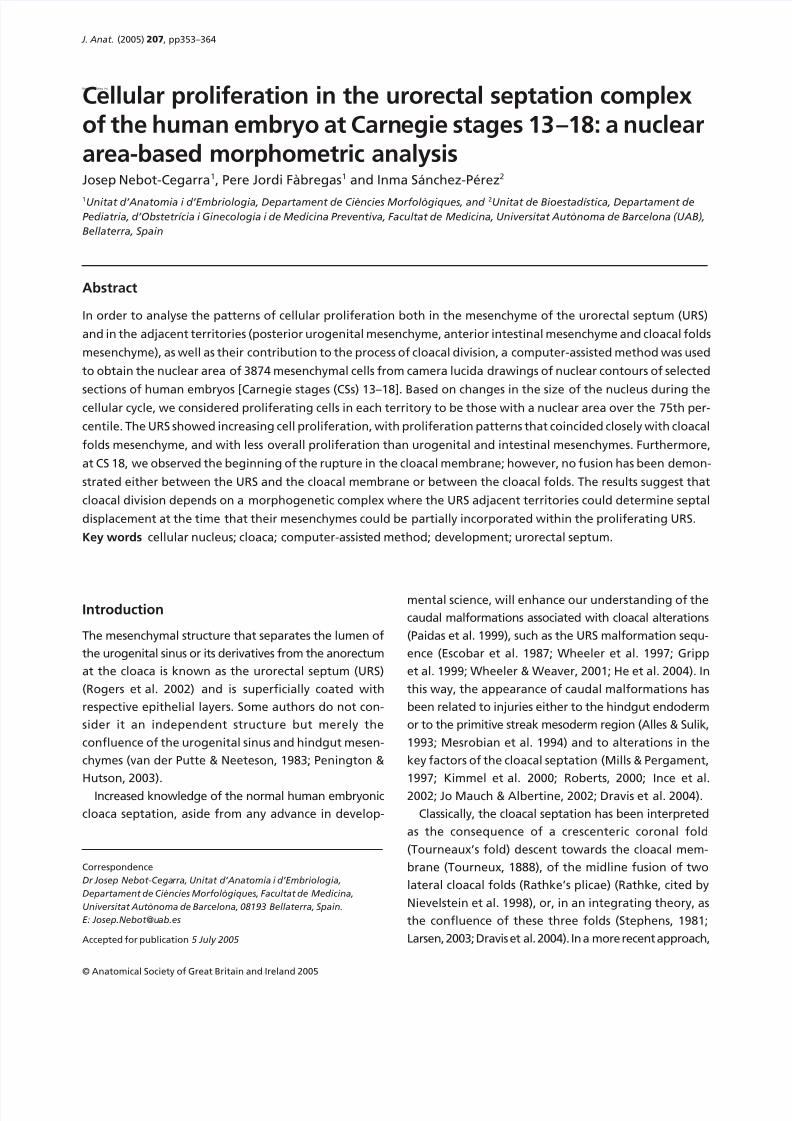
the urogenital and digestive lumens. The mesenchyme
of the folds in the lateral walls of the cloaca (cloacal folds)
was named the cloacal folds mesenchyme (CFM) (Fig. 1)
Morphological observation
In each embryo, the persistence of the cloacal membrane,
the presence/absence of fusion between the URS and
cloacal membrane, or between both cloacal folds and the
degree of tissue organization in mesenchymal territories
were estimated using a light microscopic approach.
Computer-assisted nuclear morphometric method
From each embryo, histological sections were selected
from a first randomly chosen section between those
that contained the URS. From this first section, the
others were selected upwards and downwards with a
sequence of one in two. If possible, a double number of
sections were selected from the PUM and AIM territo-
ries rather than from the URS. Owing to the reduced
dimensions of the cloacal folds, the number of sections
used in the CFM study oscillated between one and three
(Fig. 2).
Table 1 Data relating to the embryos and the sections studied
Developmental data of the embryos* Cross-section data
Embryo
designation CS
POA
(days)
CRL
(mm)
Thickness
(µm) Stain
SS-1 13 28 6 10 H&E
Fra-1 15 33 8, 1 8 H&EMar-2 15 33 8, 5 10 H&E
Bi-6 16 37 10 10 H&E
Pg-3 16 37 11 10 H&E
Bi-7 17 41 12 10 H&E
Re-1 18 44 15 10 H&E
*According to the catalogue of the Bellaterra Collection
(Prof. Doménech Mateu). CS, Carnegie stage; CRL, crown–rump
length; POA, post-ovulation age.
Fig. 1 Cross-section of Mar-2 embryo (CS 15), immediately
below urorectal septum (URS) (arrow marks the URS epitelial
tip). Note the outflow point of the right mesonephric duct (*)
in the urogenital sinus (UGS) and how, just over the cloaca, the
hindgut constitutes the anorectum (ar). 1, cloacal folds
mesenchyme; 2, posterior urogenital mesenchyme; 3, anterior
intestinal mesenchyme; hg, hindgut; ua, umbilical artery.
Bar = 50 µm.
8/3/2019 Cellular Proliferation in the Urorectal Septation
http://slidepdf.com/reader/full/cellular-proliferation-in-the-urorectal-septation 4/12
Cellular proliferation in the urorectal septation complex, J. Nebot-Cegarra et al.
© Anatomical Society of Great Britain and Ireland 2005
356
By means of the camera lucida method, using the
high-power objective (
×
100) of the Jenalumar micro-
scope (Carlss Zeis Jena, Jena, Germany) and immersion
oil, nuclear contours of 3874 mesenchymal cells were
outlined on the studied mesenchymal territories of the
selected sections. The mesothelial, vascular and blood
cells were not considered. The final magnification was
×
851.2. Each nucleus was outlined when the best focus
of its contour was reached and superimposed or bro-
ken nuclei were rejected. Camera lucida drawings were
digitalized with an HP Scanjet 3500C (Hewlett-Packard,
Palo Alto, CA, USA) and nuclear areas were determined
(
µ
m
2
) using Image Tool 3.0.
CPEBONA methology: determination of the rate of
proliferating cells
In agreement with the mesenchymal territory (four
mesenchymal territories) and the embryo (seven embryos)
to which the cells belonged, the nuclear areas were dis-
tributed in 28 groups. Because a preliminary nuclear
area analysis of the ‘no larger nucleus’ cells revealed
significant differences between territories, quartiles of
the nuclear areas were calculated separately in each
mesenchymal territory. Therefore, those cells with a
nuclear area over the Q
3
value (75th percentile) of each
territory were considered to be proliferating cells (see
Discussion). Finally, in each of the 28 groups of nuclear
areas the rate of proliferating cells was calculated as
the proportion of cells with a nuclear area over the 75th
percentile of its territory in relation to the total number
of cells of the group (cells of a territory in an embryo).
Statistics
Because of the proportional nature of the variables,
which do not have a normal distribution, comparisons
between groups were carried out using the Kruskall–
Wallis method (SPSS ver. 10.0 software, Chicago, IL, USA).
Log linear models were used to globalize distribution
of the frequencies analysed among cells of the multi-
dimensional table, generated by the cross-way of cellular
proliferation, territory and embryonic stage. A log
linear model expresses the ln of cell frequencies as an
addition of effects, each due to the categorical value of
variables that define the cell as well as the effects due
to the interactions between variables.
The model containing all possible effects is known as
a saturated model and reproduces exactly the observed
distribution of frequencies. The backward elimination
of terms produces a simple model with the restriction
that the differences between frequencies predicted
and those observed using this model must not be
statistically significant. This mechanism is not different
from the usual and well-known chi-square test of in-
dependence in a bidimensional crosstab generalized to
a multidimensional table.
Statistical significance (
P
< 0.05) of differences between
the frequencies of proliferating cells such as intrastage
and interstages were calculated based on the effects of
the log linear model referring to their variances and
covariances.
Comparative parameters of the rate of proliferating cells
Several comparative parameters were performed on
the rate of proliferating cells obtained from each of the
nuclear area groups.
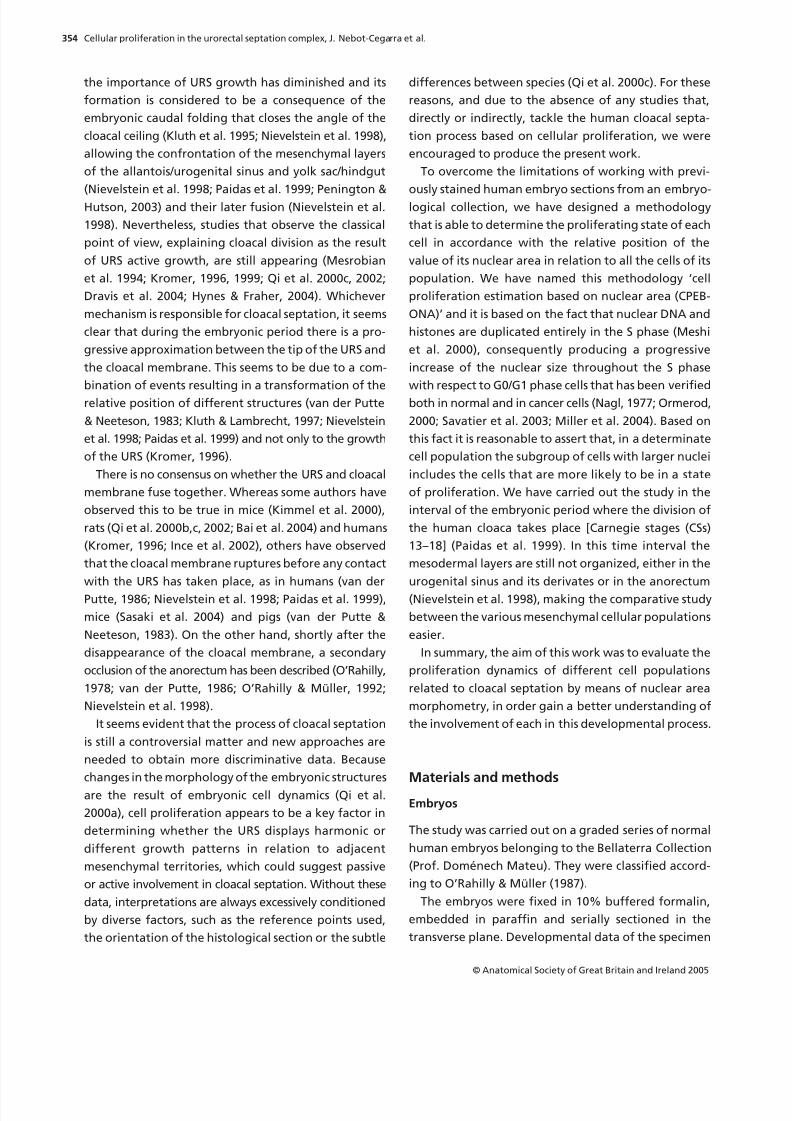
Fig. 2 Diagrammatic representation of the caudal end of a CS
15 human embryo to illustrate the method used in cross-section selection (right half after sagittal section). From
among the sections in which the urorectal septum (URS) was
comprised (sections 9–12), a section was randomly chosen (e.g.
section 10). From this, the remaining sections were selected
upwards and downwards with a sequence of one in two. The
top of the sections selected above the URS was twice that of
the septal analysis (e.g. sections 2, 4, 6 and 8). Below the URS,
the sequence was applied (e.g. sections 14, 16) on the sections
which contained the cloacal folds (sections 13–16). a, allantoic
lumen; ar, anorectum lumen; c, cloaca; cf, cloacal fold;
cc, celomic cavity; cm, cloacal membrane; el, epithelial layer;
hg, hindgut lumen; ml, mesenchymal layer; ugs, urogenital
sinus lumen. Arrow: opening of the mesonephric duct.
8/3/2019 Cellular Proliferation in the Urorectal Septation
http://slidepdf.com/reader/full/cellular-proliferation-in-the-urorectal-septation 5/12
8/3/2019 Cellular Proliferation in the Urorectal Septation
http://slidepdf.com/reader/full/cellular-proliferation-in-the-urorectal-septation 6/12
Cellular proliferation in the urorectal septation complex, J. Nebot-Cegarra et al.
© Anatomical Society of Great Britain and Ireland 2005
358
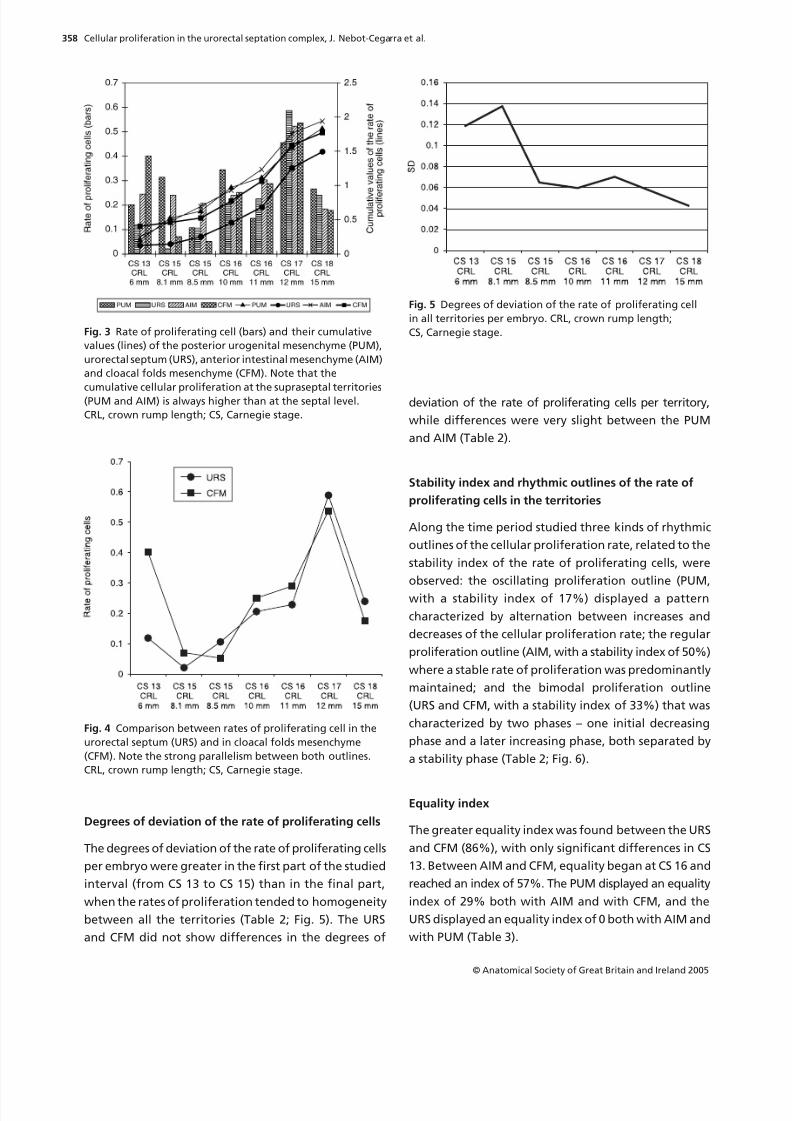
Degrees of deviation of the rate of proliferating cells
The degrees of deviation of the rate of proliferating cells
per embryo were greater in the first part of the studied
interval (from CS 13 to CS 15) than in the final part,
when the rates of proliferation tended to homogeneity
between all the territories (Table 2; Fig. 5). The URS
and CFM did not show differences in the degrees of
deviation of the rate of proliferating cells per territory,
while differences were very slight between the PUM
and AIM (Table 2).
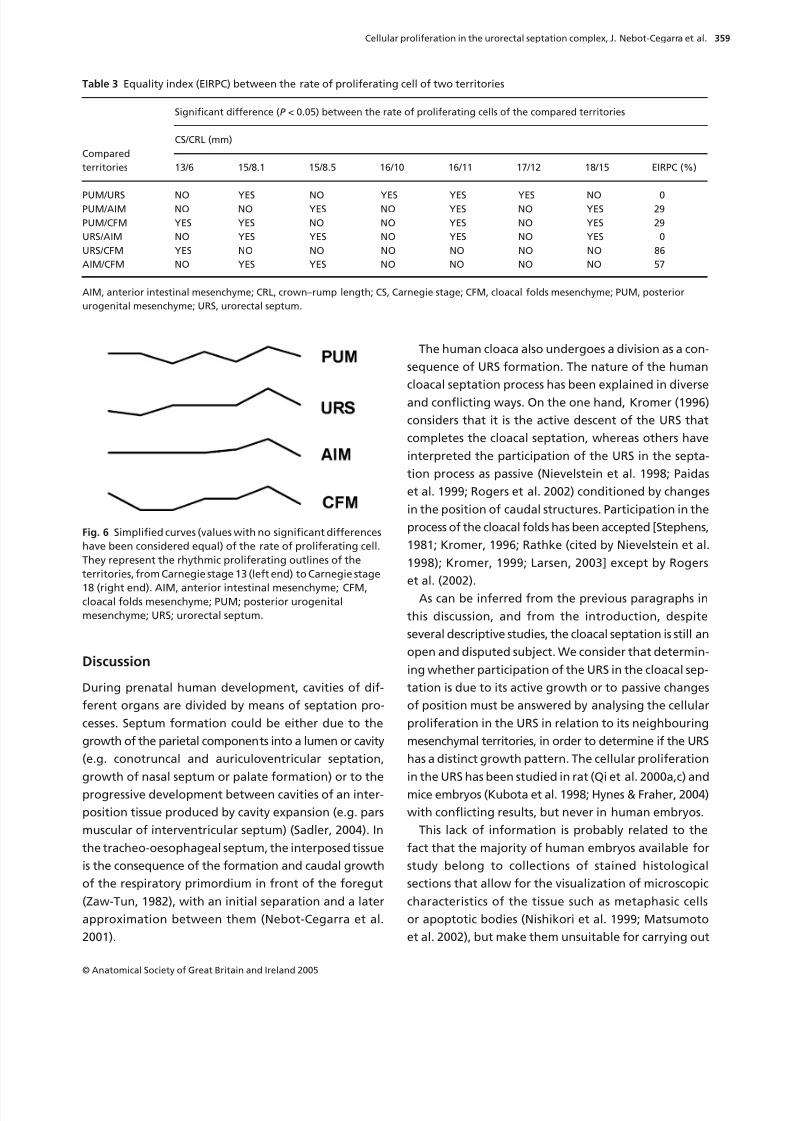
Stability index and rhythmic outlines of the rate of
proliferating cells in the territories
Along the time period studied three kinds of rhythmic
outlines of the cellular proliferation rate, related to the
stability index of the rate of proliferating cells, were
observed: the oscillating proliferation outline (PUM,
with a stability index of 17%) displayed a pattern
characterized by alternation between increases and
decreases of the cellular proliferation rate; the regular
proliferation outline (AIM, with a stability index of 50%)
where a stable rate of proliferation was predominantly
maintained; and the bimodal proliferation outline
(URS and CFM, with a stability index of 33%) that was
characterized by two phases – one initial decreasing
phase and a later increasing phase, both separated by
a stability phase (Table 2; Fig. 6).
Equality index
The greater equality index was found between the URS
and CFM (86%), with only significant differences in CS
13. Between AIM and CFM, equality began at CS 16 and
reached an index of 57%. The PUM displayed an equality
index of 29% both with AIM and with CFM, and the
URS displayed an equality index of 0 both with AIM and
with PUM (Table 3).
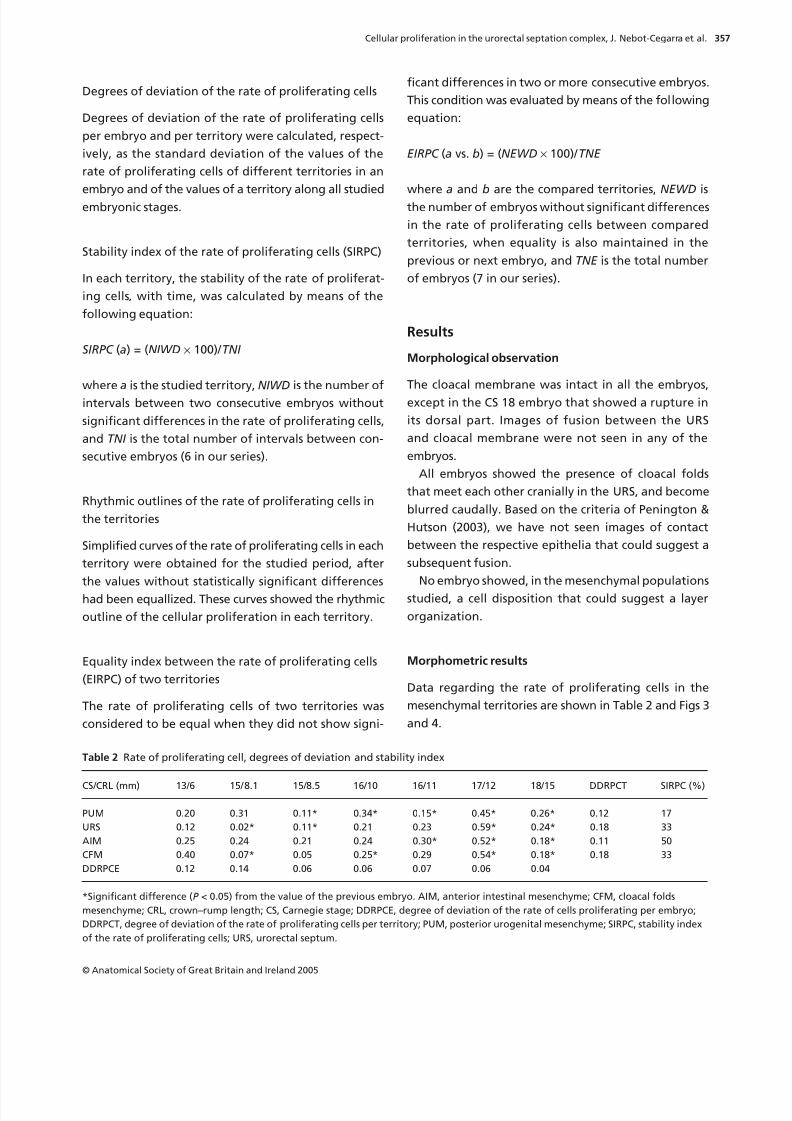
Fig. 3 Rate of proliferating cell (bars) and their cumulative
values (lines) of the posterior urogenital mesenchyme (PUM),
urorectal septum (URS), anterior intestinal mesenchyme (AIM)
and cloacal folds mesenchyme (CFM). Note that the
cumulative cellular proliferation at the supraseptal territories(PUM and AIM) is always higher than at the septal level.
CRL, crown rump length; CS, Carnegie stage.
Fig. 4 Comparison between rates of proliferating cell in the
urorectal septum (URS) and in cloacal folds mesenchyme
(CFM). Note the strong parallelism between both outlines.
CRL, crown rump length; CS, Carnegie stage.
Fig. 5 Degrees of deviation of the rate of proliferating cell
in all territories per embryo. CRL, crown rump length;
CS, Carnegie stage.
8/3/2019 Cellular Proliferation in the Urorectal Septation
http://slidepdf.com/reader/full/cellular-proliferation-in-the-urorectal-septation 7/12
Cellular proliferation in the urorectal septation complex, J. Nebot-Cegarra et al.
© Anatomical Society of Great Britain and Ireland 2005
359
Discussion
During prenatal human development, cavities of dif-
ferent organs are divided by means of septation pro-
cesses. Septum formation could be either due to the
growth of the parietal components into a lumen or cavity
(e.g. conotruncal and auriculoventricular septation,
growth of nasal septum or palate formation) or to the
progressive development between cavities of an inter-
position tissue produced by cavity expansion (e.g. pars
muscular of interventricular septum) (Sadler, 2004). In
the tracheo-oesophageal septum, the interposed tissue
is the consequence of the formation and caudal growth
of the respiratory primordium in front of the foregut
(Zaw-Tun, 1982), with an initial separation and a later
approximation between them (Nebot-Cegarra et al.
2001).
The human cloaca also undergoes a division as a con-
sequence of URS formation. The nature of the human
cloacal septation process has been explained in diverse
and conflicting ways. On the one hand, Kromer (1996)
considers that it is the active descent of the URS that
completes the cloacal septation, whereas others have
interpreted the participation of the URS in the septa-
tion process as passive (Nievelstein et al. 1998; Paidas
et al. 1999; Rogers et al. 2002) conditioned by changes
in the position of caudal structures. Participation in the
process of the cloacal folds has been accepted [Stephens,
1981; Kromer, 1996; Rathke (cited by Nievelstein et al.
1998); Kromer, 1999; Larsen, 2003] except by Rogers
et al. (2002).
As can be inferred from the previous paragraphs in
this discussion, and from the introduction, despite
several descriptive studies, the cloacal septation is still an
open and disputed subject. We consider that determin-
ing whether participation of the URS in the cloacal sep-
tation is due to its active growth or to passive changes
of position must be answered by analysing the cellular
proliferation in the URS in relation to its neighbouring
mesenchymal territories, in order to determine if the URS
has a distinct growth pattern. The cellular proliferation
in the URS has been studied in rat (Qi et al. 2000a,c) and
mice embryos (Kubota et al. 1998; Hynes & Fraher, 2004)
with conflicting results, but never in human embryos.
This lack of information is probably related to the
fact that the majority of human embryos available for
study belong to collections of stained histological
sections that allow for the visualization of microscopic
characteristics of the tissue such as metaphasic cells
or apoptotic bodies (Nishikori et al. 1999; Matsumoto
et al. 2002), but make them unsuitable for carrying out
Table 3 Equality index (EIRPC) between the rate of proliferating cell of two territories
Compared
territories
Significant difference (P < 0.05) between the rate of proliferating cells of the compared territories
CS/CRL (mm)
13/6 15/8.1 15/8.5 16/10 16/11 17/12 18/15 EIRPC (%)
PUM/URS NO YES NO YES YES YES NO 0PUM/AIM NO NO YES NO YES NO YES 29
PUM/CFM YES YES NO NO YES NO YES 29
URS/AIM NO YES YES NO YES NO YES 0
URS/CFM YES NO NO NO NO NO NO 86
AIM/CFM NO YES YES NO NO NO NO 57
AIM, anterior intestinal mesenchyme; CRL, crown–rump length; CS, Carnegie stage; CFM, cloacal folds mesenchyme; PUM, posterior
urogenital mesenchyme; URS, urorectal septum.
Fig. 6 Simplified curves (values with no significant differences
have been considered equal) of the rate of proliferating cell.
They represent the rhythmic proliferating outlines of the
territories, from Carnegie stage 13 (left end) to Carnegie stage
18 (right end). AIM, anterior intestinal mesenchyme; CFM,cloacal folds mesenchyme; PUM; posterior urogenital
mesenchyme; URS; urorectal septum.
8/3/2019 Cellular Proliferation in the Urorectal Septation
http://slidepdf.com/reader/full/cellular-proliferation-in-the-urorectal-septation 8/12
Cellular proliferation in the urorectal septation complex, J. Nebot-Cegarra et al.
© Anatomical Society of Great Britain and Ireland 2005
360
cytometric flow techniques, using bromodeoxyuridine
(BrdUrd), PCNA (Morris & Mathews, 1989), Ki-67 (Key
et al. 1993) or terminal deoxynucleotidyl transferase
biotin-dUTP nick end labelling (TUNEL) (Gavrieli et al.
1992) that could potentially provide more concrete
information about the proportion of cells that are in
the different cell cycle phases and also about the fate
of the cells. The CPEBONA methodology is a useful tool
for solving this problem because it can estimate pro-
liferation activity in a cellular population by means of a
morphometric analysis of nuclei obtained from digital-
ized conventional histological sections.
We applied the CPEBONA methodology in two steps:
first we grouped the nuclear areas of all the cells in
each territory and those whose nuclear areas were over
the 75th percentile of all areas of the territory, and
considered these to be proliferating cells. In a second
step we applied the value of the 75th percentile for the
whole territory, obtained in the previous step, to each
of the embryos involving this territory to obtain the
number of proliferating cells for each group (territory
per embryo). The ratio of the number of proliferating
cells in each group and the total number of cells for the
group is defined as the ‘rate of proliferating cells’,
which depends on the proliferation activity.
Use of the CPEBONA methodology is based on two
premises: first there is an increase in the nuclear size
during the S phase, due to duplication of DNA and his-
tones inside the nucleus, such that the average nuclear
area in the G2/M phases becomes approximately
1.5 times greater than in G0/G1 (Ormerod, 2000; Savatier
et al. 2003). The range of intermediate sizes between
G0/G1 and G2/M corresponds to those cells that are in
the S phase having different grades of DNA and histone
duplication. The second premise is that in a homogene-
ous and non-synchronic population, cells are distributed
in the different cell cycle phases in a proportion that
is directly related to the duration of each phase. For
a ‘typical quick human cell’, such as non-synchronous
embryonic cells (Murray & Hunt, 1993), with a cycle
duration of 24 h, the lengths of the different phases
are: G1, 11 h; S, 8 h; G2, 4 h; M, 1 h (Cooper & Hausman,
2004). If we consider that cells are distributed uni-
formly throughout the cycle, cell distribution should be
directly related to the length of each phase: 46% in G1,
33% in S, 17% in G2 and 4% in M. Combining the two
premises we can assume that 25% of cells with a larger
nuclear area have a high probability of being in the more
advanced cell cycle phases (final part of S, G2 and M).
Some considerations must be borne in mind in rela-
tion to the theoretical basis of the CPEBONA method-
ology. First, the length of the different cell cycle phases
changes depending on the type of organism and also
on the cell type in a particular organism (Murray &
Hunt, 1993). Secondly, not all the cells in a population
cycle at a particular moment, meaning that the pro-
liferation rate is the proportion of cycling (G1, S, G2 and
M phase) and resting cells (G0 phase) (Pardee, 1989),
which depends on the tissue type and on other factors
such as life stage, metabolic conditions or the existence
of pathological conditions (Pardee, 1989). Both in mor-
phometric determinations and in flow cytometry, G0/
G1 cells are grouped together because they display the
same nuclear size and DNA content. Moreover, G0/G1
cannot be very different because cells can switch from
one to the other depending on cellular and extracellular
factors. In this way, in CPEBONA, resting cells are inter-
mingled with G1 cells, moving the influence of non-
cycling cells to the small cell side and consequently
reinforcing the importance of the larger cells. The group
of transition cells from small G0/G1 cells to large G2/M
cells, S phase cells, comprises progressively enlarging
cells that can be divided into an initial component that
is not distinguishable from G0/G1 and an advanced
component of similar dimensions to G2/M cells; in its
proliferating group CPEBONA selects the latter because
it is possible that there is an overlap between G0/G1
cells and the initial S phase cells. With regard to the
group of M phase cells, we could only include in our
study those which are in the prophase, having an intact
nuclear envelope; this was confirmed by means of the
camera lucida method.
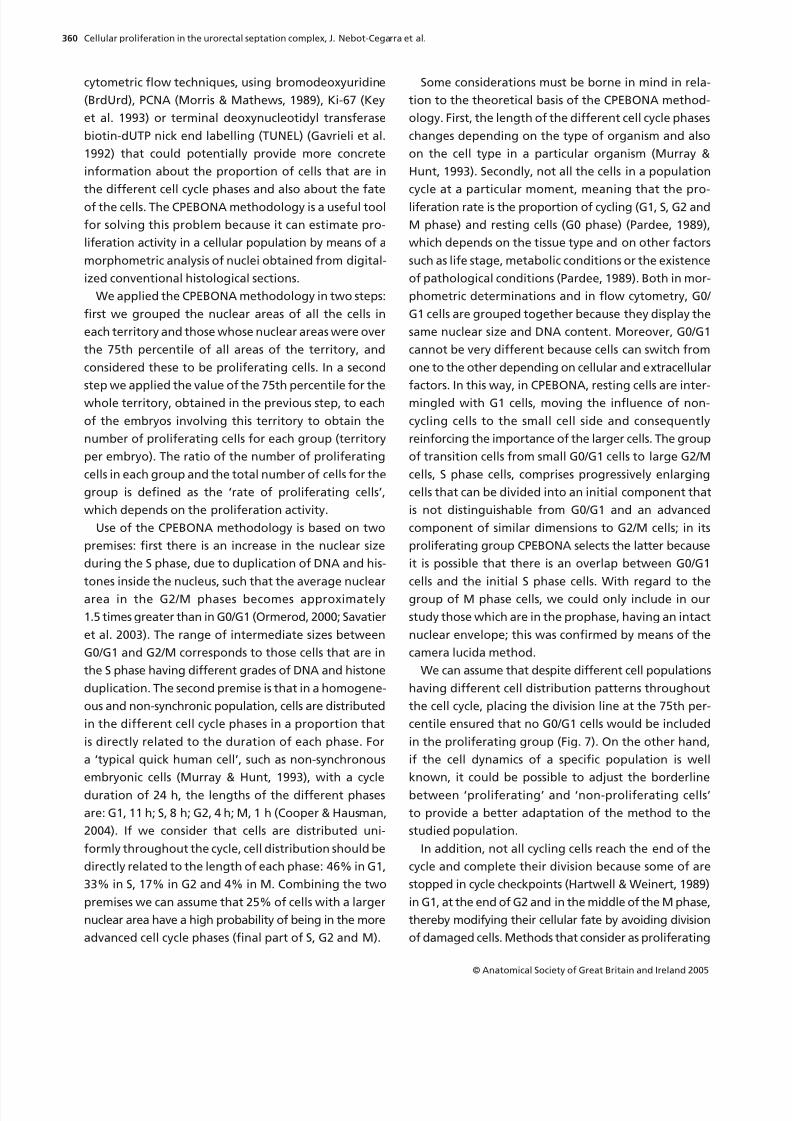
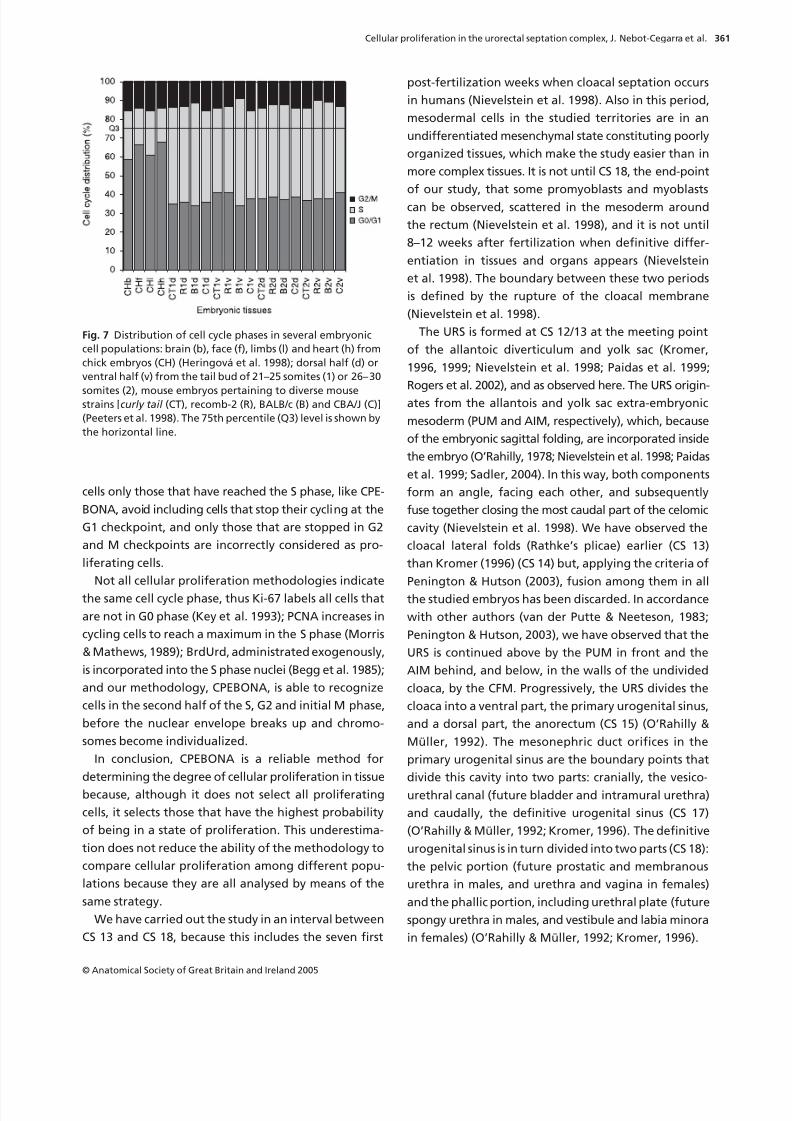
We can assume that despite different cell populations
having different cell distribution patterns throughout
the cell cycle, placing the division line at the 75th per-
centile ensured that no G0/G1 cells would be included
in the proliferating group (Fig. 7). On the other hand,
if the cell dynamics of a specific population is well
known, it could be possible to adjust the borderline
between ‘proliferating’ and ‘non-proliferating cells’
to provide a better adaptation of the method to the
studied population.
In addition, not all cycling cells reach the end of the
cycle and complete their division because some of are
stopped in cycle checkpoints (Hartwell & Weinert, 1989)
in G1, at the end of G2 and in the middle of the M phase,
thereby modifying their cellular fate by avoiding division
of damaged cells. Methods that consider as proliferating
8/3/2019 Cellular Proliferation in the Urorectal Septation
http://slidepdf.com/reader/full/cellular-proliferation-in-the-urorectal-septation 9/12
Cellular proliferation in the urorectal septation complex, J. Nebot-Cegarra et al.
© Anatomical Society of Great Britain and Ireland 2005
361
cells only those that have reached the S phase, like CPE-
BONA, avoid including cells that stop their cycling at the
G1 checkpoint, and only those that are stopped in G2
and M checkpoints are incorrectly considered as pro-
liferating cells.
Not all cellular proliferation methodologies indicate
the same cell cycle phase, thus Ki-67 labels all cells that
are not in G0 phase (Key et al. 1993); PCNA increases in
cycling cells to reach a maximum in the S phase (Morris
& Mathews, 1989); BrdUrd, administrated exogenously,
is incorporated into the S phase nuclei (Begg et al. 1985);
and our methodology, CPEBONA, is able to recognize
cells in the second half of the S, G2 and initial M phase,
before the nuclear envelope breaks up and chromo-
somes become individualized.
In conclusion, CPEBONA is a reliable method for
determining the degree of cellular proliferation in tissue
because, although it does not select all proliferating
cells, it selects those that have the highest probability
of being in a state of proliferation. This underestima-
tion does not reduce the ability of the methodology to
compare cellular proliferation among different popu-
lations because they are all analysed by means of the
same strategy.
We have carried out the study in an interval between
CS 13 and CS 18, because this includes the seven first
post-fertilization weeks when cloacal septation occurs
in humans (Nievelstein et al. 1998). Also in this period,
mesodermal cells in the studied territories are in an
undifferentiated mesenchymal state constituting poorly
organized tissues, which make the study easier than in
more complex tissues. It is not until CS 18, the end-point
of our study, that some promyoblasts and myoblasts
can be observed, scattered in the mesoderm around
the rectum (Nievelstein et al. 1998), and it is not until
8–12 weeks after fertilization when definitive differ-
entiation in tissues and organs appears (Nievelstein
et al. 1998). The boundary between these two periods
is defined by the rupture of the cloacal membrane
(Nievelstein et al. 1998).
The URS is formed at CS 12/13 at the meeting point
of the allantoic diverticulum and yolk sac (Kromer,
1996, 1999; Nievelstein et al. 1998; Paidas et al. 1999;
Rogers et al. 2002), and as observed here. The URS origin-
ates from the allantois and yolk sac extra-embryonic
mesoderm (PUM and AIM, respectively), which, because
of the embryonic sagittal folding, are incorporated inside
the embryo (O’Rahilly, 1978; Nievelstein et al. 1998; Paidas
et al. 1999; Sadler, 2004). In this way, both components
form an angle, facing each other, and subsequently
fuse together closing the most caudal part of the celomic
cavity (Nievelstein et al. 1998). We have observed the
cloacal lateral folds (Rathke’s plicae) earlier (CS 13)
than Kromer (1996) (CS 14) but, applying the criteria of
Penington & Hutson (2003), fusion among them in all
the studied embryos has been discarded. In accordance
with other authors (van der Putte & Neeteson, 1983;
Penington & Hutson, 2003), we have observed that the
URS is continued above by the PUM in front and the
AIM behind, and below, in the walls of the undivided
cloaca, by the CFM. Progressively, the URS divides the
cloaca into a ventral part, the primary urogenital sinus,
and a dorsal part, the anorectum (CS 15) (O’Rahilly &
Müller, 1992). The mesonephric duct orifices in the
primary urogenital sinus are the boundary points that
divide this cavity into two parts: cranially, the vesico-
urethral canal (future bladder and intramural urethra)
and caudally, the definitive urogenital sinus (CS 17)
(O’Rahilly & Müller, 1992; Kromer, 1996). The definitive
urogenital sinus is in turn divided into two parts (CS 18):
the pelvic portion (future prostatic and membranous
urethra in males, and urethra and vagina in females)
and the phallic portion, including urethral plate (future
spongy urethra in males, and vestibule and labia minora
in females) (O’Rahilly & Müller, 1992; Kromer, 1996).
Fig. 7 Distribution of cell cycle phases in several embryonic
cell populations: brain (b), face (f), limbs (l) and heart (h) from
chick embryos (CH) (Heringová et al. 1998); dorsal half (d) or
ventral half (v) from the tail bud of 21–25 somites (1) or 26–30
somites (2), mouse embryos pertaining to diverse mousestrains [curly tail (CT), recomb-2 (R), BALB/c (B) and CBA/J (C)]
(Peeters et al. 1998). The 75th percentile (Q3) level is shown by
the horizontal line.
8/3/2019 Cellular Proliferation in the Urorectal Septation
http://slidepdf.com/reader/full/cellular-proliferation-in-the-urorectal-septation 10/12
Cellular proliferation in the urorectal septation complex, J. Nebot-Cegarra et al.
© Anatomical Society of Great Britain and Ireland 2005
362
Although an approach between the URS and the
cloacal membrane has been observed before the rupture
of the cloacal membrane, we, like others (Nievelstein
et al. 1998; Paidas et al. 1999; Rogers et al. 2002; Sadler,
2004), have not observed fusion between them.
We observed that, throughout the embryonic inter-
val studied here, the cellular proliferation rate tends
towards homogeneity between all territories studied
(Table 2; Fig. 5) and the URS displays a tendency to
increase its proliferation rate to reach similar values to
the other mesenchymal territories in the final part of
the interval studied (Table 2; Figs 3 and 4). Together
with the fact that the URS shows progressive enlarge-
ment during development and that it takes part in the
formation of digestive and urogenital subperitoneal
visceral walls and of the rectovesical septum in men
and rectovaginal septum in women, these data suggest
that the definitive URS comes from the incorporation
of mesenchymal tissue from the adjacent territories
(PUM, AIM and CFM) into the primitive URS mesen-
chyme. It is possible that the trend towards homogeni-
zation in the proliferation rates between territories
(Fig. 5) and the progressive increase in the URS (Table 2;
Fig. 3) could be due to a mixture of process between
primitive URS cells and cells from extraseptal territories.
Migration processes of mesenchymal cells towards the
URS have been described in mice embryos (Dravis et al.
2004). It is credible to think that growth of the urogenital
viscera and hindgut tends to bring them near to each
other, just over the primitive URS, favouring contact
and subsequent fusion of opposite mesenchymes. In
this way the initial union between the allantois and
yolk sac (Nievelstein et al. 1998) could be extended,
further closing the Douglas pouch, and extending up
the URS. In the lower part of the septation complex,
the URS, located above, and cloacal folds prolonging it
downwards on both sides delimit a space or isthmus
that is being progressively closed, probably due to
the inclusion of the cloacal folds in the URS while it
descends. In this way, the URS is enlarged caudally, and
the cloacal folds could act as ‘rails’ that guide the
closure of this part of the septum. It must be emphasized
that the URS and the CFM have demostrated almost
identical proliferation behaviour over most of the stud-
ied period (Table 3; Figs 4 and 6) and it seems reason-
able to believe that they are developed together early
as components of the same structure (Kromer, 1996; Qi
et al. 2000c, 2002) and/or are under the control of the
same regulatory factors. On the other hand, the link
between URS and supraseptal territories (PUM and AIM)
makes it credible to attribute the septal descent not
only to its intrinsic growth but mainly to preponderant
global proliferation of supraseptal mesenchymal cells
(Fig. 3), as has similarly been explained for rat embryos
(Penington & Hutson, 2003). For all these reasons our
proposal is to name all of the definitive sources of URS
as the ‘urorectal septation complex’, because they
constitute a morphogenetic unity in their cellular origin
as well as in their mutual influence on developmental
changes.
In the majority of sagittal section images (van der
Putte & Neeteson, 1983; Nievelstein et al. 1998; Kimmel
et al. 2000; Qi et al. 2000a,b,c, 2002; Penington &
Hutson, 2003; Bai et al. 2004), the URS tip appears slightly
faced to the front, which could be due to displacement
in this direction as a consequence of the slight predom-
inance of cellular proliferation of the AIM over that of
the PUM, as observed in our study, especially from CS
16 onwards (Table 2; Fig. 3). These data and others
(Alles & Sulik, 1993) might indicate that an abnormal
change in the proliferation and/or apoptotic degrees in
these mesenchymal populations could modify the nor-
mal descent of the septum or the orientation of its
tip; it would therefore be interesting to corroborate
this hypothesis in embryos with septal malformations
(Nebot-Cegarra & Domenech-Mateu, 1989). Against
this hypothesis is the fact that in mouse embryos with
cloacal malformations, disturbances in the cellular
dynamics were observed in the cloacal membrane and
dorsocaudal region but not in the URS and its adjacent
territories (Kubota et al. 1998).
In conclusion, our study has enabled us to determine
that the cloacal membrane begins its rupture at CS 18
and that there is no fusion either between the URS and
cloacal membrane or between the cloacal folds them-
selves during the cloacal septation period (CSs 13–18).
Furthermore, the data regarding cellular proliferation
of the URS and its adjacent mesenchymal territories
that we have obtained allow us to consider that the
division of the human cloaca is a consequence of a
coordinated process of septation, in which the compo-
sition of the URS could be modified not only by its
intrinsic cellular proliferation but also by the incorpo-
ration into the septum of cells coming from the neigh-
bouring territories, and its position could be changed
by the differential growth of these cellular populations.
We therefore suggest that the URS and its adjacent ter-
ritories constitute a septation morphogenetic complex.
8/3/2019 Cellular Proliferation in the Urorectal Septation
http://slidepdf.com/reader/full/cellular-proliferation-in-the-urorectal-septation 11/12
Cellular proliferation in the urorectal septation complex, J. Nebot-Cegarra et al.
© Anatomical Society of Great Britain and Ireland 2005
363
Acknowledgements
We thank Prof. Josep M. Domènech-Mateu (Unitat
d’Anatomia i Embriologia, UAB) for his advice in the
selection of human embryos, and Prof. Miguel Martin-
Mateo (Unitat de Bioestadística, UAB) for assistance
with the statistics, as well as Mr David Carrera for his
technical assistance. We are also grateful to Servei de
Traduccions i Revisions de Textos (UAB) for assistance
with the translation.
References
Alles AJ, Sulik KK
(1993) A review of caudal dysgenesis and its
pathogenesis as illustrated in an animal model. Birth
Defects Orig Artic Series
29
, 83–102.
Bai Y, Chen H, Yuan ZW, Wang W
(2004) Normal and abnormal
embryonic development of the anorectum in rats. J Pediatr
Surg
39
, 587–590.
Begg AC, McNally NJ, Shrieve DC, Karcher H
(1985) A methodto measure the duration of DNA synthesis and the potential
doubling time from a single sample. Cytometry
6
, 620–626.
Cooper GM, Hausman RE
(2004) The Cell
. A Molecular
Approach
, 3th edn. Washington, DC: ASM Press.
Dravis C, Yokoyama N, Chumley MJ,
et al.
(2004) Bidirectional
signaling mediated by ephrin-B2 and EphB2 controls urorectal
development. Dev Biol
271
, 272–290.
Escobar LF, Weaver DD, Bixler D, Hodes ME, Mitchell M
(1987)
Urorectal septum malformation sequence. Report of six cases
and embryological analysis. Am J Dis Child 141, 1021–1024.
Gavrieli Y, Sherman Y, Ben-Sasson SA (1992) Identification of
programmed cell death in situ via specific labeling of nuclear
DNA fragmentation. J Cell Biol 119, 493–501.
Gripp KW, Barr M Jr, Anadiotis G, McDonald-McGinn DM,Zderic SA, Zackai EH
(1999) Aphallia as part of urorectal
septum malformation sequence in an infant of a diabetic
mother. Am J Med Genet
82
, 363–367.
Hartwell LH, Weinert TA
(1989) Checkpoints: controls that
ensure the order of cell cycle events. Science
246
, 629–634.
He R, Harrison K, Malloy C, McClatchey KD
(2004) Pathologic
quiz case: multiple congenital birth defects in a full-term
infant. Urorectal septum malformation sequence. Arch
Pathol Lab Med
128
, e73–75.
Heringová L, Dostal M, Jelinek R
(1998) Cell-cycle alterations
within chick embryonic anlagen after cyclophosphamide
treatment. Teratog Carcinog Mutagen
18
, 63–72.
Hynes PJ, Fraher JP
(2004) The development of the male gen-itourinary system. I. The origin of the urorectal septum and
the formation of the perineum. Br J Plast Surg
57
, 27–36.
Ince TA, Cviko AP, Quade BJ,
et al.
(2002) p63 Coordinates
anogenital modeling and epithelial cell differentiation in
the developing female urogenital tract. Am J Pathol
161,
1111–1117.
Jo Mauch T, Albertine KH (2002) Urorectal septum malforma-
tion sequence: Insights into pathogenesis. Anat Rec 268,
405–410.
Key G, Becker MH, Baron B, et al. (1993) New Ki-67-equivalent
murine monoclonal antibodies (MIB 1–3) generated against
bacterially expressed parts of the Ki-67 cDNA containing
three 62 base pair repetitive elements encoding for the Ki-
67 epitope. Lab Invest 68, 629–636.
Kimmel SG, Mo R, Hui CC, Kim PC (2000) New mouse models
of congenital anorectal malformations. J Pediatr Surg 35,
227–231.
Kluth D, Hillen M, Lambrecht W (1995) The principles of nor-
mal and abnormal hindgut development. J Pediatr Surg 30,
1143–1147.Kluth D, Lambrecht W (1997) Current concepts in the embry-
ology of anorectal malformations. Semin Pediatr Surg 6,
180–186.
Kromer P (1996) Development of the urorectal septum and
differentiation of the urogenital sinus in human embryos of
stages 13–19. Folia Morph (Warsz) 55, 362–363.
Kromer P (1999) Further study of the urorectal septum in
staged human embryos. Folia Morph (Warsz) 58, 53–63.
Kubota Y, Shimotake T, Yanagihara J, Iwai N (1998) Develop-
ment of anorectal malformations using etretinate. J Pediatr
Surg 33, 127–129.
Larsen WJ (2003) Embriología Humana, 3th edn. Madrid:
Elsevier Science.Matsumoto A, Hashimoto K, Yoshioka T, Otani H (2002)
Occlusion and subsequent re-canalization in early duodenal
development of human embryos: integrated organogenesis
and histogenesis through a possible epithelial–mesenchymal
interaction. Anat Embryol (Berl) 205, 53–65.
Meshi T, Taoka KI, Iwabuchi M (2000) Regulation of histone
gene expression during the cell cycle. Plant Mol Biol 43,
643–657.
Mesrobian HG, Sessions RP, Lloyd RA, Sulik KK (1994) Cloacal
and urogenital abnormalities induced by etretinate in mice.
J Urol 152, 675–678.
Miller J, Geisler JP, Manahan KJ, et al. (2004) Nuclear size,
shape, and density in endometrial carcinoma: relationship
to survival at over 5 years of follow-up. Does analyzing onlycells occupying the G0–G1 peak add useful information? Int
J Gynecol Cancer 14, 138–144.
Mills PL, Pergament E (1997) Urorectal septal defects in a
female and her offspring. Am J Med Genet 70, 250–252.
Morris GF, Mathews MB (1989) Regulation of proliferating
cell nuclear antigen during the cell cycle. J Biol Chem 264,
13856–13864.
Murray A, Hunt T (1993) The Cell Cycle: an Introduction. New
York: Oxford University Press.
Nagl W (1977) Nuclear structures during cell cycles. In Mecha-
nisms and Control of Cell Division (eds Rost TL, Gifford EM
Jr), pp. 147–193. Stroudsburg, PA: Dowden, Hutchinson &
Ross.Nebot-Cegarra J, Domenech-Mateu JM (1989) Association of
tracheoesophageal anomalies with visceral and parietal
malformations in a human embryo (Carnegie stage 21).
Teratology 39, 11–17.
Nebot-Cegarra J, Fabregas PJ, Campillo M, Ricart S (2001) Sepa-
ration between the digestive and the respiratory lumina
during the human embryonic period: morphometric study
along the tracheo-oesophageal septum. J Anat 198, 117–124.
Nievelstein RA, van der Werff JF, Verbeek FJ, Valk J, Vermeij-
Keers C (1998) Normal and abnormal embryonic development
of the anorectum in human embryos. Teratology 57, 70–78.
8/3/2019 Cellular Proliferation in the Urorectal Septation
http://slidepdf.com/reader/full/cellular-proliferation-in-the-urorectal-septation 12/12
Cellular proliferation in the urorectal septation complex, J. Nebot-Cegarra et al.
© Anatomical Society of Great Britain and Ireland 2005
364
Nishikori T, Hatta T, Kawauchi H, Otani H (1999) Apoptosis
during inner ear development in human and mouse embryos:
an analysis by computer-assisted three-dimensional re-
construction. Anat Embryol (Berl) 200, 19–26.
O’Rahilly R (1978) The timing and sequence of events in the
development of the human digestive system and associated
structures during the embryonic period proper. Anat Embryol
(Berl) 153, 123–136.
O’Rahilly R, Müller F (1987) Developmental Stages in HumanEmbryos. Washington, DC: Carnegie Institution of Washington.
O’Rahilly R, Müller F (1992) Human Embryology and Teratology .
New York: Wiley-Liss.
Ormerod MG (2000) Analysis of DNA-general methods. In
Flow Cytometry , 3th edn (ed. Ormerod MG), pp. 83–97.
Oxford: Oxford University Press.
Paidas CN, Morreale RF, Holoski KM, Lund RE, Hutchins GM
(1999) Septation and differentiation of the embryonic
human cloaca. J Pediatr Surg 34, 877–884.
Pardee AB (1989) G1 events and regulation of cell prolifera-
tion. Science 246, 603–608.
Peeters MC, Schutte B, Lenders MH, Hekking JW, Drukker J,
Van Straaten HW (1998) Role of differential cell prolifera-tion in the tail bud in aberrant mouse neurulation. Dev Dyn
211, 382–389.
Penington EC, Hutson JM (2003) The absence of lateral fusion
in cloacal partition. J Pediatr Surg 38, 1287–1295.
van der Putte SC, Neeteson FA (1983) The normal develop-
ment of the anorectum in the pig. Acta Morph Neerl Scand
21, 107–132.
van der Putte SC (1986) Normal and abnormal development of
the anorectum. J Pediatr Surg 21, 434–440.
Qi BQ, Beasley SW, Williams AK, Fizelle F (2000a) Apoptosis
during regression of the tailgut and septation of the cloaca.
J Pediatr Surg 35, 1556–1561.
Qi BQ, Beasley SW, Williams AK, Frizelle F (2000b) Does the
urorectal septum fuse with the cloacal membrane? J Urol 164, 2070–2072.
Qi BQ, Williams A, Beasley S, Frizelle F (2000c) Clarification of
the process of separation of the cloaca into rectum and uro-
genital sinus in the rat embryo. J Pediatr Surg 35, 1810–1816.
Qi BQ, Beasley SW, Frizelle FA (2002) Clarification of the
processes that lead to anorectal malformations in the ETU-
induced rat model of imperforate anus. J Pediatr Surg 37,
1305–1312.
Roberts DJ (2000) Molecular mechanisms of development of
the gastrointestinal tract. Dev Dyn 219, 109–120.
Rogers DS, Paidas CN, Morreale RF, Hutchins GM (2002)Septation of the anorectal and genitourinary tracts in the
human embryo: crucial role of the catenoidal shape of the
urorectal sulcus. Teratology 66, 144–152.
Sadler TW (2004) Langman: Embriología Médica con Orien-
tación Clínica, 9th edn. Buenos Aires: Editorial Médica
Panamericana.
Sasaki CH, Yamaguchi K, Akita K (2004) Spatiotemporal distri-
bution of apoptosis during normal cloacal development in
mice. Anat Rec (Part A) 279A, 761–767.
Savatier J, Vigo J, Salmon JM (2003) Monitoring cell cycle
distributions in living cells by videomicrofluorometry and
discriminant factorial analysis. Cytometry 56A, 8–14.
Stephens FD (1981) The association and embryology of tra-cheoesophageal and anorectal malformations. In Associated
Congenital Anomalies (eds Shafie M, Klippel CH), pp. 183–
188. Baltimore: Williams & Wilkins.
Tourneux F (1888) Sur les premiers développements du
cloaques du tubercule génital et de l’anus chez l’embryon
de mouton. J Anat 24, 503–517.
Wheeler PG, Weaver DD, Obeime MO, Vance GH, Bull MJ,
Escobar LF (1997) Urorectal septum malformation sequence:
report of thirteen additional cases and review of the litera-
ture. Am J Med Genet 73, 456–462.
Wheeler PG, Weaver DD (2001) Partial urorectal septum mal-
formation sequence: a report of 25 cases. Am J Med Genet
103, 99–105.
Zaw-Tun HA (1982) The tracheo-esophageal septum – fact orfantasy? Origin and development of the respiratory primor-
dium and esophagus. Acta Anat (Basel) 114, 1–21.