Embed Size (px)
Citation preview
CCentral Plaza Hotel Public Company Limited October 17, 2014p y
This presentation contains certain forward looking statements Such forward lookingThis presentation contains certain forward looking statements. Such forward looking
statements are not guarantees of future performance and involve risks and uncertainties, and
actual results may differ from those in the forward looking statements as a result of various
factors and circumstances. The views, analyses and opinions expressed herein contain some
information derived from publicly available sources and third party information providers. No
representation or warranty is made as to the accuracy, completeness, or reliability of such
information. This presentation should not be relied upon as any recommendation, view,
opinion representation or forecast of “Central Plaza Hotel Plc ” Nothing in this presentationopinion, representation or forecast of Central Plaza Hotel Plc. Nothing in this presentation
should be construed as either an offer to sell, a solicitation of an offer to buy or sell shares or
any type of securities in any jurisdiction. This presentation is not intended to be any type of
investment advice and must not be relied upon as such. You must always seek the relevant
professional advice before otherwise making any such financial, legal or commercial
decisions.
2

IT
ED
NY
L
IM
IC
OM
PA
NU
BL
IC
C
Company Background
OT
EL
P
U Company Background
Hotel Business
LA
ZA
H
O Hotel Business
Food Business
RA
L
PL
Outlook and Financial Highlight
CE
NT
3

IT
ED
NY
L
IM
IC
OM
PA
NU
BL
IC
C
OT
EL
P
UL
AZ
A
HO
RA
L
PL
CE
NT
4
CENTEL’s presentation
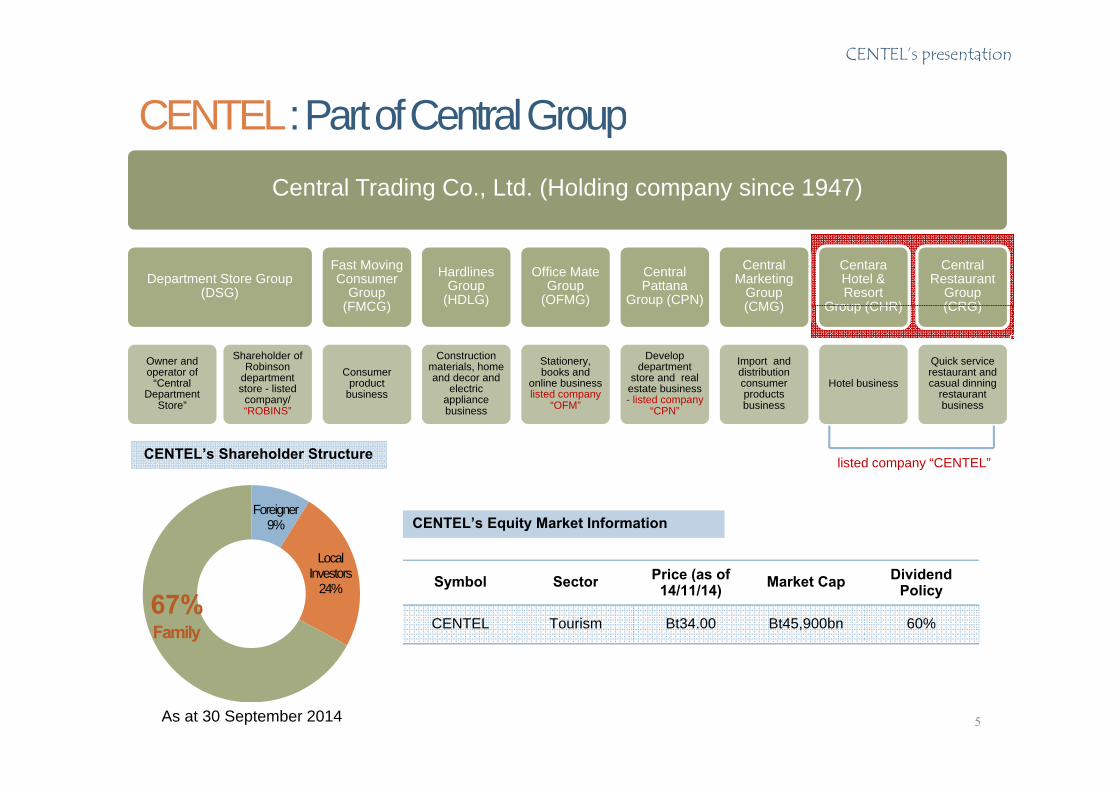
CENTEL:PartofCentralGroupCentral Trading Co., Ltd. (Holding company since 1947)
CENTEL: Part of Central Group
Department Store Group (DSG)
Fast Moving Consumer
Group (FMCG)
HardlinesGroup
(HDLG)
Office Mate Group
(OFMG)
Central Pattana
Group (CPN)
Central Marketing
Group (CMG)
Centara Hotel & Resort
Group (CHR)
Central Restaurant
Group (CRG)
Owner and operator of
“Central Department
Shareholder of Robinson
department store - listed
/
(FMCG)
Consumer product
business
( )
Construction materials, home and decor and
electric li
( )
Stationery, books and
online business listed company
p ( )
Develop department
store and real estate business li d
(CMG)
Import and distribution consumer products
Group (CHR)
Hotel business
(CRG)
Quick service restaurant and casual dinning
restaurantDepartment Store” company/
“ROBINS”business appliance
businesslisted company
“OFM” - listed company “CPN”
products business
restaurant business
CENTEL’s Shareholder Structure listed company “CENTEL”
Foreigner9%
Local Investors Price (as of Dividend
CENTEL’s Equity Market Information
Investors24%
Family
Symbol Sector Price (as of 14/11/14) Market Cap Dividend
Policy
CENTEL Tourism Bt34.00 Bt45,900bn 60%67%
5As at 30 September 2014
CENTEL’s presentation
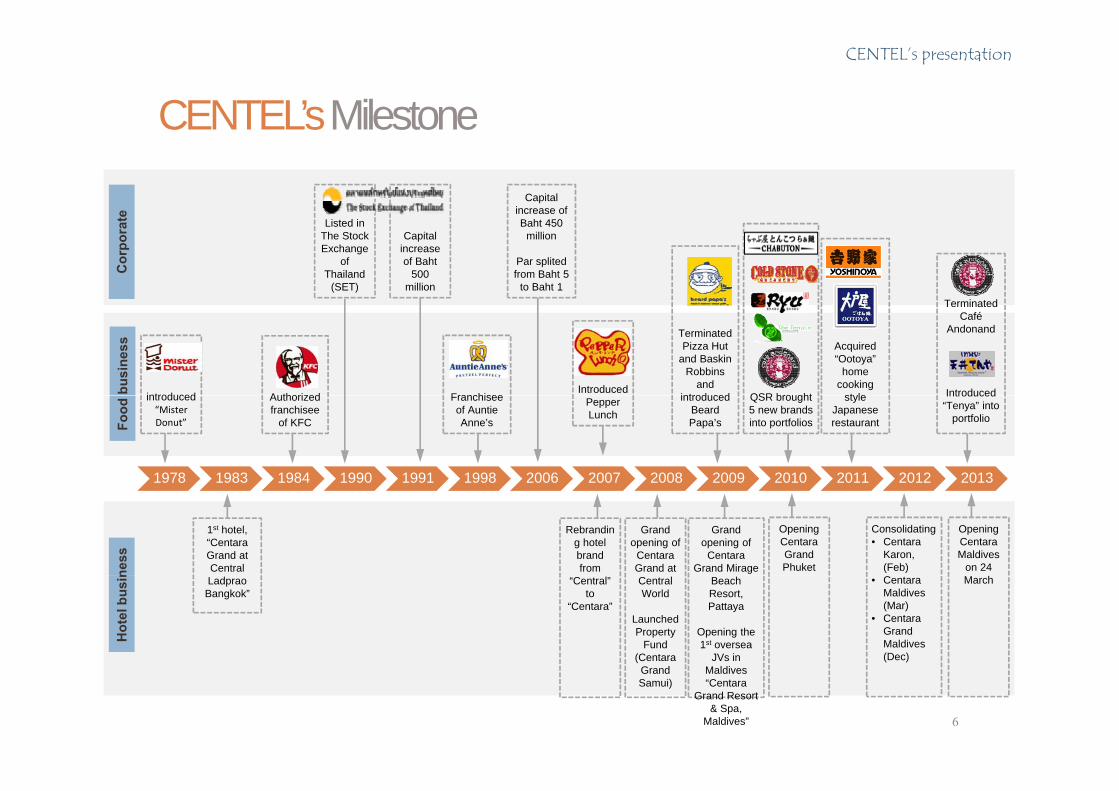
CENTEL’sMilestoneCENTELs Milestone
Capital increase of e
Listed in The Stock Exchange
of Thailand
(SET)
Capital increase of Baht
500 million
Baht 450 million
Par splitedfrom Baht 5
to Baht 1
Cor
pora
te
Terminated
introduced Authorized Franchisee
Terminated Pizza Hut
and Baskin Robbins
and introduced QSR brought
Acquired “Ootoya”
home cooking
stylebusi
ness
Introduced
Terminated Café
Andonand
Introduced
1978 1983 1984 1990 1991 1998 2006 2007 2008 2009 2010 2011 2012 2013
introduced“Mister Donut”
Authorized franchisee
of KFC
Franchisee of Auntie Anne’s
introduced Beard Papa’s
QSR brought 5 new brands into portfolios
style Japanese restaurantFo
od
PepperLunch
Introduced “Tenya” into
portfolio
1st hotel, “CentaraGrand at Central
Rebranding hotel brand from
Grand opening of
CentaraGrand at
Grand opening of
CentaraGrand Mirage
Opening CentaraGrand Phuketne
ss
Consolidating• Centara
Karon, (Feb)
Opening Centara Maldives
on 24 Ladprao
Bangkok”“Central”
to “Centara”
Central World
Launched Property
Fund (Centara
Beach Resort, Pattaya
Opening the 1st oversea
JVs in
Hot
el b
usin • Centara
Maldives (Mar)
• CentaraGrand Maldives (Dec)
March
Grand Samui)
Maldives “Centara
Grand Resort & Spa,
Maldives” 6
CENTEL’s presentation
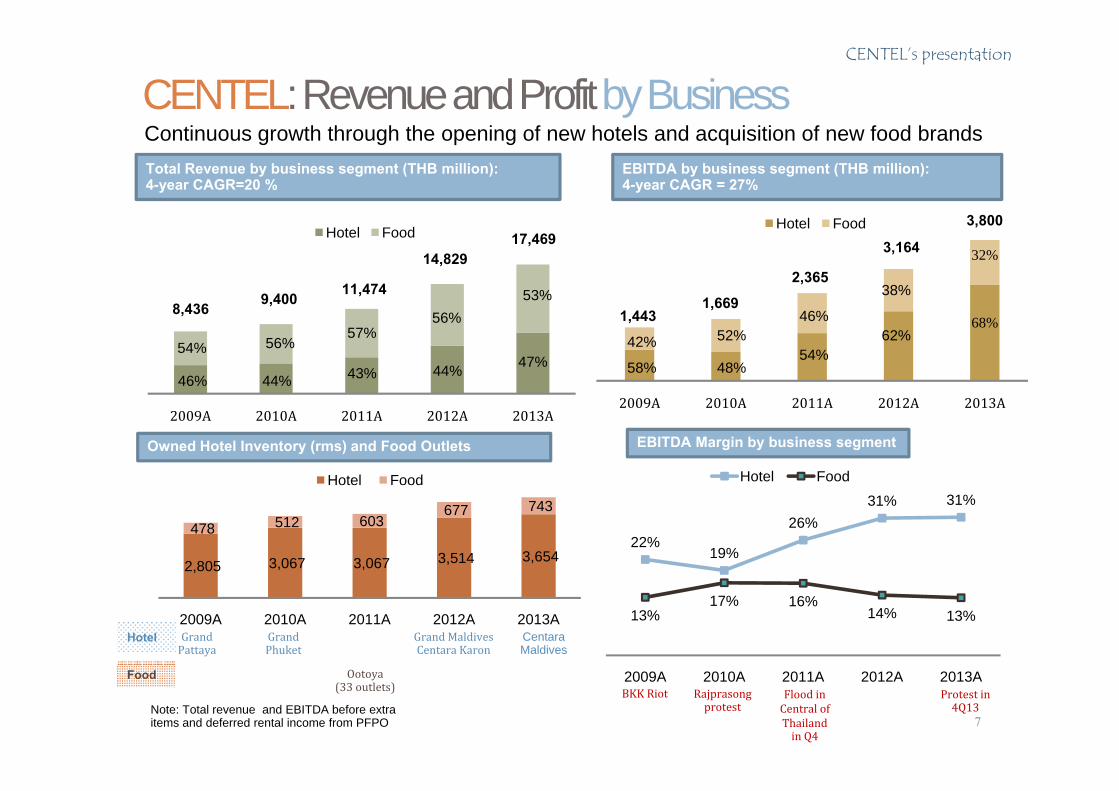
CENTEL: Revenue and Profit by BusinessC ti th th h th i f h t l d i iti f f d b dTotal Revenue by business segment (THB million): 4-year CAGR=20 %
EBITDA by business segment (THB million): 4-year CAGR = 27%
Continuous growth through the opening of new hotels and acquisition of new food brands
3 800Hotel Food
2,36538%
1 669
Hotel Food
11,4748 436 9,400
14,82917,469 3,164
53%
32%
3,800
58% 48%54%
42% 52%46%
62%1,443
1,66968%
8,436 ,
46% 44%
54% 56%
43%
57%
44%
56%
47%
Hotel Food
2009A 2010A 2011A 2012A 2013A2009A 2010A 2011A 2012A 2013A
EBITDA Margin by business segment
Hotel Food
Owned Hotel Inventory (rms) and Food Outlets
22%19%
26%31% 31%
2,805 3,067 3,067 3,514 3,654
478 512 603 677 743
13%17% 16%
14% 13%Centara Maldives
Grand MaldivesCentara Karon
Grand Pattaya
Grand Phuket
Hotel2009A 2010A 2011A 2012A 2013A
7
2009A 2010A 2011A 2012A 2013ABKK Riot Flood in
Central of Thailand in Q4
RajprasongprotestNote: Total revenue and EBITDA before extra
items and deferred rental income from PFPO
Protest in 4Q13
Food Ootoya(33 outlets)

IT
ED
NY
L
IM
IC
OM
PA
N
HOTELU
BL
IC
C HOTEL
OT
EL
P
UL
AZ
A
HO
RA
L
PL
CE
NT
8
CENTEL’s presentation
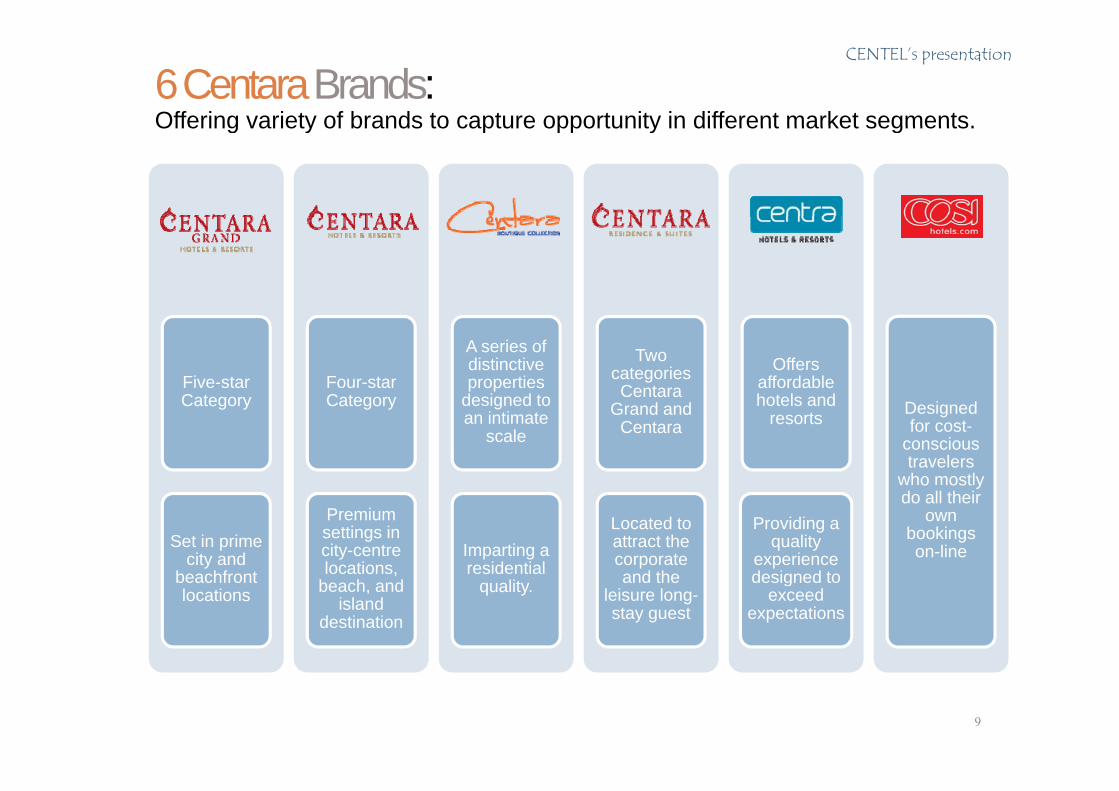
6 CentaraBrands:Offering variety of brands to capture opportunity in different market segments.Offering variety of brands to capture opportunity in different market segments.
Five-star C t
Four-star C t
A series of distinctive properties
d i d t
Two categories Centara
Offers affordable h t l dCategory Category designed to
an intimate scale
Centara Grand and
Centarahotels and
resorts Designed for cost-
conscious travelers
who mostly
Set in prime city and
beachfront
Premium settings in city-centrelocations,
Imparting a residential
Located to attract the corporate and the
Providing a quality
experience designed to
o ost ydo all their
own bookings on-line
beachfront locations
,beach, and
island destination
quality. and the leisure long-stay guest
designed to exceed
expectations
9
CENTEL’s presentation
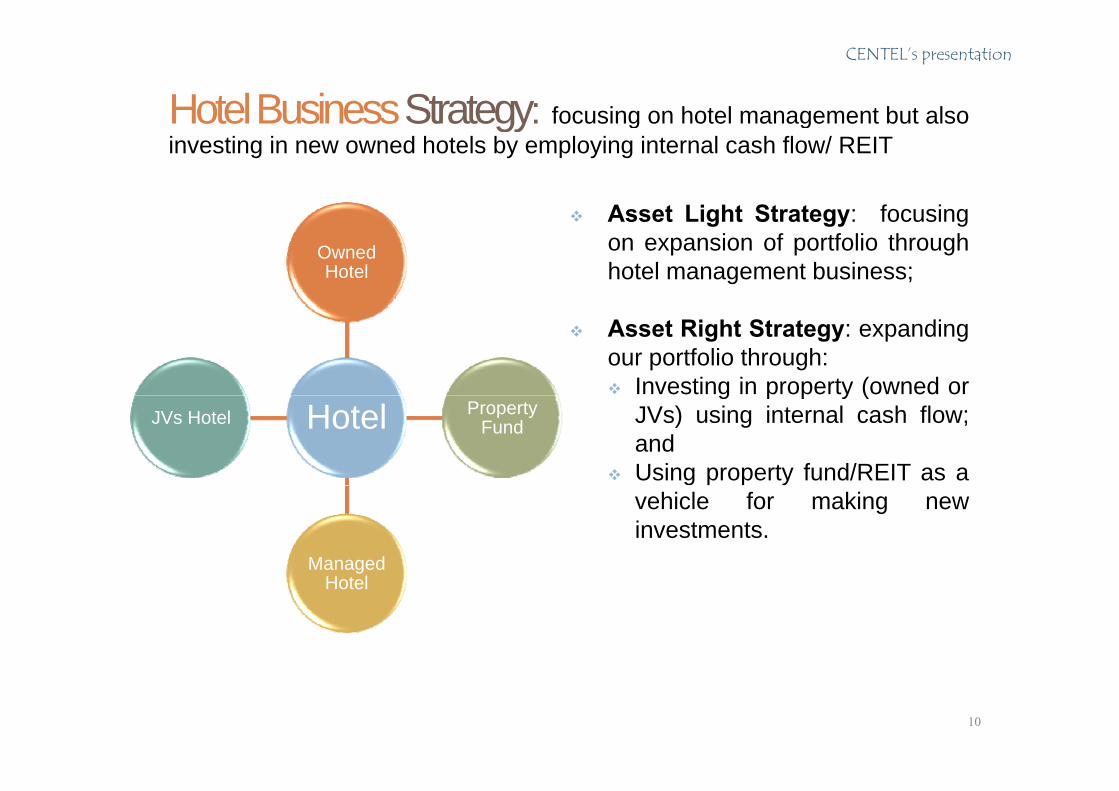
Hotel Business Strategy: focusing on hotel management but also gy g ginvesting in new owned hotels by employing internal cash flow/ REIT
Asset Light Strategy: focusingOwned Hotel
Asset Light Strategy: focusingon expansion of portfolio throughhotel management business;
Asset Right Strategy: expandingour portfolio through: Investing in property (owned or
Hotel Property FundJVs Hotel
g p p y (JVs) using internal cash flow;and
Using property fund/REIT as a
Managed
g yvehicle for making newinvestments.
Hotel
10
CENTEL’s presentation
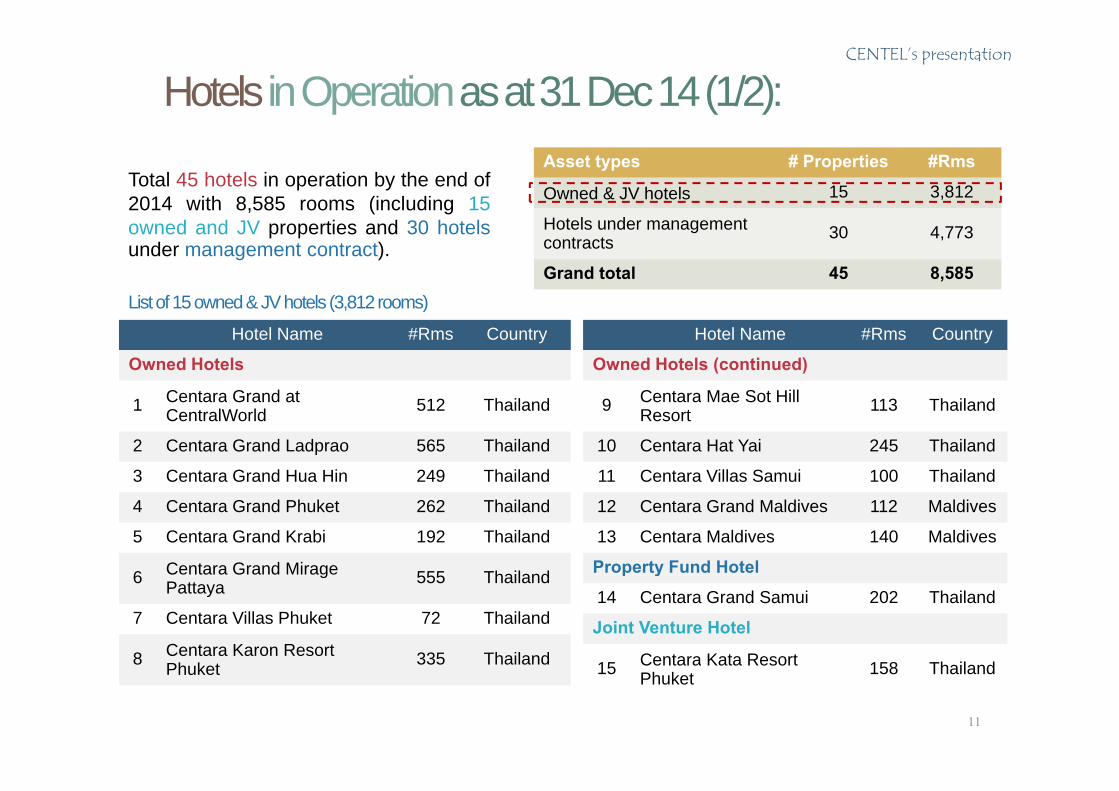
Hotels in Operation as at 31 Dec 14 (1/2):
Total 45 hotels in operation by the end of2014 with 8,585 rooms (including 15
Asset types # Properties #Rms
Owned & JV hotels 15 3,812
owned and JV properties and 30 hotelsunder management contract).
Hotels under management contracts 30 4,773
Grand total 45 8,585Listof15owned& JVhotels (3812rooms)
Hotel Name #Rms Country
Owned Hotels
Centara Grand at
Hotel Name #Rms Country
Owned Hotels (continued)
Centara Mae Sot Hill
List of 15 owned & JV hotels (3,812 rooms)
1 Centara Grand at CentralWorld 512 Thailand
2 Centara Grand Ladprao 565 Thailand
3 Centara Grand Hua Hin 249 Thailand
9 Centara Mae Sot Hill Resort 113 Thailand
10 Centara Hat Yai 245 Thailand
11 Centara Villas Samui 100 Thailand
4 Centara Grand Phuket 262 Thailand
5 Centara Grand Krabi 192 Thailand
6 Centara Grand Mirage 555 Thailand
12 Centara Grand Maldives 112 Maldives
13 Centara Maldives 140 Maldives
Property Fund Hotel6 gPattaya 555 Thailand
7 Centara Villas Phuket 72 Thailand
8 Centara Karon Resort Ph k t 335 Thailand
p y
14 Centara Grand Samui 202 Thailand
Joint Venture Hotel
15 Centara Kata Resort 158 Thailand
11
Phuket 15 Centara Kata Resort Phuket 158 Thailand
CENTEL’s presentation
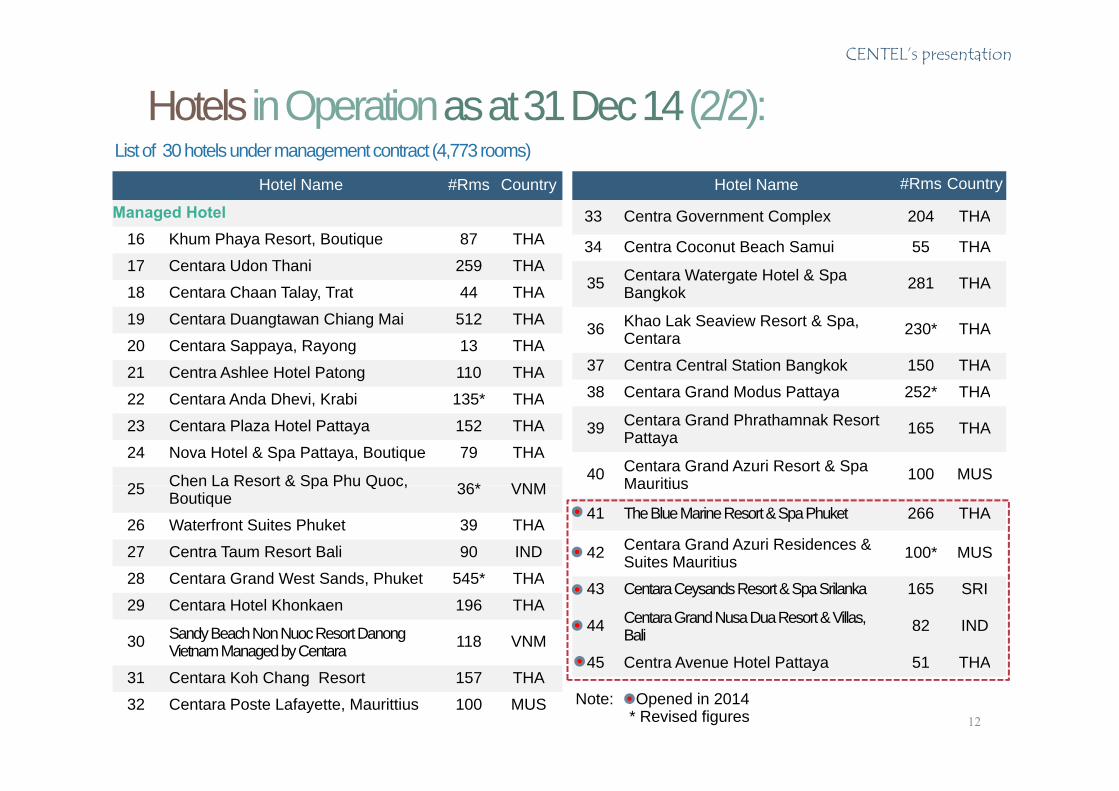
Hotels in Operation as at 31 Dec 14 (2/2):Hotel Name #Rms Country
33 Centra Government Complex 204 THA
p ( )Hotel Name #Rms Country
Managed Hotel
List of 30 hotels under management contract (4,773 rooms)
33 Centra Government Complex 204 THA
34 Centra Coconut Beach Samui 55 THA
35 Centara Watergate Hotel & Spa Bangkok 281 THA
Managed Hotel16 Khum Phaya Resort, Boutique 87 THA
17 Centara Udon Thani 259 THA
18 Centara Chaan Talay, Trat 44 THA
36 Khao Lak Seaview Resort & Spa, Centara 230* THA
37 Centra Central Station Bangkok 150 THA
38 Centara Grand Modus Pattaya 252* THA
19 Centara Duangtawan Chiang Mai 512 THA
20 Centara Sappaya, Rayong 13 THA
21 Centra Ashlee Hotel Patong 110 THA
22 C t A d Dh i K bi 135* THA 38 Centara Grand Modus Pattaya 252 THA
39 Centara Grand Phrathamnak Resort Pattaya 165 THA
40 Centara Grand Azuri Resort & Spa Mauritius 100 MUS
22 Centara Anda Dhevi, Krabi 135* THA
23 Centara Plaza Hotel Pattaya 152 THA
24 Nova Hotel & Spa Pattaya, Boutique 79 THA
25 Chen La Resort & Spa Phu Quoc, 36* VNM Mauritius
41 The Blue Marine Resort & Spa Phuket 266 THA
42 Centara Grand Azuri Residences & Suites Mauritius 100* MUS
25 Chen La Resort & Spa Phu Quoc, Boutique 36* VNM
26 Waterfront Suites Phuket 39 THA
27 Centra Taum Resort Bali 90 IND
28 C t G d W t S d Ph k t 545* THA 43 CentaraCeysandsResort & Spa Srilanka 165 SRI
44 Centara Grand Nusa DuaResort & Villas, Bali 82 IND
45 Centra Avenue Hotel Pattaya 51 THA
28 Centara Grand West Sands, Phuket 545* THA
29 Centara Hotel Khonkaen 196 THA
30 Sandy Beach Non NuocResort DanongVietnam Managed by Centara 118 VNM
45 Centra Avenue Hotel Pattaya 51 THA
12
31 Centara Koh Chang Resort 157 THA
32 Centara Poste Lafayette, Maurittius 100 MUS Note: Opened in 2014* Revised figures
CENTEL’s presentation
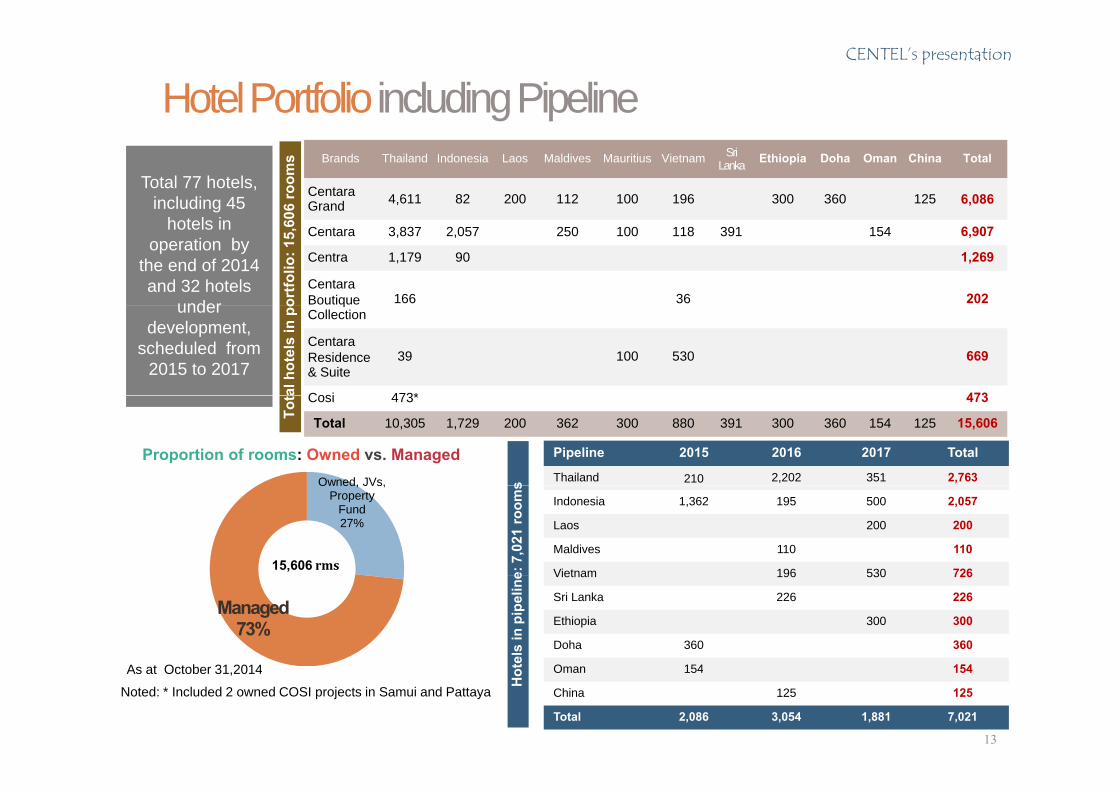
Hotel Portfolio including PipelineBrands Thailand Indonesia Laos Maldives Mauritius Vietnam Sri
Lanka Ethiopia Doha Oman China Total
CentaraGrand 4,611 82 200 112 100 196 300 360 125 6,086
06 ro
oms
Total 77 hotels, including 45
Centara 3,837 2,057 250 100 118 391 154 6,907
Centra 1,179 90 1,269
Centara Boutique 166 36 202or
tfolio
: 15,
60hotels in operation by
the end of 2014 and 32 hotels
under qCollection
CentaraResidence & Suite
39 100 530 669
Cosi 473* 473al h
otel
s in
pounder
development, scheduled from
2015 to 2017
Proportion of rooms: Owned vs. Managed Pipeline 2015 2016 2017 Total
Thailand 210 2,202 351 2,763
Cosi 473* 473
Total 10,305 1,729 200 362 300 880 391 300 360 154 125 15,606Tot
Owned, JVs, s
15,606 rms
Indonesia 1,362 195 500 2,057
Laos 200 200
Maldives 110 110
Vietnam 196 530 726
Owned, JVs, Property
Fund27%
e: 7
,021
room
s
A t O t b 31 2014
Vietnam 196 530 726
Sri Lanka 226 226
Ethiopia 300 300
Doha 360 360
O 154 154
Managed73%
tels
in p
ipel
ine
1313
Noted: * Included 2 owned COSI projects in Samui and Pattaya
As at October 31,2014 Oman 154 154
China 125 125
Total 2,086 3,054 1,881 7,021
Hot
CENTEL’s presentation
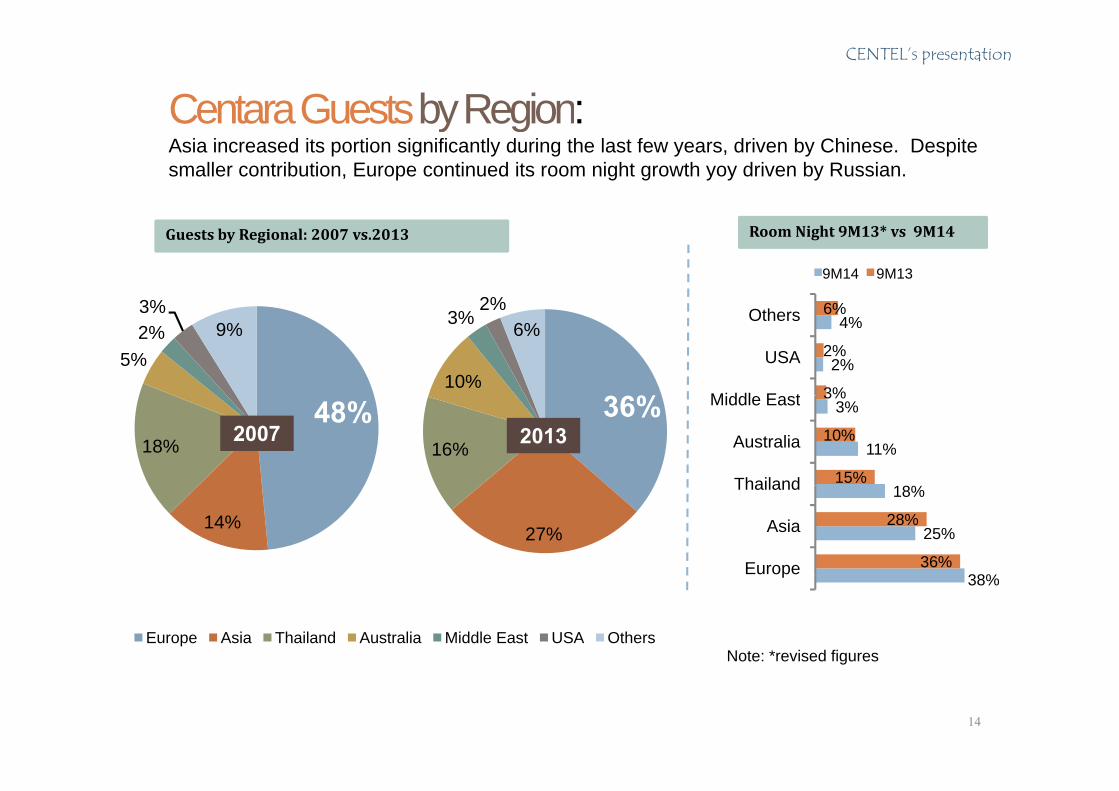
Centara Guests by Region: y gAsia increased its portion significantly during the last few years, driven by Chinese. Despite smaller contribution, Europe continued its room night growth yoy driven by Russian.
3% 2%
Guests by Regional: 2007 vs.2013 Room Night 9M13* vs 9M14
6%
9M14 9M13
5%2%3%
9%
36%10%
3%2%
6%
2%
4%
3%
2%
6%
Middl E t
USA
Others
48%18%
36%16%
2007 2013
18%
11%
3%
15%
10%
3%
Thailand
Australia
Middle East
14% 27%
38%
25%
18%
36%
28%
Europe
Asia
Thailand
Europe Asia Thailand Australia Middle East USA Others
38%p
0% 5% 10% 15% 20% 25% 30% 35% 40%
Note: *revised figures
14
CENTEL’s presentation
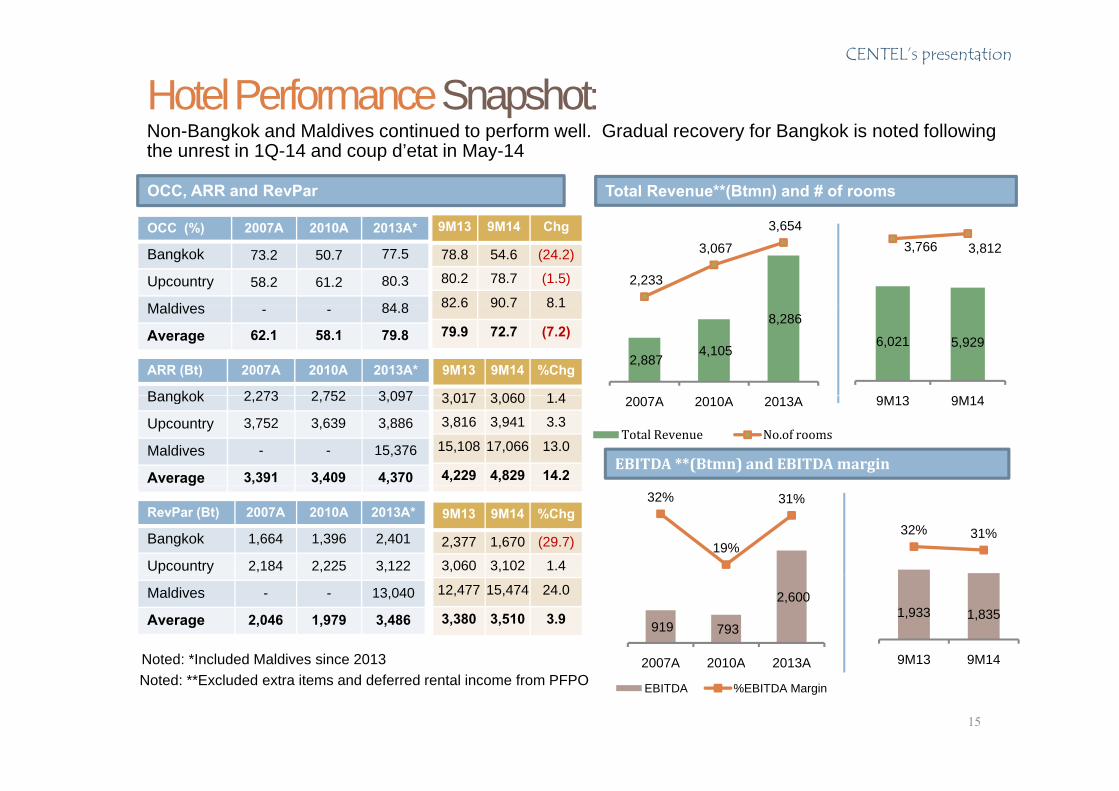
Hotel Performance Snapshot: N B k k d M ldi ti d t f ll G d l f B k k i t d f ll iNon-Bangkok and Maldives continued to perform well. Gradual recovery for Bangkok is noted following the unrest in 1Q-14 and coup d’etat in May-14
OCC, ARR and RevPar Total Revenue**(Btmn) and # of rooms
2,233
3,067
3,654
2,000
2,500
3,000
3,500
4,000
6,000
8,000
10,000 OCC (%) 2007A 2010A 2013A*
Bangkok 73.2 50.7 77.5
Upcountry 58.2 61.2 80.3
Maldi es 84 8
9M13 9M14 Chg
78.8 54.6 (24.2)
80.2 78.7 (1.5)
82 6 90 7 8 1
3,766 3,812
3,300
3,500
3,700
3,900
6,000
8,000
10,000
2,887 4,105
8,286
‐
500
1,000
1,500
2,000
‐
2,000
4,000 Maldives - - 84.8
Average 62.1 58.1 79.8
ARR (Bt) 2007A 2010A 2013A*
Bangkok 2 273 2 752 3 097
82.6 90.7 8.1
79.9 72.7 (7.2)6,021 5,929
2,500
2,700
2,900
3,100
‐
2,000
4,000
9M13 9M14 %Chg
3 017 3 060 1 4 2007A 2010A 2013A
Total Revenue No.of rooms
EBITDA **(Btmn) and EBITDA margin
Bangkok 2,273 2,752 3,097
Upcountry 3,752 3,639 3,886
Maldives - - 15,376
Average 3,391 3,409 4,370
9M13 9M143,017 3,060 1.4
3,816 3,941 3.3
15,108 17,066 13.0
4,229 4,829 14.232%
19%
31%
20.00%
25.00%
30.00%
35.00%
2,000
3,000
4,000
g
RevPar (Bt) 2007A 2010A 2013A*
Bangkok 1,664 1,396 2,401
Upcountry 2,184 2,225 3,122
32% 31%
25.0%
30.0%
35.0%
40.0%
45.0%
50.0%
2,000
3,000
4,000
9M13 9M14 %Chg
2,377 1,670 (29.7)
3,060 3,102 1.4
919 793
2,600
0.00%
5.00%
10.00%
15.00%
-
1,000
2007A 2010A 2013A
Maldives - - 13,040
Average 2,046 1,979 3,486
Noted: *Included Maldives since 2013
1,933 1,835 0.0%
5.0%
10.0%
15.0%
20.0%
‐
1,000
9M13 9M14
12,477 15,474 24.0
3,380 3,510 3.9
15
2007A 2010A 2013A
EBITDA %EBITDA MarginNoted: **Excluded extra items and deferred rental income from PFPO
CENTEL’s presentation
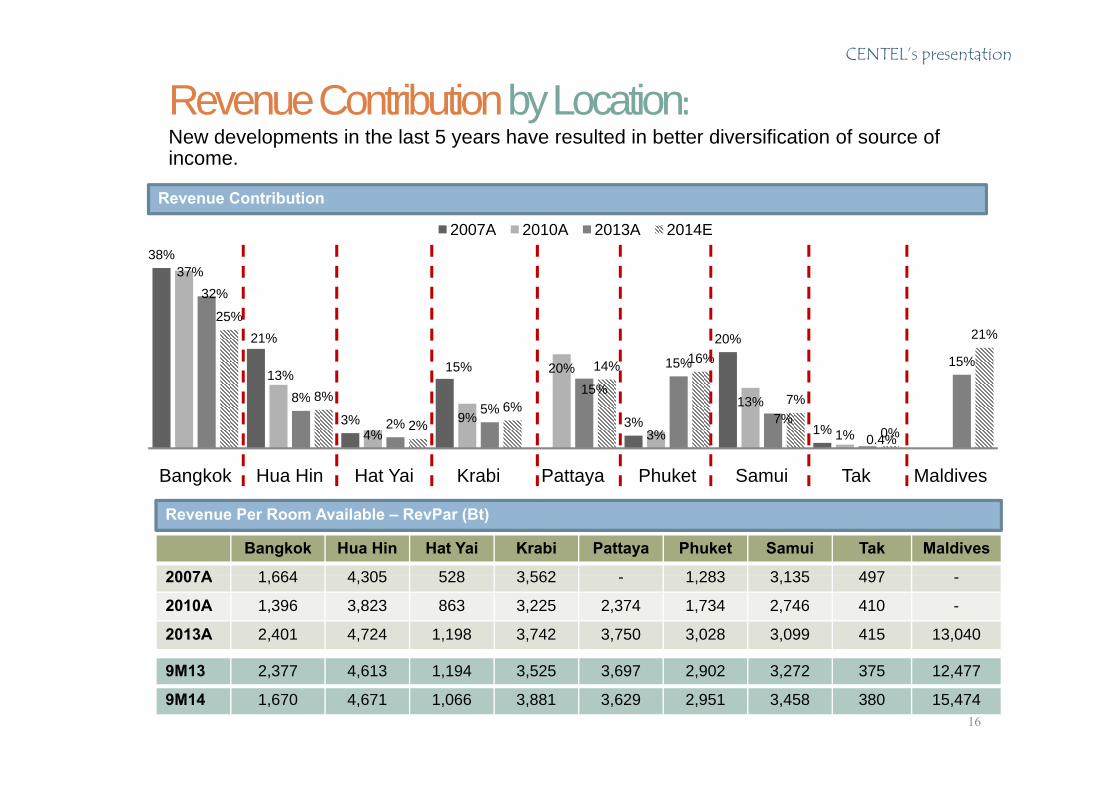
Revenue Contribution by Location: New developments in the last 5 years have resulted in better diversification of source of income.
Revenue Contribution
38%37%
32%
2007A 2010A 2013A 2014E
21%
15%
20%
13% 20%
8% 15%
15% 15%
25%
8%
14% 16%
7%
21%
3% 3% 1%4%9%
3%
13%
1%
8%
2%5%
7%0.4%
8%
2%6% 7%
0%
Bangkok Hua Hin Hat Yai Krabi Pattaya Phuket Samui Tak Maldivesg y
Revenue Per Room Available – RevPar (Bt)
Bangkok Hua Hin Hat Yai Krabi Pattaya Phuket Samui Tak Maldives
2007A 1 664 4 305 528 3 562 1 283 3 135 4972007A 1,664 4,305 528 3,562 - 1,283 3,135 497 -
2010A 1,396 3,823 863 3,225 2,374 1,734 2,746 410 -
2013A 2,401 4,724 1,198 3,742 3,750 3,028 3,099 415 13,040
9M13 2 377 4 613 1 194 3 525 3 697 2 902 3 272 375 12 477
16
9M13 2,377 4,613 1,194 3,525 3,697 2,902 3,272 375 12,477
9M14 1,670 4,671 1,066 3,881 3,629 2,951 3,458 380 15,474

IT
ED
NY
L
IM
IC
OM
PA
N
FOODU
BL
IC
C FOOD
OT
EL
P
UL
AZ
A
HO
RA
L
PL
CE
NT
17
CENTEL’s presentation
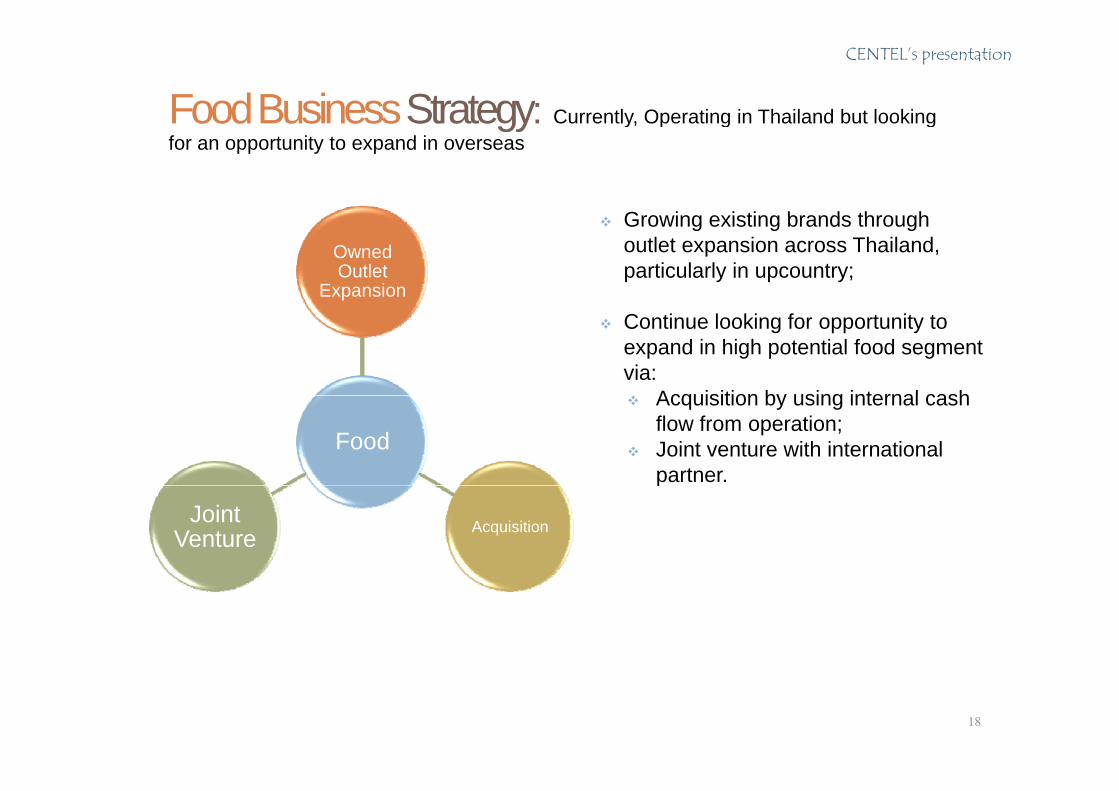
Food Business Strategy: Currently, Operating in Thailand but looking gy y p g gfor an opportunity to expand in overseas
Growing existing brands throughOwned Outlet
Expansion
Growing existing brands through outlet expansion across Thailand, particularly in upcountry;
Continue looking for opportunity to expand in high potential food segment via: Acquisition by using internal cash
Food
Acquisition by using internal cash flow from operation;
Joint venture with international partner.
AcquisitionJoint Venture
p
18
CENTEL’s presentation
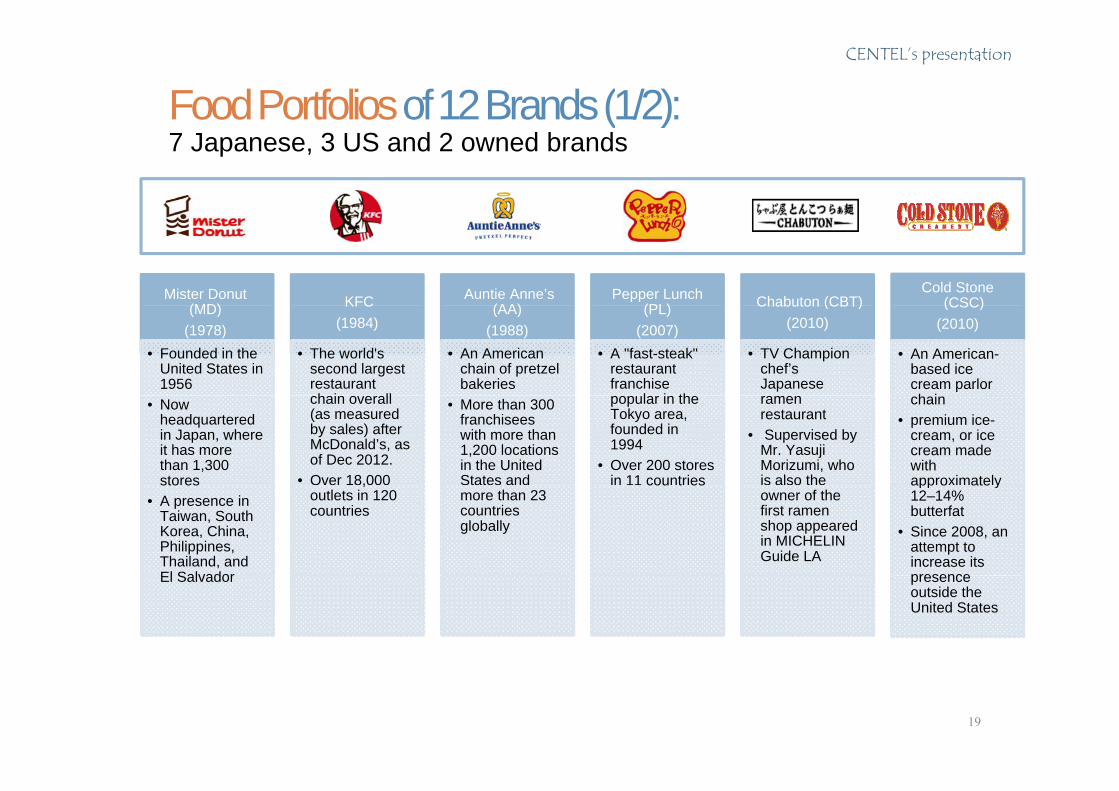
Food Portfoliosof 12 Brands (1/2): ( )7 Japanese, 3 US and 2 owned brands
Mister Donut (MD) KFC Auntie Anne’s
(AA)Pepper Lunch
(PL) Chabuton (CBT)Cold Stone
(CSC)(MD)(1978)
• Founded in the United States in 1956
KFC(1984)
• The world's second largest restaurant h i ll
(AA)(1988)
• An American chain of pretzel bakeries
(PL)(2007)
• A "fast-steak" restaurant franchise
l i th
Chabuton (CBT)(2010)
• TV Champion chef’s Japanese
(CSC)(2010)
• An American-based ice cream parlor h i• Now
headquartered in Japan, where it has more than 1,300 stores
chain overall (as measured by sales) after McDonald’s, as of Dec 2012.
• Over 18,000
• More than 300 franchisees with more than 1,200 locations in the United States and
popular in the Tokyo area, founded in 1994
• Over 200 stores in 11 countries
ramen restaurant
• Supervised by Mr. Yasuji Morizumi, who is also the
chain• premium ice-
cream, or ice cream made with approximately sto es
• A presence in Taiwan, South Korea, China, Philippines, Thailand, and El Salvador
,outlets in 120 countries
more than 23 countries globally
cou t esowner of the first ramen shop appeared in MICHELIN Guide LA
app o ate y12–14% butterfat
• Since 2008, an attempt to increase its presenceEl Salvador presence outside the United States
19
CENTEL’s presentation
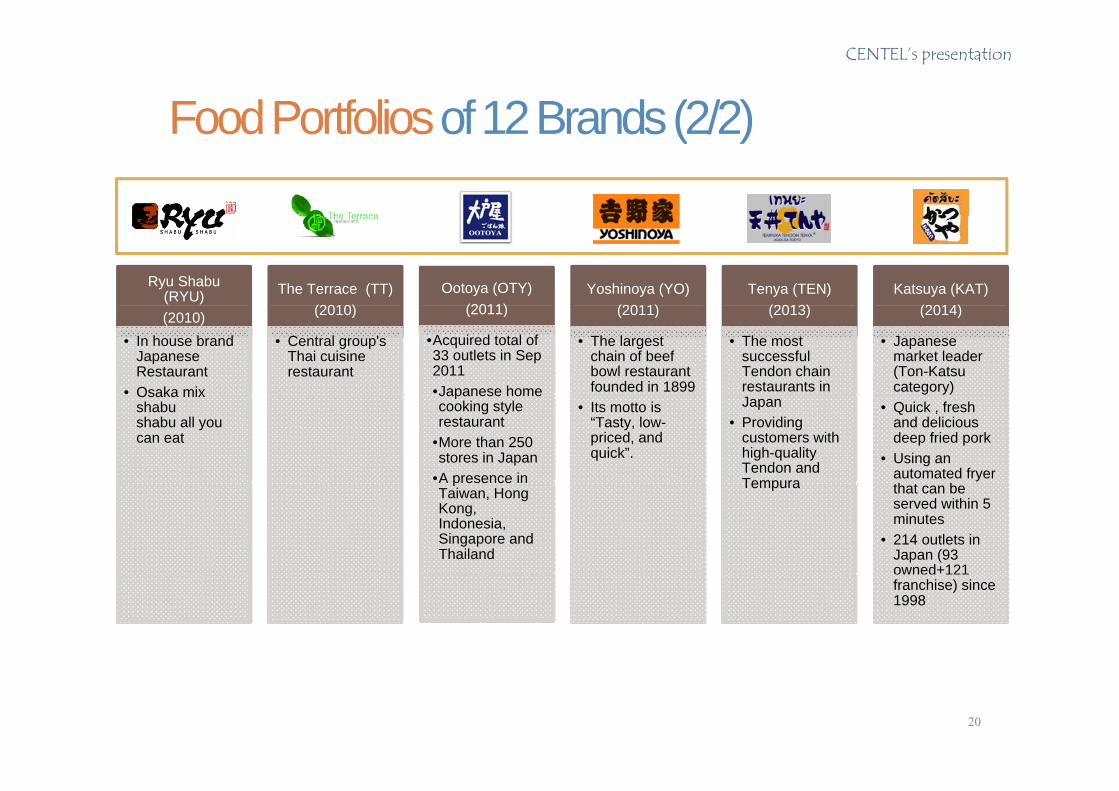
FoodPortfoliosof12Brands(2/2)Food Portfolios of 12 Brands (2/2)
Ryu Shabu(RYU) The Terrace (TT)
(2010)Ootoya (OTY)
(2011)Yoshinoya (YO)
(2011)Tenya (TEN)
(2013)Katsuya (KAT)
(2014)(2010)• In house brand
Japanese Restaurant
• Osaka mix
(2010)
• Central group's Thai cuisine restaurant
(2011)
•Acquired total of 33 outlets in Sep 2011•Japanese home
(2011)
• The largest chain of beef bowl restaurant founded in 1899
(2013)
• The most successful Tendon chain restaurants in
(2014)
• Japanese market leader (Ton-Katsucategory) Osaka mix
shabushabu all you can eat
Japanese home cooking style restaurant
•More than 250 stores in Japan
•A presence in
• Its motto is “Tasty, low-priced, and quick”.
Japan• Providing
customers with high-quality Tendon and Tempura
• Quick , fresh and delicious deep fried pork
• Using an automated fryer th t b
pTaiwan, Hong Kong, Indonesia, Singapore and Thailand
Tempura that can be served within 5 minutes
• 214 outlets in Japan (93 owned+121 franchise) since 1998
20
CENTEL’s presentation
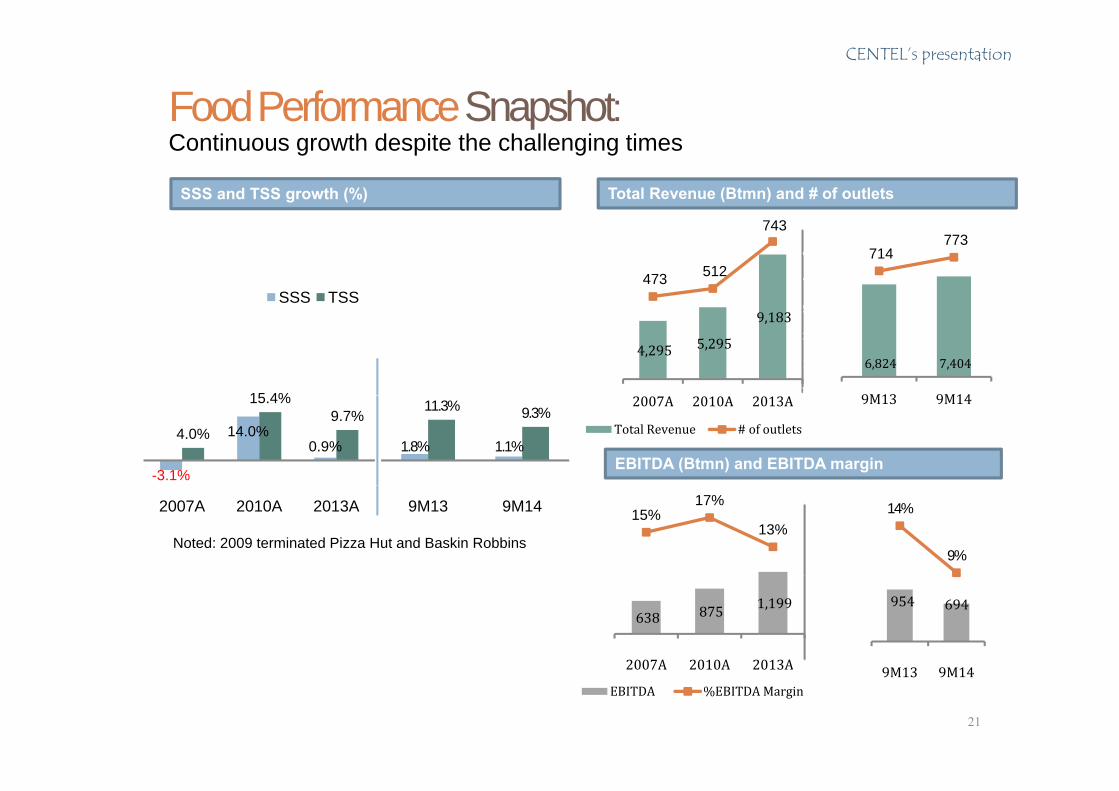
Food Performance Snapshot:pContinuous growth despite the challenging times
SSS and TSS growth (%) Total Revenue (Btmn) and # of outlets
473 512
743
500
600
700
800
7,000
9,000
11,000
SSS TSS
714 773
600
700
800
900
5 000
7,000
9,000
11,000
4,295 5,295
9,183
-
100
200
300
400
(1,000)
1,000
3,000
5,000
15 4%
6,824 7,404
200
300
400
500
(1,000)
1,000
3,000
5,000
9M13 9M14(1,000)2007A 2010A 2013A
Total Revenue # of outlets
EBITDA (Btmn) and EBITDA margin-3.1%
14.0%0.9%
4.0%
15.4%9.7%
1.8% 1.1%
11.3% 9.3%( )
9M13 9M14
15%17%
13%
10.0%
12.0%
14.0%
16.0%
18.0%
1,500
2,500
Noted: 2009 terminated Pizza Hut and Baskin Robbins
2007A 2010A 2013A 9M13 9M14 14%
9%10.0%
12.0%
14.0%
16.0%
1,500
2,500
638 875 1,199
0.0%
2.0%
4.0%
6.0%
8.0%
(500)
500
2007A 2010A 2013A
954 694
2.0%
4.0%
6.0%
8.0%
(5 )
500
21
( ) 2007A 2010A 2013A
EBITDA %EBITDA Margin
0.0%(500) 9M13 9M14
CENTEL’s presentation
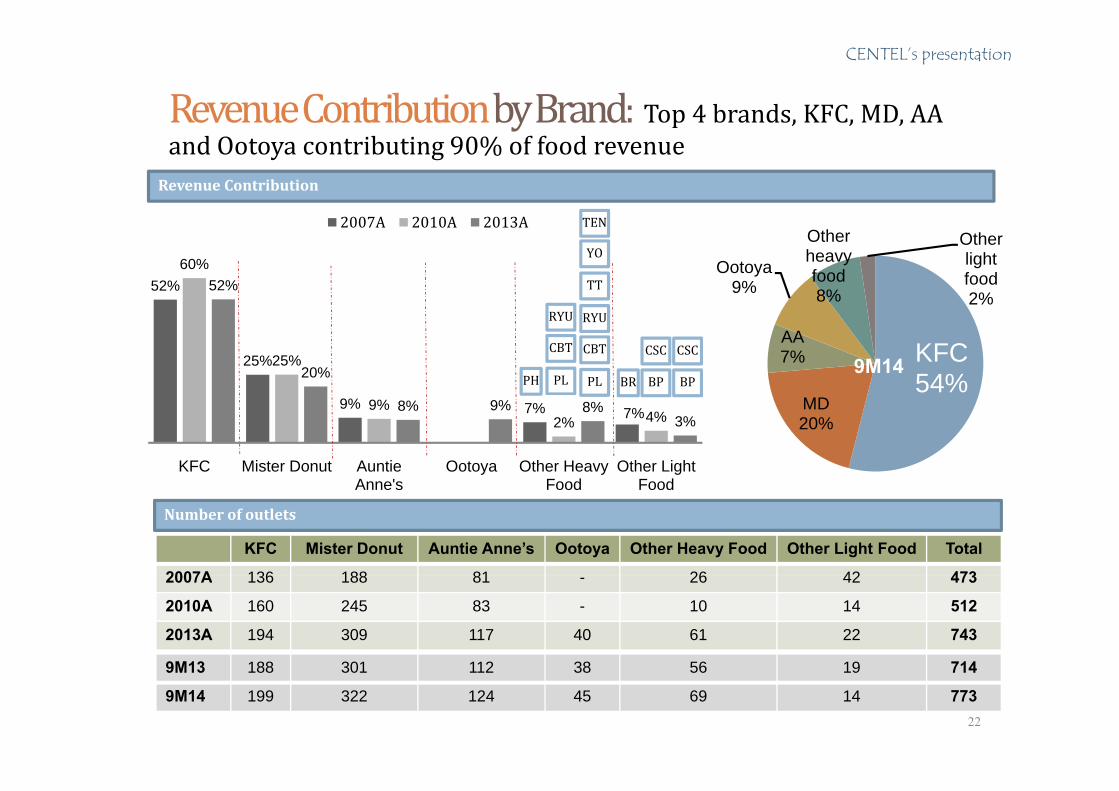
Revenue Contribution by Brand: Top 4 brands, KFC, MD, AA y pand Ootoya contributing 90% of food revenueRevenue Contribution
52%60%
52%
2007A 2010A 2013A
TT
YO
TEN
Ootoya9%
Other heavy food8%
Other light food2%
25%25%20% PH
CBT
RYU
PL
CSC
BP
CBT
RYU
PL
CSC
BPBR
KFC54%
AA7% 9M14
9% 7% 7%9%2% 4%
8% 9% 8%3%
KFC Mister Donut Auntie Anne's
Ootoya Other Heavy Food
Other Light Food
MD20%
Anne s Food Food
Number of outlets
KFC Mister Donut Auntie Anne’s Ootoya Other Heavy Food Other Light Food Total
2007A 136 188 81 26 42 4732007A 136 188 81 - 26 42 473
2010A 160 245 83 - 10 14 512
2013A 194 309 117 40 61 22 743
9M13 188 301 112 38 56 19 714
22
9M13 188 301 112 38 56 19 714
9M14 199 322 124 45 69 14 773

IT
ED
NY
L
IM
IC
OM
PA
NU
BL
IC
C
OT
EL
P
U
Hi hli ht
LA
ZA
H
O Highlight
RA
L
PL
g g
CE
NT
23
CENTEL’s presentation
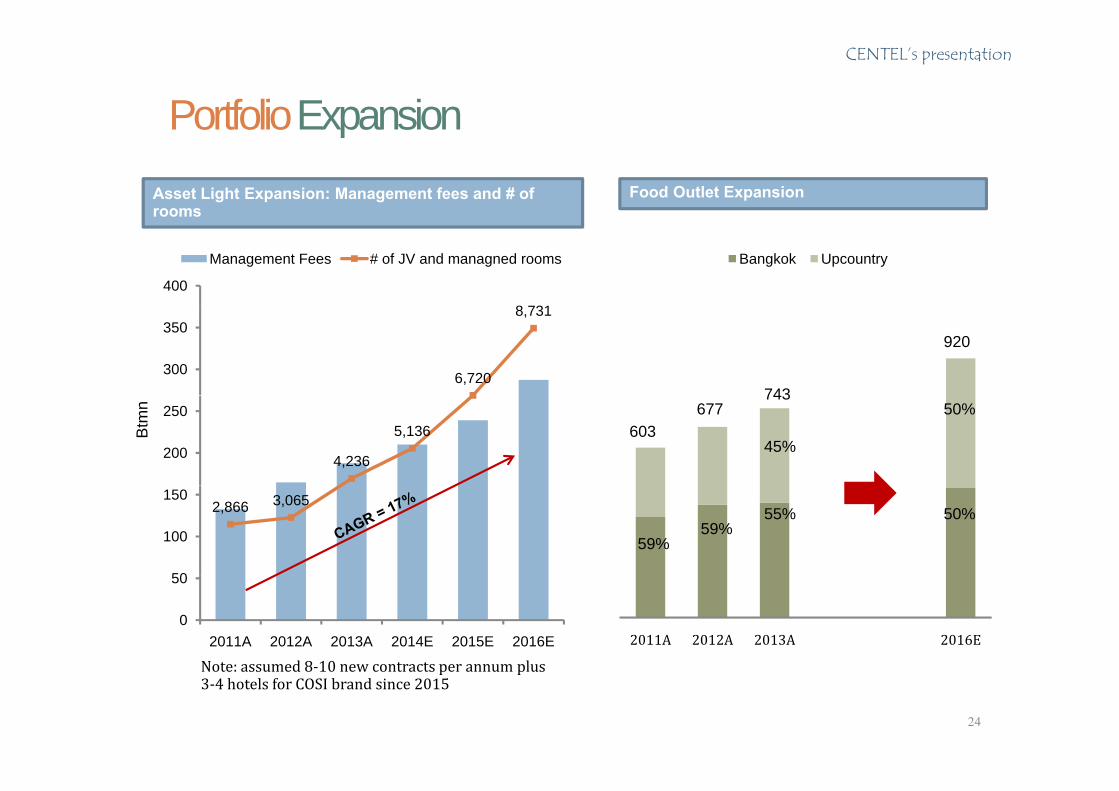
PortfolioExpansionPortfolio Expansion Asset Light Expansion: Management fees and # of rooms
Food Outlet Expansion
8 731
10000400
Management Fees # of JV and managned rooms
rooms
Bangkok Upcountry
6,720
8,731
7000
8000
9000
300
350
743
920
4,236
5,1365000
6000
200
250
Btm
n
603677
743
45%
50%
2,866 3,065
2000
3000
4000
50
100
150
59%59%
55% 50%
0
1000
0
50
2011A 2012A 2013A 2014E 2015E 2016E 2011A 2012A 2013A 2016E
Note: assumed 8 10 new contracts per annum plus
24
Note: assumed 8‐10 new contracts per annum plus 3‐4 hotels for COSI brand since 2015
CENTEL’s presentation
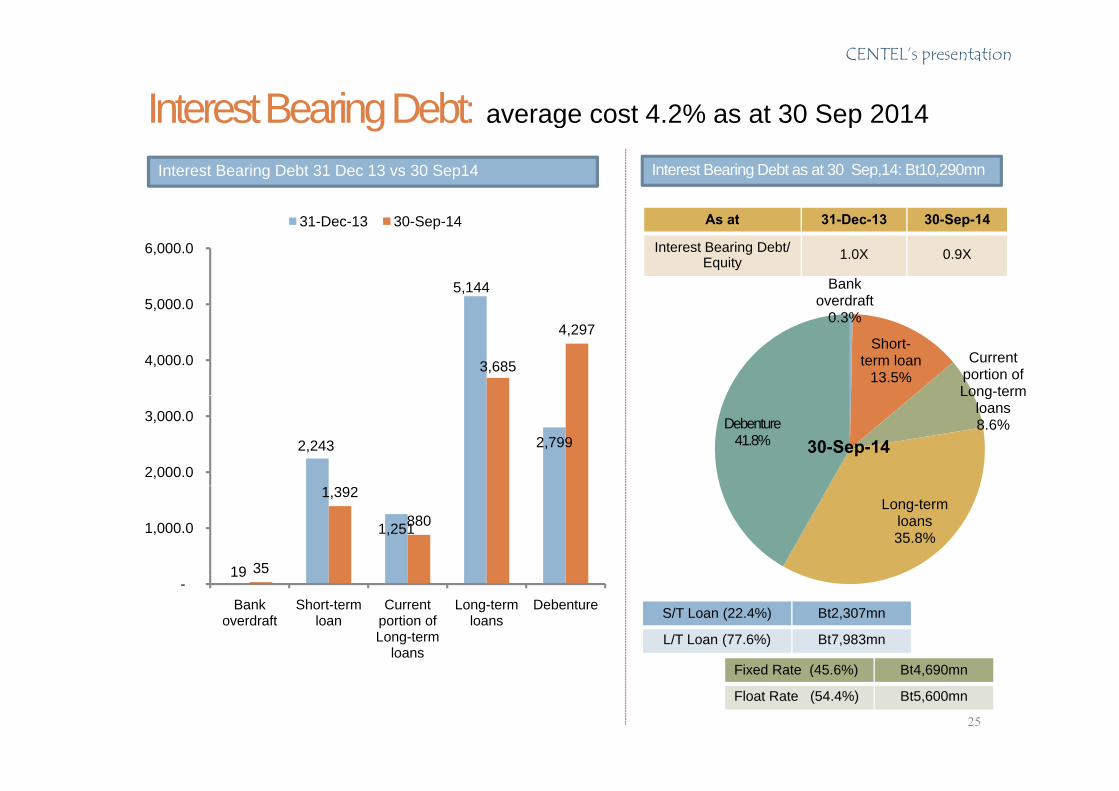
Interest Bearing Debt: average cost 4.2% as at 30 Sep 2014g g p
31 D 13 30 S 14
Interest Bearing Debt 31 Dec 13 vs 30 Sep14 Interest Bearing Debt as at 30 Sep,14: Bt10,290mn
A t 31 D 13 30 S 14
5,1445 000 0
6,000.0
31-Dec-13 30-Sep-14
Bank overdraft
As at 31-Dec-13 30-Sep-14
Interest Bearing Debt/ Equity 1.0X 0.9X
3,685
4,297
4,000.0
5,000.0 0.3%
Short-term loan
13.5%Current
portion of Long-term
2,243 2,799
2,000.0
3,000.0
Long term loans8.6%Debenture
41.8% 30-Sep-14
19
1,251
35
1,392
8801,000.0 Long-term
loans35.8%
19-
Bank overdraft
Short-term loan
Current portion of Long-term
loans
Long-term loans
Debenture S/T Loan (22.4%) Bt2,307mn
L/T Loan (77.6%) Bt7,983mn
Fi d R t (45 6%) Bt4 690
25
Fixed Rate (45.6%) Bt4,690mn
Float Rate (54.4%) Bt5,600mn
CENTEL’s presentation
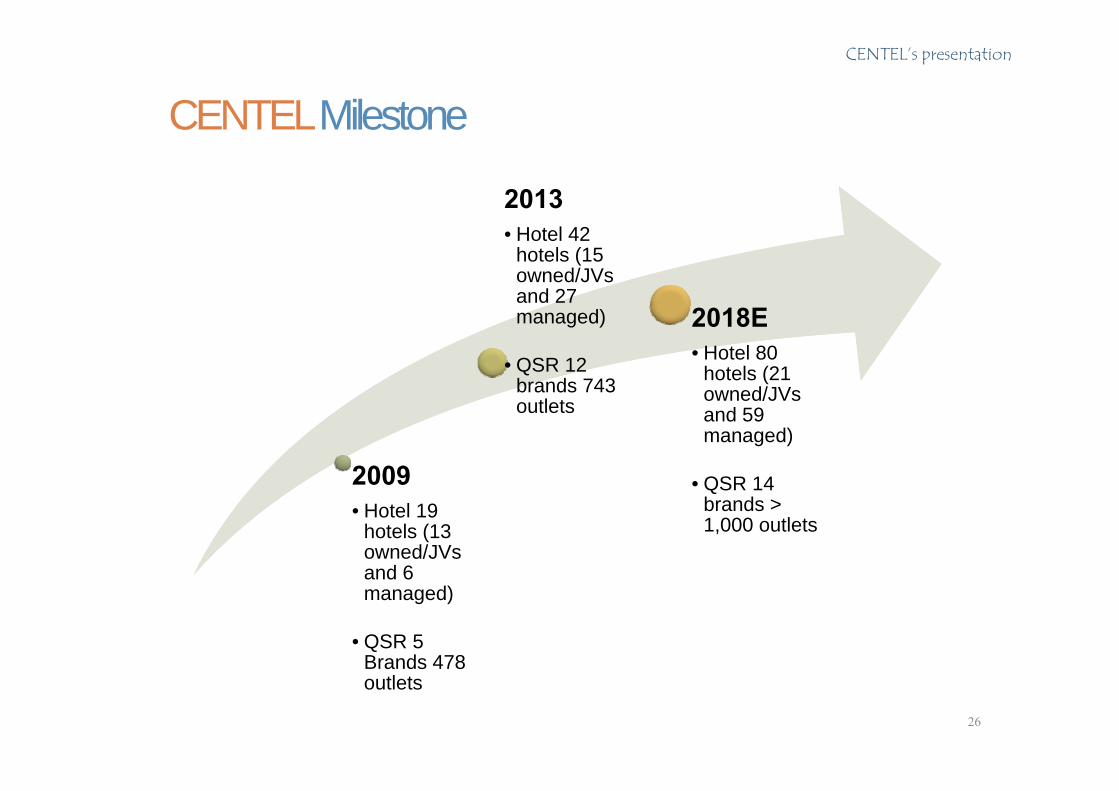
CENTELMilestone
2013
CENTELMilestone
• Hotel 42 hotels (15 owned/JVs and 27 managed)
• QSR 12 brands 743
2018E• Hotel 80
hotels (21 owned/JVs
2009
outlets owned/JVs and 59 managed)
• QSR 14• Hotel 19
hotels (13 owned/JVs and 6
• QSR 14 brands > 1,000 outlets
and 6 managed)
• QSR 5 Brands 478Brands 478 outlets
26
CENTEL’s presentation
hankYouThank YouT
CENTEL’s presentation
ppendixAppendixA
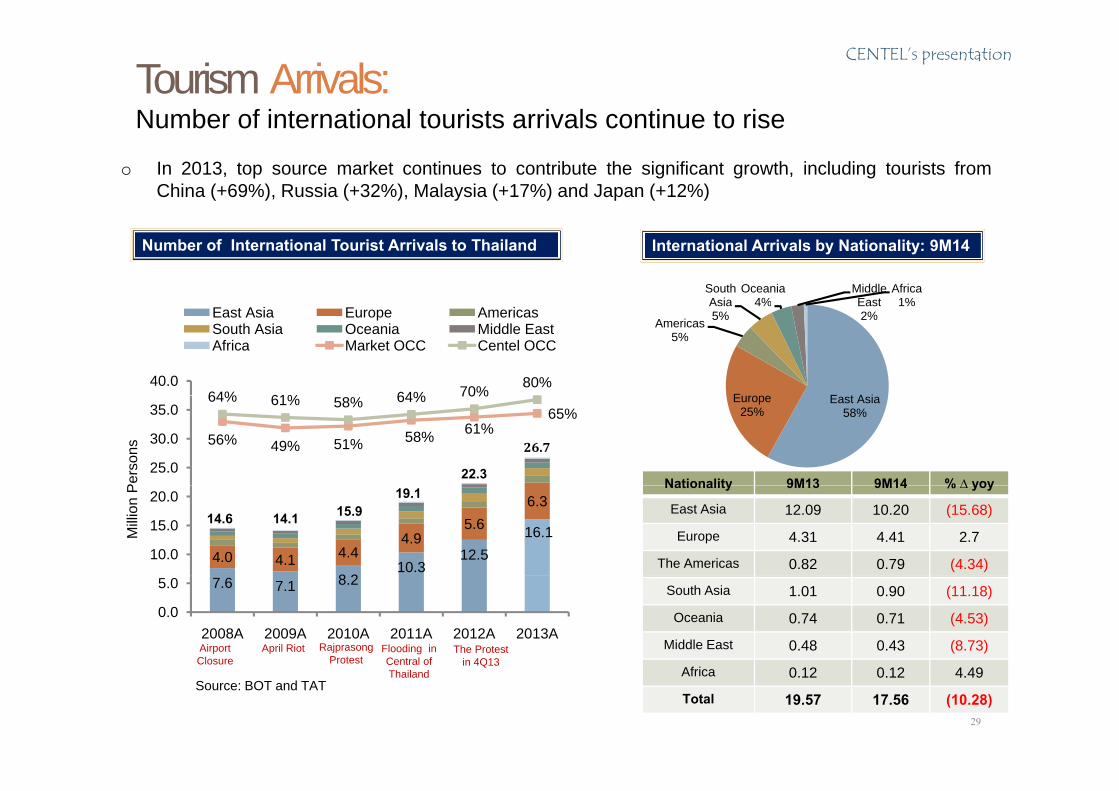
Tourism Arrivals:Number of international tourists arrivals continue to rise
CENTEL’s presentation
Number of international tourists arrivals continue to rise
o In 2013, top source market continues to contribute the significant growth, including tourists fromChina (+69%), Russia (+32%), Malaysia (+17%) and Japan (+12%)
International Arrivals by Nationality: 9M14Number of International Tourist Arrivals to Thailand
South Asia
Oceania4%
Middle East
Africa1%
64% 61% 64% 70% 80% 100.00%40.0
East Asia Europe AmericasSouth Asia Oceania Middle EastAfrica Market OCC Centel OCC
E t A iE
Americas5%
Asia5%
4% East2%
1%
56% 49% 51% 58% 61%65%
64% 61% 58% 64% 70%
0.00%
50.00%
25.0
30.0
35.0
Per
sons
22.3
East Asia58%
Europe25%
Nationality 9M13 9M14 % ∆ yoy
26.7
8 210.3
12.516.1
4.0 4.1 4.44.9
5.66.3
-100.00%
-50.00%
10.0
15.0
20.0
Mill
ion
P
14.6 14.1 15.919.1
Nationality 9M13 9M14 % ∆ yoy
East Asia 12.09 10.20 (15.68)
Europe 4.31 4.41 2.7
The Americas 0.82 0.79 (4.34)
Flooding in Central of
7.6 7.1 8.2
-150.00%0.0
5.0
2008A 2009A 2010A 2011A 2012A 2013AAirport Closure
April Riot RajprasongProtest
South Asia 1.01 0.90 (11.18)
Oceania 0.74 0.71 (4.53)
Middle East 0.48 0.43 (8.73)The Protest in 4Q13Ce a o
ThailandSource: BOT and TAT
Africa 0.12 0.12 4.49
Total 19.57 17.56 (10.28)
in 4Q13
29