Embed Size (px)
Citation preview

CEP Discussion Paper No 927
May 2009
(revised June 2013)
The Distinct Effects of Information Technology and
Communication Technology on Firm Organization
Nicholas Bloom, Luis Garicano,
Raffaella Sadun and John Van Reenen¶

Abstract Guided by theories of management by exception, we study the impact of Information and Communication
Technology on worker and plant manager autonomy and on span of control. We find, using an original dataset
of American and European manufacturing firms, that better information technologies (Enterprise Resource
Planning for plant managers and CAD/CAM for production workers) are associated with more autonomy and a
wider span, while technologies that improve communication (like data intranets) decrease autonomy for workers
and plant managers, consistently with the theory. Using instrumental variables (distance from ERP’s birthplace
and heterogeneous telecommunication costs arising from regulation) strengthens our results.
JEL Classifications: O31, O32, O33, F23
Keywords: organization, delegation, information technology, communication technology, the theory of the firm
This paper was published as part of the Centre’s Productivity and Innovation Programme. The Centre for
Economic Performance is financed by the Economic and Social Research Council.
Acknowledgements This paper is produced as part of the project Science, Innovation, Firms and Markets in a Globalized World
SCIFI-GLOW), a Collaborative Project funded by the European Commission’s Seventh Research framework
Programme, Contract number SSH7-CT-2008-217436. Any opinions expressed here are those of the author(s)
and not those of the European Commission.
This is an extensively revised version of Bloom, Garicano, Sadun and Van Reenen (2009). We thank
participants in seminars in the AEA, Chicago, Harvard/MIT, LSE, Microsoft and NBER for helpful comments.
We would like to thank the ESRC for help with financing this research through the Centre for Economic
Performance. Bloom and Garicano also thank the Toulouse Network on Information Technology.
Nick Bloom is an Associate at the Centre for Economic Performance, London School of Economics.
He is also a Professor with the Department of Economics, Stanford University. Luis Garicano is an Associate at
CEP and Professor of Economics and Strategy, Departments of Management and of Economics, LSE. Raffaella
Sadun is an Associate at CEP and an Assistant Professor at Harvard Business School. John Van Reenen is
Director of CEP and Professor of Economics, LSE.
Published by
Centre for Economic Performance
London School of Economics and Political Science
Houghton Street
London WC2A 2AE
All rights reserved. No part of this publication may be reproduced, stored in a retrieval system or transmitted in
any form or by any means without the prior permission in writing of the publisher nor be issued to the public or
circulated in any form other than that in which it is published.
Requests for permission to reproduce any article or part of the Working Paper should be sent to the editor at the
above address.
N. Bloom, L. Garicano, R. Sadun and J. Van Reenen, resubmitted 2013
ISSN 2042-2695
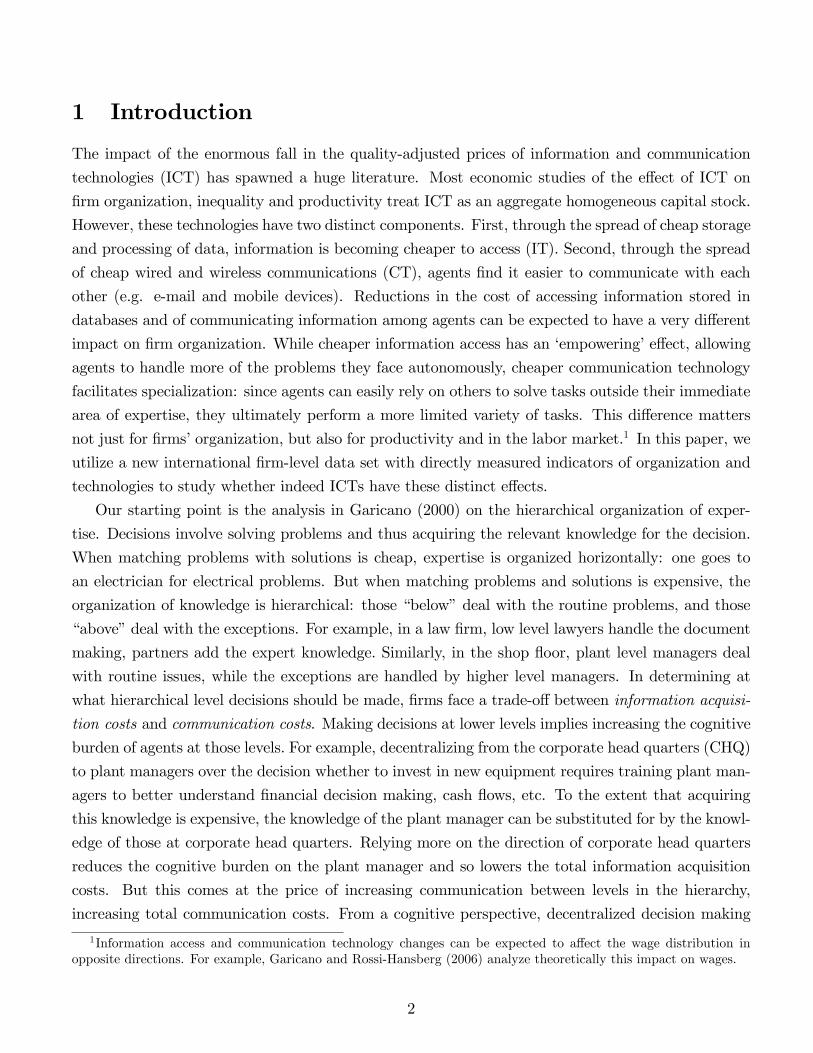
1 Introduction
The impact of the enormous fall in the quality-adjusted prices of information and communication
technologies (ICT) has spawned a huge literature. Most economic studies of the e§ect of ICT on
firm organization, inequality and productivity treat ICT as an aggregate homogeneous capital stock.
However, these technologies have two distinct components. First, through the spread of cheap storage
and processing of data, information is becoming cheaper to access (IT). Second, through the spread
of cheap wired and wireless communications (CT), agents find it easier to communicate with each
other (e.g. e-mail and mobile devices). Reductions in the cost of accessing information stored in
databases and of communicating information among agents can be expected to have a very di§erent
impact on firm organization. While cheaper information access has an ‘empowering’ e§ect, allowing
agents to handle more of the problems they face autonomously, cheaper communication technology
facilitates specialization: since agents can easily rely on others to solve tasks outside their immediate
area of expertise, they ultimately perform a more limited variety of tasks. This di§erence matters
not just for firms’ organization, but also for productivity and in the labor market.1 In this paper, we
utilize a new international firm-level data set with directly measured indicators of organization and
technologies to study whether indeed ICTs have these distinct e§ects.
Our starting point is the analysis in Garicano (2000) on the hierarchical organization of exper-
tise. Decisions involve solving problems and thus acquiring the relevant knowledge for the decision.
When matching problems with solutions is cheap, expertise is organized horizontally: one goes to
an electrician for electrical problems. But when matching problems and solutions is expensive, the
organization of knowledge is hierarchical: those “below” deal with the routine problems, and those
“above” deal with the exceptions. For example, in a law firm, low level lawyers handle the document
making, partners add the expert knowledge. Similarly, in the shop floor, plant level managers deal
with routine issues, while the exceptions are handled by higher level managers. In determining at
what hierarchical level decisions should be made, firms face a trade-o§ between information acquisi-
tion costs and communication costs. Making decisions at lower levels implies increasing the cognitive
burden of agents at those levels. For example, decentralizing from the corporate head quarters (CHQ)
to plant managers over the decision whether to invest in new equipment requires training plant man-
agers to better understand financial decision making, cash flows, etc. To the extent that acquiring
this knowledge is expensive, the knowledge of the plant manager can be substituted for by the knowl-
edge of those at corporate head quarters. Relying more on the direction of corporate head quarters
reduces the cognitive burden on the plant manager and so lowers the total information acquisition
costs. But this comes at the price of increasing communication between levels in the hierarchy,
increasing total communication costs. From a cognitive perspective, decentralized decision making
1Information access and communication technology changes can be expected to a§ect the wage distribution inopposite directions. For example, Garicano and Rossi-Hansberg (2006) analyze theoretically this impact on wages.
2
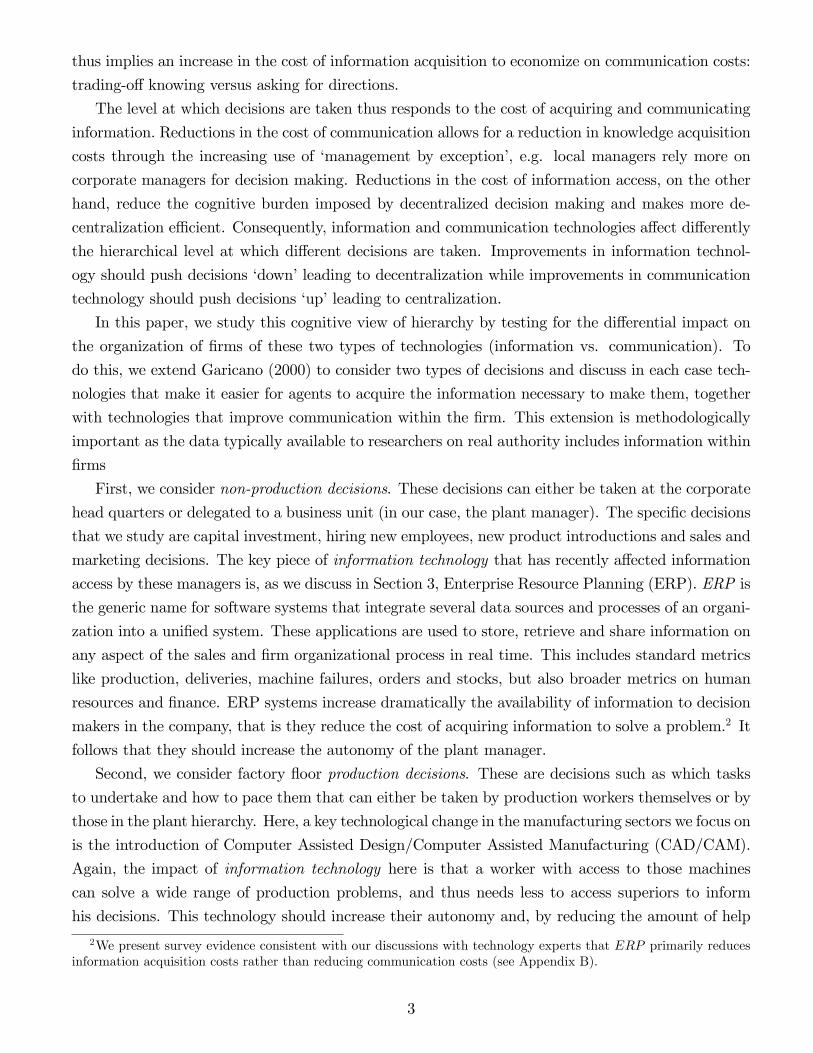
thus implies an increase in the cost of information acquisition to economize on communication costs:
trading-o§ knowing versus asking for directions.
The level at which decisions are taken thus responds to the cost of acquiring and communicating
information. Reductions in the cost of communication allows for a reduction in knowledge acquisition
costs through the increasing use of ‘management by exception’, e.g. local managers rely more on
corporate managers for decision making. Reductions in the cost of information access, on the other
hand, reduce the cognitive burden imposed by decentralized decision making and makes more de-
centralization e¢cient. Consequently, information and communication technologies a§ect di§erently
the hierarchical level at which di§erent decisions are taken. Improvements in information technol-
ogy should push decisions ‘down’ leading to decentralization while improvements in communication
technology should push decisions ‘up’ leading to centralization.
In this paper, we study this cognitive view of hierarchy by testing for the di§erential impact on
the organization of firms of these two types of technologies (information vs. communication). To
do this, we extend Garicano (2000) to consider two types of decisions and discuss in each case tech-
nologies that make it easier for agents to acquire the information necessary to make them, together
with technologies that improve communication within the firm. This extension is methodologically
important as the data typically available to researchers on real authority includes information within
firms
First, we consider non-production decisions. These decisions can either be taken at the corporate
head quarters or delegated to a business unit (in our case, the plant manager). The specific decisions
that we study are capital investment, hiring new employees, new product introductions and sales and
marketing decisions. The key piece of information technology that has recently a§ected information
access by these managers is, as we discuss in Section 3, Enterprise Resource Planning (ERP). ERP is
the generic name for software systems that integrate several data sources and processes of an organi-
zation into a unified system. These applications are used to store, retrieve and share information on
any aspect of the sales and firm organizational process in real time. This includes standard metrics
like production, deliveries, machine failures, orders and stocks, but also broader metrics on human
resources and finance. ERP systems increase dramatically the availability of information to decision
makers in the company, that is they reduce the cost of acquiring information to solve a problem.2 It
follows that they should increase the autonomy of the plant manager.
Second, we consider factory floor production decisions. These are decisions such as which tasks
to undertake and how to pace them that can either be taken by production workers themselves or by
those in the plant hierarchy. Here, a key technological change in the manufacturing sectors we focus on
is the introduction of Computer Assisted Design/Computer Assisted Manufacturing (CAD/CAM).
Again, the impact of information technology here is that a worker with access to those machines
can solve a wide range of production problems, and thus needs less to access superiors to inform
his decisions. This technology should increase their autonomy and, by reducing the amount of help
2We present survey evidence consistent with our discussions with technology experts that ERP primarily reducesinformation acquisition costs rather than reducing communication costs (see Appendix B).
3
they need from plant managers, increase the span of control of plant managers. In sum, we expect
‘information technologies’ (ERP and CAD/CAM) to decentralize decision making respectively in
non production decisions (from CHQ to plant managers) and in production decisions (from plant
managers towards production workers).
On the other hand, as we argued above, we expect communication technologies, that is those
that facilitate communication within the firm, to increase centralized decision making. This will be
true both for types of decisions discussed above, so that this technologies will a§ect in the same way
production workers (so that plant-managers will take more of their decisions), and also for plant-
managers (so that the corporate head quarters will take more of their decisions). A key technological
innovation a§ecting communication is the growth of intranets. We test whether the availability of
intranets reduced the decision making autonomy in production decisions of workers, and in non-
production decisions of managers.
We utilize a new data set that combines manufacturing plant-level measures of organization
and ICT across the US and Europe. The organizational questions were collected as part of our own
management survey work (see Bloom and Van Reenen, 2007) and were asked to be directly applicable
to the theories we investigate. The technology dataset is from a private sector data source (Harte-
Hanks) that has been used mainly to measure hardware utilization in large publicly listed firms (e.g.
Bresnahan, Brynjolfsson and Hitt, 2002), whereas we focus on the less used software components of
the survey.
In terms of identification, we mainly focus on conditional correlations between the di§erent ICT
measures and three dimensions of the organization of the firm, guided by our theoretical predic-
tions. But we also consider two instrumental variable strategies to take into account the possible
endogeneity of investments in ICT. First, we use the distance from Walldorf which was the German
birthplace of the SAP company and remains the location of its headquarters as an instrument for
ERP presence. SAP was the first major ERP vendor and is still the market leader. This draws on
the general observation, which is true in our data, that the di§usion of an innovation has a strong
geographical dimension.3 Second, we utilize the fact that the di§erential regulation of the telecommu-
nication industry across countries generates exogenous di§erences in the e§ective prices of intranets.
We show that industries that exogenously rely more on intranets are at a greater disadvantage in
countries with high communication costs, and use this to identify the e§ect of communication costs
on decentralization. Our IV results support a causal interpretation of the e§ect of information and
communication technologies on firm organization.
In short, the evidence is supportive of the theory. Technologies that lead to falling information
costs for non-production decisions (like ERP) tend to empower plant managers (relative to the CHQ)
and technologies that lead to falling information costs for production decisions (like CAD/CAM)
3Examples of how geographical proximity is important for di§usion include Henderson, Ja§e and Trajtenberg(2003), Skinner and Staiger (2007), Gri¢th, Lee and Van Reenen (2011), Holmes (2011) and (for a survey) Foster andRosenzweig (2010). Becker and Woessmann (2009) use distance from Wittenberg as in instrument for the spread ofProtestantism in Germany which they show fosters human capital. Note that in our regressions we control for humancapital, so this cannot be driving the results.
4
tend to empower workers relative to plant managers. Information technologies also widen the span
of control. By contrast, technologies that reduce communication costs (like intranets) lead to more
centralization and have ambiguous e§ects on the span of control (in the theory and the data).
Much previous empirical work on this topic has tended to aggregate ICTs together as one ho-
mogenous technology due to data constraints, often simply measured by computers per person or
“ICT capital”. As noted above, this is problematic since hardware will simultaneously reduce in-
formation and communication costs, and we show that these should have very di§erent e§ects on
firm organization. One strand of the literature also looks for complementarities between ICT and
organizational aspects of the firm, but takes organization as exogenous.4 A second branch tries to
endogenize organization, but does not discriminate between types of ICT.5 A third branch, which
we are perhaps closest to, looks more closely at the e§ects of ICT on organization but does so in the
context of a single industry in a single country.6 What is unique about our study is the disaggregation
of types of ICT and organization across a number of industries and countries.
An alternative to our cognitive perspective is that hierarchies may be a solution to incentive prob-
lems (e.g. Calvo and Weillisz, 1978; Aghion and Tirole, 1997; Dessein, 2002), linked to automation
(Autor et al., 2003) or the result of coordination issues (Cremer et al., 2007 and Alonso et al., 2008).
Although we do not reject the potential importance of other mechanisms, we think our information
perspective is first order and provide some empirical support for this in a range of robustness tests.7
We proceed as follows. In Section 2 we discuss a basic theoretical framework that allows us to
study the impact of information and communication technologies. We then discuss our data (Section
3), and map the model to the data by focusing on some key factors that a§ected information and
communication costs. Finally, we discuss possible alternative mechanisms driving the relationship
between the technological variables and the organizational outcomes that we consider (Section 4)
and present our results (Section 5). The final section o§ers some concluding comments.
2 Theory
2.1 Communication technology Centralizes; Information Technology De-centralizes
Garicano (2000) proposes a theory of a hierarchy as a cognitive device. In the model the role of
hierarchy is to facilitate the acquisition of knowledge by increasing its utilization rate. Here we
present a simplified version of that theory, which allows us to extend it towards a setting with
4Examples include Black and Lynch (2001), Bresnahan, Brynjolsson and Hitt (2002), Bartel, Ichinowski and Shaw(2007) and Bloom, Sadun and Van Reenen (2012a). See also the survey in Draca, Sadun and Van Reenen (2007).
5For example see Acemoglu et al (2007), Caroli and Van Reenen (2001), Colombo and Delmastro (2004), Creponet al (2004) and Aubert et al (2004). To explain the evidence for trend delayering described in Rajan and Wulf (2006),Guadalupe and Wulf (2008) emphasise competition rather than ICT.
6See, for example, Baker and Hubbard (2003, 2004), Garicano and Heaton (2010), or the case studies in Blanchard(2004).
7Our work also relates to the wider theoretical literature on firm delegation. For example, see Baron and Besanko(1992), Melumad et al (1995), Mookherjee (2006), Baker et al (1999), Radner (1993) and Hart and Moore (2005).
5

di§erent types of decisions (production and non-production).
Assumption 1. Production requires time and knowledge. Each production worker draws a unit
measure of problems (or tasks or decisions) in [0, 1] per unit of time. Production only takes place if
all the problems are dealt with by someone in the organization. We normalize to 1 the output per
agent and per unit of time once problems are solved. Some problems occur more often than others:
problems are distributed according to a density function f(z). Agents can only deal with a problem
or task if they have the relevant knowledge.
Assumption 2. Knowledge acquisition is costly. The cost incurred by an agent i to acquire the
knowledge necessary to deal with problems in [0, z] is proportional to the length of the interval
of problems, aiz. The information acquisition cost parameter ai, which is individual specific, may
depend on the technology available to di§erent agents and their skill. Thus an agent who acquires
the information required to perform all the tasks in [0, 1] incurs a cost ai and produces net output
1 ai.8
Assumption 3. Knowledge can be communicated. Managers can be used to provide directions and
thus economize on the knowledge that must be acquired by production workers. Specifically, the cost
of training agents can be reduced through a hierarchy in which production agents’ only deal with a
fraction of problems - that is, those in (0, zp)- and ask for help on the rest to an agentm (for manager)
who is specialized in problem solving. A communication or helping cost h is incurred whenever help
is sought, that is h is incurred per question posed. Clearly, communication is minimized if workers
learn the most common problems and ask help on the rest; thus without loss of generality, we reorder
problems so that f 0(z) < 0, i.e. more common problems have a lower index and are performed by
workers. In other words, ‘management by exception’ is optimal, so that workers do routine tasks and
managers deal with the exceptions.9 Figure 1 illustrates this task allocation.
The value of problem solvers or managers is that by reducing lower level workers’ decision range,
the cost of acquiring information is reduced. The cost of hierarchy is the time wasted in communi-
cation, since problem solvers do not produce output, but instead use their time to help others solve
their problems.
Suppose a team must deal with N problems per unit of time. The team needs then N production
workers in layer 0 and nm managers or problem solvers. The profits generated by this hierarchy with
N production workers, each receiving a wage wp, and nm managers specialized in ‘problem solving’
8The cost of information acquisition was denoted “c” in earlier versions to be consistent with Garicano (2000). Thechange in notation here was made to avoid confusion with communication, or helping, cost “h”.We assume the costof learning is linear so that learning z problems costs az. This is without loss, as we can redefine problems of tasks sothat f(z) is the frequency of a renormalized (equal cost) problem.
9See Garicano (2000) for a formal proof. In that paper, there are potentially many layers of problem solvers, andorganizations can decide which problems to do and which ones not to deal with at all- while here all problems must besolved. It is shown that the organization set up in the model (characterized by ‘management by exception’) is optimal.Intuitively, if those lower in the hierarchy learnt exceptions (rather than routine tasks), the tasks could be swapped,reducing communication costs. Here, in our basic model, there are only two layers and all problems are (eventually)solved; the only choice is who learns the solution. The model with two types of problems in Section 3.2. extends theframework in Garicano (2000).
6
or ‘helping’, receiving a wage wm, is:10
= N N(apzp + wp) nm(amzm + wm) (1)
that is, when the N production workers deal with problems in [0, zp] they must learn the zp most
common problems. We further assume (although it is unnecessary for the results) that the learning
technology is such that managers know all the tasks that workers also know, and more, so that
knowledge overlaps.11 Thus, since all tasks must be dealt with zm = 1. A production agent can deal
with a fraction F (zp) of the tasks and asks for help with probability (1 F (zp)). Thus, a managerspends time h(1 F (zp)) helping each production worker. Since there are N agents, the needed
number of managers or problem solvers is Nh(1 F (zp)) = nm, resulting in a span, or ratio of
workers per manager of s = N/nm. Thus this time constraint determines a trade-o§ between what
the agents below can do and how many managers are needed. The more knowledge is acquired by
lower level agents, the less managers are needed. Figure 2 provides an overview of the model.
The problem of the hierarchy is to decide the size or span of the hierarchy (s) and the degree of
worker autonomy (zp) so as to maximize profits per problem. Substituting for nm in equation (1) we
obtain:
= maxzp[N (1 (apzp + wp) h(1 F (zp)) (am + wm))]
The following comparative statics follow immediately.
Proposition 1 Cheaper Communication Centralizes; Cheaper Information Access De-centralizes
1. A drop in communication (or ‘helping’) costs (h) reduces worker autonomy (zp) and has an
ambiguous impact on span of control s = N/nm (more questions are asked, but each one takes
less time).
2. A reduction in the cost of acquiring information of all agents (a = am = ap), or one a§ecting
only lower level agents, ap, increases lower level autonomy (zp) and increases managerial span
of control, s (as less questions are asked).
The formal proof of the above is straightforward. Note first that f 0(z) < 0 implies that the second
order conditions for optimization is met, @2/@z2p < 0. Then the first result follows from the fact
that @2@zp@h
> 0 . Second, letting ap = am = a, we have that at the optimum (using the first order
conditions): @2@zp@a
< 0. Similarly @2@zp@ap
< 0, i.e. if workers can learn cheaper they do more.. The
changes in span follow straightforwardly from s = N/nm = 1/ (h(1 F (zp))) .10We are solving throughout for the partial equilibrium e§ects (taking wages as given) as is common in the literature
(see e.g. Milgrom and Roberts, 1990). For a general equilibrium analysis with heterogeneous workers (i.e. where wagesare adjusting) see Garicano and Rossi-Hansberg (2006).11This overlapping knowledge assumption is used because it seems more reasonable in the empirical context, but it
is irrelevant for the comparative statics in the propositions here, as can be seen by replacing h(1 F (zp))(am +wm)by h(1 F (zp))(am(1 zp) + wm). Overlapping knoweldge could result from learning that takes place on the job orbecause the process of learning involves learning the ‘easy’ tasks first.
7

The intuition for these results is as follows. (1) Cheaper communication cost lowers the value
of additional worker knowledge, since that economizes on communication. (2) Cheaper information
acquisition costs for all agents lowers the value of asking questions for workers, since the role of
asking questions is to economize on expensive information acquisition. In sum, Essentially, while
communication cost reductions facilitate the reliance of specialist problem solvers and decrease what
each worker can do (centralize knowledge/information), reductions in the cost of acquiring informa-
tion make learning cheaper and reduce the need to rely on specialized problem solvers for help with
solutions (decentralize knowledge/information).
2.2 Extension: Production and Non Production Decisions
Middle managers perform two broadly di§erent functions. First, they are at the top of the production
hierarchies, dealing with the problems that production workers could not handle, as outlined in
the model above. Second, they also are at the bottom of a non-production hierarchy, potentially
dealing with managerial decisions on things like hiring/firing, investment, product introduction and
marketing delegated to them by central head quarters. To study the implications of the multiple
roles played by middle managers, we extend the model in the simplest possible way considering a
multilayer hierarchy involving corporate managers, middle managers (in our data, plant managers)
and production workers.
In this extension, corporate head quarters and middle-managers deal with non-production (man-
agement) decisions, x, while middle-managers and production workers deal with production decisions,
z.
Production Decisions: As above, each production worker confronts one production decision per
unit of time, z 2 [0, 1]. He can deal with a measure zp of these production decisions. That is, for thosez > zp, he asks a middle manager for help. Decisions are distributed according to cdf F (zp), with pdf
f(zp). As previously, optimality (management by exception) implies f 0(zp) < 0, so that production
workers specialize in the more common tasks. A cost h is incurred each time the middle manager
must be involved in production. Production workers can acquire knowledge at cost ap and middle
managers at cost am. A firm that must deal with N production problems requires, as previously,
h(1 F (zp))N = nm middle managers.
Non-Production Decisions: Each middle manager must make a measure 1 of non-production
decisions per unit of time, where non-production decisions x 2 [0, 1], are drawn from a density
function g(x), again with g0(x) < 0 implied by optimality. If the middle manager has the knowledge
to deal with these decisions, he does so instantaneously. If he does not, he passes on the problem
to corporate head quarters. Similarly to production workers, middle managers acquire knowledge so
that they can take a fraction xm of those decisions (they can solve those problems). Thus, if the
problem drawn is x < xm, a middle manager solves it; if not, the corporate manager intervenes.
A helping cost h is incurred as before when top managers have to intervene, that is helping each
8
middle manager costs (1G(xm))h units of corporate manager’s time.12 For an agent i to learn totake (all) of the non-production problems costs ai, a cost dependent on the technology available to
manager i; thus training middle managers to deal with non production problems costs amxm, while,
analogously to the production decision case, corporate managers can deal with all (a unit measure)
of non-production problems at a cost ac (c for corporate), with ac ? am. A hierarchy with nmnon-production problems where middle managers have knowledge xm requires (1G(xm))hnm = nccorporate managers.
Thus, the profits of a hierarchy with production workers, middle managers and corporate man-
agers is given by:
= maxzp,xm,nm,nc
N (apzp + wp)N (am + amxm + wm)nm (ac + wc)nc (2)
The first term are the N units of output produced by N production workers. The second term
is the cost of employing production workers - their wage (wp) and the costs of providing them with
enough information to deal with decisions z < zp(apzp). The third term is the cost of nm middle
managers - their wage (wm), and training them to deal with production problems (am) and with a
fraction xm of non-production problems. The cost of dealing with production and non-production
problems is assumed to be the same, since a given technology is available to each manager to deal
with these problems.13 The last term is the cost of nc corporate managers - their wage (wc) and
training them to deal with a measure of 1 non-production problems (ac). The organization must
choose the set of decisions dealt with by workers and middle managers, zp and xm (as illustrated
graphically in Figure 3), as well as the number of middle managers and corporate managers, subject
to the time constraints of middle managers and corporate managers.
Replacing the number of middle managers nm and of corporate managers nc required to manageN
production workers, the profits per production worker can be written (dividing equation (2) through
by N, and noting that the profit function is constant returns to scale in N):
N= max
zp,xm1 (apzp+wp) (am+amxm+wm)h(1F (zp)) (ac+wc)h2(1F (zp))(1G(xm)) (3)
Which allows us to generalize in a straightforward manner the results above.
Proposition 2 1. A reduction in communications costs (h) leads to a reduction in production
decision making by production workers (zp) and in non-production decision making of middle
managers (xm), and has an ambiguous impact on spans of control.
2 A reduction in the cost of acquiring information of lower level agents (ap) leads to an increase in
production workers autonomy (zp) and in the span of control of middle managers (sm = N/nm).
12We assume communication or helping cost h is the same for production and non-production decisions for simplicitysince in our empirical application we cannot distinguish di§erent communication costs. Conceivably, some technologiesmay a§ect communication costs di§erently for production and non-production, and that would have to be taken intoaccount in the formulation.13This assumption can be weakened by assuming them di§erent, with the only cost being the extra notation.
9
3 A reduction in the cost of acquiring information either by middle managers (am) or by them
and corporate managers (ac and am) increases autonomy of middle managers in non-production
decisions (xm), and the span of corporate managers (sc = nm/nc); it reduces the autonomy of
production workers (zp), and the span of control of middle managers (sm).
We show these results formally in Appendix A.
In summary, the framework generates eight comparative static results for the direct impact of
the information cost and technology cost variables (ap, am, h) on the four organizational outcomes
(xm, zp, sm, sc) shown in propositions 1 and 2. These predictions are summarized in Table 1. We
report tests of six of these predictions for worker autonomy, plant manager autonomy and plant
manager (xm, zp, sm) in the main paper, as we have good measures of these organizational variables.
We report results for the remaining two predictions for CEO span (sc) in the Appendix because
unlike plan manager span we do not measure CEO span directly. From the theory there are also a
further four “cross” predictions of the indirect e§ects of technology on organizational measures - such
as the impact of production information costs on plant manager autonomy. We also report tests of
these more subtle e§ects in the Appendix.
3 Data
We use a new international micro dataset combining novel sources from the US and several European
countries to test the empirical relevance of the model presented in Section 2. Our two main sources
of data are the Center for Economic Performance (CEP) management and organization survey and
the Harte-Hanks ICT panel. We also match in information from various external data sources such
as firm-level accounting data, industry and macro-economic data. The full dataset plus all Stata do
files are available on www.stanford.edu/~nbloom/bsgv.zip
3.1 The CEP Management and Organization Survey
3.1.1 Overview
In the summer of 2006 a team of 51 interviewers ran a management and organizational practices sur-
vey from the CEP (at the London School of Economics) covering over 4,000 firms across Europe, the
US and Asia. In this paper we use data on approximately 1,000 firms from the US, France, Germany,
Italy, Poland, Portugal, Sweden and the UK for which we were able to match the organization data
with ICT data from an independent database (which only has data on a sub-sample of our countries).
Appendix C provides detailed information on our sources, but we summarize relevant details here.
The CEP survey uses the “double-blind” technique developed in Bloom and Van Reenen (2007)
to try and obtain unbiased accurate responses to the survey questions. One part of this double-blind
methodology is that managers were not told they were being scored in any way during the telephone
survey. The other part of the double blind methodology is that the interviewers knew nothing about
10
the performance of the firm as they were not given any information except the name of the company
and a telephone number. Since these firms are medium sized, large household names are not included.
The survey is targeted at plant managers in firms randomly drawn from the population of all
publicly listed and private firms in the manufacturing sector with between 100 and 5,000 employees.
We had a response rate of 45% which was uncorrelated with firm profitability or productivity overall
and in the sample we focus on in this paper. The interviews took an average of 45 minutes with
the interviewers running an average of 78 interviews each, over a median of 3 countries, allowing us
to remove interviewer fixed e§ects. We also collected detailed information on the interview process,
including the interview duration, date, time of day, day of the week, and analyst-assessed reliability
score, plus information on the interviewees’ tenure in the company, tenure in the post, seniority
and gender. We generally include these variables plus interviewer fixed-e§ects as ‘noise-controls’ to
mitigate measurement error.
3.1.2 Measuring Plant Manager Autonomy
As part of this survey we asked four questions on plant manager autonomy. First, we asked how much
capital investment a plant manager could undertake without prior authorization from the corporate
head quarters. This is a continuous variable enumerated in national currency (which we convert into
US dollars using Purchasing Power Parities). We also asked where decisions were e§ectively made in
three other dimensions: (a) hiring a new full-time permanent shopfloor employee, (b) the introduction
of a new product and (c) sales and marketing decisions. These more qualitative variables were scaled
from a score of one, defined as all decisions taken at the corporate head quarters, to a five, defined as
complete power (“real authority”) of the plant manager, and intermediate scores varying degrees of
joint decision making. In Table A2 we detail the individual questions (D1 to D4) and scoring grids
in the same order as they appeared in the survey.
Since the scaling may vary across all these questions, we converted the scores from the four
decentralization questions to z-scores by normalizing each score to have a mean of zero and standard
deviation one. In our main econometric specifications, we take the unweighted average across all
four z-scores as our primary measure of overall decentralization.14 These results are robust to other
weighting schemes and when the questions are disaggregated into their component parts.
3.1.3 Measuring Worker Autonomy
During the survey we also asked two questions about worker autonomy over production decisions
regarding the pace of work and the allocation of production tasks. These questions were taken
directly from Bresnahan et al, (2002) and are reported in Table A2 (questions D6 and D7). These
questions are scaled on a one to five basis, with a one denoting managers have full control, and a
five denoting workers have full control over the pace of work and allocation of tasks. Our measure
of workers’ autonomy is a dummy taking value one whenever decisions on both pace of work and
14The resulting decentralization variable is itself normalized to mean zero and standard deviation one.
11
allocation of production tasks are mostly taken by workers (i.e. both variables take values higher
than three15). Again, we experiment with other functional forms.
3.1.4 Measuring Span of Control
We also asked about the plant manager’s span of control in terms of the number of people he directly
manages, as reported in Table A2 (question D8). The interviewers were explicitly trained to probe
the number of people that directly report to him rather than the total number in the hierarchy below
him. Unfortunately, we do not have such a direct measure of CHQ span (since we did not interview
the CEO). But we try to get a sense of senior management’s (CHQ) span of control by asking about
whether the firm was single or multi-plant firm, with the idea being that multi-plant firms lead to
larger spans at senior management level.
3.1.5 Other Data
In addition to the organizational variables, the CEP survey also provides a wide variety of other
variables such as human capital, demographics and management practices. Also, since the CEP sur-
vey used accounting databases as our sampling frames from BVD (Amadeus in Europe and ICARUS
in the US), we have the usual accounting information for most firms, such as employment, sales,
industry, location, etc. Table 2 contains some descriptive statistics of the data we use. In the largest
sample we have 950 plants with mean employment of 250 employees (153 at the median).
3.2 ICT Data
We use an plant level ICT panel produced by the information company Harte-Hanks (HH). HH is
a multinational firm that collects detailed hardware and software information to sell to large ICT
firms, like IBM and Cisco, to use for marketing. This exerts a strong market discipline on the data
quality, as major discrepancies in the data are likely to be rapidly picked up by HH customers’. For
this reason, HH conducts extensive internal random quality checks on its own data, enabling them
to ensure high levels of accuracy.
The HH data has been collected annually for over 160,000 plants across Europe since the late-
1990s. They target plants in firms with 100 or more employees, obtaining a 37% response rate. We
use the data for the plants we were able to match to the firms in the management survey. Since this
matching procedure sometimes leads to multiple plants sampled in HH per firm, we aggregate ICT
plant level data pooled across 2000 to 2006 (i.e. prior to the to the CEP organization survey) to the
firm level, using plant employment weights. A number of papers, such as Bresnahan et al, (2002),
Brynjolfsson and Hitt (2003), Beaudry et al (2010) and Forman et al (2011), have previously used
the US HH hardware data, but few papers have used the software data. And certainly no one has
15Decisions on pace of work are taken mostly by workers 11% of the times. Similarly, decisions on the allocation ofproduction tasks, are taken moslty by workers 12% of the times.
12
combined the software data with information on organizational form in a single country, let alone
internationally as we do here.
The prior literature has typically used information on firms aggregate ICT capital stock covering
PCs, servers and infrastructure. But since these simultaneously reduce information and communica-
tion costs we do not expect a clear result. Our approach consists instead in considering the presence
of three specific technologies that a§ect di§erentially the cost of information access and the cost of
communication within the organization. Concerning communication (or ‘helping’) costs, we focus on
the introduction of intranets (INTRANET). Concerning information access costs, we focus on the
widespread adoption of CAD/CAM technologies, and the introduction of large, real time, connected
databases, in the form most notably of ‘enterprise resource planning’ (ERP) systems.
The reason we focus on these three technologies is that they are major advances in the man-
ufacturing sector that we study, as well as other sectors like retail, wholesale and banking.16 We
also believe they map clearly into reductions in communication costs (INTRANET) and reductions
in information acquisition costs in production (CAD/CAM) and management (ERP), as we discuss
in detail in the Appendix B. In sum, our hypothesis concerning these variables, given the model
presented in Section 2 are as follows:
• Falling information acquisition costs for non-production decisions (proxied by ERP) are pre-dicted to raise autonomy for plant managers
• Falls in information acquisition costs for production decisions (proxied by CAD/CAM) arepredicted to increase both worker autonomy and plant manager’s span (they can manage more
workers if these workers are making more of their own decisions)
• Finally, falling communication costs (proxied by INTRANET) have negative e§ects on auton-omy and ambiguous e§ects on spans (each worker does more but will ask more question).
This is depicted in relation to the model in Figure 4, while Table 1 maps the e§ects of each
technology on the three organizational outcomes included in our data; plant manager autonomy in
column (1); workers’ autonomy in column (2); and plant manager’s span in column (3).
In practice, the presence of any of these technologies at the plant level is codified using binary
variables, and plant level employment weights are used to generate firm level indicators.17 The
technologies are measured as follows:
• HH distinguishes up to 17 distinct types of ERPs: the market leader is SAP, but Oracle, IBMand many others all o§er products in this space. HH tries to record only ERP systems in
operation (rather then those pending the go-live decision) which Aral, Brynjolfsson and Wu
(2009) highlight as important.
16This is based on reviewing the literature, US, UK, China and India factory visits and discussions with engineersand consultants at Sun Microsystems, EDS, HP, McKinsey and Accenture.17The resulting variables have mass points at zero or one.We present robustness tests using just the discrete versions
of these technology indicators.
13

• HH defines under “workstation applications” the presence of CAD/CAM’s, software tools thatassist production workers, engineers and machinists.
• HH measures the presence of Leased Lines or Frame Relays (INTRANET), which are technolo-gies used by businesses to connect o¢ces or production sites.18 We have, in some years, direct
information on Local Area Networks (LAN) and Wide Area Networks (WAN) and find these
to be both highly correlated with our INTRANET variable. In the robustness tests we show
the similarity of results when using this as an alternative proxy for intranets.
In terms of other technologies we condition on computers per worker, but note its theoretical
ambiguity.
4 Alternative Theoretical Channels
Before moving to the empirical results, we present a brief discussion of alternative channels through
which ICT could a§ect the allocation of decisions and span and how we might distinguish them from
the information approach we emphasize in this paper.
4.1 Coordination
There is a large literature focusing on the importance of coordination in organizations, including
Hart and Moore (2005), Dessein and Santos (2006), Cremer et al (2007), and Alonso et al (2008).
A channel through which ICT could a§ect centralization is through their impact on coordination
costs. This could be true of both ERP and INTRANET, but probably less so of CAD/CAM. In this
section we investigate the role of the coordination mechanism as distinct from the information and
communication costs that are the focus of our theory.
A first, important aspect of a system such as ERP is that it increases the cost of misrepresenting
information. Soft information about local issues becomes ‘hard’ and can be more easily shared
across local managers. This means that horizontal communication becomes more credible but so
does vertical communication. In a framework such as Alonso et al (2008), local managers find
horizontal communication more credible, reducing the need for the central headquarters manager to
intervene. Thus the decentralized organization will become relatively more e¢cient, similarly to our
prediction.
Second, ERP may also a§ect coordination without a§ecting incentives: by unifying multiple pre-
viously unrelated databases, ERP facilitates coordination between independently operated business
18A leased line is a symmetric telecommunications line connecting two locations. It is sometimes known as a ‘PrivateCircuit’ or ‘Data Line’. Unlike traditional PSTN lines, a leased line does not have a telephone number, because eachside of the line is permanently connected to the other. Leased lines can be used for telephone, data or Internet services.Frame relay is a data transmission technique used to send digital information (data and voice) cheaply quickly, and isoften used in local and wide area networks. These systems are predominantly used to manage internal communicationsystems. They are not specifically about production or non-production decisions, but a§ects communication throughout the firm.
14
units. In fact, by creating a common language, ERP may facilitate the substitution of ‘hierarchi-
cal/vertical’ communication by ‘horizontal’ or peer-to-peer communication as Cremer, Garicano and
Prat (2007) have noted. As a result, if coordination across units becomes easier and less hierarchical,
we could also expect (similarly to the e§ect we predict in our theory) that ERP results in ‘empower-
ment’ and decentralization, as managers of business units coordinate with their colleagues without
going through central management.
On the other hand, and contrary to our theory, the presence of INTRANET would also reduce
coordination costs. The e§ect, as in the case of ERP, would be towards empowering local managers,
who can again more easily coordinate with one another without intervention of corporate headquar-
ters. In this case, the e§ect is however opposite to what we expect in our theory. On the other hand
if, as in our theory, INTRANET primarily a§ects communication costs, as we have hypothesized, it
will lead, as we have shown, to more centralization, that is to more participation by central head-
quarters in local problem solving. Thus, in this case our empirical analysis does allow us directly to
separate the two hypothesis, since they have opposite predictions for decentralization.
In other words, the coordination perspective does not result in a sharp distinction between tech-
nologies that reduce information costs (like ERP and CAD/CAM) and those that reduce communi-
cation costs (INTRANET). Both reduce coordination costs and thus result in the same impact on
decentralization (increased) and on spans (ambiguous). The data will allow us to di§erentiate the
coordination costs perspective from ours, since we expect changes in information and communica-
tion costs to have di§erent impacts on organizational outcomes. We shall also provide several direct
tests of the coordination hypothesis (reported in Table A3 and discussed in section 5.2.2). Our tests
rely on the observation that, as Hart and Moore (2005) have argued if technology is a§ecting cen-
tralization through its impact on coordination, its impact must be higher where coordination needs
are particularly relevant. We study three environments in which we have a priori reasons to expect
coordination to matter more: (i) when the firm is a multinational, (ii) when the firm operates in
multiple industries and (iii) where the headquarters and the plant are located separately. We do not
find our results are any di§erent across these three environments.
4.2 Agency and Incentives
It is di¢cult to have a general view of how technology a§ects agency without being precise about
the channels. Specifically, would we expect delegation to increase or decrease as a consequence of
ICT improvements? The key characteristic that will a§ect whether delegation should increase or
decrease is the extent to which technical changes facilitate monitoring inputs or monitoring outputs.
As Prendergast (2002) showed, a technology that results in better measures of output will increase
delegation, as incentives can be used to align decision making. On the other hand, a technology that
facilitates monitoring of inputs will reduce delegation. Specific technologies, and specific instances
of the technology, may have stronger impact on inputs or on outputs. For example, Baker and
Hubbard (2004) have argued that a specific piece of ICT, the on-board computers used in trucks,
15
decrease the cost of monitoring a trucker’s level of care in driving (an input). As a result, these
on-board computers induced an increase in vertical integration (less incentives and delegation). The
opposite prediction may be easily the consequence of other types of ICT, such as ERP, which provides
better information about agents’ production decisions and so can facilitate delegation with monetary
incentives.
Absent a specific technology like on board computers, we believe that there may be multiple
channels through which the technologies that we examine may a§ect incentive conflicts. Rather than
formulating a large range of hypothesis on incentives and decision making, we simply note that if
technology a§ects output monitoring, it should also a§ect delegation and incentive payments. Since
the CEP survey also includes information on the percentage of plant manager salary that is linked
to individual, team or firm performance, we can explicitly test whether this is driving our results by
controlling in our regressions for the impact of ICT on delegation holding incentive pay constant.
4.3 Automation
Autor, Levy and Murnane (2003) have argued that the key way ICT impacts the division of labor
is through “automation”. Essentially, their argument is that the routine tasks of both low human
capital workers (like assembly line workers) and higher human capital workers (like bank clerks) have
been replaced by computerization and do not have to be either learned or undertaken by workers or
managers. In a bank, for example, information technology allows for automatic sorting of checks.
We can extend our model to deal with this type of mechanism. Specifically, suppose that a
worker is in charge of tasks z0, the machine is in charge of tasks m and the manager of tasks
1 z0 m. The impact of automation is to increase the number of tasks m undertaken by the
machine. Straightforward comparative statics show that the number of tasks undertaken by a worker
is reduced, as the machine does the more routine tasks. Thus, a worker does z0m tasks compared
to z0 tasks before, while the manager continues to do 1z0 tasks, thereby reducing the share of taskscarried out by worker. The reason is that the marginal value of learning an additional task does not
get increased by the machine doing the most routine task, so z0 stays constant. The span of control
remains unchanged as the number of tasks done by the manager 1 z0 is unchanged.Our data allows testing of this channel since, if any of our ICT measures is having an impact
through automation, this will reduce the number of tasks done by lower level agents, reducing their
autonomy. By contrast, our perspective predicts increases in the number of tasks done by lower
level agents in response to falls in information acquisition costs. Another distinguishing feature of
our theory is that we obtain specific predictions on the impact of intranets, which the automation
perspective is largely silent on.
16
5 Empirical Results
5.1 Econometric Model
We wish to estimate the following equation:
Oijk = aijk + hijk + x0ijk + uijk (4)
where the dependent variable is Oijk which denotes the organizational form of firm i in industry j
in country k. Our theory o§ers predictions over four types of organizational outcomes for which we
have data: the autonomy of the worker (O = AW), the autonomy of the plant manager (O = AP),
the span of control of the plant manager (O = SP) and the span of control of the CHQ (O = SC).
As in the theory, a denotes information access costs and h denotes communication (helping) costs.
The xijk denote other control variables and uijk is a stochastic error term - we will discuss these in
more detail later.
As discussed in the data section, we have direct measures of workers’ autonomy, managers’ auton-
omy and managers’ span of control from our survey. The management autonomy questions investigate
the extent of “non-production” autonomy the plant manager has from the corporate head quarters
(e.g. how much investment could be made without corporate head quarters’ approval). The worker
autonomy questions relate to decisions the worker could have control over compared to the plant
manager (e.g. setting the pace of work).
The information costs and communication costs facing the firm are not directly observable, but
we substitute in the relevant indicator from HH (INTRANET lowers h; ERP and CAD/CAM lower
a). To be more explicit the three regressions we will estimate are:
Autonomy of the plant managers (AP)
APijk = APERPijk +
AP INTRANETijk + x0ijk
AP + uAPijk (5)
Autonomy of the worker (AW)
AWijk = AW (CAD/CAM)ijk +
AWijk INTRANETijk + x
0ijk
AW + uAWijk (6)
Span of control of the plant manager (SP)
ln(SPijk) = SP (CAD/CAM)ijk +
SPijkINTRANETijk + x
0ijk
SP + uSPijk (7)
Recall that Table 1 contains the main theoretical predictions of the model that we have sketched
together with the technologies we are using. Falls in information acquisition costs are associated with
greater plant manager autonomy and workers’ autonomy, and larger spans of control. By contrast,
falls in communication costs are associated with decreases in autonomy and ambiguous e§ects on
spans.
In the empirical implementation of these equations we are not assuming that each of the three
observable technologies a§ects only information costs or only communication costs. Rather, we are
17
merely assuming that each technology has a relatively larger e§ect on a or on h. For example,
following the discussion in the previous section we claim that ERP has a stronger e§ect on reducing
information access costs than reducing communication costs. Hence, consider a simplified managerial
autonomy equation AP = a+h with the parameterization a = -1ERP(11)NETWORK and
h = -(1 2)ERP 2NETWORK with weights 1 > 1, 2 > 12. Substituting these into equation
(4) implies that in equation (5) AP = 1 + 2 1 > 0 and AP = 1 1 2 < 0. These are the
qualitative predictions we test.
We have a rich set of controls to draw on (xijk), although we are careful about conditioning
on factors that are also directly influenced by technology. Consequently we consider specifications
with very basic controls as well as those with a more extensive vector of covariates. Since there is
measurement error in the organizational variables we generally condition on “noise controls” that
include interviewer fixed e§ects and interviewee controls (e.g. tenure of manager) and interview
controls (e.g. time of day). Other controls include a full set of three digit industry and country
dummies, plant age, skills (share of college educated workers), firm and plant size and multinational
status. We also perform robustness checks with many other variables suggested in the literature
which may potentially confound our key results.
5.2 Basic Results
Tables 3 through 5 present the main results. Each table has a di§erent dependent variable and
corresponds to equations (5) to (7).
5.2.1 Plant Manager Autonomy
Table 3 contains the empirical results for plant managers’ autonomy. All columns control for size
(through employment of the firm and the plant), multinational status (foreign multinational or
domestic multinational with the base as a purely domestic firm), whether the CEO is located on
the same site as the plant manager,19 “noise” controls as discussed in the data section and a full set
of country and three digit industry dummies. Column (1) uses the presence of Enterprise Resource
Planning (ERP) as a measure of information acquisition over non-production decisions. As the theory
predicts, ERP is associated with more autonomy of plant managers (relative to the corporate head
quarters) as the plant manager is allowed greater flexibility in making decisions over investment,
hiring, marketing and product introduction.20 In our model this is because ERP enables him to
access information more easily and solve more problems without referring them upwards. In terms
of the other covariates we find that larger and more complex enterprises (as indicated by size and
19All results are robust to dropping size, multinational and CEO on site controls (results available onwww.stanford.edu/~nbloom/bsgv.zip). Note that firms where the CEO was the same individual as the plant managerare dropped.20We investigate the endogeneity of the technology variables in depth in Table 6. One inital check on whether the
OLS results are upwards biased is to implement a propensity score matching technique. We found that matchingstrengthened the results. For example in the specification of column (2) of Table 3, the Average Treatment e§ect onthe Treated was 0.194 with a standard error of 0.102. This used nearest neighbors matching with three neighbors.
18
multinational status) are more likely to decentralize decision-making to the plant manager. Column
(2) includes firm level skills, as measured by the proportion of employees with college degrees. The
variable takes a positive and significant coe¢cient, indicating that more skilled workplaces tend to
be more decentralized (consistent with Caroli and Van Reenen, 2001). This column also includes
the computer intensity of plant which enters with a negative and insignificant sign. The ambiguity
of the IT hardware variable should not be surprising as greater computer intensity simultaneously
lowers information costs and communication costs which, according to our theoretical model, have
opposite e§ects on autonomy. Despite the extra controls, the coe¢cient on ERP remains significantly
positive.
The third column of Table 3 reports the same specification as column (1), but instead of ERP
we use an indicator for the presence of intranets, which indicates lower communication costs. As
the theory predicts, there is a negative coe¢cient on the intranet variable which our theory suggests
reflects the fact that lower communication costs imply that corporate head quarters make more
decisions than the plant manager as it is now easier to pass on solutions. This result is robust to
including skills and computer intensity in column (4). Columns (5) and (6) includes both information
and communications technologies at the same time. Since these are positively correlated, the results
are stronger with both variables significant and correctly signed.21 Table 3 is consistent with the
theoretical model sketched earlier: falling information costs are associated with decentralization,
whereas falling communication costs are associated with centralization.
5.2.2 Coordination Costs
As discussed in sub-section 4.1, an alternative reason why ICT may a§ect firm organization is by
reducing coordination costs. To the extent that both ERP and INTRANET reduce coordination
costs we would expect them to increase the degree of plant manager autonomy. That means that
although coordination is an alternative explanation for the positive ERP coe¢cient in Table 3, it will
make it harder for us to find a negative coe¢cient on INTRANET. This is contrary to our results
which show that ERP tends to result in decentralization (a positive coe¢cient in Table 3), while
INTRANETs tend to centralize (a negative coe¢cient).
Nevertheless, to examine coordination in more depth we consider several indicators of environ-
ments where we would expect a priori that coordination costs are more important: (i) when firms
operate in multiple countries, (ii) when firms operate across multiple industries, and (iii) when the
headquarters (HQ) and plant are not co-located. We examine this in Table A3 and do not find much
evidence in favor of the idea that coordination costs drive our results. Column (1) reproduces the
baseline results and columns (2)-(4) examine the multinational indicator. Column (2) looks at the
sub-sample of domestic firms and column (3) at multinational firms. The results for domestic firms
look like those in the overall sample in column (1). The results in column (3) are actually weaker
for ERP which goes against a coordination story, while they are similar for INTRANET. In col-
21The results are robust to clustering at a higher level, such as by industry country cell. For example, in the finalcolumn the coe¢cients (standard errors) are 0.192(0.085) and -0.188(0.096)
19
umn (4) we pool the sample and introduce an interaction of the multinational status with ERP and
INTRANET and find both are insignificant. Hence, overall there is no evidence that coordination is
explaining the impacts of our ICT variables on plant manager autonomy. This does not, of course,
rule out the importance of coordination issues for firms which are generally likely to be important. It
simply means that co-ordination is unlikely to be responsible for generating the covariance patterns
between plant manager autonomy and the ICT we examine here.
In columns (5) to (7) of Table A3 we repeat the same exercise for firms who operate in multiple
industries compared to a single industry. Again, the results looks similar across the two sub-samples
and neither ERP or INTRANET have a significant interaction with the industry terms. Finally,
columns (8) to (10) use an indicator of whether the plant we interviewed is co-located with the
headquarters, and again find no evidence of di§erential .
Overall, then, it does not seem that the pattern of coe¢cients from ERP and INTRANET are
easily accounted for by the coordination costs mechanism. Again, this is not to say that coordination
is not important for delegation, it is rather the case that the theory does a less good job of explaining
the impact of ICT on decentralization than our cognitive hierarchy approach.
5.2.3 Workers’ Autonomy and Managerial Span of Control
Table 4 and 5 analyze the relationship between information and communication technologies with
workers’ autonomy and plant manager span of control (this follows exactly the order of Table 3).22
Table 4 is a probit model of workers’ autonomy where our indicator of information acquisition
over production decisions is CAD/CAM. In columns (1) and (2), the coe¢cient on CAD/CAM is
positive and significant, indicating that such technologies are associated with worker empowerment.
In columns (3) and (4), by contrast, the presence of intranets has a negative coe¢cient which is
consistent with the theoretical notion that greater communication leads to centralization. Although
the coe¢cient on INTRANET is correctly signed, it is insignificant even when both technologies are
included simultaneously (in the final two columns).
Table 5 examines the plant manager’s span of control as measured by the number of employees
who directly report to him. CAD/CAM is associated with significantly greater plant manager span,
consistent with the idea that production technologies that help worker information access enable
them to do more tasks which makes it possible for the plant manager to oversee more production
workers (greater span). The coe¢cient on INTRANET is negative and insignificant (the theory does
not have an unambiguous prediction for this coe¢cient).
Comparing the empirical results with our expectations in Table 1, we obtain a reasonably close
match. All the coe¢cients are in the same direction as the theoretical predictions (when they are
unambiguous) and all are significant at the 5% level in the most general specifications (with the
exception of INTRANET in the worker autonomy equation). The idea that information technologies
are associated with increased autonomy and span of control, whereas communications technologies
22The number of observations is smaller than Table 3 because of missing values on the worker autonomy question.
20

are associated with decreased autonomy appears to have some empirical content. By contrast, the
automation story would predict information technologies should be associated with centralization
away from lower level employees and the coordination theories would predict that communication
technologies should be associated with decentralization (see sub-section 3.3.). Thus, we interpret our
evidence on ICT and firm organization as providing some support for the cognitive view of hierarchies
in section 2.
5.3 Magnitudes
The estimates are statistically significant and broadly consistent with our theory, but are they of
economic significance? One way of examining this question is to simulate an increase in the di§usion
of our ICT indicators. Given the debate over whether the increasing productivity gap between Europe
and the US in the decade since 1995 was related to ICT (e.g. Bloom, Sadun and Van Reenen, 2012a),
we simulate increasing the ICT di§usion measures by 60% (the di§erence in the average level of the
ICT capital stock per hour worked between the EU and the US 2000-2004).23
An increase in the penetration of ERP of 60% over the sample average of 34% is about 20
percentage points. Using the final column of Table 3, this is associated with a 0.038 of a standard
deviation increase in plant manager autonomy. This is equivalent in e§ect to an increase in the
proportion of college graduates by 38% which is a third higher than the increase in education achieved
by the US between 1990 and 2000 of about 24%. So we regard this as a very substantial e§ect. Similar
calculations show that increasing the penetration of INTRANET by 60% (21 percentage points at the
mean) is associated with a decrease in plant manager’s autonomy by about 0.04 standard deviations,
equivalent to reducing the college share by 38%. This same increase in INTRANET is associated with
a decrease in worker autonomy of 0.08 standard deviations (equivalent to a 28% fall in the college
share). So the “e§ect” of falling communication costs (INTRANET) appears somewhat greater for
plant manager than for worker autonomy. Finally, consider a 60% increase in CAD/CAM. This is
associated with a 0.4% increase in plant manager’s span (equivalent to a 9.5% in the college share)
and a 1.6% increase in worker autonomy (equivalent to 5.5% increase in the college share). This is
lower because the mean of CAD/CAM is lower than the other technologies.
This implies that these technical changes appear very important for some aspects of organization
(benchmarked against equivalent increases in skills), especially ERP on plant manager’s autonomy
and INTRANET on all three organizational dimensions.
5.4 Extensions and Robustness
5.4.1 Endogeneity
Tables 3 through 5 present conditional correlations that seemed to be broadly consistent with the
theory. The theoretical model suggests that the endogenous outcomes should covary in systematic
23This is based on the EU KLEMS data. See Timmer, Yppa and Van Ark (2003) Table 5 for a similar figure for2001 and a description of the data.
21
ways in equilibrium which is what we examine in the data. We are of course concerned about endo-
geneity bias as there may be some unobservable that is correlated with the organizational outcomes
and our measures of information and communication costs (especially as these are all measured at
the firm level). We take some reassurance in the fact that although these ICT indicators are posi-
tively correlated in the data,24 their predicted e§ects on the same organizational variable can take
opposite signs. For example, in the plant manager autonomy equation the coe¢cient on informa-
tion acquisition technologies (proxied by ERP) is opposite in sign to communication technologies
(INTRANET) both theoretically and empirically. For endogeneity to generate these results, the hy-
pothetical unobservable positively correlated with decentralization would have to mimic this pattern
of having a negative covariance with INTRANET and a positive covariance with ERP. This is always
a theoretical possibility, but it is not obvious what would generate these covariance patterns.
In this sub-section we consider instrumental variable strategies for ERP and INTRANET.25 SAP
is the market leader in ERP and was founded by five IBM engineers who formed their start-up
in Walldorf, a suburb of the German city of Heidelberg in 1972 (e.g. Hagiu et al, 2007). SAP’s
Headquarters remains inWalldorf. Studies of di§usion suggest that geography plays an important role
because when there is uncertainty and tacit knowledge. Being geographically close to the innovator
plays a role in the adoption of the new technology (e.g. Baptista, 2000). Studies of the di§usion
of ERP (e.g. Armbruster et al, 2005) suggest that firms closer to SAP’s headquarters were more
likely to be early adopters all else equal. Since our firms are medium sized enterprises who could
also learn from these earlier adopters (ERP is more common among very large enterprises), we use
the closeness to Walldorf as an exogenous factor that shifts the probability of adopting an ERP.
We focus on Continental Europe as the US and UK are separated by sea from Germany, and drop
making “distance” hard to define, and drop subsidiaries of multinational firms as there is no obvious
distance measure for such global firms.
We regress the presence of ERP in the plant on the ln(distance in kilometers) to Walldorf in
Column (1) of Table 6. To be conservative we cluster the standard errors by region because we are
using a distance instrument and shocks may be spatially correlated. Consistent with our priors, a
firm twice as far as another from Walldorf is significantly less likely (around 24%) to adopt an ERP
system. When entered instead of ERP in the plant manager autonomy equation (the “reduced form”
of column (2)), the coe¢cient on distance is again negative and (weakly) significant. Column (3)
presents the instrumental variable results, showing that ERP has a large and positive causal e§ect
on decentralization. We also ran these regressions on the larger sample that includes multinationals
with similar results.26
In the sub-sample of Table 6 there are 45% of firms with ERP, of whom 30% use SAP and 70%
24For example, the pairwise correlation between the ERP and the INTRANET variables is 0.168, significant atthe 1% level.25We do not have an obvious instrumental variable for CAD/CAM , so we can only re-estimate Table 3 using this
alternative identification strategy.26As expected the first stage was weaker, with a coe¢cient (standard error) on distance of -0.087 (0.052). Never-
theless, the second stage remained significant with a coe¢cient (standard error) on ERP of 1.906 (1.101).
22
use a variety of other ERP o§ered by vendors like Oracle, Sage and Microsoft. Since our instrumental
variable should be most powerful for SAP we repeated the specifications of columns (1)-(3) replacing
ERP with a dummy for the presence of SAP’s ERP only. The first stage results are much stronger:
the coe¢cient (standard error) on distance was -0.094 (0.029) and the second stage coe¢cient on
ERP was 1.770 (1.032). In fact, the instrument has no power at all for predicting non-SAP ERP
systems. Given the distance to Walldorf only predicts the adoption of SAP ERP and not other makes
of ERP this suggests it reflects some SAP e§ect rather than some other unobservable favorable to
ERP adoption.27
As a further check on instrument validity we examined placebo regressions of whether the distance
to Walldorf instrument could predict any other observables such as INTRANET firm size. We found
no significant correlation with any of these variables.28 This suggests that the instrument is not
correlated with other factors that could be driving higher plant manager autonomy.
We consider an alternative approach to identifying the e§ects of intranets. The cost of electron-
ically communicating over intranets di§ers substantially between countries because of di§erential
degrees of the roll-out of high speed bandwidth and the pricing of telecommunications. Although
there have been moves to liberalize the telecommunication sector in most countries, this has hap-
pened at very di§erent speeds and in some countries the incumbent state run (or formerly state run)
monopolists retain considerable pricing power (e.g. Nicoletti and Scarpetta, 2003; Azmat et al, 2008;
OECD, 2005, 2007). We discuss these in more detail Appendix C.
We exploit these di§erential costs using OECD (2007) series on the prices of leased lines used
for intranets (call this price pck), which represent the cost of an annual subscription to a leased line
contract at 2006 PPP US$. An obvious empirical problem is that these measured telecommunication
price indices only vary across countries29 and not within countries, so they are collinear with the
country dummies. Industries will be di§erentially a§ected by these costs, however, depending on
the degree to which they are reliant on intranets for exogenous technological reasons. We proxy this
reliance by using the intensity of intranet use in the industry pooling the data across all countries
(INTRANETj).30 The instrument is defined as pck INTRANETj. Since we also include a fullset of industry and country dummies we are essentially using pck INTRANETj as a direct proxyfor communication costs, h, with the prediction that for the intranet-intensive industries we would
expect to see more managerial autonomy in countries where communication prices are high (like
27The magnitude of the e§ect is much larger than in the simple OLS specifications. This could be due to correctingattenuation bias from measurement error and/or reverse causality - for example, plants which are for some exogenousreason more decentralized may find it di¢cult to coordinate on introducing an ERP system which will require someconsolidation of databases.28We ran four separate placebo regressions where the dependent variables were INTRANET, PC intensity, skills or
firm size. The coe¢cient(standard error) on distance to Walldorf was 0.025(0.067), -0.159(0.177), 0.279(0.276) and-0.165(0.261) respectively. The specifications were the same as Table 6 column (2) except we dropped the endogenousleft hand side variable from the covariate set.29This is only partially true as there is some within country variation. For example, the roll-out of broadband
proceeds at a di§erent rate across areas (see Stephenson, 2006).30This identification strategy parallels Rajan and Zingales (1998) We also considered specifications where we used
intranet intensive industries defined on US data only and dropped the US from the sample we estimated on. Thisgenerated similar results.
23
Poland) than where they are low (like Sweden). The results for this experiment are presented in
columns (4)-(6) of Table 6 (we can use a larger sample than in the first three columns as we have
more countries). High telecommunications costs significantly reduce the probability of having an
intranet in column (4). When this is entered in the reduced form in column (5), the variable enters
with the expected positive sign: less intranets imply more decentralization. In column (6), the second
stage coe¢cient is large, negative and significant as predicted by the theory.31
The final column of Table 6 uses both instruments together. Both coe¢cients take their expected
sign and are similar in magnitude to columns (3) and (6). Unfortunately only the ERP coe¢cient is
significant at the 10% level. The problem is that although the distance to Walldorf is significant in
the first stage for ERP, the instrument for intranets has no power in this smaller sub-sample where
it is appropriate to use the distance to Walldorf IV.
Taking Table 6 as a whole suggests that the e§ects we identify are more likely to be causal impacts
of technology on organizational form, rather than simply reflecting an endogeneity problem, although
the results are stronger for ERP than for INTRANET.
5.4.2 “Cross” E§ects of Technologies
We now consider some of the further “cross” e§ects of technologies by saturating the empirical
models with all three types of technologies. Table A4 presents the full set of predictions from the
theory analogously to Table 1. We present the most general specifications for each of the three main
organizational variables in Table A5. The first thing to note is that none of the earlier conclusions
change with respect to the earlier tests: INTRANET are associated with less autonomy, ERP is
associated with more autonomy for managers and CAD/CAM is associated with more autonomy
for workers and a larger span of control. In terms of additional tests, the first column of Table
A5 includes CAD/CAM in the plant managers’ autonomy equation. This is insignificant, in line
with the theoretical predictions of a zero e§ect. The second and third columns includes ERP in the
workers’ autonomy and span of control regressions. In both cases ERP takes a positive coe¢cient.
This is contrary to the theory as ERP should be negative. We do not regard this as undermining
our general set-up, however, as the coe¢cients are in both cases insignificant. The robustness of the
earlier results to these “cross e§ects” is reassuring, but the insignificance of the extra terms does
imply that it is di¢cult to pick up some of the more subtle cross e§ects of ICTs on firm organization.
5.4.3 Corporate Head Quarters’ Span of Control
Table A4 showed that the theory also generates predictions for the span of control of the corporate
head quarters (CHQ). Although we had a direct measure of the plant managers’ span (number of
direct reports) we do not have such a direct measure for the CHQ span. One proxy measure for
this, however, is the number of plants in the firm, with more plants indicating a larger CHQ span.
Because this variable is likely measured with error we simply consider a dummy for a multiplant firm
31For example, we included regional ln(GDP per head) and ln(population) in columns 3 and 6 of Table 5. Thecoe¢cient (standard error) on ERP and INTRANET were 1.669 (.626) and -2.970 (1.652) respectively.
24

as a measure of the CHQ span and regress this on information acquisition technology for the Plant
Manager (ERP) and INTRANET in Table A6. The clear theoretical prediction is that ERP should
be associated with a wider CHQ span because plant managers are able to make decisions more easily
so CHQ finds it easier to manage a larger number of them. This is supported by Table A6, ERP has
a significant and positive association with CHQ span of control in column (1) where we condition on
the standard controls and column (3) where we also condition on INTRANET.32 The coe¢cient on
INTRANET is positive and significant in column (2) - it has a theoretically ambiguous sign.
5.4.4 An alternative mechanism: Incentives
In Section 4.2 we discussed alternative mechanisms, such as agency and incentives, through which
ICT could a§ect organizational structure. To investigate this, we explicitly condition on incentive
pay in the regressions. From the survey we know the proportion of managerial pay that was in bonus
(direct incentive pay) and the increase in pay upon promotion (a career concerns mechanism).
Columns (1) through (3) of Table A7 include a variable indicating the proportion of the plant
manager’s pay that was bonus (rather than flat salary).33 Columns (4) through (6) includes the
proportionate increase in pay when promoted for a typical plant manager. It is clear that the signs
and significance of the technology variables are hardly a§ected by this additional variable. For
example, in column (1) the incentive pay variable is positively but insignificantly associated with
greater autonomy of the plant manager. The coe¢cient on ERP is 0.193 and the coe¢cient on
INTRANET is -0.187, both basically unchanged from Table 3. The other incentive pay proxies are
insignificant and do not change the qualitative results. Obviously, this is a crude test as there are
other dimensions of incentive pay we have not captured (e.g. for production workers) and some
incentive e§ects may operate independently of any remuneration scheme. But the robustness of
our results to explicit controls for incentives suggest that there is a role for the cognitive theory we
emphasis when looking at the impact of ICT.
5.4.5 Further Results
We have examined a large variety of robustness tests and some of these are presented in Table 7.
Each panel presents a di§erent dependent variable with di§erent tests in each column (Panel A for
plant manager autonomy, Panel B for worker autonomy and Panel C for plant manager span of
control ). Column (1) simply repeats the baseline specifications from the final column in Tables 3
through 5.
In Bloom, Sadun and Van Reenen (2012b) we found that product market competition and cul-
tural factors such as trust and non-hierarchical religions were associated with greater plant manager
autonomy. We control for these in column (2) by including a full set of regional dummies and the
industry-level Lerner Index of competition. None of the main results change, with the exception of
32If we also include CAD/CAM the ERP coe¢cient remains positive and significant. The theory predicts a zeroe§ect of CAD/CAM which indeed has an insignificant coe¢cient (-0.389 with a standard error of 0.432).33See Lemieux, MacLeod and Parent (2009) for how performance pay has grown in importance over time.
25
INTRANET in the worker autonomy equation. The sign is still negative, which is consistent with
the theory (falls in communication cost lower autonomy) but it is now larger in absolute magnitude
and significant at the 10% level, whereas it was insignificant in the baseline regression. Column
(3) includes a variety of additional firm level controls: the capital-labor ratio, sales per employee,
total employment in the group where the firm belongs (i.e. consolidated worldwide employment for
multinationals), firm age and a listing dummy. The results are robust to these additional controls
(which were individually and jointly insignificant). Column (4) uses an alternative indicator of in-
tranets based on the presence of LAN (Local Area Networks) or WAN (Wide Area Networks).34 The
LAN/WAN indicator is highly correlated with INTRANET and the results are very similar to the
baseline. The only di§erence is that, again, INTRANET in the worker autonomy equation which
is now significant (at the 10% level) with a theory consistent negative sign. Again, nothing much
changes, nor does including the Bloom and Van Reenen (2007) measure of management quality in
column (5). Column (6) considers alternative ways of constructing the dependent variable. For the
plant manager autonomy equation we use the principal component of the four questions and for the
worker autonomy question we define it based only on the pace of work.35 The results again seem ro-
bust to these alternatives. Column (7) drops the size controls as they are potentially endogenous and
column (8) conditions on the sub-sample with at least three firms per industry. Neither experiment
has much e§ect on the results.
6 Conclusions
The empirical and theoretical literature that examines the economic e§ects of information and com-
munication technologies (ICT) generally aggregates together information technology (IT) and com-
munication technology (CT) into a single homogeneous category. We argue that this is inappropriate
because the impact of IT and CT on the organization of firms, and ultimately income inequality, will
be quite di§erent depending on the type of technology. Falls in communication costs will tend to re-
duce employee autonomy, as decisions will be passed up to the centre of the firm. Falls in information
acquisition costs will have the opposite e§ect, facilitating more e§ective employee decision-making.
This matters, as the returns to skill at di§erent levels of the organization depend on the importance
of the decisions taken at those levels.
We show these e§ects formally in a “cognitive” model of firm organization which considers two
types of decisions within firms. First, we consider non-production decisions (investment, hiring, new
products and pricing). These decisions can either be taken by the CEO at corporate head quarters
or by the plant manager in the local business unit. The key piece of information technology that has
a§ected these decisions is Enterprise Resource Planning. ERP provides a range of data on metrics like
34We prefer our indicator of INTRANET as LAN was included only in earlier years of the Harte-Hanks data andWAN only in later years.35The results are also robust to constructing the plant manager autonomy variable focusing solely on questions
coded between 1 and 5, i.e. excluding the question on how much capital investment a plant manager could undertakewithout prior authorization from CHQ.
26
production, waste, energy use, sales, inventories and human resources. Modern ERP systems increase
dramatically the availability of information to top and middle managers, which should (according to
our theory) be associated with decentralization of decision making towards middle managers.
Second, we consider factory floor decisions, on the allocation and pace of production tasks. These
production decisions can either be taken by factory floor employees or by their superiors in the
plant hierarchy, like the plant managers. Here, a key technological change has taken the adoption
of Computer Assisted Design and Computer Assisted Manufacturing (CAD/CAM). A worker with
access to those technologies can solve design and production problems better, and thus needs less
access to his superiors in making decisions. This should lead to the decentralization of non-production
decisions towards the factory floor.
Production and non-production decisions will be impacted by reducing communication costs
in entirely di§erent ways. The key technological innovation in within-firm communications is the
growth of intranets. The spread of intranets should be associated with centralization of both types
of decisions within the firm, as providing input from afar becomes cheaper relative to making decisions
on the spot.
We confirm these predictions on a new dataset that combines plant-level measures of organization
and ICT hardware and software adoption across the US and Europe. The organizational questions
were collected as part of our large international management survey, and were explicitly targeted at
the theories we investigate.
In terms of identification, we mainly focus on simple conditional correlations between the di§erent
ICT measures and the multiple dimensions of the organization of the firm, guided by our theoretical
predictions. But we also show that treating technology as endogenous strengthens the results. Our
instrumental variables are distance from the birthplace of the market leading ERP system (SAP)
and the di§erential regulation of the telecommunication industry across countries (which generates
exogenous di§erences in the e§ective prices of intranets).
There are several directions that could be pursued from this line of research. Firstly, it would
be interesting to examine in more detail the reasons for di§erential adoptions of technologies across
firms and countries as the instruments suggest important factors that could explain the di§usion of
communication and information technologies. This is of interest in itself, but is also important in
order to get more closely at the causal e§ects of changes in ICT on firm organization. Secondly,
the theory could be developed to consider interactions between di§erent type of production and
non-production technologies at other layers of the hierarchy. Finally, one could more systematically
examine the e§ect of di§erential type of ICT adoption and organization on other outcomes such as
productivity and wage inequality at the level of the industry and economy.36
36For work in this area see Bresnahan et al (2002), Caroli and Van Reenen (2001) and more recently Caliendo,Monte and Rossi-Hansberg (2012).
27
References
[1] Acemoglu Daron, Philippe Aghion, Claire Lelarge, John Van Reenen, and Fabrizio Zilibotti
(2006) “Technology, Information and the Decentralization of the Firm” Quarterly Journal of
Economics, 122 (4), 1759—1799
[2] Aghion, Philippe, and Tirole, Jean (1997), “Formal and Real Authority in Organizations,”
Journal of Political Economy, 105, 1-29.
[3] Alonso, Ricardo, Dessein, Wouter and Matouschek, Niko “When Does Coordination Require
Centralization” (2008) American Economic Review, 98(1), 145-179.
[4] Aral, Sinan, Brynjolfsson, Erik and Wu, Lynn (2009),“Testing three-way complementarities:
performance pay, monitoring and information technology”, ICIS proceedings.
[5] Armbruster, Heidi, Kinkel, Ste§an, Lay, Gunter and Maloca, Someka (2005) “Techno-
organizational innovation in the European manufacturing industry” European Manufacturing
Survey Bulletin, 1, 1-16
[6] Aubert, Patrick, Caroli, Eve, and Roger, Muriel (2006), “New Technologies, Workplace Orga-
nization and the Structure of the Workforce: Firm-Level Evidence,” Economic Journal, 116,
73-93.
[7] Autor, David, Lavy, Frank and Murnane, Richard (2003) “The Skill Content of Recent Techno-
logical Change: An Empirical Exploration” Quarterly Journal of Economics, 118(4), 1279-1334
[8] Azmat, Ghazala, Manning, Alan, and Van Reenen, John (2008), “Privatization, Entry Regu-
lation and the Decline of Labour’s Share of GDP: A Cross-Country Analysis of the Network
Industries”, Centre for Economic Performance Discussion Paper No. 806, forthcoming Econom-
ica
[9] Baker, George, Gibbons, Robert, and Murphy, Kevin (1999), “Informal Authority in Organiza-
tions,” Journal of Law, Economics, and Organization, 15, 56-73.
[10] Baker, George, and Hubbard, Thomas (2004), “Contractibility and Asset Ownership: On Board
Computers and Governance in US Trucking,” Quarterly Journal of Economics, 119, 1443-79.
[11] Baptista, Rui (2000) “Do innovations di§use faster in geographical clusters?” International
Journal of Industrial Organization 18, 515—535
[12] Baron, David, and Besanko, David (1992), “Information, Control, and Organizational Struc-
ture”, Journal of Economics and Management Strategy, 1, 237-275.
28
[13] Bartel, Ann, Ichniowski, Casey and Kathryn Shaw (2007), “How Does Information Technology
Really A§ect Productivity? Plant-Level Comparisons of Product Innovation, Process Improve-
ment and Worker Skills”, Quarterly Journal of Economics, 122, No. 4, 1721-1758
[14] Beaudry, Paul, Mark Doms and Ethan Lewis (2010) “Should the Personal Computer Be Consid-
ered a Technological Revolution? Evidence from U.S. Metropolitan Areas” Journal of Political
Economy, 118(5), 988-1036.
[15] Becker, Sascha and Ludger Woessmann (2009) “Was Weber wrong? A human capital theory of
Protestant Economic History” Quarterly Journal of Economics, 124(2) 531-595
[16] Black, Sandra, and Lynch, Lisa (2001), “How to Compete: The Impact of Workplace Practices
and Information Technology on Productivity,” Review of Economics and Statistics, 83, 434-445.
[17] Blanchard, Olivier (2004) “The Economic Future of Europe”, Journal of Economic Perspectives,
18, 3-26.
[18] Bloom, Nick, Draca, Mirko and Van Reenen, John (2011) “Trade induced technical change: The
impact of Chinese imports on technology and jobs,” CEP Discussion Paper 1000.
[19] Bloom, Nick, Eifert, Benn, McKenzie, David, Mahajan, Aprajit and Roberts, John (2013),
“Does Management Matter: Evidence from India,” Quarterly Journal of Economics.
[20] Bloom, Nick, Sadun, Ra§aella and Van Reenen, John (2012a), “Americans do I.T. Better:
American multinationals and the productivity miracle”, American Economic Review , 102(1),
167-201.
[21] Bloom, Nick, Sadun, Ra§aella and Van Reenen, John (2012b), “Measuring and Explaining
Organization across firms and countries” Quarterly Journal of Economics, 127(4): 1663-1705.
[22] Bresnahan, Timothy, Brynjolfsson, Erik, and Hitt, Lorin (2002), “Information Technology,
Workplace Organization and the Demand for Skilled Labor: Firm-level Evidence,” Quarterly
Journal of Economics, 117, 339-376.
[23] Calvo, Guillermo, Wellisz, Stanislaw (1978), “Supervision, Loss of Control, and the Optimum
Size of the Firm” Journal of Political Economy, 86, 943-952.
[24] Caliendo, Lorenzo, Ferdinando Monte and Estaban Rossi-Hansberg (2012) “The Anatomy of
French Production Hierarchies” NBER Working Paper No. 18259
[25] Caroli, Eve, and Van Reenen, John, (2001), “Skill Biased Organizational Change,” Quarterly
Journal of Economics, 116, 1448-1492.
[26] Colombo, Massimo, and Delmastro, Marco (2004), “Delegation of Authority in business organi-
zations: An empirical test,” Journal of Industrial Economics, 52, 53-80.
29
[27] Cremer, Jacques, Garicano, Luis and Prat, Andrea (2007), “Language and the Theory of the
Firm” Quarterly Journal of Economics, 122(1): 373-407
[28] Davenport, Thomas H. , Harris, Jeanne G., Catrell, Susan (2002), “The Return of Enterprise
Solutions: The Director’s Cut.” Accenture Institute for High Performance Business Research
Report, October 2002.
[29] Dessein, Wouter (2002), “Authority and Communication in Organizations,” Review of Economic
Studies, 69, 811-838.
[30] Dessein, Wouter and Tano Santos (2006), “Adaptive Organizations.” Journal of Political Econ-
omy, (5): 956—995.
[31] Draca, Mirko, Sadun Ra§aella and Van Reenen, John (2007), “Productivity and ICTs: a Review
of the Evidence”, in Robin Mansell, Chrisanthi Avgerou, Danny Quah and Roger Silverstone
(eds.)The Oxford Handbook of Information and Communication Technologies, Oxford University
Press.
[32] Forman, Chris, Avi Goldfarb and Shane Greenstein (2011) “The Internet and Local Wages: A
Puzzle”, mimeo, Northwestern University
[33] Foster, Andrew and Mark Rosenzweig (2010) “Microeconomics of Technology Adoption” Annual
Review of Economics, 2, 395-424
[34] Garicano, Luis (2000), “Hierarchies and the Organization of Knowledge in Production,” Journal
of Political Economy, 108, 874-904.
[35] Garicano, Luis and Paul Heaton (2010), “Information Technology, Organization, and Produc-
tivity in the Public Sector: Evidence from Police Departments,” Journal of Labor Economics,
18:1, 167-201.
[36] Garicano, Luis and Rossi-Hansberg, Estaban (2006), “Organization and Inequality in a Knowl-
edge Economy” Quarterly Journal of Economics, 121(4), 1383-435.
[37] Gri¢th, Rachel and Simon Lee (2011) “Is distance dying at last? Falling Home bias in fixed
e§ects models of patent citations” Quantitative Economics, 2, 211-249
[38] Guadalupe, Maria and Wulf, Julie (2008) “The Flattening Firm and Product Market Compe-
tition: The E§ect of Trade Liberalization”, American Economic Journal: Applied Economics,
2(4), 105-27
[39] Hagiu, Andrei, Yin, Pai-Ling, Beyersdorfer, Daniela and Dessain, Vincent (2007) “SAP: Industry
Transformation” Harvard Business School Case study 9-707-435
30
[40] Hart, Oliver, and Moore, John (2005), “On the Design of Hierarchies: Coordination versus
Specialization,” Journal of Political Economy, 113, 675-702.
[41] Harris, Jeanne G. and Davenport, Thomas H (2006),“New Growth from Enterprise Systems:
Achieving High Performance through Distinctive Capabilities”, Accenture Institute for High
Performance Business Report.
[42] Holmes, Thomas (2011) “The Di§usion of Wal-Mart and the economics of density”, Economet-
rica, 79(1) 252-301
[43] Hunter, Larry, Bernhardt, Annette, Hughes, Katherine, and Skuratowicz, Eva (2001) “It’s not
just the ATMs: Technology, firm strategies, jobs and earnings in retail banking”, Industrial and
Labor Relations Review, 54(2). 402-424
[44] Ja§e, Adam, Manuel Trajtenberg and Rebecca Henderson (1993), “Geographic localization of
knowledge spillovers as evidenced by patent citations”, Quarterly Journal of Economics 108 (3),
577-598
[45] Kretschmer, Tobias and Mahr, Ferdinand (2009) “Complementaries between technologies: Sur-
vey Evidence”, University of Munich mimeo
[46] Manski, Charles (2004), “Measuring expectations”, Econometrica, LXXII (5), 1329-1376.
[47] Lemieux, Thomas, MacCleod, Bentley and Parent, Daniel (2009) “Performance Pay and Wage
Inequality”, Quarterly Journal of Economics 124(1), 1-49.
[48] Melumad, Nahum, Mookherjee, Dilip, and Reichelstein, Stefan (1995), “Hierarchical Decentral-
ization of Incentive Contracts,” Rand Journal of Economics, 26, 654-672.
[49] Milgrom, Paul, and Roberts, John (1990), “The Economics of Modern Manufacturing: Technol-
ogy, Strategy and Organization,” American Economic Review, 80, 511-528.
[50] Prendergast, Canice (2002) “The Tenuous Trade-o§ between Risk and Incentives” Journal of
Political Economy, 110 (5), 1071-1102
[51] Radner, Roy (1993), “The Organization of Decentralized Information Processing,” Economet-
rica, 61, 1109-1146.
[52] Rajan, Raghuram G and Zingales, Luigi (1998) “Financial Dependence and Growth” American
Economic Review, 88(3), 559-86
[53] Rajan, Raghuram, and Wulf, Julie (2006), “The Flattening Firm: Evidence from Panel Data
on the Changing Nature of Corporate Hierarchies,” Review of Economics and Statistics, 88 (4),
759-773
31
[54] Shepard, Jim and Eric Klein (2006), Enterprise Resource Planning Spending Report, 2006-2007.
AMR Research.
[55] Skinner, Jonathan and Doug Staiger (2007) “Technological Adoption from hybrid corn to Beta
Blockers”, in Ernst Berndt (ed) Hard-to-Measure Goods and Services: Essays in Honor of Zvi
Griliches, Chapter 18, 545-570
[56] Stephenson, Betsy (2006) “The Impact of the Internet on worker flows”, Wharton Business
School mimeo
[57] Telecommunication Handbook, (2007), OECD: Paris
[58] World Development Indicators (2006) World Bank: Washington DC.
32
NOT FOR PUBLICATION UNLESSREQUESTED BY REFEREES/EDITOR
APPENDICES
A Proofs Appendix
Recall the value of a firm with three layers is = maxzp,xm 1 (apzp+wp) (am+amxm+wm)h(1F (zp)) (ac +wc)h2(1 F (zp))(1G(xm)). To show proposition 2, first take first order conditionswith respect to the two types of decisions, zp and xm. These are:
foczp : ap + ((am + amxm + wm) + (ac + wc)h(1G(xm)))hf(zp) = 0
focxm : [am + (ac + wc)hg(xm))]h(1 F (zp)) = 0
To sign the Hessian, note first that the second cross derivatives are 0 at the optimum. To see this
take the second order condition
@focxm@zp
= [am (ac + wc)hg(xm))]hf(zp)
Optimality when managers are used requires that [am + (ac +wc)hg(xm))] = 0 (since F (zp) < 1 orelse workers work on their own as they know everything), and thus the Hessian is:
H =
((am + amxm + wm) + (ac + wc)h(1G(xm))hf 0(zp) 0
0 h(ac + wc)g0(xm)
Since f 0(zp) < 0 and g0(xm) < 0 (management by exception— those higher up specialized in ex-
ceptions), the solution of the first order conditions is a local optimum. Letting the vector foc=
(foczpfocxm):
@foc
@cp=
10
;
@foc
@cm=
h(1 + xm)f(zp)
1
;
@foc
@h=
((am + amxm + wm) + 2h(ac + wc)(1G(xm)) f(zp)
(ac + wc)g(xm)
Let the vector vars = (zp xm) .Then for each parameter, @vars@t= H1 @foc
@tgives:
sign
@zp@ap@xm@ap
!=
< 00
; sign
@zp@am@xm@am
!=
> 0< 0
; sign
@zp@h@xm@h
=
> 0> 0
.
For the e§ects in span, simply note that the span of control of corporate managers is sc =
nm/nc = 1/ ((1G(xm))h) and that of middle managers: sm = N/nm = 1/ ((1 F (zp)h) ,
33
sign
@sm@ap@sc@ap
!=
< 00
; sign
@sm@am@sc@am
=
> 0< 0
; sign
@sm@h@sc@h
=
7 07 0
.
To get the table in the paper, note that the predictions are with respect to a fall in these costs
and thus all of the signs must be reversed to obtain the prediction.
Finally, note also that if we let am be also the acquisition cost of CEOs, so that ERP a§ects both
CEOs and plant managers equally nothing changes (as the proposition states), so that ac = am. The
first foc becomes foczp : ap + ((am + amxm + wm) + (am + wc)h(1G(xm))hf(zp), focxm changesto: am + (am + wc)hg(xm)), and
@foc
@am=
((1 + xm) + h(1G(xm))hf(zp) > 01 + hg(xm) = wchg(xm)/am < 0
so that sign
@zp@am@xm@am
!=
> 0< 0
is still true.
B Technology Description Appendix: The e§ect of ERP,CAD/CAM and Intranet on the cost of accessing andcommunicating information
B.1 Connected Real Time Data Bases (ERP): Increasing ManagerialInformation Access (am, ac)
The cost of access to information by local plant managers (am) and central, head quarters’ based
managers (ac) has been directly a§ected by the installation in firms of Enterprise Resource Planning
(ERP) systems. The main sellers of ERP are SAP and Oracle, both used by more than half of large
US business. The introduction of ERP systems is typically the largest investment in information
technology in manufacturing related business: in 2006, ERP was estimated to represent just under
one third of all application IT spend in large US companies.37
To understand the impact of ERP consider the example for an exhaust factory. After the in-
troduction of SAP 5.0, such a production plant would have all its data collected and stored in one
unified computing system, allowing the plant manager (and all other managers) to easily access and
compare data across a range of processes. For example, if a filter supplier were to shut-down due
to a fire, the plant manager could use his ERP system to generate an on-line inventory of current
filter stocks, a read-out of work-in-progress, and customer orders outstanding, to evaluate which
customer orders were most at risk from shortages. This would enable him to re-schedule filter stocks
towards the most imminent customer orders, and pause production of less imminent orders until
alternative suppliers could be found. He would also able to call-up a list of alternative filters and
37These estimates are from Shepard and Klein, (2006) who conducted 175 interviews with IT managers in U.S. basedcompanies with 1,000 or more employees. ERP systems are also increasingly common in larger firms in developingcountries, see for example Bloom et al. (2011).
34
their suppliers to source a replacement supplier. Once the local manufacturing sites and the company
head quarters are integrated in the company-wide ERP system, plant managers and the central head
quarters have a full company-level overview of production, inventory, orders and finance across the
company. Therefore, the development of ERP enables managers to access timely information at an
unprecedented rate, empowering plant managers to make decisions on a range of activities including
investment, hiring, pricing and product choice.38 Given the theory, we thus expect ERP to be a
decentralizing technology: as all managers have better access to information, lower level managers
can make more decisions without consulting their superiors.
A possible concern is that ERP might also a§ect communication costs, by simplifying the trans-
mission of information across hierarchical levels. To investigate this issue in more detail, we collected
data in a survey of IT managers on ERP usage in 431 firms with 100 to 5000 employees. The em-
pirical evidence, which we discuss below, corroborates our discussions with technology experts that
ERP is primarily related to information acquisition rather than communication.
In the Summer and Fall of 2008 Kretschmer and Mahr (2009) conducted a survey of IT managers
in medium-sized (100 to 5,000 employees) German and Polish firms that were randomly chosen from
the population of manufacturing firms. The aims of the survey were wider than just ERP and
collected information on management and other factors. At our request some questions on the use
of ERP were inserted. Answers to the questions were on a Likert Scale from 1 = strongly disagree
to 5 = strongly agree. The key questions for our purposes were the following:
Q21 “Our ERP system is used to endow top management with more and better information”
Q24 “Our ERP system is used to endow middle managers with more and better information”
Q23 “Our ERP system is used to faster communicate information and directives from top
management to employees”
Q26 “Our ERP system is used to faster communicate information and directives from middle
management to employees”
Figure A1 shows the distribution of answers to these questions. It is clear from this figure that
most respondents were likely (a “4”) or very likely (a “5”) to agree with statements Q21 and Q24
suggesting ERP was related to information acquisition. By contrast, as many people disagreed as
agreed with the statements in Q23 and Q26 that ERP lowers communication costs. About three
quarters of respondents said that ERP was “likely” or “very likely” to increase information flows (see
Q1 in Figure A1). When we asked whether “ERP is used for faster communication of information
and directives from top management to other employees” (again from 1 = strongly disagree to 5 =
strongly agree), only about a third of respondents answered that ERP was “likely” or “very likely”
to increase this form of communication (see Panel Q2 in Figure A1). Using the cardinal scale, the
mean of the information acquisition answer was 3.8, whereas the mean of the communication answer
was 2.8 with the di§erence significant at the 1% level. A similar pattern is evident when respondents
where asked about information acquisition vs. communication for middle managers (see Panels Q3
38By improving the access of managers to local time information ERP also allows managers to make better decisions(see Davenport et al, 2002).
35
and Q4 in Figure A1).
Table A1 shows regression versions of these descriptive statistics. Likert scales between respon-
dents can be biased because each respondent implicitly has a di§erent scaling when they answer
such questions (Manski, 2004). We can deal with this by only comparing “within respondent”, i.e.
looking at the relative responses for the same individual across questions. We construct several such
variables, but the key one is “DIF1” the absolute di§erence between “Our ERP system is used to
endow middle managers with more and better information” (Q24) and “Our ERP system is used to
faster communicate information and directives from top management to employees” (Q23). This
is an index from -4 to 4 indicating the degree to which ERP reduces information costs relative to
communication costs. A positive value of this index indicates that managers are more likely to view
ERP as improving information costs rather than reducing communication costs.
Column (1) of Table A1 shows that the mean value of this index is just above one and significantly
greater than zero - if ERP was on average thought to be equally important for communication as for
information acquisition, the coe¢cient on the constant would be insignificantly di§erent from zero.
This is consistent with our assumption that ERP is used more as an information acquisition tool than
a communication tool. We condition on some confounding influences - country dummies, industry
dummies and size in column (2) which shows the di§erence is robust. One might be concerned
that the communication question relates to top managers, so we also used “DIF2” which keeps the
information question the same (Q21) but deducts “Our ERP system is used to faster communicate
information and directives from middle management to employees” (Q26). The results of using this
as a dependent variable are in column (3) which are almost identical to column (2). Finally we
checked whether ERP is better at endowing top management with more information than middle
management by constructing “DIF3” the absolute di§erence between “Our ERP system is used to
endow middle managers with more and better information” (Q24) and “Our ERP system is used
to endow top management with more and better information” (Q21). This di§erence is positive
but completely insignificant. In terms of our theory this means that ERP shifts am downwards to a
similar extent as ac which is again, what we assumed for our interpretation of the empirical results.39
See Kretschmer and Mahr (2009) for full details on the underlying survey.
B.2 Computer Assisted Design and Manufacturing (CAD/CAM): In-creasing Information Access at the Shop Floor (ap)
A second important parameter in our model is the change in the cost of access to information on the
production floor. A crucial recent change in these costs has been the introduction of CAD/CAM.
New manufacturing orders generally require design, testing and redesign, typically by the engi-
neering department. The process traditionally started with the design being provided by the supplier
- for example an exhaust pipe for a new military vehicle - which the engineers would mock-up and
produce in a trial run. Once this was successful the engineers would go to the manufacturing facility,
39There are di§erences in the comparative statistcs if ERP or another technology reduced cc but not cm.
36
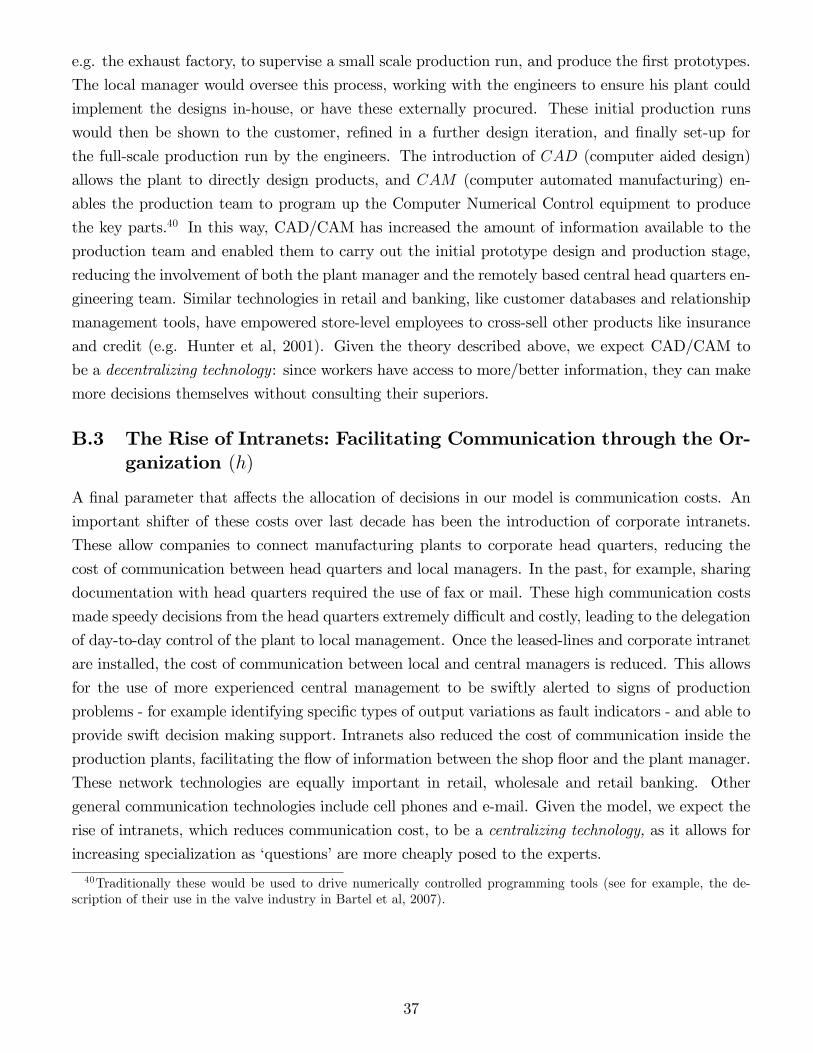
e.g. the exhaust factory, to supervise a small scale production run, and produce the first prototypes.
The local manager would oversee this process, working with the engineers to ensure his plant could
implement the designs in-house, or have these externally procured. These initial production runs
would then be shown to the customer, refined in a further design iteration, and finally set-up for
the full-scale production run by the engineers. The introduction of CAD (computer aided design)
allows the plant to directly design products, and CAM (computer automated manufacturing) en-
ables the production team to program up the Computer Numerical Control equipment to produce
the key parts.40 In this way, CAD/CAM has increased the amount of information available to the
production team and enabled them to carry out the initial prototype design and production stage,
reducing the involvement of both the plant manager and the remotely based central head quarters en-
gineering team. Similar technologies in retail and banking, like customer databases and relationship
management tools, have empowered store-level employees to cross-sell other products like insurance
and credit (e.g. Hunter et al, 2001). Given the theory described above, we expect CAD/CAM to
be a decentralizing technology: since workers have access to more/better information, they can make
more decisions themselves without consulting their superiors.
B.3 The Rise of Intranets: Facilitating Communication through the Or-ganization (h)
A final parameter that a§ects the allocation of decisions in our model is communication costs. An
important shifter of these costs over last decade has been the introduction of corporate intranets.
These allow companies to connect manufacturing plants to corporate head quarters, reducing the
cost of communication between head quarters and local managers. In the past, for example, sharing
documentation with head quarters required the use of fax or mail. These high communication costs
made speedy decisions from the head quarters extremely di¢cult and costly, leading to the delegation
of day-to-day control of the plant to local management. Once the leased-lines and corporate intranet
are installed, the cost of communication between local and central managers is reduced. This allows
for the use of more experienced central management to be swiftly alerted to signs of production
problems - for example identifying specific types of output variations as fault indicators - and able to
provide swift decision making support. Intranets also reduced the cost of communication inside the
production plants, facilitating the flow of information between the shop floor and the plant manager.
These network technologies are equally important in retail, wholesale and retail banking. Other
general communication technologies include cell phones and e-mail. Given the model, we expect the
rise of intranets, which reduces communication cost, to be a centralizing technology, as it allows for
increasing specialization as ‘questions’ are more cheaply posed to the experts.
40Traditionally these would be used to drive numerically controlled programming tools (see for example, the de-scription of their use in the valve industry in Bartel et al, 2007).
37
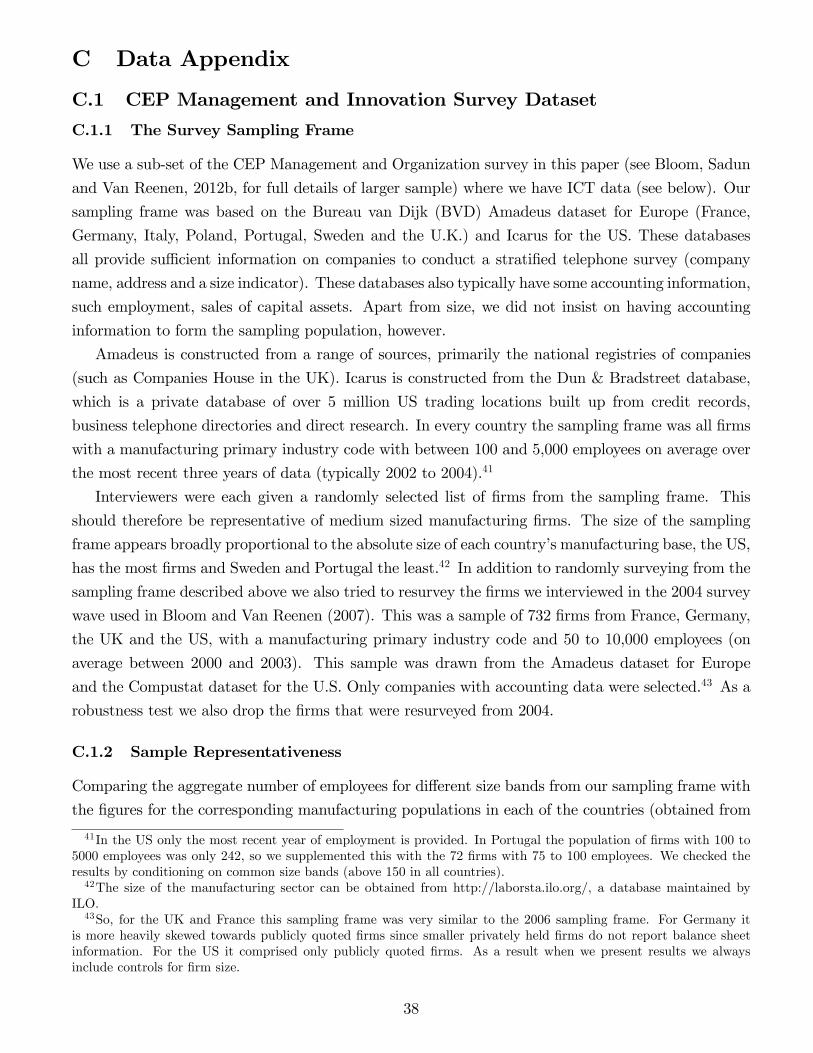
C Data Appendix
C.1 CEP Management and Innovation Survey Dataset
C.1.1 The Survey Sampling Frame
We use a sub-set of the CEP Management and Organization survey in this paper (see Bloom, Sadun
and Van Reenen, 2012b, for full details of larger sample) where we have ICT data (see below). Our
sampling frame was based on the Bureau van Dijk (BVD) Amadeus dataset for Europe (France,
Germany, Italy, Poland, Portugal, Sweden and the U.K.) and Icarus for the US. These databases
all provide su¢cient information on companies to conduct a stratified telephone survey (company
name, address and a size indicator). These databases also typically have some accounting information,
such employment, sales of capital assets. Apart from size, we did not insist on having accounting
information to form the sampling population, however.
Amadeus is constructed from a range of sources, primarily the national registries of companies
(such as Companies House in the UK). Icarus is constructed from the Dun & Bradstreet database,
which is a private database of over 5 million US trading locations built up from credit records,
business telephone directories and direct research. In every country the sampling frame was all firms
with a manufacturing primary industry code with between 100 and 5,000 employees on average over
the most recent three years of data (typically 2002 to 2004).41
Interviewers were each given a randomly selected list of firms from the sampling frame. This
should therefore be representative of medium sized manufacturing firms. The size of the sampling
frame appears broadly proportional to the absolute size of each country’s manufacturing base, the US,
has the most firms and Sweden and Portugal the least.42 In addition to randomly surveying from the
sampling frame described above we also tried to resurvey the firms we interviewed in the 2004 survey
wave used in Bloom and Van Reenen (2007). This was a sample of 732 firms from France, Germany,
the UK and the US, with a manufacturing primary industry code and 50 to 10,000 employees (on
average between 2000 and 2003). This sample was drawn from the Amadeus dataset for Europe
and the Compustat dataset for the U.S. Only companies with accounting data were selected.43 As a
robustness test we also drop the firms that were resurveyed from 2004.
C.1.2 Sample Representativeness
Comparing the aggregate number of employees for di§erent size bands from our sampling frame with
the figures for the corresponding manufacturing populations in each of the countries (obtained from
41In the US only the most recent year of employment is provided. In Portugal the population of firms with 100 to5000 employees was only 242, so we supplemented this with the 72 firms with 75 to 100 employees. We checked theresults by conditioning on common size bands (above 150 in all countries).42The size of the manufacturing sector can be obtained from http://laborsta.ilo.org/, a database maintained by
ILO.43So, for the UK and France this sampling frame was very similar to the 2006 sampling frame. For Germany it
is more heavily skewed towards publicly quoted firms since smaller privately held firms do not report balance sheetinformation. For the US it comprised only publicly quoted firms. As a result when we present results we alwaysinclude controls for firm size.
38

national census data), we find that in all countries but two the sampling frame broadly matches up
with the population of medium sized manufacturing firms. This suggests our sampling frame covers
the population of all firms. In Germany and Portugal the coverage is less complete as the frame
appears to cover around a third of manufacturing employees. To address this problem we always
include country fixed-e§ects to try to control for any di§erences across countries. Second, we control
for size and industry. This should help to condition out some of the factors that lead to under/over
sampling of firms. Finally, we made sure the results were robust to dropping Germany and Portugal.
45% of the firms we contacted took part in the survey: a high success rate given the voluntary
nature of participation. Of the remaining firms 17% refused to be surveyed, while the remaining
38% were in the process of being scheduled when the survey ended. The decisions to reject the
interview is uncorrelated with revenues per worker, listing status of the firm or firm age. Large firms
and multinationals were more likely to respond although the magnitude of this e§ect is small (e.g.
multinationals were about 7% more likely to agree to the interview and firms about 4 percentage
points more likely for a doubling in size).
C.2 Harte Hanks Data
The ICT data used is constructed using the Ci Technology Database (CiDB) produced by the in-
ternational marketing and information company Harte Hanks (HH). Harte-Hanks is a NYSE listed
multinational that collects IT data primarily for the purpose of selling on to large producers and
suppliers of IT products (e.g. IBM, Dell etc). Their data is collected for over 160,000 plants across
20 European countries, and another 250,000 across the US. The US branch has the longest history
with the company beginning its data collection activities in the mid 1980s.
Harte Hanks surveys plants (referred to as “sites” in the CiTB database) on a rolling basis with
an average of 11 months between surveys. This means that at any given time, the data provides
a “snapshot” of the stock of a firm’s IT. The CiTDB contains detailed hardware, equipment and
software information at the plant level. Areas covered by the survey include PCs, many types of
software, servers, storage and IT sta§ (including development sta§ such as programmers). The fact
that HH sells this data on to major firms like IBM and Cisco, who use this to target their sales
e§orts, exerts a strong market discipline on the data quality. If there were major discrepancies in
the collected data this would rapidly be picked up by HH’s clients when they placed sales calls using
the survey data, and would obviously be a severe problem for HH future sales.44 Because of this HH
run extensive internal random quality checks on its own data, enabling them to ensure high levels of
data accuracy.
Another valuable feature of the CiDB is its consistency of collection across countries. The data for
Europe is collected via a central call centre in Dublin and this ensures that all variables are defined
on an identical basis across countries. This provides some advantages over alternative strategies such
as (for example) harmonizing government statistical register data collected by independent national
44HH also refunds data-purchases for any samples with error levels above 5%.
39

agencies.
HH samples all firms with over 100 employees in each country. Thus, we do lose smaller firms,
but since we focus on manufacturing the majority of employees are in these larger firms. It is also
worth noting this survey frame is based on firm employment - rather than plant employment - so
the data contains plants with less than 100 employees in firms with multiple plants. Furthermore,
HH only drops plants from the survey if they die or repeatedly refuse to answer over several years,
so that the sampling frame covers all firms that have had at 100 employees in any year since the
survey began. In terms of survey response rate HH reports that for the large European countries
(UK, France, Germany, Italy, and Spain) they had a response rate of 37.2% in 2004 for firms with
100 or more employees. Bloom, Draca and Van Reenen (2011) provide further information on the
HH dataset.
C.3 Firm level accounting data
Our firm accounting data on sales, employment, capital, profits, shareholder equity, long-term debt,
market values (for quoted firms) and wages (where available) came from Amadeus dataset for Europe
(France, Germany, Italy, Poland, Portugal, Sweden and the U.K.) and on Icarus for the US
C.4 Leased Line Data
The data on cross national prices is given by OECD (2007). Although European prices have been
falling over the past decade due to liberalizations and pressures from the regulators (e.g. European
Commission DG-Competition), there remains considerable concern about di§erential degrees of com-
petition and regulation generating cross-national price disparities. “Local leased line prices remain of
concern where there is insu¢cient competition. For users in these areas this means that incumbents
can continue to charge prices that are not disciplined by competition. For new entrants it means that
incumbents may price local leased circuits in an anti-competitive manner” (OECD Communication
Outlook, 2005).
“Leased lines are provided by traditional telecom operators. New market entrants have their
own networks but need to link their customers’ premises to it. This link is called a ‘leased line part
circuit’ and is usually provided by the incumbent. The availability at the wholesale level of these
links at reasonable prices is a necessary condition for a competitive leased lines retail market and for
pro-competitive downstream ‘knock-on’ e§ects” (European Commission Report, 2002)
A major turning point in the pricing of leased lines took place in 1998 when a significant number
of European countries fully liberalized their telecommunication markets. The impact of increasing
liberalization is evident in the OECD’s Index of leased line prices. At the distances of 50 and 200
kilometers the leased lines (2Mbit/s) index fell from 77 in 1997 to 31 by 2004. This process happened
at a much faster rate in some countries than others (see OECD, 2005).
40
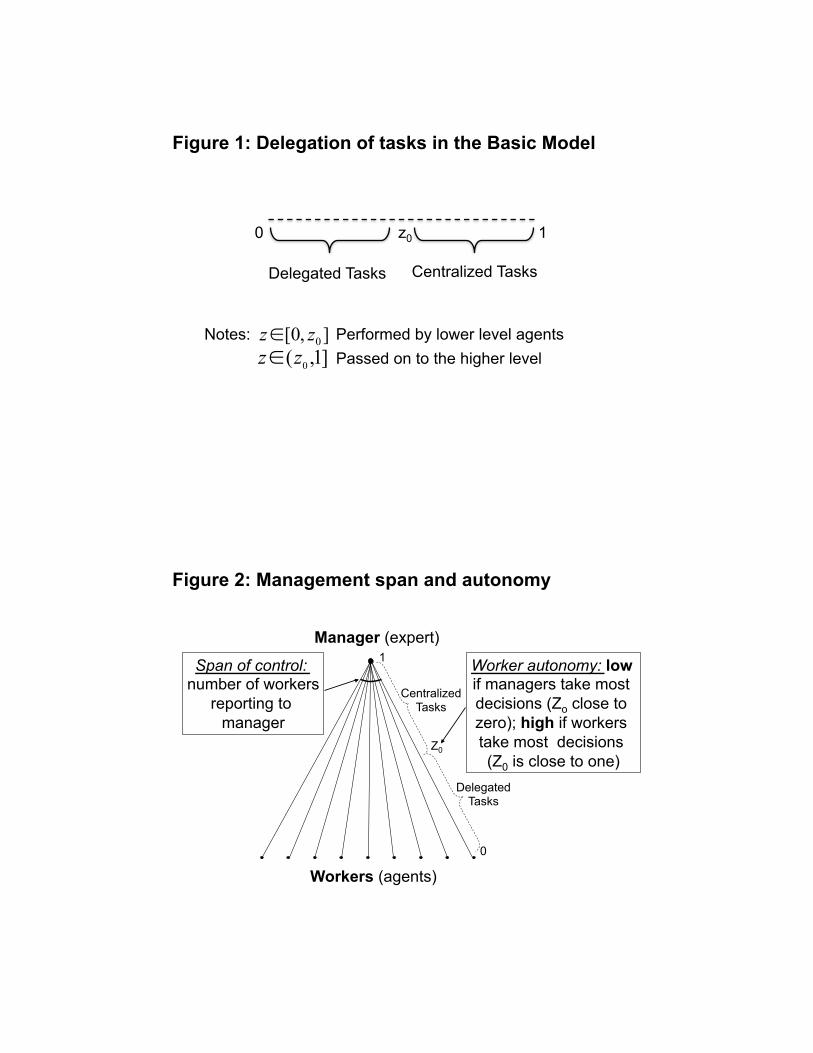
Delegated Tasks Centralized Tasks
0 1 z0
],0[ 0zz∈]1,( 0zz∈
Notes: Performed by lower level agents Passed on to the higher level
Figure 1: Delegation of tasks in the Basic Model
Manager (expert)
Figure 2: Management span and autonomy
Workers (agents)
Span of control: number of workers
reporting to manager
Worker autonomy: low if managers take most decisions (Zo close to zero); high if workers take most decisions (Z0 is close to one)
Z0
0
1
Delegated Tasks
Centralized Tasks

Delegated Tasks Centralized Tasks
0 1 zp
Notes: This generalizes Figure 1 where we allow for non-production decisions and production decisions. Non-production decisions below xm are performed by plant managers, the rest by central head quarters. Production decisions below z0 are performed by production workers, the rest by plant managers
0 1 xm Non-Production Decisions
Production Decisions
Delegated Tasks Centralized Tasks
Figure 3: Delegation of tasks in the extended model
CHQ
Plant Manager 1
Workers
Figure 4: Information and communication
Plant Manager 2
Plant Manager 3
Workers Workers
Communication costs: h Cost of
transmitting information
between CEO and PM, and between PM and workers, measured by presence of
networks
Managers information costs: am & ap
Cost of managers acquiring information, measured using the
presence of ERP
Workers information
costs: ap Cost of workers
acquiring information, measured
using presence of CAD/CAM
43
TABLE 1 – SUMMARY OF MAIN THEORETICAL PREDICTIONS THAT WE EMPIRICALLY TEST
(1) (2) (3)
Plant Manager
Autonomy Worker Autonomy Plant Manager Span
of Control (Table 3) (Table 4) (Table 5) Reduction in Communication costs (h) Technology Indicator INTRANET (h) INTRANET (h) INTRANET (h)
Theoretical Prediction - - ?
Empirical Finding - - (insig) - (insig.) Reduction in Information acquisition costs (a) Technology Indicator ERP (am) CAD/CAM (ap) CAD/CAM (ap)
Theoretical Prediction + + +
Empirical Finding + + + Notes: This table presents the theoretical predictions and the empirical findings. Column (1) refers to plant manager autonomy;; Column (2) refers to workers’ autonomy;; and Column (3) refers to span of control (for plant manager and CEO). INTRANET denotes the presence of an intranet (leased line/frame relay); ERP denotes the presence of Enterprise Resource Planning and CAD/CAM denotes the presence of Computer Assisted Design/Computer Assisted Manufacturing. A “+” denotes an increase, a “-’’ a decrease a “0” denotes no effect and “?’’ denotes an ambiguous sign. All empirical coefficients are statistically significant at the 5% level for those marked (“insig.”).
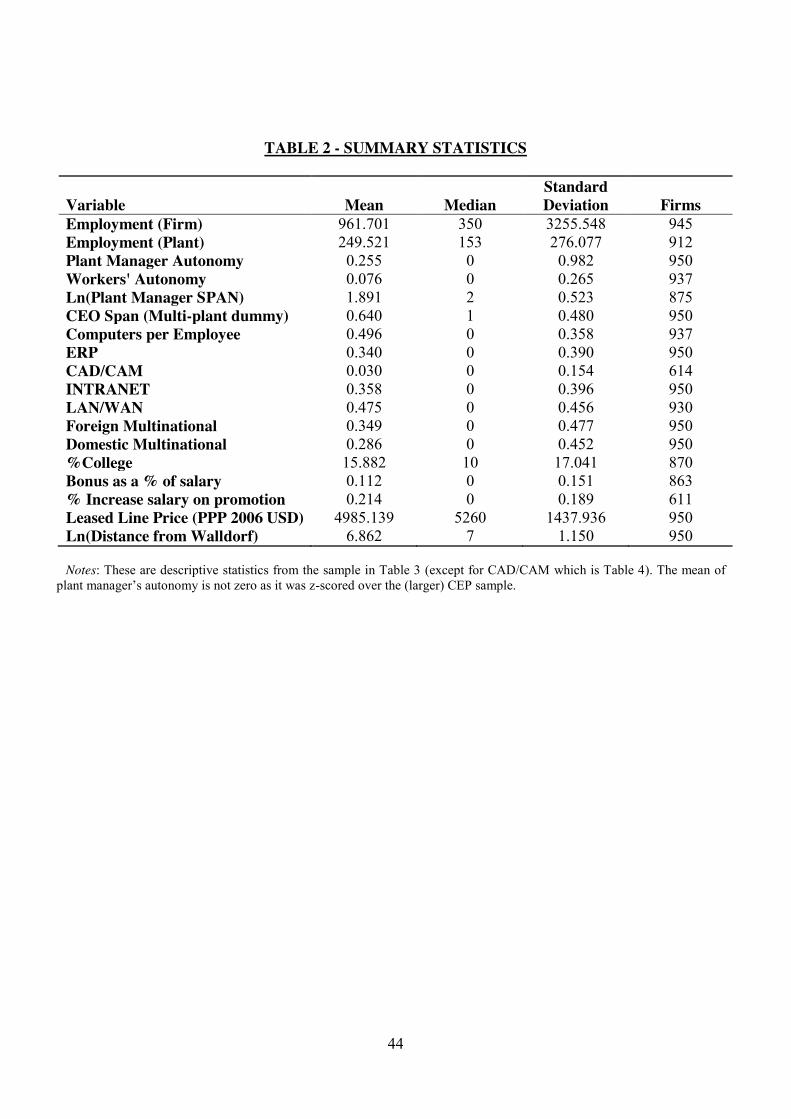
44
TABLE 2 - SUMMARY STATISTICS
Variable Mean Median Standard Deviation Firms
Employment (Firm) 961.701 350 3255.548 945 Employment (Plant) 249.521 153 276.077 912 Plant Manager Autonomy 0.255 0 0.982 950 Workers' Autonomy 0.076 0 0.265 937 Ln(Plant Manager SPAN) 1.891 2 0.523 875 CEO Span (Multi-plant dummy) 0.640 1 0.480 950 Computers per Employee 0.496 0 0.358 937 ERP 0.340 0 0.390 950 CAD/CAM 0.030 0 0.154 614 INTRANET 0.358 0 0.396 950 LAN/WAN 0.475 0 0.456 930 Foreign Multinational 0.349 0 0.477 950 Domestic Multinational 0.286 0 0.452 950 %College 15.882 10 17.041 870 Bonus as a % of salary 0.112 0 0.151 863 % Increase salary on promotion 0.214 0 0.189 611 Leased Line Price (PPP 2006 USD) 4985.139 5260 1437.936 950 Ln(Distance from Walldorf) 6.862 7 1.150 950
Notes: These are descriptive statistics from the sample in Table 3 (except for CAD/CAM which is Table 4). The mean of
plant manager’s autonomy is not zero as it was z-scored over the (larger) CEP sample.
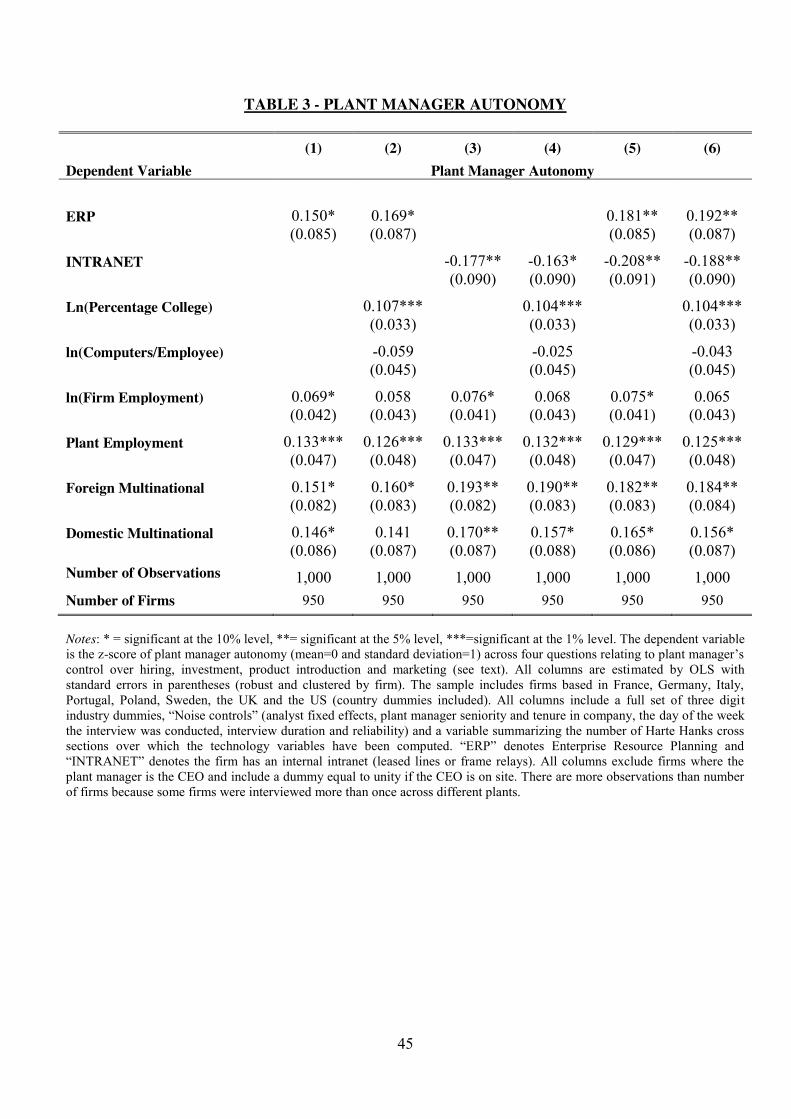
45
TABLE 3 - PLANT MANAGER AUTONOMY (1) (2) (3) (4) (5) (6) Dependent Variable Plant Manager Autonomy ERP 0.150* 0.169* 0.181** 0.192**
(0.085) (0.087) (0.085) (0.087)
INTRANET -0.177** -0.163* -0.208** -0.188** (0.090) (0.090) (0.091) (0.090)
Ln(Percentage College) 0.107*** 0.104*** 0.104*** (0.033) (0.033) (0.033)
ln(Computers/Employee) -0.059 -0.025 -0.043 (0.045) (0.045) (0.045)
ln(Firm Employment) 0.069* 0.058 0.076* 0.068 0.075* 0.065 (0.042) (0.043) (0.041) (0.043) (0.041) (0.043)
Plant Employment 0.133*** 0.126*** 0.133*** 0.132*** 0.129*** 0.125*** (0.047) (0.048) (0.047) (0.048) (0.047) (0.048)
Foreign Multinational 0.151* 0.160* 0.193** 0.190** 0.182** 0.184** (0.082) (0.083) (0.082) (0.083) (0.083) (0.084)
Domestic Multinational 0.146* 0.141 0.170** 0.157* 0.165* 0.156* (0.086) (0.087) (0.087) (0.088) (0.086) (0.087)
Number of Observations 1,000 1,000 1,000 1,000 1,000 1,000 Number of Firms 950 950 950 950 950 950 Notes: * = significant at the 10% level, **= significant at the 5% level, ***=significant at the 1% level. The dependent variable is the z-score of plant manager autonomy (mean=0 and standard deviation=1) across four questions relating to plant manager’s control over hiring, investment, product introduction and marketing (see text). All columns are estimated by OLS with standard errors in parentheses (robust and clustered by firm). The sample includes firms based in France, Germany, Italy, Portugal, Poland, Sweden, the UK and the US (country dummies included). All columns include a full set of three digit industry dummies, “Noise controls” (analyst fixed effects, plant manager seniority and tenure in company, the day of the week the interview was conducted, interview duration and reliability) and a variable summarizing the number of Harte Hanks cross sections over which the technology variables have been computed. “ERP” denotes Enterprise Resource Planning and “INTRANET” denotes the firm has an internal intranet (leased lines or frame relays). All columns exclude firms where the plant manager is the CEO and include a dummy equal to unity if the CEO is on site. There are more observations than number of firms because some firms were interviewed more than once across different plants.
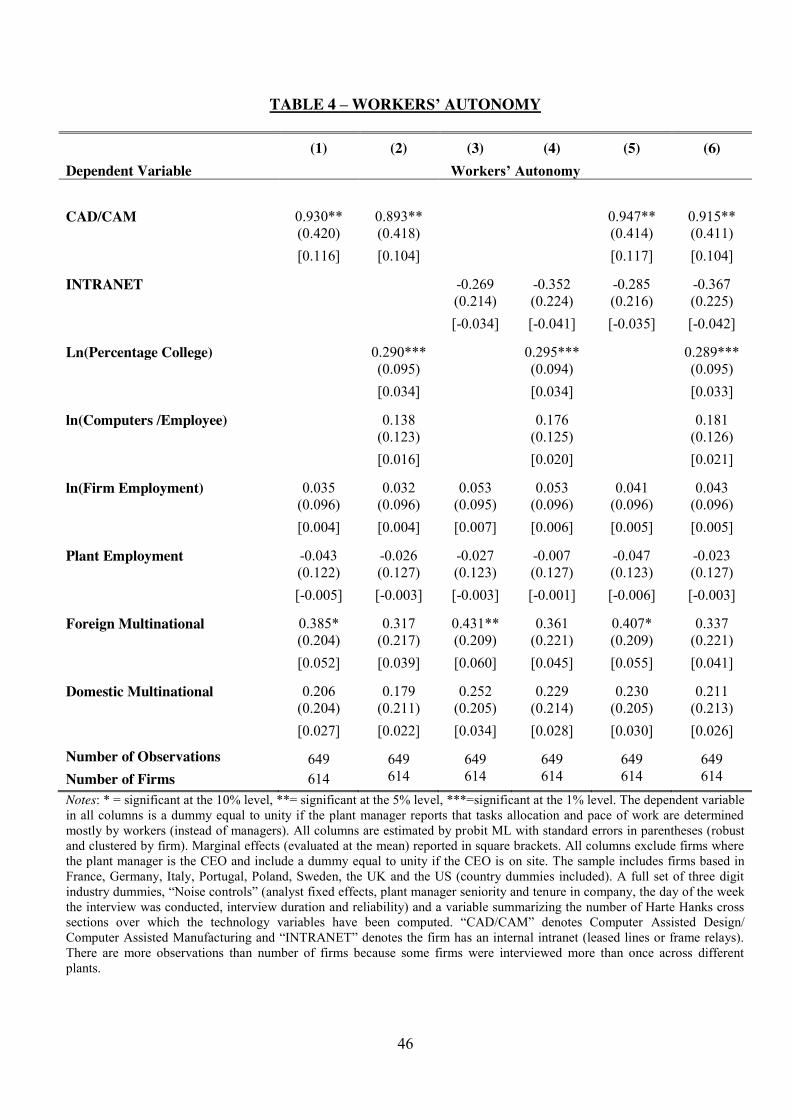
46
TABLE 4 – WORKERS’ AUTONOMY
(1) (2) (3) (4) (5) (6) Dependent Variable Workers’ Autonomy CAD/CAM 0.930** 0.893** 0.947** 0.915**
(0.420) (0.418) (0.414) (0.411) [0.116] [0.104] [0.117] [0.104]
INTRANET -0.269 -0.352 -0.285 -0.367 (0.214) (0.224) (0.216) (0.225) [-0.034] [-0.041] [-0.035] [-0.042]
Ln(Percentage College) 0.290*** 0.295*** 0.289*** (0.095) (0.094) (0.095) [0.034] [0.034] [0.033]
ln(Computers /Employee) 0.138 0.176 0.181 (0.123) (0.125) (0.126) [0.016] [0.020] [0.021]
ln(Firm Employment) 0.035 0.032 0.053 0.053 0.041 0.043 (0.096) (0.096) (0.095) (0.096) (0.096) (0.096) [0.004] [0.004] [0.007] [0.006] [0.005] [0.005]
Plant Employment -0.043 -0.026 -0.027 -0.007 -0.047 -0.023 (0.122) (0.127) (0.123) (0.127) (0.123) (0.127) [-0.005] [-0.003] [-0.003] [-0.001] [-0.006] [-0.003]
Foreign Multinational 0.385* 0.317 0.431** 0.361 0.407* 0.337 (0.204) (0.217) (0.209) (0.221) (0.209) (0.221) [0.052] [0.039] [0.060] [0.045] [0.055] [0.041]
Domestic Multinational 0.206 0.179 0.252 0.229 0.230 0.211 (0.204) (0.211) (0.205) (0.214) (0.205) (0.213) [0.027] [0.022] [0.034] [0.028] [0.030] [0.026]
Number of Observations 649 649 649 649 649 649 Number of Firms 614 614 614 614 614 614 Notes: * = significant at the 10% level, **= significant at the 5% level, ***=significant at the 1% level. The dependent variable in all columns is a dummy equal to unity if the plant manager reports that tasks allocation and pace of work are determined mostly by workers (instead of managers). All columns are estimated by probit ML with standard errors in parentheses (robust and clustered by firm). Marginal effects (evaluated at the mean) reported in square brackets. All columns exclude firms where the plant manager is the CEO and include a dummy equal to unity if the CEO is on site. The sample includes firms based in France, Germany, Italy, Portugal, Poland, Sweden, the UK and the US (country dummies included). A full set of three digit industry dummies, “Noise controls” (analyst fixed effects, plant manager seniority and tenure in company, the day of the week the interview was conducted, interview duration and reliability) and a variable summarizing the number of Harte Hanks cross sections over which the technology variables have been computed. “CAD/CAM” denotes Computer Assisted Design/ Computer Assisted Manufacturing and “INTRANET” denotes the firm has an internal intranet (leased lines or frame relays). There are more observations than number of firms because some firms were interviewed more than once across different plants.
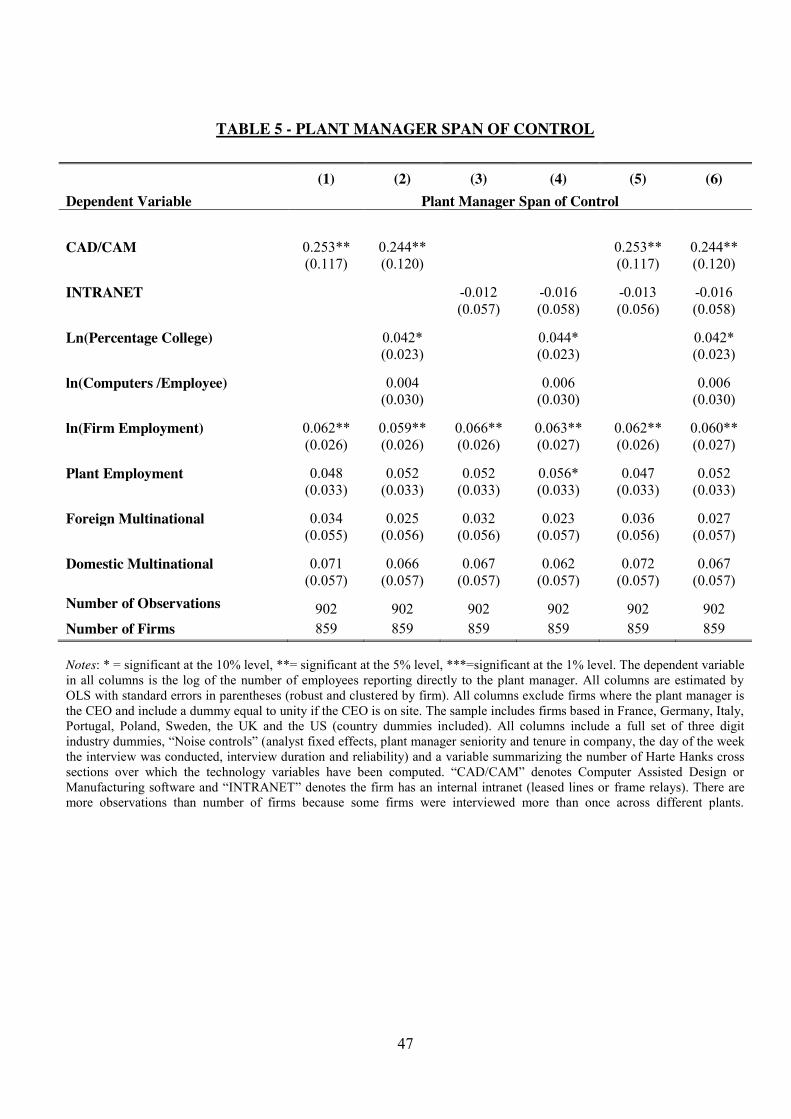
47
TABLE 5 - PLANT MANAGER SPAN OF CONTROL
(1) (2) (3) (4) (5) (6) Dependent Variable Plant Manager Span of Control CAD/CAM 0.253** 0.244** 0.253** 0.244**
(0.117) (0.120) (0.117) (0.120)
INTRANET -0.012 -0.016 -0.013 -0.016 (0.057) (0.058) (0.056) (0.058)
Ln(Percentage College) 0.042* 0.044* 0.042* (0.023) (0.023) (0.023)
ln(Computers /Employee) 0.004 0.006 0.006 (0.030) (0.030) (0.030)
ln(Firm Employment) 0.062** 0.059** 0.066** 0.063** 0.062** 0.060** (0.026) (0.026) (0.026) (0.027) (0.026) (0.027)
Plant Employment 0.048 0.052 0.052 0.056* 0.047 0.052 (0.033) (0.033) (0.033) (0.033) (0.033) (0.033)
Foreign Multinational 0.034 0.025 0.032 0.023 0.036 0.027 (0.055) (0.056) (0.056) (0.057) (0.056) (0.057)
Domestic Multinational 0.071 0.066 0.067 0.062 0.072 0.067 (0.057) (0.057) (0.057) (0.057) (0.057) (0.057)
Number of Observations 902 902 902 902 902 902 Number of Firms 859 859 859 859 859 859 Notes: * = significant at the 10% level, **= significant at the 5% level, ***=significant at the 1% level. The dependent variable in all columns is the log of the number of employees reporting directly to the plant manager. All columns are estimated by OLS with standard errors in parentheses (robust and clustered by firm). All columns exclude firms where the plant manager is the CEO and include a dummy equal to unity if the CEO is on site. The sample includes firms based in France, Germany, Italy, Portugal, Poland, Sweden, the UK and the US (country dummies included). All columns include a full set of three digit industry dummies, “Noise controls” (analyst fixed effects, plant manager seniority and tenure in company, the day of the week the interview was conducted, interview duration and reliability) and a variable summarizing the number of Harte Hanks cross sections over which the technology variables have been computed. “CAD/CAM” denotes Computer Assisted Design or Manufacturing software and “INTRANET” denotes the firm has an internal intranet (leased lines or frame relays). There are more observations than number of firms because some firms were interviewed more than once across different plants.
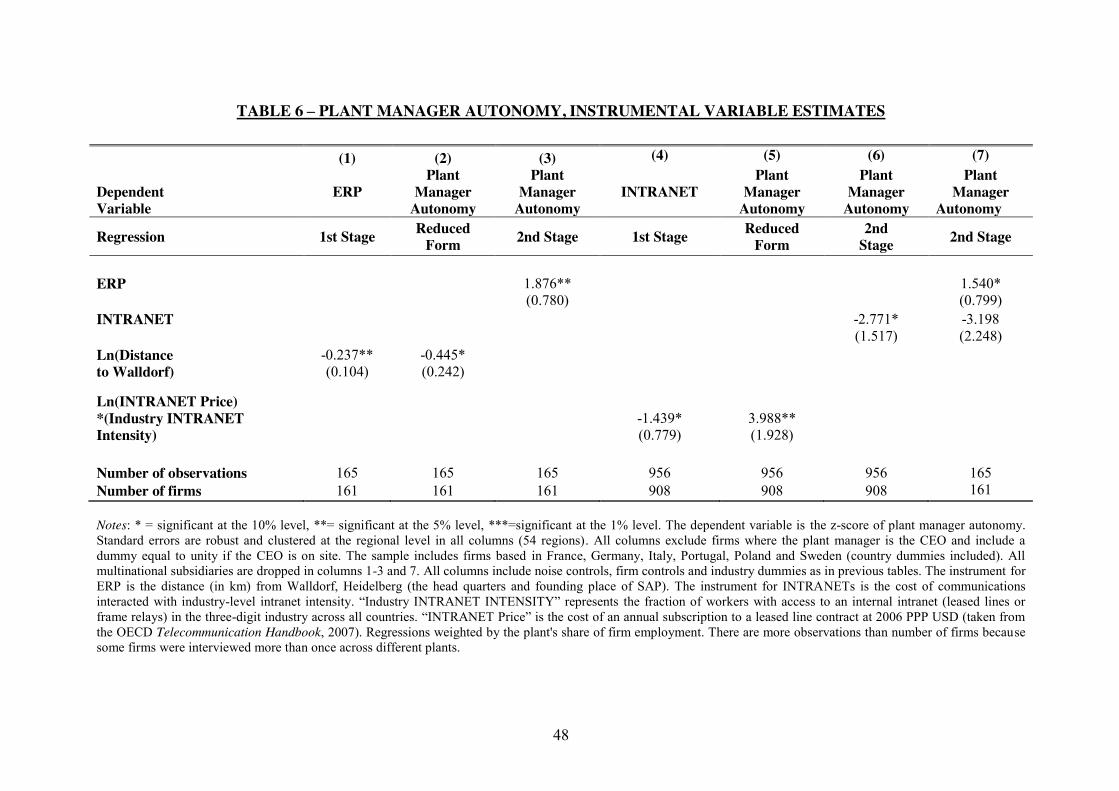
48
TABLE 6 – PLANT MANAGER AUTONOMY, INSTRUMENTAL VARIABLE ESTIMATES
(1) (2) (3) (4) (5) (6) (7)
Dependent Variable
ERP
Plant Manager
Autonomy
Plant Manager
Autonomy INTRANET
Plant Manager
Autonomy
Plant Manager
Autonomy
Plant Manager
Autonomy
Regression 1st Stage Reduced Form 2nd Stage 1st Stage Reduced
Form 2nd
Stage 2nd Stage
ERP 1.876** 1.540*
(0.780) (0.799) INTRANET -2.771* -3.198
(1.517) (2.248) Ln(Distance -0.237** -0.445* to Walldorf) (0.104) (0.242)
Ln(INTRANET Price) *(Industry INTRANET -1.439* 3.988** Intensity) (0.779) (1.928) Number of observations 165 165 165 956 956 956 165 Number of firms 161 161 161 908 908 908 161 Notes: * = significant at the 10% level, **= significant at the 5% level, ***=significant at the 1% level. The dependent variable is the z-score of plant manager autonomy. Standard errors are robust and clustered at the regional level in all columns (54 regions). All columns exclude firms where the plant manager is the CEO and include a dummy equal to unity if the CEO is on site. The sample includes firms based in France, Germany, Italy, Portugal, Poland and Sweden (country dummies included). All multinational subsidiaries are dropped in columns 1-3 and 7. All columns include noise controls, firm controls and industry dummies as in previous tables. The instrument for ERP is the distance (in km) from Walldorf, Heidelberg (the head quarters and founding place of SAP). The instrument for INTRANETs is the cost of communications interacted with industry-level intranet intensity. “Industry INTRANET INTENSITY” represents the fraction of workers with access to an internal intranet (leased lines or frame relays) in the three-digit industry across all countries. “INTRANET Price” is the cost of an annual subscription to a leased line contract at 2006 PPP USD (taken from the OECD Telecommunication Handbook, 2007). Regressions weighted by the plant's share of firm employment. There are more observations than number of firms because some firms were interviewed more than once across different plants.
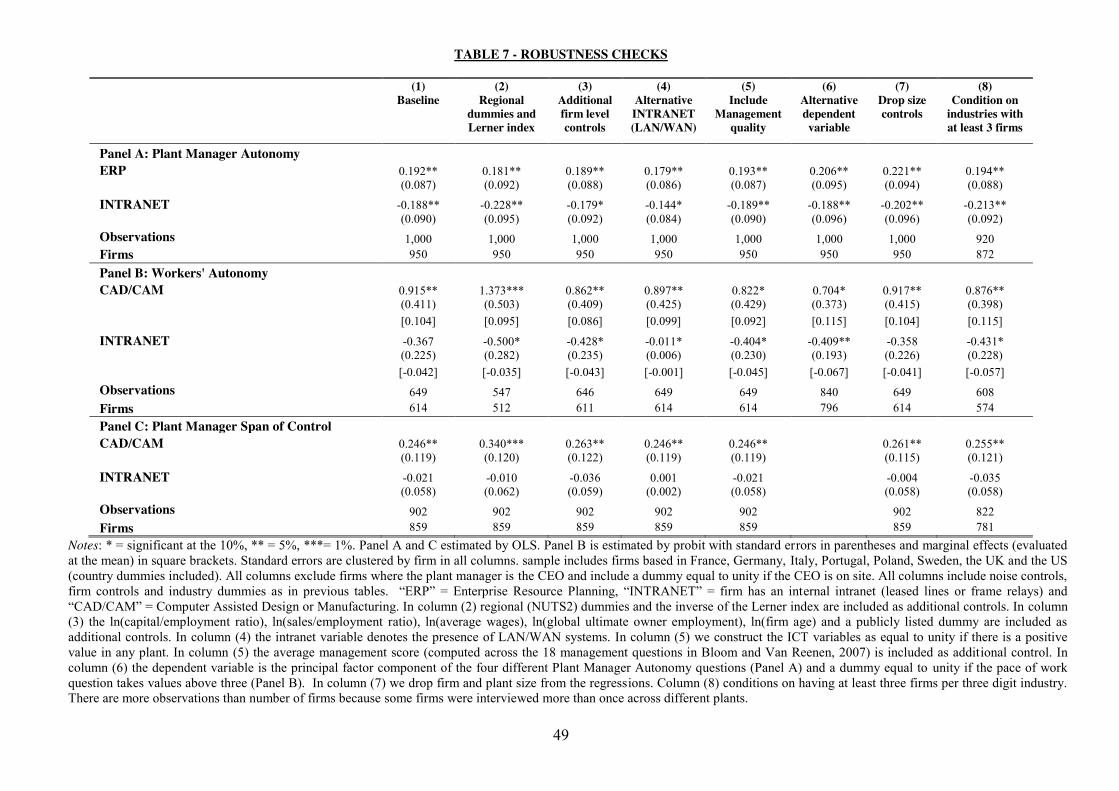
49
TABLE 7 - ROBUSTNESS CHECKS
(1) (2) (3) (4) (5) (6) (7) (8) Baseline Regional
dummies and Lerner index
Additional firm level controls
Alternative INTRANET (LAN/WAN)
Include Management
quality
Alternative dependent variable
Drop size controls
Condition on industries with at least 3 firms
Panel A: Plant Manager Autonomy ERP 0.192** 0.181** 0.189** 0.179** 0.193** 0.206** 0.221** 0.194**
(0.087) (0.092) (0.088) (0.086) (0.087) (0.095) (0.094) (0.088)
INTRANET -0.188** -0.228** -0.179* -0.144* -0.189** -0.188** -0.202** -0.213** (0.090) (0.095) (0.092) (0.084) (0.090) (0.096) (0.096) (0.092)
Observations 1,000 1,000 1,000 1,000 1,000 1,000 1,000 920 Firms 950 950 950 950 950 950 950 872 Panel B: Workers' Autonomy CAD/CAM 0.915** 1.373*** 0.862** 0.897** 0.822* 0.704* 0.917** 0.876**
(0.411) (0.503) (0.409) (0.425) (0.429) (0.373) (0.415) (0.398) [0.104] [0.095] [0.086] [0.099] [0.092] [0.115] [0.104] [0.115]
INTRANET -0.367 -0.500* -0.428* -0.011* -0.404* -0.409** -0.358 -0.431* (0.225) (0.282) (0.235) (0.006) (0.230) (0.193) (0.226) (0.228) [-0.042] [-0.035] [-0.043] [-0.001] [-0.045] [-0.067] [-0.041] [-0.057]
Observations 649 547 646 649 649 840 649 608 Firms 614 512 611 614 614 796 614 574 Panel C: Plant Manager Span of Control CAD/CAM 0.246** 0.340*** 0.263** 0.246** 0.246** 0.261** 0.255**
(0.119) (0.120) (0.122) (0.119) (0.119) (0.115) (0.121)
INTRANET -0.021 -0.010 -0.036 0.001 -0.021 -0.004 -0.035 (0.058) (0.062) (0.059) (0.002) (0.058) (0.058) (0.058)
Observations 902 902 902 902 902 902 822 Firms 859 859 859 859 859 859 781
Notes: * = significant at the 10%, ** = 5%, ***= 1%. Panel A and C estimated by OLS. Panel B is estimated by probit with standard errors in parentheses and marginal effects (evaluated at the mean) in square brackets. Standard errors are clustered by firm in all columns. sample includes firms based in France, Germany, Italy, Portugal, Poland, Sweden, the UK and the US (country dummies included). All columns exclude firms where the plant manager is the CEO and include a dummy equal to unity if the CEO is on site. All columns include noise controls, firm controls and industry dummies as in previous tables. “ERP” = Enterprise Resource Planning, “INTRANET” = firm has an internal intranet (leased lines or frame relays) and “CAD/CAM” = Computer Assisted Design or Manufacturing. In column (2) regional (NUTS2) dummies and the inverse of the Lerner index are included as additional controls. In column (3) the ln(capital/employment ratio), ln(sales/employment ratio), ln(average wages), ln(global ultimate owner employment), ln(firm age) and a publicly listed dummy are included as additional controls. In column (4) the intranet variable denotes the presence of LAN/WAN systems. In column (5) we construct the ICT variables as equal to unity if there is a positive value in any plant. In column (5) the average management score (computed across the 18 management questions in Bloom and Van Reenen, 2007) is included as additional control. In column (6) the dependent variable is the principal factor component of the four different Plant Manager Autonomy questions (Panel A) and a dummy equal to unity if the pace of work question takes values above three (Panel B). In column (7) we drop firm and plant size from the regressions. Column (8) conditions on having at least three firms per three digit industry. There are more observations than number of firms because some firms were interviewed more than once across different plants.

00
01010
102020
203030
304040
405050
50Percent
Perc
ent
Percent1
1
12
2
23
3
34
4
45
5
5Endow top management with more and better information
Endow top management with more and better information
Endow top management with more and better information
Figure A1: Enterprise Resource Planning (ERP) use
Notes: Answers range from 1=“strongly disagree” to 5=“strongly agree”. Each bar represents the % of respondents in the relevant bin from 431 firms. See Appendix B for details.
0
0
010
10
1020
20
2030
30
3040
40
4050
50
50Percent
Perc
ent
Percent1
1
12
2
23
3
34
4
45
5
5Faster communicate information from top management to employees
Faster communicate information from top management to employees
Faster communicate information from top management to employees
0
0
010
10
1020
20
2030
30
3040
40
4050
50
50Percent
Perc
ent
Percent1
1
12
2
23
3
34
4
45
5
5Endow middle managers with more and better information
Endow middle managers with more and better information
Endow middle managers with more and better information 0
0
010
10
1020
20
2030
30
3040
40
4050
50
50Percent
Perc
ent
Percent1
1
12
2
23
3
34
4
45
5
56
6
6Faster communicate information from middle management to employees
Faster communicate information from middle management to employees
Faster communicate information from middle management to employees
Q3: “Our ERP System is used to endow middle management with more & better information”
Q4: “Our ERP System is used to faster communicate information and directives from middle management to employees”
Q2: “Our ERP System is used to faster communicate information and directives from top management to employees”
Q1: “Our ERP System is used to endow top management with more & better information”
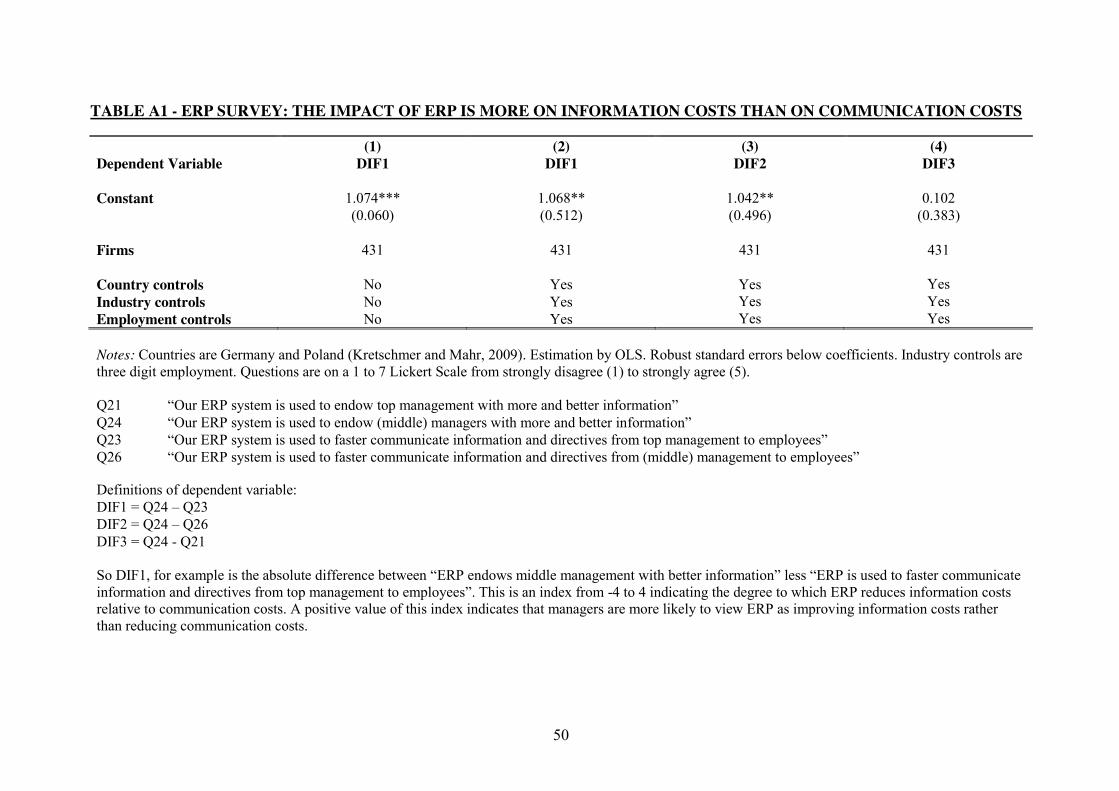
50
TABLE A1 - ERP SURVEY: THE IMPACT OF ERP IS MORE ON INFORMATION COSTS THAN ON COMMUNICATION COSTS
(1) (2) (3) (4) Dependent Variable DIF1 DIF1 DIF2 DIF3 Constant 1.074*** 1.068** 1.042** 0.102 (0.060) (0.512) (0.496) (0.383) Firms 431 431 431 431 Country controls No Yes Yes Yes Industry controls No Yes Yes Yes Employment controls No Yes Yes Yes Notes: Countries are Germany and Poland (Kretschmer and Mahr, 2009). Estimation by OLS. Robust standard errors below coefficients. Industry controls are three digit employment. Questions are on a 1 to 7 Lickert Scale from strongly disagree (1) to strongly agree (5). Q21 “Our ERP system is used to endow top management with more and better information” Q24 “Our ERP system is used to endow (middle) managers with more and better information” Q23 “Our ERP system is used to faster communicate information and directives from top management to employees” Q26 “Our ERP system is used to faster communicate information and directives from (middle) management to employees” Definitions of dependent variable: DIF1 = Q24 – Q23 DIF2 = Q24 – Q26 DIF3 = Q24 - Q21 So DIF1, for example is the absolute difference between “ERP endows middle management with better information” less “ERP is used to faster communicate information and directives from top management to employees”. This is an index from -4 to 4 indicating the degree to which ERP reduces information costs relative to communication costs. A positive value of this index indicates that managers are more likely to view ERP as improving information costs rather than reducing communication costs.
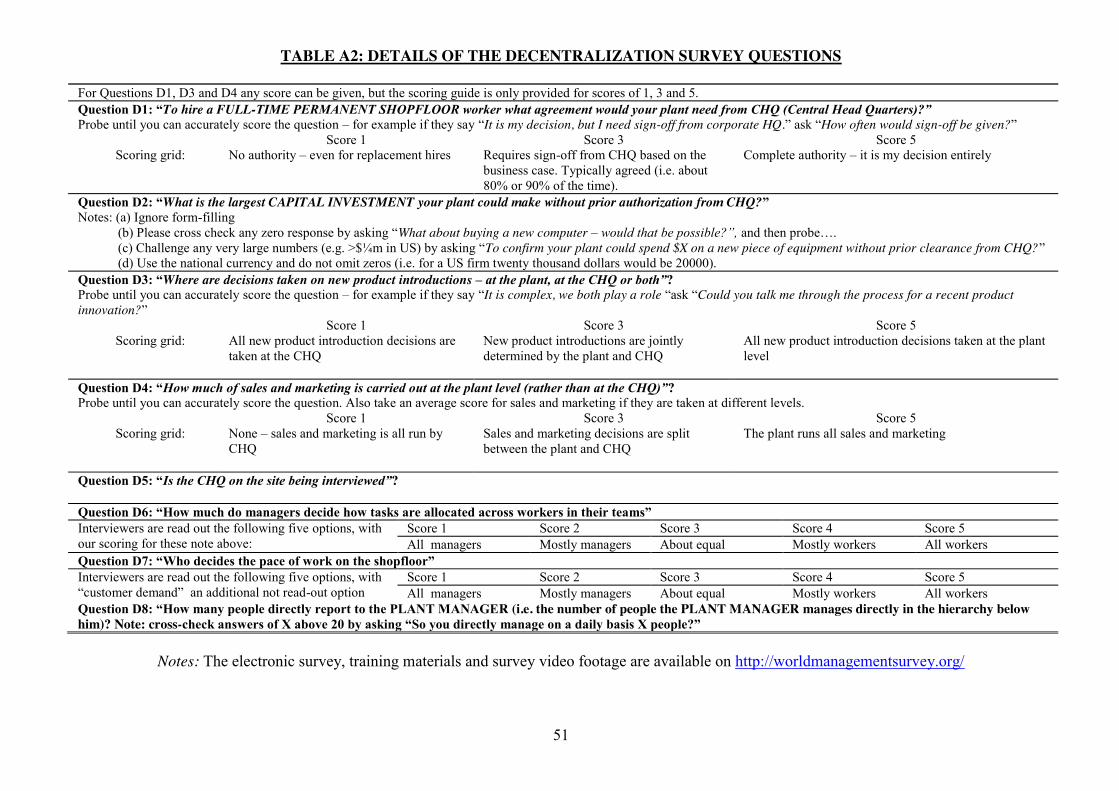
51
TABLE A2: DETAILS OF THE DECENTRALIZATION SURVEY QUESTIONS
For Questions D1, D3 and D4 any score can be given, but the scoring guide is only provided for scores of 1, 3 and 5. Question D1: “To hire a FULL-TIME PERMANENT SHOPFLOOR worker what agreement would your plant need from CHQ (Central Head Quarters)?” Probe until you can accurately score the question – for example if they say “It is my decision, but I need sign-off from corporate HQ.” ask “How often would sign-off be given?”
Score 1 Score 3 Score 5 Scoring grid: No authority – even for replacement hires Requires sign-off from CHQ based on the
business case. Typically agreed (i.e. about 80% or 90% of the time).
Complete authority – it is my decision entirely
Question D2: “What is the largest CAPITAL INVESTMENT your plant could make without prior authorization from CHQ?” Notes: (a) Ignore form-filling (b) Please cross check any zero response by asking “What about buying a new computer – would that be possible?”, and then probe…. (c) Challenge any very large numbers (e.g. >$¼m in US) by asking “To confirm your plant could spend $X on a new piece of equipment without prior clearance from CHQ?” (d) Use the national currency and do not omit zeros (i.e. for a US firm twenty thousand dollars would be 20000). Question D3: “Where are decisions taken on new product introductions – at the plant, at the CHQ or both”? Probe until you can accurately score the question – for example if they say “It is complex, we both play a role “ask “Could you talk me through the process for a recent product innovation?”
Score 1 Score 3 Score 5 Scoring grid: All new product introduction decisions are
taken at the CHQ
New product introductions are jointly determined by the plant and CHQ
All new product introduction decisions taken at the plant level
Question D4: “How much of sales and marketing is carried out at the plant level (rather than at the CHQ)”? Probe until you can accurately score the question. Also take an average score for sales and marketing if they are taken at different levels.
Score 1 Score 3 Score 5 Scoring grid: None – sales and marketing is all run by
CHQ Sales and marketing decisions are split between the plant and CHQ
The plant runs all sales and marketing
Question D5: “Is the CHQ on the site being interviewed”? Question D6: “How much do managers decide how tasks are allocated across workers in their teams” Interviewers are read out the following five options, with our scoring for these note above:
Score 1 Score 2 Score 3 Score 4 Score 5 All managers Mostly managers About equal Mostly workers All workers
Question D7: “Who decides the pace of work on the shopfloor” Interviewers are read out the following five options, with “customer demand” an additional not read-out option
Score 1 Score 2 Score 3 Score 4 Score 5 All managers Mostly managers About equal Mostly workers All workers
Question D8: “How many people directly report to the PLANT MANAGER (i.e. the number of people the PLANT MANAGER manages directly in the hierarchy below him)? Note: cross-check answers of X above 20 by asking “So you directly manage on a daily basis X people?”
Notes: The electronic survey, training materials and survey video footage are available on http://worldmanagementsurvey.org/
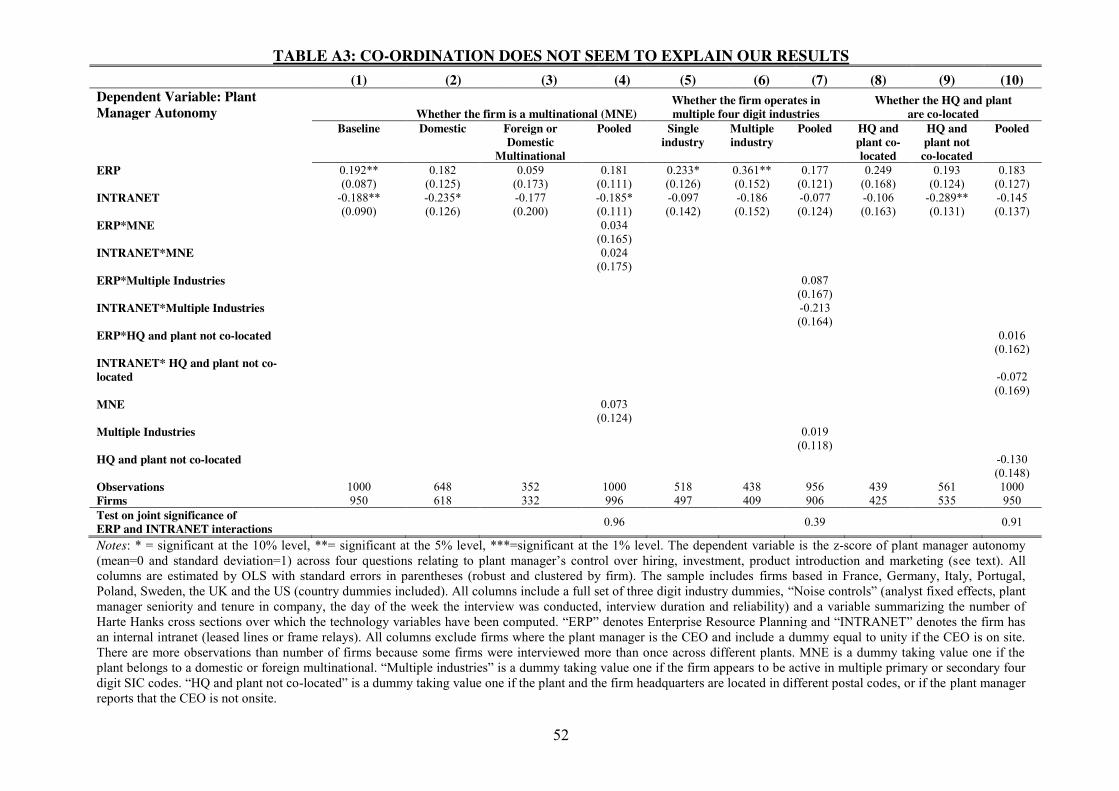
52
TABLE A3: CO-ORDINATION DOES NOT SEEM TO EXPLAIN OUR RESULTS (1) (2) (3) (4) (5) (6) (7) (8) (9) (10) Dependent Variable: Plant Manager Autonomy Whether the firm is a multinational (MNE)
Whether the firm operates in multiple four digit industries
Whether the HQ and plant are co-located
Baseline Domestic Foreign or Domestic
Multinational
Pooled Single industry
Multiple industry
Pooled HQ and plant co-located
HQ and plant not co-located
Pooled
ERP 0.192** 0.182 0.059 0.181 0.233* 0.361** 0.177 0.249 0.193 0.183 (0.087) (0.125) (0.173) (0.111) (0.126) (0.152) (0.121) (0.168) (0.124) (0.127) INTRANET -0.188** -0.235* -0.177 -0.185* -0.097 -0.186 -0.077 -0.106 -0.289** -0.145 (0.090) (0.126) (0.200) (0.111) (0.142) (0.152) (0.124) (0.163) (0.131) (0.137) ERP*MNE 0.034 (0.165) INTRANET*MNE 0.024 (0.175) ERP*Multiple Industries 0.087 (0.167) INTRANET*Multiple Industries -0.213 (0.164) ERP*HQ and plant not co-located 0.016 (0.162) INTRANET* HQ and plant not co-located -0.072 (0.169) MNE 0.073 (0.124) Multiple Industries 0.019 (0.118) HQ and plant not co-located -0.130 (0.148) Observations 1000 648 352 1000 518 438 956 439 561 1000 Firms 950 618 332 996 497 409 906 425 535 950 Test on joint significance of ERP and INTRANET interactions 0.96 0.39 0.91
Notes: * = significant at the 10% level, **= significant at the 5% level, ***=significant at the 1% level. The dependent variable is the z-score of plant manager autonomy (mean=0 and standard deviation=1) across four questions relating to plant manager’s control over hiring, investment, product introduction and marketing (see text). All columns are estimated by OLS with standard errors in parentheses (robust and clustered by firm). The sample includes firms based in France, Germany, Italy, Portugal, Poland, Sweden, the UK and the US (country dummies included). All columns include a full set of three digit industry dummies, “Noise controls” (analyst fixed effects, plant manager seniority and tenure in company, the day of the week the interview was conducted, interview duration and reliability) and a variable summarizing the number of Harte Hanks cross sections over which the technology variables have been computed. “ERP” denotes Enterprise Resource Planning and “INTRANET” denotes the firm has an internal intranet (leased lines or frame relays). All columns exclude firms where the plant manager is the CEO and include a dummy equal to unity if the CEO is on site. There are more observations than number of firms because some firms were interviewed more than once across different plants. MNE is a dummy taking value one if the plant belongs to a domestic or foreign multinational. “Multiple industries” is a dummy taking value one if the firm appears to be active in multiple primary or secondary four digit SIC codes. “HQ and plant not co-located” is a dummy taking value one if the plant and the firm headquarters are located in different postal codes, or if the plant manager reports that the CEO is not onsite.

53
TABLE A4 – EXTENDED THEORY PREDICTIONS
(1) (2) (3) (4)
Plant Manager Autonomy (xm)
Worker Autonomy (zp)
Plant Manager Span of Control
(sm) CEO Span of
Control (sc)
Reduction in communication costs (h) Technology Indicator INTRANET (h) INTRANET (h) INTRANET (h) INTRANET (h)
Theoretical Prediction - - ? ?
Reduction in information acquisition costs for non-production decisions (am) Technology Indicator ERP (am) ERP (am) ERP (am) ERP (am)
Theoretical Prediction + - - +
Reduction in information acquisition costs for production decisions (ap)
Technology Indicator CAD/CAM (ap) CAD/CAM (ap) CAD/CAM (ap) CAD/CAM (ap)
Theoretical Prediction 0 + + 0
Notes: ERP denotes Enterprise Resource Planning, CAD/CAM denotes Computer Assisted Design/Computer Assisted Manufacturing and INTRANET denotes the presence of an intranet (leased line/frame relay). A “+” denotes an increase, a “-’’ a decrease a “0” denotes no effect and “?’’ denotes an ambiguous sign.
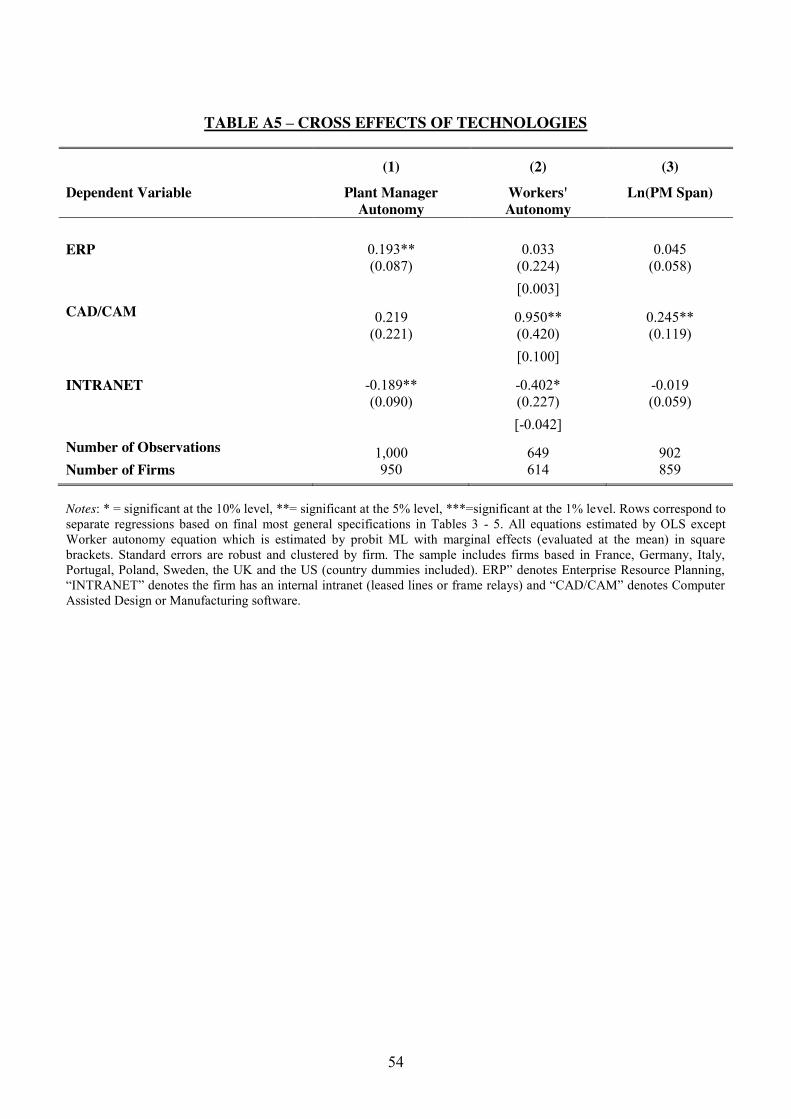
54
TABLE A5 – CROSS EFFECTS OF TECHNOLOGIES
(1) (2) (3)
Dependent Variable Plant Manager Autonomy
Workers' Autonomy
Ln(PM Span)
ERP 0.193** 0.033 0.045
(0.087) (0.224) (0.058) [0.003]
CAD/CAM 0.219 0.950** 0.245** (0.221) (0.420) (0.119) [0.100]
INTRANET -0.189** -0.402* -0.019 (0.090) (0.227) (0.059) [-0.042]
Number of Observations 1,000 649 902 Number of Firms 950 614 859 Notes: * = significant at the 10% level, **= significant at the 5% level, ***=significant at the 1% level. Rows correspond to separate regressions based on final most general specifications in Tables 3 - 5. All equations estimated by OLS except Worker autonomy equation which is estimated by probit ML with marginal effects (evaluated at the mean) in square brackets. Standard errors are robust and clustered by firm. The sample includes firms based in France, Germany, Italy, Portugal, Poland, Sweden, the UK and the US (country dummies included). ERP” denotes Enterprise Resource Planning, “INTRANET” denotes the firm has an internal intranet (leased lines or frame relays) and “CAD/CAM” denotes Computer Assisted Design or Manufacturing software.
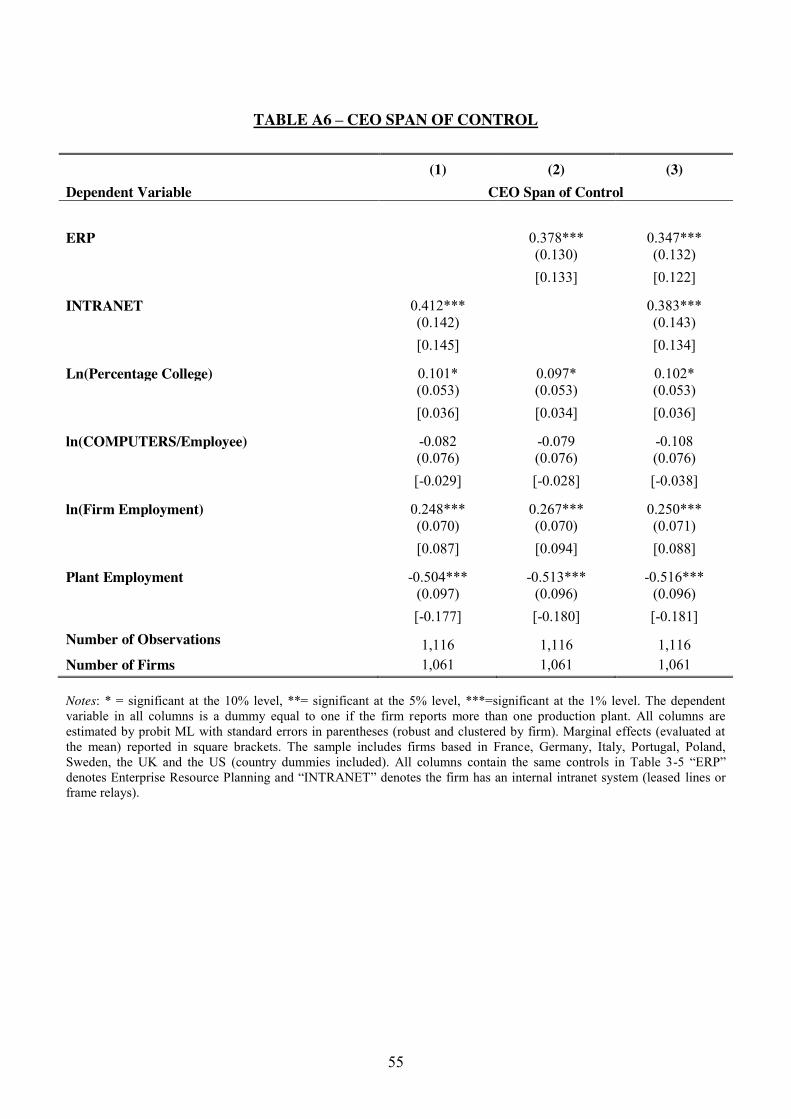
55
TABLE A6 – CEO SPAN OF CONTROL
(1) (2) (3) Dependent Variable CEO Span of Control ERP 0.378*** 0.347***
(0.130) (0.132) [0.133] [0.122]
INTRANET 0.412*** 0.383*** (0.142) (0.143) [0.145] [0.134]
Ln(Percentage College) 0.101* 0.097* 0.102* (0.053) (0.053) (0.053) [0.036] [0.034] [0.036]
ln(COMPUTERS/Employee) -0.082 -0.079 -0.108 (0.076) (0.076) (0.076) [-0.029] [-0.028] [-0.038]
ln(Firm Employment) 0.248*** 0.267*** 0.250*** (0.070) (0.070) (0.071) [0.087] [0.094] [0.088]
Plant Employment -0.504*** -0.513*** -0.516*** (0.097) (0.096) (0.096) [-0.177] [-0.180] [-0.181]
Number of Observations 1,116 1,116 1,116 Number of Firms 1,061 1,061 1,061 Notes: * = significant at the 10% level, **= significant at the 5% level, ***=significant at the 1% level. The dependent variable in all columns is a dummy equal to one if the firm reports more than one production plant. All columns are estimated by probit ML with standard errors in parentheses (robust and clustered by firm). Marginal effects (evaluated at the mean) reported in square brackets. The sample includes firms based in France, Germany, Italy, Portugal, Poland, Sweden, the UK and the US (country dummies included). All columns contain the same controls in Table 3-5 “ERP” denotes Enterprise Resource Planning and “INTRANET” denotes the firm has an internal intranet system (leased lines or frame relays).

56
TABLE A7 - CONTROLLING FOR CONTINGENT PAY
(1) (2) (3) (4) (5) (6)
Dependent Variable
Plant Manager
Autonomy
Workers' Autonomy
Ln(Plant Manager
Span)
Plant Manager
Autonomy
Workers' Autonomy
Ln(Plant Manager
Span)
ERP 0.193** 0.189**
(0.087) (0.087) CAD/CAM 0.908** 0.239** 0.982** 0.247**
(0.402) (0.119) (0.413) (0.115) [0.101] [0.104]
INTRANET -0.187** -0.382* -0.017 -0.186** -0.329 -0.018 (0.090) (0.227) (0.058) (0.091) (0.228) (0.058) [-0.042] [-0.035]
Bonus as a % of Total Salary 0.385 -1.121 0.152 For typical manager (0.249) (0.756) (0.144) [-0.124] % Salary Increase on Promotion -0.060 0.303 0.175 For a typical manager (0.221) (0.479) (0.128) [0.032] Number of Observations 1,000 649 902 1,000 649 902 Number of Firms 950 614 859 950 614 859 Notes: * = significant at the 10% level, **= significant at the 5% level, ***=significant at the 1% level. All columns estimated by OLS except columns 2 and 5 which are estimated by probit ML with standard errors in parentheses and marginal effects (evaluated at the mean) in square brackets. Standard errors are robust and clustered by firm in all columns. The sample includes firms based in France, Germany, Italy, Portugal, Poland, Sweden, the UK and the US (country dummies included). All columns include the same controls as Table 3 through 5. “ERP” denotes Enterprise Resource Planning, “INTRANET” denotes the firm has an internal intranet (leased lines or frame relays) and “CAD/CAM” denotes Computer Assisted Design or Manufacturing software.

CENTRE FOR ECONOMIC PERFORMANCE Recent Discussion Papers
926 Reyn van Ewijk Long-term health effects on the next generation of Ramadan fasting during pregnancy
925 Stephen J. Redding The Empirics of New Economic Geography
924 Rafael Gomez Alex Bryson Tobias Kretschmer Paul Willman
Employee Voice and Private Sector Workplace Outcomes in Britain, 1980-2004
923 Bianca De Paoli Monetary Policy Under Alterative Asset Market Structures: the Case of a Small Open Economy
922 L. Rachel Ngai Silvana Tenreyro
Hot and Cold Seasons in the Housing Market
921 Kosuke Aoki Gianluca Benigno Nobuhiro Kiyotaki
Capital Flows and Asset Prices
920 Alex Bryson John Forth Patrice Laroche
Unions and Workplace Performance in Britain and France
919 David Marsden Simone Moriconi
‘The Value of Rude Health’: Employees’ Well Being, Absence and Workplace Performance
918 Richard Layard Guy Mayraz Stephen Nickell
Does Relative Income Matter? Are the Critics Right?
917 Ralf Martin Laure B. de Preux Ulrich J. Wagner
The Impacts of the Climate Change Levy on Business: Evidence from Microdata
916 Paul-Antoine Chevalier Rémy Lecat Nicholas Oulton
Convergence of Firm-Level Productivity, Globalisation, Information Technology and Competition: Evidence from France
915 Ghazala Azmat Nagore Iriberri
The Importance of Relative Performance Feedback Information: Evidence from a Natural Experiment using High School Students
914 L Rachel Ngai Robert M. Samaniego
Accounting for Research and Productivity Growth Across Industries
913 Francesco Caselli Tom Cunningham
Leader Behavior and the Natural Resource Curse
912 Marco Manacorda Edward Miguel Andrea Vigorito
Government Transfers and Political Support
911 Philippe Aghion John Van Reenen Luigi Zingales
Innovation and Institutional Ownership
910 Fabian Waldinger Peer Effects in Science – Evidence from the Dismissal of Scientists in Nazi Germany
909 Tomer Blumkin Yossi Hadar Eran Yashiv
The Macroeconomic Role of Unemployment Compensation
908 Natalie Chen Dennis Novy
International Trade Integration: A Disaggregated Approach
907 Dongshu Ou To Leave or Not to Leave? A Regression Discontinuity Analysis of the Impact of Failing the High School Exit Exam
906 Andrew B. Bernard J. Bradford Jensen Stephen J. Redding Peter K. Schott
The Margins of US Trade
905 Gianluca Benigno Bianca De Paoli
On the International Dimension of Fiscal Policy
904 Stephen J. Redding Economic Geography: A Review of the Theoretical and Empirical Literature
903 Andreas Georgiadis Alan Manning
Change and Continuity Among Minority Communities in Britain
902 Maria Bas Trade, Technology Adoption and Wage Inequalities: Theory and Evidence
901 Holger Breinlich Chiara Criscuolo
Service Traders in the UK
900 Emanuel Ornelas John L. Turner
Protection and International Sourcing
899 Kosuke Aoki Takeshi Kimura
Central Bank's Two-Way Communication with the Public and Inflation Dynamics
898 Alan Manning Farzad Saidi
Understanding the Gender Pay Gap: What’s Competition Got to Do with It?
The Centre for Economic Performance Publications Unit
Tel 020 7955 7284 Fax 020 7955 7595 Email [email protected] Web site http://cep.lse.ac.uk