Embed Size (px)
Citation preview

Chapter 42: Scope of Ecology
Ecology: the study of interactions of organisms
with other organisms and with the physical
environment
(word means "study of house")

Population: members of the same
species living in the same area

Community: all the different populations in
an area

Ecosystem: the community plus the
nonliving factors (biotic & abiotic factors)

Biosphere: all the areas of the earth that
supports life

Biomes
Aquatic BiomesFreshwater: lakes, rivers, streamswetlands*, estuary*Marine: intertidal zone, coral reefs, deep sea vents

Terrestrial Biomes- Tropical Forest- Savanna- Desert- Chaparral- Temperate Grassland- Temperate Deciduous Forest- Taiga- Coniferous Forest- Tundra
TUNDRA
TAIGA
DESERT

Chapter 43 - Ecology of Populations

Demography - the statistical study of a population (density, distribution, rate of growth)
Population density: number of individuals per unit areaPopulation distribution: pattern of dispersal of individuals (random, clumped, uniform)

Figure 46.2

Factors that determine how much a population will change1. births 2. deaths 3. migration
Stable populations occur when as many individuals join (birth or immigration) as leave (death or emigration)
Population change (r) = (birth - deaths) + (immigrants - emigrants)

Biotic Potential: maximum rate at which a population could grow given optimal conditions (food, water, space)
Factors that influence biotic potential:
1. age of reproduction2. frequency of reproduction3. number of offspring produced4. reproductive life span5. average death rate under ideal conditions

Survivorship curve - probability of newborn individuals surviving to a particular age
Late Loss (Type I)Constant loss (Type II) - death is often unrelated to ageEarly loss (Type III)
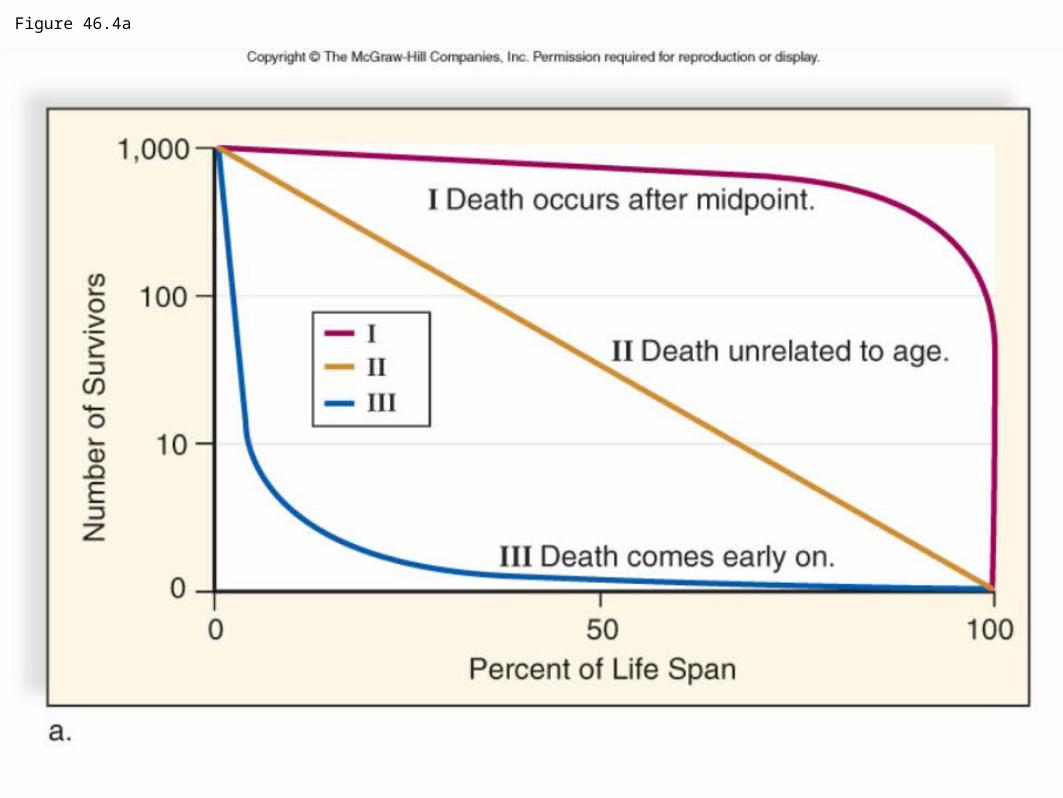
Figure 46.4a

DEMOGRAPHICS - statistical study of a
population’s density, distribution and growth
rate
You can create a
survivorship curve of a
human population by
studying cemetery data

Population Growth Models
Discrete Breeding: Reproduction occurs once in life (followed by death)Continuous Breeding: occurs throughout lifetime
Exponential vs Logistic Growth

J-shaped curve showing exponential growth of a population
Lag Phase then Exponential GrowthThis population has not yet reached its carrying capacity. Requires unlimited resources
S-shaped curve shows how a population becomes limited by environmental factors
Lag Phase, exp growth phase, Deceleration, Stable Equilibrium PhaseCarrying Capacity: the maximum size of a population that an area can support

Growth rate (r) = birth rate (b) - death rate (d)
Population growth = rN
(r = growth rate, N = original population size)
Zero Population Growth - same number enters as leaves the population
Some movements encourage low population growth

Regulation of Population Size
Density Independent Factors: weather and other natural disastersDensity Dependent Factors: food, space, water, parasitism, competition

Figure 46.10
Density Independent Factor (Flash Flood) – it will have the
same impact on a small pop as it does on a large pop.
60% loss for both

Figure 46.11
Density Dependent Factor – as number increases,
not all of them will have access to resources

Life History Patterns
K-strategists - small numbers of offspring, usually parental care (Kangaroo)R-strategists - large numbers of offspring, no care, low survivability (Roaches)
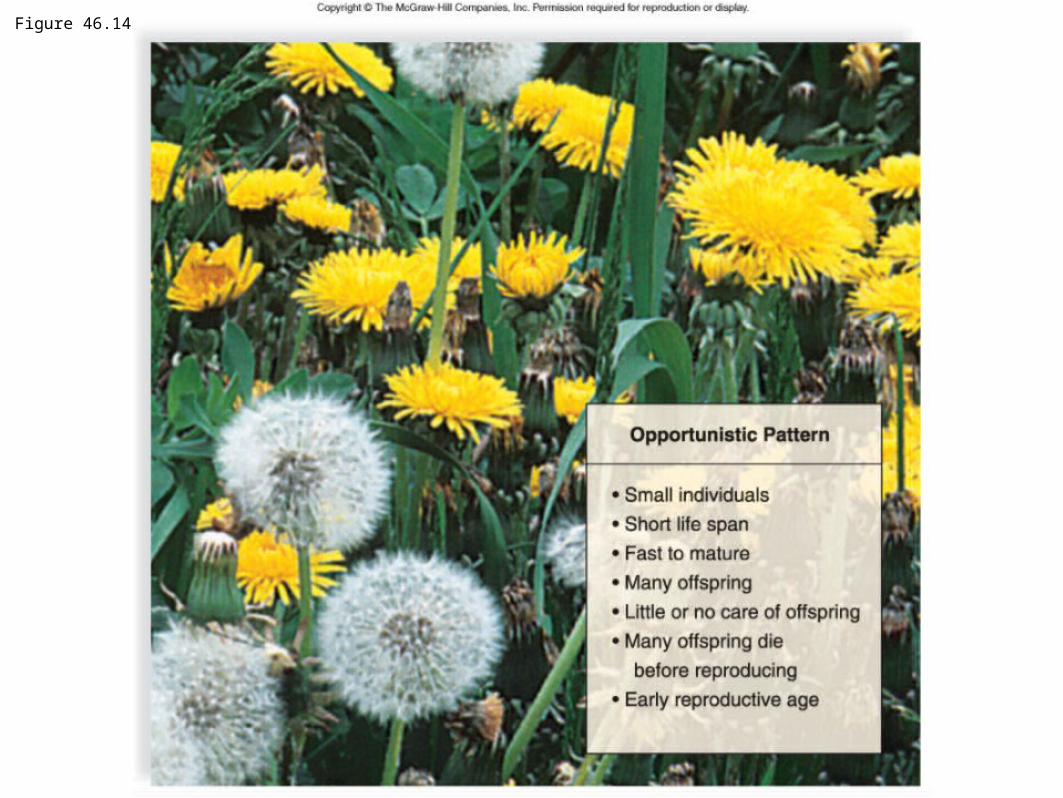
Figure 46.14a

Figure 46.14b

HUMAN POPULATION GROWTHCurrent World Population: 6.6 billion (and growing)
•Now in exponential part of a J-shaped growth curve.
•The doubling time is the length of time for a population size to double, now 53 years.
•Zero population growth is when the birthrate equals the death rate and the population size remains steady.

No other population of large organisms has shown such growth for so long.- Bubonic Plague 1300’s- Industrial Revolution 1800’s

Joseph Lister- 1864-66 the death rate of surgical patients was 45.7%- 1867-1870 death rate of surgical patients fell to 15% which the introduction of antiseptic

Figure 46.16