Embed Size (px)
Citation preview

ii
iii
PROGRAMME VI
APPLICATIONS OF MARINE CLIMATOLOGY 1 ORAL 1 (S1O1) ATTRIBUTION OF EXTREME EVENTS 1 (S1O2) TOWARDS THE DEVELOPMENT OF MARINE INDICES FOR RISK MANAGEMENT APPLICATIONS IN THE EASTERN PACIFIC REGION 2 (S1O3) ON THE DEVELOPMENT OF MARINE CLIMATE EXTREME INDICES 4 (S1O4) ADDED VALUES OF OCEANOGRAPHIC DATA FROM NODC AT NATIONAL LEVEL: SENEGAL CASE 5 (S1O5) DEVELOPMENT OF MARINE INTEGRATED DATA AND ANALYSIS SYSTEM (MIDAS) TO SUPPORT WEATHER AND CLIMATE SERVICES IN INDONESIA 6 (S1O6) EVIDENCE OF THE WALKER CIRCULATION SLOWDOWN OVER THE PAST SIX DECADES: IN SITU OBSERVATIONS, SST-‐FORCED AGCMS, AND REANALYSES 7 POSTER 8 (S1P1) STUDYING THE TEN YEARS VARIABILITY OF OCTOPUS VULGARIS IN SENEGALESE WATERS USING GENERALIZED ADDITIVE MODELS (GAMS) 8 (S1P2) SUITABILITY OF MARINE CLIMATOLOGY PRODUCTS FOR STUDIES IN FISHERIES AND MARINE ECOLOGY: THE CAGM/JCOMM JOINT TASK TEAM ON WEATHER CLIMATE AND FISHERIES 9
AIR - SEA INTERACTION 10 ORAL 10 (S2O1) SATELLITE-‐DERIVED NEAR-‐SURFACE AIR TEMPERATURE AND HUMIDITY: RECENT PROGRESS AND NEW VALIDATION 10 (S2O2) AN ANALYSIS OF FLUXES IN THE CONTEXT OF WEATHER REGIMES FROM SATELLITES AND BUOYS 11 (S2O3) SMALL SCALE VARIABILITY IN SSTS AND WINDS CAUSES A STRUCTURAL ERROR IN SURFACE FLUXES 12 (S2O4) MINIMIZING SAMPLING UNCERTAINTY IN VOS OBSERVATIONS AND ESTIMATION OF REGIONALLY INTEGRATED SURFACE TURBULENT FLUXES 13 (S2O5) SURFACE FLUXES FROM SAMOS 14 POSTER 15 (S2P1) BIASES IN QUIKSCAT SCATTEROMETER WIND SPEEDS DUE TO RAIN 15 (S2P2) THE NOCS SURFACE FLUX AND MARINE METEOROLOGICAL DATA SET: RECENT DEVELOPMENTS AND FUTURE PLANS 16 (S2P3) A COMPARISON OF SATELLITE-‐DERIVED GLOBAL MARINE SURFACE SPECIFIC HUMIDITY DATASETS 17 (S2P4) OCEANRAIN -‐ THE OCEANIC SHIPBOARD PRECIPITATION MEASUREMENT NETWORK FOR SURFACE VALIDATION 18
WAVES AND STORM SURGES 19 ORAL 19 (S3O1) TOWARDS A GLOBAL STORM SURGE CLIMATOLOGY 19 (S3O2) NUMERICAL SIMULATION OF STORM SURGES ASSOCIATED WITH SEVERE CYCLONES LANDFALLING PAKISTAN COAST DURING 1999-‐2010. 20 (S3O3) ADVANCING WAVE CLIMATOLOGY USING WIND WAVE THEORY 21 (S3O4) THE JCOMM EXTREME WAVE DATA SET 22 (S3O5) COWCLIP: THE COORDINATED OCEAN WAVE CLIMATE PROJECT -‐ QUANTIFYING UNCERTAINTY IN WIND-‐WAVE CLIMATE PROJECTIONS 23 (S3O6) THIRTY-‐YEAR WAVE HINDCAST USING THE CLIMATE FORECAST SYSTEM REANALYSIS WINDS 24 POSTER 25
iv
(S3P1) EXTREME WAVES IN BRITISH WATERS 25 (S3P2) FORCED MIGRATION AND OCEAN SURGES DISASTERS ALONG THE COASTLINE OF LAGOS, NIGERIA: LESSONS LEARNED FROM THIS EXTREME EVENTS. 26 (S3P3) CLIMATOLOGICAL ASPECT OF COASTAL FOG AND OCEAN SURGES IN THE CITY OF LAGOS, NIGERIA 27 (S3P4) SEA LEVEL CHANGES AND TIDE ALONG THE EAST AND WEST COAST OF THE RED SEA 28 (S3P5) LONG-‐RANGE (384-‐HOUR) OPERATIONAL WAVE MODEL FORECASTING SYSTEM AT THE MALAYSIAN METEOROLOGICAL DEPARTMENT 29 (S3P6) STORM SURGE MODELLING FOR HEAD OF THE BAY OF BENGAL 30
OCEANOGRAPHIC DATA 31 ORAL 31 (S4O2) IQUOD (INTERNATIONAL QUALITY CONTROLLED OCEAN DATABASE) -‐ AN INTERNATIONAL INITIATIVE TO DESIGN, DELIVER AND MAINTAIN A CLIMATE-‐STANDARD SUBSURFACE GLOBAL OCEAN TEMPERATURE (SALINITY) DATASET 31 (S4O3) THE WORLD OCEAN DATABASE -‐ PRESERVING AND DISSEMINATING OCEAN SUBSURFACE PROFILE DATA TO UNDERSTAND OUR CHANGING OCEANS. 32 (S4O4) THE NODC THERMOSALINOGRAPH STEWARDSHIP PROJECT 33 (S4O5) HADIOD AN INTEGRATED OCEAN DATABASE OF GLOBAL SURFACE AND SUBSURFACE TEMPERATURE AND SALINITY OBSERVATIONS FROM 1900-‐2010 34 POSTER 35 (S4P1) EN4 -‐ QUALITY CONTROLLED TEMPERATURE AND SALINITY PROFILES AND MONTHLY OBJECTIVE ANALYSES WITH UNCERTAINTY ESTIMATES 35
SURFACE TEMPERATURES 36 ORAL 36 (S5O1) UPGRADES OF EXTENDED RECONSTRUCTED SEA SURFACE TEMPERATURE VERSION 4 (ERSST.V4) 36 (S5O2) CENTENNIAL SST ANALYSIS AND ITS APPLICATION TO CLIMATE STUDIES 37 (S5O3) A NEW 1/4° SEA SURFACE TEMPERATURE CLIMATOLOGY BASED ON A BLENDED SATELLITE AND IN SITU ANALYSIS 38 (S5O4) VARIABILITY AND LONG TERM TREND OF SEA SURFACE TEMPERATURE OVER CHINA SEAS DERIVED FROM A NEW MERGED RECONSTRUCTION DATASET 39 (S5O5) RECENT PROGRESS IN SEA-‐SURFACE TEMPERATURE AT THE MET OFFICE HADLEY CENTRE 40 (S5O6) IMPROVED ERROR ESTIMATES FOR EXTENDED RECONSTRUCTED SST 41 (S5O7) THE INTERNATIONAL SURFACE TEMPERATURE INITIATIVE: UPDATE ON PROGRESS WITH LAND SURFACE TEMPERATURES 42 POSTER 43 (S5P1) PROGRESS TOWARDS A SLIGHTLY BIGGER HADSST ENSEMBLE 43 (S5P2) HISTORICAL OCEAN SURFACE TEMPERATURE: ACCURACY, CHARACTERISATION AND EVALULATION (HOSTACE) 44 (S5P3) DIURNAL SST VARIABILITY CHARACTERISED FROM DRIFTING BUOY DATA 46
CHARACTERISTICS OF THE OBSERVING SYSTEM(S) 47 ORAL 47 (S6O1) HOW LARGE ARE THE DIFFERENCES BETWEEN GLOBAL SST MEANS ESTIMATED FROM IN SITU AND SATELLITE DATA? 47 (S6O2) IMPACT OF OBSERVATIONAL SAMPLING ON OCEAN TEMPERATURE CHANGE ESTIMATION 48 (S6O3) OCEAN OBSERVATION PANEL FOR CLIMATE RELATED ACTIVITIES 49 (S6O4) THE ERA-‐CLIM PROJECT 50 (S6O5) ASSESSING THE HEALTH OF THE MARINE CLIMATE OBSERVING SYSTEM 51
v
DATA RECOVERY AND MANAGEMENT INITIATIVES 52 ORAL 52 (S7O1) ICOADS RELEASE 3.0: A MAJOR UPDATE TO THE HISTORICAL MARINE CLIMATE RECORD 52 (S7O2) ICOADS VALUE-‐ADDED DATABASE (IVAD) 54 (S7O3) THE NEW MARINE CLIMATE DATA SYSTEM 55 (S7O4) 20 YEARS OF GLOBAL COLLECTING CENTRES 56 (S7O5) THE JCOMM IN-‐SITU OBSERVING PROGRAMME SUPPORT CENTRE: ASSISTING IN PLANNING, IMPLEMENTING, AND OPERATING OCEAN OBSERVING SYSTEMS 57 (S7O6) THE CITATION CONTEXT OF ICOADS 58 (S7O7) (INTEGRATED) DATA GATHERING SYSTEMS FOR MARINE RENEWABLES 59 POSTER 60 (S7P1) THE GENEALOGY OF ICOADS 60 (S7P2) A NETWORK OF COASTAL TEMPERATURE AUTONOMOUS SENSORS IN THE NORTH OF THE GULF OF GUINEA: PROPAO/JEAI 61
QUALITY CONTROL 62 ORAL 62 (S8O1) HIGH LEVEL QUALITY CONTROL STANDARD FOR MARINE ATMOSPHERIC DATA 62 (S8O2) FOLLOWING A MOVING SHIP -‐ A PROBABILISTIC APPROACH FOR SHIP TRACKING MODELS63 (S8O3) IN SITU SST QUALITY MONITOR (IQUAM) VERSION 2 64 (S8O4) THE USAGE OF MARINE SURFACE DATA IN THE ERA-‐20C REANALYSIS 65 POSTER 66 (S8P1) IMPROVED CLOUD INFORMATION IN ICOADS 66 (S8P2) QUALITY CONTROL OF METEOROLOGICAL DATA FROM OFFSHORE PLATFORMS 67
IVAD PROGRESS WORKSHOP 68
vi
PROGRAMME Time slot Monday Tuesday Wednesday Thursday Friday
08:30 -‐ 09:00 Registration Coffee
09:00 -‐ 09:10
Logistics / welcome
S3O1 (Horsburgh)
S5O1 (Huang)
S7O1 (Freeman)
IVAD01
09:10 -‐ 09:20
09:20 -‐ 09:30
09:30 -‐ 09:40 S3O2 (Sarfaraz)
S5O2 (Ishii) S7O2
(Smith) 09:40 -‐ 09:50
09:50 -‐ 10:00 S3O3 (Grigorieva)
S5O3 (Banzon) 10:00 -‐ 10:10
S1O1 (Peterson)
S7O3 (Rosenhagen) IVAD02 10:10 -‐ 10:20 S3O4
(Swail) S5O4 (Mu) 10:20 -‐ 10:30
10:30 -‐ 10:40 BREAK BREAK
10:40 -‐ 10:50
10:50 -‐ 11:00 S1O2
(Martinez)
S3O5
(Wang)
S5O5
(Kennedy)
S7O4 (Cunningham)
IVAD02 11:00 -‐ 11:10
11:10 -‐ 11:20 S7O5 (Stroker) 11:20 -‐ 11:30 S1O4
(Diallo) S3O6
(Spindler) S5O6 (Smith) 11:30 -‐ 11:40 S7O6
(Weber) IVAD03
11:40 -‐ 11:50 S1O5 (Riama)
S1O3 (Wang)
S5O7
(Thorne) 11:50 -‐ 12:00 S7O7
(Lawrence) 12:00 -‐ 12:10 S1O6 (Tokinaga)
Lunch 12:10 -‐ 12:20
Lunch Lunch Lunch 12:20
Lunch
13:10 13:20
IVAD04
13:20 -‐ 13:30
Posters
Posters Posters 13:30 -‐ 13:40
13:40 -‐ 13:50
13:50 -‐ 14:00
14:00 -‐ 14:10 S2O1
(Jackson)
S6O1 (Kaplan) S8O1
(Rosenhagen) 14:10 -‐ 14:20
14:20 -‐ 14:30 S4O2 (Cowley)
S6O2 (Good) 14:30 -‐ 14:40 S2O2
(Clayson) S8O2
(Carella) 14:40 -‐ 14:50 S4O3 (Boyer)
S6O3 (Bourassa)
14:50 -‐ 15:00 S2O3 (Bourassa)
S8O3 (Ignatov) 15:00 -‐ 15:10
BREAK 15:10 -‐ 15:20
BREAK S804
(Hersbach) 15:20 -‐ 15:30
IVAD04 15:30 -‐ 15:40 S2O4
(Gulev) S4O4 (Byrne)
S6O4 (Hersbach) BREAK 15:40 -‐ 15:50
15:50 -‐ 16:00 S2O5 (Smith)
S4O5 (Kennedy)
S6O5 (Berry) 16:00 -‐ 16:10
Wrap up / close IVAD05 16:10 -‐ 16:20 Plenary 1 Plenary 2 Plenary 3
16:20 -‐ 17:30
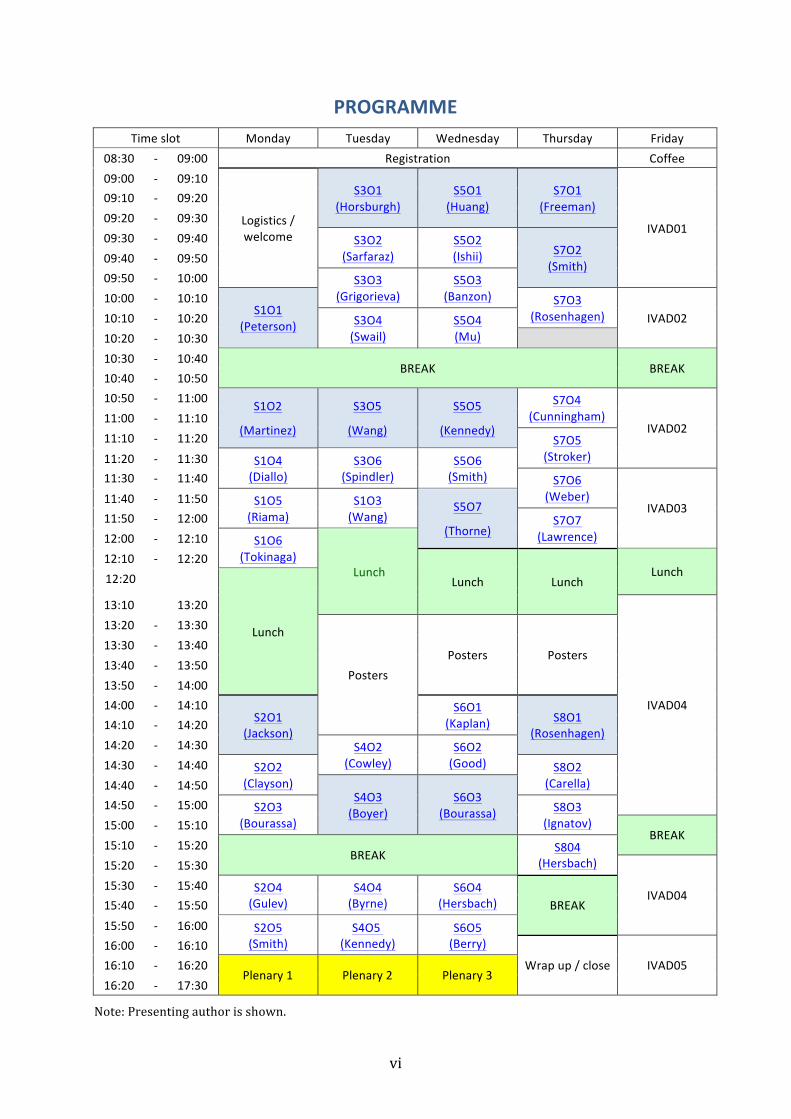
Note: Presenting author is shown.
vii
Session Topic
Invited / keynote
Session 1 Applications of marine climatology Break
Session 2 Air – sea interaction Plenary
Session 3 Waves and storm surges
Session 4 Oceanographic data
Session 5 Surface temperatures
Session 6 Characteristics of the observing system(s)
Session 7 Data recovery and management initiatives
Session 8 Quality control
IVAD01 IVAD Progress
IVAD02 IVAD Discussion
IVAD03 UID Management
IVAD04 IMMA Format
IVAD05 IVAD Admin.
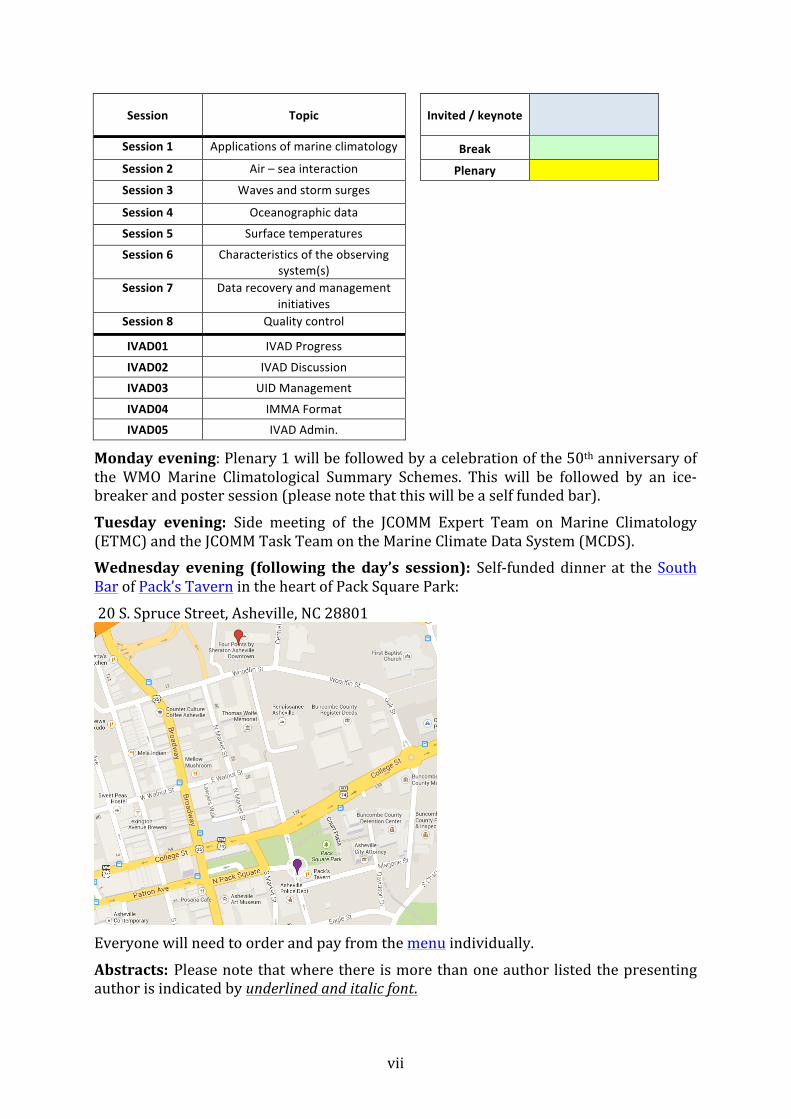
Monday evening: Plenary 1 will be followed by a celebration of the 50th anniversary of the WMO Marine Climatological Summary Schemes. This will be followed by an ice-‐breaker and poster session (please note that this will be a self funded bar). Tuesday evening: Side meeting of the JCOMM Expert Team on Marine Climatology (ETMC) and the JCOMM Task Team on the Marine Climate Data System (MCDS). Wednesday evening (following the day’s session): Self-‐funded dinner at the South Bar of Pack’s Tavern in the heart of Pack Square Park: 20 S. Spruce Street, Asheville, NC 28801
Everyone will need to order and pay from the menu individually. Abstracts: Please note that where there is more than one author listed the presenting author is indicated by underlined and italic font.

viii
1
APPLICATIONS OF MARINE CLIMATOLOGY
ORAL
(S1O1) ATTRIBUTION OF EXTREME EVENTS Thomas C. Peterson
National Climatic Data Center, Asheville, USA
This September the Bulletin of the American Meteorological Society is scheduled to publish the third annual paper explaining extreme events of the previous year from a climate perspective. Event attribution in near-‐real time is cutting edge science that the report attempts to foster by publishing short contributions from author teams from around the world. This presentation will give a brief history of attribution science followed by a series of example event attribution analyses published in this report. The interactions between the ocean and the atmosphere are the focus of many of the analyses and provide insights into potential future event attribution papers that focus solely on oceanic events.
Session 1: Applications of marine climatology (Invited oral presentation)
2
(S1O2) TOWARDS THE DEVELOPMENT OF MARINE INDICES FOR RISK MANAGEMENT APPLICATIONS IN THE EASTERN PACIFIC REGION
Rodney Martínez
CIIFEN Scientific Coordinator
WMO-‐CCl OPACE IV Co-‐Chair
WCRP-‐JSC Member
The World Meteorological Organization (WMO) and partnering agencies are together implementing the Global Framework for Climate Services (GFCS), with the intent to ‘enable better management of the risks of climate variability and change and adaptation to climate change, through the development and incorporation of science-‐based climate information and prediction into planning, policy and practice on the global, regional and national scale. As part of continuous effort of WMO-‐CCl with the ETCCDI, a lot of progress on climate indices has been achieved with a wide coverage around the world. In the case of South America a recent and comprehensive extremes analysis has been achieved (Skansi et al, 2013). This effort was supported by WMO with the active participation of NMHSs from South America, regional organizations as CIIFEN and climate experts outside the region. Subsequently an important progress is being done regarding the design and implementation of Climate Risk and Sector-‐specific Climate Indices. A pilot workshop was held in Guayaquil Ecuador in March, 2013 with the support of WMO and action Plan was established towards the implementation of specific indices relevant for priority sectors such as agriculture, water and health. Despite all this progress on climate indices and applications, a lot of gaps on Marine Indices is clearly evidenced in some regions around the world. These gaps become critical in some such as the Eastern Pacific, where during the last decade, the uncertainty related with ENSO teleconnections and impacts has increased. Several recent research papers, suggest a decreased ENSO predictability which affects directly to regional and national risk management systems with significant social and economic impacts. In other side, NMHSs from all Latin America are implemented seasonal forecasting (in operational and/or experimental mode ) with a remarkable progress on the implementation of statistical methods which are strongly dependent of ocean variables and indices. The experience on statistical seasonal forecasting suggests the need to design more targeted Marine indices for more specific spatial dominions along coastal zones or particular ocean areas different to the traditional NIÑO regions. While a lot of progress has been achieved on climate data management along the Eastern Pacific countries during the recent years. Ocean data management and further process to derive marine indices for multiple purposes is clearly behind while is becoming critically necessary. Considering the successful previous processes followed with climate indices is proposed to implement a regional approach to enhance marine indices for risk management applications in the Eastern Pacific region.
3
The potential applications of this marine indices are: - Marine ecosystems management - Fisheries and maritime transportation issues (ports planning, etc) - ENSO local impacts studies and associated coastal risk management. - Integrated assessment of the impacts of the marine environmental change
(warming, acidification, sea level rise) associated to global warming and climate change for adaptation in coastal zones and assessment on large marine ecosystems.
- Hazards assessment and risk management related to extreme waves, storm surges, and storm tides.
The potential contribution for physical processes research and understanding are:
- Decadal variability detection in South-‐eastern Pacific - Upwelling - Surface Circulation patterns
The workshop will provide a good platform to join oceanographic and meteorological community in this region and enhance potential linkages with JCOMM, the Ocean Observation Panel for Climate, CLIVAR, IOC-‐IODE and others. CIIFEN is interested to share with the Marine Climatology community, these aideas to receive valuable contributios to define the priorities, data sets to be shared, processed and work together in the design of specific indices that can be implemented through a one year action plan in close coordination with WMO and regional coordination at CIIFEN.
Session 1: Applications of marine climatology (Invited oral presentation)(S1O2)
4
(S1O3) ON THE DEVELOPMENT OF MARINE CLIMATE EXTREME INDICES Xiaolan L. Wang1, Kevin Horsburgh2, Val R. Swail1, and Scott Woodruff3
1) Climate Research Division, Environment Canada, Toronto, ON
2) National Oceanography Centre, Liverpool, UK
3) Cooperative Institute for Research in Environmental Sciences & National Climatic Data Center, Boulder, CO
This presentation aims to stimulate a discussion on the development of impacts-‐relevant marine climate extreme indices (MarClimEX), in the context of the joint WMO CCl (Commission for Climatology)-‐CLIVAR-‐JCOMM Expert Team on Climate Change Detection and Indices (ETCCDI). Over the recent decade or so, the ETCCDI has developed a set of extreme indices for precipitation (PRCP) and surface air temperature (SAT) over land, using in situ PRCP and SAT observations. As its contribution to the ETCCDI activities, JCOMM aims to develop and operationalize (as practical) a set of impacts-‐relevant marine climate extreme indices, thereby expanding the coverage of existing ETCCDI extreme indices to selected near-‐coastal and open-‐ocean areas. We have compiled a list of marine climate extreme indices that we think we can develop using the in situ data (e.g. wave buoy measurements and ICOADS products) currently available. We would like to finalize this set of marine extreme indices with the help of community consensus.
Session 1: Applications of marine climatology (Oral presentation)(S1O3)
5
(S1O4) ADDED VALUES OF OCEANOGRAPHIC DATA FROM NODC AT NATIONAL LEVEL: SENEGAL CASE
Mr. Anis Diallo
Senegal NODC, Data Manager, CRODT BP. 2241 Dakar, Senegal
Oceanographic data from different sources (coastal stations, satellites, fixed and drifting buoys, etc.,), allow us to understand the state of the sea , its evolution and its impact on human activities. The historical series databases promote their recovery, providing products and services to different end users for the purposes of good management, sustainable use, risk prevention as coastal erosion and natural disasters. Senegal with databases since 1911 through scientific publications, characterize ocean dynamics and water mass circulation in its continental shelf. Mainly the understanding of coastal upwelling which is the main source of trophic enrichment of the sea and the variability of the resource in relation to the environment. Achieving maps of decadal temperature allows fishermen to identify the thermocline and streamline their research time for tuna fish. Development of data and databases has enabled the establishment of outfall sewage at sea (Hann Bay depollution), expansion of access channel of a new ship terminal in the port of Dakar. This has allowed the Autonomous Port of Dakar (PAD), an increase of 15% of its capacity. Conducting marine and coastal atlas as a tool for decision making allows both the rational management of resources, identification of vulnerable areas to erosion and oil pollution along Senegalese coastline. The usefulness of these data and databases on the marine environment is well understood and has been strengthened by the commissioning of three coastal stations by the National Agency of Meteorology (ANACIM) in collaboration with the World Meteorological Organization (WMO).
Session 1: Applications of marine climatology (Oral presentation)(S1O4)
6
(S1O5) DEVELOPMENT OF MARINE INTEGRATED DATA AND ANALYSIS SYSTEM (MIDAS) TO SUPPORT WEATHER AND CLIMATE SERVICES IN
INDONESIA A.E Sakya, W. Sulistya, Nurhayati, N.F. Riama, Marjuki, D. Amrina
Indonesia Agency for Meteorology, Climatology and Geophysics ( BMKG), Indonesia
Indonesia is a country with large areas consists of sea that influences its weather and climate phenomena. Indonesian is flanked by two oceans, Indian and Pacific. Couple interactions of ocean-‐atmosphere consider influencing climate variability in Indonesia. Many driving factors such as the Asian -‐ Australian Monsoon, Dipole Mode Index (DMI), SST , MJO, El Nino and La Nina also contribute to climate variability in Indonesia. El Nino events often related to drought phenomena while La Nina causes to wet condition for several areas in the country. Indonesia also located in maritime traffics crossing and important for sea transportation. Therefore, integrated data and information is needed to support maritime early warning and climate related to transportation safety and understanding the weather and climate phenomena. Starting from 2013, Indonesian Agency for Meteorology, Climatology and Geophysics (BMKG) as a government agency who responsible to provide weather and climate information has strengthened the capabilities to produce the marine weather and climate information. BMKG has held several Focus Group Discussions (FGDs) together with relevant Indonesian agencies to concern on developing of MIDAS (Marine Integrated Data and Analysis System) as marine information portal for weather and climate. In fact, lots of information related to weather and climate in the Indonesian sea scattered among different agencies. MIDAS intends to collect all the data and information in one system to simplify user and stakeholders to get the data and information.
Session 1: Applications of marine climatology (Oral presentation)(S1O5)
7
(S1O6) EVIDENCE OF THE WALKER CIRCULATION SLOWDOWN OVER THE PAST SIX DECADES: IN SITU OBSERVATIONS, SST-‐FORCED AGCMS,
AND REANALYSES Hiroki Tokinaga1,2, Shang-‐Ping Xie1,3, Clara Deser4, Yu Kosaka3, and Yuko M.
Okumura5
1) International Pacific Research Center, University of Hawaii, USA
2) Disaster Prevention Research Institute, Kyoto University, Japan
3) Scripps Institution of Oceanography, University of California at San Diego, USA
4) National Center for Atmospheric Research, USA
5) Institute for Geophysics, The University of Texas at Austin, USA
It remains challenging to identify physically consistent patterns of climate change from observations because of limited samplings, changes in observational practice, and biases between measurement methods. Especially the Walker circulation change and SST warming patterns during the twentieth century are still controversial, depending on data sets used for trend analyses. Here we present a successful case of detecting the Walker circulation change since the 1950s, synthesizing in situ observations from ICOADS and AGCMs forced by various SST data sets. Our bias-‐corrected surface wind dataset, Wave-‐ and Anemometer-‐based Sea Surface Wind (WASWind), displays westerly trends over the western tropical Pacific and easterly trends over the tropical Indian Ocean, indicative of a slowdown of the Walker circulation. This pattern of wind change is consistent with that of observed SLP change showing positive (negative) trends over the Maritime Continent (the central equatorial Pacific). The ICOADS cloudiness change also suggests an eastward shift of atmospheric deep convection from the Maritime Continent to the central equatorial Pacific, consistent with a decreased land rainfall over the Maritime Continent. Whereas results from major SST reconstructions show no significant change in zonal gradient in the tropical Indo-‐Pacific, both bucket-‐sampled SSTs and nighttime marine air temperatures (NMAT) show a weakening of the zonal gradient. AGCM experiments with this trend pattern robustly simulate the observed weakening of the Walker circulation, including weakened northeast trades and the eastward shift of atmospheric convection. Comparison with reanalysis products will be also presented.
Session 1: Applications of marine climatology (Oral presentation)(S1O6)
8
POSTER
(S1P1) STUDYING THE TEN YEARS VARIABILITY OF OCTOPUS VULGARIS IN SENEGALESE WATERS USING GENERALIZED ADDITIVE MODELS
(GAMS) Ousmane Diankha1, Modou Thiaw2, Bamol Ali Sow3, Amadou Thierno Gaye1
1) Laboratoire de Physique de l'Atmosphère et de l'Océan Siméon Fongang (LPAO-‐SF/ESP-‐UCAD, Sénégal), BP 5085 Dakar Fann
2) Centre de Recherche Océanographique de Dakar-‐Thiaroye (CRODT, ISRA Sénégal)
3) Laboratoire d'Océanographie, des Sciences de l'Environnement et du Climat (LOSEC) Département de Physique -‐ UFR Sciences & Technologies -‐ Université de
Ziguinchor BP 523 Ziguinchor -‐ Sénégal
The Eastern Boundary Systems are known for their seasonal and interannual fluctuations and their key biological and socio-‐economical roles. This variability could have consequences for marine resources, particularly on short lived species such as octopus vulgaris. In their principal fishing area, south of Mbour, Octopus vulgaris show high interannual variability. It have been attempted to relate octopus abundance to environmental factors using simple linear regression methods. However, the precision of such models is still unclear due to the non-‐linear character of the relationships. In this work we applied generalized additive models (GAMs), nonparametric generalization of multiple linear regression, to investigate ten years (1996-‐2005) variability of octopus recruitment in the Senegalese waters. The semi-‐parametric smooth function and Gamma distribution were used to build the models. The variables included in the models are sea surface temperature (SST), sea surface height deviation (SSHD) and time (Month). The present results illustrate that GAMs are more useful and reliable in investigating the complex relationships between octopus recruitment and the environmental and temporal variables than classical regression techniques. Our study suggested that high octopus recruitment occurred at specific time, temperature and sea surface height deviation. This work also showed that variability of octopus recruitment could be explained by SST and its combination with month even if the effects of SSHD is not to be ignored.
Session 1: Applications of marine climatology (Poster presentation)(S1P1)
9
(S1P2) SUITABILITY OF MARINE CLIMATOLOGY PRODUCTS FOR STUDIES IN FISHERIES AND MARINE ECOLOGY: THE CAGM/JCOMM
JOINT TASK TEAM ON WEATHER CLIMATE AND FISHERIES Karen Evans1, Catherine Marzin2, Jim Salinger3, and Scott Woodruff4,5
1) CSIRO Marine and Atmospheric Research, Tasmania
2) NOAA National Marine Sanctuary Program, USA
3) IBIMET-‐CNR, Rome, italy
4) Cooperative Institute for Research in Environmental Sciences, USA
5) NOAA National Climatic Data Center, USA
The World Meteorological Organisation (WMO) Commission for Agricultural Meteorology (CAgM) and the WMO-‐Intergovernmental Oceanographic Commission (IOC) Joint Commission for Oceanography and Marine Meteorology (JCOMM) established a joint Task Team on Weather Climate and Fisheries (TT-‐WCF) in 2013. The primary objective of the TT-‐WCF is to assess the likely impacts of climate variability and change on oceanic fisheries with a particular focus on Pacific Island countries and territories, as a pathway to assisting in the improved management of these resources. Amongst its terms of reference (which CAgM will be reviewing and re-‐endorsing at its intergovernmental meeting in April 2014), the TT-‐WCF has been tasked with: (i) reviewing the current data collection by JCOMM and others, to assess how these data meet the current needs of ecosystem-‐based approaches to fisheries management (EBFM) and as appropriate, work with other JCOMM expert teams to develop climate services for fisheries based on the available marine climate data; and (ii) encourage and assist fisheries management organizations to inform their members about the advantages of making and reporting relevant marine meteorological and ocean observations to the various WMO/IOC observation and information systems. Here we discuss the suitability of the current JCOMM data collection for use within the context of EBFM and what steps might be considered in developing reporting and distribution networks for fishery industry based data collection. Similar perspectives for the management of marine protected areas regarding the suitability of JCOMM observational data, and derived marine climatology products, will also be considered.
Session 1: Applications of marine climatology (Poster presentation)(S1P2)
10
AIR -‐ SEA INTERACTION
ORAL
(S2O1) SATELLITE-‐DERIVED NEAR-‐SURFACE AIR TEMPERATURE AND HUMIDITY: RECENT PROGRESS AND NEW VALIDATION
Gary A. Wick1 and Darren L. Jackson2
1) NOAA ESRL/PSD
2) CIRES, University of Colorado
Satellite-‐derived estimates of the air-‐sea heat flux are a key dataset for global studies of air-‐sea interaction. Significant work is continuing to evaluate the accuracy of the satellite-‐derived products, particularly in the presence of storms and extreme weather events. The greatest source of uncertainty in satellite-‐derived turbulent heat fluxes is the indirect estimates of the near-‐surface air temperature (Ta) and specific humidity (qa). Our group has recently developed improved satellite-‐derived Ta and qa products through the merging of microwave imager and sounder data and other colleagues have pursued improved retrievals through neural network approaches. This presentation describes recent refinements to these products and a new independent validation using aircraft-‐deployed dropsonde data. Recent refinements to our products have included regional corrections based on anomalous stability conditions, use of independent sea surface temperature data, and use of new inter-‐satellite calibrated brightness temperature inputs. The impact of these changes on the estimated accuracy and coverage of the Ta and qa products as well as the derived fluxes is presented. Product validation, particularly in severe environmental conditions, has been limited by the availability of direct observations from research vessels and ships-‐of-‐opportunity. An independent validation source that has not yet been utilized is dropsondes deployed from operational NOAA aircraft and in new unmanned aircraft experiments. The data provide high vertical resolution measurements of the air temperature and humidity down to the surface in locations that might not otherwise be sampled by surface vessels. Satellite-‐based retrievals of Ta and qa are compared with these observations with a focus on regions of tropical and mid-‐latitude storms. Corresponding air-‐sea heat flux estimates in these environments are shown along with comparison against other coincident aircraft observations.
Session 2: Air -‐ sea interaction (Invited oral presentation)(S2O1)
11
(S2O2) AN ANALYSIS OF FLUXES IN THE CONTEXT OF WEATHER REGIMES FROM SATELLITES AND BUOYS
Carol Anne Clayson
Woods Hole Oceanographic Institution
In order to understand how the climate responds to variations in forcing, one necessary component is to understand the full distribution of variability of exchanges of heat and moisture between the atmosphere and ocean. These fluxes play an important role in the generation and decay of important coupled air-‐sea phenomena. These mechanisms operate across a number of scales and contain significant contributions from interactions between the anomalous (i.e. non-‐mean), often extreme-‐valued, flux components. In this work we are pursuing an integrated approach towards determining the air-‐sea interaction through the surface fluxes of heat and moisture on a variety of spatial and temporal scales, using a combination of satellite data sets . We will present results of our analyses looking at the flux distributions and the associated surface components. Using clustering methods and joint distributions we will show results of the fluxes categorized as weather states, and compare with results from various ocean sites buoys. We will present these results in the context of differing ocean basins and climate regimes.
Session 2: Air -‐ sea interaction (Oral presentation)(S2O2)
12
(S2O3) SMALL SCALE VARIABILITY IN SSTS AND WINDS CAUSES A STRUCTURAL ERROR IN SURFACE FLUXES
Mark Bourassa
Center for Ocean-‐Atmospheric Prediction Studies (COAPS) and Department of Earth, Ocean and Atmospheric Science, Florida State University
Variability in SSTs and air-‐sea temperature differences cause changes in the surface wind. The combination results in changes in surface fluxes. The influence of small spatial scale SST gradients on fluxes modeled will be shown. These are non-‐linear processes that lead to a small bias in the surface energy fluxes, and also cause a large change in the upwelling. Variability on these scales is missing in most NWP and ship-‐based products: residuals in energy budgets are inevitable unless the unresolved variability is parameterized.
Session 2: Air -‐ sea interaction (Oral presentation)(S2O3)
13
(S2O4) MINIMIZING SAMPLING UNCERTAINTY IN VOS OBSERVATIONS AND ESTIMATION OF REGIONALLY INTEGRATED SURFACE TURBULENT
FLUXES Sergey K. Gulev, Natalia Tilinina, Konstantin Belyaev
P. P. Shirshov Institute of Oceanology, Russian Academy of Sciences, Moscow State University, Moscow, Russia
Surface turbulent fluxes derived from the VOS data are influenced by sampling biases whose magnitude may amount to several tens of W/m2 in poorly sampled mid-‐latitudinal and sub-‐polar regions of both hemispheres. Sampling uncertainties seriously affect estimates of regional energy balances and extreme surface fluxes and may also affect characteristics of climate variability in surface fluxes, as they have typically time dependent nature. We suggest a statistical approach for minimizing sampling uncertainties in VOS-‐based surface turbulent fluxes. An approach is based on approximation of probability distribution of surface turbulent moisture and heat fluxes by the modified Fisher-‐Tippett (MFT) distribution. This could be applied in either 1-‐dimensional case (for approximation of distribution of turbulent fluxes themselves) or in 2-‐dimensional case along with Weibull distribution (for approximation of distributions of surface moisture and temperature gradients and surface winds, i.e. state
Session 2: Air -‐ sea interaction (Oral presentation)(S2O4)
14
(S2O5) SURFACE FLUXES FROM SAMOS Shawn R. Smith1, Mark A. Bourassa1, 2, and Nicolas Lopez1
1) Center for Ocean-‐Atmospheric Prediction Studies, Florida State University, Tallahassee, USA
2) Earth, Ocean, & Atmospheric Science Department, Florida State University, Tallahassee, USA
Development of a new surface flux dataset based on underway meteorological observations from research vessels will be presented. The Florida State University routinely acquires, quality controls (QC), and distributes surface meteorological and oceanographic observations from ~30 research vessels. These activities are coordinated by the Shipboard Automated Meteorological and Oceanographic System (SAMOS) initiative in partnership with the Rolling Deck to Repository (R2R) project. The SAMOS data center is producing bulk flux estimates using 1-‐min sampling interval observations from each vessel along individual cruise tracks. A description of this new flux product, along with the underlying QC procedures applied to SAMOS observations, will be provided. We will describe the bulk flux algorithms that have been applied to the observations and the choices of constants that are used. Spatial and temporal coverage of preliminary fluxes and their variability will be described.
Session 2: Air -‐ sea interaction (Oral presentation)(S2O5)
15
POSTER
(S2P1) BIASES IN QUIKSCAT SCATTEROMETER WIND SPEEDS DUE TO RAIN
Susanne Fangohr1 and Elizabeth Kent2
1) University of Southampton, UK
2) National Oceanography Centre, Southampton, UK
Wind measurements by scatterometers operating at 13.4 GHz (Ku-‐band) such as QuikSCAT (QS) and the Ocean Scatterometer (OSCAT) are strongly affected by rain. A variety of rain flags is provided with the satellite datasets but little information is given with respect to the biases introduced by each of the flags or their relative performance. We compare high-‐resolution wind and rain data from the tropical buoy arrays with QS data during 2008. The number of flagged data points varies from 7% to 18% between the satellite flags and wind speed discrepancy between QS and buoys for flagged data varies from ~1 m/s to 5 m/s. One of the flags is derived from non-‐simultaneous radiometer measurements but is only available in 65% of the cases globally when QS/radiometer collocations are within 60 minutes. However, whilst closer collocation significantly improves the performance of the flag it limits data volume further to 15% availability at 10 min collocation.
Session 2: Air -‐ sea interaction (Poster presentation)(S2P1)
16
(S2P2) THE NOCS SURFACE FLUX AND MARINE METEOROLOGICAL DATA SET: RECENT DEVELOPMENTS AND FUTURE PLANS
Louise Jenkins, David I. Berry and Elizabeth C. Kent
National Oceanography Centre
Version 2 of the NOCS Surface Flux and Marine Meteorological Data Set (NOCS2.0) has been widely used in studies ranging from quantifying recent climate change to forcing ocean models and validating satellite data. In this poster we present an update on the status of the NOCS2.0 dataset, including recent developments, future plans and contributions towards ICOADS and IVAD.
Session 2: Air -‐ sea interaction (Poster presentation)(S2P2)
17
(S2P3) A COMPARISON OF SATELLITE-‐DERIVED GLOBAL MARINE SURFACE SPECIFIC HUMIDITY DATASETS
John Prytherch1, Elizabeth C. Kent2, Susanne Fangohr3 and David I. Berry2
1) University of Leeds, UK
2) National Oceanography Centre, Southampton, UK
3) University of Southampton, UK
Observations of near-‐surface humidity over the oceans are needed for climate and air-‐sea interaction applications. Observations from ships have been used to generate fields of near surface specific humidity (qa) in datasets based on observations archived in the International Comprehensive Ocean-‐Atmosphere Data Set (ICOADS). Such in situ-‐based humidity datasets have been produced by the University of Wisconsin at Milwaukee, by the UK National Oceanography Centre (NOC), and by the Centre for Ocean-‐Atmosphere Prediction Studies at the Florida State University. These datasets provide long time series estimates of qa, but are compromised by poor sampling in some regions, especially in the Southern Hemisphere. Using satellite observations to provide wider coverage for qa would therefore be extremely valuable. Satellite-‐based microwave sensors, such as the Special Sensor Microwave Imager (SSM/I), have provided a means to retrieve qa since the 1980s. Seven publically available satellite measurement-‐derived monthly mean humidity datasets are compared with one another and with in situ qa from the NOC Surface Flux and Meteorological dataset. The datasets are shown to be markedly different in terms of their large-‐scale means, and their smaller-‐scale spatial and temporal structure Differences show a range of yearly, global mean qa of ~ 1 g kg-‐1. Comparison of the datasets derived using the same satellite measurements of brightness temperature reveals differences in qa that depend on the source of satellite data; the processing and quality control applied to the data; and the algorithm used to derive qa from the satellite measurements of brightness temperature. Regional differences between satellite-‐derived qa due to the choice of input data, quality control, and retrieval algorithm can all exceed the accuracy requirements for surface flux calculation of ~ 0.3 g kg-‐1 and can be several g kg-‐1 in monthly means for some periods and regions.
Session 2: Air -‐ sea interaction (Poster presentation)(S2P3)
18
(S2P4) OCEANRAIN -‐ THE OCEANIC SHIPBOARD PRECIPITATION MEASUREMENT NETWORK FOR SURFACE VALIDATION
Christian Klepp
University of Hamburg
Systematic high quality oceanic in-‐situ precipitation measurements are requested on an international science level and are essential for improved understanding and validation of hydrological processes in satellite, re-‐analysis and model data. OceanRAIN, the shipboard “Ocean Rainfall And Ice-‐phase precipitation measurement Network” for surface validation is to date the only systematic long-‐term disdrometer-‐based oceanic shipboard precipitation data collection effort to establish a comprehensive statistical basis of precipitation for all climate related hotspots over the global oceans. OceanRAIN utilizes automated disdrometer systems (ODM470) capable of measuring precipitation occurrence, intensity and accumulation through minute-‐based particle size distributions discriminated for rain, snow and mixed-‐phase precipitation. The ODM470 was especially designed for shipboard operation under high and frequently varying wind speeds and rough sea states. This paper describes the content, instruments, algorithms, methodology and data products of OceanRAIN. The procedure of the data processing chain is outlined, including calibration, shipboard operation, data acquisition and quality control. The selected research ships do not circumvent high impact weather, allowing for a collection of the full precipitation spectrum including extremes. The fast growing OceanRAIN data base comprises to date more than 370 000 minutes of precipitation measurements equivalent to more than seven ship years since its start in 2010. OceanRAIN aims at increasing knowledge about oceanic precipitation, improving error characterization of GPM (Global Precipitation Measurement) era precipitation retrievals, adding to the continual improvement of the satellite retrieval algorithms, as well as benchmarking existing satellite-‐based climatologies, re-‐analysis and model data. The accumulating data volume can be utilized for statistical and process study applications on different temporal and spatial scales, microphysical studies of rain and snow formation, and yields insight to the point-‐to-‐area problem of precipitation.
Session 2: Air -‐ sea interaction (Poster presentation)(S2P4)
19
WAVES AND STORM SURGES
ORAL
(S3O1) TOWARDS A GLOBAL STORM SURGE CLIMATOLOGY Kevin Horsburgh, Robert Proctor, Jane WIlliams
National Oceanography Centre, Liverpool, UK
Coastal flooding represents one of the major challenges of climate change for humanity, with mean sea-‐level rising over the coming centuries as well as the potential for changes in storm surge and wave climate. It is estimated that in 2005, in the largest 136 coastal cities, there were 40 million people and $3,000 billion of assets exposed to a 1 in 100 year flood event. These figures are projected to rise to approximately 150 million people and $35,000 billion of assets by 2070. The most high profile and high impact examples of coastal flooding occur when large storm events coincide with tidal high water. To protect people and assets, engineers and planners require the best statistical description of extreme sea levels globally, and this in turn demands a methodically obtained climatology of storm surges combined with the most up to date joint probability methods. This presentation introduces a project that moves sequentially towards a global climatology of storm surges. The project is managed by the IOC/WMO Joint Commission for Oceanography and Marine Meteorology (JCOMM) expert team on waves and coastal hazards (ETWCH). We present analysis of tide gauge data from sites around the UK and the Netherlands that delivers the necessary baseline statistical information on observed storm surges. We emphasise the correct method for isolating the actual storm surge from spurious residual sea levels caused by tide-‐surge interactions. The methodology and the summary statistics can easily be adopted by other national agencies. Finally we present plans to use a global tide-‐surge model to extend the statistical description of storm surges into a coherent global picture, ultimately incorporating surges from tropical cyclones. This will provide the basis of robust assessments of vulnerability that will benefit disaster and risk reduction agencies, and will assist governments worldwide in setting out plans for mitigating coastal flood risk in the face of rising sea levels.
Session 3: Waves and storm surges (Invited oral presentation)(S3O1)
20
(S3O2) NUMERICAL SIMULATION OF STORM SURGES ASSOCIATED WITH SEVERE CYCLONES LANDFALLING PAKISTAN COAST DURING
1999-‐2010. S. Sarfaraz1 and S. K. Dube2
1) Pakistan Meteorological Department
2) Centre for Atmospheric Sciences, Indian Institute of Technology, New Delhi, India
A tropical cyclone is one of the most powerful and destructive weather phenomena that cause heavy loss of human lives and property around the world. The human population inhabiting the coastal regions is vulnerable to the wrath of this violent weather event and under the influence of the changing climate scenario this vulnerability has become an enhanced threat now. The impact of tropical cyclones is three-‐pronged -‐ the torrential rain, strong ravaging winds and storm surges with storm surge being the cause of highest death toll out of these three. The North Indian Ocean (NIO) rim countries having high population density are exposed to more pronounced threat than anywhere else. Hence an increase and/or decrease in the tropical cyclones formation frequency and intensity are directly linked with the safety of millions of people residing along the NIO coast. In this study the simulations of storm surges, generated by the severe tropical cyclones which developed in the Arabian Sea and crossed Pakistan coast during the last 11 years (1999-‐2010), have been carried out by using the Indian Institute of Technology, Delhi storm surge model (IIT-‐D Model). And also the TC formation frequency and intensity (in maximum sustained winds) in the NIO (comprising of the North Arabian Sea, NAS and the Bay of Bengal, BOB) have been studied for the period 1951 -‐ 2010. Because of their distinctively large varying TC frequencies the NAS and BOB are also separately studied to see what trend emerges out and how can we rate the vulnerability to the Pakistan coastal shelf.
Session 3: Waves and storm surges (Oral presentation)(S3O2)
21
(S3O3) ADVANCING WAVE CLIMATOLOGY USING WIND WAVE THEORY V. Grigorieva1, S. Gulev1, S. Badulin1,2,3
1) P. P. Shirshov Institute of Oceanology of the Russian Academy of Science
2) Novosibirsk State University, Russia
3) Russian State Hydrometeorological University, Saint-‐Petersburg, Russia
In order to improve conventional climatologies of wind wave characteristics derived from the Voluntary Observing Ship (VOS) data and from satellite altimetry (ESA GLOBWAVE, http://globwave.org) we use a recently proposed theoretical concept implying dependencies of wave height on the wave periods and self-‐similarity of wind forced surface waves. While the climatologies of significant wave height and dominant period based on the observations from VOS and satellite data demonstrate qualitative consistency, quantitative differences are quite evident for the co-‐located satellite and VOS observations. These differences cannot be explained to a full extent by the uncertainties in visual wave observations with considerable part of the uncertainties being due to biases in satellite data mostly associated with the pre-‐processing of raw measurements. Our framework allows for the adjustment of exponential dependencies of significant wave heights on the period for both VOS and satellite data by accounting for the effect of interaction of wind-‐driven seas and swell on global scales. This adjustment allows for the correction of the conventional climatologies and provides new global gridded products with accurate discrimination of seas and swells. We will present these products and discuss their potential applications for wave climate studies. Comparative assessments will be presented on global scale as well as for selected well sampled regions in the Northwest Atlantic and south of Australia characterized by different wind sea and swell characteristics.
Session 3: Waves and storm surges (Oral presentation)(S3O3)
22
(S3O4) THE JCOMM EXTREME WAVE DATA SET V. Swail1, S. Woodruff2 and A. Cox3
1) Environment Canada, Toronto, ON
2) Cooperative Institute for Research in Environmental Sciences & National Climatic Data Center, Boulder, CO
3) Oceanweather, Inc., Cos Cob, CT
The WMO-‐IOC Joint Technical Commission for Oceanography and Marine Meteorology, through the efforts of its Expert Team on Marine Climatology and Expert Team on Waves and Coastal Hazard Forecasting Systems, has recently completed Version 1.0 of the JCOMM Extreme Waves Data Set (EWDS). The rationale for this data set is to have a relatively small and manageable set of extreme storm sea states for comparison with wave forecast and hindcast products, model development and evaluation and satellite sensor calibration and validation, where such models and algorithms suffer from a lack of sufficient data during extreme conditions. The possible deficiencies in the models, especially at these extreme wave heights, could have a major impact on present wave climatologies, and resulting impacts on the computed design criteria for offshore structures. Version 1.0 of the EWDS has been populated with measured wave data where the significant wave height (SWH) exceeds 14 metres, based primarily on scans through official moored buoy wave archives from the US National Oceanographic Data Center (NODC), the Canadian Oceanography and Scientific Data (OSD, formerly MEDS) and the UK Met Office. A companion data set of remotely sensed extreme sea states (again SWH >14 m) has been included in Version 1.0 from the consolidated and homogenized data set of altimeter wave height estimates produced under the GlobWave project (www.globwave.org). This significantly augments EWDS in terms of coverage global oceanic coverage, as opposed to the primarily coastal coverage of the in situ data (presently limited to the margins of North America and Western Europe). In addition to the rigorous quality control carried out in GlobWave, these estimates have been further evaluated through comparisons with synoptic meteorological charts, and obvious erroneous data removed. The presentation will describe the process for creating the two elements of Version 1.0 of the EWDS, and also note the considerable challenges in assembling the current version of this data set and its sustainable operation and enhancement. These include, among others, obtaining an ongoing commitment for updating the data set, provision of appropriate accompanying historical metadata to include with the wave information, linking to the International Comprehensive Ocean-‐Atmosphere Data Set (ICOADS) including appropriate data formats, and the termination of the GlobWave Project. Interest in a general, consolidated measured wave data base will also be assessed.
Session 3: Waves and storm surges (Oral presentation)(S3O4)
23
(S3O5) COWCLIP: THE COORDINATED OCEAN WAVE CLIMATE PROJECT -‐ QUANTIFYING UNCERTAINTY IN WIND-‐WAVE CLIMATE PROJECTIONS Mark Hemer1, Elodie Charles1, Li Erikson2, Claire Trenham1 and Xiaolan Wang3
1) Centre for Australian Weather and Climate Research: A Partnership between CSIRO and the Bureau of Meteorology. Hobart, TAS, Australia
2) United States Geological Survey, Santa Cruz, CA, USA
3) Environment Canada, Toronto, Canada
Climate driven changes in the characteristics of wind-‐waves may exacerbate the effects of sea-‐level rise. Analysis of a community derived ensemble of wave climate projections derived from CMIP3 climate model forcing, carried out through COWCLIP allowed the first community assessment of projected future global changes in wave climate. The level of uncertainty surrounding these projections was large, and as the available ensemble inadequately sampled across many sources of variance (e.g., emission scenario uncertainty, climate model uncertainty, downscaling uncertainty), understanding of the cause of this uncertainty was limited. This paper will present an updated ensemble of wave climate projections, derived from CMIP5 experiments, where emission scenario, climate model forcing and downscaling approaches have greater sampling density. Quantifying sources of variance within the ensemble helps improve and develop methods to assess potential impacts of climate variability on our coasts.
Session 3: Waves and storm surges (Invited oral presentation)(S3O5)
24
(S3O6) THIRTY-‐YEAR WAVE HINDCAST USING THE CLIMATE FORECAST SYSTEM REANALYSIS WINDS
Deanna Spindler1, Arun Chawla2 and Hendrik Tolman2
1)IMSG at NOAA/NCEP, Environmental Modeling Center
College Park, MD 20740
2) NOAA/NCEP, Environmental Modeling Center
College Park, MD 20740
The NCEP Climate Forecast System Reanalysis (CFSR) system developed by Saha et al. in 2010, has been used to drive a 30-‐year wave hindcast (1979 -‐ 2010) using the WAVEWATCH III® model. This database is being developed in parallel to a NOPP initiative to improve physics in third generation phase-‐averaged models. The projects involves three phases: the first phase was completed in 2012 and involved creating the wave database using the then operational physics packages in WAVEWATCH III®. In general, the database did a very good job of representing the wave climate. At most buoys there is excellent agreement between model and data out to the 99.9th percentile. The agreement at coastal buoys is not as good as the offshore buoys due to unresolved coastal features (topographic/bathymetric). The monthly wind speeds were compared with altimeter data, and showed a consistent wind field in the Northern Hemisphere. The Southern Hemisphere showed two clear transition points (1994/1995 and 2005/2006), particularly in the higher percentiles, that coincide with the introduction of new data streams to the CFSR (Saha et al., 2010). For the second phase of the project, the database is being recreated using new physics packages that have been introduced as part of the NOPP project. Empirical fits between percentiles of altimeter derived and CFSR wind-‐speeds along latitude bands are used to correct the CFSR winds, to remove the Southern Ocean bias in the strongest wind speeds. The final phase of the project will involve recreating the database with the best physics packages available at the end of the NOPP project.
Session 3: Waves and storm surges (Oral presentation)(S3O6)
25
POSTER
(S3P1) EXTREME WAVES IN BRITISH WATERS Emma Steventon (presented by Fraser Cunningham)
Met Office
As a result of a JCOMM proposal for the need for ongoing, high quality wave data for the Extreme Wave Data Base, the Met Office has analysed its marine records for the UK's contribution. Data from 78 marine sites from 1991-‐2014 were analysed and wave heights of ≥14m quality checked. Data were analysed for trends including frequency and magnitude along with correlations with pressure and wind. Complete wave height time series from each extreme wave site were also produced. All sites have supporting metadata. 130 extreme waves (29 'events') were recorded by 13 stations from 1991-‐2014, all between November and March. A negative correlation was found with wave height and frequency, with 77.4% being between14-‐15.9m. The highest wave was reported at 19m. 87% of all the reported extreme waves have occurred since 2005, the highest frequency occurring in 2013. This poster illustrates the UK's contribution so far and highlights the seasonal cycles and long term variability of these events.
Session 3: Waves and storm surges (Poster presentation)(S3P1)
26
(S3P2) FORCED MIGRATION AND OCEAN SURGES DISASTERS ALONG THE COASTLINE OF LAGOS, NIGERIA: LESSONS LEARNED FROM THIS
EXTREME EVENTS. O. A. Ediang1 and A. A. Ediang2
1) Marine Division, Nigerian Meteorological Agency, Lagos, Nigeria
2) Nigerian Maritime Administration And Safety Agency, Lagos, Nigeria
Climate Change in Nigeria is having a very real impact and needs urgent attention. Extreme weather as a manifestation of climate change is increasingly problematic for the people along the coastline of Lagos state . For this study , ocean surges is the focus , whereby there is a rise in sea level along the coastline caused by the combination of strong winds and atmospheric pressure reported to be transiently low at times of surges. The paper talked on the real impact of coastal areas is not from a sole reason: various factors-‐such as sea level rise, increase storminess, Inundation-‐combine and cause greater damage to low-‐lying coastal regions in Lagos. The field research did not detect large-‐scale migration resulting from the Lagos coastline flooding caused by ocean surges or significant rural-‐urban migration patterns for flood-‐affected groups. Instead, the research revealed that government of Lagos state and Federal government of Nigeria-‐organised resettlement programmes dominate the environmentally induced movement pattern for flood-‐affected areas.
Session 3: Waves and storm surges (Poster presentation)(S3P2)
27
(S3P3) CLIMATOLOGICAL ASPECT OF COASTAL FOG AND OCEAN SURGES IN THE CITY OF LAGOS, NIGERIA
O. A. Ediang1 and A. A. Ediang2
1) Marine Division, Nigerian Meteorological Agency, Pmb1215 Oshodi Lagos, Nigeria
2) Nigerian Maritime Administration And Safety Agency, 6 Burmal Road, Apapa, Lagos, Nigeria.
Coastal Fog represent not only am important climate forming factor, but also a sensitive indicator of climate change, while ocean surges is the focus as it relate to coastal fog. It is a rise in sea level along a coastline caused by combination of strong winds and atmospheric pressure reported to be transiently low at times of Surges. The major objective of this paper is to examine the relationship between fog and ocean surges in the coastline of Lagos, Nigeria. This paper contributes to the wealth of knowledge already existing on fog and Ocean Surges by specifically working at the climatological aspect and impact of fog and Ocean Surges on the coastline of Lagos. A comprehensive review of literature using electronic and non-‐electronic databases formed the methodology. The relationship between fog and Ocean Surges is described and recommendations for the control and management of Ocean Surges as it relate to fog formation are made. The finding further revealed that the variations using descriptive statistical technique, June is seen as occurrence of first peak of fog and Ocean Surges. But the second peak of both events vary between Sept/Oct. It was observed from the trend line, the length of fog days was directly affected by frequency(Ocean Surges days). Implications of finding were discussed and solutions proffered for the study area.
Session 3: Waves and storm surges (Poster presentation)(S3P3)
28
(S3P4) SEA LEVEL CHANGES AND TIDE ALONG THE EAST AND WEST COAST OF THE RED SEA
Elfatih Bakry Ahmed Eltaib1 and Knut Barthel2
1) Red Sea University
2) University of Bergen
Tide gauge measurements recorded at two stations in the Red Sea, at Port Sudan from 1986-‐1994 and at Gizan for the period of 1992-‐1994 are used to analyze the sea level changes and tide along the east and west coast of the Red Sea, using the harmonic analysis (t_tide). Meteorological parameters during the same period are used to study the response of the sea level and residual sea level to local and global forcing. The relation between sea level and forces are examined using the correlation and cross covariance analysis. The correlation and cross-‐covariance coefficients between sea level and sea level pressure at Port Sudan indicate that the sea level responds to atmospheric pressure as non-‐inverse barometer. The linear trend for the coastal area shows a sea level increases by 1.2 mm per year compared to 5.4±1.2 mm per year decrease for the period 1962-‐1979 at Port Sudan, but in good agreement with global mean sea-‐level rise of 1.5±0.4 mm per year1. Harmonic analysis (t_tide) reveals the presence of a semi-‐annual and the annual components, with amplitudes 5:7 cm and 11:6 cm respectively. The spectral analysis shows the dominant tide at Port Sudan is diurnal tide, and in Gizan is found to semidiurnal tide. The magnitude of the tidal signal at Port Sudan is weak compared to that of Gizan, and that is because Port Sudan is located close to the amphidromic point of the semidiurnal constituent M2. 1) Neil J. White, John. A. Church, Catia. M. Domingues, Peter. J. Gleckler, Susan. E. Wijffels, Paul. M. Barker and Jeff. R. Dunn, “Improved Estimates of Upper-‐ocean Warming and Multi-‐decadal Sea-‐level Rise.”
Session 3: Waves and storm surges (Poster presentation)(S3P4)
29
(S3P5) LONG-‐RANGE (384-‐HOUR) OPERATIONAL WAVE MODEL FORECASTING SYSTEM AT THE MALAYSIAN METEOROLOGICAL
DEPARTMENT Muhammad Helmi Abdullah
Malaysian Meteorological Department, National Weather Centre, Jalan Sultan, 46667 Petaling Jaya, Selangor, Malaysia
This paper describes the wave modelling activities at the Malaysian Meteorological Department (MMD). Since 2003, WAM (Wave Model) has been operational at the Malaysian Meteorological Department using inputs from the NOGAPS model (now known as NAVGEM) . The model is run in two modes namely coarse-‐grid and fine-‐grid. The coarse-‐grid mode covers an area bounded by 30N -‐20S and 85-‐135E. The coarse-‐grid mode is run first to provide the boundary conditions for the fine-‐grid mode which covers the area 15ON -‐10S and 95-‐120E. The outputs of the WAM model include 192-‐hour forecasts of significant wave height, wave period and direction. The demand for more accurate swell forecasts and longer lead time prompted The MMD to source for another wave model and an alternative data source. In 2010, The MMD installed and operationalised MRI-‐III as the second wave model for operational use. The MRI-‐III was developed by the Meteorological Research Institute, Japan Meteorological Agency and is well-‐known for its superior swell forecasts and is also an invaluable addition to the existing WAM Model. In order to provide longer forecast time, the wind data from the GFS 384-‐hour forecast was used on an experimental basis for a period of 12 months. The models' forecasts were assessed during significant events involving the strengthening of the winds over The South China Sea especially between November to March. Upon the satisfactory results obtained during the trial run, both the WAM and MRI-‐III Models are fully operational with the new wind data and forecasts of up to 384 hours are produced. Currently, wave forecasts and advisories/warnings issued by The MMD take into account the outputs from both models as well as from the Wave Watch III.
Session 3: Waves and storm surges (Poster presentation)(S3P5)
30
(S3P6) STORM SURGE MODELLING FOR HEAD OF THE BAY OF BENGAL Shamsuddin Ahmed
Bangladesh Meteorological Department
Coastal disasters are a major concern for the lives and livelihoods of people, and socio-‐economic development, in low-‐lying, highly-‐populated coastal areas in Bangladesh. Bangladesh is situated at northern tip of the funneling Bay of Bengal. Bangladesh Meteorological Department (BMD) has been using IIT-‐Delhi model (fine resolution) for storm surge forecasting over Head of the Bay of Bengal (North of Lat. 18 -‐ 23N, 83.5-‐ 94.5E) since 2003.The resolution of IIT-‐D model is ∆X = 3.70 km, ∆Y= 3.50 km, visualization tool Generic Mapping Tool (GMT) and topographic & bathymetric data ETOPO2. Recently MRI model resolution 3.75 km x 3.75 km, visualization tools GMT & GrADS and topographic data Gebco 30 sec resolution (It is used by converting into 2min) has been installed in BMD to incorporate tide data. The results obtained from the model are in good agreement with the reported data.
Session 3: Waves and storm surges (Poster presentation)(S3P6)
31
OCEANOGRAPHIC DATA
ORAL
(S4O2) IQUOD (INTERNATIONAL QUALITY CONTROLLED OCEAN DATABASE) -‐ AN INTERNATIONAL INITIATIVE TO DESIGN, DELIVER AND
MAINTAIN A CLIMATE-‐STANDARD SUBSURFACE GLOBAL OCEAN TEMPERATURE (SALINITY) DATASET
Rebecca Cowley (on behalf of the CLIVAR/GSOP workshop team and international partners)
CSIRO Marine and Atmospheric Research, Australia
Studies of the oceans role in the Earth's climate system, whether through data assimilation or direct analyses, have been hampered by lack of availability and mixed quality of the ocean subsurface data and metadata. To greatly improve this situation, the IQuOD initiative aims to develop an internationally-‐sanctioned climate-‐standard subsurface ocean temperature (and eventually, salinity) global dataset, by pooling resources and expertise into a unique and internationally coordinated effort. Such a highly quality-‐controlled subsurface ocean dataset will: be augmented with previously unavailable observations/metadata from worldwide sources; include data quality-‐controlled by a combination of automated and manual procedures; include all available metadata from point of origin through quality control; contain uncertainty estimates on individual profile observations; and be freely distributed. Outcomes from the second IQuOD workshop will be presented.
Session 4: Oceanographic data (Oral presentation)(S4O2)
32
(S4O3) THE WORLD OCEAN DATABASE -‐ PRESERVING AND DISSEMINATING OCEAN SUBSURFACE PROFILE DATA TO UNDERSTAND
OUR CHANGING OCEANS. Tim Boyer, John Antonov, Olga Baranova, Carla Coleman, Hernan Garcia, Alexandra
Grodsky, Daphne Johnson, Ricardo Locarnini, Alexey Mishonov, Todd O'Brien, Christopher Paver, James Reagan, Dan Seidov, Igor Smolyar, and Melissa Zweng
National Oceanographic Data Center/NOAA Silver Spring, MD
The World Ocean Database (WOD) is the largest freely accessible quality controlled collection of ocean subsurface in situ profile data. Presently WOD contains more than 2 billion individual measurements ordered into 13 million casts (sets of collocated profiles of oceanographic variables). Data span the bottle measurements of Captain Cook in 1772 to yesterdays autonomous lagrangian float measurements. Each measurement from either end of this time spectrum is important to our understanding of the present ocean and its relation to past ocean states. Significant effort is expended in keeping up to date with recent oceanographic profiles as well as with discovery and recovery of historical ocean profile data. Efforts to obtain, reformat, and quality control historical and recent ocean profile data will be discussed with an emphasis on the international cooperation integral to the success of this endeavor. Use of these data for climate studies and plans to integrate WOD data with other databases of oceanographic profile and ocean surface measurements will also be discussed.
Session 4: Oceanographic data (Invited oral presentation)(S4O3)
33
(S4O4) THE NODC THERMOSALINOGRAPH STEWARDSHIP PROJECT Deirdre A. Byrne1, Mathew M. Biddle2, Daphne R. Johnson1
1) NOAA National Oceanographic Data Center
2) University of Maryland
Scientific data stewardship at the US National Oceanographic Data Center (NODC) is conceptually modeled as a six-‐tier endeavor. At its most basic level, stewardship consists of the long-‐term preservation of the data and information submitted to us. At the highest levels of stewardship, we produce authoritative records such as the World Ocean Database (WOD) and Atlas (WOA). In October, 2013 NODC initiated a project to improve its scientific stewardship of thermosalinograph (TSG) data. The goal of the NODC Thermosalinograph Stewardship Project is to present TSG data in a way that provides enhanced utility to the user community. Enhancements may include: applying consistent quality control and formatting to TSG data files; identifying files containing overlapping or duplicate observations; developing a database of unique TSG observations in a single format; all of the above. We seek input from stakeholders in the Marine Climatology Community to help us maximize the value of this effort.
Session 4: Oceanographic data (Oral presentation)(S4O4)
34
(S4O5) HADIOD AN INTEGRATED OCEAN DATABASE OF GLOBAL SURFACE AND SUBSURFACE TEMPERATURE AND SALINITY
OBSERVATIONS FROM 1900-‐2010 Chris Atkinson, John Kennedy, Nick Rayner
Met Office Hadley Centre, Exeter, UK
Observations made by surface-‐based instruments and sub-‐surface profiling instruments have largely been treated separately, motivated by a focus on different ocean domains. However, activities such as coupled climate reanalyses, long-‐term forecasting, satellite validation and climate monitoring increasingly want consistent information from across these domains. To address this we have created an ‘Integrated’ Ocean Database of global temperature and salinity observations covering 1900-‐2010, which we name HadIOD. The database merges data from release 2.5.1 of the International Comprehensive Ocean-‐Atmosphere Data Set (surface observations) and version 4.0.1 of the Met Office Hadley Centre EN dataset (sub-‐surface observations). Quality flags are also assigned to each observation. In bringing together observations, it is necessary to understand and, where possible, adjust for any biases. We include bias adjustments and uncertainties alongside the ICOADS temperature observations. The adjustments and uncertainties are derived from those used in the Met Office Hadley Centre HadSST3 dataset. We also include adjustments for EN observations made by expendable and mechanical bathythermographs, which are known to suffer from biases in reported temperature and depth. The HadSST3 error model is extended to other observations in the database, but in many cases it is not yet possible to populate fully/satisfactorily all the components of this model for a particular observation due to limitations in our understanding of the ocean observing system. Session 4: Oceanographic data (Oral presentation)(S4O5)
35
POSTER
(S4P1) EN4 -‐ QUALITY CONTROLLED TEMPERATURE AND SALINITY PROFILES AND MONTHLY OBJECTIVE ANALYSES WITH UNCERTAINTY
ESTIMATES Simon Good, Matt Martin, Nick Rayner
Met Office, Exeter, UK
Good quality observations of the subsurface of the ocean are required for a variety of applications such as estimation of ocean heat content change, ocean reanalysis and decadal forecasting. We present the EN4 dataset, which aims to meet this requirement. It covers 1900 to present (dataset is updated monthly). Profile observations from anywhere in the oceans are included and are sourced from a number of data collections in order to achieve the best possible coverage. A series of quality control checks are run on the data. All observations and quality control decisions for a month are collated in a single file. The EN4 dataset also includes monthly objective analyses formed from the quality controlled observations. Uncertainty estimates are provided with the analyses. We describe briefly the novel method used to generate these. Both the observations and analyses are made available in NetCDF files and are freely available for research and private study from www.metoffice.gov.uk/hadobs.
Session 4: Oceanographic data (Poster presentation)(S4P1)
36
SURFACE TEMPERATURES
ORAL
(S5O1) UPGRADES OF EXTENDED RECONSTRUCTED SEA SURFACE TEMPERATURE VERSION 4 (ERSST.V4)
Boyin Huang1, Viva F. Banzon1, Eric Freeman1,2, Jay Lawrimore1, Wei Liu1,3, Thomas C. Peterson1, Thomas M. Smith4, Peter W. Thorne3,6, Scott D. Woodruff1,5, and
Huai-‐Min Zhang1
1) National Climatic Data Center, Asheville, USA
2) STG Inc., Reston, USA
3) Cooperative Institute for Climate & Satellites, Raleigh, USA
4) NOAA/STAR/SCSB and CICS/ESSIC University of Maryland, College Park, USA
5) Cooperative Institute for Research in Environmental Sciences, Boulder, USA
6) Nansen Environmental and Remote Sensing Center, Bergen, Norway
The monthly Extended Reconstructed Sea Surface Temperature (ERSST) dataset, available on 2°×2° grids has been revised to version 4 (v4) from v3b. Major revisions include: updated and substantively more complete input data from the International Comprehensive Ocean-‐Atmosphere Data Set (ICOADS) Release 2.5 (R2.5); revised Empirical Orthogonal Teleconnections (EOTs) and EOT acceptance criterion; updated sea surface temperature (SST) quality control procedures; revised SST anomaly (SSTA) evaluation methods; updated bias adjustments of ship SSTs using Hadley Nighttime Marine Air Temperature version 2 (HadNMAT2); and a buoy SST bias adjustment not previously made in v3b. Tests showed that the revisions to ship SST bias adjustment in ERSST.v4 are dominant among other revisions and updates. The effect is to make SST 0.1°C-‐0.2°C lower north of 30°S but 0.1°C-‐0.2°C higher south of 30°S in ERSST.v4 than in ERSST.v3b before 1940. In comparison with the UK Met Office SST product (HadSST3), the ship SST bias adjustment in ERSST.v4 is 0.1°C-‐0.2°C lower in the tropics but 0.1°C-‐0.2°C higher in the mid-‐latitude oceans both before 1940 and from 1945 to 1970. Comparisons highlight substantive differences of long-‐term SST trend and SSTA variations at decadal timescale among ERSST.v4, ERSST.v3b, and HadSST3, which is largely associated with the difference of bias adjustments in these SST products. The tests also showed that SSTAs in ERSST.v4 can substantially better represent the El Niño/La Niña behavior when observations are sparse before 1940. In comparison with satellite-‐based SST analyses, SSTs deviations in ERSST.v4 are much smaller than those found in HadSST3.
Session 5: Surface temperatures (Invited oral presentation)(S5O1)
37
(S5O2) CENTENNIAL SST ANALYSIS AND ITS APPLICATION TO CLIMATE STUDIES
Masayoshi Ishii
Meteorological Research Institute/Japan Meteorological Agency
A centennial sea surface temperature (SST) analysis (COBE-‐SST2; Hirahara et al. 2014) was developed as a successor of the previous SST analysis, COBE-‐SST. In COBE-‐SST2, the sea surface temperature fields are reconstructed by statistically analyzing a long-‐term trend, interannual variations, and daily changes for the period from 1850 to the present. In addition, the analysis errors are estimated for the individual analyzed SSTs. In our research group, the analysis data base are used for analyzing the historical maritime climate changes, the constructing subsurface temperature changes, and reproducing and predicting climate variations with dynamical models. With a coupled atmosphere-‐ocean model, a centennial reanalysis of atmosphere and ocean is now undertaken aiming at further progress of seasonal-‐to-‐decadal climate prediction. Here, surface pressure and SST data are assimilated in the coupled model integration by using an ensemble Kalman filter. In every studies mentioned above, it is a key how to estimate uncertainties in outputs reproduced statistically and dynamically. It is expected that the uncertainty in climate predictions with such initialization of the coupled model provide meaningful and understandable information to the users. The success of this attempt probably depends on how much we understand the quality of historical observations, the incompleteness of model dynamics, and anything missing in our knowledge. A trial for realizing the above in terms of the observations will be introduced, in which analyzed SST are perturbed in space and time so as to use them with dynamical models easily.
Session 5: Surface temperatures (Oral presentation)(S5O2)
38
(S5O3) A NEW 1/4° SEA SURFACE TEMPERATURE CLIMATOLOGY BASED ON A BLENDED SATELLITE AND IN SITU ANALYSIS
Viva F. Banzon1, Richard W. Reynolds2, Diane Stokes3 and Yan Xue4
1) NOAA/NCDC
2) CICS-‐NC (retired)
3) NOAA/NCEP/EMC
4) NOAA/NCEP/CPC
A new 1/4° (~25 km) sea surface temperature (SST) climatology has been constructed from the first thirty complete years (1982-‐2011) of the 1/4° Daily Optimum Interpolation (OI) of SST, an analysis that combines in situ observations, satellite SSTs, and proxy SSTs derived from sea ice concentrations. The advantage in using an analysis is that there are no gaps, i.e., no grid points with missing values. The new climatology will be used to compute daily OISST anomalies in lieu of a lower resolution 1981-‐2010 climatology from NCEP, primarily based on the weekly 1° OISST. The impact of changing climatologies can be significant in specific locations. The new climatology tends to represent coastal flows and strong gradients associated with ocean currents better, so less of the mean signal remains in the daily OISST anomalies. The climatologies also differ greatly in the near-‐polar regions as a result of disparate ice datasets used in the daily and weekly OISSTs. In persistently cloudy areas, the new climatology is slightly cooler due to the difference between input satellite SST datasets to the two OISSTs. While the two climatologies are generally close, their agreement would improve further if the two OISSTs were reprocessed from the same input data.
Session 5: Surface temperatures (Oral presentation)(S5O3)
39
(S5O4) VARIABILITY AND LONG TERM TREND OF SEA SURFACE TEMPERATURE OVER CHINA SEAS DERIVED FROM A NEW MERGED
RECONSTRUCTION DATASET Lin MU, Yan LI, Yulong LIU, Guosong WANG, Dongsheng ZHANG, Jun SONG, Huan LI
National Marine Data and Information Service, Tianjin 300171, P.R. China
Sea surface temperatures (SST) play a key role in regulating climate and its variability. Variations in SST provide a source of potential predictability for climate fluctuations on timescales of seasons and longer. However, the seasonal and long-‐term changes in the marginal seas, such as the Yellow Sea and Bohai Sea known as an inland sea in China Seas, are not well understood because of the uncertainties and sparse sampling at these regions in SST products which were widely used in climate studies over the world. In this study, a high-‐quality SST reconstruction based on historical observations over China Seas and adjacent seas (100-‐150°E,0-‐50°N) is developed. The SST reconstruction has a temporal resolution of monthly mean and a spatial resolution of 1°latitude x 1° longitude with period from January 1960 to December 2012. This product merged national-‐wide monthly observational and investigative SST data applied by the State Oceanic Administration (SOA) of China and the latest updates in the International Comprehensive Ocean-‐Atmosphere Data Set (ICOADS). Results show that the new dataset is better able to represent the spatial and temporal SST variability over China Seas. Compared with the two international representative SST products, this new product effectively reduced the sparse and uncertainties data over the Offshore China Seas, especially at the coastal area. Results show that annual mean SST has increased by 0.013℃/year during the past 50 years. Winter and spring have experienced a significant increase in SST with the value of 0.018 and 0.015℃/year. An abrupt warming in SST has occurred since late 1990s. All these results were coincident with many earlier researches. Moreover, the new product seemed to be much reliable due to the fact that the dataset was mostly based on observation. Furthermore, the new product decreased the uncertainty and sparse sampling over offshore China Seas. Thus, it provided a much more useful dataset for climate and oceanic studies over coastal China Seas and adjacent seas.
Session 5: Surface temperatures (Oral presentation)(S5O4)
40
(S5O5) RECENT PROGRESS IN SEA-‐SURFACE TEMPERATURE AT THE MET OFFICE HADLEY CENTRE
John Kennedy1, Chris Atkinson1, Nick Rayner1, Sarah Millington2, Holly Titchner1, Rob Smith1, Michael Saunby1
1) Met Office Hadley Centre, Exeter, UK
2) Met Office, Exeter, UK
To meet the needs of users of climate data -‐ e.g. reanalyses, long-‐term forecasting, satellite validation and climate monitoring -‐ it is necessary to unite a wide variety of data sources to create products that provide consistent, seamless information with uncertainties across a wide range of space and time scales. HadISST2: Version 2 of the Hadley Centre Sea Ice and Sea-‐Surface Temperature analysis brings together high-‐accuracy space-‐based retrievals of SST from the Along Track Scanning Radiometer series of instruments, high-‐coverage lower-‐accuracy retrievals from the Advanced Very-‐High Resolution Radiometers and long-‐term low-‐accuracy measurements from ships and other in situ sources. The ATSRs provide a stable reference series that anchors the absolute SSTs. The high resolution high-‐coverage AVHRR data provide detailed information on the covariance structure of the SST fields and the in situ data provide a homogeneous long term context for the changes that we are currently seeing. HadISST2 blends these three data sources using a multiscale reconstruction technique to provide a global homogeneous SST data set from 1850. Uncertainties are propagated through the processing system by using a multi-‐generation ensemble approach that allows complex space-‐and-‐time covarying uncertainty information to be propagated appropriately and traceably through each stage in the processing chain.
Session 5: Surface temperatures (Invited oral presentation)(S5O5)
41
(S5O6) IMPROVED ERROR ESTIMATES FOR EXTENDED RECONSTRUCTED SST
Thomas Smith1, Boyin Huang2, Wei Liu2,3, Peter Thorne4, Viva Banzon2, Huai-‐Min Zhang2, Eric Freeman2,5, Jay Lawrimore2, Thomas Peterson2, Scott Woodruff6
1) NOAA/STAR/SCSB and CICS-‐MD/ESSIC Univ. Maryland, College Park, MD
2) NOAA/NCDC, Asheville, NC
3) CICS-‐NC, NC State Univ., Raleigh, NC
4) Nansen Environmental and Remote Sensing Center, Bergen, Norway
5) STG. Inc., Reston, VA
6) CIRES, Univ. Colorado, Boulder, CO
ERSST is a global-‐monthly SST analysis on a 2-‐degree spatial grid. It begins in the late 19th Century and is operationally updated in near-‐real time. It was developed and documented in 2003 and has had several updates since. ERSST errors occur because of data errors, including both correlated and random data errors, along with changes in sampling over time and compromises made in the development of ERSST. Both data properties and sampling vary, so errors can change spatially and temporally. This presentation discusses some properties of the uncertainty in the improved ERSST analysis. Errors discussed include sampling errors, data-‐bias errors, and errors from compromises made in the development of ERSST. Most sampling and analysis-‐system uncertainty occurs when sampling is sparse, in the 1940s and before 1930. With denser sampling in later periods sampling error is greatly reduced while variations caused by slight changes in the ERSST statistics and parameters are overwhelmed by the denser data. For large-‐scale averages the bias uncertainty tends to dominate the total ERSST error.
Session 5: Surface temperatures (Oral presentation)(S5O6)
42
(S5O7) THE INTERNATIONAL SURFACE TEMPERATURE INITIATIVE: UPDATE ON PROGRESS WITH LAND SURFACE TEMPERATURES
P.W. Thorne1, J. H. Lawrimore2, K. M. Willett3, J. J. Rennie4
1) NERSC, Norway
2)NOAA NCDC, USA
3) Met Office, UK
4) CICS-‐NC, USA
The International Surface Temperature Initiative was instigated in 2010 with the aim of improving understanding of Land surface Air Temperatures and their changes. In the intervening period substantial progress has been made on setting up a framework for improved analyses. This talk will summarize progress to date on aspects of data rescue, building of a land equivalent databank to ICOADS, and creating a set of benchmarks to enable rigorous validation. A particular focus of this talk will be on the first version release of the databank holdings. This databank release was made possible by an international working group. It has been constructed by sourcing over 50 non-‐unique station compilations from national, international, private and academic sources. Sources arise from every continent. The sources have been merged based upon metadata and data matching and the entire process is open and transparent. It will be shown how these represent a substantive step forwards in both spatial completeness and station count. Progress in creating benchmarks that exactly mimic the databank holdings availability will be discussed. Such benchmarks are non-‐trivial requiring: realistic station series behavior; realistic inter-‐station series behavior, and the addition of plausible data issues. Because the benchmarks are a known problem set when algorithms are run on these we are afforded a potential glimpse into real-‐world algorithm efficacy. In particular this benchmarking exercise should enable identification of strengths and weaknesses of different algorithms. Future plans will also be highlighted including efforts to reach out to statistical and metrological communities. There is much that the different, proximal, domains of land surface and sea surface can learn from one another.
Session 5: Surface temperatures (Invited oral presentation)(S5O7)
43
POSTER
(S5P1) PROGRESS TOWARDS A SLIGHTLY BIGGER HADSST ENSEMBLE John Kennedy
Met Office
The range of uncertainties explored in the original HadSST.3.1.0.0 ensemble of 100 sea-‐surface temperatures data sets was limited. A new ensemble has been generated which explores a much greater range of parametric uncertainties, incorporates both Folland and Parker (1995) and Smith and Reynolds (2002) style adjustments and references biases to a more reliable drifting buoy baseline. A larger 1000-‐member exploratory ensemble has been generated which has been used to assess the sensitivity of temperature changes to particular parameter choices. It can potentially be used to refine parameter choices by comparison to independent high-‐quality reference data.
Session 5: Surface temperatures (Poster presentation)(S5P1)
44
(S5P2) HISTORICAL OCEAN SURFACE TEMPERATURE: ACCURACY, CHARACTERISATION AND EVALULATION (HOSTACE)
Elizabeth C. Kent1, Christopher J. Merchant2, David I. Berry1, Giulia Carella1, Simone Morak-‐Bozzo2
1) National Oceanography Centre, Southampton, UK
2) University of Reading, UK
The Earth's global surface temperature is one of the most important indicators of climate change. Sea surface temperature (SST) is the marine component and the instrumental SST record stretches back more than 150 years. Several gridded datasets of historical SST have been produced over the years, most recently by the US National Climatic Data Center (Extended Reconstructed Sea Surface Temperature, ERSSTv4.0), by the UK Hadley Centre for Climate Prediction and Research (Hadley Centre Sea Ice and SST data set, HadISST and Hadley Centre SST data set HadSST3) and by the Japan Meteorological Agency and the Meteorological Research Institute (Centennial in situ Observation-‐Based Estimates, COBE-‐SST2). Each of these datasets applies adjustments to the SST observations to account for differences between different measurement methods and on different types of platform. These adjustments are largest prior to World War 2 when uninsulated canvas buckets are thought to be in common use. Some datasets apply smaller adjustments through to the present day to account for differences between observations from insulated buckets, engine intakes and drifting buoys. HOSTACE is a project funded by the UK Natural Environment Research Council (NERC) that will re-‐examine the historical SST record and produce a new SST dataset. The HOSTACE approach will be to make adjustments to the SST observations that vary between methods, and can vary from ship-‐to-‐ship and buoy-‐to-‐buoy. The first step toward this goal is clustering the observations made by each individual platform (ship or buoy) using ID information where available or voyage tracking for observations with no platform ID. Next, models of the expected functional dependence of SST biases will be derived, for example heat exchange from different types and sizes of buckets or offsets for individual buoys or ERI installations. An estimate of the true variability of SST will be made using high-‐quality data from the satellite-‐era as a reference. For example the expected variability may depend on time of day, measurement depth, wind or other environmental parameters. Differences between the observed and expected SST will be compared with the functional dependence predicted by the bias models. These differences will then be used to diagnose the measurement method and level of confidence in the assignment of that method. The SST observations will then be adjusted, accounting for the uncertainty in all of the previous steps. The adjusted observation will then be compared with independent observations from island and coastal stations and with surface measurements from hydrographic casts. The adjusted observations will be used to create a gridded dataset for the global ice-‐free oceans that will be compared with other available gridded surface temperature datasets.

45
Session 5: Surface temperatures (Poster presentation)(S5P2)
46
(S5P3) DIURNAL SST VARIABILITY CHARACTERISED FROM DRIFTING BUOY DATA
Simone Morak-‐Bozzo1, Christopher J. Merchant1, Elizabeth C. Kent2, David I. Berry2, Giulia Carella2
1) University of Reading, UK
2) National Oceanography Centre, Southampton, UK
The diurnal cycle of sea-‐surface temperature (SST) is an important component of SST variability. The diurnal SST cycle amplitude is strongly dependent on wind speed and solar radiation, and the shape is modified by variations in the period of daylight round the year. In this study, drifting buoy SST data from ICOADS release 2.5 are used to estimate the diurnal SST cycle. The data set covers the period 1990-‐2009 and is a collection of individual SST records from drifting buoys. Appropriately transformed, this dataset is well suited for estimation of the diurnal cycle, since many drifting buoys have high temporal coverage (many reports per day), and are globally distributed. For each drifter, we computed the annual mean and seasonal mean diurnal cycles of daily SST anomalies. These were averaged globally and in 10-‐degree latitudinal bands. The analysis was repeated stratifying the data based on wind speed and total cloud cover sourced from NWP re-‐analysis data. The results show, as expected, an increase in diurnal cycle amplitude and a decrease in seasonality towards the equator. In general, the SST is seen to cool on windy days and increase on calm days, so that the diurnal variability contributes to SST changes on slower timescales. Thorough characterisation of diurnal variability will assist in interpreting SST observations made at different local times of day for climatological purposes.
Session 5: Surface temperatures (Poster presentation)(S5P3)
47
CHARACTERISTICS OF THE OBSERVING SYSTEM(S)
ORAL
(S6O1) HOW LARGE ARE THE DIFFERENCES BETWEEN GLOBAL SST MEANS ESTIMATED FROM IN SITU AND SATELLITE DATA?
Alexey Kaplan
Lamont-‐Doherty Earth Observatory of Columbia University
There are easily discernible differences between global mean SST estimates obtained from different gridded products, even those that are interpolated to be globally complete. While historical SST products that make use of the AVHRR data (HadISST1 and COBE SST) show very good consistency with each other and with the NCEP weekly 1 degree OI product, they are colder than data sets that use only in situ data (ERSST v3b, HadSST3, ICOADS). High-‐resolution interpolated SST products, which make more extensive use of the satellite data (OSTIA and NCDC OI) are even colder (by about 0.3 C in 1985-‐2000 period). These differences are not due to different spatial coverage of the data sets (they appear in co-‐located calculations as well) and they cannot be reasonably explained by random error effects on global annual SST averages. However, (1) the differences seem decrease after 2001; (2) NCDC OI version that uses microwave data in addition to the AVHRR has smaller differences with in situ data; (3) CCI version of the OSTIA is closer to the in situ as well. Therefore, remaining cold biases in the AVHRR data and, possibly, systematic differences between ship and buoy data as well, seem responsible for the global mean differences between historical data sets during the satellite period. Homogenization of historical data sets in terms of a common reference data type across satellite and pre-‐satellite periods is yet to be satisfactorily resolved, even with regards to the estimates of annual global SST means.
Session 6: Characteristics of the observing system(s) (Oral presentation)(S6O1)
48
(S6O2) IMPACT OF OBSERVATIONAL SAMPLING ON OCEAN TEMPERATURE CHANGE ESTIMATION
Simon Good
Met Office Hadley Centre, Exeter, UK
The observational sampling of the subsurface ocean has changed immensely over the past ~50 years, driven by changes to instrument types and observing practices. Recently, the Argo project has provided us with almost global coverage of the deep oceans to approx. 2000m depth. However, before Argo the majority of observations were made in the northern hemisphere and to progressively shallower depths the further back in time we look. This changing observing system makes it challenging to estimate how the temperature of the ocean has changed over time. In this study climate model data have been used to investigate the impact of incomplete sampling on estimation of ocean temperature change. The impact of this sampling on the construction of climatologies will be described. The way in which this interplays with the impact of sampling on a time series constructed from the data will be discussed.
Session 6: Characteristics of the observing system(s) (Oral presentation)(S6O2)
49
(S6O3) OCEAN OBSERVATION PANEL FOR CLIMATE RELATED ACTIVITIES Mark Bourassa1,3, Toshio Suga2,3 and Katy Hill4
1) Center for Ocean-‐Atmospheric Prediction Studies (COAPS) and Department of Earth, Ocean and Atmospheric Science, Florida State University
2) Tohoku University & JAMSTEC, Japan
3) Co-‐chair, Ocean Observation Panel for Climate (OOPC)
4) OOPC Secretariat
The Ocean Observation Panel for Climate (OOPC) focuses on observations from the global oceans. Recent activities have reinforced the need for marine meteorology observations. OOPC activities related to marine meteorology will be reviewed. The Framework for Ocean Observations (FOO) will also be reviewed.
Session 6: Characteristics of the observing system(s) (Invited oral presentation)(S6O3)
50
(S6O4) THE ERA-‐CLIM PROJECT Hans Hersbach for the ERA-‐CLIM consortium
ECMWF
This presentation provides an overview of the main outcomes of ERA-‐CLIM, a three-‐year project (2011-‐2013) that was funded within the European FP7 framework. Involving 9 partners, the ERA-‐CLIM project focused on data rescue efforts (land, maritime, upper-‐air, satellite), the production of 20th-‐century SST and sea-‐ice boundary conditions, and the production of a set of century-‐long pilot reanalyses, integrating all information in a consistent manner. A short overview will also be provided for the ERA-‐CLIM2 project (2014-‐2016), which involving 16 partners, focuses on the production of an extended climate reanalysis of the 20th century, with consistent descriptions of the global atmosphere, ocean, land-‐surface, cryosphere and the carbon cycle.
Session 6: Characteristics of the observing system(s) (Oral presentation)(S6O4)
51
(S6O5) ASSESSING THE HEALTH OF THE MARINE CLIMATE OBSERVING SYSTEM
David I. Berry and Elizabeth C. Kent
National Oceanography Centre, UK
The first adequacy assessment on the Global Climate Observing System (GCOS) was made in 1998. This assessment resulted in a qualitative plan for the development of the GCOS and a number of goals were set out. Subsequent assessments of the adequacy, the most recent in 2010, have been relatively simple, measuring the completeness of the observing system against a set target number of observations and / or platforms by programme area (e.g. VOS, drifting buoy etc). In this presentation a more detailed quantitative approach is taken, integrating across the surface marine in-‐situ observing system and comparing the completeness of the system to the Global Ocean Observing System (GOOS) and GCOS requirements.
Session 6: Characteristics of the observing system(s) (Oral presentation)(S6O5)
52
DATA RECOVERY AND MANAGEMENT INITIATIVES
ORAL
(S7O1) ICOADS RELEASE 3.0: A MAJOR UPDATE TO THE HISTORICAL MARINE CLIMATE RECORD
Eric Freeman1,2, Scott D. Woodruff1,4, Steven J. Worley5, Sandra J. Lubker7, David I. Berry3, Zaihua Ji5, Elizabeth C. Kent3, Jay Lawrimore1, Nick A. Rayner8, Gudrun
Rosenhagen9, Karsten Shein1, and Shawn R. Smith6
1) National Climatic Data Center, Asheville, USA
2) STG. Inc., Asheville, USA
3) National Oceanography Centre, Southampton, UK
4) Cooperative Institute for Research in Environmental Sciences, Boulder, USA
5) National Center for Atmospheric Research, Boulder, USA
6) Center for Ocean-‐Atmospheric Prediction Studies, Florida State University, Tallahassee, USA
7) Earth System Research Laboratory, Boulder, USA
8) UK Met Office, Exeter, UK
9) Deutscher Wetterdienst, Hamburg, Germany
The International Comprehensive Ocean-‐Atmosphere Data Set (ICOADS) is the most widely-‐used archive of surface marine data, containing over 300 million individual marine reports from ships, buoys, and coastal and oceanographic platforms. The earliest observations date from the late 17th Century and ICOADS is updated in near real time. ICOADS Release 3.0 will contain millions of new or improved marine reports, including many observations recovered through historical digitization projects, e.g. OldWeather crowd-‐sourcing. Additional updates for R3.0 will include: 1) A permanent unique identifier (UID) assigned to each report, providing a mechanism for associating externally provided information-‐such as estimates of observational bias, adjustments to standard reference heights, or for differences in measurement methods; and improved QC flags-‐providing centralized access to information from data scientists. 2) An international partnership established through a formal Letter of Intent, which will leverage expertise and available resources to complete R3.0 and enhance future ICOADS releases. The partnership is also anticipated to facilitate future formalization of ICOADS under WMO-‐IOC's new Marine Climate Data System (MCDS). 3) A major revision and extension of the standardized ICOADS International Maritime Meteorological Archive (IMMA) common data format, including a new near-‐surface oceanographic data attachment to provide sea surface salinity and other surface oceanographic observations and metadata. 4) Updated QC procedures and climatologies. ICOADS is directly used by thousands of scientists and members of the public for applications ranging from climate assessments to genealogy. Its use as input to many gridded sea surface analyses (e.g. air and sea temperatures, humidity, pressure, wind, waves and clouds) and dynamical reanalyses of the atmosphere and ocean further extends its influence. R3.0 will, through its UIDs, updated
53
format and new sources of data, enable a more effective and complete exchange of information describing data quality between ICOADS, reanalysis centers, scientists and the public. describing data quality between ICOADS, reanalysis centers, scientists and the public.
Session 7: Data recovery and management initiatives (Invited oral presentation) (S7O1)
54
(S7O2) ICOADS VALUE-‐ADDED DATABASE (IVAD) Shawn R. Smith1, David I. Berry2, Mark A. Bourassa1,3, J. Eric Freeman4,5, Elizabeth
C. Kent2, Scott D. Woodruff4,6, and Steven J. Worley7
1) Center for Ocean-‐Atmospheric Prediction Studies, Florida State University, Tallahasse, USA
2) National Oceanography Centre, Southampton, UK
3) Earth, Ocean, & Atmospheric Science Department, Florida State University, Tallahassee, USA
4) National Climatic Data Center, Asheville, USA
5) STG. Inc., Asheville, USA
6) Cooperative Institute for Research in Environmental Sciences, Boulder, USA
7) National Center for Atmospheric Research, Boulder, USA
The International Comprehensive Ocean-‐Atmosphere Data Set (ICOADS) Value-‐Added Database (IVAD) project will be described, highlighting its role in improving observational data for climate studies. The presentation will provide an overview of the IVAD project in advance of the first IVAD workshop, which will immediately follow CLIVAR-‐IV on 13 June 2014. The main IVAD goal is to provide a mechanism whereby expert-‐developed adjusted data values (e.g., bias or height corrections) and uncertainty estimates can be added into, and served to the public alongside, the original ICOADS marine reports. This is made possible by enhancing the ICOADS underlying observational data format (IMMA) to include unique identifiers on each record and the capability to add a documented IVAD specific attachment, where required. Ongoing development of IVAD records will be described, including those for diurnal ship heating biases in air temperature, estimated wind corrections, and enhanced cloud reports.
Session 7: Data recovery and management initiatives (Invited oral presentation)(S7O2)
55
(S7O3) THE NEW MARINE CLIMATE DATA SYSTEM Gudrun Rosenhagen
Deutscher Wetterdienst, Germany
The new Marine Climate Data System (MCDS) is an outcome of the modernization of the Marine Climatological Summaries Scheme (MCSS) taking into account new sources of historical marine-‐meteorological and oceanographic climate data, as well as state of the art data management techniques. The goal is to develop a standardized international data management system across JCOMM and IODE, integrating collection, rescue, quality control, formatting, archiving, exchange, and access-‐for marine-‐meteorological and oceanographic real-‐time and delayed-‐mode data and associated metadata of known quality, and products that satisfy the needs of WMO and IOC applications. In particular, ocean data requirements for long term climate monitoring, and climate services are to be addressed. The paper gives a survey of the development and the actual state of the future MCDS which is to replace the existing MCSS by 2020.
Session 7: Data recovery and management initiatives (Oral presentation)(S7O3)
56
(S7O4) 20 YEARS OF GLOBAL COLLECTING CENTRES Fraser Cunningham and Heike Haar
GCC/Met Office and GCC/DWD
In support of global climate studies and the provision of a range of marine climate services, the international exchange, quality control and archival of delayed mode marine climatological data is a primary objective. Within the Marine Climatological Summaries Scheme (MCSS) two Global Data Collecting Centres (GCC) were formed in 1993, one in Hamburg, Germany, the other in Edinburgh, UK, to facilitate and enhance the flow and quality control of the data. Since then, over 22.5 million observations, contributed by 28 nations were collected, checked and distributed by the GCCs. The last 20 years brought huge changes: The computer media and the capacity of the data processors and archives have changed rapidly. The international format and quality standards have progressed. The quality of collected data improved by using electronic logbooks and the quantity increased by using automated weather stations. The presentation will provide an overview of the last 20 years' achievements of the GCCs.
Session 7: Data recovery and management initiatives (Oral presentation)(S7O4)
57
(S7O5) THE JCOMM IN-‐SITU OBSERVING PROGRAMME SUPPORT CENTRE: ASSISTING IN PLANNING, IMPLEMENTING, AND OPERATING
OCEAN OBSERVING SYSTEMS Kelly Stroker, Mathieu Belbeoch, Martin Kramp
JCOMM Observing Platform Support Centre, Parc Technologique du Canal, 8-‐10 rue Hermès, 31526 Ramonville, St Agne, France
Observations from in-‐situ ocean observing systems are paramount to generating good quality meteorological and oceanographic products. These in-‐situ observing networks, which underpin JCOMM, generate large amounts of data used by many different communities. The JCOMM in-‐situ Observation Programme Support Centre (JCOMMOPS) represents a bridge between the oceanographic and meteorological communities and provides integrated support with program monitoring, planning, implementation and operations. Observing systems need to meet the requirements of all ocean information products, which can vary greatly depending on the application, therefore international coordination is necessary to balance the needs of all actors involved. JCOMMOPS provides international coordination through the Data Buoy Cooperation Panel (including drifting and moored buoys), the OceanSITES program, the Argo Profiling Float program, the Ship Observations Team (including SOOP -‐ XBT, TSG, ASAP and VOS), and the GO-‐SHIP repeat hydrography program. Data from most of these systems are available in real-‐time through the Global Telecommunications System (GTS) of the World Meteorological Organization (WMO) and/or other online data centers. The flow of information and data, in particular onto the GTS, will be discussed, as well as data archiving, instrument metadata and quality control procedures.
Session 7: Data recovery and management initiatives (Oral presentation)(S7O5)
58
(S7O6) THE CITATION CONTEXT OF ICOADS Nicholas Weber1, Steven Worley2 and Matthew Mayernik3
1) University of Illinois, Urbana-‐Champaign
2) NCAR CISL
3) NCAR Library
The evaluation and analysis of research impact has evolved significantly in the past five years. Citations within peer-‐reviewed journal publications have typically been the gold standard for measuring impact, but funding agencies and professional societies are beginning to recognize the value and importance of citations to a number of diverse research products, including datasets, models, high performance computing facilities and even data curation services. However, much of the infrastructure (e.g. persistent identifiers, journal policies, etc.) for citing or referencing these products is still emerging. Techniques for citation analysis are simultaneously being reconsidered, and modified to accommodate a shift from journal publications to research products. In this vein, we are interested in how publications that announce or describe a dataset are currently being cited, and the ways that these citations may or may not be similar to citations made directly to the datasets themselves. To operationalize this work, we've adopted a method of Citation Content Analysis (Zhang et al., 2013). This method uses a socio-‐cultural approach that combines quantitative “counting” of citations between documents and qualitative “coding” of the syntactic and semantic context of a citation. This poster will present results of our using CCA to code the syntactic and semantic relationships of how and why citations were made to publications that describe The International Comprehensive Ocean-‐Atmosphere Data Set (ICOADS)) hosted by the Research Data Archive at the National Center for Atmospheric Research. Works Cited Zhang, G., Ding, Y., & Milojevic, S. (2013). Citation Content Analysis (CCA): A Framework for Syntactic and Semantic Analysis of Citation Content, 64(7), 1490-‐1503. doi:10.1002/asi
Session 7: Data recovery and management initiatives (Oral presentation)(S7O6)
59
(S7O7) (INTEGRATED) DATA GATHERING SYSTEMS FOR MARINE RENEWABLES Dr John Lawrence
The European Marine Energy Centre (EMEC) Limited
With the development of marine renewable devices, the need to understand local long term marine climate is growing. The European Marine Energy Centre has developed monitoring programmes at wave and tidal sites, coupled with a numerical modelling program. Renewable energy operators need to understand long-‐term statistics for designing device survivability and operational envelopes. EMEC operates a collection of wave, tide, wind and ancillary data stations, with a data set now extending to over 10 years, corroborated by a numerical modelling programme. The development of our monitoring approach is shown. Extreme wave predictions are compared with operational experience. Future data collection plans and community needs are discussed
Session 7: Data recovery and management initiatives (Oral presentation)(S7O7)
60
POSTER
(S7P1) THE GENEALOGY OF ICOADS Nicholas Weber1, Steven Worley2
1) University of Illinois, Urbana-‐Champaign
2) NCAR CISL
This poster presents out initial work on creating a geneaology of the International Comprehensive Ocean and Atmosphere Data Set (ICOADS). In this work, we're interested in tracing data products that have been derived from ICOADS, as well as those that have been added to subsequent releases of COADS since its original version in 1987. Our poster will include a visualization of this lineage in a tree structure, and we hope to encourage the CLIMAR community to add to or correct our initial work.
Session 7: Data recovery and management initiatives (Poster presentation)(S7P1)
61
(S7P2) A NETWORK OF COASTAL TEMPERATURE AUTONOMOUS SENSORS IN THE NORTH OF THE GULF OF GUINEA: PROPAO/JEAI
Zacharie SOHOU1, Bernard BOURLES2, Roger DJIMAN1, Angora AMAN3, Regina FOLORUNSHO4, Ayaa Kodjo ARMAH5, Rémy CHUCHLA2 and Virginie RACAPE2
1) Institut de Recherches Halieutiques et Océanologiques du Bénin (IRHOB) /Centre Béninois de la Recherche Scientifique et Technique, Cotonou & Sciences and
Technics Faculty of Abomey-‐Calavi University, Benin
2) IRHOB/Institut de Recherche pour le Développement (IRD), Cotonou, Bénin,
3) Laboratoire de Physique de l'Atmosphère et de Mécanique des Fluides (LAPA-‐MF), Université Félix Houphouët Boigny -‐ Cocody, Abidjan, Côte d'Ivoire,
4) Nigerian Institute of Oceanography and Marine Resources (NIOMR), Lagos, Nigeria,
5) Department of Oceanography and Fisheries (DOF), Legon University, Accra, Ghana,
This work is being done in the framework of the program, Young Team Associate to IRD (JEAI) entitled "Analysis Littoral, Climate and Ocean north of the Gulf of Guinea" (ALOC-‐GG) is a continuation of Regional Program of Physical Oceanography in West Africa (PROPAO). The main goals of the project are:
• Continuity of measurement activities, research and training initiated in the frame of EGEE / AMMA, in coastal countries of the northern Gulf of Guinea (Nigeria, Benin, Togo, Ghana and Côte d'Ivoire), and reinforce regional collaborations.
• To set up a network of regional measurements and build a regional coastal database;
• Monitoring and analysis of coastal upwelling regime and improved understanding of the coastal environment.
The deployment of the PROPAO coastal network and regional databank is a very important opportunity for all countries of the sub region. Increasing environmental data are now available for scientists of the region through the data bank website that could become at term a useful tool for evaluating the regional ocean and climate evolutions related to the observed climate changes. The PROPAO databank is also a complementary regional source for the World Ocean database on coastal oceanography and can be seen as an African contribution to the international observing network in the Tropical Atlantic ocean (eg PIRATA, AMMA and CLIVAR/TACE; refer to : http://www.pmel.noaa.gov/pirata/; http://www.brest.ird.fr/pirata/; http://database.amma-‐international.org/ ; http://tace.geomar.de/ ). Data are made available for scientists and students without restriction if they are used in academic objective. Some preliminary scientific works have been achieved during research training periods of the regional Master 2 (MROPA) initiated during PROPAO and now for PhD thesis. The data bank is available on IRHOB website financing by ODINAFRICA Program: http://www.nodc-‐benin.org The first thesis was defend in November 2013. Now in regional and national level we have a lot of specialist in physical oceanography.
Session 7: Data recovery and management initiatives (Poster presentation)(S7P2)
62
QUALITY CONTROL
ORAL
(S8O1) HIGH LEVEL QUALITY CONTROL STANDARD FOR MARINE ATMOSPHERIC DATA
Gudrun Rosenhagen, Rainer Sedlatschek and Hiltrud Otten-‐Balaccanu
Deutscher Wetterdienst, Germany
High level quality controlled data are of utmost importance for all sorts of climate investigations. Thus, the development of a Higher Quality Control Standard (HQCS) plays an important role within the new Marine Climate Data System MCDS. The presentation gives an overview on the contents and the progress in the development of a new standardized HQCS which is designed by the German Meteorological Service, Deutscher Wetterdienst. The goal is a uniform, higher level checking of all types of marine atmospheric observations from ships, buoys, rigs and platforms. The program uses among others a revised and improved land-‐sea mask, climate checks with ERA-‐Interim-‐data and comprehensive near-‐neighborhood tests. Comparisons with data checked by the HQC program used so far show considerable improvements.
Session 8: Quality control (Invited oral presentation)(S8O1)
63
(S8O2) FOLLOWING A MOVING SHIP -‐ A PROBABILISTIC APPROACH FOR SHIP TRACKING MODELS
Giulia Carella, Elizabeth C. Kent and David I. Berry
National Oceanography Centre, Southampton, UK
The Earth is warming and global mean temperature is predicted to increase. The surface temperature is the main measure of recent climate change and sea surface temperature (SST) is its ocean component. SST in situ measurements made from ships extend over the past 150 years and it is generally agreed that SST data cannot be used with some sort of adjustment, mainly because of the dramatic change in technology over the observational record. The HOSTACE project (Historical Ocean Surface Temperature: Accuracy, Characterization And Evaluation) will develop a new method for bias adjustment of the past c.a. 150 years SST record based on individual platform corrections. Observations from the same platform are likely to be of the same measurement type and, as a consequence, characterized by the same instrumental bias model. The observations used in HOSTACE are from the International Comprehensive Ocean-‐Atmosphere Data Set (ICOADS). Central to this approach is the ability to identify and group observations made by each ship or other platform using ICOADS ID information, where available, and voyage tracking. Past attempts have only tracked observations with a known platform identifier (e.g. ship name, logbook number, call sign) while observations with no usable ID were not tracked. Moreover, neither the spatiotemporal coherence of the known tracks has been fully investigated nor their possible aggregation, resulting in smaller and nosier track ensembles. We propose a new tracking method based on probabilistic assignment/clustering of observations, integrated with metadata information when available. The ship trajectory evolution is obtained assuming a uniform velocity subjected to random noise and modeling the probability density of finding a ship at a given location and time as a function of the distance between known past and/or future positions. Results show that the method is successful throughout the historical record, especially in the early period where the original number of not-‐assigned observations can be more than half of the total reports. Furthermore, tracking allows a complete uncertainty analysis, fully accounting for the uncertainty associated both with each SST observation and the assignment of a measurement method to each individual platform.
Session 8: Quality control (Oral presentation)(S8O2)
64
(S8O3) IN SITU SST QUALITY MONITOR (IQUAM) VERSION 2 Alexander Ignatov1, Feng Xu2, Xinjia Zhou3
1) NOAA/NESDIS
2) GST Inc
3) CSU/CIRA
In situ Quality Monitor (iQuam, www.star.nesdis.noaa.gov/sod/sst/iquam) was established at NOAA to support near-‐real time Cal/Val of SST products from heritage polar and geostationary, as well as from the newer Joint Polar Satellite System (JPSS) and GOES-‐R satellites. iQuam performs 3 major functions in near-‐real time: 1) quality controls (QC) in situ SSTs, using both basic screenings (duplicate removal, plausibility, platform track, SST spike) and more sophisticated Bayesian reference and buddy checks; 2) monitors QCed SSTs online; 3) serves in situ SST data to NOAA and external users with quality flags appended. Version 1 (Xu and Ignatov, JTECH, 2014) used GTS data from Jan 1991-‐on. Version 2 uses ICOADS (whenever available) and GTS data, extends time series back to 1981, adds ARGO floats, and improves the QC, among other upgrades. This presentation discusses iQuam v2, its use at NOAA for satellite Cal/Val, and future work towards iQuam version 3.
Session 8: Quality control (Oral presentation)(S8O3)
65
(S8O4) THE USAGE OF MARINE SURFACE DATA IN THE ERA-‐20C REANALYSIS
Hans Hersbach, Paul Poli, Carole Peubey and Dick Dee.
ECMWF
This presentation focuses on the conventional observations as used in the ERA-‐20C pilot reanalysis (1900-‐2010) that was conducted at ECMWF within the ERA-‐CLIM project. This embraces ocean surface wind, mean-‐sea level pressure and surface pressure from the recent versions of the International Surface Pressure Databank (ISPDv3.2.6) and the International Comprehensive Ocean-‐Atmosphere Data Set (ICOADSv2.5.1). These historical data banks were imported at ECMWF into a uniform observation feedback archive, called OFA. This database serves the ECMWF assimilation system and is very flexible with respect to new observables, platforms and levels in the vertical. Feedback information embodies collocated model information and quality flags as set during the assimilation. On input such feedback data was obtained from the NOAA/CIRES 20CR reanalysis, and was used to identify breakpoints from a prior station timeseries analysis. On output, feedback information from the ERA-‐20C reanalysis contains a wealth of information on e.g., how well the data compares with the ERA-‐20C model fields, how it was used or rejected, what level of bias correction was applied. Feedback information also allows for the estimation of observation error, such as the evolution of the improving quality of observations from meteorological vessels over time compared to that from regular ships.
Session 8: Quality control (Oral presentation)(S8O4)
66
POSTER
(S8P1) IMPROVED CLOUD INFORMATION IN ICOADS Ryan Eastman1, Elizabeth C. Kent2,
Scott D. Woodruff3,4, Sandra J. Lubker5
1) University of Washington, USA
2) National Oceanography Centre, Southampton, UK
3) CIRES/University of Colorado, USA
4) NOAA National Climatic Data Center, USA
5) NOAA Earth System Research Laboratory, USA
Cloud information has been reported by ships using the same code since the early 1950s, allowing a consistent climate record to be generated covering the past 60 years. Shipboard observers report: total cloud cover, low-‐level cloud cover, cloud base height and also cloud type codes for low, medium and high clouds. These fields are supplemented by the reported present weather code. For the past 25 years the University of Washington has produced a "Climatic Atlas of Clouds over Land and Ocean" using improved methods of analysis and quality control (QC). These methods are now being integrated into International Comprehensive Ocean-‐Atmosphere Data Set (ICOADS) routine processing to produce updates to the University of Washington Extended Edited Cloud Report (EECR). The EECR provides rigorous QC of the cloud and weather information, identifying inconsistent or incorrectly coded reports. These reports are corrected where possible. Reports with "sky obscured" are checked using the reported weather and assigned to full cloud cover when appropriate. In some cases more detailed information on cloud types can be deduced from combinations of cloud types and weather codes. New parameters are also calculated. These include the amount of either sunlight or moonlight at the observation time and also non-‐overlapping cloud amounts. A quantification of the improvement to the cloud record resulting from the EECR processing will be presented.
Session 8: Quality control (Poster presentation)(S8P1)
67
(S8P2) QUALITY CONTROL OF METEOROLOGICAL DATA FROM OFFSHORE PLATFORMS
Tina Leiding, Lydia Gates, Birger Tinz, Gudrun Rosenhagen, Rainer Sedlatschek
Deutscher Wetterdienst, Germany
The exploitation of renewable energy using offshore wind turbines will be one of the major emerging markets in the future. In order to investigate conditions for offshore wind power generation in the German coastal areas, three research platforms were constructed in the North Sea (FINO1 and 3) and the Baltic Sea (FINO2). Measurement masts at each platform are equipped with a range of meteorological sensors at heights of 30 to 100 m above sea level. Recorded measurement data are checked automatically on the basis of a comprehensive checking routine. The quality control of the data is performed in a sequence of tests: The routine starts with a formal check, followed by climatological, temporal, repetition, consistency, and spatial checks. After the successful completion of every sequence, the data are assigned standardized quality flags. By default, 10-‐minute averages of data are processed. A current challenge is the quality-‐control of 1-‐second values.
Session 8: Quality control (Poster presentation)(S8P2)

68
IVAD PROGRESS WORKSHOP Meeting Agenda 1) IVAD progress (60 min)
a) Status of prototypes b) Status of submission/extraction from IVAD database system c) Exercising IVAD – Pseudo-‐flux testing
2) IVAD discussion topics (70 min) a) NCAR database system b) Prototype questions
3) Management of UIDs (40 min) a) Delayed-‐mode data issues b) Near real-‐time data issues
4) IMMA format topics (150 min) a) Proposal for a higher-‐level “how to” manual for translation into IMMA format b) Programming for ICOADS: Languages and Tools c) Plan for user provided subsidiary records
5) IVAD administration (30 min) a) Sustaining support for IVAD b) New prototypes
Working group under ICOADS Steering Committee terms of reference