Embed Size (px)
DESCRIPTION
Cold Spring Harb
Citation preview
August 5, 20092009; doi: 10.1101/cshperspect.a001990 originally published onlineCold Spring Harb Perspect Biol
Naama Barkai and Ben-Zion Shilo Robust Generation and Decoding of Morphogen Gradients
Subject Collection Generation and Interpretation of Morphogen Gradients
GradientsRegulation of Organ Growth by Morphogen
Gerald Schwank and Konrad BaslerHomeostasisGradients in Planarian Regeneration and
Teresa Adell, Francesc Cebrià and Emili Saló
DevelopmentSignaling Gradients during Paraxial Mesoderm
Alexander Aulehla and Olivier Pourquié
Shaping Morphogen Gradients by ProteoglycansDong Yan and Xinhua Lin
Morphogen Gradient Formation
González-GaitánOrtrud Wartlick, Anna Kicheva and Marcos
and Sorting OutMorphogen Gradients: Scattered Differentiation Forming Patterns in Development without
Robert R. Kay and Christopher R.L. ThompsonNodal Morphogens
Alexander F. Schier GradientsRobust Generation and Decoding of Morphogen
Naama Barkai and Ben-Zion Shilo
in the Insect CuticleGradients and the Specification of Planar Polarity
David StruttGradientsModels for the Generation and Interpretation of
Hans Meinhardt
4-Dimensional Patterning SystemClassical Morphogen Gradients to an Integrated Vertebrate Limb Development: Moving from
Jean-Denis Bénazet and Rolf Zeller
EmbryoDrosophilathe Graded Dorsal and Differential Gene Regulation in
Gregory T. Reeves and Angelike Stathopoulos
Tube Patterning: The Role of Negative FeedbackHedgehog Signaling during Vertebrate Neural Establishing and Interpreting Graded Sonic
Vanessa Ribes and James Briscoe
Chemical Gradients and Chemotropism in YeastRobert A. Arkowitz
GastrulaXenopusMorphogenetic Gradient of the Systems Biology of the Self-regulating
Jean-Louis Plouhinec and E. M. De Robertis Cerebral CortexDevelopment of Form and Function in the Gradients in the Brain: The Control of the
Stephen N. Sansom and Frederick J. Livesey
http://cshperspectives.cshlp.org/cgi/collection/ For additional articles in this collection, see
Copyright © 2009 Cold Spring Harbor Laboratory Press; all rights reserved
Spring Harbor Laboratory Press at INST DE INVESTIGACIONES on February 28, 2013 - Published by Coldhttp://cshperspectives.cshlp.org/Downloaded from
Robust Generation and Decoding ofMorphogen Gradients
Naama Barkai1,2 and Ben-Zion Shilo1
1Department of Molecular Genetics, Weizmann Institute of Science, Rehovot 76100, Israel2Physics of Complex Systems, Weizmann Institute of Science, Rehovot 76100, Israel
Correspondence: [email protected]
Morphogen gradients playa key role in multiple differentiation processes. Both the formationof the gradient and its interpretation by the receiving cells need to occur at high precision toensure reproducible patterning. This need for quantitative precision is challenged byfluctuations in the environmental conditions and by variations in the genetic makeup ofthe developing embryos. We discuss mechanisms that buffer morphogen profiles againstvariations in gene dosage. Self-enhanced morphogen degradation and pre-steady-statedecoding provide general means for buffering the morphogen profile against fluctuationsin morphogen production rate. A more specific “shuttling” mechanism, which establishesa sharp and robust activation profile of a widely expressed morphogen, and enables theadjustment of morphogen profile with embryo size, is also described. Finally, we considerthe transformation of the smooth gradient profile into sharp borders of gene expression inthe signal-receiving cells. The integration theory and experiments are increasingly used,providing key insights into the system-level functioning of the developmental system.
In order for a uniform field of cells to differen-tiate into a reproducible pattern of organs and
tissues, cells need to receive information abouttheir position within the field. During develop-ment, positional information is often conveyedby spatial gradients of morphogens (Wolpert1989). In the presence of such gradients, cellsare subject to different levels of morphogen,depending on their positions within the field,and activate, accordingly, one of several geneexpression cassettes. The quantitative shapeof the morphogen gradient is critical for pat-terning, with cell-fate boundaries establishedat specific concentration thresholds. Although
these general features of morphogen-basedpatterning are universal, the range and formof the morphogen profile, and the pattern ofinduced target genes, vary significantly depend-ing on the tissue setting and the signalingpathways used.
The formation of a morphogen gradient is adynamic process, influenced by the kinetics ofmorphogen production, diffusion, and degra-dation. These processes are tightly controlledthrough intricate networks of positive andnegative feedback loops, which shape the gradi-ent and enhance its reproducibility between in-dividual embryos and developmental contexts.
Editors: James Briscoe, Peter Lawrence, and Jean-Paul Vincent
Additional Perspectives on Generation and Interpretation of Morphogen Gradients available at www.cshperspectives.org
Copyright # 2009 Cold Spring Harbor Laboratory Press; all rights reserved; doi: 10.1101/cshperspect.a001990
Cite this article as Cold Spring Harb Perspect Biol 2009;1:a001990
1
Spring Harbor Laboratory Press at INST DE INVESTIGACIONES on February 28, 2013 - Published by Coldhttp://cshperspectives.cshlp.org/Downloaded from
In the past three decades, many of the com-ponents comprising the morphogen signalingcascades have been identified and sorted intopathways, enabling one to start addressingseminal questions regarding their functionality:How is it that morphogen signaling is reprodu-cible from one embryo to the next, despite fluc-tuations in the levels of signaling components,temperature differences, variations in size, orunequal distribution of components betweendaughter cells? Are there underlying mechan-isms that assure a reproducible response? Arethese mechanisms conserved across species,similar to the signaling pathways they control?
In this review, we outline insights wegained by quantitatively analyzing the processof morphogen gradient formation. We focuson mechanisms that buffer morphogen pro-files against fluctuations in gene dosage, anddescribe general means by which such bufferingis enhanced. These mechanisms include self-enhanced morphogen degradation and pre-steady-state decoding. In addition, we describea more specific “shuttling” mechanism thatis used to generate a sharp and robust profileof a morphogen activity from a source that isbroadly produced. We discuss the implicationof the shuttling mechanism for the ability ofembryos to adjust their pattern with size.Finally, we consider the transformation of thesmooth gradient profile into sharp borders ofgene expression in the signal-receiving cells.
CANONICAL PARADIGM OF MORPHOGENGRADIENT FORMATION: INTERPLAYBETWEEN DYNAMIC RANGE ANDROBUSTNESS
The canonical model of morphogen gradientformation assumes that morphogen is secret-ed from a localized source, and spreads acrossthe tissue while being degraded. The result-ing concentration gradient peaks at the sourceand decays gradually away from it. Thisgeneral paradigm applies to a number of well-studied systems, including the Bicoid gradientin the early Drosophila embryo (Drieverand Nusslein-Volhard 1988b) and the Dpp,Hedgehog, and Wingless gradients in the
Drosophila wing imaginal disc (Teleman et al.2001). Quantitative properties of such morpho-gen profiles are relatively well understood. Inthe absence of feedbacks, the steady-state gradi-ent is exponential, M � e2x/l. The decay length(scale) of the profile is defined by the mor-phogen diffusion coefficient (D) and its typicaldegradation time (a) such that l ¼
ffiffiffiffiffiffiffi
Dap
, andits overall level is proportional to the morpho-gen production rate.
Within this canonical paradigm, the sensi-tivity to changes in morphogen productionrate is easily derived (Eldar et al. 2003). Theshift in cell-fate boundaries, dx, upon modulat-ing the morphogen production rate by somefactor h, is proportional to the morphogendecay length l:
dx ¼ l ln(h): (1)
This means that all thresholds are shifted bythe precise same amount, independently oftheir position in the unperturbed system.Thus, a single length scale, l, controls boththe spread of the morphogen (its decay acrossthe field) and the sensitivity of patterning toperturbations in morphogen production rate.Robustness and dynamic range are thus inher-ently linked: The system can be readily madeless sensitive by reducing the decay length l,but this will inevitably limit the spread ofthe gradient. A gradient that spreads overmost of the field requires l to be of the orderof field size, and consequently will be highlysensitive to fluctuations in morphogen pro-duction rate.
UNCOUPLING THE INTERPLAY:“SELF-ENHANCED DEGRADATION”ENHANCES ROBUSTNESS WITHOUTLIMITING THE DYNAMIC RANGE OF THEMORPHOGEN GRADIENT
The distribution of morphogens is typicallyshaped by feedback loops. Morphogen signal-ing regulates the abundance or activity ofgenes coding for receptors, heparan sulfateproteoglycans (HSPGs) or other regulatoryproteins, and a feedback loop is established
N. Barkai and B.-Z. Shilo
2 Cite this article as Cold Spring Harb Perspect Biol 2009;1:a001990
Spring Harbor Laboratory Press at INST DE INVESTIGACIONES on February 28, 2013 - Published by Coldhttp://cshperspectives.cshlp.org/Downloaded from
when these molecules regulate the diffusion,degradation, or production of the morphogen(Akiyama et al. 2008; Chen and Struhl 1996;Tsuda et al. 1999). In principle, such feedbackscould buffer the morphogen gradient againstgenetic and environmental perturbations.
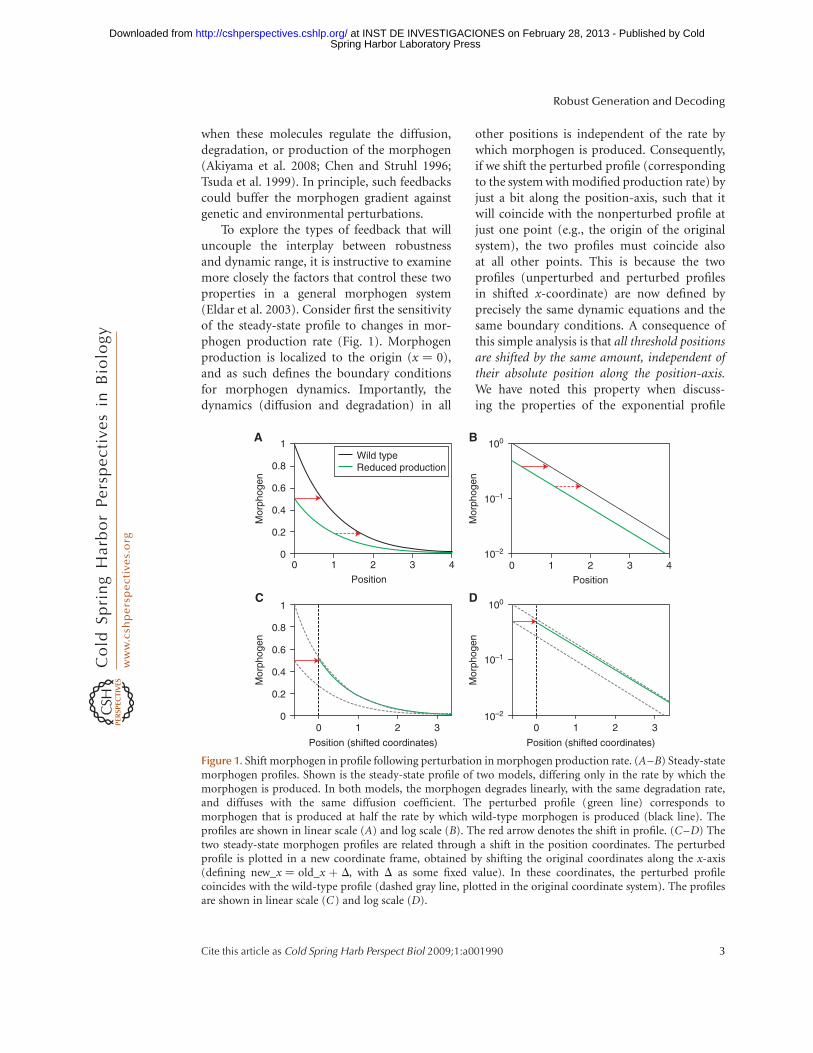
To explore the types of feedback that willuncouple the interplay between robustnessand dynamic range, it is instructive to examinemore closely the factors that control these twoproperties in a general morphogen system(Eldar et al. 2003). Consider first the sensitivityof the steady-state profile to changes in mor-phogen production rate (Fig. 1). Morphogenproduction is localized to the origin (x ¼ 0),and as such defines the boundary conditionsfor morphogen dynamics. Importantly, thedynamics (diffusion and degradation) in all
other positions is independent of the rate bywhich morphogen is produced. Consequently,if we shift the perturbed profile (correspondingto the system with modified production rate) byjust a bit along the position-axis, such that itwill coincide with the nonperturbed profile atjust one point (e.g., the origin of the originalsystem), the two profiles must coincide alsoat all other points. This is because the twoprofiles (unperturbed and perturbed profilesin shifted x-coordinate) are now defined byprecisely the same dynamic equations and thesame boundary conditions. A consequence ofthis simple analysis is that all threshold positionsare shifted by the same amount, independent oftheir absolute position along the position-axis.We have noted this property when discuss-ing the properties of the exponential profile
A
Mor
phog
en
1
0.8
0.6
0.4
00 1 2 3 4
0.2
Wild typeReduced production
Position
100
10–1
10–2
0 1 2
Position
3 4
B
Mor
phog
en
C
Mor
phog
en
0
0.2
0.4
0.6
0.8
1
0 1
Position (shifted coordinates)
2 3
D
Mor
phog
en
100
0 1
Position (shifted coordinates)
2 3
10–1
10–2
Figure 1. Shift morphogen in profile following perturbation in morphogen production rate. (A–B) Steady-statemorphogen profiles. Shown is the steady-state profile of two models, differing only in the rate by which themorphogen is produced. In both models, the morphogen degrades linearly, with the same degradation rate,and diffuses with the same diffusion coefficient. The perturbed profile (green line) corresponds tomorphogen that is produced at half the rate by which wild-type morphogen is produced (black line). Theprofiles are shown in linear scale (A) and log scale (B). The red arrow denotes the shift in profile. (C–D) Thetwo steady-state morphogen profiles are related through a shift in the position coordinates. The perturbedprofile is plotted in a new coordinate frame, obtained by shifting the original coordinates along the x-axis(defining new_x ¼ old_x þ D, with D as some fixed value). In these coordinates, the perturbed profilecoincides with the wild-type profile (dashed gray line, plotted in the original coordinate system). The profilesare shown in linear scale (C) and log scale (D).
Robust Generation and Decoding
Cite this article as Cold Spring Harb Perspect Biol 2009;1:a001990 3
Spring Harbor Laboratory Press at INST DE INVESTIGACIONES on February 28, 2013 - Published by Coldhttp://cshperspectives.cshlp.org/Downloaded from
(Equation 1, previously). The present discus-sion concludes that this property holds moregenerally for steady-state morphogen profiles,even in the presence of feedbacks (providedthat the profile decays sufficiently and rapidlyacross the field [Eldar et al. 2003]).
Moreover, it is clear from the above anal-ysis that the shift in the morphogen profiledepends only on the rate by which morphogenprofile decays close to the source (boundary).Robustness thus depends only on the dynamicsproperties close to the source. In contrast,the spread of the gradient is a function of theaverage decay of the profile throughout thefield. The case of no-feedback (exponentialprofile) is unique in the sense that the gradientis defined by a single decay length (l). Hence,the decay length in the vicinity of the source(which controls robustness) is the same as thedecay length everywhere, coupling robustnessand dynamic range.
Feedback regulation can result in a mor-phogen profile that decays at multiple lengthscales, and can thus break the interplaybetween robustness and dynamic range (Eldaret al. 2003). A multitude of length scales isachieved, for example, when morphogen signal-ing enhances morphogen degradation. In sucha case, morphogen decays rapidly close to thesource (where morphogen levels are highest)but decays at a slower rate further away fromthe source (where morphogen levels arelower). Robustness is thus improved withoutcomprising the dynamic range. The resultinggradient is not exponential. Rather, it is betterapproximated by a power-law S(x) � 1/xm.The same uncoupling can be obtained alsoif morphogen signaling alters the (local) diffu-sion coefficient (e.g., by modulating the levelof HSPG), such that diffusion becomessmaller in regions of high morphogen signaling(Bollenbach et al. 2005).
The robustness mechanism described aboveis general, and does not depend on the precisemeans by which morphogen signaling impactson morphogen degradation or diffusion. Self-enhanced degradation was described in sev-eral developmental contexts. The induction ofpatched transcription by Hh signaling, for
example, enhances the uptake and degradationof Hh (Incardona et al. 2000), leading toenhanced Hh degradation in the vicinity of itssource. Specifically in the Drosophila wingimaginal disc, Hh is produced in the posteriorcompartment and signals to the adjacent cellsin the anterior compartment, which, in response,induce Ptc expression (Chen and Struhl 1996).This induction of Ptc results in increasedsequestering and degradation of Hh by thereceiving cells (Tabata and Kornberg 1994),thus likely increasing the robustness to fluctu-ations in the level of Hh. Similarly, in thezebrafish embryo, retinoic acid (RA) is pro-duced posterior to the hindbrain, and generatesa posterior-to-anterior gradient that specifiesrhombomere location. RA signaling leads to in-duction of cyp26a, a cytochrome p450 enzymethat oxidizes RA to promote its removal fromthe tissue, thus generating an RA gradient thatis robust to fluctuations in RA synthesis(White et al. 2007).
PRE-STEADY-STATE DECODING
Most analyses of morphogen patterning assumethat the fate of the responding cells is deter-mined by the morphogen gradient after thegradient had reached its steady state. However,developmental processes often occur rapidly,and it is not clear whether the profile can con-verge to its steady state within the restrictedtime frame available. Moreover, temporal aver-aging throughout the kinetics is also possibleand was shown to apply, e.g., in the readout ofthe sonic hedgehog morphogen gradient inthe vertebrate central nervous system (Dessaudet al. 2007). We also realized that feedbacks,which shape morphogen gradients throughregulation of transcription or translation, arelengthy, and might not be possible to useduring rapid early development. Several theo-retical studies suggested that the morphogensignal might be read (decoded) before theprofile had reached its steady state (Gurskyet al. 2004; Mizutani et al. 2005; Saha andSchaffer 2006). This motivated us to examinewhether the time at which the gradient isbeing decoded affects the sensitivity of the
N. Barkai and B.-Z. Shilo
4 Cite this article as Cold Spring Harb Perspect Biol 2009;1:a001990
Spring Harbor Laboratory Press at INST DE INVESTIGACIONES on February 28, 2013 - Published by Coldhttp://cshperspectives.cshlp.org/Downloaded from
profile-to-morphogen production rate (Berg-mann et al. 2007).
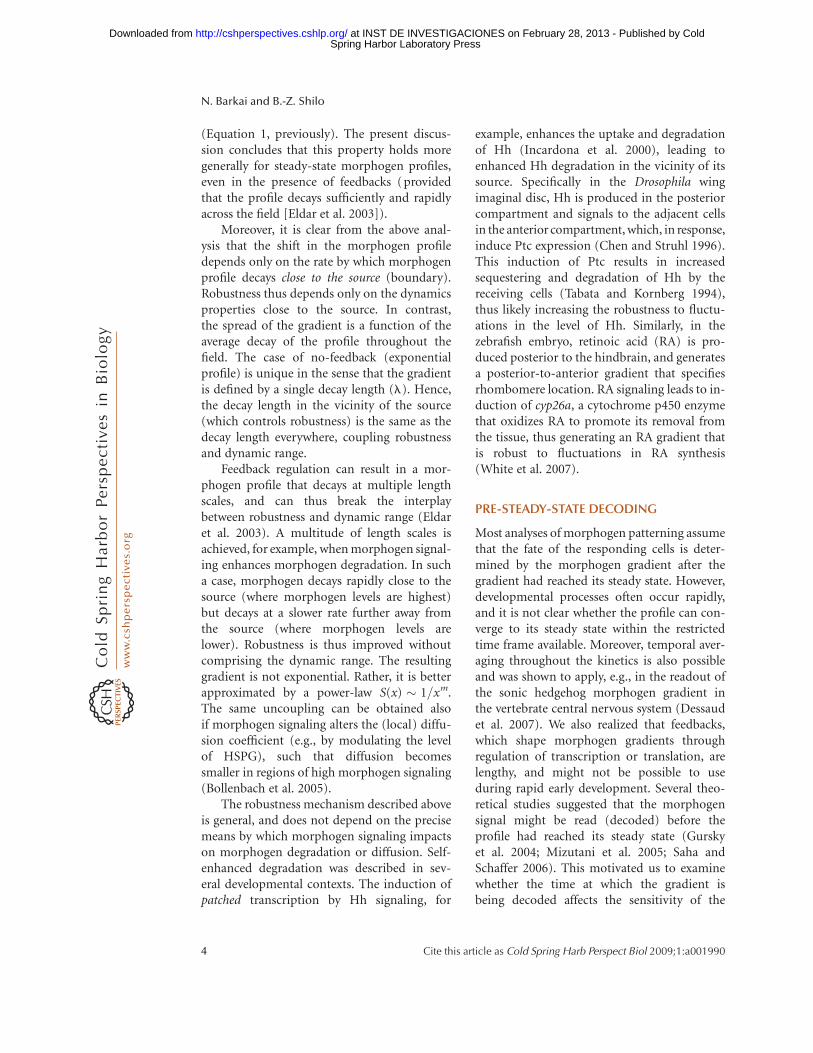
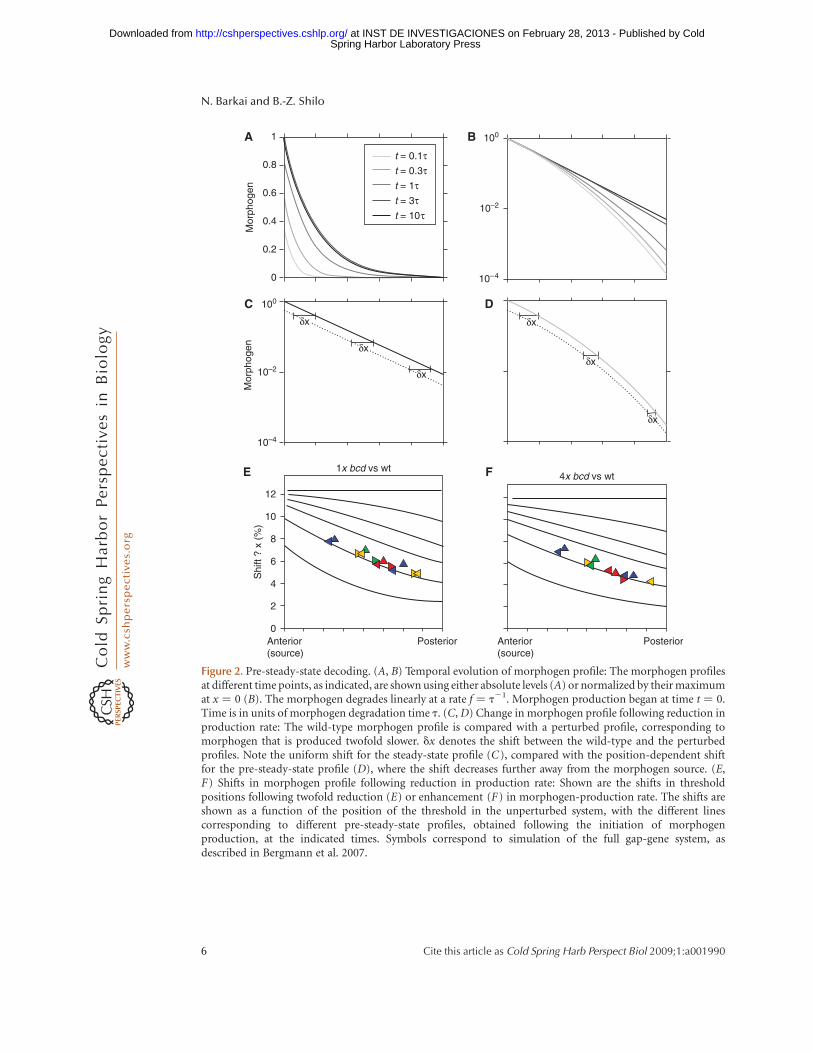
The mathematical formula describing thepre-steady-state morphogen profile is some-what more complex than that describing thesteady-state distribution, precluding meaning-ful analytical manipulation. Still, the sensitivityof the pre-steady-state profile to changes inmorphogen production rate can be predictedusing straightforward numerical integration(Bergmann et al. 2007). Two features that dis-tinguish the pre-steady-state profile weredescribed. First, the shift in profile following achange in morphogen production rate is notuniform. Rather, thresholds positioned differ-ently across the field shift to different extents(Fig. 2). This is in contrast to the uniformshift expected of the steady-state profile, as dis-cussed previously. The reason for this differenceis that the morphogen profile does not convergeto its steady state at a uniform rate everywhere.Rather, positions that are close to the sourceconverge rapidly, whereas positions that arefurther away take a longer time to converge.Consequently, at any point in time, differentpositions will be at different stages of theirdynamics, and this will affect the shift in theirposition when morphogen production rate isperturbed.
A second interesting aspect is that, for mostthreshold positions, the sensitivity to morpho-gen production rate is in fact lower when decod-ing is performed before steady state has beenreached (Bergmann et al. 2007). The reasonfor this smaller shift in the pre-steady-stategradient has to do with differences in thedecay profile. Thus, although the steady-stateprofile decays exponentially, the rate by whichthe pre-steady-state profile converges to thislimiting exponential pattern increases withthe distance from the source. Consequently,before the steady state, the local steepness ofthe gradient increases with the distance fromthe source. This increased steepness decreasesthe shift in threshold position upon a changein morphogen production rate. It should benoted, however, that although this increasedsteepness enhances robustness, it also com-promises the dynamic range of the profile
because of its more rapid decay away fromthe source.
PRE-STEADY-STATE DECODING OFTHE BICOID MORPHOGEN PROVIDESQUANTITATIVE EXPLANATIONS TO ANUMBER OF UNRESOLVED PROPERTIES OFTHIS PATTERNING SYSTEM
One of the best-studied examples of moleculargradients is that of Bicoid (Bcd), a maternallyencoded transcription factor that plays apivotal role in patterning the early Drosophilaembryo (reviewed in Ephrussi and Johnston2004). Visualization of the graded Bcd dis-tribution along the anterior–posterior axis ofthe embryo provided the first experimentaldemonstration that molecular gradients exist(Driever and Nusslein-Volhard 1988a,b). Bcdinduces the expression of different targetgenes (termed “gap genes”) in a concentration-dependent manner, leading to their expres-sion in distinct spatial domains along theanterior–posterior axis (Driever et al. 1989a;Driever and Nusslein-Volhard 1989; Drieveret al. 1989b; Johnston and Nusslein-Volhard1992; Struhl et al. 1989). The pattern of gapgene expression is subsequently refined throughthe cross-regulatory interactions between thegap genes themselves, which, similar to Bcd,function as transcription factors (Rivera-Pomar and Jackle 1996).
Consistent with Bcd functioning as amorphogen, changes in the dosage of maternalBcd cause a shift in the expression domainsof Bcd-target genes such as hunchback (hb).Reducing Bcd dosage leads to an anteriorshift, whereas increasing its dosage shifts theexpression domains posteriorly. Surprisingly,however, several studies noted that the observedshifts are significantly smaller than expectedby the simple morphogen model (Driever andNusslein-Volhard 1988a; Houchmandzadehet al. 2002). For example, in embryos derivedfrom mothers bearing only one functionalallele of bcd, the Hb expression domain shiftsby only �7% embryo length (EL), about halfof what is expected theoretically. These anoma-lous shifts in cell fates were recognized over two
Robust Generation and Decoding
Cite this article as Cold Spring Harb Perspect Biol 2009;1:a001990 5
Spring Harbor Laboratory Press at INST DE INVESTIGACIONES on February 28, 2013 - Published by Coldhttp://cshperspectives.cshlp.org/Downloaded from
0
12
10
8
6
4
2
0
0.2
t = 10tt = 3tt = 1tt = 0.3tt = 0.1t
0.4
0.6
0.8
1 100
10–2
10–4
Shi
ft ?
x (%
)
A B
E F
Anterior(source)
Anterior(source)
Posterior Posterior
100
10–2
dx
dx
dx
dx
10–4
1x bcd vs wt4x bcd vs wt
Mor
phog
enM
orph
ogen
C D
dx
dx
Figure 2. Pre-steady-state decoding. (A, B) Temporal evolution of morphogen profile: The morphogen profilesat different time points, as indicated, are shown using either absolute levels (A) or normalized by their maximumat x ¼ 0 (B). The morphogen degrades linearly at a rate f ¼ t21. Morphogen production began at time t ¼ 0.Time is in units of morphogen degradation time t. (C, D) Change in morphogen profile following reduction inproduction rate: The wild-type morphogen profile is compared with a perturbed profile, corresponding tomorphogen that is produced twofold slower. dx denotes the shift between the wild-type and the perturbedprofiles. Note the uniform shift for the steady-state profile (C), compared with the position-dependent shiftfor the pre-steady-state profile (D), where the shift decreases further away from the morphogen source. (E,F) Shifts in morphogen profile following reduction in production rate: Shown are the shifts in thresholdpositions following twofold reduction (E) or enhancement (F) in morphogen-production rate. The shifts areshown as a function of the position of the threshold in the unperturbed system, with the different linescorresponding to different pre-steady-state profiles, obtained following the initiation of morphogenproduction, at the indicated times. Symbols correspond to simulation of the full gap-gene system, asdescribed in Bergmann et al. 2007.
N. Barkai and B.-Z. Shilo
6 Cite this article as Cold Spring Harb Perspect Biol 2009;1:a001990
Spring Harbor Laboratory Press at INST DE INVESTIGACIONES on February 28, 2013 - Published by Coldhttp://cshperspectives.cshlp.org/Downloaded from
decades ago, in the early analysis of the Bcd gra-dient (Driever and Nusslein-Volhard 1988a),and were further emphasized by recent quanti-tative measurements (Houchmandzadeh et al.2002).
The simple morphogen model was furtherchallenged by several observations that seemedto decouple the hb-expression domain fromthe Bcd gradient. First, it was shown thatchanges in temperature alter the Bcd gradientbut do not influence the hb-expression domain(Houchmandzadeh et al. 2002; Lucchetta et al.2005). An additional difficulty was raised whenthe stochastic fluctuations in the bindingof Bcd to gene promoters were considered(Gregor et al. 2007a; Gregor et al. 2007b). Itwas argued, based on physical considerations,that this noise is too high to allow distinc-tion between the Bcd levels at two neighbor-ing nuclei at the border of the hb-expressiondomain. Again, it was proposed that a novel,yet to be determined mechanism is usedfor ensuring the high precision by which thehb-expression domain is defined, as seenexperimentally.
We revisited these issues, and in particularthe anomalous shift in gap-gene expressiondomains, by examining the basic assump-tions leading to the apparent inconsistenciesbetween the measured and the predicted shifts(Bergmann et al. 2007). In previous studies,the expected shifts in Hb expression domainsfollowing a change in Bcd dosage were calcu-lated using Equation 1. This equation requirestwo parameters: l, the decay length of themorphogen, and h, the relative change in Bcddosage. Both parameters can be readily esti-mated: l is deduced from the measured Bcdprofile, whereas h is well approximated by thechange in the number of maternal copies ofbcd. We noted, however, that the use ofEquation 1 is justified only if the profile hadreached its steady state. As we discussed pre-viously, the expected shifts are different if theBcd profile is decoded early, before reachingits steady state. A first indication that thesteady-state assumption might not hold herewas provided by the shifts in gap-gene ex-pression domains upon change in Bcd dosage,
which were shown to be strongly position-dependent (Bergmann et al. 2007): Anteriorgap genes display a relatively high sensitivityto changes in Bcd dosage, whereas those thatare expressed more posteriorly display a lowersensitivity. As discussed above, this position-dependent shift is a signature of a pre-steady-state decoding.
Pre-steady-state decoding provides a parsi-monious explanation to other apparent mys-teries characterizing the relationship betweenHb and Bcd (Bergmann et al. 2007; Bergmannet al. 2008). First and foremost, the measuredshifts in Hb expression domain are fullyexplained by the corresponding changes inBcd dosage. Second, at early times, greater dis-tances separate the nuclei, increasing the differ-ence in Bcd dosage between neighboringnuclei, and limiting the impact of stochasticfluctuations. Finally, it was shown that Hbprofile scales with the natural variations inembryo size whereas the Bcd profile doesnot (Driever and Nusslein-Volhard 1988a;Houchmandzadeh et al. 2002). This, again, canbe explained by the pre-steady-state theory,under the additional assumption that Bcd tran-smits rapidly between nucleus and cytoplasm(Gregor et al. 2007b). In such a case, the pre-steady-state profile (defining Hb expressiondomain) scales with embryo size, whereasthe late, steady-state profile of Bcd does not(Bergmann et al. 2007).
Experiments analyzing the Bcd gradientwere reported recently (Gregor et al. 2007b),but their interpretation is under debate(Bergmann et al. 2008). Three different ap-proaches for measuring the Bcd diffusioncoefficient gave a consistently low value of D�0.3 mm2/s (Gregor et al. 2007b). Consideringthe relevant time scale in which patterning takesplace (�90 min following egg lay), and thescale of the Bcd gradient (�100 microns),this diffusion coefficient is clearly inconsistentwith the steady-state assumption. In fact, evenfor pre-steady-state decoding, this low diffusionentails a high production of the Bcd protein inorder to allow for sufficient accumulation ofBcd at mid-embryo, which enables the determi-nation of Hb transcription at early times.
Robust Generation and Decoding
Cite this article as Cold Spring Harb Perspect Biol 2009;1:a001990 7
Spring Harbor Laboratory Press at INST DE INVESTIGACIONES on February 28, 2013 - Published by Coldhttp://cshperspectives.cshlp.org/Downloaded from
Interestingly, direct measurements of nuclearBcd-GFP distribution in early embryos didreveal a stable pattern as early as stage 10–11.This apparent contradiction might be recon-ciled by further analysis, which showed thatthe total level of Bcd does in fact continueto accumulate in embryos (Bergmann et al.2008). This analysis suggested that the overallprofile has not yet reached its steady state, inaccordance with the pre-steady-state hypoth-esis. Further clarification of these issues willrequire measuring the Bicoid degradationtime, and the time of gap genes determinationby the Bcd gradient, which are not yet available.
NONCANONICAL GRADIENT FORMATION:ESTABLISHING A SHARP DISTRIBUTIONFROM A SHALLOW SOURCE
Our discussion so far has focused on the canon-ical model of morphogen gradient formation,which assumes that morphogen is secreted bya localized source, and diffuses to create a gradi-ent that peaks at the source (Fig. 3A). Althoughthis model is applicable to many systems, othercases exist where morphogen is in fact producedin a broad domain but its activity is sub-sequently restricted to a narrow area that iswell within its domain of expression (Fig. 3B).Properties of gradients created by this paradigmare significantly less understood.
The dorsoventral (DV) axis of the earlyDrosophila embryo is patterned by a gradedactivity of the bone-morphogenetic protein(BMP) (Ferguson and Anderson 1992). Thissystem provides a well-studied example for thenoncanonical strategy for morphogen gradientformation. Two BMP ligands (Screw and Dpp)participate in this patterning, and both arebroadly expressed: Dpp is produced in thedorsal domain whereas Screw is producedthroughout the embryo (reviewed by Rafteryand Sutherland 1999). The key asymmetryleading to the formation of a BMP-activationgradient is the secretion of the BMP inhibitor,Short gastrulation (Sog), from the neuroecto-derm regions flanking the dorsal domain(Srinivasan et al. 2002). The resulting activationgradient is sharp enough to subdivide the
dorsal domain into several distinct regions ofgene expression.
The protein components involved in thispatterning system, as well as the interactionbetween them, are well described. Still, thefunction of this patterning network dependson the quantitative values of the kineticparameters. In fact, changing the parametervalues might not only alter the quantitativedynamics, but also lead to a qualitatively differ-ent mechanism for gradient formation. Forexample, if only some of the proteins or com-plexes are allowed to diffuse, a gradient will beestablished by a mechanism that is distinctfrom the case where all protein species areallowed to diffuse. The values of these kineticparameters are largely unknown. How thencan modeling assist in our understanding ofthe patterning mechanism?
Our working hypothesis is that evolutionfavors a robust network design. Specifically, weassumed that the networks that function innature display minimal sensitivity to fluctu-ations in gene dosage or kinetic parameters.Because the subspace of robust networks is typi-cally small, identifying a robust topology canpredict the patterning mechanism, which canthen be verified experimentally.
The best way to describe the function ofa patterning network for an arbitrary set ofparameters is to formulate a general enoughmodel, and derive an analytical solution forthe concentrations of the different molecularspecies. Such an analytical solution, however,is typically difficult to obtain, in particular forthe noncanonical paradigm for morphogengradient formation, where several diffusingand interacting species cooperate in establishingthe gradient. A numerical screen provides analternative approach. The idea here is to startfrom a general (“liberal”) model that is restrictedonly by the known network topology, and tosolve this model systematically over a widerange of parameters. Each parameter choiceconsists of a particular “network.” The consis-tency of each network with experimentalevidence or some other requirement (e.g.,robustness) is then evaluated, and the propertiesof the “consistent” networks are characterized.
N. Barkai and B.-Z. Shilo
8 Cite this article as Cold Spring Harb Perspect Biol 2009;1:a001990
Spring Harbor Laboratory Press at INST DE INVESTIGACIONES on February 28, 2013 - Published by Coldhttp://cshperspectives.cshlp.org/Downloaded from
–1 –0.5 0 0.5 10
0.2
0.4
0.6
0.8
1
Position
Act
ivat
ion
leve
l
A Canonical model
Activator
–1 –0.5 0 0.5 10
0.2
0.4
0.6
0.8
1
Position
Act
ivat
ion
leve
l
Noncanonicalmodel
ActivatorInhibitor Inhibitor
B
Inhibition Shuttling
Inhibitor
Totalmorphogen
Activation
Con
cent
ratio
n
D L V
Inhibitor
Totalmorphogen
Activation
D L V
DC
E F
BM
P a
ctiv
ity
Con
cent
ratio
nB
MP
act
ivity
Normalized position
wt wt
Normalized position
–1.5 –1 –0.5 0 0.5 1 1.50
0.5
1
1.5
2
Position Position
Con
cent
ratio
n
Wild type
G
ComplexFree inhibitor
–1.5 –1 –0.5 0 0.5 1 1.5
100
101
102
Act
ivat
or c
once
ntra
tion
HRobustness to change in inhibitor dosage
–1.5 –1 –0.5 0 0.5 1 1.5
100
101
102
103
Position
Act
ivat
or c
once
ntra
tion
IRobustness to changein activator dosage
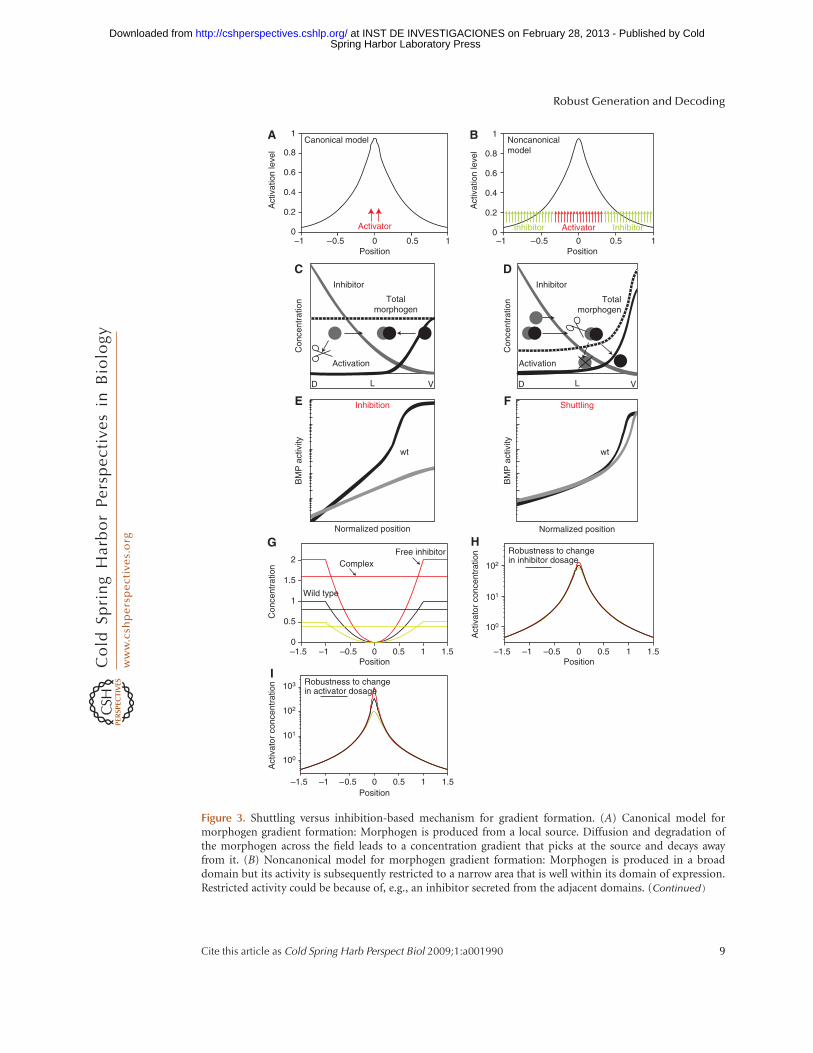
Figure 3. Shuttling versus inhibition-based mechanism for gradient formation. (A) Canonical model formorphogen gradient formation: Morphogen is produced from a local source. Diffusion and degradation ofthe morphogen across the field leads to a concentration gradient that picks at the source and decays awayfrom it. (B) Noncanonical model for morphogen gradient formation: Morphogen is produced in a broaddomain but its activity is subsequently restricted to a narrow area that is well within its domain of expression.Restricted activity could be because of, e.g., an inhibitor secreted from the adjacent domains. (Continued)
Robust Generation and Decoding
Cite this article as Cold Spring Harb Perspect Biol 2009;1:a001990 9
Spring Harbor Laboratory Press at INST DE INVESTIGACIONES on February 28, 2013 - Published by Coldhttp://cshperspectives.cshlp.org/Downloaded from
SHUTTLING MECHANISM: GENERATING ASHARP AND ROBUST GRADIENT
We analyzed the BMP patterning network inDrosophila using the numerical screen approach(Eldar et al. 2002). The results of this screenrevealed two distinct mechanisms that can beused for establishing an activation gradient.The first class of networks achieved patterningby relying strictly on the inhibition of BMP byits inhibitor Sog. Within this inhibition-basedmechanism (Fig. 3C), the inhibitor Sog diffusesinto a region of uniform BMP, where it is alsocleaved by a protease (Tolloid). A gradient ofinhibition is generated, leading to an inverseactivation gradient. This mechanism does notrequire the redistribution of BMP moleculesthemselves. Rather, BMP may still be uniformlydistributed, but its activity is now graded be-cause of the graded distribution of its inhibitor.
An alternative, shuttling-based mechanismwas also proposed (Holley et al. 1996), andwas found to be implemented by the secondclass of networks (Fig. 3D). Here, the inhibitorSog functions to physically translocate the BMPmolecules to the dorsal region. The activationgradient now reflects mostly the graded redistri-
bution of the BMP molecules themselves, and
not the inhibition of their activity by graded
Sog. Shuttling is obtained when BMP diffusesprimarily when bound by Sog. This binding
is also assumed to facilitate the degradation of
Sog by its protease, Tolloid. Conversely, free
BMP does not readily diffuse, thus accumulat-ing in the dorsal-most region where the levels
of free Sog are low. This lack of diffusion of
Dpp could result, for example, from its rapidbinding to receptors or to components of the
extracellular environment.
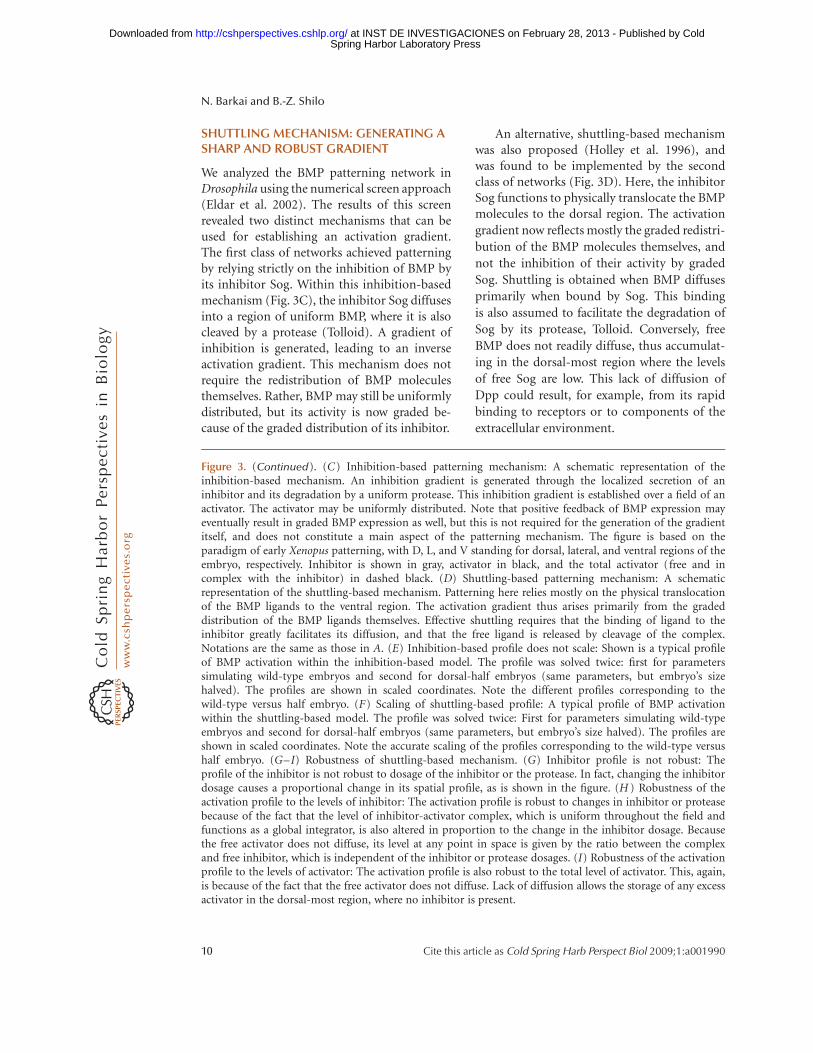
Figure 3. (Continued). (C) Inhibition-based patterning mechanism: A schematic representation of theinhibition-based mechanism. An inhibition gradient is generated through the localized secretion of aninhibitor and its degradation by a uniform protease. This inhibition gradient is established over a field of anactivator. The activator may be uniformly distributed. Note that positive feedback of BMP expression mayeventually result in graded BMP expression as well, but this is not required for the generation of the gradientitself, and does not constitute a main aspect of the patterning mechanism. The figure is based on theparadigm of early Xenopus patterning, with D, L, and V standing for dorsal, lateral, and ventral regions of theembryo, respectively. Inhibitor is shown in gray, activator in black, and the total activator (free and incomplex with the inhibitor) in dashed black. (D) Shuttling-based patterning mechanism: A schematicrepresentation of the shuttling-based mechanism. Patterning here relies mostly on the physical translocationof the BMP ligands to the ventral region. The activation gradient thus arises primarily from the gradeddistribution of the BMP ligands themselves. Effective shuttling requires that the binding of ligand to theinhibitor greatly facilitates its diffusion, and that the free ligand is released by cleavage of the complex.Notations are the same as those in A. (E) Inhibition-based profile does not scale: Shown is a typical profileof BMP activation within the inhibition-based model. The profile was solved twice: first for parameterssimulating wild-type embryos and second for dorsal-half embryos (same parameters, but embryo’s sizehalved). The profiles are shown in scaled coordinates. Note the different profiles corresponding to thewild-type versus half embryo. (F) Scaling of shuttling-based profile: A typical profile of BMP activationwithin the shuttling-based model. The profile was solved twice: First for parameters simulating wild-typeembryos and second for dorsal-half embryos (same parameters, but embryo’s size halved). The profiles areshown in scaled coordinates. Note the accurate scaling of the profiles corresponding to the wild-type versushalf embryo. (G–I) Robustness of shuttling-based mechanism. (G) Inhibitor profile is not robust: Theprofile of the inhibitor is not robust to dosage of the inhibitor or the protease. In fact, changing the inhibitordosage causes a proportional change in its spatial profile, as is shown in the figure. (H ) Robustness of theactivation profile to the levels of inhibitor: The activation profile is robust to changes in inhibitor or proteasebecause of the fact that the level of inhibitor-activator complex, which is uniform throughout the field andfunctions as a global integrator, is also altered in proportion to the change in the inhibitor dosage. Becausethe free activator does not diffuse, its level at any point in space is given by the ratio between the complexand free inhibitor, which is independent of the inhibitor or protease dosages. (I) Robustness of the activationprofile to the levels of activator: The activation profile is also robust to the total level of activator. This, again,is because of the fact that the free activator does not diffuse. Lack of diffusion allows the storage of any excessactivator in the dorsal-most region, where no inhibitor is present.
N. Barkai and B.-Z. Shilo
10 Cite this article as Cold Spring Harb Perspect Biol 2009;1:a001990
Spring Harbor Laboratory Press at INST DE INVESTIGACIONES on February 28, 2013 - Published by Coldhttp://cshperspectives.cshlp.org/Downloaded from
As expected, both mechanisms can establisha graded BMP activation profile. The mecha-nisms differ substantially, however, in thesharpness of the resulting profile and also inits robustness. Gradients established by theinhibition-based mechanism are relatively shal-low, and are highly sensitive to the dosages ofthe inhibitor, activator, or protease. In contrast,the shuttling-based mechanism defines a muchsharper profile, and this profile is robust tochanges in gene dosage (Eldar et al. 2002;Meinhardt and Roth 2002). The mechanismsensuring the robustness of the activationprofile to the dosage of the inhibitor or the pro-tease, and to the dosage of the activator itself,are explained in Figure 3G,H, respectively.The finding that the shuttling-based mecha-nism confers a significantly higher robustnessled us to propose that this mechanism operatesin Drosophila. This prediction was confirmedexperimentally in the Drosophila embryo(Eldar et al. 2002; Mizutani et al. 2005; Shimmiet al. 2005; Wang and Ferguson 2005) (reviewby O’Connor et al. 2006) and was subsequentlyalso shown to be used for patterning theembryonic DV axis in short-germ insects (vander Zee et al. 2006).
Notably, this strategy for creating a patternis particularly useful for early embryos, wheredistinct yet broad zygotic gene expressiondomains are defined, but a highly restrictedsource for morphogen production has notbeen generated yet. The physical concentrationof ligand by shuttling molecules providedby adjacent tissues can thus generate a sharpand robust morphogen profile, even in theabsence of a restricted morphogen expressionsource.
SHUTTLING OF BMP LIGANDS INXENOPUS: IMPLICATION FOR THESCALING OF PATTERN WITH SIZE
So far, we focused on the property of robustness,defined as the quantitative ability to buffer fluc-tuations in gene dosage or kinetic rate con-stants. The embryo, however, faces additionalsources of variability, most notably fluctuationsin size. Embryo size can differ greatly, depending
on environmental factors (e.g., nutrition andtemperature) or specific genetic polymor-phisms. The body plan must be adjusted tothese size fluctuations to maintain properproportions between the different tissues ororgans. How this scaling of pattern with size isachieved mechanistically is largely unknown.
The ability of embryos to scale pattern withsize was emphasized most dramatically in twoclassical experiments performed by HansSpemmann at the beginning of the century(reviewed in De Robertis 2006). The first exper-iment showed that dorsal-half embryos grow togenerate a complete and well-proportionedembryo, albeit smaller in size. The secondexperiment shows that transplanting a dorsalgroup of cells from one embryo to the ventralside of a second embryo generates a twinnedtadpole. Here also, both axes are well-proportioned and include dorsal, lateral, andventral tissues. The precision of scaling, andthe lack of compensatory growth, was furtherillustrated in subsequent quantitative exper-iments (Cooke 1981).
What is the mechanistic basis for scaling?One of our motivations in addressing thisquestion was the fact that the patterningnetwork involved is largely homologous to thenetwork that patterns the dorsal region ofthe early Drosophila embryo, discussed above(De Robertis and Kuroda 2004; Holley andFerguson 1997). In fact, in all bilatera, DV pat-terning of the early embryo involves a gradedBMP activation profile, although in vertebratesthe positions are inverted with respect toDrosophila, i.e., maximal activation by BMPtakes place at the ventral side. Other com-ponents of the patterning network are alsoconserved. For example, the key asymmetry ingenerating the BMP activation gradient inamphibians relies on the localized secretion ofa BMP inhibitor (including Chordin, homol-ogous to Sog), which is produced at the dorsalregion by cells of the “Spemman organizer”(De Robertis and Kuroda 2004). An importantdifference between the Drosophila and ver-tebrate systems, however, is the use of a uniqueBMP ligand in vertebrates, Admp (Reversadeand De Robertis 2005), which is repressed by
Robust Generation and Decoding
Cite this article as Cold Spring Harb Perspect Biol 2009;1:a001990 11
Spring Harbor Laboratory Press at INST DE INVESTIGACIONES on February 28, 2013 - Published by Coldhttp://cshperspectives.cshlp.org/Downloaded from
BMP signaling and accordingly is expressedtogether with the BMP inhibitor Chordin inthe dorsal region, where pathway activation islowest.
Using a numeric screen for networks thatsupport scaling, we identified again the shuttingmechanism. This mechanism provided a simple,quantitative explanation for the capacity of theXenopus embryo to scale pattern with size(Ben-Zvi et al. 2008). The key for scaling wasthe shuttling of two types of BMP ligands, acanonical one (BMP) and noncanonical one(Admp), both of which compete for bindingto the inhibitor Chordin. This competitionallows for a range of possible activation profiles,depending on the relative amount of the twoligands in the system. The precise activationprofile can thus be controlled by modulatingthe levels of the two BMP ligands. Importantly,these levels are in fact controlled through feed-back loops. In particular, Admp expression isrepressed by the BMP pathway. This repressionprovides an effective means for measuring thesize of the embryo and adjusting the morphogenprofile accordingly.
More precisely, note that the repression ofAdmp by BMP signaling functions to “pin” themagnitude of BMPactivation at the dorsal-mostside to a precise value, defined by the thresholdat which Admp expression is repressed. Oncethis boundary level of the activation gradienthad been determined, the rest of the gradientwill follow, resulting in a robust scaling of themorphogen profile (both length scale andamplitude) with embryo size. Intriguingly,we find that this scaling mechanism functionsthrough an effective implementation of anintegral-feedback controller, a key concept inengineering (Barkai and Ben-Zvi 2009).
GRADIENT INTERPRETATION: USINGSHALLOW GRADIENTS TO DEFINESHARP ACTIVATION BORDERS
Because the distribution of a morphogen isgoverned by diffusion processes, its profile issmooth, decaying gradually between adjacentcells. This continuous distribution is convertedto well-defined domains of gene expression,
demarcated by sharp borders. This poses achallenge for the responding cells: how tosense small differences in morphogen activationprofile, and execute one of several alternativegene expression programs, accordingly. Coop-erative binding to the regulatory region of theresponding target gene provides one solution,and is used, for example, in the responsesto the early Bicoid or Dorsal gradients inDrosophila embryos (Jiang and Levine 1993;Struhl et al. 1989). The degree of cooperativitydetermines the sharpness of the response, andthe binding affinity dictates the position ofthe borders of expression with respect to thesource of the gradient.
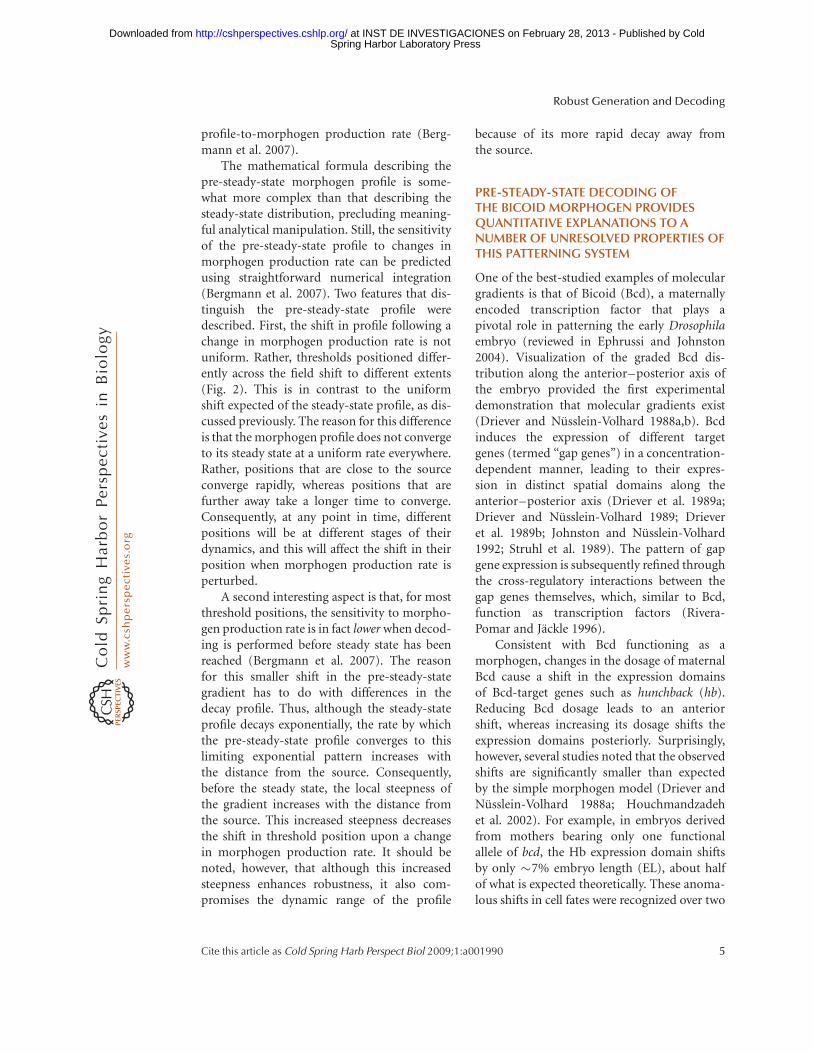
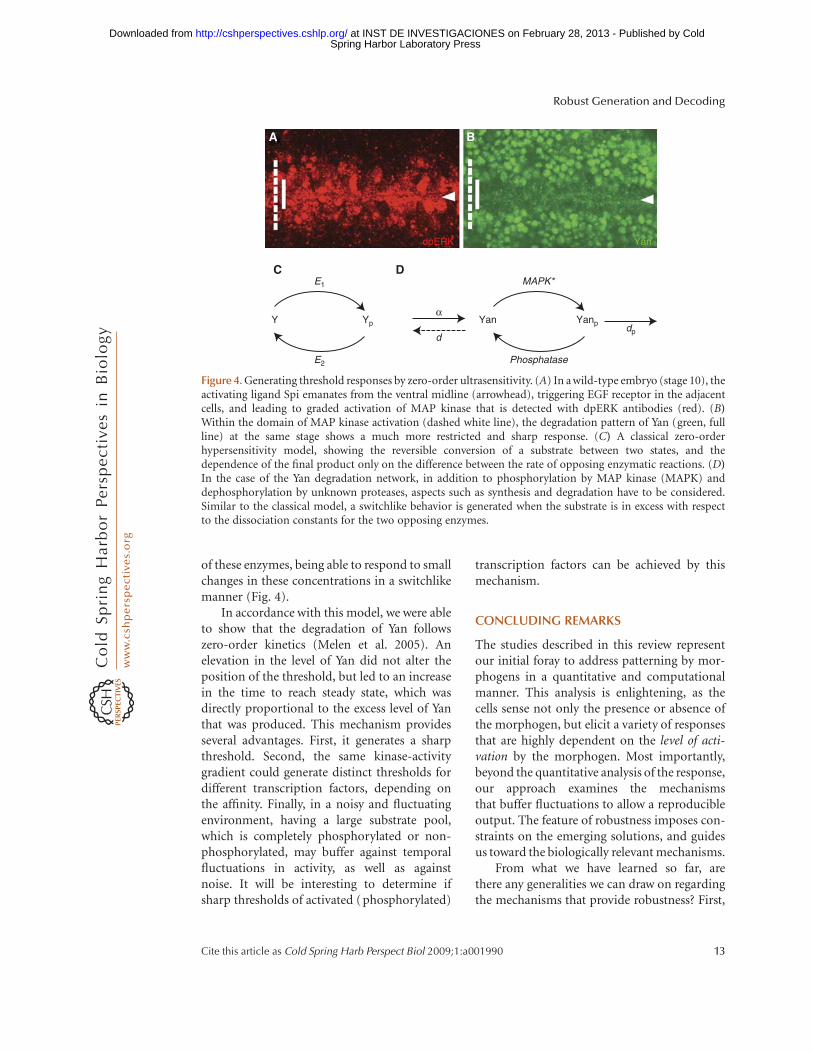
We sought alternative mechanisms forgenerating threshold responses. The ETS-transcription factor Pointed executes most ofthe transcriptional responses following EGFreceptor activation in Drosophila (Gabay et al.1996). Different Pointed isoforms are acti-vated at the transcriptional or posttranscrip-tional level, by MAP kinase phosphorylation.In parallel, the repressor ETS-domain proteinYan is phophorylated by MAP kinase, leadingto its nuclear export and degradation. Thesharp border of Yan degradation, which iswell within the domain of graded activationof the EGF receptor (Fig. 4), prompted us toexamine the mechanism in detail.
Goldbeter and Koshland have suggestedthat sharp borders can be defined by a mecha-nism they coined “zero order ultrasensitivity”(Goldbeter and Koshland 1981; Goldbeterand Wolpert 1990). This mechanism considersa reversible reaction in which substrate is, forexample, phosphorylated and dephosphory-lated, and assumes that the substrate is inexcess, allowing both reactions to occur at zeroorder (saturation). Under these conditions,the rate of reactions is practically independentof the concentration of the substrate. Allsubstrate will thus accumulate as one of theforms, depending simply on the differencein the rates of the forward and backwardreactions. Because the rates of the reactionsdepend on the concentration of the modifyingand de-modifying enzymes, this system is ultra-sensitive to small changes in the concentrations
N. Barkai and B.-Z. Shilo
12 Cite this article as Cold Spring Harb Perspect Biol 2009;1:a001990
Spring Harbor Laboratory Press at INST DE INVESTIGACIONES on February 28, 2013 - Published by Coldhttp://cshperspectives.cshlp.org/Downloaded from
of these enzymes, being able to respond to smallchanges in these concentrations in a switchlikemanner (Fig. 4).
In accordance with this model, we were ableto show that the degradation of Yan followszero-order kinetics (Melen et al. 2005). Anelevation in the level of Yan did not alter theposition of the threshold, but led to an increasein the time to reach steady state, which wasdirectly proportional to the excess level of Yanthat was produced. This mechanism providesseveral advantages. First, it generates a sharpthreshold. Second, the same kinase-activitygradient could generate distinct thresholds fordifferent transcription factors, depending onthe affinity. Finally, in a noisy and fluctuatingenvironment, having a large substrate pool,which is completely phosphorylated or non-phosphorylated, may buffer against temporalfluctuations in activity, as well as againstnoise. It will be interesting to determine ifsharp thresholds of activated (phosphorylated)
transcription factors can be achieved by thismechanism.
CONCLUDING REMARKS
The studies described in this review representour initial foray to address patterning by mor-phogens in a quantitative and computationalmanner. This analysis is enlightening, as thecells sense not only the presence or absence ofthe morphogen, but elicit a variety of responsesthat are highly dependent on the level of acti-vation by the morphogen. Most importantly,beyond the quantitative analysis of the response,our approach examines the mechanismsthat buffer fluctuations to allow a reproducibleoutput. The feature of robustness imposes con-straints on the emerging solutions, and guidesus toward the biologically relevant mechanisms.
From what we have learned so far, arethere any generalities we can draw on regardingthe mechanisms that provide robustness? First,
dpERK
E1 MAPK*
a
E2 Phosphatase
Y Yan YanpYp
C D
A B
Yan
ddp
Figure 4. Generating threshold responses by zero-order ultrasensitivity. (A) In a wild-type embryo (stage 10), theactivating ligand Spi emanates from the ventral midline (arrowhead), triggering EGF receptor in the adjacentcells, and leading to graded activation of MAP kinase that is detected with dpERK antibodies (red). (B)Within the domain of MAP kinase activation (dashed white line), the degradation pattern of Yan (green, fullline) at the same stage shows a much more restricted and sharp response. (C) A classical zero-orderhypersensitivity model, showing the reversible conversion of a substrate between two states, and thedependence of the final product only on the difference between the rate of opposing enzymatic reactions. (D)In the case of the Yan degradation network, in addition to phosphorylation by MAP kinase (MAPK) anddephosphorylation by unknown proteases, aspects such as synthesis and degradation have to be considered.Similar to the classical model, a switchlike behavior is generated when the substrate is in excess with respectto the dissociation constants for the two opposing enzymes.
Robust Generation and Decoding
Cite this article as Cold Spring Harb Perspect Biol 2009;1:a001990 13
Spring Harbor Laboratory Press at INST DE INVESTIGACIONES on February 28, 2013 - Published by Coldhttp://cshperspectives.cshlp.org/Downloaded from
these mechanisms are not absolute, but onlyminimize the effects of fluctuations. Second,diverse strategies seem to be used, and areadapted to each of the systems. In the case ofligand-induced degradation, the morphogendistribution close to the source is uncoupledfrom its distribution away from the source.For the Bicoid gradient, early decodingbefore steady state may minimize fluctuations.Finally, for the early BMP gradients, the physicalconcentration of the ligand generates notonly a graded activation profile, but may alsotranslocate excess ligand to a narrower region,thus minimizing the effects of fluctuationsin ligand levels. The striking conservation ofrobustness mechanisms, e.g., in the case ofBMP ligand shuttling, indicates that they arean integral part of the patterning pathwaysthat they regulate.
ACKNOWLEDGMENT
This work was supported by the Hellen andMartin Kimmel award for innovative investi-gations, the EU (ERC), Minerva, the IsraelScience Foundation to N.B., and a grant fromthe Israel Science Foundation (converging tech-nology). B-Z.S. holds the Hilda and Cecil LewisProfessorial chair in Molecular Genetics.
REFERENCES
Akiyama T, Kamimura K, Firkus C, Takeo S, Shimmi O,Nakato H. 2008. Dally regulates Dpp morphogen gradi-ent formation by stabilizing Dpp on the cell surface.Dev Biol 313: 408–419.
Barkai N, Ben-Zvi D. 2009. ‘Big frog, small frog’–maintaining proportions in embryonic development:Delivered on 2 July 2008 at the 33rd FEBS Congress inAthens, Greece. FEBS J 276: 1196–1207.
Ben-Zvi D, Shilo BZ, Fainsod A, Barkai N. 2008. Scaling ofthe BMP activation gradient in Xenopus embryos. Nature453: 1205–1211.
Bergmann S, Sandler O, Sberro H, Shnider S, Schejter E,Shilo BZ, Barkai N. 2007. Pre-steady-state decoding ofthe Bicoid morphogen gradient. PLoS Biol 5: e46.
Bergmann S, Tamari Z, Schejter E, Shilo BZ, Barkai N. 2008.Re-examining the stability of the Bicoid morphogengradient. Cell 132: 15–17; author reply 17–18.
Bollenbach T, Kruse K, Pantazis P, Gonzalez-Gaitan M,Julicher F. 2005. Robust formation of morphogen gradi-ents. Phys Rev Lett 94: 018103.
Chen Y, Struhl G. 1996. Dual roles for patched in sequester-ing and transducing Hedgehog. Cell 87: 553–563.
Cooke J. 1981. Scale of body pattern adjusts to available cellnumber in amphibian embryos. Nature 290: 775–778.
De Robertis EM. 2006. Spemann’s organizer and self-regulation in amphibian embryos. Nat Rev Mol CellBiol 7: 296–302.
De Robertis EM, Kuroda H. 2004. Dorsal-ventral patterningand neural induction in Xenopus embryos. Annu Rev CellDev Biol 20: 285–308.
Dessaud E, Yang LL, Hill K, Cox B, Ulloa F, Ribeiro A,Mynett A, Novitch BG, Briscoe J. 2007. Interpretationof the sonic hedgehog morphogen gradient by a temporaladaptation mechanism. Nature 450: 717–720.
Driever W, Ma J, Nusslein-Volhard C, Ptashne M. 1989a.Rescue of bicoid mutant Drosophila embryos by Bicoidfusion proteins containing heterologous activatingsequences. Nature 342: 149–154.
Driever W, Nusslein-Volhard C. 1989. The bicoid protein is apositive regulator of hunchback transcription in the earlyDrosophila embryo. 337: 138–143.
Driever W, Nusslein-Volhard C. 1988a. The bicoid proteindetermines position in the Drosophila embryo in aconcentration-dependent manner. Cell 54: 95–104.
Driever W, Nusslein-Volhard C. 1988b. A gradient of bicoidprotein in Drosophila embryos. Cell 54: 83–93.
Driever W, Thoma G, Nusslein-Volhard C. 1989b.Determination of spatial domains of zygotic geneexpression in the Drosophila embryo by the affinity ofbinding sites for the bicoid morphogen. 340: 363–367.
Eldar A, Dorfman R, Weiss D, Ashe H, Shilo BZ, Barkai N.2002. Robustness of the BMP morphogen gradient inDrosophila embryonic patterning. Nature 419: 304–308.
Eldar A, Rosin D, Shilo BZ, Barkai N. 2003. Self-enhancedligand degradation underlies robustness of morphogengradients. Dev Cell 5: 635–646.
Ephrussi A, Johnston DS. 2004. Seeing is believing: Thebicoid morphogen gradient matures. Cell 116: 143–152.
Ferguson EL, Anderson KV. 1992. decapentaplegic acts as amorphogen to organize dorsal-ventral pattern in theDrosophila embryo. Cell 71: 451–461.
Gabay L, Scholz H, Golembo M, Klaes A, Shilo BZ, KlambtC. 1996. EGF receptor signaling induces pointed P1 tran-scription and inactivates Yan protein in the Drosophilaembryonic ventral ectoderm. Development 122:3355–3362.
Goldbeter A, Koshland DE. 1981. An amplified sensitivityarising from covalent modification in biological systems.Proce Natl Acad Sci 78: 6840–6844.
Goldbeter A, Wolpert L. 1990. Covalent modification ofproteins as a threshold mechanism in development.J Theoret Biol 142: 243–250.
Gregor T, Tank DW, Wieschaus EF, Bialek W. 2007a. Probingthe limits to positional information. Cell 130: 153–164.
Gregor T, Wieschaus EF, McGregor AP, Bialek W, Tank DW.2007b. Stability and nuclear dynamics of the bicoidmorphogen gradient. Cell 130: 141–152.
Gursky VV, Jaeger J, Kozlov KN, Reinitz J, Samsonov AM.2004. Pattern formation and nuclear divisions areuncoupled in Drosophila segmentation: Comparison of
N. Barkai and B.-Z. Shilo
14 Cite this article as Cold Spring Harb Perspect Biol 2009;1:a001990
Spring Harbor Laboratory Press at INST DE INVESTIGACIONES on February 28, 2013 - Published by Coldhttp://cshperspectives.cshlp.org/Downloaded from
spatially discrete and continuous models. Physica D:Nonlinear Phenomena 197: 286–302.
Holley SA, Ferguson EL. 1997. Fish are like flies are like frogs:Conservation of dorsal-ventral patterning mechanisms.Bioessays 19: 281–284.
Holley SA, Neul JL, Attisano L, Wrana JL, Sasai Y, O’ConnorMB, De Robertis EM, Ferguson EL. 1996. The Xenopusdorsalizing factor noggin ventralizes drosophilaembryos by preventing dpp from activating its receptor.Cell 86: 607–617.
Houchmandzadeh B, Wieschaus E, Leibler S. 2002.Establishment of developmental precision and pro-portions in the early Drosophila embryo. Nature415: 798–802.
Incardona JP, Lee JH, Robertson CP, Enga K, Kapur RP,Roelink H. 2000. Receptor-mediated endocytosis ofsoluble and membrane-tethered Sonic hedgehog byPatched-1. Proc Natl Acad Sci 97: 12044–12049.
Jiang J, Levine M. 1993. Binding affinities and cooperativeinteractions with bHLH activators delimit thresholdresponses to the dorsal gradient morphogen. Cell72: 741–752.
Johnston DS, Nusslein-Volhard C. 1992. The origin ofpattern and polarity in the Drosophila embryo. Cell68: 201–219.
Lucchetta EM, Lee JH, Fu LA, Patel NH, Ismagilov RF. 2005.Dynamics of Drosophila embryonic patterning networkperturbed in space and time using microfluidics.Nature 434: 1134–1138.
Meinhardt H, Roth S. 2002. Developmental biology: Sharppeaks from shallow sources. Nature 419: 261–262.
Melen GJ, Levy S, Barkai N, Shilo BZ. 2005. Thresholdresponses to morphogen gradients by zero-order ultra-sensitivity. Mol Syst Biol 1: 0028.
Mizutani CM, Nie Q, Wan FYM, Zhang Y-T, Vilmos P,Sousa-Neves R, Bier E, Marsh JL, Lander AD. 2005.Formation of the BMP Activity Gradient in theDrosophila Embryo. Developmental Cell 8: 915–924.
O’Connor MB, Umulis D, Othmer HG, Blair SS. 2006.Shaping BMP morphogen gradients in the Drosophilaembryo and pupal wing. Development 133: 183–193.
Raftery LA, Sutherland DJ. 1999. TGF-[beta] Family SignalTransduction in Drosophila Development: From Mad toSmads. Developmental Biol 210: 251–268.
Reversade B, De Robertis EM. 2005. Regulation of ADMPand BMP2/4/7 at opposite embryonic poles generatesa self-regulating morphogenetic field. Cell 123:1147–1160.
Rivera-Pomar R, Jackle H. 1996. From gradients to stripes inDrosophila embryogenesis: Filling in the gaps. Trends inGen 12: 478–483.
Saha K, Schaffer DV. 2006. Signal dynamics in Sonic hedge-hog tissue patterning. Development 133: 889–900.
Shimmi O, Umulis D, Othmer H, O’Connor MB. 2005.Facilitated transport of a Dpp/Scw heterodimer bySog/Tsg leads to robust patterning of the Drosophilablastoderm embryo. Cell 120: 873–886.
Srinivasan S, Rashka KE, Bier E. 2002. Creation of a SogMorphogen Gradient in the Drosophila Embryo.Developmental Cell 2: 91–101.
Struhl G, Struhl K, Macdonald PM. 1989. The gradientmorphogen bicoid is a concentration-dependent tran-scriptional activator. Cell 57: 1259–1273.
Tabata T, Kornberg TB. 1994. Hedgehog is a signalingprotein with a key role in patterning Drosophila imaginaldiscs. Cell 76: 89–102.
Teleman AA, Strigini M, Cohen SM. 2001. Shaping mor-phogen gradients. Cell 105: 559–562.
Tsuda M, Kamimura K, Nakato H, Archer M, Staatz W,Fox B, Humphrey M, Olson S, Futch T, Kaluza V,et al. 1999. The cell-surface proteoglycan Dally regulatesWingless signalling in Drosophila. Nature 400:276–280.
van der Zee M, Stockhammer O, von Levetzow C, Nunes daFonseca R, Roth S. 2006. Sog/Chordin is required forventral-to-dorsal Dpp/BMP transport and head for-mation in a short germ insect. Proc Natl Acad Sci103: 16307–16312.
Wang YC, Ferguson EL. 2005. Spatial bistability of Dpp-receptor interactions during Drosophila dorsal-ventralpatterning. Nature 434: 229–234.
White RJ, Nie Q, Lander AD, Schilling TF. 2007. ComplexRegulation of cyp26a1 Creates a Robust RetinoicAcid Gradient in the Zebrafish Embryo. PLoS Biology5: e304.
Wolpert L. 1989. Positional information revisited. Develop-ment 107: 3–12.
Robust Generation and Decoding
Cite this article as Cold Spring Harb Perspect Biol 2009;1:a001990 15
Spring Harbor Laboratory Press at INST DE INVESTIGACIONES on February 28, 2013 - Published by Coldhttp://cshperspectives.cshlp.org/Downloaded from