Embed Size (px)
Citation preview

Comprehensive Evaluation of a Low-Profile Cross-Ventilated Freestall Barn
J. F. Smith Kansas State University, Dept. of Animal Sciences & Ind.
136 Call Hall, Manhattan, KS 66506 785-532-1203, 785-532-5681 FAX
J. P. Harner Kansas State University, Dept. of Biological and Agricultural Engineering
144 Seaton Hall, Manhattan, KS 66506 785-532-2930, 785-532-6944 FAX
[email protected] M. de Haro Marti, University of Idaho, Ron. Sheffield, University of Idaho, J. Zulovich, University of Missouri, S. Pohl, South Dakota State University, C. Fulhage, University of Missouri - Columbia, D. Nicoli (Nicolai), South Dakota State University, B. Hetchler, University of Minnesota, L. Jacobson, University of Minnesota K. Dhuyvetter, Kansas State University, M. J. Brouk, Kansas State University
Introduction Low-profile cross-ventilated freestall buildings are another option for dairy cattle housing. These facilities allow producers to have some control over the cow’s environment during all seasons of the year. They allow buildings to be placed closer to the parlor, reducing time cows are away from feed and water. The overall site footprint of these facilities is smaller than naturally ventilated facilities. The purpose of this study was to conduct a comprehensive evaluation of the physical characteristics of a LPCV 800-head dairy barn located near Milnor, ND. Evaluations of lighting, noise, water use, wind velocities, static pressure, dust, and gas emissions were conducted at three ventilation rates during the spring (May 8 - 12, 2006) and summer (August 28 - 31, 2006).
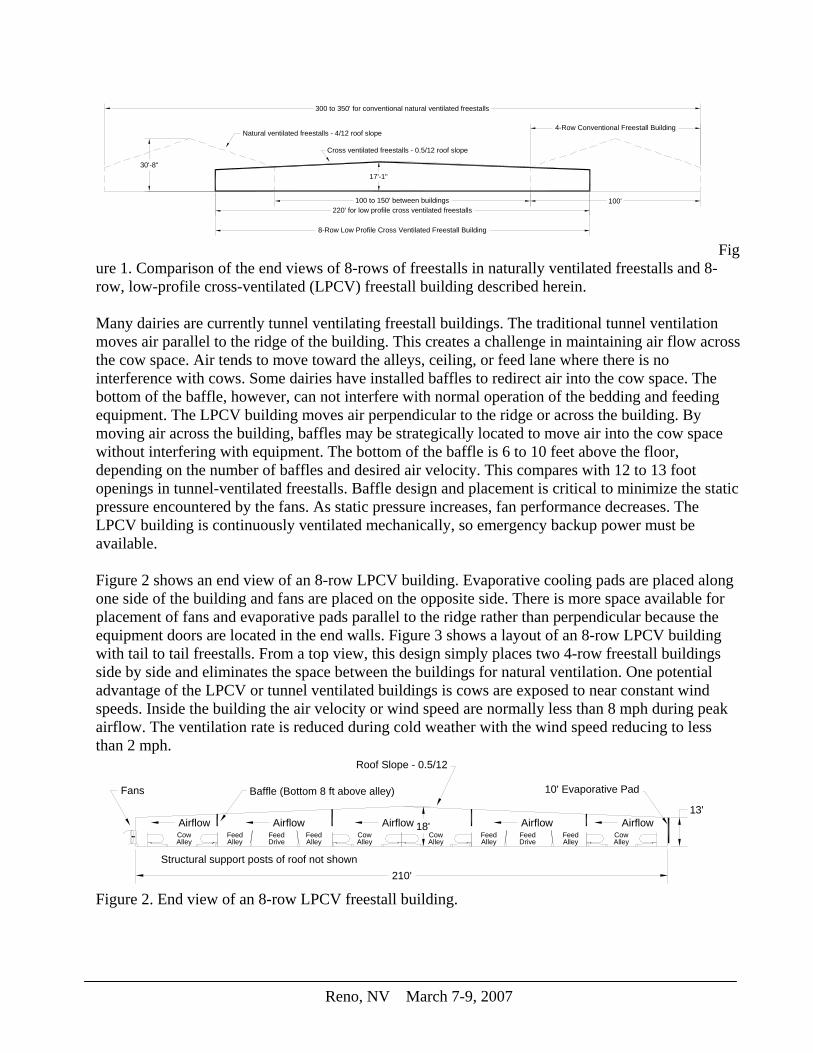
LPCV Characteristics The low-profile results from the roof slope being changed from a 3/12 or 4/12 pitch common with naturally ventilated buildings to a 0.5/12 pitch . Figure 1 shows the difference in ridge height between 4-row natural ventilated buildings and an 8-row Low-Profile Cross-Ventilated (LPCV) building. Contractors are able to use conventional warehouse structures with the LPCV building, reducing the cost of the exterior shell of the building. The interior components and space per cow for resting, socializing, and feeding in an LPCV building is similar to 4-row building. Differences in land space requirements between the two, 4-row natural ventilated freestall buildings and an 8-row LPCV building, are shown in Figure 1.
Western Dairy Management Conference
30'-8"
300 to 350' for conventional natural ventilated freestalls
220' for low profile cross ventilated freestalls
17'-1"
Natural ventilated freestalls - 4/12 roof slope
Cross ventilated freestalls - 0.5/12 roof slope
100'
8-Row Low Profile Cross Ventilated Freestall Building
4-Row Conventional Freestall Building
100 to 150' between buildings
Figure 1. Comparison of the end views of 8-rows of freestalls in naturally ventilated freestalls and 8-row, low-profile cross-ventilated (LPCV) freestall building described herein. Many dairies are currently tunnel ventilating freestall buildings. The traditional tunnel ventilation moves air parallel to the ridge of the building. This creates a challenge in maintaining air flow across the cow space. Air tends to move toward the alleys, ceiling, or feed lane where there is no interference with cows. Some dairies have installed baffles to redirect air into the cow space. The bottom of the baffle, however, can not interfere with normal operation of the bedding and feeding equipment. The LPCV building moves air perpendicular to the ridge or across the building. By moving air across the building, baffles may be strategically located to move air into the cow space without interfering with equipment. The bottom of the baffle is 6 to 10 feet above the floor, depending on the number of baffles and desired air velocity. This compares with 12 to 13 foot openings in tunnel-ventilated freestalls. Baffle design and placement is critical to minimize the static pressure encountered by the fans. As static pressure increases, fan performance decreases. The LPCV building is continuously ventilated mechanically, so emergency backup power must be available. Figure 2 shows an end view of an 8-row LPCV building. Evaporative cooling pads are placed along one side of the building and fans are placed on the opposite side. There is more space available for placement of fans and evaporative pads parallel to the ridge rather than perpendicular because the equipment doors are located in the end walls. Figure 3 shows a layout of an 8-row LPCV building with tail to tail freestalls. From a top view, this design simply places two 4-row freestall buildings side by side and eliminates the space between the buildings for natural ventilation. One potential advantage of the LPCV or tunnel ventilated buildings is cows are exposed to near constant wind speeds. Inside the building the air velocity or wind speed are normally less than 8 mph during peak airflow. The ventilation rate is reduced during cold weather with the wind speed reducing to less than 2 mph.
Structural support posts of roof not shown
FeedDrive
FeedDrive Alley
Feed CowAlley
FeedAlley
CowAlley
CowAlley
CowAlley
FeedAlley
FeedAlley
210'
13'
10' Evaporative PadBaffle (Bottom 8 ft above alley)
Airflow Airflow AirflowAirflowAirflow
Fans
Roof Slope - 0.5/12
18'
Figure 2. End view of an 8-row LPCV freestall building.
Reno, NV March 7-9, 2007
420'
84 - 48" fans
Baffle
184 Freestalls per Pen (46" stall width)
20' Cross Alley (2 8' Water Troughs)
Entrance Doors
10' Wide Evaporative Pad T
o M
ilk P
arlo
r Bottom of Baffle 8' above alley floor (6'4" opening)
200 Cows
200 Headlocks
Baffle
200 Cows
200 Cows
200 Cows
210'
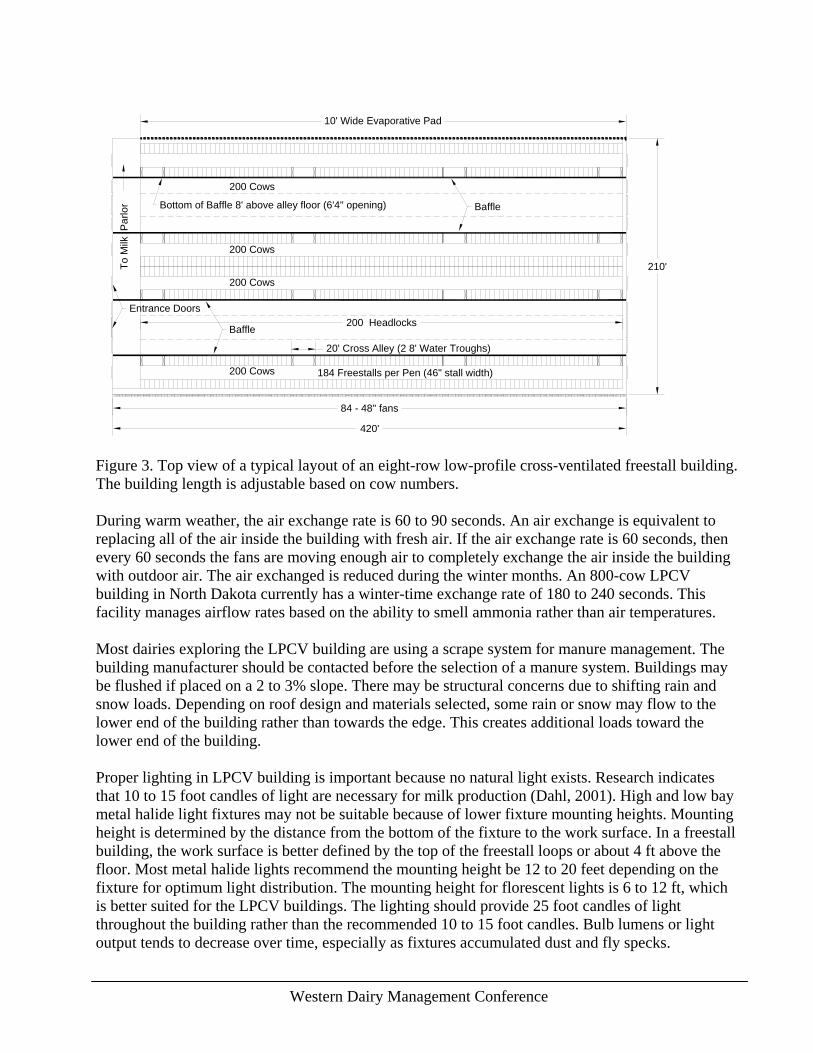
Figure 3. Top view of a typical layout of an eight-row low-profile cross-ventilated freestall building. The building length is adjustable based on cow numbers. During warm weather, the air exchange rate is 60 to 90 seconds. An air exchange is equivalent to replacing all of the air inside the building with fresh air. If the air exchange rate is 60 seconds, then every 60 seconds the fans are moving enough air to completely exchange the air inside the building with outdoor air. The air exchanged is reduced during the winter months. An 800-cow LPCV building in North Dakota currently has a winter-time exchange rate of 180 to 240 seconds. This facility manages airflow rates based on the ability to smell ammonia rather than air temperatures. Most dairies exploring the LPCV building are using a scrape system for manure management. The building manufacturer should be contacted before the selection of a manure system. Buildings may be flushed if placed on a 2 to 3% slope. There may be structural concerns due to shifting rain and snow loads. Depending on roof design and materials selected, some rain or snow may flow to the lower end of the building rather than towards the edge. This creates additional loads toward the lower end of the building. Proper lighting in LPCV building is important because no natural light exists. Research indicates that 10 to 15 foot candles of light are necessary for milk production (Dahl, 2001). High and low bay metal halide light fixtures may not be suitable because of lower fixture mounting heights. Mounting height is determined by the distance from the bottom of the fixture to the work surface. In a freestall building, the work surface is better defined by the top of the freestall loops or about 4 ft above the floor. Most metal halide lights recommend the mounting height be 12 to 20 feet depending on the fixture for optimum light distribution. The mounting height for florescent lights is 6 to 12 ft, which is better suited for the LPCV buildings. The lighting should provide 25 foot candles of light throughout the building rather than the recommended 10 to 15 foot candles. Bulb lumens or light output tends to decrease over time, especially as fixtures accumulated dust and fly specks.
Western Dairy Management Conference
Additional lighting in the building also will create a better environment for employees to perform their tasks.
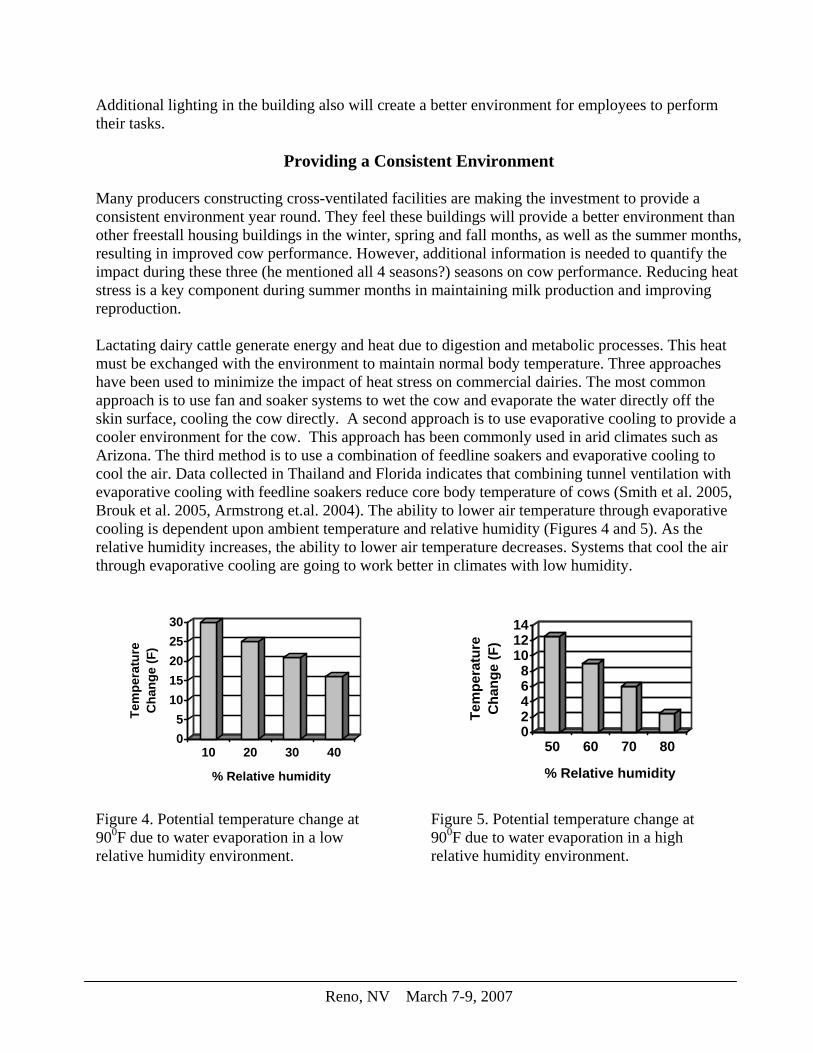
Providing a Consistent Environment Many producers constructing cross-ventilated facilities are making the investment to provide a consistent environment year round. They feel these buildings will provide a better environment than other freestall housing buildings in the winter, spring and fall months, as well as the summer months, resulting in improved cow performance. However, additional information is needed to quantify the impact during these three (he mentioned all 4 seasons?) seasons on cow performance. Reducing heat stress is a key component during summer months in maintaining milk production and improving reproduction. Lactating dairy cattle generate energy and heat due to digestion and metabolic processes. This heat must be exchanged with the environment to maintain normal body temperature. Three approaches have been used to minimize the impact of heat stress on commercial dairies. The most common approach is to use fan and soaker systems to wet the cow and evaporate the water directly off the skin surface, cooling the cow directly. A second approach is to use evaporative cooling to provide a cooler environment for the cow. This approach has been commonly used in arid climates such as Arizona. The third method is to use a combination of feedline soakers and evaporative cooling to cool the air. Data collected in Thailand and Florida indicates that combining tunnel ventilation with evaporative cooling with feedline soakers reduce core body temperature of cows (Smith et al. 2005, Brouk et al. 2005, Armstrong et.al. 2004). The ability to lower air temperature through evaporative cooling is dependent upon ambient temperature and relative humidity (Figures 4 and 5). As the relative humidity increases, the ability to lower air temperature decreases. Systems that cool the air through evaporative cooling are going to work better in climates with low humidity.
05
1015202530
Tem
pera
ture
C
hang
e (F
)
10 20 30 40
% Relative humidity
Figure 4. Potential temperature change at 900F due to water evaporation in a low relative humidity environment.
02468
101214
Tem
pera
ture
C
hang
e (F
)
50 60 70 80
% Relative humidity
Figure 5. Potential temperature change at 900F due to water evaporation in a high relative humidity environment.
Reno, NV March 7-9, 2007
Methodology This study was conducted on a 420’ x 210’ 800-head LPCV barn in Milnor, ND. Tests were conducted during three series of three randomly assigned, pre-selected ventilation (low = 20 fans, medium = 40 fans; high = 78 fans) periods lasting 2-hours. The herd was comprised of crossbred and Holstein cows milked 3X and housed in freestalls with sand bedding. Manure was scraped from the barn, with a skid steer loader mounted with a rubber tractor tire, to a flush-flume collection pit on the north-end of the barn. Collected manure was then processed with a McLanahan sand-manure separator before collected manure and parlor wastewater was stored in an earthen manure collection basin.
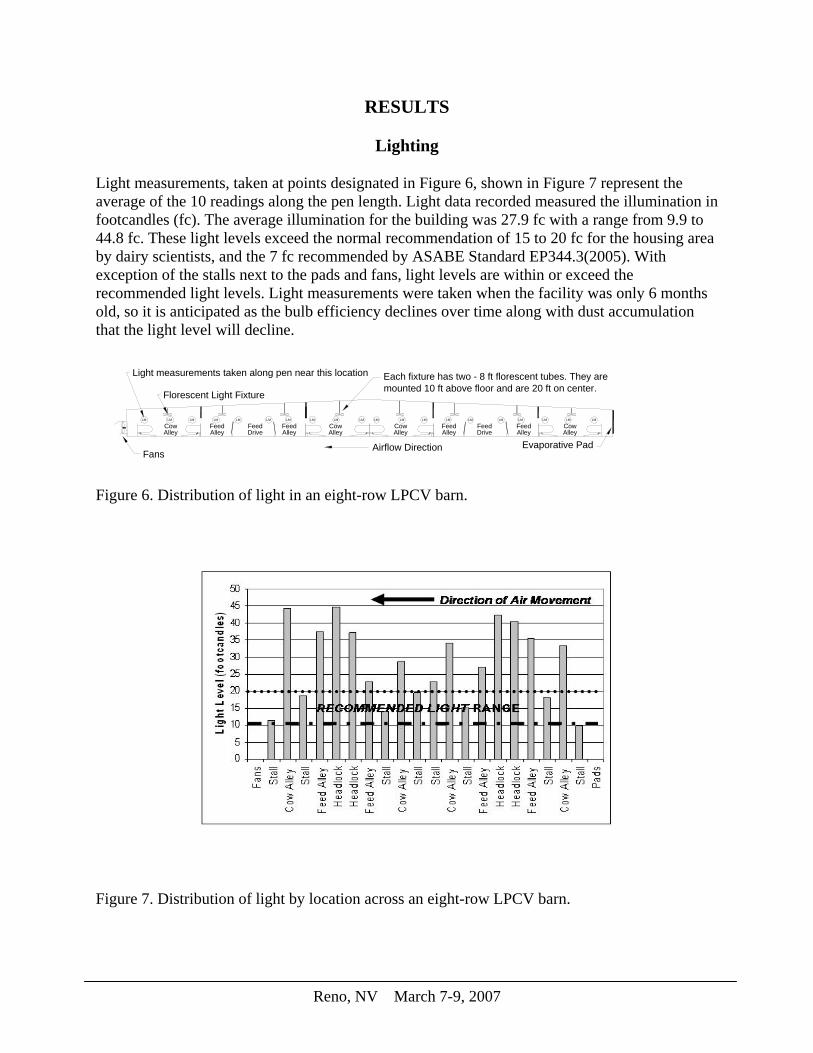
Lighting The study barn had two rows of fluorescent lights per pen. The fixtures each contained two 8 foot florescent tubes, mounted at a height of approximately 10 feet above the concrete alley. Fixtures were located approximately 20 feet on center and in the center of the cow alleys. Manual measurements were taken using a digital light meter (Beha Digital Illuminometer, Model 93-1065F). Light measurements were taken 4 ft above the floor at 10 random locations along the 420 ft barn length. However, no measurements along the pen length were repeated between any two adjacent support posts. Measurements were taken parallel to the light fixtures at 20 locations across the width of the building as shown in Figure 6.
Noise Noise levels were measured inside the building using a Scott 451 Sound Level Meter. The meter was set on the A weighted scale (what’s this?) and fast response. Measurements were taken at 14 to 25 points along the center line of the south and north feed lanes. Manual readings were recorded during the low, medium and high airflow rates test when the skid steer scrape equipment was at least 30 feet (space between support posts) away from the noise meter.
Water Use and Evaporative Cooling Evaporative pads were located along the south side of the building. Twelve sections of pads, with a 1-inch water hydrant serving 4 sections of pads, were installed. Each pad section was 5 ft wide and ranged in length from 57 to 67 ft. There were 2 rows of pads stacked on top of each other to form a 10 ft wide by 365 ft long evaporative cooling pad. Water meters were installed between the hydrant and pads while data were collected every 15 minutes during 2 hr periods. Data were only collected during 3 periods because of a main water line malfunction. The pad area to cow ratio was equal to 4.5 ft2 per cow. The airflow rate through the pad was 282, 185 and 106 fpm for the high, medium and low ventilation rates, respectively.
Ventilation Five of the 84 fans were selected for representative airflow measurements. The fans were 48 inch in diameter with a 54 inch shutter opening. Each fan was tested using the Fan Assessment Numeration System (Casey et. al, 2002). This unit was placed on the intake side and sealed to the wall. Airflow through each of the tested fans was measured at three different static pressures
Western Dairy Management Conference

(typically 0, 0.1 and 0.2 inches of water) to create a fan curve for each fan. Static pressure was measured with an incline manometer with a resolution of 0.01 inches. The different static pressures were held constant during each three-minute measurement and obtained by operating different numbers of fans and changing inlet air areas. Static pressure measurements were taken along the length of each baffle at locations near the center of each structural frame space. Thirteen measurements, approximately every 30 feet along the pen length, were taken per baffle. The static pressure was measured using the digital electronic micro-manometer component of an Alnor EBT721 Electronic Balancing Tool. Measurements were taken 3 feet to 4 feet above the bottom of the baffle by locating one tube from the micro-manometer against one side of the baffle and the other tube against the other side of the baffle. These locations above the bottom of the baffle were selected to minimize any airflow turbulence effects on the static pressure readings. Velocity measurements were collected at the first baffle near the center of each structural frame. The velocity was measured using a Solomat Modumeter 2013, which included a hot wire anemometer. The Solomat unit has an averaging function which was used to collect an average velocity along the vertical profile of the baffle opening at each static pressure measurement location along the length of the first baffle. Measurements were collected during the high and medium ventilation studies. Three replications of the velocity and static pressure measurements were collected during the high ventilation studies along the first baffle as well as three replications of static pressure along baffles two, three, and four. Only one replication of the velocity and static pressure measurements were collected at the medium ventilation rate along the first baffle, with only static pressure recorded along baffles two, three, and four. No velocity and static pressure data were collected at the low ventilation rate because the airflow baffles have minimal effect on total ventilation system static pressure drop at the low ventilation rate.
Indoor and Outdoor Environment Two temperature and humidity data loggers (HOBO H8 RH/Temp Data Logger) were placed inside the building near the evaporative pads and three other units were place near the exhaust fans. Two loggers were used to record ambient conditions. Data was collected every 15-minutes from March, 2006 until August 31, 2006.
Dust Emissions Particulate emissions were estimated using a MiniVol™ Portable Air Sampler by Airmetrics. This system uses the gravimetrical method of measuring dust concentration. The MiniVol's pump draws air at 5 liters/minute through a particle size separator (impactor) and then through a 47mm filter. The 10 micron particle (PM10) separation was achieved by impaction. Three units were positioned inside the barn 5 m from the ventilation fans at 2.5 m above the floor and at ¼ barn intervals along the wall containing the fans. Airflow through the units was corrected to standard temperature and pressure. Filters before and after sampling were placed in a chamber controlled at 30% humidity for 24 hr prior to weighing on a balance accurate to one µg. Sampling was done over a 24 hr period from noon on Aug 28, 2006 to noon on Aug 29, 2006.
Reno, NV March 7-9, 2007
The net weight change of the filters (µg) was divided by the sampling period (hr) and sampler flow rate (m3/hr) to obtain emission (µg/m3).
Gaseous Emissions Single Point Monitors (SPMs) (Model 7100, Zellweger Analytics, Inc., Lincolnshire, Ill.) at the four locations around dairy facilities were used to monitor H2S levels. Three units were positioned inside the barn 0.5 m from the ventilation fans at 1 m above the floor and at ¼ intervals along the wall containing the ventilation exhaust fans. The other unit was positioned on the opposite side of the barn from the ventilation fans 0.5 m from the air inlet and near the center. The SPM measures gas levels based on the rate of color change of a chemical cassette tape that reacts with the target gas. The color intensity change of the tape is sensed by a photocell whose output is then converted to analog output and digital display of the gas level. Liang and Xin (2005) compared the performance of an SPM to a known gas concentration, and found that the SPM readings for H2S measurement can achieve 90% to 107% agreement with a pulsed fluorescence- Thermo Model 45 H2S continuous analyzer. A H2S/L "chem-key" on the SPM sets the range span (1 to 100 ppb) for the hydrogen sulfide. The SPMs were set to record a H2S concentration every 17 minutes in an internal datalogger. Sampling was done over a 24 hr period in May, and from noon on Aug 28, 2006 to Aug 29, 2006. Gas emission rates were estimated using an open-path ultraviolet (UV) spectrometer system. This non-invasive method is recognized by the US-EPA for it superior precision, accuracy and versatility to quantify dozens of emitted gases simultaneously across source areas without inhibiting the flux of various compounds that have been identified with the use of small area chambers or flux hoods. During this study an open-path UV Spectrometer, known as a UV Sentry(Cerex Environmental, Atlanta, GA), was placed inside the barn adjacent to the exhaust fans. The UV light transmitter was placed at one end of the barn while the receiver, computer and 3-dimensional anemometer were placed at the opposite end. The UV light beam was placed 0.5 m from the rear of the fans at a height bisecting the fans on the east side of the LPCV (Figure 3). Data logging software and a portable computer were used to collect data from the UV Sentry. Sample UV spectra were recorded every minute during each of the eighteen sampling periods. Sampling software was programmed to estimate the concentration from the recorded spectra: Ammonia (NH3), Nitric Oxide (NO2), Nitrogen Oxides (NOx), Hydrogen Sulfide (H2S), other reduced Sulfide (S2) compounds, and Volatile Organic Compounds (VOCs). Gas concentrations with a library spectra prediction of R2 >0.75 were used in determining average concentrations or emission rates. Measurements with predictions below the 0.75 threshold were treated as non-detected concentrations. Emission rates were calculated from the product of the gas concentration, gas molecular weight, and air velocity. Data from this study was found to meet the assumption of normality without transformation. Differences between groups were tested for significance (P < 0.05) using Differences in Least Squared Means test of the PROCMIXED procedure and linear regressions were calculated using PROCREG of SAS (SAS 9.1).
Western Dairy Management Conference
RESULTS
Lighting Light measurements, taken at points designated in Figure 6, shown in Figure 7 represent the average of the 10 readings along the pen length. Light data recorded measured the illumination in footcandles (fc). The average illumination for the building was 27.9 fc with a range from 9.9 to 44.8 fc. These light levels exceed the normal recommendation of 15 to 20 fc for the housing area by dairy scientists, and the 7 fc recommended by ASABE Standard EP344.3(2005). With exception of the stalls next to the pads and fans, light levels are within or exceed the recommended light levels. Light measurements were taken when the facility was only 6 months old, so it is anticipated as the bulb efficiency declines over time along with dust accumulation that the light level will decline.
Figure 6. Distribution of light in an eight-row LPCV barn.
FeedDrive
FeedDrive Alley
Feed CowAlley
FeedAlley
CowAlley
CowAlley
CowAlley
FeedAlley
FeedAlley
Florescent Light Fixture
LM
Light measurements taken along pen near this location
LM LM LM LM LM LMLM LM LMLM LM LM LM LM LM LMLM LM LM
Airflow DirectionFans
Evaporative Pad
Each fixture has two - 8 ft florescent tubes. They are mounted 10 ft above floor and are 20 ft on center.
Figure 7. Distribution of light by location across an eight-row LPCV barn.
Reno, NV March 7-9, 2007
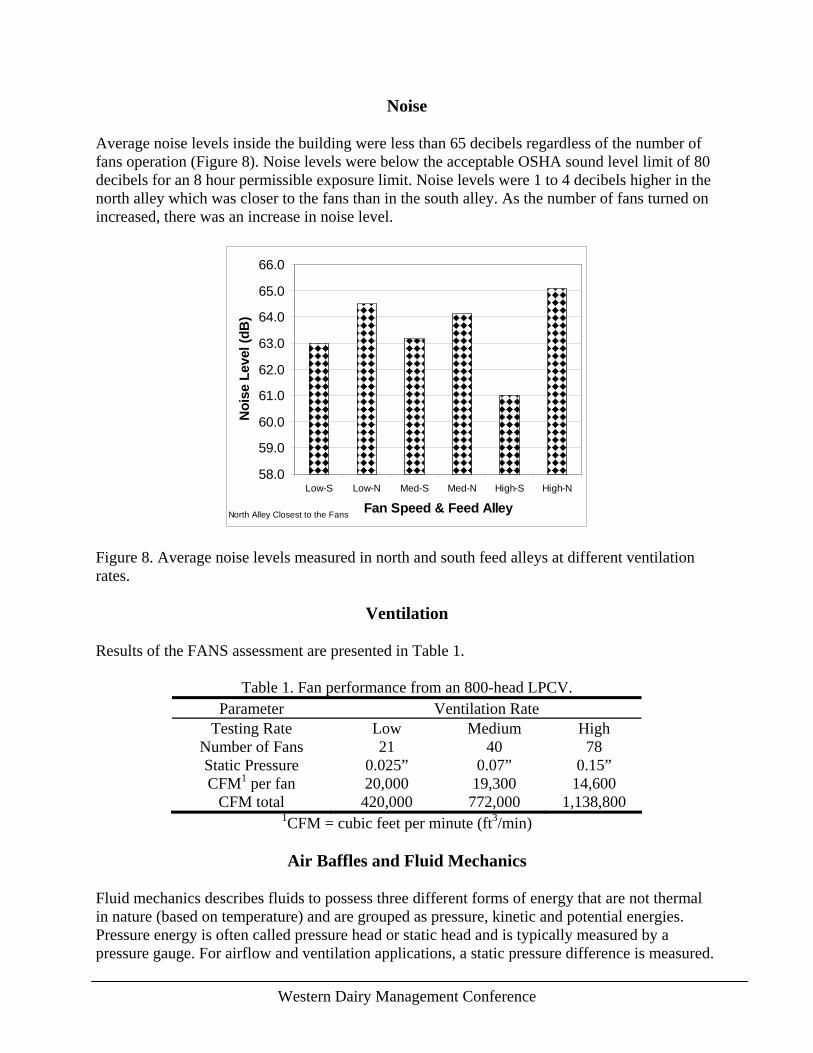
Noise Average noise levels inside the building were less than 65 decibels regardless of the number of fans operation (Figure 8). Noise levels were below the acceptable OSHA sound level limit of 80 decibels for an 8 hour permissible exposure limit. Noise levels were 1 to 4 decibels higher in the north alley which was closer to the fans than in the south alley. As the number of fans turned on increased, there was an increase in noise level.
58.0
59.0
60.0
61.0
62.0
63.0
64.0
65.0
66.0
Low-S Low-N Med-S Med-N High-S High-N
Fan Speed & Feed Alley
Noi
se L
evel
(dB
)
North Alley Closest to the Fans
Figure 8. Average noise levels measured in north and south feed alleys at different ventilation rates.
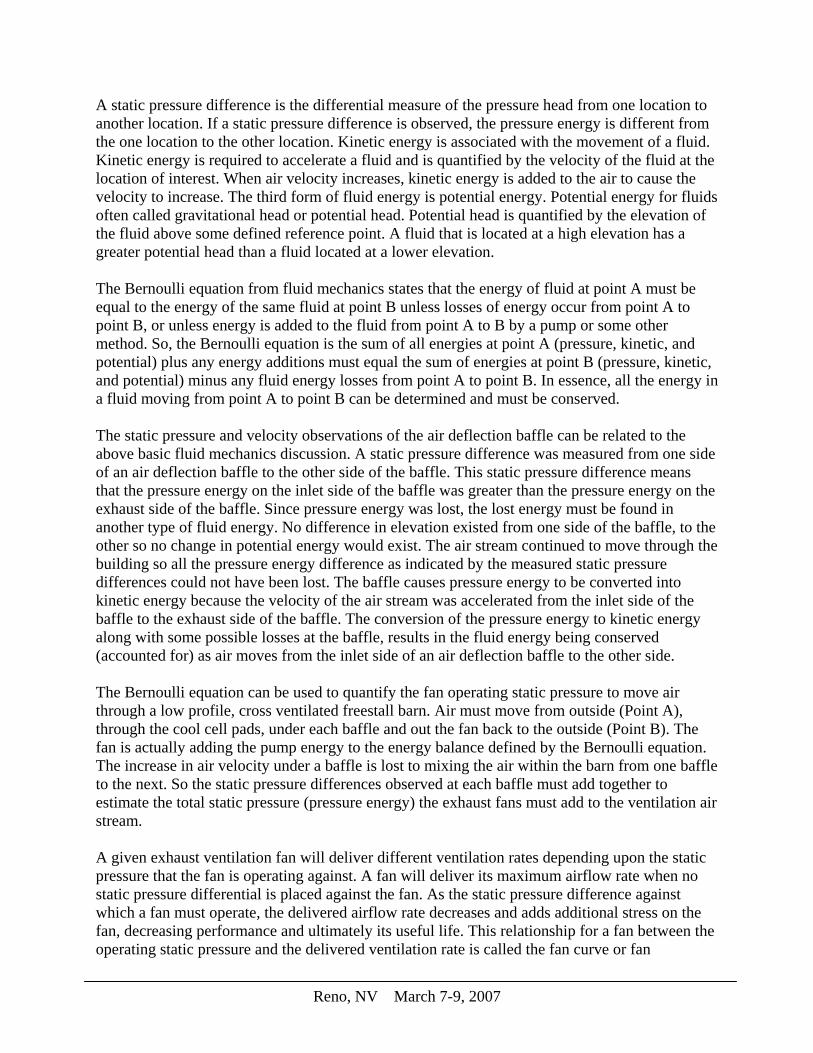
Ventilation Results of the FANS assessment are presented in Table 1.
Table 1. Fan performance from an 800-head LPCV.
Parameter Ventilation Rate Testing Rate Low Medium High
Number of Fans 21 40 78 Static Pressure 0.025” 0.07” 0.15” CFM1 per fan 20,000 19,300 14,600
CFM total 420,000 772,000 1,138,800 1CFM = cubic feet per minute (ft3/min)
Air Baffles and Fluid Mechanics
Fluid mechanics describes fluids to possess three different forms of energy that are not thermal in nature (based on temperature) and are grouped as pressure, kinetic and potential energies. Pressure energy is often called pressure head or static head and is typically measured by a pressure gauge. For airflow and ventilation applications, a static pressure difference is measured.
Western Dairy Management Conference
A static pressure difference is the differential measure of the pressure head from one location to another location. If a static pressure difference is observed, the pressure energy is different from the one location to the other location. Kinetic energy is associated with the movement of a fluid. Kinetic energy is required to accelerate a fluid and is quantified by the velocity of the fluid at the location of interest. When air velocity increases, kinetic energy is added to the air to cause the velocity to increase. The third form of fluid energy is potential energy. Potential energy for fluids often called gravitational head or potential head. Potential head is quantified by the elevation of the fluid above some defined reference point. A fluid that is located at a high elevation has a greater potential head than a fluid located at a lower elevation. The Bernoulli equation from fluid mechanics states that the energy of fluid at point A must be equal to the energy of the same fluid at point B unless losses of energy occur from point A to point B, or unless energy is added to the fluid from point A to B by a pump or some other method. So, the Bernoulli equation is the sum of all energies at point A (pressure, kinetic, and potential) plus any energy additions must equal the sum of energies at point B (pressure, kinetic, and potential) minus any fluid energy losses from point A to point B. In essence, all the energy in a fluid moving from point A to point B can be determined and must be conserved. The static pressure and velocity observations of the air deflection baffle can be related to the above basic fluid mechanics discussion. A static pressure difference was measured from one side of an air deflection baffle to the other side of the baffle. This static pressure difference means that the pressure energy on the inlet side of the baffle was greater than the pressure energy on the exhaust side of the baffle. Since pressure energy was lost, the lost energy must be found in another type of fluid energy. No difference in elevation existed from one side of the baffle, to the other so no change in potential energy would exist. The air stream continued to move through the building so all the pressure energy difference as indicated by the measured static pressure differences could not have been lost. The baffle causes pressure energy to be converted into kinetic energy because the velocity of the air stream was accelerated from the inlet side of the baffle to the exhaust side of the baffle. The conversion of the pressure energy to kinetic energy along with some possible losses at the baffle, results in the fluid energy being conserved (accounted for) as air moves from the inlet side of an air deflection baffle to the other side. The Bernoulli equation can be used to quantify the fan operating static pressure to move air through a low profile, cross ventilated freestall barn. Air must move from outside (Point A), through the cool cell pads, under each baffle and out the fan back to the outside (Point B). The fan is actually adding the pump energy to the energy balance defined by the Bernoulli equation. The increase in air velocity under a baffle is lost to mixing the air within the barn from one baffle to the next. So the static pressure differences observed at each baffle must add together to estimate the total static pressure (pressure energy) the exhaust fans must add to the ventilation air stream. A given exhaust ventilation fan will deliver different ventilation rates depending upon the static pressure that the fan is operating against. A fan will deliver its maximum airflow rate when no static pressure differential is placed against the fan. As the static pressure difference against which a fan must operate, the delivered airflow rate decreases and adds additional stress on the fan, decreasing performance and ultimately its useful life. This relationship for a fan between the operating static pressure and the delivered ventilation rate is called the fan curve or fan
Reno, NV March 7-9, 2007
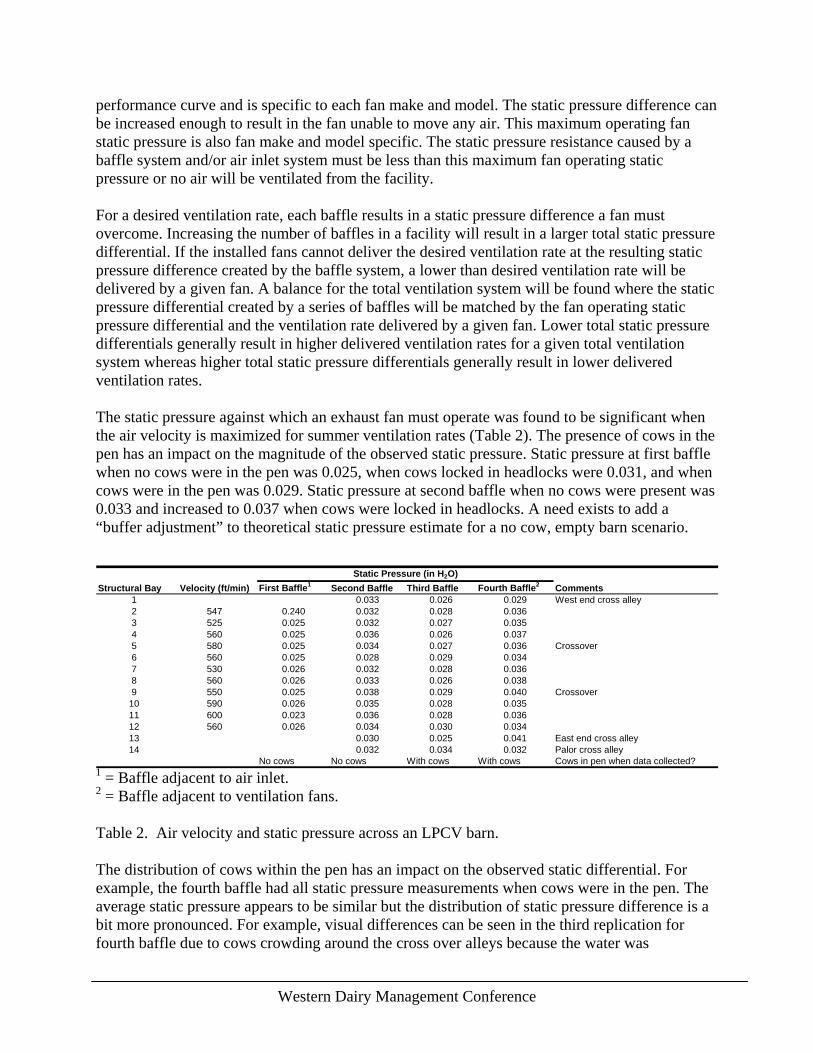
performance curve and is specific to each fan make and model. The static pressure difference can be increased enough to result in the fan unable to move any air. This maximum operating fan static pressure is also fan make and model specific. The static pressure resistance caused by a baffle system and/or air inlet system must be less than this maximum fan operating static pressure or no air will be ventilated from the facility. For a desired ventilation rate, each baffle results in a static pressure difference a fan must overcome. Increasing the number of baffles in a facility will result in a larger total static pressure differential. If the installed fans cannot deliver the desired ventilation rate at the resulting static pressure difference created by the baffle system, a lower than desired ventilation rate will be delivered by a given fan. A balance for the total ventilation system will be found where the static pressure differential created by a series of baffles will be matched by the fan operating static pressure differential and the ventilation rate delivered by a given fan. Lower total static pressure differentials generally result in higher delivered ventilation rates for a given total ventilation system whereas higher total static pressure differentials generally result in lower delivered ventilation rates. The static pressure against which an exhaust fan must operate was found to be significant when the air velocity is maximized for summer ventilation rates (Table 2). The presence of cows in the pen has an impact on the magnitude of the observed static pressure. Static pressure at first baffle when no cows were in the pen was 0.025, when cows locked in headlocks were 0.031, and when cows were in the pen was 0.029. Static pressure at second baffle when no cows were present was 0.033 and increased to 0.037 when cows were locked in headlocks. A need exists to add a “buffer adjustment” to theoretical static pressure estimate for a no cow, empty barn scenario.
Structural Bay Velocity (ft/min) First Baffle1 Second Baffle Third Baffle Fourth Baffle2 Comments1 0.033 0.026 0.029 West end cross alley2 547 0.240 0.032 0.028 0.0363 525 0.025 0.032 0.027 0.0354 560 0.025 0.036 0.026 0.0375 580 0.025 0.034 0.027 0.036 Crossover6 560 0.025 0.028 0.029 0.0347 530 0.026 0.032 0.028 0.0368 560 0.026 0.033 0.026 0.0389 550 0.025 0.038 0.029 0.040 Crossover
10 590 0.026 0.035 0.028 0.03511 600 0.023 0.036 0.028 0.03612 560 0.026 0.034 0.030 0.03413 0.030 0.025 0.041 East end cross alley14 0.032 0.034 0.032 Palor cross alley
No cows No cows With cows With cows Cows in pen when data collected?
Static Pressure (in H2O)
1 = Baffle adjacent to air inlet. 2 = Baffle adjacent to ventilation fans. Table 2. Air velocity and static pressure across an LPCV barn. The distribution of cows within the pen has an impact on the observed static differential. For example, the fourth baffle had all static pressure measurements when cows were in the pen. The average static pressure appears to be similar but the distribution of static pressure difference is a bit more pronounced. For example, visual differences can be seen in the third replication for fourth baffle due to cows crowding around the cross over alleys because the water was
Western Dairy Management Conference
unavailable, due to a maintenance problem on the farm. This variation is directly proportional to the air speed under the baffle. If cows crowd, less air will move through the group of cows as compared to where no cows are located. The overall management of cows within a pen must be implemented to minimize the frequency cows will bunch together in a group. Stressful situations for cows often results in a herding instinct to be observed that results in cows grouping together even though the resulting cow grouping or bunching may actually exacerbate increase the stress level.
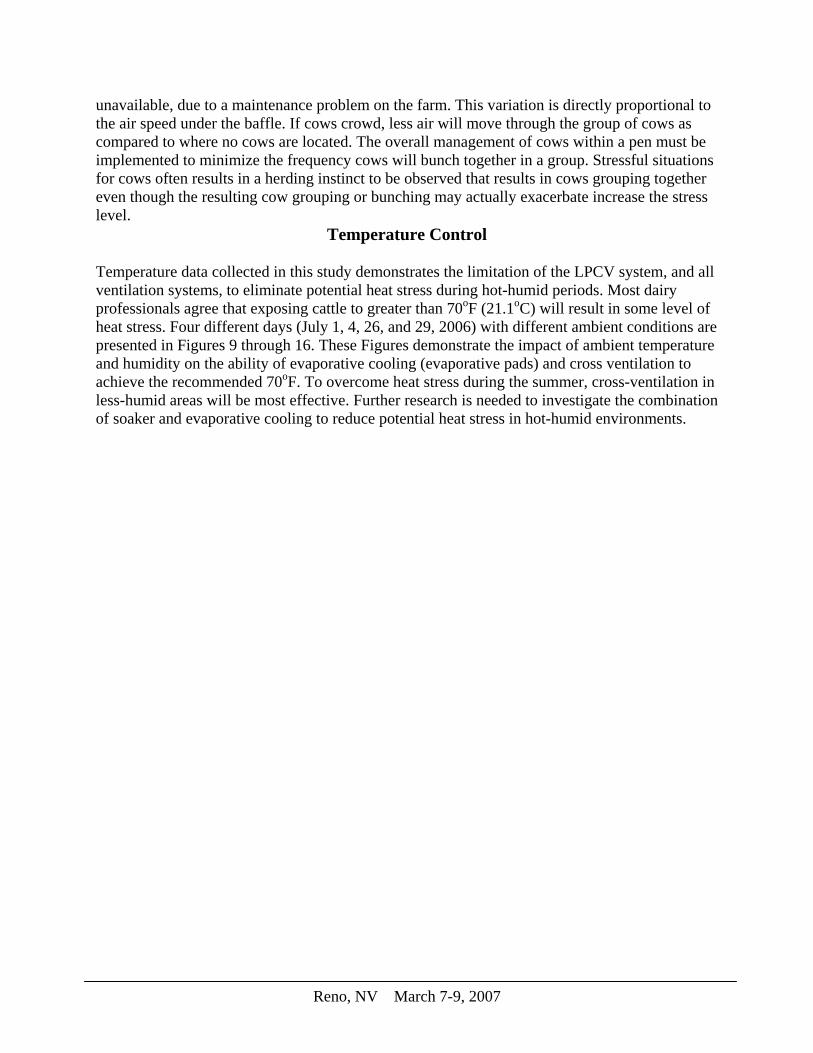
Temperature Control Temperature data collected in this study demonstrates the limitation of the LPCV system, and all ventilation systems, to eliminate potential heat stress during hot-humid periods. Most dairy professionals agree that exposing cattle to greater than 70oF (21.1oC) will result in some level of heat stress. Four different days (July 1, 4, 26, and 29, 2006) with different ambient conditions are presented in Figures 9 through 16. These Figures demonstrate the impact of ambient temperature and humidity on the ability of evaporative cooling (evaporative pads) and cross ventilation to achieve the recommended 70oF. To overcome heat stress during the summer, cross-ventilation in less-humid areas will be most effective. Further research is needed to investigate the combination of soaker and evaporative cooling to reduce potential heat stress in hot-humid environments.
Reno, NV March 7-9, 2007
4045505560657075808590
0:00
1:30
3:00
4:30
6:00
7:30
9:00
10:3
0
12:0
0
13:3
0
15:0
0
16:3
0
18:0
0
19:3
0
21:0
0
22:3
0
Time
Tem
p (F
)
IntakeExhaustAmbient
40
45
50
55
60
65
70
75
80
0:00
1:30
3:00
4:30
6:00
7:30
9:00
10:3
0
12:0
0
13:3
0
15:0
0
16:3
0
18:0
0
19:3
0
21:0
0
22:3
0
Time
Tem
p (F
)
IntakeExhaustAmbient
4045505560657075808590
0:00
1:30
3:00
4:30
6:00
7:30
9:00
10:3
0
12:0
0
13:3
0
15:0
0
16:3
0
18:0
0
19:3
0
21:0
0
22:3
0
Time
Tem
p (F
)
IntakeExhaustAmbient
40
50
60
70
80
90
100
0:00
1:30
3:00
4:30
6:00
7:30
9:00
10:3
0
12:0
0
13:3
0
15:0
0
16:3
0
18:0
0
19:3
0
21:0
0
22:3
0
Time
Tem
p (F
)
IntakeExhaustAmbient
20
30
40
50
60
70
80
90
100
110
0:00
1:30
3:00
4:30
6:00
7:30
9:00
10:3
0
12:0
0
13:3
0
15:0
0
16:3
0
18:0
0
19:3
0
21:0
0
22:3
0
Time
% R
H
IntakeExhaustAmbient
Figure 10. Typical summer conditions, % RH
7-1-2006 Figure 9. Typical summer conditions, Temperature
7-1-2006
20
30
40
50
60
70
80
90
100
0:00
1:30
3:00
4:30
6:00
7:30
9:00
10:3
0
12:0
013
:30
15:0
0
16:3
018
:00
19:3
0
21:0
022
:30
Time
% R
H
IntakeExhaustAmbient
Figure 12. Cool summer conditions, % RH 7-4-2006
Figure 11. Cool summer conditions, Temperature 7-4-2006
20
30
40
50
60
70
80
90
100
110
0:00
1:30
3:00
4:30
6:00
7:30
9:00
10:3
0
12:0
0
13:3
0
15:0
0
16:3
0
18:0
0
19:3
0
21:0
0
22:3
0
Time
% R
H
IntakeExhaustAmbient
Figure 14. Moderate humidity, % RH 7-26-2006
Figure 13. Moderate humidity, Temperature 7-26-2006
20
30
40
50
60
70
80
90
100
110
0:00
1:30
3:00
4:30
6:00
7:30
9:00
10:3
0
12:0
0
13:3
0
15:0
0
16:3
0
18:0
0
19:3
0
21:0
0
22:3
0
Time
% R
H
IntakeExhaustAmbient
Figure 16. High humidity, % RH 7-29-2006
Figure 15. High humidity, Temperature 7-29-2006
Western Dairy Management Conference
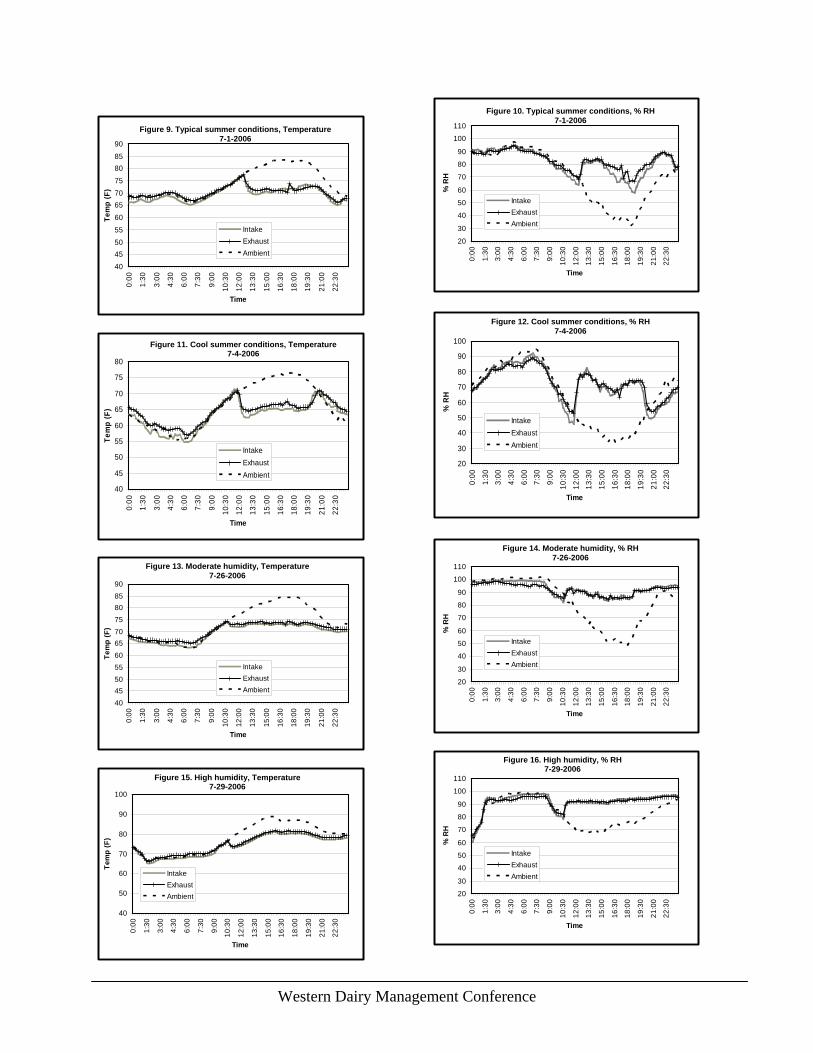
Water Use and Evaporative Cooling
Consumptive water usage equaled 30.1, 91.5, and 115.7 gallons per 15 minute for the low, medium, and high airflow rate studies, respectively. Measured airflow rates through the pad averaged 106, 185, and 282 feet per minute (fpm) for the low, medium, and high airflows, respectively. On a per cow basis, water usage was 0.45, 1.37, and 1.75 gallons/hr per cow while the evaporative pad was operating. The amount of water used per ft2 of evaporative pad for a dairy in Kansas was compared to the study dairy in North Dakota. Similar water usage was observed between the Kansas dairy and the medium airflow rate at the North Dakota dairy (Figure 9). Measured airflow rates were 282 fpm through the pads at the Kansas site and 320 fpm during the medium airflow rate study at the study dairy. Water usage by the pad did not increase proportional to the airflow rate. When comparing the high and medium airflow rates, the difference in air velocity was 47%, however, the increase in pad water usage was only 27% greater.
0 0.05 0.1 0.15 0.2 0.25 0.3 0.35 0.4
ks:jul18
ks:jul19
ks:jul20
ks:jul25
ks:jul26
ks:aug9
ks:aug10
ks:avg
nd:highair
nd:medair
nd:lowair
Pad Water Usage (gph / sq.ft.)
Figure 17. Comparison of evaporative pad water usage during summer 2006 monitoring periods at a Kansas (ks) and North Dakota (nd) study dairy. (gph/sq.ft. = gallons per hour per square foot of evaporative pad surface)
Dust Emissions Particulate emissions from the three samplers were 78.2 µg/m3 near the east end of the barn, 74.8 µg/m3 in the barn’s center, and 94.8 µg/m3 near the west barn end. These values are between a 10 to 100 times less than dust concentrations from poultry and swine units (Jerez, et al., 2006). By comparison, U.S. Environmental Protection Agency (USEPA, 1987), National Ambient Air Quality Standards (NAAQS) limits primary and secondary PM10 dust concentration for a 24 hr average sampling period at 150 µg/m3. The purpose of the primary standard was protection of public health and the secondary standard is to protect the public from known or anticipated adverse effects. The values obtained from this site are below the current standard. Dust emissions were collected in an LPCV using sand bedding. Further research is needed to investigate if dust emissions would be higher if organic bedding such as dried manure solids or sawdust was used.
Reno, NV March 7-9, 2007
Gaseous Emissions
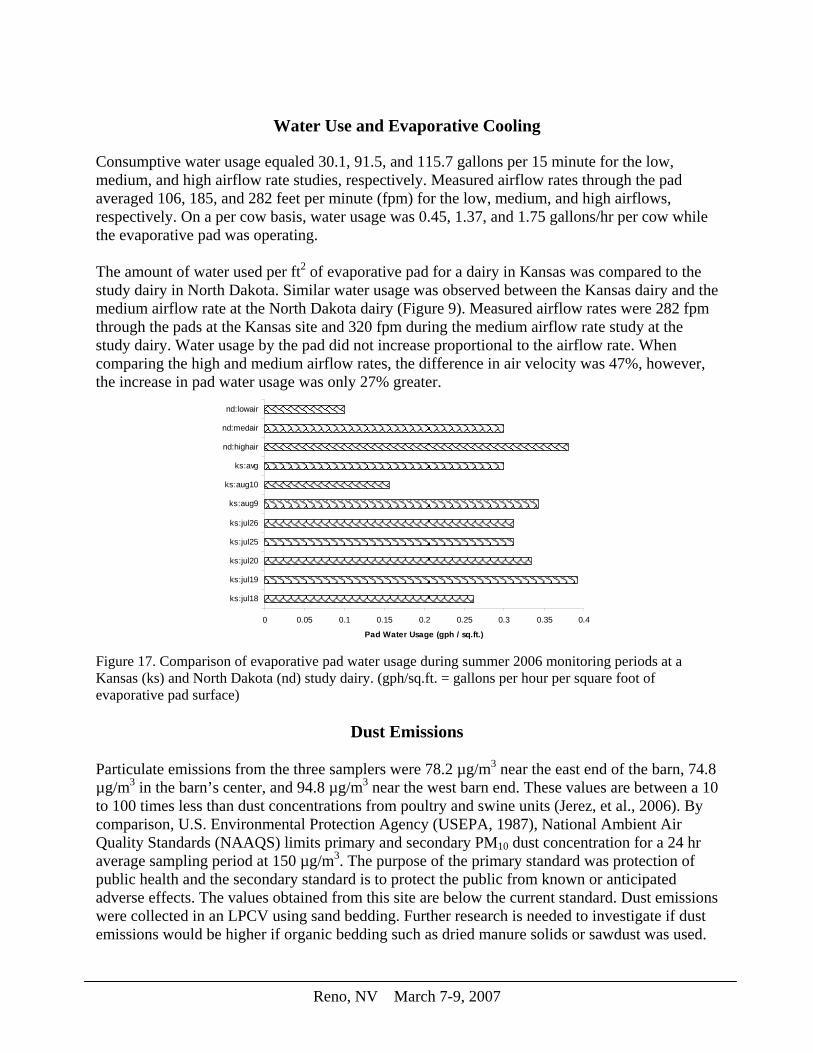
Background concentrations of H2S were observed with the SPM at 0.05 ppb for the May sampling period and 2.6 ppb for the August sampling period (Table 3). There is no significant (P>0.05) difference between the SPM-H2S values at the east, middle, and west ends of the barn. Table 3. Hydrogen sulfide concentration observed by SPM during May 2006 from an 800-cow LPCV Dairy Barn.
Ventilation Rate H2S (ppb)
Mean Standard Error
Low 14 5.7 Medium 8 3.9 High 7 2.0
Figure 18 shows the concentration of the exhaust air over a 24 hour period. The higher concentrations at 19:00 hour may be attributed to cow movement adjacent to the SBM monitors.
0
5
10
15
20
25
30
35
40
45
50
15:0
8:00
17:5
8:00
20:4
8:00
23:3
8:00
2:28
:00
5:18
:00
8:08
:00
10:5
8:00
13:4
8:00
Time
H2S
Conc
entra
tion
(PP
B
South MiddleNorth EastNorth MiddleNorth West
Figure 18. Diurnal H2S concentration in LPCV barn during August 28-29, 2006.
Gases emitted from the LPCV were found to be dominated by nitrogen-based gases (NH3, NO2, NO) during the spring and summer testing periods. Concentrations of H2S were not observed with the open-path spectrometer at any time during the study to have a spectra prediction greater than the R2 > 0.75 threshold established by the investigators. Periodic recordable concentrations were detected for S2, however, continuous detections were not observed to last more than 5-minutes and thus were not reported. The lack of non-observed H2S is not surprising, such differences, especially at the relatively low concentrations observed by the SPMs can be due to differences in monitoring techniques or the method of manure cleaning used at the study dairy. It
Western Dairy Management Conference

would be anticipated that with the regular (twice daily) scraping of manure from the LPCV barn that large amount of stagnant manure would not be allowed to accumulate and begin to anaerobically degrade within the barn, thus producing H2S. Ammonia concentrations and emission rates were found to be greatest during the springtime and under the lowest ventilation rate tested (420,000 cfm) (Table 4). No statistical difference was found between NH3 concentration and emission rates at the high ventilation rate during springtime, low ventilation rate during the summer, and high ventilation rate during the summer. No statistical difference in NH3 concentrations was observed during the medium ventilation rates of both seasons. Average concentrations of NH3 observed here (spring = 1219 +/-5 ppb; summer = 1117 +/- 4 ppb) are lower than those reported by Zhoa et al. (2005) and Mutula et al (2004) of 0.3 – 3.0 ppm and 36 – 51 ppm, from naturally ventilated freestall barns in Ohio and Texas, respectively. Springtime NH3 emissions from the LPCV barn were found to be higher than those calculated during studies of naturally ventilated freestall barns in Minnesota and Texas. During this study, NH3 emissions (Table 2) at the low ventilation rate were found to be 856 mg/h/500-kg live weight during the spring and 678 mg/h/500-kg live weight during the summer, compared to 224 mg/h/500-kg live weight during the winter and 481 mg/h/500-kg live weight during the summer in Minnesota (Schmidt et al., 2002). Comparatively, NH3 emission rates in this study were found to be 21.02 µg/m2/s during the spring and 16.65 µg/m2/s during the summer, compared to 11 µg/m2/s during the winter and 32 µg/m2/s measured during the summer in a Texas freestall barn (Mutula et al., 2004). These differences between reported values are likely due to differences in the gaseous measurement techniques and the methods used for quantifying the ventilation rate from each respective barn and the difference between emission rates due to barn configuration, manure management and desired ventilation rate. During this study, emission rates were determined from the product of the gaseous concentration determined by open-path UV spectrometry and the field-verified ventilation rate at the time of concentration measurement. Schmidt et al. (2002) determined average ammonia concentrations using continuous chemiluminescence NO analyzer and thermal NH3 converter (Model No. 17C Thermal Environment Instrument) and ventilation rates were calculated using the “CO2 Balance” method described by Albright (1990). Mutula et al. (2004) also determined ammonia concentrations using a Model 17C TEI while using an isolation flux chamber to determine the emission rate per square meter. Further research is needed to quantify the differences between these techniques to allow engineers, scientists, regulators and air quality professionals to make accurate comparisons between study results. Results from this study (Table 5) show that the current 800-cow LPCV barn would emit a maximum of 72 pounds/day (32.8 kg/day) of NH3 and 73 pounds/day (33.3 kg/day) of NO2. These values are less than the 100 pound/day reporting limit required for compliance with the Comprehensive Environmental Response, Compensation and Liability Act (CERCLA) and the emergency notification provisions of the Emergency Planning and Community Right-to-Know Act (EPCRA). However, based on these values, a LPCV barn with more than 1090 cows should consider reporting potential maximum emission for NO2, 1107 cows for NH3.
Reno, NV March 7-9, 2007

The indoor and outdoor temperature and indoor relative humidity were found to be significant factors (Table 6) contributing to the prediction of the maximum NH3 concentration within the LPCV dairy barn during the spring (Equation 1). Other factors such as outdoor relative humidity and ventilation rate were found to not be significant to the prediction of ammonia concentrations during the spring. However, during the summer, all model variables were found to be statistically significant (P< 0.05 level) toward the prediction of maximum ammonia concentrations (Equation 2). Further research should be conducted to investigate the predictive relationship between maximum NH3 concentration within the barn, with and without the use of evaporative cooling pads during summertime periods. Equation 1. outinin TRHTspringNH 88.13127.431.11727.1174)(3 −++= Equation 2. VRRHTRHTsummerNH outoutinin 00014.06421.1655.442.5380.73)(3 ++−++−= Where; NH3 = ammonia concentration at LPCV exhaust, T= temperature (C), RH = relative humidity (%), VR = ventilation rate (ft3/min), in = inside barn, and out = outside barn. Table 4. Gaseous concentration and emissions from an 800-cow LPCV dairy barn.
Concentration as ppb Season Ventilation Rate NH3 NO2 NO
Mean Standard Error Mean
Standard Error Mean
Standard Error
Spring Low 1,370 10.3 445a 35.9 8ab 5.2 Medium 1,181b 8.2 296 28.6 27 4.1 High 1,108 a 8.2 417a 28.6 0a 4.1 Summer Low 1,084a 7.0 176b 24.4 0a 3.5 Medium 1,157b 7.0 145b 24.5 4b 3.5 High 1,112a 7.1 155b 24.5 0a 3.5 Emission Rate as µg/s Season Ventilation Rate NH3 NO2 NO
Mean Standard Error Mean
Standard Error Mean
Standard Error
Spring Low 172,248 2,464 151,469b 24,117 1,779ab 2,050 Medium 273,133a 1,962 185,446b 19,202 11,074 1,632 High 377,874b 1,962 385,073 19,202 0a 1,632 Summer Low 136,426 1,676 60,088a 16,407 0a 1,394 Medium 268,596a 1,679 91,455a 16,429 1,572a 1,395 High 379,190b 1,681 142,958b 14,452 0a 1,398
abc within a column, means without a common superscript differ (P<0.05) using Differences in Least Squares Means.
Western Dairy Management Conference
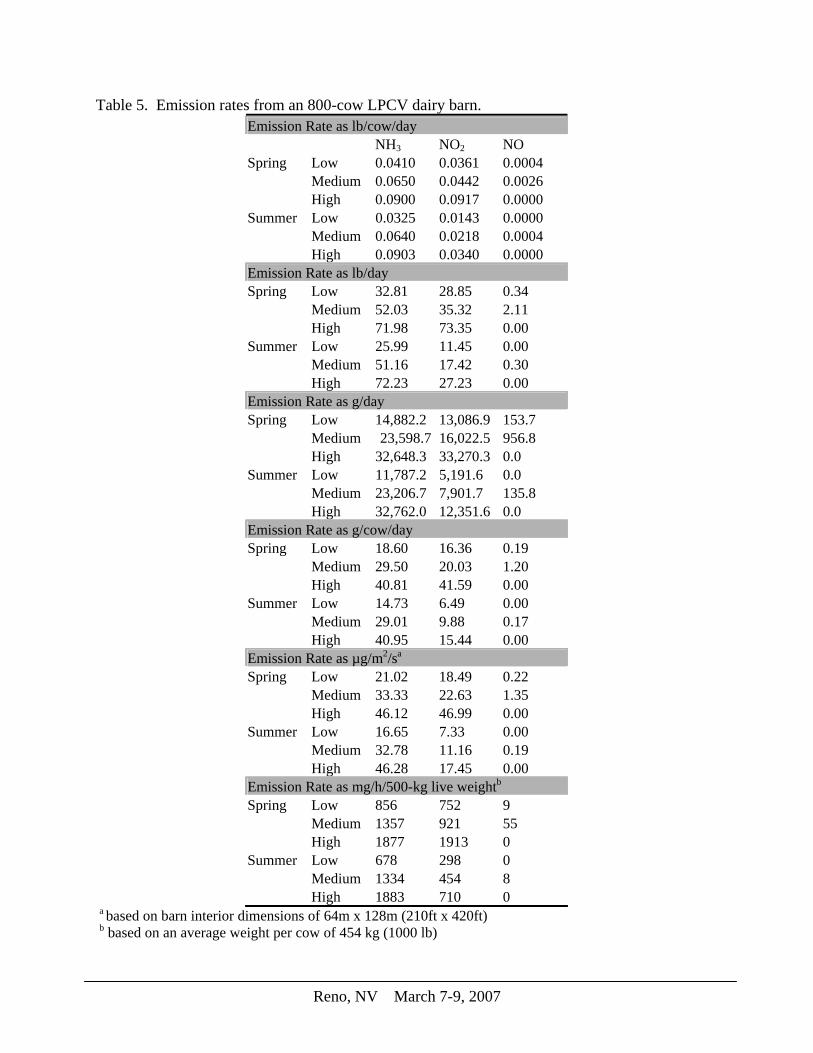
Table 5. Emission rates from an 800-cow LPCV dairy barn. Emission Rate as lb/cow/day NH3 NO2 NO Spring Low 0.0410 0.0361 0.0004 Medium 0.0650 0.0442 0.0026 High 0.0900 0.0917 0.0000 Summer Low 0.0325 0.0143 0.0000 Medium 0.0640 0.0218 0.0004 High 0.0903 0.0340 0.0000 Emission Rate as lb/day Spring Low 32.81 28.85 0.34 Medium 52.03 35.32 2.11 High 71.98 73.35 0.00 Summer Low 25.99 11.45 0.00 Medium 51.16 17.42 0.30 High 72.23 27.23 0.00 Emission Rate as g/day Spring Low 14,882.2 13,086.9 153.7 Medium 23,598.7 16,022.5 956.8 High 32,648.3 33,270.3 0.0 Summer Low 11,787.2 5,191.6 0.0 Medium 23,206.7 7,901.7 135.8 High 32,762.0 12,351.6 0.0 Emission Rate as g/cow/day Spring Low 18.60 16.36 0.19 Medium 29.50 20.03 1.20 High 40.81 41.59 0.00 Summer Low 14.73 6.49 0.00 Medium 29.01 9.88 0.17 High 40.95 15.44 0.00 Emission Rate as µg/m2/sa Spring Low 21.02 18.49 0.22 Medium 33.33 22.63 1.35 High 46.12 46.99 0.00 Summer Low 16.65 7.33 0.00 Medium 32.78 11.16 0.19 High 46.28 17.45 0.00 Emission Rate as mg/h/500-kg live weightb Spring Low 856 752 9 Medium 1357 921 55 High 1877 1913 0 Summer Low 678 298 0 Medium 1334 454 8 High 1883 710 0
a based on barn interior dimensions of 64m x 128m (210ft x 420ft) b based on an average weight per cow of 454 kg (1000 lb)
Reno, NV March 7-9, 2007
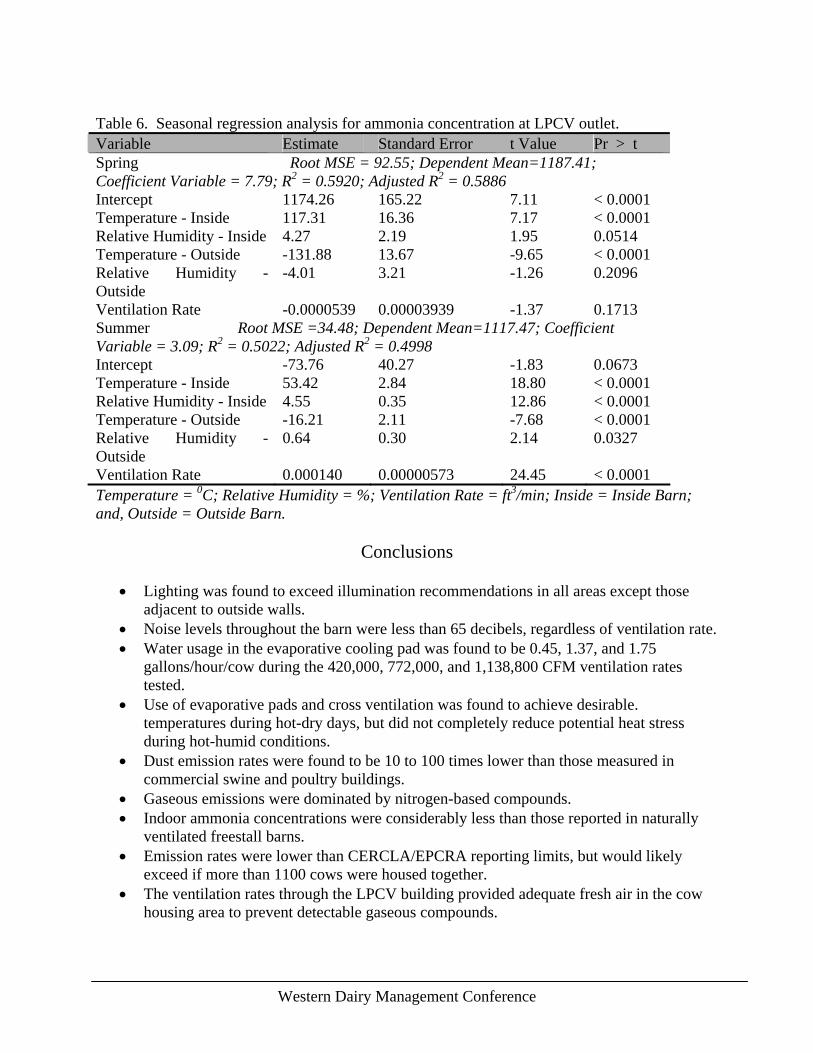
Table 6. Seasonal regression analysis for ammonia concentration at LPCV outlet. Variable Estimate Standard Error t Value Pr > t Spring Root MSE = 92.55; Dependent Mean=1187.41; Coefficient Variable = 7.79; R2 = 0.5920; Adjusted R2 = 0.5886 Intercept 1174.26 165.22 7.11 < 0.0001 Temperature - Inside 117.31 16.36 7.17 < 0.0001 Relative Humidity - Inside 4.27 2.19 1.95 0.0514 Temperature - Outside -131.88 13.67 -9.65 < 0.0001 Relative Humidity - Outside
-4.01 3.21 -1.26 0.2096
Ventilation Rate -0.0000539 0.00003939 -1.37 0.1713 Summer Root MSE =34.48; Dependent Mean=1117.47; Coefficient Variable = 3.09; R2 = 0.5022; Adjusted R2 = 0.4998 Intercept -73.76 40.27 -1.83 0.0673 Temperature - Inside 53.42 2.84 18.80 < 0.0001 Relative Humidity - Inside 4.55 0.35 12.86 < 0.0001 Temperature - Outside -16.21 2.11 -7.68 < 0.0001 Relative Humidity - Outside
0.64 0.30 2.14 0.0327
Ventilation Rate 0.000140 0.00000573 24.45 < 0.0001 Temperature = 0C; Relative Humidity = %; Ventilation Rate = ft3/min; Inside = Inside Barn; and, Outside = Outside Barn.
Conclusions
• Lighting was found to exceed illumination recommendations in all areas except those adjacent to outside walls.
• Noise levels throughout the barn were less than 65 decibels, regardless of ventilation rate. • Water usage in the evaporative cooling pad was found to be 0.45, 1.37, and 1.75
gallons/hour/cow during the 420,000, 772,000, and 1,138,800 CFM ventilation rates tested.
• Use of evaporative pads and cross ventilation was found to achieve desirable. temperatures during hot-dry days, but did not completely reduce potential heat stress during hot-humid conditions.
• Dust emission rates were found to be 10 to 100 times lower than those measured in commercial swine and poultry buildings.
• Gaseous emissions were dominated by nitrogen-based compounds. • Indoor ammonia concentrations were considerably less than those reported in naturally
ventilated freestall barns. • Emission rates were lower than CERCLA/EPCRA reporting limits, but would likely
exceed if more than 1100 cows were housed together. • The ventilation rates through the LPCV building provided adequate fresh air in the cow
housing area to prevent detectable gaseous compounds.
Western Dairy Management Conference
• The static pressure drop across the building was additive at the highest ventilation rate. There was an increase in static pressure each time the air passed beneath an additional baffle. Each baffle functioned as a sidewall inlet at the higher ventilation rate. This inlet effect was not observed at the lower ventilation rates.
• The baffles created the desired effect of moving the air down into the freestall area while maintaining air velocities above 7 mph at the high ventilation rate. This air velocity was maintained throughout the stalls immediately past each baffle.
• Baffle design, height from floor and number, is critical and must be based on sidewall inlet design procedures or fluid mechanics equations to ensure the total static pressure drop across the building does not exceed the fans desired operating range.
References
Armstrong, D.V., J.F. Smith, M.J. Brouk, V Wuthironarith, and J.P. Harner III. 2004. Impact of Soaking Cows Housed In a Tunnel Ventilated Barn Equipped With Evaporative Pads Located In Thailand. J. Dairy Sci 87 (Supp 1):598. Brouk, M.J., J. F. Smith, D.V. Armstrong, M.J. VanBaale, D. Bray, and J.P. Harner. 2005 Combining Air Cooling and Feedline Soaking for Heat Abatement of Lactating Dairy Cattle Housed in North Central Florida. Journal of Dairy Science Vol. 88 (Suppl. 1) and Journal of Animal Science Vol. 83 (Suppl. 1):504 (Abstract). Casey, K.D.; Wheeler, E.F.; Gates, R.S.; Xin, H.; Topper, P.A.; Zajaczkowski, J.; Liang, Y.; Heber, A.J.; Jacobson, L.D. Quality assured measurements of animal building emissions: Part 4. Airflow. Symposium on Air Quality Measurement Methods and Technology. Air and Waste Management Association, 2002. Dahl, G.E. 2001. Photoperiod Control Improves Production and Profit of Dairy Cows. Proceedings of the 5th Western Dairy Management Conference, Las Vegas, NV, pg. 27- 30. Jerez, S.B., Y. Zhang, J.W. McClure, L. Jacobson, A. Heber, S. Hoff, J. Koziel, and D. Beasley. 2006. Comparison of Measured Total Suspended Particulate Matter Concentrations Using Tapered Element Oscillating Microbalance and a Total Suspended Particulate Sampler. J. Air & Waste Manage. Assoc. 56:261-270. Liang, Y. and H. Xin. 2005. Performance of Single Point Monitor in Measuring Ammonia and Hydrogen Sulfide Gases. Iowa State University Animal Industry Report 2005, A.S. Leaflet R2012. Ames, IA Mutulu, A., S. Mukhtar, S. C. Capareda, C.N. Boriack, R.E. Lacey, B.W. Shaw, and C.B. Parnell. 2004. A Process-Based Approach for Ammonia Emission Measurements at a Free-Stall Dairy. ASAE Paper Number 044110. Presented at the 2004 ASAE/CSAE Annual International Meeting. Sponsored by ASAE and CSAE. Fairmont Chateau Laurier, The Westin, Government Centre. Ottawa, Ontario, Canada 1 - 4 August 2004
Reno, NV March 7-9, 2007
Schmidt, D.R., L.D. Jacobson, and K.A. Janni. 2002. Continuous monitoring of ammonia, hydrogen sulfide and dust emissions from swine, dairy and poultry barns. ASAE Paper Number 024060. Presented at the 2002 ASAE Annual International Meeting / CIGR XVth World Congress Sponsored by ASAE and CIGR. Hyatt Regency Chicago Chicago, Illinois, USA July 28-July 31, 2002. Smith, J.F., D.V. Armstrong, M.J. Brouk, V. Wuthironarith, and J.P. Harner. 2005. Impact of Using Feedline Soakers in Combination with Tunnel Ventilation and Evaporative Pads to Minimize Heat Stress in Lactating Dairy Cows Located in Thailand. Journal of Dairy Science Vol. 88 (Suppl. 1) and Journal of Animal Science Vol. 83 (Suppl. 1):503 (Abstract). U.S. Environmental Protection Agency. 1987. 40CGFR50, Revisions to the National Ambient Air Quality Standards for Particulate Matter and Appendix J – Reference Method for the Determination of Particulate Matter as PM10 in the Atmosphere. Federal Reg. 52(126):34634, 24664-24669. Zhao, L. Y., M. Brugger, R. Manuzon, G. Arnold, and E. Imerman. 2005. Study of air quality of air quality spatial and temporal distributions on large dairy farms in Ohio. Proceedings of the Seventh International Symposium, 18-20 May 2005.Beijing, China. ASABE. St. Joseph, Michigan USA.
Western Dairy Management Conference