Embed Size (px)
Citation preview

Study on thermal adaptation in naturally ventilated office buildings in Japan
SHASE Student Member †Marina TAKASU (The University of Tokyo)
Technical Fellow Ryozo OOKA (The University of Tokyo) Member Hom B. RIJAL (Tokyo City University)
Member M. INDRAGANTI (Qatar University) ASHRAE Member M. K. SINGH (The University of Tokyo)
This paper discusses the relationship between thermal environment and adaptive thermal comfort in office buildings of
Japan where occupants are able to open the windows. We conducted a questionnaire based field survey in naturally
ventilated office buildings. Analyzing the data we found that the measured value of comfort temperature can be closely
predicted using nonlinear regression analysis. Also the adaptive model which can be used over a wide range of outdoor air
temperatures is proposed.
1. Introduction
Research suggests that offices ventilated naturally by opening
of windows not only improved the thermal comfort for
occupants but also energy savings for the building1). It is also
well established that occupants comfort feeling and preferences
are different in HVAC buildings versus naturally ventilated
buildings. In Japan, the indoor temperature setting for
air-conditioning systems in offices is 28°C and 20°C (as per
Japanese Government recommendation) in summer and winter
in general. Availability of cool biz and warm biz (a
Government of Japan initiative to allow office workers wear
light clothes in offices in summer and winter) makes it easier
for occupants to take adaptive actions to make themselves
comfortable based on outdoor thermal environments.
Therefore, if these offices are designed taking thermal comfort
adaptation into consideration, energy consumption for heating
and cooling can be reduced because temperature setting can be
relaxed and a period of use air conditioning can be shorter.
To build an adaptive thermal comfort model, large data sets
on Japanese life style and climate is required because Japan
experiences high temperature and high relative humidity in
particularly summer months. The adaptive thermal comfort in
houses and offices has been widely investigated with field
studies in Japan2) 3). There are very limited studies done in
naturally ventilated buildings compared to air-conditioned
buildings. In this context, this research focused on the thermal
comfort and adaptive opportunities in a naturally ventilated
office building.
2. Methodology
We conducted a questionnaire based field survey in four
office buildings of the University of Tokyo and a building of
Japan Women's University during the months of July –
September in 20124), October – December in 20155) and
February – April in 2016. We also carried out environmental
measurements and recorded thermal comfort responses. Total
2641 data sets were collected. We measured thermal
environment such as air temperature, globe temperature,
surface temperature, relative humidity, air movements, and
conducted thermal comfort survey such as thermal sensation
(Table 1) and overall comfort. We have also recorded
environmental controls in offices and the occupant behaviour
such as window opening and clothing adjustment. For outdoor
environmental parameters weather data from the Japan
Meteorological Agency is used.
Table-1 Thermal sensation scale
1 2 3 4 5 6 7
Thermal
sensation
scale A
Cold Cool Slightly
cool Neutral
Slightly warm
Warm Hot
Thermal
sensation
scale B
Very cold
Cold Slightly
cold Neutral
Slightly hot
Hot Very hot
The data is divided into two groups depending on usage of
air-conditioning use in offices. Following terminology is used
to represent the cases.
Free-running (FR) mode: Air conditioning is not in use.
Mixed-mode: Air conditioning is in use and not in use based
on outdoor temperature (All data)
3. Results and discussions
3.1 Differences of the translation effect on the results
This section discusses the critical aspect of culture and
perception that can have a big influence on results. To show the
correlation between thermal sensation and indoor air
temperature, we perform linear regression analysis (Figure-1).
The regression equations are given below:
𝐶𝐴 = 0.14𝑇𝑜𝑝 − 0.39 ( 𝑟 = 0.16, 𝑆. 𝐸. = 0.06) (1)
𝐶𝐵 = 0.16𝑇𝑜𝑝 − 0.02 ( 𝑟 = 0.26, 𝑆. 𝐸. = 0.04) (2)
𝑤ℎ𝑒𝑟𝑒
空気調和・衛生工学会大会学術講演論文集{2016.9.14〜16(鹿児島)} -13-
第6巻
IS-4
𝐶𝐴 : Predicted thermal sensation votes (scale A)
𝐶𝐵 : Predicted thermal sensation votes (scale B)
𝑇𝑜𝑝 : Indoor operative temperature in °C
S.E. : Standard error
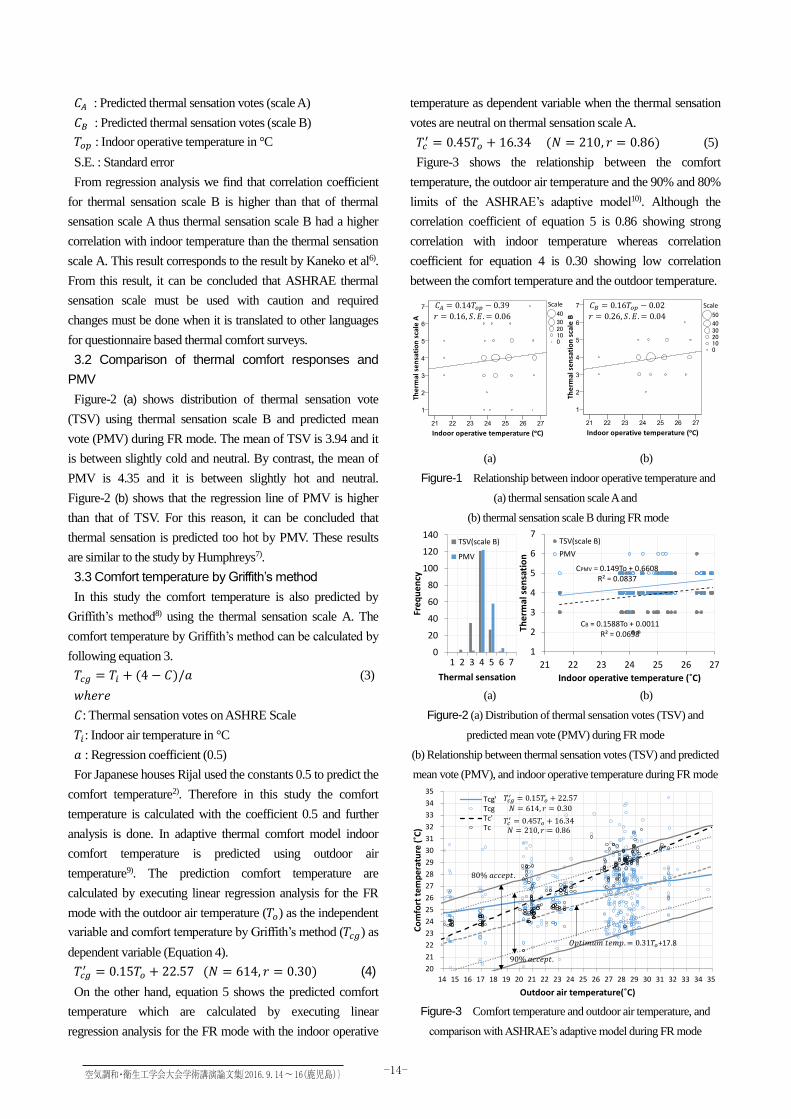
From regression analysis we find that correlation coefficient
for thermal sensation scale B is higher than that of thermal
sensation scale A thus thermal sensation scale B had a higher
correlation with indoor temperature than the thermal sensation
scale A. This result corresponds to the result by Kaneko et al6).
From this result, it can be concluded that ASHRAE thermal
sensation scale must be used with caution and required
changes must be done when it is translated to other languages
for questionnaire based thermal comfort surveys.
3.2 Comparison of thermal comfort responses and
PMV
Figure-2 (a) shows distribution of thermal sensation vote
(TSV) using thermal sensation scale B and predicted mean
vote (PMV) during FR mode. The mean of TSV is 3.94 and it
is between slightly cold and neutral. By contrast, the mean of
PMV is 4.35 and it is between slightly hot and neutral.
Figure-2 (b) shows that the regression line of PMV is higher
than that of TSV. For this reason, it can be concluded that
thermal sensation is predicted too hot by PMV. These results
are similar to the study by Humphreys7).
3.3 Comfort temperature by Griffith’s method
In this study the comfort temperature is also predicted by
Griffith’s method8) using the thermal sensation scale A. The
comfort temperature by Griffith’s method can be calculated by
following equation 3.
𝑇𝑐𝑔 = 𝑇𝑖 + (4 − 𝐶)/𝑎 (3)
𝑤ℎ𝑒𝑟𝑒
𝐶: Thermal sensation votes on ASHRE Scale
𝑇𝑖: Indoor air temperature in °C
𝑎 : Regression coefficient (0.5)
For Japanese houses Rijal used the constants 0.5 to predict the
comfort temperature2). Therefore in this study the comfort
temperature is calculated with the coefficient 0.5 and further
analysis is done. In adaptive thermal comfort model indoor
comfort temperature is predicted using outdoor air
temperature9). The prediction comfort temperature are
calculated by executing linear regression analysis for the FR
mode with the outdoor air temperature (𝑇𝑜) as the independent
variable and comfort temperature by Griffith’s method (𝑇𝑐𝑔) as
dependent variable (Equation 4).
𝑇𝑐𝑔′ = 0.15𝑇𝑜 + 22.57 (𝑁 = 614, 𝑟 = 0.30) (4)
On the other hand, equation 5 shows the predicted comfort
temperature which are calculated by executing linear
regression analysis for the FR mode with the indoor operative
temperature as dependent variable when the thermal sensation
votes are neutral on thermal sensation scale A.
𝑇𝑐′ = 0.45𝑇𝑜 + 16.34 (𝑁 = 210, 𝑟 = 0.86) (5)
Figure-3 shows the relationship between the comfort
temperature, the outdoor air temperature and the 90% and 80%
limits of the ASHRAE’s adaptive model10). Although the
correlation coefficient of equation 5 is 0.86 showing strong
correlation with indoor temperature whereas correlation
coefficient for equation 4 is 0.30 showing low correlation
between the comfort temperature and the outdoor temperature.
(a) (b)
Figure-1 Relationship between indoor operative temperature and
(a) thermal sensation scale A and
(b) thermal sensation scale B during FR mode
(a) (b)
Figure-2 (a) Distribution of thermal sensation votes (TSV) and
predicted mean vote (PMV) during FR mode
(b) Relationship between thermal sensation votes (TSV) and predicted
mean vote (PMV), and indoor operative temperature during FR mode
Figure-3 Comfort temperature and outdoor air temperature, and
comparison with ASHRAE’s adaptive model during FR mode
CB = 0.1588To + 0.0011R² = 0.0698
CPMV = 0.149To + 0.6608R² = 0.0837
1
2
3
4
5
6
7
21 22 23 24 25 26 27
The
rmal
se
nsa
tio
n
Indoor operative temperature (˚C)
TSV(scale B)
PMV
0
20
40
60
80
100
120
140
1 2 3 4 5 6 7
Fre
qu
en
cy
Thermal sensation
TSV(scale B)
PMV
20
21
22
23
24
25
26
27
28
29
30
31
32
33
34
35
14 15 16 17 18 19 20 21 22 23 24 25 26 27 28 29 30 31 32 33 34 35
Co
mfo
rt t
emp
erat
ure
(˚C
)
Outdoor air temperature(˚C)
Tcg'TcgTc'Tc
+17.8
空気調和・衛生工学会大会学術講演論文集{2016.9.14〜16(鹿児島)} -14-

3.4 Prediction of comfort temperature by nonlinear
regression analysis
(1) Methods of analysis
As discussed in section 3.3, the correlation between comfort
temperature and outdoor air temperature is low by using
Griffith’s method in this study. Therefore, for further analysis
we assumed that indoor comfort temperature is indoor
operative temperature when the thermal sensation votes are
neutral on thermal sensation scale A.
Although indoor comfort temperature is predicted by linear
regression analysis in earlier studies, we suggest the indoor
comfort temperature by nonlinear regression analysis because
there is a difference between measured and linear regression
comfort temperature when outdoor air temperature is high or
low. The following are probable main reasons to explain the
phenomenon.
1)Clothing level limitation: Clothing levels can’t be
unlimitedly reduced or increased especially in the office
environment. Therefore a range of temperature to which
occupants can adapt is limited.
2)Physiological limitation: Human/Occupant’s physiology
limits the temperature range or set of environmental conditions
to feel comfortable.
Therefore in this situation nonlinear regression analysis is
used to solve this problem.
The method of predicting the comfort temperature by
nonlinear regression analysis is the method of correcting the
linear regression analysis using the residual. The residual (𝑒) is
calculated by
𝑒 = 𝑇𝑐 − 𝑇𝑐′ (6)
𝑤ℎ𝑒𝑟𝑒
𝑇𝑐 : Measured comfort temperature in °C
𝑇𝑐′ : Predicted comfort temperature in °C by linear regression
analysis
Assuming that the change of comfort temperature becomes
lower as the outdoor air temperature is higher and lower, the
residual can be predicted by the cubic regression analysis. The
cubic regression is obtained by least-squares method (Equation
7).
𝑒′ = 𝑎𝑇𝑜3 + 𝑏𝑇𝑜
2 + 𝑐𝑇𝑜 + 𝑑 (7)
𝑤ℎ𝑒𝑟𝑒
𝑎, 𝑏, 𝑐, 𝑑 : Regression coefficient
Predicted comfort temperature by linear regression analysis
(𝑇𝑐′) is added to predicted residual (𝑒′) in order to obtain the
corrected comfort temperature (𝑇𝑐′′) (Equation 8).
𝑇𝑐′′ = 𝑇𝑐
′ + 𝑒′ (8)
(2) Prediction of comfort temperature during FR mode
The corrected comfort temperature during FR mode are
obtained by using the methods in section 3.4(1) (Equation 9).
𝑇𝑐′′ = 0.45𝑇𝑜 + 16.34
− 0.0012𝑇𝑜3 + 0.10𝑇𝑜
2 − 2.66𝑇𝑜 + 20.07 (9)
(𝑁 = 210, 𝑟 = 0.88)
The correlation coefficient of regression curve is 0.02 higher
than that of linear regression (Equation 5). The comfort
temperature which is lower than 24°C is almost constant value
(Figure-4). The comfort temperature is higher than the
optimum temperature of ASHRAE’s adaptive model.
(3) Prediction of comfort temperature in mixed-mode
The equation 10 shows the predicted comfort temperature by
linear regression analysis in mixed-mode.
𝑇𝑐′ = 0.21𝑇𝑜 + 21.52 (𝑁 = 1079, 𝑟 = 0.59) (10)
Furthermore, the equation 11 is constructed using the
methods in section 3.4(1).
𝑇𝑐′′ = 0.21𝑇𝑜 + 21.52
− 0.0015𝑇𝑜3 + 0.10𝑇𝑜
2 − 1.94𝑇𝑜 + 11.51 (11)
(𝑁 = 1079, 𝑟 = 0.65)
The correlation coefficient of regression curve is 0.06 higher
than that of linear regression. Figure-5 shows the relation
between comfort temperature and outdoor air temperature, and
the comparison with ASHRAE’s adaptive model in mixed-mode.
In comparison with regression curve for the FR mode
(Figure-4), the result is distinct in the high and low outdoor air
temperature. It is found that the comfort temperature becomes
higher when the outdoor air temperature is lower than 12°C.
This is similar to the statistical dependence of indoor thermal
neutralities on climate by Humphreys1). In addition, the
comfort temperature tends to decrease as the outdoor air
temperature becomes higher than 31°C.
3.5 Relationship between adaptive behaviour and
comfort temperature
In this section we are analyzing adaptive behaviour to clarify
a mechanism of the change of comfort temperature. The
proportion of use of cooling and heating which varies with the
outdoor temperature are predicted by logistic analysis11)
(Equation 12, 13). Prediction open windows and clo value
which vary with the outdoor temperature are obtained by
least-squares method (Equation 14, 15).
logit(𝑝𝐶𝐿) = 0.57 𝑇𝑜 − 14.88 (𝑅2 = 0.34) (12)
logit(𝑝𝐻𝑇) = 2.27𝑇𝑜 − 31.35 (𝑅2 = 0.15) (13)
𝑝𝑤 = −0.0036𝑇𝑜2 + 0.16𝑇𝑜 − 1.30 (𝑅2 = 0.13) (14)
𝐼𝑐𝑙 = 0.0013𝑇𝑜2 − 0.082𝑇𝑜 + 1.74 (𝑅2 = 0.49) (15)
Under the adaptive mechanism, clothing behaviour provides
the maximum adaptive opportunities and flexibility to
occupant to adjust itself to the changing thermal environment.
But in office environment there is some kind of restriction to
clothing choices. This nature of adaptation is visible in figure 6.
空気調和・衛生工学会大会学術講演論文集{2016.9.14〜16(鹿児島)} -15-

In the polynomial regression (as shown in equation 15) line we
see that the lines at higher temperature bent upwards showing
the adaptation. This shows that despite high temperature
occupants get accustomed to particular clothing level.
As explained in the previous section, the gradient of
regression curve is comparatively large between 15°C to 28°C
to adapt outdoor air temperature (Figure-5) because of the
occupants’ adaptive behaviour in this range of the outdoor air
temperature. The major causes of this behaviour are changing
the clothing and controlling open windows (Figure-6). The
comfort temperature tends to saturate and then decreases or
increases as the outdoor air temperature becomes high or low,
and the proportion of cooling or heating is high. This finding
indicates that the comfort temperature varies based on
occupant’s behavioural adjustment in different seasons.
4. Conclusions
Thermal comfort surveys of Japanese office buildings where
occupants were able to open the windows was conducted. The
following results are found:
1)The comfort temperature, which is close to the measured
value, is predicted by using nonlinear regression analysis.
Therefore, the adaptive model, which can be used over a wide
range of outdoor air temperatures, is suggested.
2)After analyzing the comfort temperature for all the data, it
is found that the comfort temperature decrease as the outdoor
air temperature increase when the outdoor air temperature is
high, and the comfort temperature increase as the outdoor
temperature decrease when the outdoor air temperature is low.
3)It is indicated that the comfort temperature changes
according adjustment behaviour which are mainly changing
the clothing and controlling the proportion of open windows
across different seasons.
References
1) de Dear et al: Developing an Adaptive Model of Thermal
Comfort and Preference, FINAL REPORT ASHRAE RP-884,
1997
2) Rijal et al: Investigation of comfort temperature, adaptive
model and the window-opening behaviour in Japanese houses,
Architectural Science Review, Vol.56, No.1, pp.54-69, 2013
3) Goto et al: Long-term field survey on thermal adaptation in
office buildings in Japan, Building and Environment, Vol.42,
pp.3944-3954, 2007
4) Indraganti et al: Thermal comfort in offices in summer:
Findings from a field study under the ‘setsuden’ conditions in
Tokyo, Building and Environment, Vol.61, No.3, pp.114-132,
2013
5) Takasu et al: Study on thermal adaptation in naturally
ventilated office buildings in Japan, 9th Windsor Conference,
2016
6) Kaneko et al: A study on evaluation of Japanese psychological
responses to thermal environment by word-choice method
with a unipolar scale, J. Archit. Plann. Environ. Eng.,
Architectural Institute of Japan, Vol.543, pp.93-99, 2001
Figure-4 Relationship between comfort temperature and outdoor air
temperature, and comparison with ASHRAE’s adaptive model during
FR mode
Figure-5 Relationship between comfort temperature and outdoor air
temperature and comparison with ASHRAE’s adaptive model in
mixed-mode
Figure-6 Relationship between outdoor air temperature and
adjustment behavior
7) Humphreys: Principles of Adaptive Thermal Comfort, The
Society of Heating, Air-Conditioning Sanitary Engineers of
Japan, Vol.83, No.6, pp.413-419, 2008
8) Griffiths: Thermal comfort in buildings with passive solar
features : field studies, Commission of the European
Communities, 1991
9) ASHRAE, Thermal Environmental Conditions for Human
Occupancy, ANSI/ASHRAE Standard 55-2004, 2004
10)de Dear and Brager : The adaptive model of thermal comfort
and energy conservation in the built environment, Int. J.
Biometeorology, Vol.45, pp.100-108, 2001
11)Nicol and Humphreys: A Stochastic Approach to Thermal
Comfort-Occupant Behavior and Energy Use in Buildings,
ASHRAE Transactions, Vol.110, pp.554-568, 2004
20
21
22
23
24
25
26
27
28
29
30
31
32
14 15 16 17 18 19 20 21 22 23 24 25 26 27 28 29 30 31 32
Co
mfo
rt t
em
pe
ratu
re (
˚C)
Outdoor air temperature (˚C)
Tc''
Tc'
Tc
+17.8
20
21
22
23
24
25
26
27
28
29
30
31
32
8 9 10 11 12 13 14 15 16 17 18 19 20 21 22 23 24 25 26 27 28 29 30 31 32 33 34 35
Co
mfo
rt t
em
pe
ratu
re (
˚C)
Outdoor air temperature (˚C)
Tc'
Tc'
Tc
+17.8
0
0.2
0.4
0.6
0.8
1
1.2
8 9 10 11 12 13 14 15 16 17 18 19 20 21 22 23 24 25 26 27 28 29 30 31 32 33 34 35
Pro
po
rtio
n (
%),
clo
val
ue
(cl
o)
Outdoor air temperature (ᵒC)
Proportion of control in use cooling, pCL (%) Proportion of control in use heating, pHT (%)Proportion of windows open, pw (%) clo value, Icl (clo)
空気調和・衛生工学会大会学術講演論文集{2016.9.14〜16(鹿児島)} -16-