Embed Size (px)
Citation preview
Evaluation of Thermal Comfort in Naturally Ventilated School Classrooms during the
heating season using CFD Charalampos Angelopoulos*1, Malcolm J. Cook1, Christopher R. Iddon2 and Stephen M. Porritt1
1Loughborough University, School of Civil and Building Engineering, LE11 3TU, UK 2SE Controls, Hood Innovation Centre, Wellington Crescent, Lichfield, WS13 8RZ, UK.
Abstract
This paper investigates the performance and control of
natural ventilation during the heating season in order to
avoid occupant discomfort. The current study examined
different window configurations under a wide range of
external temperatures and wind speeds using a CFD
simulation tool. The results showed that thermally
comfortable indoor conditions could be achieved in a
UK classroom when external temperatures are as low as
8°C using high-level openable windows. At lower
external temperatures, occupants are predicted to be
thermally dissatisfied due to localised discomfort caused
by draughts. The results from the CFD model also
suggest that acceptable internal thermal conditions can
be maintained with wind speeds up to 10m/s, for an
external temperature of 10°C. The PMV results indicated
that thermal comfort is achieved and is uniformly
distributed within the classroom. This work will enable
the UK’s Education Funding Agency to have a greater
understanding of the effective control of windows to
eliminate wintertime discomfort and avoid unnecessary
heating for naturally ventilated spaces.
Introduction
Natural ventilation is considered a sustainable solution to
maintain healthy and thermally comfortable internal
environments and offers lower energy consumption
compared to mechanical ventilated spaces (Ji, Lomas, &
Cook, 2009). However, the flows that are created in
naturally ventilated spaces are more complex compared
to mechanical systems and hence more difficult to
predict. Thus, a natural ventilation strategy should be
carefully designed, and the physics understood. This is
even more crucial during wintertime, because cold
draughts could cause discomfort conditions for the
occupants (Fanger, 1977). This effect is even more
important when it comes to environments that require
specific conditions, such as schools.
Thermal comfort and indoor air quality are fields that
have attracted attention with respect to school
environments. Limited studies have investigated the
internal thermal conditions and the level of indoor air
quality in schools is associated with pupils’
performance. Low ventilation rates in classrooms have
been shown to negatively affect students’ performance
regarding attention, memory and concentration (Coley et
al., 2007; Bakó-Biró, et al., 2012; Barrett, et al.,2015). In
addition, previous studies have indicated that students
could possibly suffer from long-lasting health issues,
such as asthma, when they are exposed to environments
where ventilation rates are below the recommended
values (Mendell & Heath, 2005).
Previous researches have examined the levels of thermal
comfort and indoor air quality in naturally ventilated
English school classrooms. Although internal
temperatures during the heating season were found to be
acceptable, the monitored data revealed poor indoor air
quality in some of the classrooms, mainly due to
inadequate control of the windows (Iddon & Hudleston,
2014; Chatzidiakou, et al., 2015). Due to low external air
temperatures, the teachers preferred to keep the windows
closed to avoid thermal discomfort conditions in the
classroom, which resulted in very low ventilation rates.
Hence, it is essential to effectively control the opening of
the windows in naturally ventilated classrooms to
provide adequate outside air and to secure the absence of
cold draughts.
In England, the Priority School Building Program
Facilities Output Specification (PSBP-FOS) requires
natural ventilation solutions to meet a performance
specification to ensure occupant comfort and reduce
discomfort from draughts (PSBP, 2014). The draft
BB101 Guidelines on ventilation, thermal comfort and
indoor air quality in schools, which is currently out for
consultation, contains further guidance on acceptable
internal conditions when ventilating a classroom
naturally. This includes internal air temperature and
airspeed within the occupied zone to avoid cold draughts
(PSBP, 2014; EFA, 2016). However, there is a lack of
research that investigates under what conditions these
requirements can be met. The aim of this current study
is to bridge the gap in the literature on the effective
control of natural ventilated systems under several
outside conditions during wintertime.
Methodology
To discern the most appropriate conditions for natural
ventilation in classrooms during the heating period, the
performance of different ventilation scenarios was
explored. These scenarios include single-sided natural
ventilation of a classroom using two opening
configurations during a range of weather conditions.
The present study examined the performance of single-
sided natural ventilation systems in a typical UK
classroom that is 7.8m long, 9m wide and 3.3m high
using a Computational Fluid Dynamics (CFD)
simulation tool. The dimensions of the classroom are in
agreement with the rule of thumb proposed by CIBSE
(2005a), stating that the depth of the classroom should
not exceed 2.5 times the height of the space when a
single sided ventilation strategy, with high and low
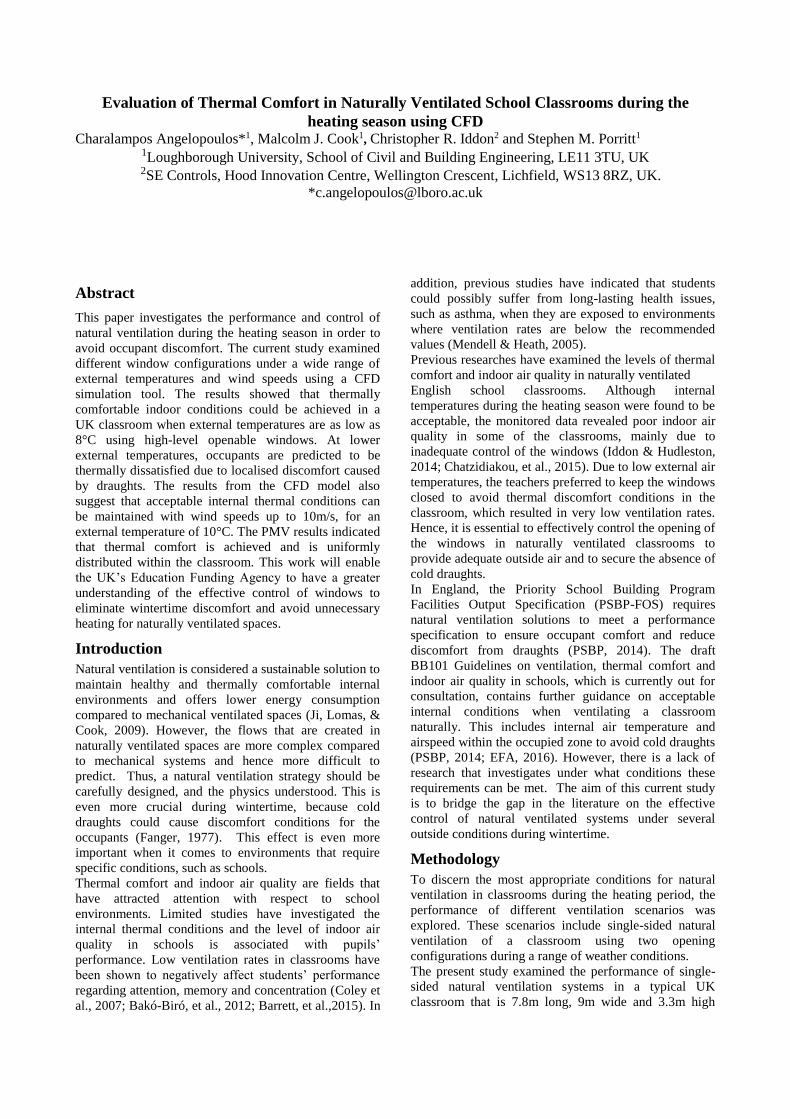
ventilation openings, is used. The classroom contained
thirty students and two additional occupants who were
considered to be the teacher and the teaching assistant.
The occupants were equally distributed across the
classroom in such a way that a circulation area on the
perimeter of the classroom was available, see Figure 1.
In total four windows were modelled and based on the
examined ventilation strategy the windows were
modelled as top-hung open-out or bottom-hung open-in.
The high-level openings were 2.6m wide, 0.7m high, and
the low-level 2.6m wide and 1.4m high. The opening
angle of the windows, and hence the free area of the
windows, varied according to the outside conditions in
order to ensure that the provision of outside air was
about 8 l/s/p, which is the preferred ventilation flow rate
for classrooms.
Figure 1: Benchmark geometry for CFD simulations.
Plan view (top) and vertical section (bottom) of the
classroom. Occupants are represented in red; ceiling
lights are shown in yellow and furniture in grey.
For the base case scenarios, the top-level windows were
modelled to be open. However, for outside conditions
with air temperatures above a certain limit, both the low
and high-level windows were modelled to be open to
ensure additional airflow to prevent overheating. The
low-level windows were assumed to open manually and
they were restricted to 100mm opening length. This
configuration is widely used for safety purposes. In the
initial design of the classroom, similar geometry was
used but without the use of furniture. However, after
launching the simulations with several outside
conditions it was observed that although the ventilation
rate and the average internal air temperature were within
the recommended values from EFA (2016), almost 26%
[8 out of 30] of the students will most likely experience
discomfort conditions due to cold draughts. Thus, an
item of furniture (4.8m, 0.485m, 1.2m) was placed
directly below the window and 150mm away from the
wall. This unit can be used as a storage facility or as
bookshelves. The furniture was used to divert the cold
air from entering into the occupied zone directly.
Table 1 shows the boundary conditions for the CFD
simulations. The values for the heat gains for the ceiling
lights were adapted from BB101 (EFA, 2016). For the
occupants, BB101 proposes 70W per occupant for the
heat gains. However, a more sophisticated approach was
used to simulate the heat gains for this study, whereby
the convective portion of the occupant heat gain is
modelled as a constant heat flux at the location of the
occupants and the radiant component is assumed to be
absorbed and be emitted by the walls. To accurately
calculate the convective portion of heat gains, the values
from CIBSE (2015) have been used for the percentage of
the radiant portion.
Table 1: Boundary conditions for the CFD simulations. Object Dimensions
(X,Y,Z)(m,m,m)
Heat
output
Quantity
Occupants (0.5,0.5,1.4) 39.6 [W] 32
Classroom
walls - 6.5 [W/m2] 4
Ceiling (9,7.8,-) 6.5 [W/m2] 1
Floor (9,7.8,-) 0 1
Lights (0.4,1.5,0.1) 70
[W per unit] 10
Computer (0.2,0.5,0.3) 100 [W] 1
Interactive 100 [W] 1
Furniture (4.8,0.485,1.2) - 1
Window
Based on the
examined
scenario
- 2 or 4
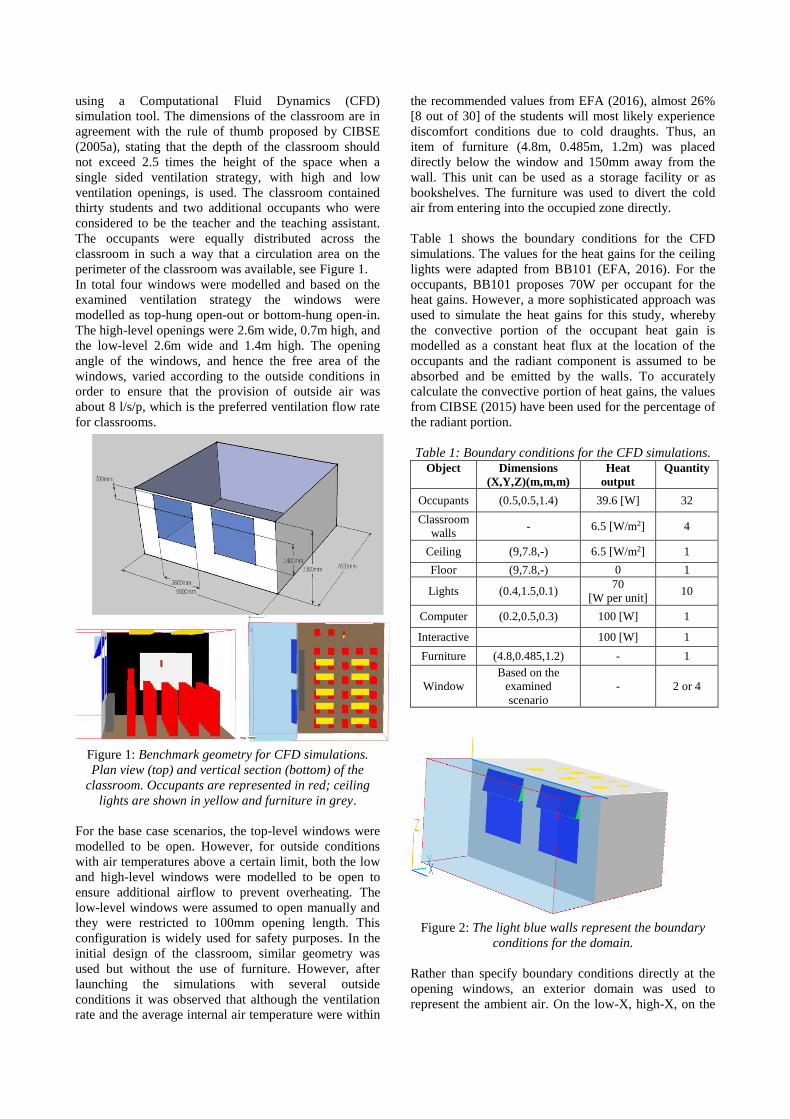
Figure 2: The light blue walls represent the boundary
conditions for the domain.
Rather than specify boundary conditions directly at the
opening windows, an exterior domain was used to
represent the ambient air. On the low-X, high-X, on the
low-Y and high-Y and on the high-Z boundaries of the
domain, (see Figure 2), the orifice flow equation was
used with a discharge coefficient of 𝐶𝑑 = 0.61 [-] (Equation 1). This enabled the air to flow into and out of
the domain (and the classroom) according to the
prevailing pressure differences and aids convergence
stability.
Pressure drop = 1
𝐶𝑑2 =
1
0.612 = 2.69
(1)
For the wind driven natural ventilation cases, a "WIND-
PROFILE" object was imposed using a logarithmic wind
profile. A 2D inlet boundary condition associated with
the wind velocity profile was used (CHAM, 2016).
Furthermore, the wind direction was selected to be
normal to the low-Y face and thus the input value was
given only to the Y-direction component of the velocity.
In addition, it was assumed that the wind velocity profile
was fully developed at the height of the building and
hence the reference height was set to be 3.3 m. For both
the buoyancy and the wind-driven cases, the whole
domain approach was used whereby the internal and
external environments are modelled simultaneously,
allowing prediction of the airflow and temperature
around the classroom, at the ventilation openings as well
as throughout the interior spaces (Spentzou, 2015). For
the buoyancy case the size of the domain was
[X,Y,Z]=[9m,11.8m,3.3m] and for the wind case
[X,Y,Z]=[50m,70m,16.5m].
Ventilation Strategies
For the purpose of this research, the scenarios focus on
both wind and buoyancy driven natural ventilation
scenarios. For both cases, the scenarios include a broad
range of external conditions. In total eleven scenarios
were examined which are shown in the table below:
Table 2: Ventilation scenarios
Buoyancy Driven
Ventilation Scenarios
Wind Driven
Ventilation
Scenarios
Top
hung-out
high level
openings
Bottom
hung-in
high level
openings
Top hung-
out high
and low
level
openings
Bottom hung-in
high level
openings and
10 °C outside
8°C
outside
8°C
outside
15°C
outside
3.5m/s wind
speed
10°C
outside
10°C
outside 5m/s wind speed
13°C
outside
13°C
outside 7m/s wind speed
10m/s wind speed
Evaluation Criteria
To assess the performance of the different ventilation
scenarios the predicted internal air temperature and
velocity as well as the provision of the outside air are
examined for buoyancy and wind-driven scenarios. The
CFD simulations provide predictions of the air
temperature and velocity across the classroom with
visual representation of their patterns. These results are
used to evaluate the variance in the classroom’s air
temperature and velocity at different heights. All the
values are examined in the occupied zone, considered to
be between 0.6m and 1.4m above floor level and at ankle
height, 0.1m above the floor (EFA, 2016).
Based on the criteria established by BB101 for natural
ventilation during the heating season, the air temperature
difference between the incoming air and minimum
maintained internal temperature, considered to be 19°C,
should not exceed 4K. In addition, the difference
between the temperature at the ankle and head level
should not be greater than 3K (EFA, 2016). Hence, those
two criteria are used to evaluate the predicted internal air
temperature.
Air velocity and air speed gradients in the classroom are
assessed using the metrics in the draft BB101 to examine
the risk of cold draughts in the occupied zone. The air
speed inside an occupied zone for naturally ventilated
spaces should not exceed 0.3m/s providing that there is
local control of the vent (EFA, 2016). However,
CIBSE:KS6 (2006) states that the ankle and head are the
most sensitive parts of the human body to cold draughts,
hence the air velocity at 0.1m above the floor,
considered to be the ankle height, is also assessed.
Furthermore, predictions of the ventilation rate are
essential to evaluate the general indoor air quality of the
classroom. The optimum ventilation rate for naturally
ventilated classrooms is 8l/s/p (EFA, 2016). If the
ventilation rate is close to this value then it is considered
that the CO2 concentration will be below 1000ppm
(EFA, 2016). However, for external temperatures above
15°C the ventilation rate should be higher to offset the
internal heat gains and prevent any risk of overheating.
Table 3 summarizes the evaluation criteria. To calculate
the flow field in the openings, additional lines of code
were added in the existing CFD code. The objects that
were used are 2D planes that can be attached to any
object without interfering with the computation or the
flow distribution CHAM (2016). The new code was
developed explicitly for the purpose of this research. The
additional code at each object calculated the average
velocity, the volumetric flow rate and the mass flow rate
(Spentzou, 2015). Finally, to capture the predicted
thermal sensation of the occupants, the CFD simulations
calculated the Predicted Mean Vote (PMV). The
distribution of the PMV was assessed against the
proposed values from BB101.
The behaviour of the downwards plume of incoming air
from the open window was assessed by predicting the
rate at which the surrounding air was entrained into the
plume due to the downwards momentum, i.e. the rate of
growth of the plume. This growth is what provides the
mixing of the incoming air with the air inside the
classroom, which tempers the incoming air. This rate of
mixing is determined by the entrainment coefficient,
which is calculated by plotting the variation of plume
width with height above the source (Cook and Lomas
1998). Fundamental plume theory was used in Cook
(1998) to show that the gradient of this graph is directly
proportional to the plume entrainment.
Table 3: Evaluation Criteria (adapted by BB101). Draught air speed [m/s] 0.3
ΔT(Min maintained operative temp - plume local air temp)
[K] 4
ΔΤ(head to ankle)
[K] 3
PMV -1 to +1
CFD simulation tool
The 2016 version of the CFD software PHOENICS
(CHAM, 2016), using the FLAIR interface, was used to
carry out steady state simulations. This is a well-
established tool for simulating and analysing fluid flow,
air velocity and temperature by quantitatively predicting
the airflow patterns (Walker, 2005). PHOENICS has
been widely used by researchers to examine the airflow
in classrooms (Chiang and Lai, 2009; Stevanovic et al.,
2015; Spentzou et al., 2016). CFD software predicts
airflow by solving the conservation equations for mass,
momentum and energy. Generally, the airflow is
turbulent and hence a method of modelling turbulence is
required. This research used the standard k-ε turbulence
model of Launder & Spalding (1974) with the
Boussinesq approximation for representing buoyancy
effects. These models consider the effects of density
variations by using an additional source term in the
momentum equation (Cook M. J., 1998) and has been
widely tested and used as the main turbulence model for
steady state modelling of buoyancy-driven flows
(Dascalaki et al., 1999; Visagavel and Srinivasan, 2009).
The simulations were considered converged when the
spot values of each variable became constant and the
enthalpy residual was less than 1% of the total heat gain
for the domain. (Cheung, 2011). In general, all residuals
were expected to reduce by a factor of 100 from their
initial sweeps (Walker, 2005). Prior to launching the
simulations for the proposed ventilation scenarios, mesh
sensitivity analyses were performed to evaluate the
optimum mesh density. For each case the convergence of
the simulation and the computational time were
evaluated. The optimum number of cells was found to
be: [X,Y,Z]=[103,109,38] for the buoyancy cases and
[X,Y,Z]=[128,114,49] for the wind cases. For all the
examined scenarios, the simulations had reached
convergence.
Results and Analysis
The results from the CFD simulations are presented in
this section. Table 4 compares the predicted provision of
outside air as well as the average internal air temperature
and velocity at different heights for the buoyancy-driven
natural ventilation scenarios. The results showed that for
Table 4: Predicted indoor air conditions using CFD for buoyancy driven natural ventilation scenarios.
all the examined scenarios the ventilation flow rates
were above the optimum level of 8l/s/p. This suggests
that with a controlled opening of the windows it is
feasible to maintain acceptable levels of outside air
supply for single-sided naturally ventilated spaces. The
predicted values of the ventilation flow rates between the
top hung-out and bottom-hung-in window configurations
are generally close. The CFD predicted slightly higher
ventilation rates for the top hung openings.
A possible explanation is that for the top-hung cases the
outside air entered through the low part of the window
where the free area of the window was greater. In
contrast, for the bottom-hung cases, the air entered
through the side triangles of the free area of the
windows, which are generally smaller in area. The free
area is as defined in Jones et al., (2016) as the geometric
area of the openings. Nevertheless, based on results from
previous studies when the provision of outside air is
above 8l/s/p then the CO2 concentration is below the
recommended value of 1000pmm (EFA, 2016).
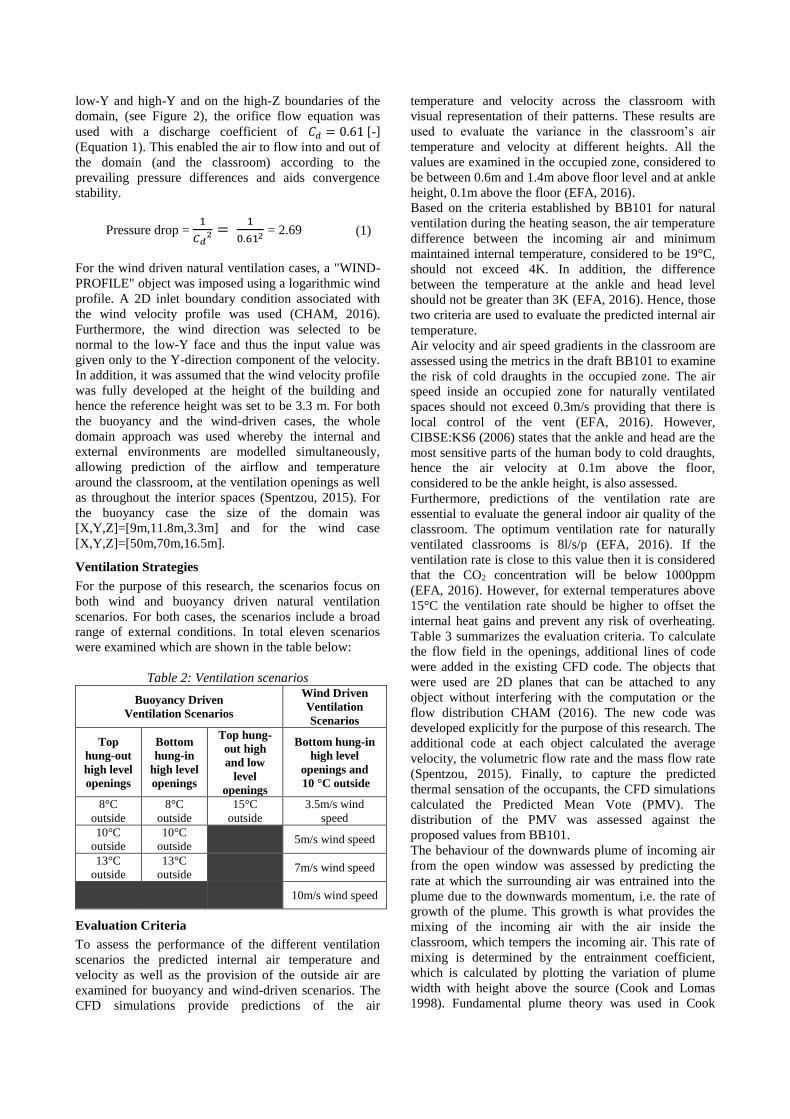
Figure 3 & Figure 5 highlight the airflow velocities and
the draught plume for the top hung-out and bottom hung-
in window configurations for the buoyancy driven
natural ventilation scenarios respectively. The contour
plots represent a section of the classroom and a plan
view of the velocity distribution at the seated height,
0.6m above the floor as it is the lower limit of the
occupied zone specified by BB101.
As presented in these graphs, the velocity exceeded the
value of 0.3m/s closer to the window and behind the
furniture. The placement of the furniture was essential to
reduce the risk of cold draughts within the occupied
zone. In results not shown, the omission of this furniture
resulted in draught plumes that exceeded 0.3m/s in the
occupied zone. For all the cases, the velocity patterns
indicated the flow paths of the incoming outside air. For
Top hung-out high level
openings
Bottom hung-in high level
openings
Top hung-out high
and low level openings
Outside temperature[°C] 8 10 13 8 10 13 15
Ventilation rates[l/s/p] 8.7 8.8 8.9 8.3 8.3 8.5 10.6
Stroke length [mm] 475 500 500 475 500 500 300(top)/100(bottom)
ΔTankle-head [K] 1.40 1.69 1.68 1.44 1.83 1.52 1.46
vaverage [m/s] (0.1m above floor) 0.21 0.18 0.19 0.18 0.19 0.19 0.22
vaverage [m/s] (0.6m above floor) 0.08 0.07 0.05 0.08 0.09 0.09 0.08
vaverage [m/s] (1.4m above floor) 0.07 0.06 0.06 0.06 0.07 0.07 0.05
the top hung-out cases, the air entered through the low
side of the openings and after passing behind the
furniture, it was spread towards the sidewalls.
Figure 3: Vertical sections (left) and plan view at 0.6m
above floor (right) velocity fields for top hung out
buoyancy driven strategies. Contour legend refers to all
the graphs and “T” indicates the external temperature.
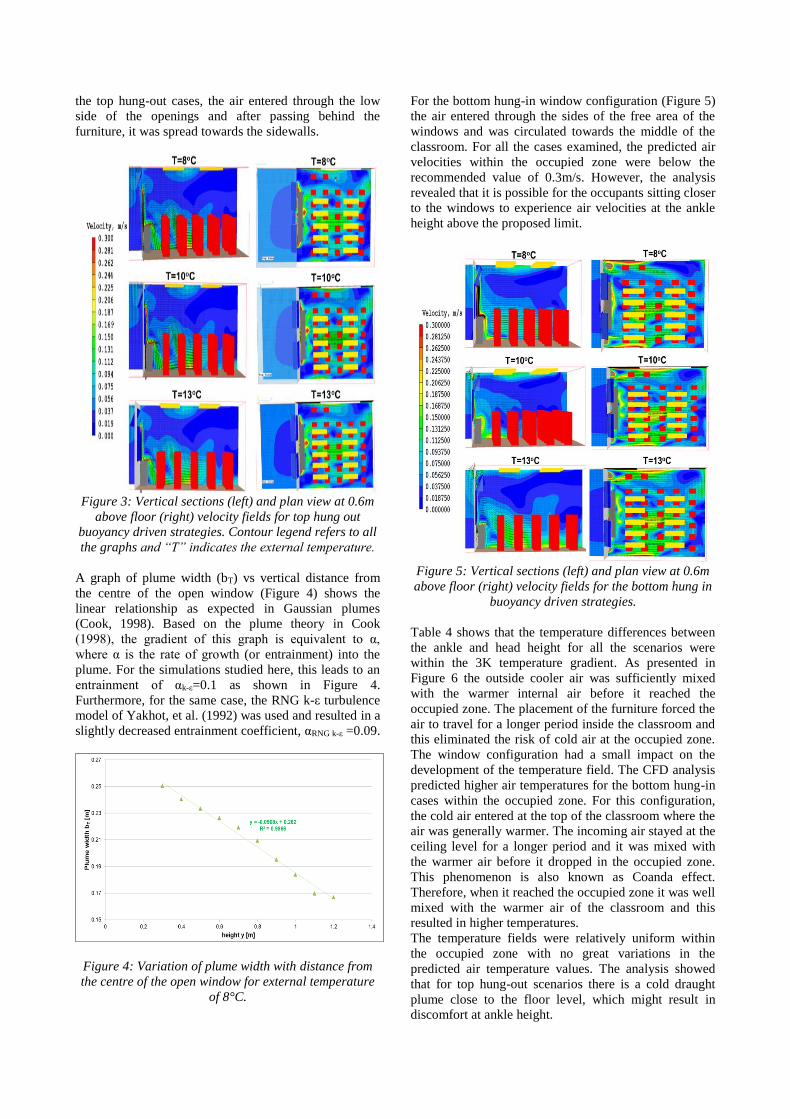
A graph of plume width (bT) vs vertical distance from
the centre of the open window (Figure 4) shows the
linear relationship as expected in Gaussian plumes
(Cook, 1998). Based on the plume theory in Cook
(1998), the gradient of this graph is equivalent to α,
where α is the rate of growth (or entrainment) into the
plume. For the simulations studied here, this leads to an
entrainment of αk-ε=0.1 as shown in Figure 4.
Furthermore, for the same case, the RNG k-ε turbulence
model of Yakhot, et al. (1992) was used and resulted in a
slightly decreased entrainment coefficient, αRNG k-ε =0.09.
Figure 4: Variation of plume width with distance from
the centre of the open window for external temperature
of 8°C.
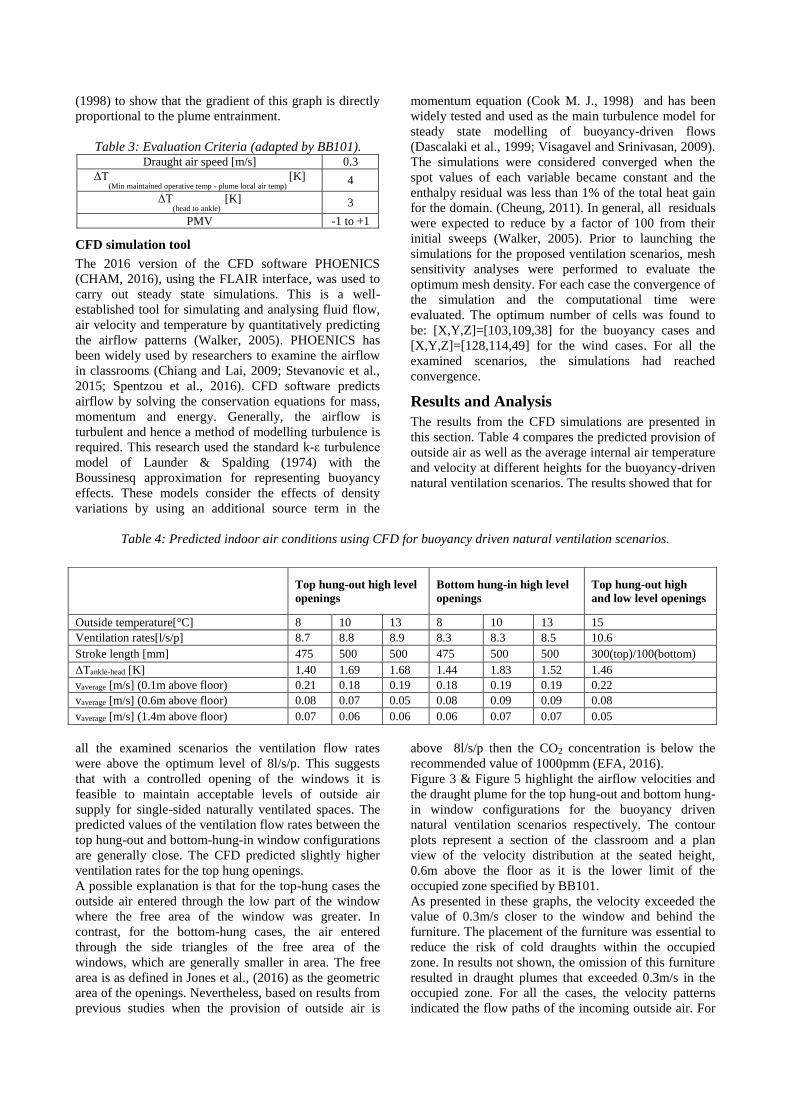
For the bottom hung-in window configuration (Figure 5)
the air entered through the sides of the free area of the
windows and was circulated towards the middle of the
classroom. For all the cases examined, the predicted air
velocities within the occupied zone were below the
recommended value of 0.3m/s. However, the analysis
revealed that it is possible for the occupants sitting closer
to the windows to experience air velocities at the ankle
height above the proposed limit.
Figure 5: Vertical sections (left) and plan view at 0.6m
above floor (right) velocity fields for the bottom hung in
buoyancy driven strategies.
Table 4 shows that the temperature differences between
the ankle and head height for all the scenarios were
within the 3K temperature gradient. As presented in
Figure 6 the outside cooler air was sufficiently mixed
with the warmer internal air before it reached the
occupied zone. The placement of the furniture forced the
air to travel for a longer period inside the classroom and
this eliminated the risk of cold air at the occupied zone.
The window configuration had a small impact on the
development of the temperature field. The CFD analysis
predicted higher air temperatures for the bottom hung-in
cases within the occupied zone. For this configuration,
the cold air entered at the top of the classroom where the
air was generally warmer. The incoming air stayed at the
ceiling level for a longer period and it was mixed with
the warmer air before it dropped in the occupied zone.
This phenomenon is also known as Coanda effect.
Therefore, when it reached the occupied zone it was well
mixed with the warmer air of the classroom and this
resulted in higher temperatures.
The temperature fields were relatively uniform within
the occupied zone with no great variations in the
predicted air temperature values. The analysis showed
that for top hung-out scenarios there is a cold draught
plume close to the floor level, which might result in
discomfort at ankle height.
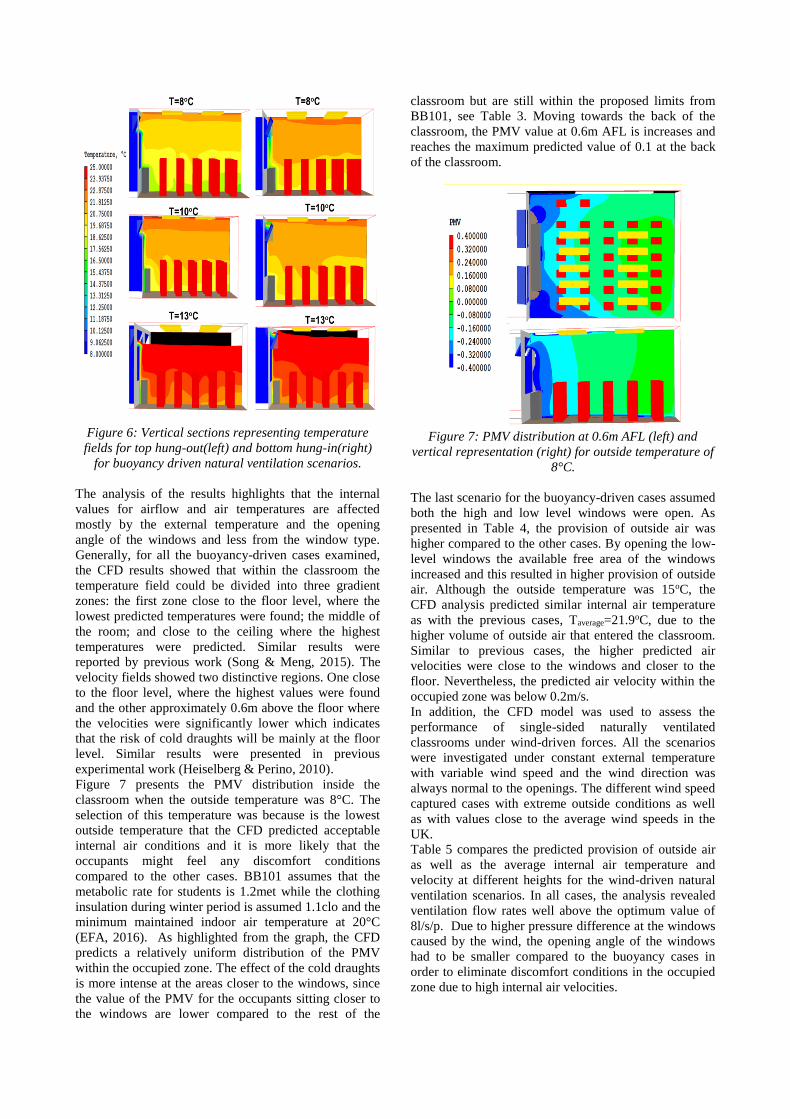
Figure 6: Vertical sections representing temperature
fields for top hung-out(left) and bottom hung-in(right)
for buoyancy driven natural ventilation scenarios.
The analysis of the results highlights that the internal
values for airflow and air temperatures are affected
mostly by the external temperature and the opening
angle of the windows and less from the window type.
Generally, for all the buoyancy-driven cases examined,
the CFD results showed that within the classroom the
temperature field could be divided into three gradient
zones: the first zone close to the floor level, where the
lowest predicted temperatures were found; the middle of
the room; and close to the ceiling where the highest
temperatures were predicted. Similar results were
reported by previous work (Song & Meng, 2015). The
velocity fields showed two distinctive regions. One close
to the floor level, where the highest values were found
and the other approximately 0.6m above the floor where
the velocities were significantly lower which indicates
that the risk of cold draughts will be mainly at the floor
level. Similar results were presented in previous
experimental work (Heiselberg & Perino, 2010).
Figure 7 presents the PMV distribution inside the
classroom when the outside temperature was 8°C. The
selection of this temperature was because is the lowest
outside temperature that the CFD predicted acceptable
internal air conditions and it is more likely that the
occupants might feel any discomfort conditions
compared to the other cases. BB101 assumes that the
metabolic rate for students is 1.2met while the clothing
insulation during winter period is assumed 1.1clo and the
minimum maintained indoor air temperature at 20°C
(EFA, 2016). As highlighted from the graph, the CFD
predicts a relatively uniform distribution of the PMV
within the occupied zone. The effect of the cold draughts
is more intense at the areas closer to the windows, since
the value of the PMV for the occupants sitting closer to
the windows are lower compared to the rest of the
classroom but are still within the proposed limits from
BB101, see Table 3. Moving towards the back of the
classroom, the PMV value at 0.6m AFL is increases and
reaches the maximum predicted value of 0.1 at the back
of the classroom.
Figure 7: PMV distribution at 0.6m AFL (left) and
vertical representation (right) for outside temperature of
8°C.
The last scenario for the buoyancy-driven cases assumed
both the high and low level windows were open. As
presented in Table 4, the provision of outside air was
higher compared to the other cases. By opening the low-
level windows the available free area of the windows
increased and this resulted in higher provision of outside
air. Although the outside temperature was 15oC, the
CFD analysis predicted similar internal air temperature
as with the previous cases, Taverage=21.9oC, due to the
higher volume of outside air that entered the classroom.
Similar to previous cases, the higher predicted air
velocities were close to the windows and closer to the
floor. Nevertheless, the predicted air velocity within the
occupied zone was below 0.2m/s.
In addition, the CFD model was used to assess the
performance of single-sided naturally ventilated
classrooms under wind-driven forces. All the scenarios
were investigated under constant external temperature
with variable wind speed and the wind direction was
always normal to the openings. The different wind speed
captured cases with extreme outside conditions as well
as with values close to the average wind speeds in the
UK.
Table 5 compares the predicted provision of outside air
as well as the average internal air temperature and
velocity at different heights for the wind-driven natural
ventilation scenarios. In all cases, the analysis revealed
ventilation flow rates well above the optimum value of
8l/s/p. Due to higher pressure difference at the windows
caused by the wind, the opening angle of the windows
had to be smaller compared to the buoyancy cases in
order to eliminate discomfort conditions in the occupied
zone due to high internal air velocities.
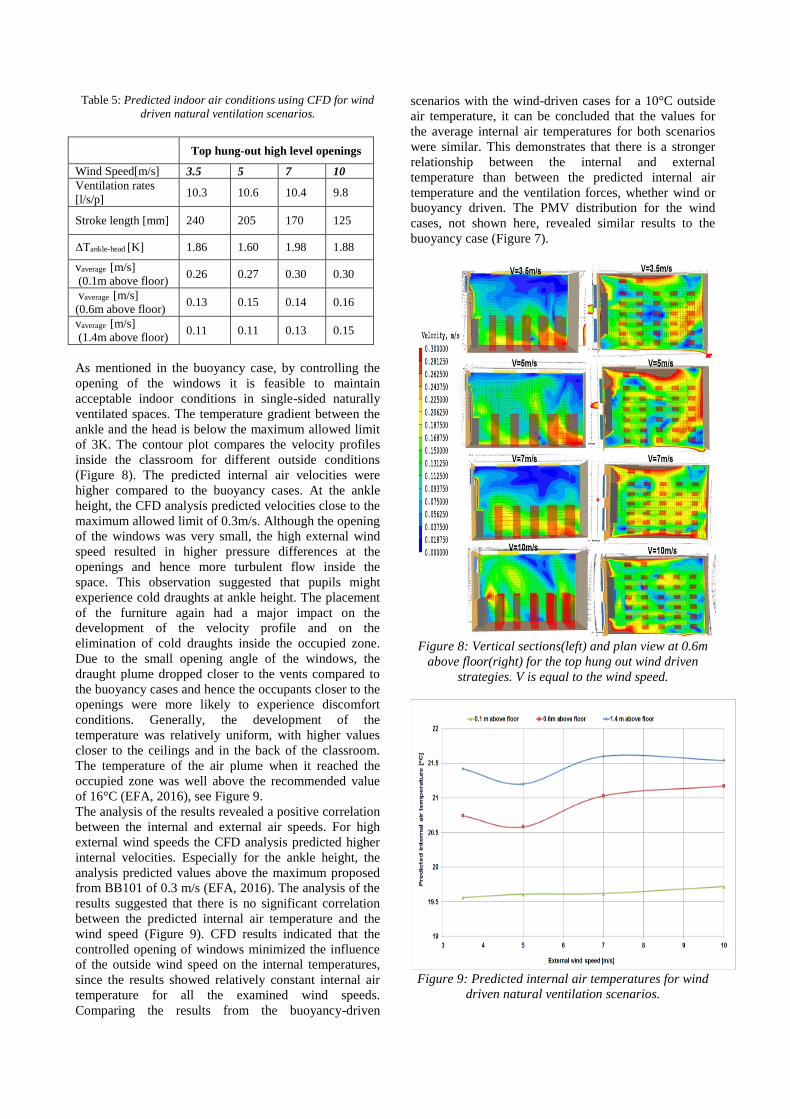
Table 5: Predicted indoor air conditions using CFD for wind
driven natural ventilation scenarios.
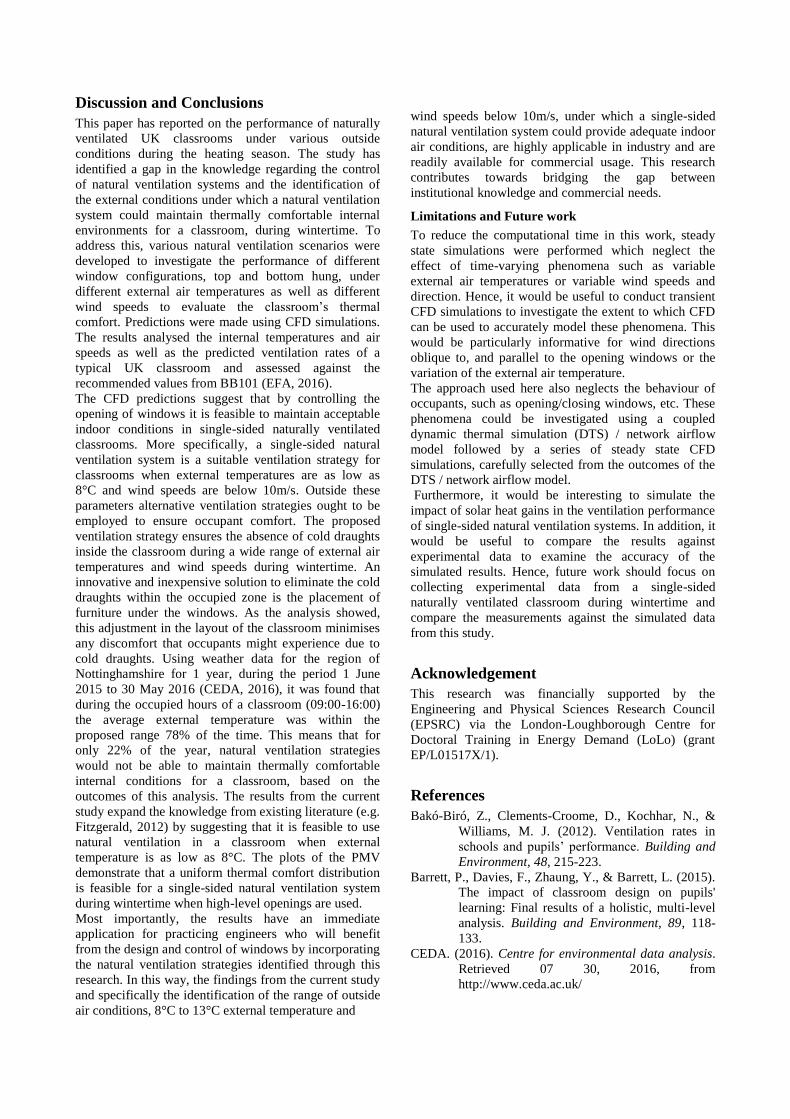
As mentioned in the buoyancy case, by controlling the
opening of the windows it is feasible to maintain
acceptable indoor conditions in single-sided naturally
ventilated spaces. The temperature gradient between the
ankle and the head is below the maximum allowed limit
of 3K. The contour plot compares the velocity profiles
inside the classroom for different outside conditions
(Figure 8). The predicted internal air velocities were
higher compared to the buoyancy cases. At the ankle
height, the CFD analysis predicted velocities close to the
maximum allowed limit of 0.3m/s. Although the opening
of the windows was very small, the high external wind
speed resulted in higher pressure differences at the
openings and hence more turbulent flow inside the
space. This observation suggested that pupils might
experience cold draughts at ankle height. The placement
of the furniture again had a major impact on the
development of the velocity profile and on the
elimination of cold draughts inside the occupied zone.
Due to the small opening angle of the windows, the
draught plume dropped closer to the vents compared to
the buoyancy cases and hence the occupants closer to the
openings were more likely to experience discomfort
conditions. Generally, the development of the
temperature was relatively uniform, with higher values
closer to the ceilings and in the back of the classroom.
The temperature of the air plume when it reached the
occupied zone was well above the recommended value
of 16°C (EFA, 2016), see Figure 9.
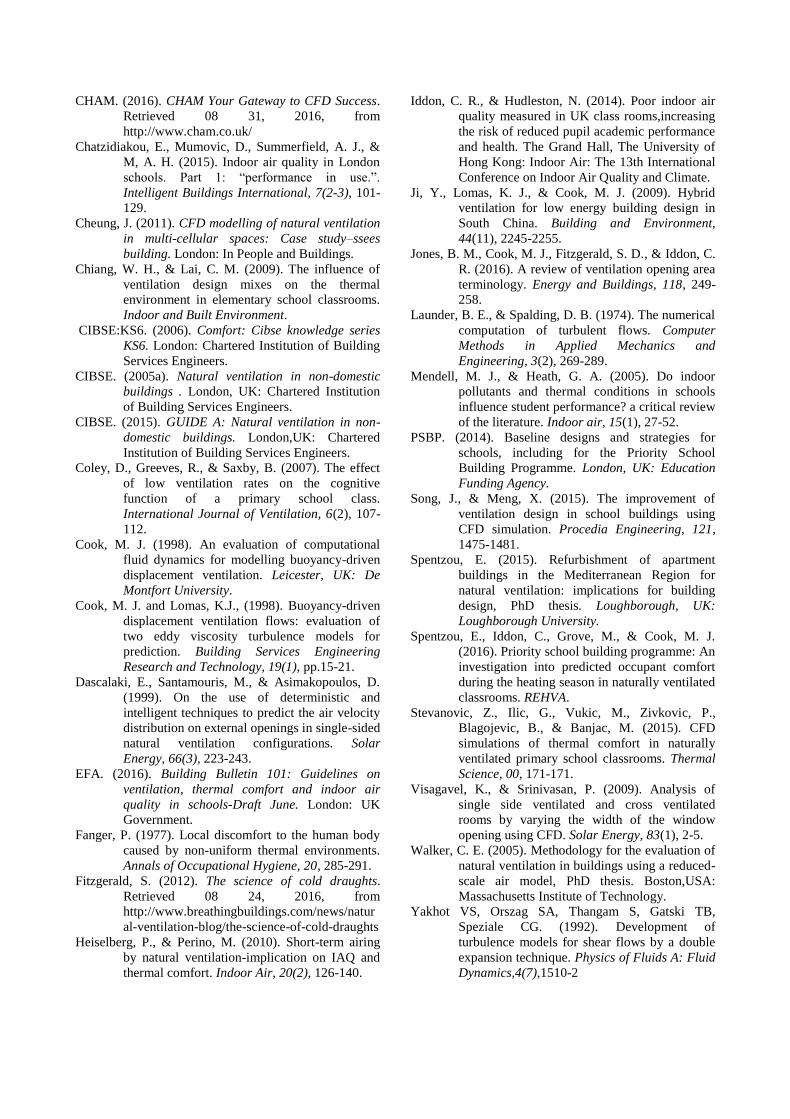
The analysis of the results revealed a positive correlation
between the internal and external air speeds. For high
external wind speeds the CFD analysis predicted higher
internal velocities. Especially for the ankle height, the
analysis predicted values above the maximum proposed
from BB101 of 0.3 m/s (EFA, 2016). The analysis of the
results suggested that there is no significant correlation
between the predicted internal air temperature and the
wind speed (Figure 9). CFD results indicated that the
controlled opening of windows minimized the influence
of the outside wind speed on the internal temperatures,
since the results showed relatively constant internal air
temperature for all the examined wind speeds.
Comparing the results from the buoyancy-driven
scenarios with the wind-driven cases for a 10°C outside
air temperature, it can be concluded that the values for
the average internal air temperatures for both scenarios
were similar. This demonstrates that there is a stronger
relationship between the internal and external
temperature than between the predicted internal air
temperature and the ventilation forces, whether wind or
buoyancy driven. The PMV distribution for the wind
cases, not shown here, revealed similar results to the
buoyancy case (Figure 7).
Figure 8: Vertical sections(left) and plan view at 0.6m
above floor(right) for the top hung out wind driven
strategies. V is equal to the wind speed.
Figure 9: Predicted internal air temperatures for wind
driven natural ventilation scenarios.
Top hung-out high level openings
Wind Speed[m/s] 3.5 5 7 10
Ventilation rates
[l/s/p] 10.3 10.6 10.4 9.8
Stroke length [mm] 240 205 170 125
ΔTankle-head [K] 1.86 1.60 1.98 1.88
vaverage [m/s]
(0.1m above floor) 0.26 0.27 0.30 0.30
vaverage [m/s]
(0.6m above floor) 0.13 0.15 0.14 0.16
vaverage [m/s]
(1.4m above floor) 0.11 0.11 0.13 0.15
Discussion and Conclusions
This paper has reported on the performance of naturally
ventilated UK classrooms under various outside
conditions during the heating season. The study has
identified a gap in the knowledge regarding the control
of natural ventilation systems and the identification of
the external conditions under which a natural ventilation
system could maintain thermally comfortable internal
environments for a classroom, during wintertime. To
address this, various natural ventilation scenarios were
developed to investigate the performance of different
window configurations, top and bottom hung, under
different external air temperatures as well as different
wind speeds to evaluate the classroom’s thermal
comfort. Predictions were made using CFD simulations.
The results analysed the internal temperatures and air
speeds as well as the predicted ventilation rates of a
typical UK classroom and assessed against the
recommended values from BB101 (EFA, 2016).
The CFD predictions suggest that by controlling the
opening of windows it is feasible to maintain acceptable
indoor conditions in single-sided naturally ventilated
classrooms. More specifically, a single-sided natural
ventilation system is a suitable ventilation strategy for
classrooms when external temperatures are as low as
8°C and wind speeds are below 10m/s. Outside these
parameters alternative ventilation strategies ought to be
employed to ensure occupant comfort. The proposed
ventilation strategy ensures the absence of cold draughts
inside the classroom during a wide range of external air
temperatures and wind speeds during wintertime. An
innovative and inexpensive solution to eliminate the cold
draughts within the occupied zone is the placement of
furniture under the windows. As the analysis showed,
this adjustment in the layout of the classroom minimises
any discomfort that occupants might experience due to
cold draughts. Using weather data for the region of
Nottinghamshire for 1 year, during the period 1 June
2015 to 30 May 2016 (CEDA, 2016), it was found that
during the occupied hours of a classroom (09:00-16:00)
the average external temperature was within the
proposed range 78% of the time. This means that for
only 22% of the year, natural ventilation strategies
would not be able to maintain thermally comfortable
internal conditions for a classroom, based on the
outcomes of this analysis. The results from the current
study expand the knowledge from existing literature (e.g.
Fitzgerald, 2012) by suggesting that it is feasible to use
natural ventilation in a classroom when external
temperature is as low as 8°C. The plots of the PMV
demonstrate that a uniform thermal comfort distribution
is feasible for a single-sided natural ventilation system
during wintertime when high-level openings are used.
Most importantly, the results have an immediate
application for practicing engineers who will benefit
from the design and control of windows by incorporating
the natural ventilation strategies identified through this
research. In this way, the findings from the current study
and specifically the identification of the range of outside
air conditions, 8°C to 13°C external temperature and
wind speeds below 10m/s, under which a single-sided
natural ventilation system could provide adequate indoor
air conditions, are highly applicable in industry and are
readily available for commercial usage. This research
contributes towards bridging the gap between
institutional knowledge and commercial needs.
Limitations and Future work
To reduce the computational time in this work, steady
state simulations were performed which neglect the
effect of time-varying phenomena such as variable
external air temperatures or variable wind speeds and
direction. Hence, it would be useful to conduct transient
CFD simulations to investigate the extent to which CFD
can be used to accurately model these phenomena. This
would be particularly informative for wind directions
oblique to, and parallel to the opening windows or the
variation of the external air temperature.
The approach used here also neglects the behaviour of
occupants, such as opening/closing windows, etc. These
phenomena could be investigated using a coupled
dynamic thermal simulation (DTS) / network airflow
model followed by a series of steady state CFD
simulations, carefully selected from the outcomes of the
DTS / network airflow model.
Furthermore, it would be interesting to simulate the
impact of solar heat gains in the ventilation performance
of single-sided natural ventilation systems. In addition, it
would be useful to compare the results against
experimental data to examine the accuracy of the
simulated results. Hence, future work should focus on
collecting experimental data from a single-sided
naturally ventilated classroom during wintertime and
compare the measurements against the simulated data
from this study.
Acknowledgement
This research was financially supported by the
Engineering and Physical Sciences Research Council
(EPSRC) via the London-Loughborough Centre for
Doctoral Training in Energy Demand (LoLo) (grant
EP/L01517X/1).
References
Bakó-Biró, Z., Clements-Croome, D., Kochhar, N., &
Williams, M. J. (2012). Ventilation rates in
schools and pupils’ performance. Building and
Environment, 48, 215-223.
Barrett, P., Davies, F., Zhaung, Y., & Barrett, L. (2015).
The impact of classroom design on pupils'
learning: Final results of a holistic, multi-level
analysis. Building and Environment, 89, 118-
133.
CEDA. (2016). Centre for environmental data analysis.
Retrieved 07 30, 2016, from
http://www.ceda.ac.uk/
CHAM. (2016). CHAM Your Gateway to CFD Success.
Retrieved 08 31, 2016, from
http://www.cham.co.uk/
Chatzidiakou, E., Mumovic, D., Summerfield, A. J., &
M, A. H. (2015). Indoor air quality in London
schools. Part 1: “performance in use.”.
Intelligent Buildings International, 7(2-3), 101-
129.
Cheung, J. (2011). CFD modelling of natural ventilation
in multi-cellular spaces: Case study–ssees
building. London: In People and Buildings.
Chiang, W. H., & Lai, C. M. (2009). The influence of
ventilation design mixes on the thermal
environment in elementary school classrooms.
Indoor and Built Environment.
CIBSE:KS6. (2006). Comfort: Cibse knowledge series
KS6. London: Chartered Institution of Building
Services Engineers.
CIBSE. (2005a). Natural ventilation in non-domestic
buildings . London, UK: Chartered Institution
of Building Services Engineers.
CIBSE. (2015). GUIDE A: Natural ventilation in non-
domestic buildings. London,UK: Chartered
Institution of Building Services Engineers.
Coley, D., Greeves, R., & Saxby, B. (2007). The effect
of low ventilation rates on the cognitive
function of a primary school class.
International Journal of Ventilation, 6(2), 107-
112.
Cook, M. J. (1998). An evaluation of computational
fluid dynamics for modelling buoyancy-driven
displacement ventilation. Leicester, UK: De
Montfort University.
Cook, M. J. and Lomas, K.J., (1998). Buoyancy-driven
displacement ventilation flows: evaluation of
two eddy viscosity turbulence models for
prediction. Building Services Engineering
Research and Technology, 19(1), pp.15-21.
Dascalaki, E., Santamouris, M., & Asimakopoulos, D.
(1999). On the use of deterministic and
intelligent techniques to predict the air velocity
distribution on external openings in single-sided
natural ventilation configurations. Solar
Energy, 66(3), 223-243.
EFA. (2016). Building Bulletin 101: Guidelines on
ventilation, thermal comfort and indoor air
quality in schools-Draft June. London: UK
Government.
Fanger, P. (1977). Local discomfort to the human body
caused by non-uniform thermal environments.
Annals of Occupational Hygiene, 20, 285-291.
Fitzgerald, S. (2012). The science of cold draughts.
Retrieved 08 24, 2016, from
http://www.breathingbuildings.com/news/natur
al-ventilation-blog/the-science-of-cold-draughts
Heiselberg, P., & Perino, M. (2010). Short-term airing
by natural ventilation-implication on IAQ and
thermal comfort. Indoor Air, 20(2), 126-140.
Iddon, C. R., & Hudleston, N. (2014). Poor indoor air
quality measured in UK class rooms,increasing
the risk of reduced pupil academic performance
and health. The Grand Hall, The University of
Hong Kong: Indoor Air: The 13th International
Conference on Indoor Air Quality and Climate.
Ji, Y., Lomas, K. J., & Cook, M. J. (2009). Hybrid
ventilation for low energy building design in
South China. Building and Environment,
44(11), 2245-2255.
Jones, B. M., Cook, M. J., Fitzgerald, S. D., & Iddon, C.
R. (2016). A review of ventilation opening area
terminology. Energy and Buildings, 118, 249-
258.
Launder, B. E., & Spalding, D. B. (1974). The numerical
computation of turbulent flows. Computer
Methods in Applied Mechanics and
Engineering, 3(2), 269-289.
Mendell, M. J., & Heath, G. A. (2005). Do indoor
pollutants and thermal conditions in schools
influence student performance? a critical review
of the literature. Indoor air, 15(1), 27-52.
PSBP. (2014). Baseline designs and strategies for
schools, including for the Priority School
Building Programme. London, UK: Education
Funding Agency.
Song, J., & Meng, X. (2015). The improvement of
ventilation design in school buildings using
CFD simulation. Procedia Engineering, 121,
1475-1481.
Spentzou, E. (2015). Refurbishment of apartment
buildings in the Mediterranean Region for
natural ventilation: implications for building
design, PhD thesis. Loughborough, UK:
Loughborough University.
Spentzou, E., Iddon, C., Grove, M., & Cook, M. J.
(2016). Priority school building programme: An
investigation into predicted occupant comfort
during the heating season in naturally ventilated
classrooms. REHVA.
Stevanovic, Z., Ilic, G., Vukic, M., Zivkovic, P.,
Blagojevic, B., & Banjac, M. (2015). CFD
simulations of thermal comfort in naturally
ventilated primary school classrooms. Thermal
Science, 00, 171-171.
Visagavel, K., & Srinivasan, P. (2009). Analysis of
single side ventilated and cross ventilated
rooms by varying the width of the window
opening using CFD. Solar Energy, 83(1), 2-5.
Walker, C. E. (2005). Methodology for the evaluation of
natural ventilation in buildings using a reduced-
scale air model, PhD thesis. Boston,USA:
Massachusetts Institute of Technology.
Yakhot VS, Orszag SA, Thangam S, Gatski TB,
Speziale CG. (1992). Development of
turbulence models for shear flows by a double
expansion technique. Physics of Fluids A: Fluid
Dynamics,4(7),1510-2