Embed Size (px)
Citation preview

Cost-Effective Strategies and
Emerging Federal and State Regulations forMercury Emissions from Coal-Fired Power Plants
Praveen Amar, Ph.D., P.E.
Director, Science and PolicyNortheast States for Coordinated Air Use Management (NESCAUM)
Western Regional Air Partnership Board Meeting
December 14-15, 2005
Palm Springs, California

Overview
What does NESCAUM do? Public health and environmental impacts of
mercury: “monetized” benefits of mercury reductions from coal-fired electricity generating units (EGUs)
Control technologies and strategies for EGUs Federal and state regulations for EGUs

Who we are
Our Members include:– Connecticut– Massachusetts– Maine– New Hampshire– New Jersey– New York– Rhode Island– Vermont

Economic Valuation of Human Health Benefits of Controlling Mercury Emissions
from U.S. Coal-Fired Power Plants
February 2005 Report
Work undertaken by the Harvard Center for Risk Analysis,Dr. James Hammitt and Glenn Rice, and by NESCAUM, Dr. Praveen Amar

Overview of NESCAUM Report
The report covers diverse areas of policy-relevant research including:– Mercury emissions (including changes from coal
plants), atmospheric transport and fate, modeling of Hg deposition
– Relationship between Hg deposition and methylmercury levels in fish, current and future exposures in humans to mercury in fish
– Dose response functions, and finally, monetization of benefits

What did this Report Monetize?
Monetized two end points:– IQ of children born to mothers with high blood-Hg
levels– Myocardial infarction and premature mortality
among adults

8 Regions
Other Marine
Average Methylmercury Concentrations for"Top 24" Types of Fish Consumed in the U.S. Commercial Seafood Market
0
0.2
0.4
0.6
0.8
1
1.2
Fish Type
Me
thy
lme
rcu
ry C
on
ce
ntr
ati
on
(p
pm
)

For "Top 24" Types of Fish in U.S. Commercial Seafood Market, the Percentage of Methylmercury Contributed by Fish Type

Spectrum of Health Effect Certainty
Persistent IQ deficitsfrom fetal
exposures above MeHg RfD
Persistent IQ deficits in all children from fetal MeHg exposures
Cardiovascular effects and premature mortality in male consumers of non -fatty freshwater fish with high MeHg levels
Cardiovascular effects and premature mortality in male fish consumers
Cardiovascular effects and premature mortality in all fish consumers
Decreasing Certainty
Increasing Benefit
Scenario 1 $75M $194M $48M $1.5B $3.3B(26 TPY)
Scenario 2 $119M $288M $86M $2.3B $4.9B (18 TPY)
Spectrum of Certainty of Causal Association of Health Effect with Mercury Exposure with Estimated Benefit Overlay
In Millions ($M) and Billions ($B) of Dollars (2000$)

Value of Monetized Benefits for about 70 percent control
Annual benefits: 200 to 300 million dollars for IQ gain
Annual benefits: 3 to 5 billion dollars for avoided fatal and non fatal heart attacks among adults

Coal-Fired Power Plants
There are about 530 power plants with 305 gigawatts of capacity. The capacity consists of about 1,300 units, 1,150 of which are >25 megawatt.
Coal plants generate the vast majority of power sector emissions:
– 100% of Hg– 95% of SO2– 90% of NOX

Regulatory Drivers
Environmental Regulation and Technology Innovation (NESCAUM’s September 2000 Report)
State Rules (strong drivers)– NJ, CT, MA, NH(?), WI and others
Consent Decrees– We Energies, Xcel, PSNM, Dynegy
EPA’s Clean Air Interstate Rule (CAIR), Clean Air Mercury Rule (CAMR): weak drivers for mercury
– 2010 Phase I cap of 38 TPY (about 20 percent reduction)– 2018 Phase II cap of 15 TPY (70% reduction; not achieved till 2025 and
beyond because of trading) – States have leeway to adopt EPA’s CAMR or propose a more-stringent
approach


Control Technologies and Strategies: Coal-Fired EGUs:
Feasibility and Costs

Native or Baseline Mercury Capture
Mercury emissions vary with:– Coal type and mercury content – Trace species present in coal/flue gas– Form of mercury in the flue gas– Unburned carbon (Loss on Ignition, LOI)– Unit configuration– Control devices (FF, SCR, FGD, SDA) and
operating temperatures

Controls BituminousPM Only
CS-ESP 46%HS-ESP 12%FF 83%PM Scrubber 14%
Dry FGDSDA + ESPSDA + FF 98%
Wet FGDCS-ESP+Wet FGD 81%HS-ESP+Wet FGD 55%FF+Wet FGD 96%
Subbituminous
16%13%72%0%
38%25%
35%33%
Native Hg Capture with Existing Control Equipment( 1999 ICR Data)

Power Plant Mercury Control Options

Site Coal Equipment
1. Gaston 1 month Low-S Bit FF2. Pleasant Prairie PRB C-ESP3. Brayton Point Low-S Bit C-ESP4. Abbott High-S Bit C-ESP/FGD5. Salem Harbor Low-S SA Bit C-ESP6. Stanton 10ND Lignite SDA/FF7. Laskin ND Lignite Wet P Scrbr8. Coal CreekND Lignite C-ESP9. Gaston 1 year Low-S Bit FF10. Holcomb PRB SDA/FF11. Stanton 10 ND Lignite SDA/FF12. Yates 1 Low-S Bit ESP13. Yates 2 Low-S Bit ESP/FGD 14. Leland OldsND Lignite C-ESP15. Meramec PRB C-ESP16. Brayton Point Low-S Bit C-ESP(Source: ADA-ES)
Full-Scale Tests of Sorbent Injection Completed: 2001-2004

Site Coal Equipment1-6 Commercial Tests Low-S Bit ESP
7. Laramie River PRB SDA/ESP
8. Conesville High-S Bit ESP/FGD
9. DTE Monroe PRB/Bit ESP
10. Antelope Valley ND Lignite SDA/FF
11. Stanton 1 ND Lignite C-ESP
12. Council Bluffs 2 PRB H-ESP
13. Louisa PRB H-ESP
14. Independence PRB C-ESP
15. Gavin High-S Bit C-ESP FGD
16. Presque Isle PRB HS-ESP TOXECO
(Source: ADA-ES)
Full-Scale Tests of Sorbent InjectionScheduled: 2005-2006

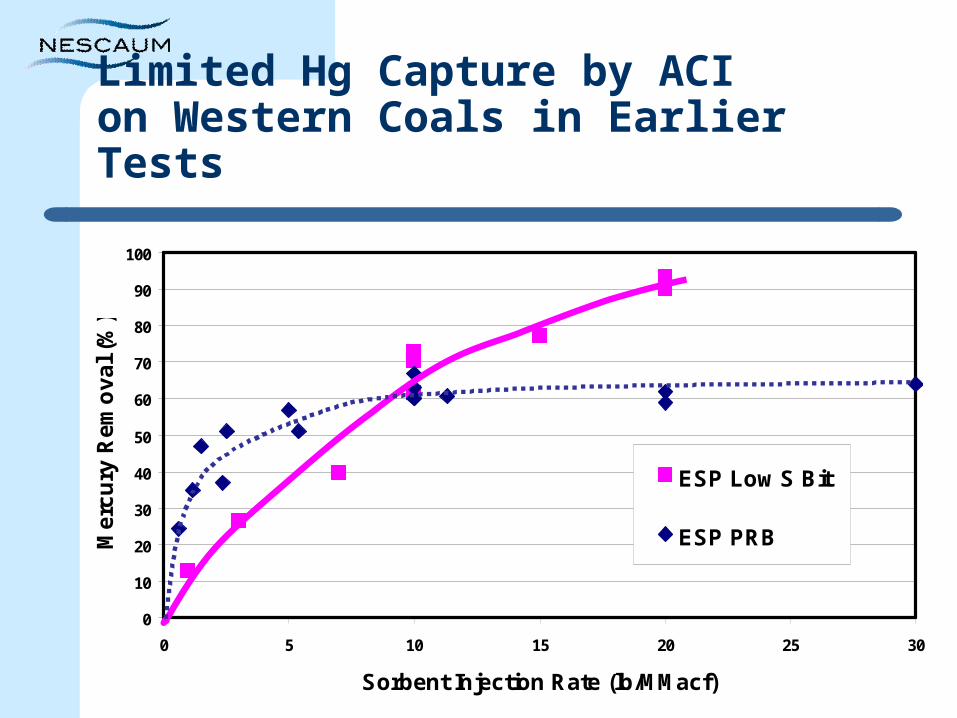
Limited Hg Capture by ACI on Western Coals in Earlier Tests
0
10
20
30
40
50
60
70
80
90
100
0 5 10 15 20 25 30
Sorbent Injection Rate (lb/MMacf)
Me
rcu
ry R
em
ov
al
(%)
ESP Low S Bit
ESP PRB

Enhancing Mercury Removal for Western Coals
Sorbent Injection
Cl, Br, F, I
Cl, Br, F, I
Cl, Br, F, I
Ash and Sorbent
ESP or FF
HgCEM

Enhancing Mercury Removal on Units with only an ESP Burning PRB Coal
0
10
20
30
40
50
60
70
80
90
100
0 5 10 15Sorbent Injection Rate (lb/MMacf)
Hg
Rem
ova
l E
ffic
ien
cy (
%)
DARCO Hg
DARCO Hg-LH
Injection Concentration (lb/MMacf)
KNX + DARCO HgAmeren Meramec

Improved Mercury Capture with Coal Blending: Holcomb
0
10
20
30
40
50
60
70
80
90
0 5 10 15 20
Percent Western Bituminous Coal
Hg
Re
mo
va
l (%
)

Sorbent Cost Comparison
0
10
20
30
40
50
60
70
80
90
100
0 0.5 1 1.5 2 2.5 3 3.5 4
Sorbent Costs (mills/kWh)
% H
g R
em
ov
al
SDA + FF PRB, DARCO Hg-LH
Holcomb: ~ $1950/lb Hg removedMeramec: ~ $6200/lb Hg removed
ESP, HS Bit, DARCO Hg
ESP PRB, DARCO Hg-LH
ESP PRB/Bit, DARCO Hg
ESP Bit, DARCO Hg

1 to 2 mills/kwhSCR for NOx control
3 to 5 mills/kwhFGD for SO2
0.2 to 0.8 mills/kwhActivated Carbon Injection
for Hg
Annual Levelized Cost Control Type
A Comparative Estimate of Hg Control Costs with ACI (mills/kWh)

Regulatory Landscape: State and Federal Mercury
Regulations, Rules, Legislation

Mercury Policy Context in the Northeast
New England Governors/Eastern Canadian Premiers’ Regional Mercury Action Plan (1998)– 50% reduction by 2003– 75% reduction by 2010– Virtual elimination of anthropogenic discharges of
mercury is long-term goal

Examples of State Actions
State Program
Connecticut 90% control by 2008 (state law)
Massachusetts 85% reduction in Hg emissions by 2008 and 95% by 2012 (state rule)
Wisconsin 40% reduction in Hg emissions by 2010 and 75% by 2015 (approved plan)
New Jersey 90% reduction or 3 mg/MWhr by 2008; 5-yr extension with multi-pollutant controls for SO2, NOx, and PM
North Carolina 55% reduction in Hg emissions by 2013 expected; recommendations for additional reductions (NC Clean Smokestacks Act)
New Hampshire 58% reduction in Hg emissions (cap of 50 lbs/year) 1 year after federal compliance dates; 80% reduction (cap of 24 lbs/year) 4 years later (departmental recommendations to legislature)
New England Governors & Eastern Canadian Premiers
50% reduction in Hg by 2003; 75% reduction by 2010; virtual elimination of anthropogenic discharges long term (Mercury Action Plan)

States Taking Action (continued)
State and local agencies setting mercury limits for new construction (sorbent injection):– Wisconsin – permitting a facility using sub
bituminous coal – 83% reduction– Iowa – issued a permit for facility using sub
bituminous coal – limit equivalent to 83% reduction

Smart Regulatory Drivers’ Components
Long-term averaging (annual) Dual limit: less stringent of:
– Removal efficiency or– Emission limit (output based, lb of Hg/MWhr)
Flexibility in achieving mercury removal– Averaging of units at a site – Enhances cost effectiveness

The STAPPA/ALAPCO MODEL RULE
How States Can Provide Better Protection from Mercury Effects on Health and Welfare

Goals of Model Rule
Policy Objectives: – Protect public health and welfare – Reduce Coal-Fired EGU emissions Hg to <7
tons/year– Provide flexibility to reduce cost– Spur rapid technological development
Goals of Model Rule
Improve on EPA proposal Treat EGU Hg as a HAP
– Expeditious application of Maximum Achievable Control Technology
– Substantial reductions in Hg emissions in 2008; 90-95% reductions in 2012
– No emission trading

Architecture of the Model Rule
Applicable to Coal-Fired EGUs Addresses only Hg Two Options All new EGUs must achieve
– 90-95% capture; or– Outlet standard of 0.0025-0.0060 lb/GWh

Existing EGUs - Option I
Phase 1 - end 2008– 80 per cent capture; or– Outlet standard 0.010 lb/GWh– Emissions averaging allowed among owned or
operated EGUs w/in state

Existing EGUs - Option I
Phase 2 - End 2012– 90-95% capture; or– Outlet standard 0.0060-0.0025 lb/GWh– Compliance on plant basis

Existing EGUs - Option II
Phase 1 – end 2008– 90-95% capture; or– Outlet standard 0.006-0.0025 lb/GWh– May postpone 50% EGUs 4 years if agree to:
Meet multi-pollutant standards 2012 Prevent Hg emission increases in interim

Existing EGUs – Option II
Phase 2 – end 2012, meet multipollutant standards: – SO2: 95% reduction or 0.10-0.15 lb/mmBtu– NOx: 0.07-0.10 lb/mmBtu– PM: 0.0150-0.0300 lb/mmBtu– Hg:
90-95% capture; or Outlet standard of 0.0025-0.0060 lb/GWh

How Can a State Adopt the Model Rule?
EPA rule not national MACT standard under section 112 of CAA
EPA rule under section 111(d) of CAA– “SIP-like” process required– Cap and trade regime optional– Emissions must meet EPA cap for State
Model Rule reductions will exceed what EPA requires

Some Final Observations
Many states in the U.S. are moving at a faster and a more certain pace than the CAMR, based on the assumption that environmental regulation drives technology innovation and implementation
Hg Control technologies are now commercially available; new technologies are rapidly emerging; 90% and higher control is feasible
Cost effectiveness of Hg control is quite comparable to, and more attractive than, the cost effectiveness of SO2 and NOx controls from power plants (Hg:SO2:NOx: 0.2 to 0.8 mills/kwhr: 3-5 mills/kwhr: 1-2 mills/kwhr)