Embed Size (px)
Citation preview

CWB 2019 Second Quarter Report 1
CWB reports second quarter financial performance and continued strategic execution
Strong 10% annual loan growth and higher net interest margin compared to last year and the prior quarter
Branch-raised deposit growth of 6% from last year and 3% from the prior quarter
Total revenue up 7% compared to last year, with pre-tax, pre-provision income up 4%
“CWB closed the first half of the year with a solid second quarter as we continue to execute against our Balanced Growth strategy,” said Chris Fowler, President and CEO. “Double-digit year-over-year loan growth delivered continued geographic and industry diversification, with 14% growth in Central and Eastern Canada as well as within the strategically targeted general commercial lending category. We also continue to execute on key strategic objectives to diversify funding sources. Sequential growth of branch-raised deposits accelerated to 3%, and we delivered higher net interest margin compared to both last year and last quarter.”
“Our Balanced Growth strategy will transform CWB’s client experience and broaden our relationships with successful business owners across the country. Focused business transformation and ongoing investment in core technology continues to drive development of our differentiated full-service offering, with increasingly focused branch-based operations driven through our centralization of credit support processes. Together, we expect these improvements to enable strong growth by supporting our teams to deliver on CWB’s reputation for proactive, personalized service in a highly scalable manner. We are also very excited to bring more awareness to our story with the launch of our refreshed brand and a new approach to marketing beginning in the third quarter. This represents a key step forward as we seek to be recognized as a disruptive force in Canadian banking, providing a clear alternative for successful business owners across the country.”
Second Quarter 2019 Highlights(1)(2) (compared to the same period in the prior year)
Common shareholders’ net income of $62 million, up 2%, pre-tax, pre-provision income of $112 million, up 4%, and total revenue of $210 million, up 7%.
Diluted and adjusted cash earnings per common share of $0.71 and $0.74, up 4% and 1%, respectively. Operating leverage of negative 3.1%, partially reflecting higher acquisition-related revenue in the second
quarter last year and increased investment in the current period to advance our strategic direction. Strong 10% loan growth drove total assets over the $30 billion milestone for the first time in CWB’s history. Loan growth reflected continued execution of CWB’s Balanced Growth strategy, including very strong 14%
growth in general commercial loans and expansion in every province, with the strongest growth rates in Central and Eastern Canada.
Net interest margin of 2.63%, up two basis points from last year and last quarter. Provision for credit losses represented 23 basis points of average loans, compared to 20 basis points last
year and 24 basis points last quarter. Gross impaired loans represented 0.62% of gross loans, up from 0.49% last year and 0.51% last quarter,
with the increase largely reflecting one impairment within the general commercial category in Saskatchewan. Strong Basel III regulatory capital ratios under the Standardized approach for calculating risk-weighted
assets of 9.1% common equity Tier 1 (CET1), 10.7% Tier 1 and 11.9% Total capital.
(1) Highlights include certain non-IFRS measures – refer to definitions and detail provided on page 22 of the 2019 Second Quarter Report to Shareholders.
(2) Effective November 1, 2018, CWB adopted IFRS 9 Financial Instruments (IFRS 9). Amounts for the periods ended April 30, 2019 and January
31, 2019 have been prepared in accordance with IFRS 9 (refer to Notes 2 and 3 of the interim consolidated financial statements). Prior periods
comparatives have been prepared in accordance with IAS 39 Financial Instruments: Classification and Measurement (IAS 39) and have not
been restated.
This news release and accompanying financial highlights are supplementary to CWB’s 2019 Second Quarter Report to Shareholders and the 2018 Annual Report and should be read in conjunction with those documents.

CWB 2019 Second Quarter Report 2
Edmonton, May 29, 2019 – CWB Financial Group (TSX: CWB) (CWB) today announced second quarter financial performance with common shareholders’ net income of $62 million and pre-tax, pre-provision income of $112 million, up 2% and 4%, respectively, from the second quarter last year. Total revenue of $210 million was up 7%, including a 7% increase in net interest income. Higher net interest income reflects the combined benefits of strong 10% loan growth and a two basis point increase in net interest margin to 2.63%. Non-interest income was relatively unchanged. Higher revenues were partially offset within common shareholders’ net income by increases in non-interest expenses and the provision for credit losses. Acquisition-related fair value changes decreased 43%, reflecting conclusion one month into the quarter of the three-year earn-out period for the contingent consideration related to the CWB Maxium acquisition. The provision for credit losses represented 23 basis points of average loans, compared to 20 basis points last year. Diluted and adjusted cash earnings per common share of $0.71 and $0.74 were up 4% and 1%, respectively.
Compared to the prior quarter, common shareholders’ net income and pre-tax, pre-provision income were 7% and 5% lower, respectively, with total revenue and net interest income both down 1%. Within net interest income, the benefits of 2% loan growth and a two basis point increase in net interest margin were more than offset by the impact of three fewer interest-earning days. Non-interest income was down 2%. The provision for credit losses as a percentage of average loans improved one basis point to 23 basis points. Non-interest expenses were 4% higher sequentially, while acquisition-related fair value changes decreased 41% reflecting the same factor noted above. Diluted and adjusted cash earnings per common share were down 5% and 8%, respectively.
Year-to-date common shareholders’ net income of $128 million and pre-tax, pre-provision income of $230 million were up 5% and 7%, respectively. Strong earnings growth reflects an 8% increase in total revenue, including 10% growth of net interest income partially offset by a 7% decrease in non-interest income. Higher net interest income was driven by 10% loan growth and a five basis point increase in net interest margin. Non-interest income was down 7%, primarily due to the impact of approximately $3 million of gains realized from the CWT strategic transactions recorded within ‘other’ non-interest income in the first quarter last year. The year-to-date provision for credit losses of 24 basis points as a percentage of average loans was up from 19 basis points last year. Non-interest expenses were 9% higher, while acquisition-related fair value changes were 22% lower reflecting the same factor noted above. Diluted and adjusted cash earnings per common share of $1.46 and $1.55 were up 7% and 5%, respectively.
Execution of CWB Financial Group’s Balanced Growth strategy
Balanced Growth Objective Strategic Execution
Full-service client growth with a focus on business owners, including further geographic and industry diversification
10% loan growth compared to last year, including 14% growth in Central and Eastern Canada.
Proportion of loan portfolio in Central and Eastern Canada of 27% up 1% from last year.
Increased business diversification with 14% annual growth of general commercial loans.
Growth and diversification of funding sources
Branch-raised deposits growth of 6% from last year, including very strong 11% growth of term deposits and 4% growth of demand and notice deposits.
Optimized capital management through transition to the Advanced Internal Ratings Based Approach (AIRB)
Expect to submit final application and receive regulatory approval in fiscal 2020 for transition to the AIRB approach.
Balanced growth of assets and funding sources
Total assets were up 7% from last year, surpassing the $30 billion milestone for the first time in CWB’s history. Total loans, excluding allowance for credit losses, of $27.4 billion increased 10% from last year, 2% from the prior quarter and 4% from October 31, 2018. Year-over-year loan growth was consistent with CWB’s Balanced Growth strategy, including strong growth of 14% in Central and Eastern Canada, as well as 14% growth in general commercial loans across CWB’s targeted markets. Central and Eastern Canada accounted for 38% of CWB’s lending growth and now comprise 27% of CWB’s total loan portfolio, up from 26% last year. Growth in British Columbia and Alberta was strong at 9% and 8%, respectively. British Columbia represents 33%, and Alberta comprises 32% of the total portfolio. We also continue to execute on key strategic objectives to grow and diversify core funding sources. Total deposits increased 8% from April 30, 2018. Branch-raised deposits were up 6% on an annual basis, driven by very strong 3% sequential growth of demand and notice deposits. Funding from capital markets was 11% higher than the same quarter last year, and the proportion of our deposits raised through the broker market remained unchanged at 36% of total deposits.

CWB 2019 Second Quarter Report 3
Ongoing business transformation initiatives to enhance CWB’s client experience and support development of full-service client relationships
Focused business transformation and ongoing investment in core technology continue to drive development of our differentiated full-service client experience, supported through more efficient processes. Initiatives to optimize client-facing operations within banking branches continue, building upon our prior centralization of credit support processes. Together, we expect these improvements to drive strong growth by supporting teams to deliver on CWB’s reputation for proactive, personalized service in a highly scalable manner. We also expect these initiatives to contribute to CWB’s operational efficiency and support capital and risk management through enhanced data integrity and analytics capabilities.
Going forward, we will bring more awareness to our story with the launch of a refreshed brand and a new marketing approach beginning in the third quarter. This represents a key step forward as CWB seeks to be recognized as a disruptive force in Canadian banking, and a clear alternative to meet the financial needs of successful business owners across the country.
Credit quality
Strong overall credit quality continues to reflect CWB’s secured lending business model, disciplined underwriting practices and proactive loan management. The dollar level of gross impaired loans in the second quarter totaled $168 million, compared to $123 million last year and $136 million in the prior quarter. This level of gross impaired loans represented 0.62% of gross loans at quarter-end, compared to 0.49% last year and 0.51% in the previous quarter. The sequential increase in gross impaired loans largely resulted from one impairment within the general commercial category in Saskatchewan. Although periodic increases in the balance of impaired loans may occur, loss rates on current and future impaired loans are expected to be consistent with CWB’s prior experience, where write-offs have been low as a percentage of impaired loans.
The provision for credit losses this year is estimated under IFRS 9, with the provision in fiscal 2018 estimated under IAS 39. Under IFRS 9, the second quarter provision for credit losses as a percentage of average loans was 23 basis points. This consisted of 22 basis points related to impaired loans and one basis point related to performing loans, and compares favourably to 24 basis points in the first quarter, consisting of 22 basis points related to impaired loans and two basis points related to performing loans. Under IAS 39, provisions for credit losses represented 20 basis points in the second quarter of last year and was entirely related to impaired loans. On a year-to-date basis, under IFRS 9 the provision for credit losses as a percentage of average loans of 24 basis points consisted of 22 basis points related to impaired loans and two basis points related to performing loans. This compares to 18 basis points related to impaired loans and one basis point related to performing loans last year under IAS 39. CWB continues to carefully monitor the entire loan portfolio for signs of weakness and has not identified any current or emerging systemic issues.
Efficient operations and operating leverage
The second quarter efficiency ratio of 46.8%, which measures adjusted non-interest expenses divided by total revenue, compares to 45.4% in the same period last year and 44.4% in the previous quarter. The year-to-date efficiency ratio of 45.6% was up 60 basis points from a year ago.
Operating leverage, which is calculated as the growth rate of total revenue less the growth rate of adjusted non-interest expenses, was negative 3.1% compared to positive 5.4% last year and positive 0.4% last quarter. On a year-to-date basis, operating leverage of negative 1.4% compares to positive 4.6% last year. Changes in operating leverage partly reflect the impact of higher acquisition-related revenue in the second quarter last year from the business lending assets acquired on January 31, 2018, and the subsequent partial run-off of that portfolio, which occurred as expected. Operating leverage in the current period also reflects the impact within non-interest expenses of continued investment to advance our strategic execution in both the second half of last year and this quarter.
Prudent capital management and dividends
At April 30, 2019, CWB’s capital ratios were 9.1% CET1, 10.7% Tier 1 and 11.9% Total capital. With a strong capital position under the more conservative Standardized approach for calculating risk-weighted assets, CWB is well-positioned to create value for shareholders through a range of capital deployment options consistent with our Balanced Growth strategy. Ongoing support and development of each of CWB’s businesses will remain a key priority, and management will continue to evaluate potential strategic acquisitions.
CWB 2019 Second Quarter Report 4
The common share dividend declared yesterday of $0.27 per share is up two cents, or 8%, from the dividend declared one year ago and consistent with the dividend declared last quarter. While the dividend payout ratio this quarter was approximately 36%, we expect earnings growth to result in migration of this metric toward 30% over the medium-term while supporting our track record of dividend increases.
Medium-term Performance Target Ranges
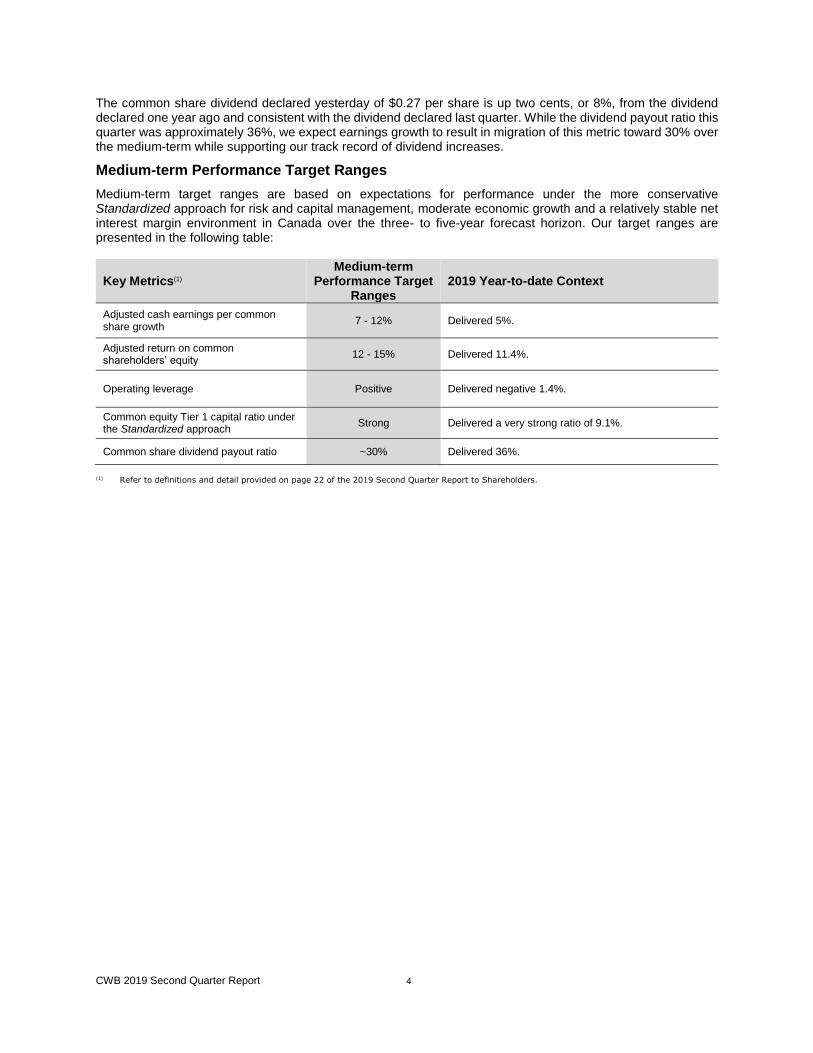
Medium-term target ranges are based on expectations for performance under the more conservative Standardized approach for risk and capital management, moderate economic growth and a relatively stable net interest margin environment in Canada over the three- to five-year forecast horizon. Our target ranges are presented in the following table:
Key Metrics(1) Medium-term
Performance Target Ranges
2019 Year-to-date Context
Adjusted cash earnings per common share growth
7 - 12% Delivered 5%.
Adjusted return on common shareholders’ equity
12 - 15% Delivered 11.4%.
Operating leverage Positive Delivered negative 1.4%.
Common equity Tier 1 capital ratio under the Standardized approach
Strong Delivered a very strong ratio of 9.1%.
Common share dividend payout ratio ~30% Delivered 36%.
(1) Refer to definitions and detail provided on page 22 of the 2019 Second Quarter Report to Shareholders.

CWB 2019 Second Quarter Report 5
About CWB Financial Group
CWB Financial Group (CWB) is a diversified financial services organization serving businesses and individuals across Canada. Operating from headquarters in Edmonton, Alberta, CWB’s key business lines include full service business and personal banking offered through branch locations of Canadian Western Bank, including CWB Virtual Branch, and Internet banking services provided by Motive Financial. Highly responsive specialized financing is delivered under the banners of CWB Optimum Mortgage, CWB Equipment Financing, CWB National Leasing, CWB Maxium Financial and CWB Franchise Finance. Trust Services are offered through Canadian Western Trust. Comprehensive wealth management offerings are provided through CWB Wealth Management, which includes the businesses of CWB McLean & Partners Wealth Management and Canadian Western Financial. As a public company on the Toronto Stock Exchange (TSX), CWB trades under the symbols “CWB” (common shares), “CWB.PR.B” (Series 5 Preferred Shares),“CWB.PR.C” (Series 7 Preferred Shares) and “CWB.PR.D” (Series 9 Preferred Shares). Learn more at www.cwb.com.
Fiscal 2019 Second Quarter Results Conference Call CWB’s second quarter results conference call is scheduled for Wednesday, May 29, 2019, at 11:00 a.m. ET (9:00 a.m. MT). CWB’s executives will comment on financial results and respond to questions from analysts.
The conference call may be accessed on a listen-only basis by dialing (416) 764-8688 (Toronto) or (888) 390-0546 (toll free) and entering passcode: 75705607. The call will also be webcast live on CWB’s website:
www.cwb.com/investor-relations/webcasts-and-events.
A replay of the conference call will be available until June 5, 2019, by dialing (416) 764-8677 (Toronto) or (888) 390-0541 (toll-free) and entering passcode 705607#.
FOR FURTHER INFORMATION CONTACT:
Chris Williams, MBA AVP, Investor Relations Phone: (780) 508-8229 Email: [email protected]
Contents
Selected Financial Highlights 6
Management’s Discussion and Analysis 7
Interim Consolidated Financial Statements 23
Shareholder Information 48
CWB 2019 Second Quarter Report 6
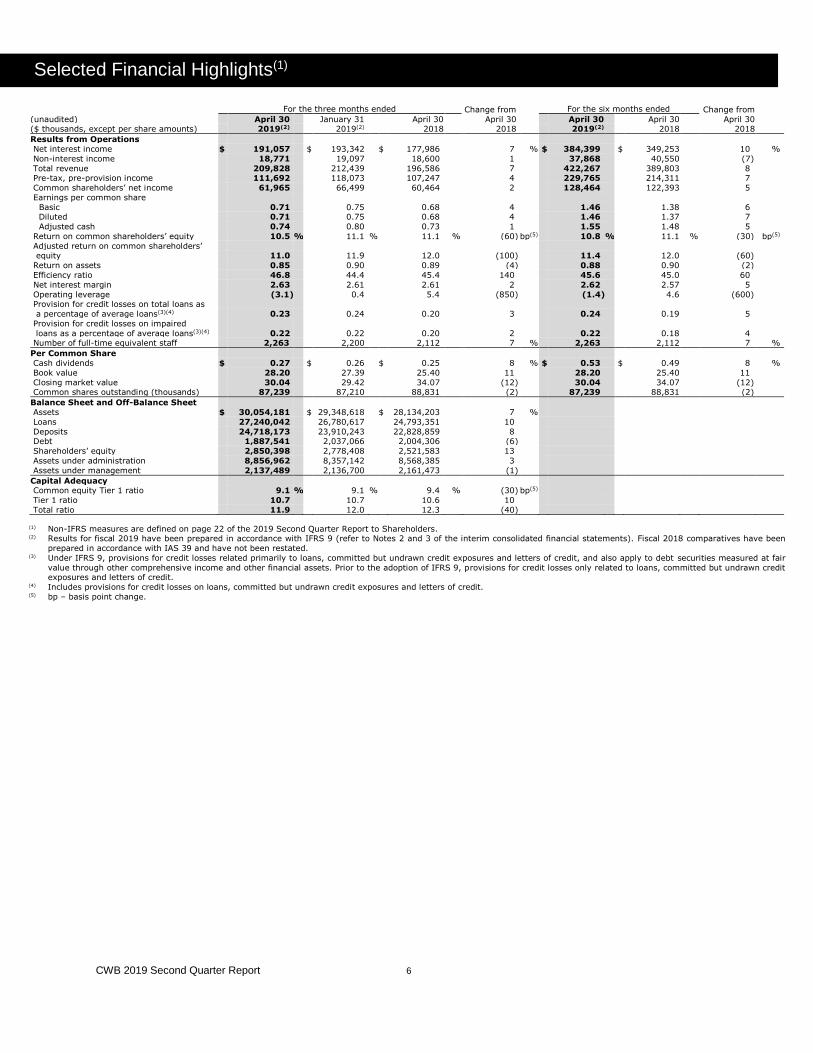
Selected Financial Highlights(1)
For the three months ended Change from
April 30 2018
For the six months ended Change from
April 30 2018
(unaudited) April 30 2019(2)
January 31 2019(2)
April 30 2018
April 30 2019(2)
April 30 2018
($ thousands, except per share amounts)
Results from Operations
Net interest income $ 191,057 $ 193,342 $ 177,986 7 % $ 384,399 $ 349,253 10 %
Non-interest income 18,771 19,097 18,600 1 37,868 40,550 (7)
Total revenue 209,828 212,439 196,586 7 422,267 389,803 8 Pre-tax, pre-provision income 111,692 118,073 107,247 4 229,765 214,311 7
Common shareholders’ net income 61,965 66,499 60,464 2 128,464 122,393 5
Earnings per common share
Basic 0.71 0.75 0.68 4 1.46 1.38 6 Diluted 0.71 0.75 0.68 4 1.46 1.37 7
Adjusted cash 0.74 0.80 0.73 1 1.55 1.48 5
Return on common shareholders’ equity 10.5 % 11.1 % 11.1 % (60) bp(5) 10.8 % 11.1 % (30) bp(5)
Adjusted return on common shareholders’ equity 11.0 11.9 12.0 (100) 11.4 12.0 (60)
Return on assets 0.85 0.90 0.89 (4) 0.88 0.90 (2)
Efficiency ratio 46.8 44.4 45.4 140 45.6 45.0 60
Net interest margin 2.63 2.61 2.61 2 2.62 2.57 5
Operating leverage (3.1) 0.4 5.4 (850) (1.4) 4.6 (600) Provision for credit losses on total loans as
a percentage of average loans(3)(4) 0.23 0.24 0.20 3 0.24 0.19 5
Provision for credit losses on impaired
loans as a percentage of average loans(3)(4) 0.22 0.22 0.20 2 0.22 0.18 4 Number of full-time equivalent staff 2,263 2,200 2,112 7 % 2,263 2,112 7 %
Per Common Share
Cash dividends $ 0.27 $ 0.26 $ 0.25 8 % $ 0.53 $ 0.49 8 %
Book value 28.20 27.39 25.40 11 28.20 25.40 11
Closing market value 30.04 29.42 34.07 (12) 30.04 34.07 (12) Common shares outstanding (thousands) 87,239 87,210 88,831 (2) 87,239 88,831 (2)
Balance Sheet and Off-Balance Sheet
Assets $ 30,054,181 $ 29,348,618 $ 28,134,203 7 %
Loans 27,240,042 26,780,617 24,793,351 10
Deposits 24,718,173 23,910,243 22,828,859 8 Debt 1,887,541 2,037,066 2,004,306 (6)
Shareholders’ equity 2,850,398 2,778,408 2,521,583 13
Assets under administration 8,856,962 8,357,142 8,568,385 3
Assets under management 2,137,489 2,136,700 2,161,473 (1)
Capital Adequacy Common equity Tier 1 ratio 9.1 % 9.1 % 9.4 % (30) bp(5)
Tier 1 ratio 10.7 10.7 10.6 10
Total ratio 11.9 12.0 12.3 (40)
(1) Non-IFRS measures are defined on page 22 of the 2019 Second Quarter Report to Shareholders. (2) Results for fiscal 2019 have been prepared in accordance with IFRS 9 (refer to Notes 2 and 3 of the interim consolidated financial statements). Fiscal 2018 comparatives have been
prepared in accordance with IAS 39 and have not been restated. (3) Under IFRS 9, provisions for credit losses related primarily to loans, committed but undrawn credit exposures and letters of credit, and also apply to debt securities measured at fair
value through other comprehensive income and other financial assets. Prior to the adoption of IFRS 9, provisions for credit losses only related to loans, committed but undrawn credit exposures and letters of credit.
(4) Includes provisions for credit losses on loans, committed but undrawn credit exposures and letters of credit. (5) bp – basis point change.
CWB 2019 Second Quarter Report 7
Management’s Discussion and Analysis
This management’s discussion and analysis (MD&A), dated May 28, 2019, should be read in conjunction with Canadian Western Bank’s (CWB) unaudited condensed interim consolidated financial statements for the period ended April 30, 2019, and the audited consolidated financial statements and MD&A for the year ended October 31, 2018, available on SEDAR at www.sedar.com and CWB’s website at www.cwb.com.
IFRS 9
CWB adopted International Financial Reporting Standard (IFRS) 9 Financial Instruments (IFRS 9), which replaces International Accounting Standard (IAS) 39 Financial Instruments: Classification and Measurement (IAS 39) for the fiscal year beginning November 1, 2018. As permitted by IFRS 9, CWB has not restated prior period comparative figures and has recognized an adjustment to opening retained earnings and accumulated other comprehensive income (AOCI) to reflect the application of the new requirements at the adoption date. For further details, refer to Notes 2 and 3 of the interim consolidated financial statements.
The most significant impact to CWB with the transition to IFRS 9 is the introduction of an expected credit loss (ECL) approach for measuring impairment that is applicable to financial assets measured at amortized cost, debt securities measured at fair value through other comprehensive income (FVOCI), and certain off-balance sheet loan commitments and financial guarantee contracts. The implementation of an ECL approach under IFRS 9, which results in allowances for credit losses being recognized on financial assets regardless of whether there has been an actual loss event, is a significant change from the incurred loss model under IAS 39.
Under IFRS 9, CWB refers to allowances and provisions for credit losses on impaired loans (Stage 3) and performing loans (Stages 1 and 2). CWB’s specific allowances under IAS 39 are consistent with Stage 3 allowances for credit losses under IFRS 9, while the collective allowance under IAS 39 is replaced by Stage 1 and 2 allowances for credit losses under IFRS 9.
Forward-looking Statements
From time to time, CWB makes written and verbal forward-looking statements. Statements of this type are included in the Annual Report and reports to shareholders and may be included in filings with Canadian securities regulators or in other communications such as press releases and corporate presentations. Forward-looking statements include, but are not limited to, statements about CWB’s objectives and strategies, targeted and expected financial results and the outlook for CWB’s businesses or for the Canadian economy. Forward-looking statements are typically identified by the words “believe”, “expect”, “anticipate”, “intend”, “estimate”, “may increase”, “may impact”, “goal”, “focus”, “potential”, “proposed” and other similar expressions, or future or conditional verbs such as “will”, “should”, “would” and “could”.
By their very nature, forward-looking statements involve numerous assumptions and are subject to inherent risks and uncertainties, which give rise to the possibility that management’s predictions, forecasts, projections, expectations and conclusions will not prove to be accurate, that its assumptions may not be correct and that its strategic goals will not be achieved.
A variety of factors, many of which are beyond CWB’s control, may cause actual results to differ materially from the expectations expressed in the forward-looking statements. These factors include, but are not limited to, general business and economic conditions in Canada, including housing market conditions, the volatility and level of liquidity in financial markets, fluctuations in interest rates and currency values, the volatility and level of various commodity prices, changes in monetary policy, changes in economic and political conditions, material changes to standing free trade agreements, legislative and regulatory developments, legal developments, the level of competition, the occurrence of natural catastrophes, changes in accounting standards and policies, information technology and cyber risk, the accuracy and completeness of information CWB receives about customers and counterparties, the ability to attract and retain key personnel, the ability to complete and integrate acquisitions, reliance on third parties to provide components of business infrastructure, changes in tax laws, technological developments, unexpected changes in consumer spending and saving habits, timely development and introduction of new products, and management’s ability to anticipate and manage the risks associated with these factors. It is important to note that the preceding list is not exhaustive of possible factors.
Additional information about these factors can be found in the Risk Management section of CWB’s annual Management’s Discussion and Analysis (MD&A). These and other factors should be considered carefully, and readers are cautioned not to place undue reliance on these forward-looking statements as a number of important factors could cause CWB’s actual results to differ materially from the expectations expressed in such forward-looking statements. Unless required by securities law, CWB does not undertake to update any forward-looking statement, whether written or verbal, that may be made from time to time by it or on its behalf.
Assumptions about the performance of the Canadian economy over the forecast horizon and how it will affect CWB’s businesses are material factors considered when setting organizational objectives and targets. In determining expectations for economic growth, CWB considers its own forecasts, economic data and forecasts provided by the Canadian government and its agencies, as well as certain private sector forecasts. These forecasts are subject to inherent risks and uncertainties that may be general or specific. Where relevant, material economic assumptions underlying forward-looking statements are disclosed within the Outlook sections of this MD&A, and/or Outlook sections of CWB’s MD&A for the year ended October 31, 2018.

CWB 2019 Second Quarter Report 8
Management’s Discussion and Analysis
Strategic Transactions
On January 31, 2018, CWB closed an asset purchase agreement to acquire for cash equipment loans and leases, and general commercial lending assets totaling approximately $850 million (referred to as the acquired “business lending assets”). The business lending assets acquired were fully aligned with CWB’s Balanced Growth strategy, including strategic objectives for industry and geographic diversification. The portfolio was primarily comprised of assets concentrated within the transportation, construction and healthcare industries, with approximately three quarters of the exposures distributed across Central and Eastern Canada.
On August 16, 2017, CWB announced that Canadian Western Trust (CWT) will focus its activities within business lines that are most aligned with the strategic objectives of CWB Financial Group, and will no longer offer self-directed account services to holders of certain securities. CWT initiated a process to appoint successor trustees for these accounts (referred to as the “CWT strategic transactions”). The CWT strategic transactions were completed in fiscal 2018.
Overview of Financial Performance
Q2 2019 vs. Q2 2018
Common shareholders’ net income of $62 million and pre-tax, pre-provision income of $112 million were up 2% and 4%, respectively. Total revenue of $210 million was up 7% from last year, including a strong 7% increase in net interest income. Higher net interest income reflected the combined benefits of strong 10% loan growth and a two basis point increase in net interest margin to 2.63%. Non-interest income was relatively unchanged. The IFRS 9 provision for credit losses on total loans as a percentage of average loans was 23 basis points, which consists of 22 basis points related to impaired loans and one basis point related to performing loans. Under IAS 39, provisions for credit losses represented 20 basis points in the second quarter of last year and was entirely related to impaired loans. Non-interest expenses were up 9%. The earn-out period for the contingent consideration related to the acquisition of CWB Maxium concluded on February 28, 2019. The final charge for the change in fair value of the contingent consideration was $3 million this quarter, down 43% from the same period last year, with the difference mainly reflecting conclusion of the earn-out period one month into the quarter. Diluted and adjusted cash earnings per common share of $0.71 and $0.74 were up 4% and 1%, respectively.
Q2 2019 vs. Q1 2019
Common shareholders’ net income and pre-tax, pre-provision income were 7% and 5% lower, respectively, with total revenue and net interest income both down 1%. Within net interest income, the benefits of 2% loan growth and a two basis point increase in net interest margin were more than offset by the impact of three fewer interest-earning days. Non-interest income was down 2%, with growth of retail services and wealth management revenue, along with stable trust services income, more than offset by lower credit related fees. The provision for credit losses as a percentage of average loans improved one basis point to 23 basis points. Non-interest expenses were 4% higher, while acquisition-related fair value changes decreased 41% reflecting the same factor noted above. Diluted and adjusted cash earnings per common share were down 5% and 8%, respectively.
YTD 2019 vs. YTD 2018
Common shareholders’ net income of $128 million and pre-tax, pre-provision income of $230 million were up 5% and 7%, respectively. Strong earnings growth reflects an 8% increase in total revenue, including 10% growth of net interest income partially offset by a 7% decrease in non-interest income. Higher net interest income was driven by 10% loan growth and a five basis point increase in net interest margin. Non-interest expenses were 9% higher, while acquisition-related fair value changes were 22% lower reflecting the same factor noted above. Diluted and adjusted cash earnings per common share of $1.46 and $1.55 were up 7% and 5%, respectively.
Adjusted ROE and ROA
The second quarter adjusted return on common shareholders’ equity (ROE) of 11.0% was 100 basis points lower compared to the same period last year. The positive impact of net income growth was more than offset by higher shareholders’ equity, mainly reflecting the contribution from higher other comprehensive income (OCI) compared to last year.
Adjusted ROE was 90 basis points lower on a sequential basis, mainly reflecting higher non-interest expenses, as well as lower net interest income with three fewer interest-earning days. Year-to-date adjusted ROE of 11.4% was 60 basis points lower compared to last year, driven by the same factors noted in the year-over-year comparison above.

CWB 2019 Second Quarter Report 9
Management’s Discussion and Analysis
The second quarter return on assets (ROA) of 0.85% was five basis points lower on a sequential basis, reflecting the same factors noted in the sequential comparison of ROE. Year-to-date ROA of 0.88% was two basis points lower compared to last year, driven the same factors noted in the comparison. ROA was four basis points lower than the same period last year as net income growth was more than offset by total asset growth.
Outlook for ROE and ROA
Over the medium-term, management expects earnings growth and profitability to benefit from an expanding geographic footprint with increased business diversification and success in key strategic initiatives to enhance CWB’s client experience, build core funding sources, and leverage current and future investment in technology.
While we expect to submit our final application and receive regulatory approval in fiscal 2020 for transition to the Advanced Internal Ratings Based (AIRB) approach, the benefits to financial performance from this risk and capital management transition will be realized over time and are not currently incorporated within the medium-term targets presented in this MD&A.
Total Revenue
Second quarter total revenue of $210 million grew 7% compared to the same quarter last year and declined 1% from the prior quarter.
Net Interest Income
Q2 2019 vs. Q2 2018
Net interest income of $191 million increased 7%, reflecting the combined benefits of 10% loan growth and a two basis point increase in net interest margin. The increase in net interest margin mainly resulted from higher asset yields, reflecting the higher interest rate environment, as well as lower balances of cash and securities. The combined benefits of these factors more than offset higher funding costs. The increase in funding costs was also driven by the higher interest rate environment, with a related increase in client preference for higher cost fixed term deposits.
Q2 2019 vs. Q1 2019
Net interest income was down 1%, as the benefits of 2% loan growth and a two basis point increase in net interest margin were more than offset by the impact of three fewer interest-earning days. Net interest margin benefitted as the increase in asset yields exceeded the increase in funding costs.
YTD 2019 vs. YTD 2018
Net interest income of $384 million was up 10%, reflecting 10% loan growth and a five basis point increase in net interest margin. The increase in net interest margin primarily reflects higher asset yields and lower average balances of cash and securities, which more than offset higher funding costs. The increase in asset yields mainly reflects the higher interest rate environment. The increase in funding costs also reflects the higher interest rate environment, competitive factors, and client preference for longer term deposits.
Interest rate sensitivity
Note 13 to the interim consolidated financial statements summarizes CWB’s exposure to interest rate risk as at April 30, 2019. The estimated sensitivity of net interest income to a change in interest rates is presented in the table below. The amounts represent the estimated change in net interest income that would result over the following 12 months from a one-percentage point parallel shift in the yield curve. The estimates are based on a number of assumptions and factors, which include:
a constant structure in the interest sensitive asset and liability portfolios;
interest rate changes affecting interest sensitive assets and liabilities by proportionally the same amount, except floor levels for various deposit liabilities and certain floating rate loans, and applied at the appropriate repricing dates; and,
no early redemptions.

CWB 2019 Second Quarter Report 10
Management’s Discussion and Analysis
($ thousands)
April 30
2019
January 31
2019
April 30
2018
Estimated impact on net interest income of a 1% increase in interest rates
1 year $ 10,155 $ 5,369 $ 10,142
1 year percentage change 1.31 % 0.70 % 1.44 %
Estimated impact on net interest income of a 1% decrease in interest rates 1 year $ (13,953) $ (9,818) $ (12,748)
1 year percentage change (1.80) % (1.28) % (1.81) %
In addition to the projected changes in net interest income noted above, it is estimated that a one-percentage point increase in all interest rates at April 30, 2019 would result in a decrease in OCI of approximately $104 million, net of tax (April 30, 2018 – $90 million).
It is estimated that a one-percentage point decrease in all interest rates at April 30, 2019 would have the opposite effect, increasing OCI by approximately $106 million, net of tax (April 30, 2018 – $88 million). Management maintains the asset liability structure and interest rate sensitivity within CWB’s established policies through pricing and product initiatives, as well as the use of interest rate swaps.
Outlook for net interest income
Management expects to deliver growth of net interest income in the high single-digit range in fiscal 2019, driven primarily by strong loan growth.
CWB’s focused business transformation and ongoing investment in core technology has enabled progress toward an enhanced client experience and growth of full-service relationships through further development of targeted services and more efficient processes. These initiatives are expected to provide support for net interest margin over the medium term through delivery of new capabilities to accelerate growth of branch-raised deposits, along with a sustained focus to drive strong growth in higher yielding loan portfolios with an acceptable risk profile.
Management expects net interest margin to remain relatively consistent through the remainder of 2019 compared to the first half of 2019, reflecting no prime interest rate increases in the outlook for the balance of fiscal 2019. Volatility in net interest margin could occur if competitive factors affecting both deposit costs and asset yields either intensify or subside.
Non-interest Income
Q2 2019 vs. Q2 2018
Non-interest income of $19 million was relatively unchanged from last year, as growth of credit related and retail services fees, along with stable wealth management and trust services income, was offset by lower foreign exchange revenue within ‘other’ non-interest income.
Q2 2019 vs. Q1 2019
Non-interest income was down 2%, with growth of retail services fees and wealth management income, along with stable income from trust services, were more than offset by lower credit related fees. The change in credit related fees partly relates to the shift in loan growth to emphasize general commercial loans, which are associated with lower fees compared to real estate loans with more complex structures.
YTD 2019 vs. YTD 2018
Non-interest income of $38 million was down 7%. Growth of credit related and retail services fees was more than offset by the impact of approximately $3 million of gains realized from the CWT strategic transactions recorded within ‘other’ non-interest income in the first quarter last year, along with slightly lower fee income from wealth management and trust services in 2019. Lower trust services fees mainly reflect the impact of the CWT strategic transactions.
Outlook for non-interest income
CWB expects full-year non-interest income in fiscal 2019 to be relatively consistent with last year. We anticipate stable performance across most categories, reflecting our strategy to extend and deepen relationships with both new and existing business and personal clients. We expect ‘other’ non-interest income to be lower, reflecting the impact of gains on sale related to the CWT strategic transactions realized in 2018.
CWB 2019 Second Quarter Report 11
Management’s Discussion and Analysis
Based on the current composition of the debt securities portfolio, we do not expect realized net gains and losses to contribute materially to non-interest income in 2019; however, the magnitude and timing of gains and losses are dependent on market factors that are difficult to predict.
Effective November 1, 2018, under IFRS 9 realized gains and losses on equity securities designated at FVOCI, consisting of CWB’s preferred share holdings, are recorded in OCI and are not subsequently recognized through earnings. Realized gains and losses that arise on the sale of preferred shares are reclassified from AOCI to retained earnings. Further detail is provided in Note 2 of the interim consolidated financial statements.
Acquisition-related Fair Value Changes
CWB Maxium has delivered very strong performance since the acquisition in 2016, with contributions to financial performance and CWB’s strategic diversification objectives which have exceeded our expectations. The final charge for the change in fair value of the contingent consideration was $3 million this quarter, with the settlement paid in cash, down 43% from the same period last year and 41% lower than last quarter. The decreases mainly reflect conclusion of the three-year earn-out period on February 28, 2019, one month into the second quarter. Total contingent payments in cash and CWB common shares over the earn-out period of $70 million represented the maximum payout under the purchase agreement and confirm the successful integration and growth of the acquired business.
Non-interest Expenses
Q2 2019 vs. Q2 2018
Non-interest expenses of $99 million were up 9% ($8 million), primarily due to a 10% ($6 million) increase in salaries and benefits. Higher salaries and benefits mainly reflected hiring activity to support overall business growth, execution of strategic priorities and annual salary increments. Premises and equipment expenses increased 12% ($2 million), primarily reflecting ongoing investment in technology infrastructure and premises to position CWB for future growth. ‘Other’ expenses were up 3% ($1 million) mainly due to higher regulatory costs and consultant fees, partially offset by a decrease in employee recruitment costs.
Q2 2019 vs. Q1 2019
Non-interest expenses were up 4% ($4 million) mainly driven by a 3% ($2 million) increase in salaries and benefits, partly due to seasonally higher benefits, as well as long-term incentive plan costs. Premises and equipment expenses increased 4% ($1 million), reflecting the same factors noted above. ‘Other’ expenses were up 8% ($1 million) mainly due to higher advertising costs, consulting fees and employee training costs.
YTD 2019 vs. YTD 2018
Non-interest expenses increased 9% ($16 million) primarily due to 9% ($10 million) growth of salaries and benefits, reflecting the same factors noted above. Premises and equipment expenses were up 13% ($4 million) due to ongoing investment in technology infrastructure and higher office lease costs. ‘Other’ expenses were up 6% ($2 million) mainly due to higher consultant fees and regulatory costs.
Efficiency ratio and operating leverage
The second quarter efficiency ratio of 46.8%, which measures adjusted non-interest expenses divided by total revenue, compares to 45.4% in the same period last year and 44.4% in the previous quarter. The difference compared to last year partly reflects the impact of acquisition-related revenue in the second quarter last year, while the sequential change mainly reflects the revenue impact of three fewer interest-earning days this quarter.
On a year-to-date basis, the efficiency ratio of 45.6% compares to 45.0% last year as strong growth in total revenue was more than offset by the increase in non-interest expenses.
Operating leverage, which is calculated as the growth rate of total revenue less the growth rate of adjusted non-interest expenses over the same period last year was negative 3.1% compared to positive 5.4% last year and positive 0.4% last quarter. On a year-to-date basis, operating leverage of negative 1.4% compares to positive 4.6% last year. Changes in operating leverage partly reflect the impact of higher acquisition-related revenue in the second quarter last year from the business lending assets acquired on January 31, 2018, and the subsequent partial run-off of that portfolio, which occurred as expected. Operating leverage in the current period also reflects the impact within non-interest expenses of increased investment to advance our strategic direction in both the second half of last year and this quarter.

CWB 2019 Second Quarter Report 12
Management’s Discussion and Analysis
Outlook for the efficiency ratio and operating leverage
CWB’s medium-term targets for growth of adjusted cash earnings per share and positive operating leverage incorporate expectations for strong business growth supported through strategic investment in people, technology and infrastructure, along with effective control of non-interest expenses in view of revenue growth opportunities. CWB’s annual efficiency ratio over the past three years has been approximately 46%. Management expects CWB’s efficiency ratio to fluctuate around this level over the near term, and expects to deliver neutral operating leverage on a full-year basis in 2019. While CWB will prudently manage expenses based on expected revenue growth, quarterly volatility of operating leverage may occur based on the timing of expenditures.
Income Taxes
The second quarter effective income tax rate was 26.7%, compared to 27.3% in the same quarter last year and 26.5% in the prior quarter. On a year-to-date basis, the effective income tax rate was 26.6%, compared to 27.0% last year.
Outlook for income taxes
CWB’s expected income tax rate for 2019 is approximately 27% based on currently enacted legislation. The throne speech delivered by the Alberta government on May 22, 2019 included a commitment to lower the Alberta corporate income tax rate from 12% to 8% by 2022. If the Alberta government enacted a 1% decrease in corporate income tax rates effective July 1, CWB’s 2019 effective income tax rate would reduce by approximately 20 basis points. The full year impact of a 1% decrease in Alberta corporate tax rates would reduce CWB’s effective income tax rate by approximately 60 basis points.
Comprehensive Income
Comprehensive income is comprised of net income and other comprehensive income (OCI), all net of income taxes.
Q2 2019 vs. Q2 2018
Comprehensive income of $101 million was up 61% from the same period last year, resulting from a $35 million increase in OCI and $3 million higher net income.
Changes in OCI, all net of tax, mainly resulted from a higher change in fair value of derivatives designated as cash flow hedges ($22 million), as well as debt and securities measured at FVOCI under IFRS 9 ($14 million). CWB’s debt securities portfolio, which is classified at FVOCI, is comprised primarily of debt securities issued or guaranteed by Canada, a province or a municipality. CWB’s equity securities, which are designated at FVOCI, are comprised of investment grade preferred shares. Fluctuations in value are generally attributed to changes in interest rates, movements in market credit spreads and shifts in the interest rate curve.
YTD 2019 vs. YTD 2018
Comprehensive income of $223 million was up $119 million, resulting from a $111 million increase in OCI and $8 million higher net income.
Changes in OCI, all net of tax, mainly resulted from a higher change in fair value of derivatives designated as cash flow hedges ($82 million), as well as debt and securities measured at FVOCI ($30 million).
Balance Sheet
Total assets were up 7% from last year and 2% from last quarter, with total assets surpassing the $30 billion milestone for the first time in CWB’s history.
Cash and securities
Cash and securities totaled $2.3 billion at April 30, 2019, compared to $2.8 billion last year and $2.0 billion last quarter. Average balances of cash and securities for the three months ending April 30, 2019 of $2.4 billion compares to $3.0 billion in the second quarter last year, and was relatively unchanged from $2.5 billion last quarter. CWB’s liquidity management is based on an internal stressed cash flow model, with the level of cash and securities driven primarily by the term structure of both assets and liabilities.
CWB maintains prudent liquidity levels at all times while the composition of total liquid assets supports ongoing compliance with the Office of the Superintendent of Financial Institutions Canada (OSFI) Liquidity Adequacy Requirements guideline and CWB’s own policies.

CWB 2019 Second Quarter Report 13
Management’s Discussion and Analysis
In April 2019, revisions to OSFI’s Liquidity Adequacy Requirements guideline were issued for implementation on January 1, 2020 and management does not expect the changes to have a material impact on CWB’s liquidity management.
The cash and securities portfolio is comprised of high quality debt instruments and investment grade preferred shares that are not held for trading purposes and, where applicable, are typically held until maturity. Net unrealized losses on cash and securities recorded on the balance sheet of $30 million were down from $59 million last year and $48 million last quarter.
Loans
Total loans, excluding the allowance for credit losses, of $27.4 billion increased 10% ($2.4 billion) from last year, 2% ($0.5 billion) from the prior quarter and 4% ($1.0 billion) over the past six months.
Change
from
April 30
2018
(unaudited) April 30
2019
January 31
2019
April 30
2018
(millions)
General commercial loans $ 8,004 $ 7,799 $ 6,992 14 %
Personal loans and mortgages 5,407 5,268 4,974 9
Commercial mortgages 4,990 4,963 4,266 17
Equipment financing and leasing 4,877 4,815 4,565 7
Real estate project loans 3,935 3,908 4,008 (2)
Oil and gas production loans 140 135 111 26
Total loans outstanding(1) $ 27,353 $ 26,888 $ 24,916 10 %
(1) Total loans outstanding by lending sector exclude the allowance for credit losses.
Q2 2019 vs. Q2 2018
In dollar terms, growth by lending sector in the past year was led by general commercial loans ($1,012 million) and commercial mortgages ($724 million).
Growth of personal loans and mortgages was $433 million. Overall growth within this category reflects continued origination of both alternative and “A” mortgages, where “A” mortgages consist of residential mortgages eligible for bulk portfolio insurance. The book value of alternative mortgages originated within CWB’s broker-sourced residential mortgage business, CWB Optimum Mortgage (CWB Optimum), represents approximately 54% of CWB’s personal loans and mortgage portfolio, and 11% of CWB’s total loans, unchanged from one year ago.
Total loans of $3.1 billion within CWB Optimum increased 6% ($176 million) from the second quarter last year. New CWB Optimum originations in the second quarter were primarily driven by alternative mortgages secured via first mortgages carrying a weighted average loan-to-value at initiation of approximately 69%, along with an increasing proportion of “A” mortgages sourced through the broker channel. The average size of CWB Optimum mortgages originated in the second quarter was approximately $329,000 and the average size of mortgages outstanding at April 30, 2019 was $297,000.
At approximately 54% of the total, Ontario represents the largest geographic exposure by province within CWB Optimum’s portfolio, followed by British Columbia at 18% and Alberta at 17%. Consistent with CWB’s previously stated expectations, growth within CWB Optimum has slowed compared to prior years. This reflects the impacts of reduced housing market activity in certain regions following changes to OSFI's Guideline B-20, Residential Mortgage Underwriting Practices and Procedures (B-20), CWB’s overall risk appetite for alternative mortgages as a proportion of total loans, and ongoing refinement of CWB’s risk appetite within the alternative mortgage market, including a preference for stronger credits. In combination, these factors have constrained the volume of new mortgage originations within CWB Optimum.
Equipment financing and leasing increased $312 million, and oil and gas production loans were up $29 million in the past year. CWB continues to maintain a proactive approach to manage its small portfolio of oil and gas production loans, with the increase this quarter reflecting higher utilization of existing credit facilities. The total balance of loans in this category continues to comprise approximately 1% of CWB’s total loans, with underlying commodity exposures skewed toward natural gas liquids.
Real estate project loans contracted $73 million, with growth in Ontario more than offset by the impact of successful project completions and payouts in Alberta and British Columbia. The pace of new project development in greater Vancouver has moderated while lagging impacts of the 2015 – 2016 regional recession have resulted in fewer new real estate project lending opportunities in Edmonton and Calgary.

CWB 2019 Second Quarter Report 14
Management’s Discussion and Analysis
Q2 2019 vs. Q1 2019
On a sequential basis, total loan growth was $465 million, with Ontario accounting for 35% of the increase. Performance within general commercial loans was strong, with the outstanding balance of loans in this category up 3% ($205 million). The outstanding balance of personal loans and mortgages increased $139 million, mainly reflecting the CWB Optimum-related factors noted above.
Equipment financing and leasing added $62 million, with new originations largely offset by higher payouts. Commercial mortgages increased $27 million and real estate project loans were up $27 million in the second quarter, while oil and gas production loans were relatively unchanged.
Change from
April 30
2018
(unaudited) April 30
2019
January 31
2019
April 30
2018
(millions)
British Columbia $ 9,109 $ 8,963 $ 8,381 9 %
Alberta 8,639 8,606 7,984 8
Ontario 5,993 5,828 5,304 13
Saskatchewan 1,424 1,426 1,361 5
Manitoba 817 794 748 9
Quebec 748 680 613 22
Other 623 591 525 19
Total loans outstanding(1) $ 27,353 $ 26,888 $ 24,916 10 %
(1) Total loans outstanding by province exclude the allowance for credit losses.
Geographic diversification
Year-over-year growth was consistent with CWB’s Balanced Growth strategy to increase geographic diversification. Central and Eastern Canada continued to lead growth by geographic market with a significant increase of $922 million (14%), representing 38% of CWB’s total lending growth. Growth in these regions was underpinned by strong performance from CWB’s businesses that have a national footprint, including CWB Maxium, CWB Optimum, CWB Franchise Finance and CWB National Leasing. Growth in both British Columbia and Alberta was also strong at 9% ($728 million) and 8% ($655 million), respectively. Manitoba and Saskatchewan grew 9% and 5% from last year, or $69 million and $63 million, respectively.
On a sequential basis, total outstanding loans were up across all provinces, with the strongest growth apparent in Ontario ($165 million) and British Columbia ($146 million), followed by Quebec ($68 million) and Alberta ($33 million).
Outlook for loans
CWB will continue to support high-quality borrowers with a focus on business owners operating within targeted industry segments across Canada. Continued strategic execution has positioned CWB to capture increased market share within a larger addressable market, and management remains committed to deliver double-digit annual loan growth whenever prudent. This includes a continued focus on secured loans that offer an appropriate return and acceptable risk profile.
Overall growth of residential mortgages is now expected to be in the mid to high single digit range in full year fiscal 2019. With increased securitization capabilities, management expects CWB’s residential mortgage growth to include an increased proportion of “A” mortgages sourced both through the CWB Optimum broker channel and CWB’s branch network. Management remains committed to the ongoing development of CWB Optimum as it continues to produce solid returns while maintaining an acceptable risk profile. CWB continues to assess housing market conditions and future construction-related opportunities within targeted markets. In general, management expects to continue to identify opportunities to finance well-capitalized developers on the basis of sound loan structures and acceptable pre-sale/lease levels.
Potential risks that could have a material adverse impact on loan growth expectations include a significant and sustained deterioration in Canadian residential real estate prices, material changes to trade agreements, including the imposition of tariffs, which could affect the outlook for Canadian exports, material weakening of energy and other commodity prices compared to recent levels, a material contraction of economic growth in the U.S., or a significant disruption in major global economies.

CWB 2019 Second Quarter Report 15
Management’s Discussion and Analysis
Credit Quality
Credit quality continues to reflect CWB’s secured lending business model, disciplined underwriting practices and proactive loan management. For the three months ended Change from
April 30
2018
(unaudited)
April 30
2019
January 31
2019
April 30
2018
($ thousands)
Gross impaired loans, beginning of period $ 136,439 $ 137,872 $ 137,194 (1) %
New formations 62,520 34,395 10,420 500
Reductions, impaired accounts paid down or returned to performing status (18,942) (16,115) (12,923) (47) (
Write-offs (11,696) (19,713) (11,737) -
Total(1) $ 168,321 $ 136,439 $ 122,954 37 %
Balance of the ten largest impaired accounts $ 75,173 $ 45,720 $ 51,112 47 %
Total number of accounts classified as impaired(2) 255 241 244 5
Gross impaired loans as a percentage of gross loans 0.62 % 0.51 % 0.49 % 13 bp(3)
(2) (1) Gross impaired loans include foreclosed assets held for sale with a carrying value of $4,598 (January 31, 2019 – $5,099, April 30, 2018 – $4,737). (2) Total number of accounts excludes CWB National Leasing. (3) bp – basis point change.
The dollar level of gross impaired loans in the second quarter totaled $168 million, compared to $123 million last year and $136 million in the prior quarter. The dollar level of gross impaired loans represented 0.62% of gross loans at quarter-end, compared to 0.49% last year and up from 0.51% in the previous quarter. The increase in gross impaired loans largely reflects one impairment within the general commercial category in Saskatchewan.
The level of gross impaired loans fluctuates as loans become impaired and are subsequently resolved, and does not directly reflect the dollar value of expected write-offs given tangible security held in support of lending exposures. The overall loan portfolio is reviewed regularly with credit decisions undertaken on a case-by-case basis to provide early identification of possible adverse trends.
As at April 30, 2019, the total IFRS 9 allowance for credit losses (Stages 1, 2 and 3) was $118 million, compared to $113 million last quarter. The total allowance for credit losses (collective and specific) under IAS 39 was $146 million one year ago. Further information relating to CWB’s total allowance for credit losses is provided in Note 6 of the interim consolidated financial statements for the period ended April 30, 2019.
Provision for credit losses
The provision for credit losses was estimated under IFRS 9 beginning in fiscal 2019, with the provision in fiscal 2018 estimated under IAS 39. Under IFRS 9, the second quarter provision for credit losses as a percentage of average loans of 23 basis points consisted of 22 basis points related to impaired loans and one basis point related to performing loans. This compares to 24 basis points in the first quarter, consisting of 22 basis points related to impaired loans and two basis points related to performing loans. Under IAS 39, provisions for credit losses represented 20 basis points in the second quarter of last year and was entirely related to impaired loans.
On a year-to-date basis, under IFRS 9 the provision for credit losses as a percentage of average loans of 24 basis points consisted of 22 basis points related to impaired loans and two basis points related to performing loans. This compares to 18 basis points related to impaired loans and one basis point related to performing loans last year under IAS 39.
Outlook for credit quality
Overall credit quality is expected to continue to reflect our secured lending business model, disciplined underwriting practices and proactive loan management. We continue to carefully monitor the entire loan portfolio for signs of weakness and no current or emerging systemic issues have been identified. Gross impaired loans within CWB Optimum may increase in the event of a material correction of residential home prices.
While IFRS 9 changes the timing of the recognition of credit losses, the actual amount of credit losses realized over the life of a particular loan, represented by write-offs net of recoveries, will not be impacted by this accounting change. We expect provisions for credit losses on performing loans to be more volatile with implementation of a forward-looking ECL approach under IFRS 9.

CWB 2019 Second Quarter Report 16
Management’s Discussion and Analysis
With all material AIRB models currently deployed in the business, our stress testing capabilities have been significantly enhanced. Stress testing was performed this quarter to simulate the impact of a two-year Canadian economic recession through a combination of GDP contraction, unemployment increases, home price declines and lower oil prices, with the recessionary conditions also resulting in a decline in interest rates and weakening of the Canadian dollar. An additional stress test also simulated a more severe downturn with rates of credit loss that resembled those experienced through the global financial crisis in 2008. The results of these tests confirmed management’s confidence that if faced with periods of macro-economic stress, CWB would continue to deliver positive earnings for shareholders while maintaining financial stability, the current dividend, and a strong capital position.
Deposits and Funding
CWB continues to execute on key strategic objectives to diversify funding sources. Total deposits of $24.7 billion were up 8% ($1.9 billion) from last year, with branch-raised deposits up 6%. Branch-raised deposit growth included contributions from CWT’s notice account line of business, CWB’s banking branches and Motive Financial, together comprising 11% growth of fixed term deposits and 4% growth of demand and notice deposits. Funding from capital markets increased from last year, while the balance of outstanding securitization funding declined. Higher amounts of outstanding securitization last year reflected success in funding the purchase of business lending assets on January 31, 2018 mainly through CWB’s securitization channels. Broker-sourced deposits increased 10% from last year.
Total deposits were up 3% ($808 million) sequentially, reflecting CWB’s strategic focus to grow and diversify funding sources. Branch-raised deposits were up 3%, with contributions from CWB’s banking branches, CWT’s notice account line of business and Motive Financial generating 3% growth of both fixed term and demand and notice deposits. Broker-sourced deposits increased 1% from the prior quarter.
Total deposits by type and source are summarized below:
As at Change from
April 30
2018
(unaudited)
April 30 2019
January 31
2019
April 30 2018
($ millions)
Deposits by source and type
CWB Financial Group branch-raised
Demand and notice $ 7,679 $ 7,424 $ 7,388 4 %
Term 5,057 4,907 4,575 11
12,736 12,331 11,963 6
Broker term 8,978 8,899 8,155 10
Capital markets 3,004 2,680 2,711 11
Total Deposits $ 24,718 $ 23,910 $ 22,829 8 %
Personal deposits represented 63% of total deposits at April 30, 2019, compared to 61% last year and 63% last quarter. Total branch-raised deposits accounted for 52% of total deposits at quarter end, unchanged from last year and the prior quarter. Demand and notice deposits comprised 31% of total deposits, compared to 32% last year and 31% last quarter. Total funding raised through the debt capital markets of $3.0 billion represented 12% of total deposits at April 30, 2019, up from 11% last year and last quarter. The deposit broker network remains an efficient source to raise insured fixed term retail deposits and has proven to be a reliable and effective way to access funding and liquidity over a wide geographic base. CWB raises only fixed-term broker deposits, with terms to maturity between one and five years, and does not offer a High Interest Savings Account (HISA) product. Term deposits raised through the broker network represented 36% of total funding at quarter end, unchanged from last year and down from 37% last quarter.
Securitization
Securitized leases, loans and mortgages are reported on-balance sheet with total loans. The gross amount of securitized leases and loans at April 30, 2019 was $1,476 million, compared to $1,729 million one year ago and $1,631 million last quarter. The gross amount of mortgages securitized under the National Housing Act Mortgage Backed Securities (NHA MBS) program this quarter was $605 million compared to $571 million one year ago and $617 million last quarter. Year-to-date total funding from the securitization of leases, loans and mortgages was $261 million compared to $835 million one year ago. Elevated funding from securitization year-to-date last year related to the acquisition of business lending assets on January 31, 2018.

CWB 2019 Second Quarter Report 17
Management’s Discussion and Analysis
Outlook for deposits and funding
CWB’s strategic focus to grow and diversify funding sources will continue. This includes a goal to increase branch-raised deposits, with particular emphasis on demand and notice deposits. Future growth in branch-raised funding is expected to reflect success in acquiring more clients and developing broader, full-service client relationships across the country.
Continued development of new and more effective products, along with an ongoing strategic focus on business transformation and process improvement, is expected to enhance the client experience, strengthen CWB’s competitive position and support various growth initiatives related to branch-raised funding over the medium term. Initiatives began last year to realign client-facing operations within banking branches will continue through the remainder of 2019. These structural improvements are expected to support deposit growth through enhanced capacity to deliver on CWB’s reputation for excellence in personalized service in a highly scalable manner.
Support for deposit gathering capabilities will also include targeted strategies within the CWB Virtual Branch and Motive Financial as well as continued development of the full-service branch network, with the opening of an Ontario branch location expected in 2020. Continued diversification of funding sources is also expected to include growth of both debt capital markets and securitization funding channels.
Other Assets and Other Liabilities
Other assets totaled $554 million at April 30, 2019, compared to $531 million last year and last quarter, with the increase over both periods primarily related to higher fair value of derivatives used for interest rate risk management purposes.
Other liabilities totaled $596 million at April 30, 2019, compared to $777 million last year and $620 million last quarter. The lower balance mainly reflects no repurchase agreements outstanding this quarter for liquidity management purposes.
Off-Balance Sheet
Off-balance sheet items include assets under administration and assets under management. Total assets under administration, which are comprised of trust assets, mortgages under service agreements and third-party leases under administration, totaled $8.9 billion at April 30, 2019, compared to $8.6 billion one year ago and $8.4 billion last quarter. Approximately $0.3 billion of assets under administration were transferred to successor trustees over the past twelve months as part of the CWT strategic transactions. The CWT strategic transactions were completed in the fourth quarter of 2018 and no further transfers of deposits or assets under administration to successor trustees will occur under the agreements.
Assets under management were $2.1 billion at quarter end, down 1% from $2.2 billion a year earlier and relatively unchanged from last quarter.
Other off-balance sheet items are comprised of standard industry credit instruments (guarantees, standby letters of credit and commitments to extend credit). CWB does not utilize, nor does it have exposure to, collateralized debt obligations or credit default swaps.
Capital Management
OSFI requires Canadian financial institutions to manage and report regulatory capital in accordance with the Basel III capital management framework. We currently report regulatory capital ratios using the Standardized approach for calculating risk-weighted assets, which requires CWB to carry significantly more capital for certain credit exposures compared to requirements under the AIRB methodology. For this reason, regulatory capital ratios of banks that utilize the Standardized approach are not directly comparable with the large Canadian banks and other financial institutions that utilize the AIRB methodology. CWB’s required minimum regulatory capital ratios, including a 250 basis point capital conservation buffer, are 7.0% common equity Tier 1 (CET1), 8.5% Tier 1 and 10.5% Total capital.
With strong capital ratios of 9.1% CET1, 10.7% Tier 1 and 11.9% Total capital at April 30, 2019, CWB is well positioned to create value for shareholders through a range of capital deployment options consistent with our Balanced Growth strategy. Ongoing support and development of each of CWB’s core businesses will remain a key priority, and we will continue to evaluate potential strategic acquisitions. CWB’s Basel III leverage ratio of 8.4% at quarter end remains very strong.

CWB 2019 Second Quarter Report 18
Management’s Discussion and Analysis
Significant Changes
On April 10, 2019, CWB announced that the Toronto Stock Exchange (TSX) approved an amendment to the normal course issuer bid (NCIB). The amendment increased the number of common shares that CWB may repurchase for cancellation by 1,767,000 to 3,534,000 common shares, increasing the cumulative number of common shares available for repurchase under the NCIB to approximately 4% of the common shares issued and outstanding on September 17, 2018. The amended NCIB provides a further 2% of issued and outstanding common shares that can be repurchased beyond the 1,767,000 common shares purchased and cancelled by CWB in the three months ended January 31, 2019.
The amended NCIB will expire on the earlier of September 30, 2019 or the date on which we have either acquired the maximum number of common shares allowable or otherwise decided not to make any further repurchases. The amended NCIB provides CWB with the flexibility to continue to manage our capital position while generating shareholder value through a range of capital deployment options.
Further details regarding CWB’s regulatory capital and capital adequacy ratios are included in the following table:
(unaudited)
As at
April 30
2019
As at
January 31
2019
As at
April 30
2018 ($ millions)
Regulatory capital CET1 capital before deductions $ 2,440 $ $2,392 $ 2,290
Net CET1 deductions (221) (215) (212)
CET1 capital 2,219 2,177 2,078
Tier 1 capital(1) 2,609 2,568 2,344
Total capital(1) 2,903 2,860 2,714
Risk-weighted assets $ 24,375 $ 23,931 $ 22,157
Capital adequacy ratios CET1
9.1
%
9.1
%
9.4
%
Tier 1 10.7 10.7 10.6
Total 11.9 12.0 12.3
(1) The 2019 inclusion of non-common equity instruments that do not include NVCC clauses is capped at 30% of the January 1, 2013 outstanding balances (2018 - 40%). At April 30, 2019, $47,500 (January 31, 2019 – $47,500; April 30, 2018 – nil) was excluded from regulatory capital related to
outstanding non-NVCC subordinated debentures.
CET1 Ratio
On a year-over-year basis, the 30 basis point reduction in CWB’s CET1 ratio reflects utilization of the NCIB, as well as an increase in risk-weighted assets related to strong business growth, partially offset by the impact of IFRS 9 transition and growth of retained earnings.
Tier 1 Ratio
Changes to the Tier 1 ratio reflect the same factors that affected the CET1 ratio, along with the issuance of $125 million First Preferred Shares Series 9 in the first quarter of 2019.
Total Ratio
Changes to the Total ratio reflect the CET1 and Tier 1 items noted above, with the exception of the IFRS 9 transition impact, which had no significant effect on Total capital, as well as the partial phase out of subordinated debentures that do not contain non-viability contingent capital (NVCC) clauses. Given that CWB’s current outstanding non-NVCC subordinated debentures do not qualify for full regulatory capital inclusion, management intends to redeem these subordinated debentures on or before maturity on December 17, 2019.
Book value per common share at April 30, 2019 of $28.20, compared to $25.40 last year and $27.39 last quarter. Changes in book value per common share primarily reflect sustained earnings growth and use of the NCIB in the three months ended January 31, 2019.
Common shareholders received a quarterly cash dividend of $0.27 per common share on March 29, 2019. On May 28, 2019, CWB’s Board of Directors declared a cash dividend of $0.27 per common share, payable on June 27, 2019 to shareholders of record on June 13, 2019. This quarterly dividend is up two cents, or 8%, from the dividend declared one year ago and unchanged from the prior quarter. The Board of Directors also declared cash dividends of $0.2688125 per Series 5, $0.390625 per Series 7, and $0.375 per Series 9 Preferred Shares all payable on July 31, 2019 to shareholders of record on July 24, 2019.

CWB 2019 Second Quarter Report 19
Management’s Discussion and Analysis
Management evaluates common share dividends every quarter against CWB’s dividend payout ratio target of approximately 30% of common shareholders’ net income, the current strength of CWB’s capital positon, and capital requirements under the Standardized approach to support ongoing strong and balanced asset growth. While the dividend payout ratio this quarter was approximately 36%, CWB’s current capital position is strong and management expects earnings growth to result in migration of this metric toward 30% target while supporting CWB’s track record of dividend increases over the medium-term.
Further information relating to CWB’s capital position is provided in Note 15 of the interim consolidated financial statements for the period ended April 30, 2019 as well as the audited consolidated financial statements and MD&A for the year ended October 31, 2018.
Basel III Reforms
The Basel Committee on Banking Supervision (BCBS) finalized Basel III reforms in fiscal 2017, with an effective date of January 2022. The reforms are mainly intended to reduce the variability in capital levels and to address a number of weaknesses in the existing capital framework. On July 16, 2018, OSFI launched a public consultation on the proposed Canadian adoption.
On October 30, 2018, OSFI revised its securitization framework to reflect the adoption of the BCBS’ Revisions to the Securitisation Framework and Capital Treatment for Short-term “Simple, Transparent and Comparable” Securitisations. The new requirements were effective November 1, 2018, however OSFI provided transitional arrangements for transactions undertaken before January 1, 2019. In addition, OSFI allowed a one-year grandfathering of the securitization framework for all exposures held at October 31, 2018. Upon adoption of the revised guidelines, there was no material impact to CWB’s capital ratios.
On October 30, 2018, OSFI also revised its guidelines to incorporate the new BCBS Standardized approach methodologies for measuring counterparty credit risk and capital requirements for exposures to central counterparties. The adoption required over-the-counter derivative exposures to be reflected under the new Standardized Approach for Measuring Counterparty Credit Risk (SA-CCR), instead of our previous methodology based on the current exposure method. The adoption of these guidelines had no material impact to CWB’s capital ratios.
On October 30, 2018, OSFI published its updated Leverage Requirements Guideline, effective for November 1, 2018. The revisions align the leverage guideline with OSFI’s Q1 2019 adoption of the BCBS standard on SA-CCR and the revisions to the securitization framework discussed above. On November 20, 2018, OSFI also finalized the Leverage Ratio Disclosure Requirements guideline, effective for November 1, 2018.The adoption of these guidelines had no material impact to CWB’s leverage ratio.
Outlook for capital management
The ongoing retention of earnings, net of expected common and preferred share dividends, is expected to support capital requirements associated with continued execution of CWB’s Balanced Growth strategy and the anticipated achievement of CWB’s medium-term performance target for a strong CET1 ratio.
CWB will maintain strong capital ratios under the Standardized approach for calculating risk-weighted assets, above CWB’s target thresholds and OSFI’s required minimums, and is well positioned to manage future business growth and unexpected events. Target capital ratios, including an appropriate capital buffer over the prescribed OSFI minimums, are reconfirmed through CWB’s regulatory capital plan.
AIRB transition plan
Our project continues in support of an application to OSFI for transition to the AIRB methodology for capital and risk management. We now expect to submit our final application and receive regulatory approval to transition to the AIRB methodology in fiscal 2020. The slight change in timing of our final application reflects the iterative and conservative approach we have undertaken to achieve this transformational milestone, which we expect to create meaningful and lasting value for shareholders.
Transition to the AIRB approach will put CWB on more equal footing with our competition and increase CWB’s addressable market. It will add risk sensitivity to our framework for capital management, increase risk quantification processes, improve risk-based pricing capabilities and economic capital estimations, improve stress testing capabilities and enhance our Internal Capital Adequacy Assessment Process (ICAAP). These improved risk management capabilities will better equip CWB to allocate resources to target business segments that generate the most attractive risk-adjusted returns.

CWB 2019 Second Quarter Report 20
Management’s Discussion and Analysis
CWB’s AIRB transition project is comprised of several discrete phases, including: establishment of formalized project governance; creation of models including data collection, development and testing, deployment, operationalization and use test; model validation; and, submission of the final application to OSFI. All material AIRB models and related scorecards have been deployed into the business.
Model validation and enhancement of existing models continues. Further development of CWB’s enterprise risk management function is also ongoing, including: three lines of defence enhancement, stress testing capabilities, and economic capital estimation. Implementation of CWB’s risk-weighted asset production and capital reporting tools is underway.
Significant Changes in Accounting Policies and Financial Statement Presentation
The unaudited interim consolidated financial statements for the quarter were prepared using the same accounting policies as the audited consolidated financial statements for the year ended October 31, 2018 with the exception of the adoption of IFRS 9 and IFRS 15 Revenue from Contracts with Customers (IFRS 15) on November 1, 2018.
As permitted by IFRS 9, CWB has not restated prior period comparative figures and has recognized an adjustment to opening retained earnings and AOCI to reflect the application of the new requirements at the adoption date. The application of the impairment requirements of IFRS 9 was the most significant change for CWB. Under IFRS 9, allowances for credit losses related to performing loans are estimated using an ECL approach that incorporates a number of underlying assumptions which involve a high degree of management judgement and can have a significant impact on financial results. The allowance for credit losses is CWB’s most significant accounting estimate. For further details, refer to Notes 2 and 3 of the interim consolidated financial statements.
CWB adopted IFRS 15 using the modified retrospective approach and has concluded that there is no significant impact in relation to the adoption of IFRS 15. For further details, refer to Note 2 of the interim consolidated financial statements.
Future Accounting Changes
A number of standards and amendments have been issued by the International Accounting Standards Board (IASB) and are described in further detail in CWB’s 2018 Annual Report. These standards and amendments may impact the presentation of financial statements in the future and management is currently reviewing these changes to determine the impact, if any. CWB continues to monitor the IASB’s proposed changes to IFRS.
Controls and Procedures
On November 1, 2018, CWB adopted IFRS 9 and updated or modified certain internal controls over financial reporting as a result of the new accounting standard. There were no significant changes in CWB’s disclosure controls and procedures and internal controls over financial reporting that occurred during the quarter ended April 30, 2019 that have materially affected, or are reasonably likely to materially affect, CWB’s disclosures of required information and internal controls over financial reporting. Prior to its release, this quarterly report to shareholders was reviewed by the Audit Committee and, on the Audit Committee’s recommendation, approved by the Board of Directors of CWB.
Third-party Credit Ratings
DBRS Limited (DBRS) maintains published credit ratings on CWB’s senior debt, short-term debt, subordinated debentures and preferred shares of “A (low)”, “R1 (low)”, “BBB (high)” and “Pfd-3”, respectively, all with a stable outlook. Credit ratings do not consider market price or address the suitability of any financial instrument for a particular investor and are not recommendations to purchase, sell or hold securities. Ratings are subject to revision or withdrawal at any time by the rating organization. Management believes the ratings widen the base of clients and investors who can participate in CWB’s offerings, while also lowering overall funding costs and the cost of capital.
Updated Share Information
As at May 22, 2019, there were 87,239,059 common shares and 2,734,160 stock options outstanding. For additional information on share capital and stock options, see Notes 17 and 18 of the audited annual consolidated financial statements for the year ended October 31, 2018 and Notes 9 and 10 to the interim consolidated financial statements for this quarter.

CWB 2019 Second Quarter Report 21
Management’s Discussion and Analysis
Dividend Reinvestment Plan
CWB common shares (TSX: CWB) and preferred shares (TSX: CWB.PR.B; CWB.PR.C; CWB.PR.D) are deemed eligible by CWB to participate in CWB’s dividend reinvestment plan (the Plan). The Plan provides holders of eligible shares of CWB the opportunity to direct cash dividends toward the purchase of CWB common shares. Further details for the Plan are available on CWB’s website.
Summary of Quarterly Financial Information
2019 2018 2017
($ thousands) Q2 Q1 Q4 Q3 Q2 Q1 Q4 Q3
Total revenue $ 209,828 $ 212,439 $ 208,566 $ 204,989 $ 196,586 $ 193,217 $ 195,122 $ 183,843 Common shareholders’ net
income 61,965
66,499
64
4
64,501
62,362
60,464
61,929
60,833
56,308
Earnings per common share Basic 0.71
0
0.75 0.73 0.70 0.68 0.70 0.69 0.64 Diluted 0.71 0.75 0.72 0.70 0.68 0.69 0.68 0.64 Adjusted cash 0.74 0.80 0.78 0.75 0.73 0.75 0.74 0.69 Total assets ($ millions) 30,054 29,349 29,021 28,170 28,134 27,914 26,447 23,345
The financial results for each of the last eight quarters are summarized above. In general, CWB’s performance reflects a relatively consistent trend, although the second quarter contains three fewer revenue-earning days in non-leap years. Total revenue in the first, third and fourth quarters of 2018 and the fourth quarter of 2017 include the impact of gains related to the CWT strategic transactions.
For additional details on variations between the prior quarters, refer to the summary of quarterly results section of CWB’s annual MD&A for the years ended October 31, 2018 and 2017, and the individual quarterly reports to shareholders which are available on SEDAR at www.sedar.com and on CWB’s website at www.cwb.com.

CWB 2019 Second Quarter Report 22
Management’s Discussion and Analysis
Non-IFRS Measures
CWB uses a number of financial measures to assess its performance against strategic initiatives and operational benchmarks. Non-IFRS measures provide readers with an enhanced understanding of how management views CWB’s ongoing operating performance. These measures may also provide readers with the ability to analyze trends related to profitability and effectiveness of CWB’s operations and strategies, and determine compliance against regulatory standards. To arrive at certain non-IFRS measures, CWB makes adjustments to the reported results. Adjustments relate to items which management believe are not indicative of underlying operating performance. CWB believes that adjusted results provide the reader with a better understanding of how management views its performance. Some of these financial measures do not have standardized meanings prescribed by IFRS and therefore may not be comparable to similar measures presented by other financial institutions. The non-IFRS measures used in this MD&A are calculated as follows:
adjusted non-interest expenses – total non-interest expenses, excluding the pre-tax amortization of acquisition-related intangible assets (see calculation below);
adjusted common shareholders’ net income – total common shareholders’ net income, excluding the amortization of acquisition-related intangible assets and contingent consideration fair value changes, net of tax (see calculation below);
pre-tax, pre-provision income – total revenue less adjusted non-interest expenses (see calculation below);
adjusted cash earnings per common share – diluted earnings per common share calculated with adjusted common shareholders’ net income;
return on common shareholders’ equity – annualized common shareholders’ net income divided by average common shareholders’ equity;
adjusted return on common shareholders’ equity – annualized adjusted common shareholders’ net income divided by average common shareholders’ equity;
return on assets – annualized common shareholders’ net income divided by average total assets;
efficiency ratio – adjusted non-interest expenses divided by total revenue;
net interest margin – annualized net interest income divided by average total assets;
provision for credit losses on total loans as a percentage of average loans – annualized provision for credit losses on loans, committed but undrawn credit exposures and letters of credit divided by average total loans. Provisions for credit losses related to debt securities measured at FVOCI and other financial assets are excluded;
provision for credit losses on impaired loans as a percentage of total loans – annualized provision for credit losses on impaired loans divided by average total loans;
operating leverage – growth rate of total revenue less growth rate of adjusted non-interest expenses;
common share dividend payout ratio – common share dividends declared during the past twelve months divided by common shareholders’ net income earned over the same period;
Basel III common equity Tier 1, Tier 1 and Total capital ratios – in accordance with guidelines issued by OSFI;
risk-weighted assets – on and off-balance sheet assets assigned a risk weighting calculated in accordance with the Standardized approach guidelines issued by OSFI; and
average balances – average daily balances.
Adjusted Financial Measures
For the three months ended Change from
April 30 2018
For the six months ended Change from
April 30 2018
(unaudited) April 30 2019
January 31 2019
April 30 2018
April 30 2019
April 30 2018
($ thousands)
Non-interest expenses $ 99,412 $ 95,643 $ 91,120 9 % $ 195,055 $ 179,037 9 %
Adjustments (before tax):
Amortization of acquisition-related
intangible assets (1,276) (1,277) (1,781) (28) (2,553) (3,545) (28)
Adjusted non-interest expenses $ 98,136 $ 94,366 $ 89,339 10 % $ 192,502 $ 175,492 10 %
Common shareholders’ net income $ 61,965 $ 66,499 $ 60,464 2 % $ 128,464 $ 122,393 5 %
Adjustments (after-tax)
Acquisition-related fair value changes 2,144 3,629 3,749 (43) 5,773 7,389 (22) Amortization of acquisition-related
intangible assets 943 943 1,315 (28) 1,886 2,659 (29)
Adjusted common shareholders’ net income $ 65,052 $ 71,071 $ 65,528 (1) % $ 136,123 $ 132,441 3 %
Pre-tax, pre-provision income
For the three months ended Change from
April 30
2018
For the six months ended Change from
April 30
2018
(unaudited) April 30
2019
January 31
2019
April 30
2018
April 30
2019
April 30
2018
($ thousands)
Total revenue $ 209,828 $ 212,439 $ 196,586 7 % $ 422,267 $ 389,803 8 %
Less: Adjusted non-interest expenses (see
above) 98,136
94,366
89,339
10 192,502 175,492 10
Pre-tax, pre-provision income $ 111,692 $ 118,073 $ 107,247 4 % $ 229,765 $ 214,311 7 %

CWB 2019 Second Quarter Report 23
Consolidated Balance Sheets
As at
April 30 2019(1)
As at
January 31 2019(1)
As at
October 31 2018
As at
April 30 2018
Change from
April 30 2018
(unaudited) ($ thousands)
Assets
Cash Resources
Cash and non-interest bearing deposits with financial institutions $ 91,394 $ 15,681 $ 73,822 $ - 100 %
Interest bearing deposits with regulated financial institutions (Note 5) 366,635 223,476 26,825 231,890 58 Cheques and other items in transit 4,967 12,044 52,574 - 100
462,996 251,201 153,221 231,890 100
Securities (Note 5)
Issued or guaranteed by Canada 1,006,225 1,121,504 1,325,816 1,562,377 (36)
Issued or guaranteed by a province or municipality 479,944 421,615 521,825 542,297 (11) Other debt securities 150,412 186,023 143,536 361,468 (58)
Preferred shares 43,134 56,294 93,575 98,733 (56)
1,679,715 1,785,436 2,084,752 2,564,875 (35)
Securities Purchased under Resale Agreements 116,936 - - 12,843 811
Loans (Note 6)
Personal 5,407,492 5,268,104 5,247,160 4,974,101 9
Business 21,945,145 21,619,464 21,085,968 19,942,141 10
27,352,637 26,887,568 26,333,128 24,916,242 10
Allowance for credit losses (Note 6) (112,595) (106,951) (128,529) (122,891) (8)
27,240,042 26,780,617 26,204,599 24,793,351 10
Other
Property and equipment 57,731 58,195 59,098 55,491 4
Goodwill 85,280 85,168 85,168 85,084 - Intangible assets 164,590 161,320 160,790 153,201 7
Derivative related 45,437 23,589 2,496 9,384 384
Other assets 201,454 203,092 271,339 228,084 (12)
554,492 531,364 578,891 531,244 4
Total Assets $ 30,054,181 $ 29,348,618 $ 29,021,463 $ 28,134,203 7 %
Liabilities and Equity Deposits (Note 7)
Personal $ 15,512,802 $ 15,142,430 $ 14,483,686 $ 13,850,248 12 %
Business and government 9,205,371 8,767,813 9,216,271 8,978,611 3
24,718,173 23,910,243 23,699,957 22,828,859 8
Other Cheques and other items in transit 29,260 37,908 28,489 74,230 (61)
Securities sold under repurchase agreements (Note 8) - 48,856 95,126 178,005 (100)
Derivative related 18,981 27,140 69,581 50,145 (62)
Other liabilities 548,035 506,453 531,953 474,313 16
596,276 620,357 725,149 776,693 (23)
Debt Debt related to securitization activities (Note 8) 1,637,541 1,787,066 1,757,854 1,754,306 (7)
Subordinated debentures 250,000 250,000 250,000 250,000 -
1,887,541 2,037,066 2,007,854 2,004,306 (6)
Equity
Preferred shares (Note 9) 390,000 390,000 265,000 265,000 47
Common shares (Note 9) 731,339 730,550 744,701 741,462 (1) Retained earnings 1,705,712 1,672,403 1,649,196 1,567,671 9
Share-based payment reserve 24,664 24,351 23,937 23,743 4
Accumulated other comprehensive income (1,317) (38,896) (97,082) (76,293) (98)
Total Shareholders’ Equity 2,850,398 2,778,408 2,585,752 2,521,583 13
Non-controlling interests 1,793 2,544 2,751 2,762 (35)
Total Equity 2,852,191 2,780,952 2,588,503 2,524,345 13
Total Liabilities and Equity $ 30,054,181 $ 29,348,618 $ 29,021,463 $ 28,134,203 7 %
(1) Amounts for fiscal 2019 have been prepared in accordance with IFRS 9 Financial Instruments (IFRS 9) (refer to Notes 2 and 3). Fiscal 2018 comparatives have been prepared
in accordance with IAS 39 Financial Instruments: Classification and Measurement (IAS 39) and have not been restated.
The accompanying notes are an integral part of the interim consolidated financial statements.

CWB 2019 Second Quarter Report 24
Consolidated Statements of Income
For the three months ended Change from April 30
2018
For the six months ended Change from April 30
2018
(unaudited) April 30
2019(1)
January 31
2019(1)
April 30
2018
April 30
2019(1)
April 30
2018
($ thousands, except per share amounts)
Interest Income (Note 14)
Loans $ 334,390 $ 336,249 $ 287,328 16 % $ 670,639 $ 560,872 20 %
Securities 6,755 7,978 9,909 (32) 14,733 18,800 (22)
Deposits with regulated financial institutions
2,018
1,765
781
158
3,783
2,763
37
343,163 345,992 298,018 15 689,155 582,435 18
Interest Expense
Deposits 138,389 138,879 107,980 28 277,268 212,227 31
Debt 13,717 13,771 12,052 14 27,488 20,955 31
152,106 152,650 120,032 27 304,756 233,182 31
Net Interest Income 191,057 193,342 177,986 7 384,399 349,253 10
Non-interest Income
Credit related 7,966 8,346 7,774 2 16,312 15,667 4
Wealth management services 4,931 4,842 5,046 (2) 9,773 10,088 (3)
Retail services 2,755 2,592 2,472 11 5,347 5,235 2
Trust services 1,885 1,884 1,911 (1) 3,769 4,088 (8)
Gains on securities, net (Note 5) 50 244 17 194 294 24 nm
Other 1,184 1,189 1,380 (14) 2,373 5,448 (56)
18,771 19,097 18,600 1 37,868 40,550 (7)
Total Revenue 209,828 212,439 196,586 7 422,267 389,803 8
Provision for Credit Losses (Note 6) 15,188 16,193 11,946 27 31,381 22,507 39
Acquisition-related Fair
Value Changes (Note 12)
2,916
4,938
5,100
(43)
7,854
10,053
(22)
Non-interest Expenses
Salaries and employee benefits 64,237 62,377 58,345 10 126,614 116,448 9
Premises and equipment 17,692 17,004 15,804 12 34,696 30,705 13
Other expenses 17,483 16,262 16,971 3 33,745 31,884 6
99,412 95,643 91,120 9 195,055 179,037 9
Net Income before Income Taxes 92,312 95,665 88,420 4 187,977 178,206 5
Income taxes 24,622 25,360 24,147 2 49,982 48,154 4
Net Income 67,690 70,305 64,273 5 137,995 130,052 6
Net income attributable to
non-controlling interests 247 243 247 - 490 534 (8)
Shareholders’ Net Income 67,443 70,062 64,026 5 137,505 129,518 6
Preferred share dividends 5,478 3,563 3,562 54 9,041 7,125 27
Common Shareholders’ Net Income $ 61,965 $ 66,499 $ 60,464 2 % $ 128,464 $ 122,393 5 %
Average number of common
shares (in thousands) 87,219 88,386 88,794 (2) % 87,812 88,710 (1) %
Average number of diluted common
shares (in thousands) 87,395 88,515 89,222 (2) 87,964 89,235 (1)
Earnings Per Common Share
Basic $ 0.71 $ 0.75 $ 0.68 4 % $ 1.46 $ 1.38 6 %
Diluted 0.71 0.75 0.68 4 1.46 1.37 7
(1) Amounts for fiscal 2019 have been prepared in accordance with IFRS 9 (refer to Notes 2 and 3). Fiscal 2018 comparatives have been prepared in accordance with IAS 39
and have not been restated.
nm – not meaningful
The accompanying notes are an integral part of the interim consolidated financial statements.

CWB 2019 Second Quarter Report 25
Consolidated Statements of Comprehensive Income
For the three months ended For the six months ended
(unaudited) ($ thousands)
April 30 2019(1)
April 30 2018
April 30 2019(1)
April 30 2018
Net Income $ 67,690 $ 64,273 $ 137,995 $ 130,052
Other Comprehensive Income (Loss), net of tax
Items that will be subsequently reclassified to net income
Debt securities measured at fair value through other comprehensive income
(2018: Available-for-sale debt and equity securities)
Gains (losses) from change in fair value(2) 9,840 (4,359) 27,651 (13,581)
Reclassification to net income(3) (62) (12) (279) (17)
9,778 (4,371) 27,372 (13,598)
Derivatives designated as cash flow hedges
Gains (losses) from change in fair value(4) 24,499 1,797 68,338 (12,651)
Reclassification to net income(5) (172) 1,006 191 (591)
24,327 2,803 68,529 (13,242)
Items that will not be subsequently reclassified to net income
Losses on equity securities designated at fair value through other comprehensive income(6) (799) n/a (11,325) n/a
33,306 (1,568) 84,576 (26,840)
Comprehensive Income for the Period $ 100,996 $ 62,705 $ 222,571 $ 103,212
Comprehensive income for the period attributable to:
Shareholders $ 100,749 $ 62,458 $ 222,081 $ 102,678 Non-controlling interests 247 247 490 534
Comprehensive Income for the Period $ 100,996 $ 62,705 $ 222,571 $ 103,212
(1) Amounts for fiscal 2019 have been prepared in accordance with IFRS 9 (refer to Notes 2 and 3). Fiscal 2018 comparatives have been prepared in accordance with IAS 39
and have not been restated. (2) Net of income tax of $3,496 and $10,175 for the three and six months ended April 30, 2019, respectively (2018 – $1,662 and $5,038). (3) Net of income tax of $23 and $103 for the three and six months ended April 30, 2019, respectively (2018 – $5 and $7). (4) Net of income tax of $9,062 and $25,276 for the three and six months ended April 30, 2019, respectively (2018 – $637 and $4,679). (5) Net of income tax of $64 and $70 for the three and six months ended April 30, 2019, respectively (2018 – $369 and $219). (6) Net of income tax of $299 and $4,106 for the three and six months ended April 30, 2019, respectively (2018 – n/a).
n/a – not applicable
The accompanying notes are an integral part of the interim consolidated financial statements.

CWB 2019 Second Quarter Report 26
Consolidated Statements of Changes in Equity
For the six months ended
(unaudited) April 30
2019(1)
April 30
2018 ($ thousands)
Preferred Shares (Note 9) Balance at beginning of period $ 265,000 $ 265,000
Issued 125,000 -
Balance at end of period 390,000 265,000
Common Shares (Note 9)
Balance at beginning of period 744,701 731,885
Purchased for cancellation (14,798) - Issued under dividend reinvestment plan 1,350 1,644
Transferred from share-based payment reserve on the exercise or exchange of options 86 2,183
Issued on acquisition-related contingent consideration instalment payment (Note 12) - 5,750
Balance at end of period 731,339 741,462
Retained Earnings
Balance at beginning of period under IAS 39 1,649,196 1,488,634 Impact of adopting IFRS 9 on November 1, 2018 (Note 3) 22,514 n/a
Balance at beginning of period under IFRS 9 1,671,710 n/a
Shareholders’ net income 137,505 129,518
Dividends – Preferred shares (9,041) (7,125)
– Common shares (46,614) (43,481) Net premium on common shares purchased for cancellation (Note 9) (33,036) -
Realized losses reclassified from accumulated other comprehensive income (Note 5) (10,969) n/a
Issuance costs on preferred shares (3,007) -
Increase (decrease) attributable to non-controlling interests ownership change (836) 125
Balance at end of period 1,705,712 1,567,671
Share-based Payment Reserve
Balance at beginning of period 23,937 24,979
Amortization of fair value of options (Note 10) 813 947
Transferred to common shares on the exercise or exchange of options (86) (2,183)
Balance at end of period 24,664 23,743
Accumulated Other Comprehensive Income Debt securities measured at fair value through other comprehensive income (2018: Available-for-sale debt and equity securities)
Balance at beginning of period under IAS 39 (48,962) (29,175)
Impact of adopting IFRS 9 on November 1, 2018 (Note 3) 12,994 n/a
Balance at beginning of period under IFRS 9 (35,968) n/a
Other comprehensive income (loss) 27,372 (13,598)
Balance at end of period (8,596) (42,773)
Derivatives designated as cash flow hedges
Balance at beginning of period (48,120) (20,278)
Other comprehensive income (loss) 68,529 (13,242)
Balance at end of period 20,409 (33,520)
Equity securities designated at fair value through other comprehensive income
Impact of adopting IFRS 9 on November 1, 2018 (Note 3) (12,774) n/a
Balance at beginning of period under IFRS 9 (12,774) n/a Other comprehensive loss (11,325) n/a
Realized losses reclassified to retained earnings (Note 5) 10,969 n/a
Balance at end of period (13,130) n/a
Total Accumulated Other Comprehensive Income (1,317) (76,293)
Total Shareholders’ Equity 2,850,398 2,521,583
Non-Controlling Interests
Balance at beginning of period 2,751 2,797 Net income attributable to non-controlling interests 490 534
Dividends to non-controlling interests (618) (882)
Partial ownership (increase) decrease (830) 313
Balance at end of period 1,793 2,762
Total Equity $ 2,852,191 $ 2,524,345
(1) Amounts for fiscal 2019 have been prepared in accordance with IFRS 9 (refer to Notes 2 and 3). Fiscal 2018 comparatives have been prepared in accordance with
IAS 39 and have not been restated.
n/a – not applicable
The accompanying notes are an integral part of the interim consolidated financial statements.

CWB 2019 Second Quarter Report 27
Consolidated Statements of Cash Flows
For the six months ended
(unaudited) April 30 2019(1)
April 30 2018(2) ($ thousands)
Cash Flows from Operating Activities
Net income $ 137,995 $ 130,052
Adjustments to determine net cash flows:
Current income taxes receivable and payable, net 38,256 (3,209) Accrued interest receivable and payable, net 36,059 25,786
Provision for credit losses (Note 6) 31,381 22,507
Depreciation and amortization 16,128 14,873
Fair value change in contingent consideration (Note 12) 7,854 10,053 Deferred income taxes, net (4,170) (8,054)
Amortization of fair value of employee stock options (Note 10) 813 947
Gains on securities, net (294) (24)
Net gain on CWT strategic transactions (Note 4) - (3,009) Change in operating assets and liabilities:
Deposits, net 1,018,216 925,877
Loans, net (1,048,930) (1,583,483)
Securities sold under repurchase agreements, net (95,126) 119,647
Securities purchased under resale agreements, net (116,936) (12,843) Debt related to securitization activities, net (120,313) 527,970
Other items, net (2,242) (828)
(101,309) 166,262
Cash Flows from Financing Activities
Dividends (54,305) (48,962) Dividends to non-controlling interests (618) (882)
Common shares purchased for cancellation (Note 9) (47,834) -
Preferred shares issued, net of issuance costs (Note 9) 121,993 -
Purchases from non-controlling interests (2,182) -
Contributions by non-controlling interests 459 1,479
17,513 (48,365)
Cash Flows from Investing Activities
Interest bearing deposits with regulated financial institutions, net (339,810) 272,005
Securities, purchased (1,662,205) (1,937,165)
Securities, sale proceeds 801,472 775,231 Securities, matured 1,309,136 767,820
Property, equipment and intangible assets (18,235) (18,183)
Acquisition-related contingent consideration payments (Note 12) (37,368) (17,250)
Proceeds from CWT strategic transactions (Note 4) - 3,059
52,990 (154,483)
Change in Cash and Cash Equivalents (30,806) (36,586) Cash and Cash Equivalents at Beginning of Period 97,907 (37,644)
Cash and Cash Equivalents at End of Period * $ 67,101 $ (74,230)
* Represented by:
Cash and non-interest bearing deposits with financial institutions $ 91,394 $ -
Cheques and other items in transit (included in Cash Resources) 4,967 -
Cheques and other items in transit (included in Other Liabilities) (29,260) (74,230)
Cash and Cash Equivalents at End of Period $ 67,101 $ (74,230)
Supplemental Disclosure of Cash Flow Information
Interest and dividends received $ 700,126 $ 588,389
Interest paid 271,932 202,840
Income taxes paid 46,703 48,072
(1) Amounts for fiscal 2019 have been prepared in accordance with IFRS 9 (refer to Notes 2 and 3). Fiscal 2018 comparatives have been prepared in accordance with
IAS 39 and have not been restated. (2) During the period ended April 30, 2019, debt related to securitization activities was reclassified from Financing Activities to Operating Activities. Comparative figures
have been reclassified to conform to the current period presentation.
The accompanying notes are an integral part of the interim consolidated financial statements.

CWB 2019 Second Quarter Report 28
Notes to Interim Consolidated Financial Statements
(unaudited) ($ thousands, unless otherwise noted)
1. Basis of Presentation and Significant Accounting Policies
These unaudited condensed interim consolidated financial statements of Canadian Western Bank (CWB) have been prepared in accordance with International Accounting Standard (IAS) 34 Interim Financial Reporting as issued by the International Accounting Standards Board (IASB) using the same accounting policies as the audited consolidated financial statements for the year ended October 31, 2018, with the exception of the adoption of International Financial Reporting Standard (IFRS) 9 Financial Instruments (IFRS 9) and IFRS 15 Revenue from Contracts with Customers (IFRS 15) as discussed in Note 2. These interim consolidated financial statements of CWB, domiciled in Canada, have also been prepared in accordance with subsection 308 (4) of the Bank Act and the accounting requirements of the Office of the Superintendent of Financial Institutions Canada (OSFI). Under IFRS, additional disclosures are required in annual financial statements and accordingly, these unaudited interim consolidated financial statements should be read in conjunction with the audited consolidated financial statements for the year ended October 31, 2018.
The interim consolidated financial statements were authorized for issue by the Board of Directors on May 28, 2019.
2. Changes in Accounting Policies
(a) IFRS 9 Financial Instruments
CWB adopted IFRS 9 effective November 1, 2018, which replaces IAS 39 Financial Instruments: Recognition and Measurement (IAS 39). The adoption of IFRS 9 resulted in changes in accounting policies primarily related to the classification, measurement and impairment of financial assets. Classification of CWB’s financial liabilities is unchanged. To facilitate a better understanding of CWB’s interim consolidated financial statements, additional information on significant accounting policy changes related to the transition to IFRS 9 are described in Notes 3, 5 and 6.
IFRS 9 was applied on a retrospective basis and as permitted, prior period comparatives were not restated. Upon transition, an adjustment to opening retained earnings and accumulated other comprehensive income (AOCI) was recorded to reflect the application of the new requirements at the adoption date. Refer to Note 3 for further details on the impact of the transition to the opening balance sheet on November 1, 2018.
CWB has elected to continue to apply the hedge accounting requirements of IAS 39. Our policy for hedge accounting is described in Note 12 of the audited consolidated financial statements for the year ended October 31, 2018 (see page 95 of the 2018 Annual Report).
i) Classification and Measurement of Financial Assets
Initial Recognition and Measurement
Financial assets consist of both debt and equity instruments. Under IFRS 9, financial assets are initially recognized at fair value and subsequently measured at fair value through profit and loss (FVTPL), fair value through other comprehensive income (FVOCI) or amortized cost.
Derivatives continue to be measured at FVTPL under IFRS 9, except to the extent that they are designated in a hedging relationship, in which case the IAS 39 hedge accounting requirements continue to apply as described in Note 12 of the audited consolidated financial statements for the year ended October 31, 2018 (see page 95 of the 2018 Annual Report).
Debt Instruments
Debt instruments, including loans and debt securities, are initially measured at fair value and are subsequently classified and measured at FVTPL, FVOCI or amortized cost based on the contractual cash flow characteristics of the instrument and the business model under which the asset is held.
The intent of the assessment of the contractual cash flow characteristics of an instrument is to determine if contractual payments to be received represent solely principal and interest (SPPI), consistent with a basic lending arrangement. Principal, for the purposes of the test, is defined as the fair value of the instrument at initial recognition and is subject to change over its life due to transactions such as repayments and amortization of related premiums or discounts. Interest represents consideration for the time value of money, credit risk, other basic lending risks and costs, such as liquidity risk and administrative costs, as well as a profit margin. Contractual terms that introduce risks or volatility that are unrelated to a basic lending arrangement do not represent cash flows that are SPPI and as a result, the related financial asset is classified and measured at FVTPL.

CWB 2019 Second Quarter Report 29
Notes to Interim Consolidated Financial Statements
For debt instruments that meet the requirements of the SPPI test, classification at initial recognition is determined based on the business model under which the assets are managed. Considerations include how performance of the debt instruments is evaluated, the risks that affect the performance of the business model, and how those risks are managed, and the manner in which management is compensated. Potential business models are as follows:
Held to collect: Objective is to collect contractual cash flows.
Held to collect and sell: Objective is to both collect contractual cash flows and sell the financial assets.
Held for sale or other business models: Encompasses all other business models. CWB does not currently hold assets within this category.
The use of judgment is required in assessing both the contractual cash flow characteristics and the business model of debt instruments.
Measured at Amortized Cost
Debt instruments measured at amortized cost are managed under a ‘held to collect’ business model and have contractual cash flows that satisfy the requirements of the SPPI test. These financial assets are initially measured at fair value, net of transaction costs, and are subsequently measured at amortized cost using the effective interest rate method, net of allowances for credit losses estimated based on the expected credit loss
(ECL) approach.
Measured at Fair Value through Other Comprehensive Income
Debt instruments measured at FVOCI, which are managed under a ‘held to collect and sell’ business model and have contractual cash flows that represent SPPI, are initially recorded at fair value, net of transaction costs. Subsequent to initial recognition, unrealized gains and losses related to the debt instruments are recorded in other comprehensive income (OCI), net of tax. Impairment losses and recoveries, estimated using an ECL approach, are recognized in the consolidated statements of income and correspondingly reduce the accumulated changes in fair value recorded in OCI. Gains and losses realized on disposal of debt instruments classified at FVOCI are included in the consolidated statements of income.
Equity Instruments
Equity instruments are classified and measured at FVTPL unless an irrevocable election is made to designate non-trading instruments at FVOCI at the time of initial recognition. If the election is applied, unrealized gains and losses are recorded in OCI, net of tax, and are not subsequently reclassified to the consolidated statements of income. When realized, gains and losses that arise upon derecognition are reclassified from AOCI to retained earnings. Equity securities are not subject to an impairment assessment under IFRS 9.
ii) Impairment
Expected Credit Loss Approach
IFRS 9 introduces an ECL approach to estimate allowances for credit losses that is applicable for financial assets measured at amortized cost, debt securities measured at FVOCI, and certain off-balance sheet loan commitments and financial guarantee contracts which were previously provided for under IAS 37 Provisions, Contingent Liabilities and Contingent Assets (IAS 37). The implementation of an ECL approach under IFRS 9, which results in the recognition of allowances for credit losses on financial assets regardless of whether an actual loss event has occurred, is a significant change from the incurred loss model under IAS 39 as described in Note 8 of the audited consolidated financial statements for the year ended October 31, 2018 (see page 90 of the 2018 Annual Report).
The ECL approach categorizes financial assets into three stages based on changes in credit risk since inception. A financial asset can move between stages depending on improvement or deterioration of credit risk.
Performing Assets
Stage 1: From initial recognition until the date on which the financial asset experiences a significant increase in credit risk (SICR), the allowance for credit losses is measured based on ECL from defaults occurring in the 12 months following the reporting date.
Stage 2: A financial asset migrates to Stage 2 when it experiences a SICR since initial recognition and the allowance for credit losses is measured based on ECL from defaults occurring over the remaining life of the asset.

CWB 2019 Second Quarter Report 30
Notes to Interim Consolidated Financial Statements
Impaired Assets
Stage 3: When a financial asset is identified as credit-impaired, it migrates to Stage 3 and an allowance for credit losses equal to full lifetime ECL is recognized. Interest income is recognized on the carrying amount of the asset, net of the allowance for credit losses.
ECL represents the discounted probability-weighted estimate of cash shortfalls expected to result from defaults over the relevant time horizon. ECL estimations are a function of the probability of default (PD), loss given default (LGD) and exposure at default (EAD). PD, which represents the estimate of the likelihood of default, considers past events, current market conditions and forward-looking information over the relevant time horizon. LGD represents an estimate of loss arising from default based on the difference between the contractual cash flows due and those that CWB expects to receive, including consideration for the amount and quality of collateral held. EAD represents an estimate of the exposure at a future default date, taking into account estimated future repayments of principal and draws on committed facilities.
For most financial assets, ECL is estimated on an individual basis. Financial assets for which allowances for credit losses are estimated on a collective basis are grouped based on similar credit risk characteristics.
As part of the transition to IFRS 9, CWB updated governance frameworks impacted by the transition to IFRS 9 and implemented new controls related to key processes and significant areas of judgment. An Expected
Credit Loss Committee, which includes senior management representation from Risk, Finance and the business was established to provide oversight to the IFRS 9 impairment process. The Expected Credit Loss Committee is responsible to review key inputs and assumptions used in ECL estimates and assess the appropriateness of performing loan allowances for credit losses.
Forward-looking Information
The estimation of ECL and the assessment of SICR consider information about past events and current conditions as well as reasonable and supportable projections of future events and economic conditions. The estimation and application of forward-looking information requires significant judgment.
With consideration of several external sources of information, CWB formulates a base case view of the future direction of relevant macroeconomic variables, which is updated quarterly. A representative range of other possible forecast scenarios is developed to incorporate multiple probability-weighted outcomes. The base case scenario represents the best estimate of forecast macroeconomic variables while other scenarios represent more optimistic or pessimistic outcomes.
Additional information regarding the incorporation of forward-looking information and the related judgment and estimation involved in the process is described in Note 6.
Assessment of Significant Increases in Credit Risk
At each reporting date, CWB assesses whether a financial asset has experienced a SICR since initial recognition by comparing the risk of a default occurring over the asset’s remaining expected life at the reporting date and the date of initial recognition.
The assessment of changes in credit risk is performed at least quarterly, generally at the instrument level. Significant judgment is also required in the application of SICR thresholds. The thresholds used to define SICR are reviewed and assessed at least annually, unless there is a material change in credit risk management practices that prompts a more frequent review, and are expected to change infrequently.
Refer to Note 6 for additional information regarding the assessment of SICR.
Expected Life
When measuring ECL, CWB considers the maximum contractual period over which an exposure to credit risk exists. For most instruments, the expected life is limited to the remaining contractual life, including prepayment and extension options. For certain revolving credit facilities, the expected life is estimated based on the period over which CWB is exposed to credit risk and how credit losses are mitigated by management actions.

CWB 2019 Second Quarter Report 31
Notes to Interim Consolidated Financial Statements
Modified Financial Assets
The original terms of a financial asset may be renegotiated or otherwise modified, resulting in an impact to contractual cash flows. In particular, in an effort to minimize CWB’s realized losses, modifications may be granted in situations where a borrower experiences financial difficulty. Modifications may include payment deferrals, extension of amortization periods, interest rate reductions, principal forgiveness, debt consolidation or forbearance. If it is determined that the modification results in expiry of cash flows, the original asset is derecognized and a new asset is recognized based on the new contractual terms.
Where a modification does not result in derecognition, the gross carrying amount of the financial asset is recalculated as the present value of the renegotiated or modified contractual cash flows, discounted at the original effective interest rate, and a gain or loss is recognized immediately in the consolidated statements of income. The financial asset continues to be subject to the same assessment for SICR relative to initial recognition. Expected cash flows arising from the modified contractual terms are considered when estimating ECL for the modified asset. Financial assets that are modified while having an allowance for credit losses equal to lifetime ECL may revert to having to an allowance for credit losses equal to 12-month ECL after a period of performance and improvement in the borrower's financial condition.
Definition of Default
The definition of default used in the estimation of ECL is consistent with the definition of default used for internal credit risk management purposes. Loans are determined to be in default and classified as impaired when payments are contractually past due 90 days or more, where CWB has commenced realization proceedings, or where CWB is of the opinion that the loan should be regarded as impaired based on objective evidence. Objective evidence that a loan is impaired may include significant financial difficulty of a borrower, default or delinquency of a borrower, breach of loan covenants or conditions, or indications that a borrower will enter bankruptcy.
The determination of impairment under IFRS 9 is generally consistent with the definition under IAS 39, with one exception. Under IAS 39, residential mortgages guaranteed or insured for both principal and interest by the Canadian government, a province or a Canadian government agency and loans that are fully secured and in the process of collection are not classified as impaired until payments are 365 days and 180 days in arrears, respectively. Under IFRS 9, all loans are classified as impaired when payments are contractually past due 90 or more days.
Financial assets are reviewed on an ongoing basis to assess whether any should be classified as impaired. Loans that have become impaired are monitored closely by a specialized team with regular reviews of each loan and its realization plan. Impaired loans are returned to performing status when the timely collection of both principal and interest is reasonably assured and all delinquent principal and interest payments are brought current.
Write-offs
Financial assets are written off, either partially or in full, against the related allowance for credit losses when CWB concludes that there is no realistic prospect of future recovery in respect of those amounts. When financial instruments are secured, this is generally after all collateral has been realized or transferred to CWB, or in certain circumstances, when the net realizable value of any collateral and other available information suggests that there is no reasonable expectation of further recovery. In subsequent periods, any recoveries of amounts previously written off are recorded as a reduction to the provision for credit losses in the consolidated statements of income.
(b) IFRS 15 Revenue from Contracts with Customers
IFRS 15 was issued in May 2014, and replaces IAS 18 Revenue, IAS 11 Construction Contracts and related Interpretations. IFRS 15 provides a single, principles based five-step model that applies to all contracts with customers. The standard excludes from its scope revenue arising from items such as financial instruments and leases as these fall within the scope of other IFRSs. CWB has performed a detailed analysis on each revenue stream that is within the scope of the new standard. CWB adopted IFRS 15 using the modified retrospective approach and has concluded that there is no significant impact in relation to the adoption of IFRS 15.
(c) Future Accounting Changes
CWB continues to monitor the IASB’s proposed changes to accounting standards. Although not expected to materially impact CWB’s 2019 consolidated financial statements, these proposed changes may have a significant impact on future financial statements. Additional discussion on certain accounting standards that may impact CWB is included in Note 1 of the audited consolidated financial statements for the year ended October 31, 2018 (see page 85 of the 2018 Annual Report).

CWB 2019 Second Quarter Report 32
Notes to Interim Consolidated Financial Statements
3. Transition to IFRS 9
Reconciliation of IAS 39 to IFRS 9
The following table details the impact of the transition to IFRS 9 on the consolidated balance sheet as at November 1, 2018. Reclassification adjustments reflect the movement of assets between measurement categories with no impact to shareholders’ equity or change to the assets’ carrying value. Remeasurement adjustments, which include changes to allowances for credit losses related to the adoption of the impairment requirements of IFRS 9, result in a change to the carrying value of the assets and an impact to shareholders’ equity, net of tax. Refer to Note 2 for additional information regarding accounting policy changes related to the transition to IFRS 9.
IAS 39
Measurement Category
IFRS 9
Measurement Category
IAS 39
Carrying
Value as at
October 31, 2018
Re- classification
Re- measurement
IFRS 9
Carrying
Value as at
November 1, 2018
Assets
Cash resources Amortized cost Amortized cost $ 126,396 $ - $ (35) (1) $ 126,361
Available-for-sale n/a 26,825 (26,825) (2) - -
n/a FVOCI - 26,825 (2) - 26,825
153,221 - (35) 153,186
Securities Available-for-sale n/a 2,084,752 (2,084,752) (3) - -
n/a FVOCI - 2,084,752 (3) - 2,084,752
2,084,752 - - 2,084,752
Loans, net of allowance for
credit losses
Amortized cost
Amortized cost
26,204,599 -
19,810
(4)
26,224,409
Other 578,891 - (7,633) (5) 571,258
Total Assets $ 29,021,463 $ - $ 12,142 $ 29,033,605
Liabilities and Equity
Deposits Amortized cost Amortized cost $ 23,699,957 $ - $ - $ 23,699,957
Other 725,149 - (10,592) (6) 714,557
Debt Amortized cost Amortized cost 2,007,854 - - 2,007,854
Total Liabilities 26,432,960 - (10,592) 26,422,368
Equity Preferred shares 265,000 - - 265,000
Common shares 744,701 - - 744,701
Retained earnings 23,937 - 22,514 (7) 46,451
Share-based payment reserve 1,649,196 - - 1,649,196 Accumulated other comprehensive income (97,082) - 220 (8) (96,862)
Total Shareholders’ Equity 2,585,752 - 22,734 2,608,486
Non-controlling interests 2,751 - - 2,751
Total Equity 2,588,503 - 22,734 2,611,237
Total Liabilities and Equity $ 29,021,463 $ - $ 12,142 $ 29,033,605
(1) Recognition of allowances for credit losses related to cash resources measured at amortized cost. (2) Available-for-sale interest-bearing deposits with regulated financial institutions have been reclassified to FVOCI as the securities met the SPPI criteria
and are managed in a ‘hold to collect and to sell’ business model. Cash and non-interest bearing deposits with regulated financial institutions as well as
cheques and other items in transit continue to be measured at amortized cost. (3) Available-for-sale debt securities totalling $1,991,177 have been reclassified to FVOCI as the securities met the SPPI criteria and are managed in a ‘hold
to collect and to sell’ business model. Available-for-sale equity securities of $93,575 have been designated at FVOCI. (4) Decrease in allowances for credit losses related to loans (see the ‘Reconciliation of Allowances for Credit Losses’ below). (5) Decrease in deferred tax assets of $7,563 combined with the recognition of allowances for credit losses of $70 related to other financial assets. (6) Decrease in allowances for credit losses related to committed but undrawn credit exposures and letters of credit of $11,419 (see the ‘Reconciliation of
Allowances for Credit Losses’ below) partially offset by an increase in deferred tax liabilities of $827. (7) Cumulative after-tax impact of the adoption of IFRS 9. (8) After-tax impact of the recognition of allowances for credit losses related to debt securities measured at FVOCI.
n/a – not applicable.
Reconciliation of Allowances for Credit Losses
The reconciliation of CWB’s allowances for credit losses in accordance with IAS 39 and provisions for committed but undrawn credit exposures and letters of credit in accordance with IAS 37 to the corresponding amount determined under IFRS 9 as at November 1, 2018 follows:
IAS 39 / IAS 37 as at October 31, 2018 IFRS 9 as at November 1, 2018
Specific
Allowance
Collective
Allowance Total
Re-
measurement Stage 1 Stage 2 Stage 3 Total
Debt securities at FVOCI(1)(2) $ - $ - $ - $ 301 $ 301 $ - $ - $ 301 Loans 27,027 101,502 128,529 (19,810) 57,999 23,693 27,027 108,719
Committed but undrawn credit
exposures and letters of credit(3)
-
18,264
18,264
(11,419)
2,787
4,058
-
6,845
Total(4) $ 27,027 $ 119,766 $ 146,793 $ (30,928) $ 61,087 $ 27,751 $ 27,027 $ 115,865
(1) The allowance for credit losses on debt securities measured at FVOCI is recorded in AOCI in the consolidated balance sheets. (2) Previously available-for-sale debt securities under IAS 39. (3) Included in other liabilities in the consolidated balance sheets. (4) Excludes insignificant allowances for credit losses related to cash resources and other financial assets of $105.

CWB 2019 Second Quarter Report 33
Notes to Interim Consolidated Financial Statements
4. Strategic Transactions
Equipment Loans and Leases and General Commercial Lending Assets
On January 31, 2018, CWB acquired a portfolio of equipment loans and leases and general commercial lending assets, which added $845,990 to performing loans at fair value. No goodwill or intangible assets were included in the purchase. No allowance for credit losses was recorded on the acquisition date and loans are evaluated for impairment at each balance sheet date using the same methodology for CWB loans.
Canadian Western Trust (CWT)
On August 16, 2017, CWB announced that CWT, a wholly-owned subsidiary of CWB, will no longer offer self-directed account services to clients holding certain securities, and CWT initiated a process to appoint successor trustees for these accounts. Pre-tax gains of $3,009 related to these transactions are recorded in other non-interest income on the consolidated statements of income for the six months ended April 30, 2018, reflecting sales proceeds less the carrying value of assets sold and related transaction costs. Total pre-tax gains related to these transactions in the year ended October 31, 2018 were $4,030. The carrying value of deposits transferred totalled $21,899 for the six months ended April 30, 2018. Total deposits transferred in the year ended October 31, 2018 were $30,409.
5. Securities
Classification and Measurement
The securities portfolio consists of both debt securities and preferred shares. Prior to the transition to IFRS 9 on November 1, 2018, these investments were classified as available-for-sale and measured at fair value, with changes to carrying value recognized in OCI, net of tax. Under IFRS 9, the applicable measurement categories are as follows:
Debt Securities
Debt securities, which are measured at FVOCI, have contractual cash flows that satisfy the requirements of the SPPI test and are purchased with the objective of collecting contractual cash flows and selling the assets in response to, or in anticipation of, changes in interest rate, credit or foreign currency risk, funding sources or terms or to meet liquidity requirements.
Debt securities measured at FVOCI are initially recorded at fair value, net of transaction costs. They are subsequently measured at fair value, with unrealized gains and losses recorded in OCI, net of tax, until the security is sold. Impairment losses and recoveries, estimated using an ECL approach, are recognized in the provision for credit losses in the consolidated statements of income and correspondingly reduce the accumulated changes in fair value recorded in OCI. Gains and losses realized upon sale of the securities are recorded in gains (losses) on securities, net in the consolidated statements of income. Interest income earned is recorded using the effective interest method.
Preferred Shares
CWB has made the irrevocable election to measure preferred shares, which are equity instruments held for long-term investment purposes, at FVOCI. Dividends from preferred shares are recognized in interest income in the consolidated statements of income. Related gains and losses are recorded in OCI, net of tax, and are subsequently transferred to retained earnings, and not earnings, if the instrument is sold.

CWB 2019 Second Quarter Report 34
Notes to Interim Consolidated Financial Statements
Unrealized Gains and Losses
Unrealized gains and losses related to debt securities and cash resources measured at FVOCI and equity securities designated at FVOCI follow:
IFRS 9
As at April 30, 2019 As at January 31, 2019
Amortized
Cost(3)
Gross
Unrealized Gains
Gross
Unrealized Losses
Fair Value
Amortized Cost(3)
Gross
Unrealized Gains
Gross
Unrealized Losses
Fair Value
Measured at FVOCI
Interest bearing deposits with
regulated financial institutions(1) $ 366,659 $ - $ 24 $ 366,635 $ 223,488 $ - $ 12 $ 223,476
Debt securities issued or guaranteed by
Canada 1,015,775 71 9,621 1,006,225 1,141,360 10 19,866 1,121,504
A province or municipality 481,598 - 1,654 479,944 425,427 - 3,812 421,615
Other debt securities(2) 151,268 157 1,013 150,412 187,727 4 1,708 186,023
Designated at FVOCI Preferred shares 60,660 - 17,526 43,134 78,575 - 22,281 56,294
Total $ 2,075,960 $ 228 $ 29,838 $ 2,046,350 $ 2,056,577 $ 14 $ 47,679 $ 2,008,912
IAS 39
As at October 31, 2018
Amortized
Cost
Gross
Unrealized
Gains
Gross
Unrealized
Losses
Fair
Value
Available-for-sale
Interest bearing deposits with regulated financial institutions(1)
$ 26,825 $ - $ - $ 26,825 Debt securities issued or guaranteed by
Canada 1,362,647 - 36,831 1,325,816
A province or municipality 531,798 - 9,973 521,825
Other debt securities(2) 146,610 1 3,075 143,536
Preferred shares 110,696 - 17,121 93,575
Total $ 2,178,576 $ 1 $ 67,000 $ 2,111,577
(1) Included in cash resources on the consolidated balance sheets. (2) Includes securities issued or guaranteed by the United States of $96,369 (January 31, 2019 – $126,661; October 31, 2018 – $125,995). (3) The amortized cost of debt securities and cash resources measured at FVOCI is net of allowance for credit losses of $213 (January 31, 2019 – $248).
During the three and six months ended April 30, 2019, CWB disposed of preferred shares with a fair value of $12,060 and $34,941, respectively. Related to the dispositions and reflecting the IFRS 9 election, CWB reclassified cumulative after-tax realized losses of $4,273 and $10,969 from AOCI to retained earnings, respectively, during the three and six months ended April 30, 2019 (three and six months ended April 30, 2018 – pre-tax realized losses of $2,171 and $2,264, respectively, recognized in gains on securities, net). Dividend income recognized in the consolidated statements of income during the three and six months ended April 30, 2019 on preferred shares that were held at April 30, 2019 totalled $452 and $1,139, respectively. Dividend income recognized in the consolidated statements of income during the three and six months ended April 30, 2019 related to preferred shares disposed during the period totalled $193 and $375, respectively.
Impairment
During the three and six months ended April 30, 2019, reversals for credit losses of $35 and $88, respectively, were recorded in the consolidated statements of income related to a reduction in estimated allowances for credit losses on performing debt securities measured at FVOCI, all of which were in Stage 1 as at April 30, 2019. No impairment losses were recognized during the three and six months ended April 30, 2018.

CWB 2019 Second Quarter Report 35
Notes to Interim Consolidated Financial Statements
6. Loans, Impaired Loans and Allowances for Credit Losses
Loans at Amortized Cost
Loans, including leases, which are measured at amortized cost and stated net of unearned income, unamortized premiums or discounts and allowances for credit losses, are originated or purchased with the objective of collecting contractual cash flows and generate cash flows that satisfy the requirements of the SPPI test. Loan fees integral to the yield, net of transaction costs, are amortized to interest income using the effective interest method.
The composition of CWB’s loan portfolio by geographic region and industry sector follows:
Composition Percentage
($ millions) BC AB ON SK
MB
QC Other Total
April 30
2019
January 31
2019
October 31
2018
Personal(1) $ 1,437 $ 1,396 $ 2,099 $ 246 $ 115 $ - $ 114 $ 5,407 20 % 20 % 20 %
Business
General commercial loans 2,351 2,667 2,110 261 238 201 176 8,004 29 29 28
Commercial mortgages 2,185 2,161 170 281 178 15 - 4,990 18 18 19
Equipment financing and leasing(2) 704 1,273 1,352 447
236
532 333 4,877 18 18 18
Real estate project loans 2,432 1,018 262 173 50 - - 3,935 14 15 15
Oil and gas production loans - 124 - 16 - - - 140 1 - -
7,672 7,243 3,894 1,178 702 748 509 21,946 80 80 80
Total Loans(3) $ 9,109 $ 8,639 $ 5,993 $ 1,424 $ 817 $ 748 $ 623 $ 27,353 100 % 100 % 100 %
Composition Percentage
April 30, 2019 33 % 32 % 22 % 5 % 3 % 3 % 2 % 100 %
January 31, 2019 33 % 32 % 22 % 5 % 3 % 3 % 2 % 100 %
October 31, 2018 34 % 32 % 21 % 5 % 3 % 3 % 2 % 100 %
(1) Includes mortgages securitized through the National Housing Act Mortgage-backed Securities program reported on-balance sheet of $605 (January 31,
2019 – $617, October 31, 2018 – $609). (2) Includes securitized leases reported on-balance sheet of $1,476 (January 31, 2019 – $1,631, October 31, 2018 – $1,622). (3) This table does not include allowances for credit losses.
Credit Quality
Internal Risk Ratings
Within CWB’s loan portfolios, borrowers are assigned a borrower risk rating (BRR) that reflects the credit quality of the obligor using industry and sector-specific risk models and expert credit judgment. BRRs are assessed and assigned at the time of loan origination and reviewed at least annually, with the exception of consumer loans and single-unit residential mortgages. More frequent reviews are conducted for borrowers with weaker risk ratings, borrowers that trigger a review based on adverse changes in financial performance and borrowers requiring or requesting changes to credit facilities. Each BRR has a PD calibrated against it, which is estimated based on CWB’s historical loss experience for each risk segment or risk rating level, adjusted for forward-looking information. CWB’s 22-point BRR scale broadly aligns to external ratings as follows:
Description
CWB Rating
Category
Standard & Poor’s
Moody’s Investor
Services
Investment grade or low risk 1 to 6M AAA to BBB- Aaa to Baa3 Non-investment grade or medium risk 6L to 8L BB+ to CCC+ Ba1 to Caa1
Watchlist or high risk 9H to 10L CCC and below Caa2 and below
Impaired 11 to 12 Default Default

CWB 2019 Second Quarter Report 36
Notes to Interim Consolidated Financial Statements
Carrying Value of Exposures by Risk Rating
Gross carrying amounts of loans and the contractual amounts of committed but undrawn credit exposures and letters of credit, categorized based on internal risk ratings, follow:
As at April 30, 2019
Performing Impaired
Stage 1 Stage 2 Stage 3 Total
Loans – Personal
Low risk $ 2,658,908 $ 46,344 $ - $ 2,705,252 Medium risk 2,261,866 332,138 - 2,594,004
Watchlist or high risk - 82,560 - 82,560
Impaired - - 25,676 25,676
Total 4,920,774 461,042 25,676 5,407,492
Allowance for credit losses (1,622) (1,164) (746) (3,532)
Total, net of allowance for credit losses 4,919,152 459,878 24,930 5,403,960
Loans – Business
Investment grade or low risk 1,718,173 8,131 - 1,726,304
Non-investment grade or medium risk 19,042,075 801,543 - 19,843,618 Watchlist or high risk - 232,578 - 232,578
Impaired - - 142,645 142,645
Total 20,760,248 1,042,252 142,645 21,945,145
Allowance for credit losses (56,551) (26,348) (26,164) (109,063)
Total, net of allowance for credit losses 20,703,697 1,015,904 116,481 21,836,082
Total loans 25,681,022 1,503,294 168,321 27,352,637 Allowance for credit losses (58,173) (27,512) (26,910) (112,595)
Total Loans, Net of Allowance for Credit Losses $ 25,622,849 $ 1,475,782 $ 141,411 $ 27,240,042
Committed but Undrawn Credit Exposures and Letters of Credit
Investment grade or low risk $ 790,217 $ - $ - $ 790,217
Non-investment grade or medium risk 4,085,877 175,190 - 4,261,067 Watchlist or high risk - 19,124 - 19,124
Impaired - - - -
Total 4,876,094 194,314 - 5,070,408
Allowance for Credit Losses (2,449) (2,568) - (5,017)
Total, Net of Allowance for Credit Losses $ 4,873,645 $ 191,746 $ - $ 5,065,391
As at January 31, 2019
Performing Impaired
Stage 1 Stage 2 Stage 3 Total
Loans – Personal
Low risk $ 2,601,942 $ 38,084 $ - $ 2,640,026
Medium risk 1,922,987 606,254 - 2,529,241
Watchlist or high risk - 67,197 - 67,197
Impaired - - 31,640 31,640
Total 4,524,929 711,535 31,640 5,268,104
Allowance for credit losses (1,540) (1,263) (1,089) (3,892)
Total, net of allowance for credit losses 4,523,389 710,272 30,551 5,264,212
Loans – Business
Investment grade or low risk 1,746,979 12,458 - 1,759,437 Non-investment grade or medium risk 18,916,382 599,900 - 19,516,282
Watchlist or high risk - 238,946 - 238,946
Impaired - - 104,799 104,799
Total 20,663,361 851,304 104,799 21,619,464
Allowance for credit losses (56,263) (24,946) (21,850) (103,059)
Total, net of allowance for credit losses 20,607,098 826,358 82,949 21,516,405
Total loans 25,188,290 1,562,839 136,439 26,887,568
Allowance for credit losses (57,803) (26,209) (22,939) (106,951)
Total Loans, Net of Allowance for Credit Losses $ 25,130,487 $ 1,536,630 $ 113,500 $ 26,780,617
Committed but Undrawn Credit Exposures and Letters of Credit Investment grade or low risk $ 831,277 $ - $ - $ 831,277
Non-investment grade or medium risk 4,118,234 183,531 - 4,301,765
Watchlist or high risk - 11,912 - 11,912
Impaired - - - -
Total 4,949,511 195,443 - 5,144,954 Allowance for Credit Losses (2,385) (3,533) - (5,918)
Total, Net of Allowance for Credit Losses $ 4,947,126 $ 191,910 $ - $ 5,139,036

CWB 2019 Second Quarter Report 37
Notes to Interim Consolidated Financial Statements
Impaired and Past Due Loans
Outstanding gross loans and impaired loans, net of allowances for credit losses, by loan type, follow:
As at April 30, 2019 As at January 31, 2019
Gross
Amount
Gross
Impaired Amount(1)(2)
Stage 3 Allowance
Net
Impaired Loans
Gross Amount
Gross
Impaired Amount(1)(2)
Stage 3 Allowance
Net
Impaired Loans
Personal $ 5,407,492 $ 25,676 $ 746 $ 24,930 $ 5,268,104 $ 31,640 $ 1,089 $ 30,551
Business
General commercial loans 8,003,878 40,845 5,926 34,919 7,798,760 13,467 2,614 10,853
Commercial mortgages(3) 4,989,644 34,906 2,655 32,251 4,962,396 26,796 2,990 23,806 Equipment financing and leasing 4,876,997 56,586 14,783 41,803 4,815,129 44,886 14,246 30,640
Real estate project loans 3,935,086 10,308 2,800 7,508 3,907,943 19,650 2,000 17,650
Oil and gas production loans 139,540 - - - 135,236 - - -
Total $ 27,352,637 $ 168,321 $ 26,910 $ 141,411 $ 26,887,568 $ 136,439 $ 22,939 $ 113,500
As at October 31, 2018
Gross
Amount
Gross
Impaired
Amount(2)
Specific
Allowance
Net
Impaired
Loans
Personal $ 5,247,160 $ 28,961 $ 647 $ 28,314
Business General commercial loans 7,458,010 21,815 5,484 16,331
Commercial mortgages(3) 4,865,183 29,376 3,290 26,086
Equipment financing and leasing 4,779,005 47,800 15,606 32,194
Real estate project loans 3,854,681 9,920 2,000 7,920 Oil and gas production loans 129,089 - - -
Total $ 26,333,128 $ 137,872 $ 27,027 $ 110,845
(1) Under IFRS 9, all loans that are over 90 days past due are considered impaired. Under IAS 39, residential mortgages guaranteed or insured for both
principal and interest by the Canadian government, a province, or a Canadian government agency and loans that were fully secured and in the process
of collection were not classified as impaired until payments were 365 or 180 days in arrears, respectively. (2) Gross impaired loans include foreclosed assets with a carrying value of $4,598 (January 31, 2019 – $5,099; October 31, 2018 – $6,628) which are held
for sale. CWB pursues timely realization on foreclosed assets and does not use the assets for its own operations. (3) Multi-family residential mortgages are included in real estate loans.
Outstanding gross impaired loans, net of related allowances for credit losses by provincial location of security, follow:
As at April 30, 2019 As at January 31, 2019
Gross Impaired
Amount
Stage 3
Allowance
Net Impaired
Loans
Gross Impaired
Amount
Stage 3
Allowance
Net Impaired
Loans
Alberta $ 77,030 $ 10,432 $ 66,598 $ 59,068 $ 10,260 $ 48,808
British Columbia 14,485 2,586 11,899 26,157 2,446 23,711
Ontario 17,478 4,080 13,398 20,593 3,264 17,329 Saskatchewan 28,140 3,978 24,162 8,833 1,569 7,264
Manitoba 19,292 3,015 16,277 10,583 1,747 8,836
Quebec 8,211 2,048 6,163 5,364 2,366 2,998
Other 3,685 771 2,914 5,841 1,287 4,554
Total $ 168,321 $ 26,910 $ 141,411 $ 136,439 $ 22,939 $ 113,500
As at October 31, 2018
Gross
Impaired Amount
Specific Allowance
Net
Impaired Loans
Alberta $ 77,018 $ 12,627 $ 64,391
British Columbia 13,699 2,069 11,630
Ontario 16,829 3,016 13,813
Saskatchewan 8,957 1,330 7,627
Manitoba 9,873 4,006 5,867
Quebec 4,826 2,345 2,481 Other 6,670 1,634 5,036
Total $ 137,872 $ 27,027 $ 110,845
Loans are considered past due when a customer has not made a payment by the contractual due date. The following table presents the carrying value of loans that are contractually past due but not classified as impaired:
As at April 30, 2019
1 – 30 days 31 – 60 days 61 – 90 days
More than
90 days(1) Total
Personal $ 47,298 $ 16,050 $ 1,073 $ - $ 64,421
Business 134,299 21,424 9,998 - 165,721
Total $ 181,597 $ 37,474 $ 11,071 $ - $ 230,142
Total as at January 31, 2019 $ 172,500 $ 37,563 $ 33,928 $ - $ 243,991
Total as at October 31, 2018 $ 169,739 $ 49,387 $ 9,779 $ 1,970 $ 230,875
(1) Under IFRS 9, all loans that are over 90 days past due are considered impaired. Under IAS 39, residential mortgages guaranteed or insured for both
principal and interest by the Canadian government, a province or a Canadian government agency and loans that were fully secured and in the process
of collection were not classified as impaired until payments were 365 days and 180 days in arrears, respectively.

CWB 2019 Second Quarter Report 38
Notes to Interim Consolidated Financial Statements
Allowances for Credit Losses
Under IFRS 9, allowances for credit losses related to performing loans are estimated using an ECL approach that incorporates a number of underlying assumptions which involve a high degree of management judgment and can have a significant impact on financial results. The allowance for credit losses is CWB’s most significant accounting estimate.
Significant key drivers impacting the estimation of ECL, which are interrelated, include:
Changes in internal risk ratings attributable to a borrower or instrument reflecting changes in credit quality;
Thresholds used to determine when a borrower has experienced a SICR; and,
Changes in forward-looking information, specifically related to variables to which the ECL models are calibrated.
The inputs and models used for estimating ECL may not always capture all emerging market conditions at the reporting date and as such, qualitative adjustments based on expert judgment that consider reasonable and supportable information may be incorporated.
Assessment of Significant Increases in Credit Risk
The determination of whether a loan has experienced a SICR has a significant impact on the estimation of allowances for credit losses as 12-month ECL is recorded for loans in Stage 1 and lifetime ECLs are recorded for loans that have migrated to Stage 2. Movement between Stages 1 and 2 is impacted by changes in borrower-specific risk characteristics as well as changes in applicable forward-looking information. The main factors considered in assessing whether a loan has experienced a SICR are relative changes in internal risk ratings since initial recognition, incorporating forward-looking information, and certain other criteria such as 30 days past due and migration to watchlist status.
Forecasting Forward-looking Information for Multiple Scenarios
Forward-looking information is incorporated into both the assessment of whether a loan has experienced a SICR since its initial recognition and the estimation of ECL. The models used to estimate ECL consider macroeconomic factors that are most closely correlated with credit risk in the relevant portfolios and are calibrated to consider CWB’s geographic diversification.
To account for the non-linear nature of projected losses, CWB incorporates multiple probability-weighted macroeconomic scenarios into the estimation of ECL. Each scenario includes a projection of all relevant macroeconomic variables for a five-year period. While the base case scenario represents the best estimate of projected macroeconomic variables, additional scenarios represent more optimistic or pessimistic outcomes. To capture a wide range of possible outcomes, CWB simulates multiple macroeconomic scenarios that are above or below the base case based on historical and current trends and with consideration for the degree of uncertainty surrounding macroeconomic outlooks.
The primary macroeconomic variables impacting ECL for retail loan portfolios are unemployment rates and housing resale price growth. Business loan portfolios are impacted by unemployment rates, gross domestic product growth, housing resale price growth, the Canadian dollar/U.S. dollar exchange rate, residential mortgage rates, interest rates and oil price, to varying degrees. Increases in unemployment rates, residential mortgage rates and interest rates will generally correlate with higher ECL, while increases in oil price, gross domestic product growth, housing resale price growth, and the U.S. dollar/Canadian dollar exchange rate will generally result in lower ECL.
Stage 3 Allowances for Credit Losses
For impaired loans in Stage 3, allowances for credit losses are measured as the difference between the carrying value of the loan at the time it is classified as impaired and the present value of the cash flows CWB expects to receive, using the original effective interest rate of the loan. When the amounts and timing of future cash flows cannot be reliably estimated, either the fair value of the security underlying the loan, net of any expected realization costs, or the current market price for the loan may be used to measure the estimated realizable amount. Security can vary by type of loan and may include real property, working capital, guarantees, or other equipment.

CWB 2019 Second Quarter Report 39
Notes to Interim Consolidated Financial Statements
Reconciliation
A reconciliation of changes in allowances for credit losses related to loans, committed but undrawn credit exposures and letters of credit under IFRS 9 follows:
IFRS 9
For the three months ended April 30, 2019
Performing Impaired
Stage 1 Stage 2 Stage 3 Total
Personal
Balance at beginning of period $ 1,546 $ 1,267 $ 1,089 $ 3,902 Transfers to (from)
Stage 1(1) 138 (138) - -
Stage 2(1) (62) 72 (10) -
Stage 3(1) (2) (20) 22 - Net remeasurement(2) (348) 86 283 21
New originations 405 - - 405
Derecognitions and maturities (49) (93) (139) (281)
Provision for (reversal of) credit losses(3) 82 (93) 156 145
Write-offs - - (507) (507) Recoveries - - 8 8
Balance at end of period 1,628 1,174 746 3,548
Business
Balance at beginning of period 58,642 28,475 21,850 108,967
Transfers to (from) Stage 1(1) 3,564 (3,564) - -
Stage 2(1) (1,207) 1,207 - -
Stage 3(1) (57) (1,141) 1,198 -
Net remeasurement(2) (7,648) 5,516 13,150 11,018
New originations 9,495 - - 9,495 Derecognitions and maturities (3,795) (1,587) (53) (5,435)
Provision for (reversal of) credit losses(3) 352 431 14,295 15,078
Write-offs - - (11,189) (11,189)
Recoveries - - 1,208 1,208
Balance at end of period 58,994 28,906 26,164 114,064
Total Allowance for Credit Losses(4) $ 60,622 $ 30,080 $ 26,910 $ 117,612
IFRS 9
For the six months ended April 30, 2019
Performing Impaired
Stage 1 Stage 2 Stage 3 Total
Personal
Balance at beginning of period $ 1,461 $ 1,181 $ 647 $ 3,289
Transfers to (from) Stage 1(1) 156 (156) - -
Stage 2(1) (238) 248 (10) -
Stage 3(1) (5) (52) 57 -
Net remeasurement(2) (596) 133 872 409 New originations 966 - - 966
Derecognitions and maturities (116) (180) (148) (444)
Provision for (reversal of) credit losses(3) 167 (7) 771 931
Write-offs - - (684) (684)
Recoveries - - 12 12
Balance at end of period 1,628 1,174 746 3,548
Business Balance at beginning of period 59,325 26,570 26,380 112,275
Transfers to (from)
Stage 1(1) 5,681 (5,681) - -
Stage 2(1) (3,849) 4,182 (333) - Stage 3(1) (91) (1,518) 1,609 -
Net remeasurement(2) (15,983) 8,219 27,552 19,788
New originations 22,750 - - 22,750
Derecognitions and maturities (8,839) (2,866) (295) (12,000)
Provision for (reversal of) credit losses(3) (331) 2,336 28,533 30,538 Write-offs - - (30,725) (30,725)
Recoveries - - 1,976 1,976
Balance at end of period 58,994 28,906 26,164 114,064
Total Allowance for Credit Losses(4) $ 60,622 $ 30,080 $ 26,910 $ 117,612
Represented by: Loans $ 58,173 $ 27,512 $ 26,910 $ 112,595
Committed but undrawn credit exposures and letters of credit(5) 2,449 2,568 - 5,017
Total Allowance for Credit Losses(4) $ 60,622 $ 30,080 $ 26,910 $ 117,612
(1) Represents stage movements prior to remeasurement of allowances for credit losses. (2) Represents credit risk changes as a result of significant increases in credit risk, changes in credit risk that did not result in a transfer between stages,
changes in model inputs and assumptions, including changes in forward-looking macroeconomic forecasts and qualitative adjustments, and changes due to partial repayment.
(3) Included in the provision for credit losses in the consolidated statements of income. (4) Allowances for credit losses related to debt securities measured at FVOCI, cash resources and other financial assets classified at amortized cost were
excluded from the table above. See Note 5 for details related to allowances for credit losses on debt securities measured at FVOCI. Cash resources and other financial assets classified at amortized cost are presented in the consolidated balance sheets, net of allowances for credit losses.
(5) Included in other liabilities in the consolidated balance sheets.

CWB 2019 Second Quarter Report 40
Notes to Interim Consolidated Financial Statements
The following table presents changes in allowances for credit losses under IAS 39:
IAS 39
For the three months ended
April 30, 2018 For the six months ended
April 30, 2018
Specific
Allowance
Collective
Allowance
for Credit
Losses Total
Specific
Allowance
Collective
Allowance
for Credit
Losses Total
Balance at beginning of period $ 21,716 $ 120,283 $ 141,999 $ 16,617 $ 119,298 $ 135,915 Provision for credit losses 11,837 109 11,946 21,413 1,094 22,507
Write-offs (11,737) - (11,737) (18,683) - (18,683)
Recoveries 3,404 - 3,404 5,873 - 5,873
Balance at End of Period $ 25,220 $ 120,392 $ 145,612 $ 25,220 $ 120,392 $ 145,612
Represented by: Loans $ 25,220 $ 97,671 $ 122,891
Committed but undrawn credit exposures and letters of credit - 22,721 22,721
Total Allowance for Credit Losses $ 25,220 $ 120,392 $ 145,612
7. Deposits
As at April 30, 2019 As at January 31, 2019
Individuals
Business and
Government Total Individuals
Business and
Government Total
Payable on demand $ 31,091 $ 705,754 $ 736,845 $ 34,592 $ 683,362 $ 717,954 Payable after notice 3,930,285 3,011,801 6,942,086 3,767,933 2,937,966 6,705,899
Payable on a fixed date 11,551,426 5,487,816 17,039,242 11,339,905 5,146,485 16,486,390
Total $ 15,512,802 $ 9,205,371 $ 24,718,173 $ 15,142,430 $ 8,767,813 $ 23,910,243
As at October 31, 2018
Individuals
Business and
Government Total
Payable on demand $ 35,889 $ 716,156 $ 752,045 Payable after notice 3,684,259 3,157,875 6,842,134
Payable on a fixed date 10,763,538 5,342,240 16,105,778
Total $ 14,483,686 $ 9,216,271 $ 23,699,957
8. Financial Assets Transferred But Not Derecognized
Securitization of leases and loans
CWB securitizes equipment financing leases and loans to third parties. These securitizations do not qualify for derecognition as CWB continues to be exposed to certain risks associated with the leases and loans; therefore, CWB has not transferred substantially all of the risk and rewards of ownership. As the leases and loans do not qualify for derecognition, the assets are not removed from the consolidated balance sheets and a securitization liability is recognized within debt related to securitization activities for the cash proceeds received.
During the six months ended April 30, 2019, CWB sold securitized equipment financing leases and loans of $255,688 to third parties (2018 – $847,917) for cash proceeds of $229,854 (2018 – $768,487).
Securitization of residential mortgages
CWB securitizes fully insured residential mortgages through the creation of mortgage-backed securities under the
National Housing Act Mortgage Backed Securities (NHA MBS) program sponsored by Canada Mortgage and Housing Corporation (CMHC). The mortgage-backed securities are sold directly to third-party investors, sold to the Canada Housing Trust (CHT) as part of the Canada Mortgage Bond (CMB) program or are held by CWB. The CHT issues CMBs, which are government guaranteed, to third party investors and uses resulting proceeds to purchase NHA MBS from CWB and other mortgage issuers in the Canadian market.
The third-party sale of the mortgage pools that comprise the NHA MBS does not qualify for derecognition as CWB retains the credit and interest rate risks associated with the mortgages, which represent substantially all of the risks and rewards associated with the transferred assets. As a result, the mortgages remain on the consolidated balance sheets as personal loans and are carried at amortized cost. Cash proceeds from the third-party sale of the mortgage pools, including those sold as part of the CMB program, are recognized within debt related to securitization activities.
During the six months ended April 30, 2019, CWB sold securitized residential mortgages of $31,419 to the CHT (2018 – $67,269) for cash proceeds of $31,360 (2018 – $66,232).
Securities sold under repurchase agreements
CWB enters into repurchase agreements under which it sells previously recognized securities, with a simultaneous agreement to purchase them back at a specific price on a future date, but retains substantially all of the credit, price, interest rate, and foreign exchange risks and rewards associated with the assets. These securities are not derecognized and the cash proceeds from the sale are recognized within other liabilities on the consolidated balance sheets.

CWB 2019 Second Quarter Report 41
Notes to Interim Consolidated Financial Statements
Details about the nature of transferred financial assets that do not qualify for derecognition and the associated liabilities follow:
As at April 30, 2019 As at January 31, 2019
Carrying
value
Fair
Value
Carrying
value
Fair
Value
Transferred assets that do not qualify for derecognition Securitized leases and loans $ 1,475,710 $ 1,477,078 $ 1,630,886 $ 1,622,872
Securitized residential mortgages 293,363 290,597 300,058 294,366
Securities sold under repurchase agreements - - 48,856 48,856
1,769,073 1,767,675 1,979,800 1,966,094
Associated liabilities(1) 1,637,541 1,657,254 1,835,922 1,857,158
Net position $ 131,532 $ 110,421 $ 143,878 $ 108,936
As at October 31, 2018
Carrying
Value
Fair
Value
Transferred assets that do not qualify for derecognition Securitized leases and loans $ 1,621,943 $ 1,690,933
Securitized residential mortgages 277,942 271,492
Securities sold under repurchase agreements 95,126 95,126
1,995,011 2,057,551
Associated liabilities(1) 1,852,980 1,786,645
Net position $ 142,031 $ 270,906
(1) Associated liabilities consist of $1,344,471 related to securitized leases and loans (January 31, 2019 – $1,485,857; October 31, 2018 – $1,479,133),
$293,070 related to residential mortgages securitized through the NHA MBS program (January 31, 2019 – $301,209; October 31, 2018 – $278,721)
and nil related to securities sold under repurchase agreements (January 31, 2019 – $48,856; October 31, 2018 – $95,126).
Additionally, CWB has securitized residential mortgages through the NHA MBS program totaling $311,625 with a fair value of $308,686 (January 31, 2019 – $316,902 with a fair value of $310,880; October 31, 2018 – $330,599 with a fair value of $322,926) that were not transferred to third parties.
9. Capital Stock
Share Capital For the six months ended
April 30, 2019 April 30, 2018
Number of
Shares Amount Number of
Shares Amount
Preferred Shares – Series 5
Outstanding at beginning and end of period 5,000,000 $ 125,000 5,000,000 $ 125,000
Preferred Shares – Series 7
Outstanding at beginning and end of period 5,600,000 140,000 5,600,000 140,000 Preferred Shares – Series 9
Outstanding at beginning of period - - - -
Issued 5,000,000 125,000 - -
Outstanding at end of period 5,000,000 125,000 - -
15,600,000 390,000 10,600,000 265,000
Common Shares
Outstanding at beginning of period 88,952,099 744,701 88,494,353 731,885 Purchased for cancellation (1,767,000) (14,798) - -
Issued under dividend reinvestment plan 49,889 1,350 45,982 1,644
Issued on exercise or exchange of options(1) (Note 10) 4,071 86 130,354 2,183
Issued on acquisition-related contingent consideration instalment payment (Note 12) - - 160,293 5,750
Outstanding at end of period 87,239,059 731,339 88,830,982 741,462
Share Capital $ 1,121,339 $ 1,006,462
(1) Represents shares issued and amounts transferred from the share-based payment reserve to share capital upon cashless settlement of option exercises.
Preferred Shares
Preferred Shares – Series 5
On April 30, 2019, CWB elected to reset the Non-Viability Contingent Capital (NVCC) First Preferred Shares Series 5 (Series 5 Preferred Shares) annual dividend rate to 4.301%, representing the five-year Government of Canada Bond Yield as at April 1, 2019 plus 276 basis points. Beginning May 1, 2019, holders of Series 5 Preferred Shares are entitled to receive quarterly fixed rate non-cumulative preferential cash dividends in the amount of $0.2688125 per share, when declared by the Board of Directors of CWB. CWB may redeem the Series 5 Preferred Shares, in whole or in part, on April 30, 2024 and on April 30 every five years thereafter. All other terms remain unchanged.
CWB 2019 Second Quarter Report 42
Notes to Interim Consolidated Financial Statements
Preferred Shares – Series 9
On January 29, 2019, CWB issued 5,000,000 non-cumulative, five year rate reset NVCC First Preferred Shares Series 9 (Series 9 Preferred Shares) at $25.00 per share, for gross proceeds of $125,000. Holders of Series 9 Preferred Shares are entitled to receive a non-cumulative fixed dividend in the amount of $0.3832 on April 30, 2019 and thereafter, dividends will be at an quarterly rate of $0.375 per share, when declared by the Board of Directors of CWB, for the initial period ending April 30, 2024. The quarterly dividend represents an annual yield of 6.00% based on the stated issue price per share. Thereafter, the dividend rate will reset every five years at a level of 404 basis points over the then five year Government of Canada Bond Yield.
CWB maintains the right to redeem, subject to the approval of OSFI, up to all of the then outstanding Series 9 Preferred Shares on April 30, 2024, and on April 30 every five years thereafter at a price of $25.00 per share. Should CWB choose not to exercise its right to redeem the Series 9 Preferred Shares, holders of these shares will have the right to convert their shares into an equal number of non-cumulative, floating rate First Preferred Shares Series 10 (Series 10 Preferred Shares), subject to certain conditions, on April 30, 2024, and on April 30 every five years thereafter. Holders of the Series 10 Preferred Shares will be entitled to receive quarterly floating dividends, as and when declared by the Board of Directors of CWB, equal to the 90-day Government of Canada Treasury Bill rate plus 404 basis points.
Upon the occurrence of a trigger event (as defined by OSFI), each Series 9 or 10 Preferred Share will be automatically
converted, without the consent of the holders, into CWB common shares. Conversion to common shares will be determined by dividing the preferred share conversion value ($25.00 per preferred share plus any declared but unpaid dividends) by the common share value (the greater of (i) the floor price of $5.00 and (ii) the current market price calculated as the volume-weighted average trading price for the ten consecutive trading days ending on the day immediately prior to the date of the conversion).
Common Shares
On September 27, 2018, CWB announced the approval of OSFI and the Toronto Stock Exchange to repurchase for cancellation up to 1,767,000 common shares, representing 2% of the issued and outstanding common shares, under a normal course issuer bid (NCIB) during the 12-month period expiring September 30, 2019. The original NCIB was amended on April 10, 2019, to provide an additional 1,767,000 shares to repurchase for cancellation. The cumulative number of common shares available for repurchase under the NCIB is now 3,534,000, representing 4% of the issued and outstanding common shares. Under the NCIB, CWB repurchased 1,767,000 common shares available for cancellation during the three months ended January 31, 2019, at an average price of $27.05 for a total cost of $47,834, including related transaction costs. No common shares were repurchased during the three months ended April 30, 2019.
10. Share-based Payments
Stock Options For the three months ended
April 30, 2019 April 30, 2018
Number of
Options
Weighted Average
Exercise
Price
Number of
Options
Weighted Average
Exercise
Price
Options
Balance at beginning of period 2,395,514 $ 30.88 2,958,913 $ 31.16 Granted 380,728 29.43 262,563 35.15
Exercised or exchanged (27,528) 25.35 (157,292) 27.40
Expired - - (14,093) 37.78
Forfeited (12,307) 31.50 - -
Balance at End of Period 2,736,407 $ 30.73 3,050,091 $ 31.67
For the six months ended
April 30, 2019 April 30, 2018
Number of
Options
Weighted Average
Exercise
Price
Number of
Options
Weighted Average
Exercise
Price
Options
Balance at beginning of period 2,833,461 $ 31.90 3,390,759 $ 31.02 Granted 380,728 29.43 262,563 35.15
Exercised or exchanged (27,528) 25.35 (586,466) 29.35
Expired (437,947) 37.50 (16,765) 36.24
Forfeited (12,307) 31.50 - -
Balance at End of Period 2,736,407 $ 30.73 3,050,091 $ 31.67
All exercised options are settled via cashless settlement, which provides the option holder the number of shares equivalent to the excess of the market value of the shares under option, determined at the exercise date, over the exercise price. During the six months ended April 30, 2019, option holders exercised 27,528 options (2018 – 586,466) in exchange for 4,071 shares (2018 – 130,354) by way of cashless settlement.

CWB 2019 Second Quarter Report 43
Notes to Interim Consolidated Financial Statements
For the six months ended April 30, 2019, salary expense of $813 (2018 – $947) was recognized related to the estimated fair value of options granted. The fair value of options granted during the six months ended April 30, 2019, which expire seven years after the grant date, was estimated using a binomial option pricing model with the following weighted average variables and assumptions: (i) risk-free interest rate of 1.6% (2018 – 2.0%) (ii) expected option life of 5.0 years (2018 – 5.0 years), (iii) expected annual volatility of 29% (2018 – 28%), and (iv) expected annual dividends of 3.7% (2018 – 2.9%). The weighted average fair value of options granted was estimated at $4.93 per share (2018 – $6.48).
Further details related to stock options outstanding and exercisable at April 30, 2019 follow:
Options Outstanding Options Exercisable
Range of Exercise Prices
Number of
Options
Weighted
Average
Remaining Contractual
Life (years)
Weighted
Average Exercise
Price
Number of
Options
Weighted
Average Exercise
Price
$23.70 to $26.13 1,098,087 2.5 $ 24.81 1,098,087 $ 24.81
$29.43 to $30.85 711,392 5.9 30.10 - -
$35.15 to $39.42 926,928 1.7 38.23 667,706 39.42
Total 2,736,407 3.1 $ 30.73 1,765,793 $ 30.34
11. Contingent Liabilities and Commitments
In the ordinary course of business, CWB and its subsidiaries are party to legal proceedings. Based on current knowledge, CWB does not expect the outcome of any of these proceedings to have a material effect on the consolidated financial position or results of operations.
12. Fair Value of Financial Instruments
Financial Assets and Liabilities by Measurement Basis
The table below provides the carrying amount of financial instruments by category as defined in IAS 39 – Financial Instruments: Recognition and Measurement and by balance sheet heading. The table does not include assets and liabilities that are not considered financial instruments. The table also excludes assets and liabilities which are considered financial instruments, but are not recorded at fair value and for which the carrying amount approximates fair value.
IFRS 9
As at April 30, 2019
Derivatives
Amortized Cost
FVOCI
FVTPL
Total
Carrying Amount
Fair Value
Fair Value
Over
(Under)
Carrying Amount
Financial Assets
Cash resources $ - $ 96,361 $ 366,635 $ - $ 462,996 $ 462,996 $ -
Securities(1) - - 1,679,715 - 1,679,715 1,679,715 -
Securities purchased under resale agreements
-
116,936
-
-
116,936
116,936
-
Loans(2) - 27,337,211 - - 27,337,211 27,301,862 (35,349)
Derivative related 45,437 - - - 45,437 45,437 -
Total $ 45,437 $ 27,550,508 $ 2,046,350 $ - $ 29,642,295 $ 29,606,946 $ (35,349)
Financial Liabilities Deposits(2) $ - $ 24,749,630 $ - $ - $ 24,749,630 $ 24,862,202 $ 112,572
Debt - 1,887,541 - - 1,887,541 1,910,408 22,867
Derivative related 18,981 - - - 18,981 18,981 -
Total $ 18,981 $ 26,637,171 $ - $ - $ 26,656,152 $ 26,791,591 $ 135,439
As at January 31, 2019
Total Financial Assets $ 23,589 $ 26,924,051 $ 2,008,912 $ - $ 28,956,552 $ 28,906,204 $ (50,348)
Total Financial Liabilities $ 27,140 $ 26,031,973 $ - $ 6,452 $ 26,065,565 $ 26,032,894 $ (32,671)
IAS 39
Derivatives
Loans and
Receivables, and Non-
trading
Liabilities
Available-
for-sale
Total
Carrying
Amount
Fair Value
Fair
Value
Over (Under)
Carrying
Amount
As at October 31, 2018
Total Financial Assets $ 2,496 $ 26,390,375 $ 2,237,973 $ 28,630,844 $ 28,791,615 $ 160,771
Total Financial Liabilities $ 69,581 $ 25,781,286 $ 95,126 $ 25,945,993 $ 25,639,193 $ (306,800)
(1) Securities is comprised of $1,636,581 (January 31, 2019 – $1,729,142) measured at FVOCI and $43,134 (January 31, 2019 – $56,294) designated at
FVOCI. (2) Loans and deposits exclude deferred premiums, deferred revenue, allowances for credit losses and fair value hedge adjustments, which are not financial
instruments.

CWB 2019 Second Quarter Report 44
Notes to Interim Consolidated Financial Statements
Fair values are based on management’s best estimates based on market conditions and pricing policies at a certain point in time. Methods used to estimate the fair values of financial instruments remain unchanged from the audited consolidated financial statements for the year ended October 31, 2018 with the exception of floating rate loans and deposits with no stated maturity. Beginning in Q1 2019, the fair value of floating rate loans and deposits with no stated maturities, previously assumed to be equal to book value, are now estimated by discounting the expected future cash flows at current market rates for loans and deposits with similar terms and conditions.
The fair value estimates are subjective and involve particular assumptions and matters of judgment and, as such, may not be reflective of future fair values. Further information on how the fair value of financial instruments is determined is included in Note 26 of the October 31, 2018 consolidated audited financial statements (see page 108 of the 2018 Annual Report).
Fair Value Hierarchy
CWB categorizes its fair value measurements of financial instruments recorded on the consolidated balance sheets according to a three-level hierarchy. Level 1 fair value measurements reflect unadjusted quoted prices in active markets for identical assets and liabilities that CWB can access at the measurement date. Level 2 fair value measurements were estimated using observable inputs, including quoted market prices for similar assets or liabilities in active markets, quoted prices for identical or similar assets or liabilities in inactive markets, and model inputs that are either observable
or can be corroborated by observable market data for substantially the full term of the assets or liabilities. Level 3 fair value measurements were determined using one or more inputs that are unobservable and significant to the fair value of the asset or liability. Unobservable inputs are used to measure fair value to the extent that observable inputs are not available at the measurement date.
The following table presents CWB’s financial assets and liabilities that are either carried at fair value on the balance sheet or for which fair value is disclosed, categorized by level under the fair value hierarchy:
Valuation Technique
As at April 30, 2019 Fair Value Level 1 Level 2 Level 3
Financial Assets
Cash resources $ 462,996 $ 113,525 $ 349,471 $ -
Securities 1,679,715 234,981 1,444,734 -
Securities purchased under resale agreements 116,936 - 116,936 - Loans 27,301,862 - - 27,301,862
Derivative related 45,437 - 45,437 -
Total $ 29,606,946 $ 348,506 $ 1,956,578 $ 27,301,862
Financial Liabilities
Deposits $ 24,862,202 $ - $ 24,862,202 $ - Debt 1,910,408 - 1,910,408 -
Derivative related 18,981 - 18,981 -
Total $ 26,791,591 $ - $ 26,791,591 $ -
As at January 31, 2019
Financial Assets $ 28,906,204 $ 229,717 $ 1,830,509 $ 26,845,978
Financial Liabilities $ 26,032,894 $ - $ 26,026,442 $ 6,452
As at October 31, 2018
Financial Assets $ 28,791,615 $ 363,589 $ 1,876,880 $ 26,551,146
Financial Liabilities $ 25,639,193 $ - $ 25,609,379 $ 29,814
Financial instruments that are not carried on the balance sheet at fair value, but for which fair value is disclosed above, include securities purchased under resale agreements, loans, deposits and debt.

CWB 2019 Second Quarter Report 45
Notes to Interim Consolidated Financial Statements
Level 3 Financial Instruments
The level 3 financial liabilities measured at fair value on the consolidated balance sheets were comprised of contingent consideration on business acquisitions and divestitures. The following table shows a reconciliation of the fair value measurements related to the Level 3 valued instruments:
For the six months ended
April 30
2019
April 30
2018
Acquisitions
Balance at beginning of period $ 29,514 $ 32,420 Acquisition-related fair value changes 7,854 10,053
Contingent consideration payments(1) (37,368) (23,000)
- 19,473
Divestitures Balance at beginning of period 300 500
Divestiture-related fair value changes (300) (100)
- 400
Balance at End of Period $ - $ 19,873
(1) Under the terms of the March 2016 purchase agreement relating to the acquisition of CWB Maxium Financial, contingent payment instalments were made annually with determination of the total amount payable based on CWB Maxium Financial’s cumulative business performance over a 36-month period
ended February 28, 2019. Up to 50% of each contingent consideration payment could have been settled with CWB common shares at the vendor’s option,
provided the average share price over the preceding 20 days exceeded $30.00, with the remainder paid in cash. CWB completed the third instalment
and final settlement contingent payments in cash in the first and second quarters of 2019, respectively. The 2018 instalment was paid with cash totaling $17,250 and the issuance of 160,293 CWB common shares with a fair value of $5,750.
13. Interest Rate Sensitivity
CWB’s exposure to interest rate risk as a result of a difference or gap between the maturity or repricing behavior of interest sensitive assets and liabilities, including derivative financial instruments, is discussed in Note 25 of the audited consolidated financial statements for the year ended October 31, 2018 (see page 107 of the 2018 Annual Report). The following table shows the gap position for selected time intervals.
Asset Liability Gap Positions
($ millions)
Floating Rate
and
Within
1 Month
1 to 3
Months
3
Months
to 1
Year
Total
Within 1
Year
1 Year to
5 Years
More than
5 Years
Non-
interest
Sensitive
Total
April 30, 2019 Assets
Cash resources and securities $ 777 $ 270 $ 164 $ 1,211 $ 1,042 $ - $ 7 $ 2,260
Loans(1) 12,650 1,261 4,301 18,212 8,910 219 (101) 27,240
Other assets(2) - - - - - - 554 554 Derivative financial
instruments(3) 245 85 1,305 1,635 4,597 - 273 6,505
Total 13,672 1,616 5,770 21,058 14,549 219 733 36,559
Liabilities and Equity
Deposits(1) 7,521 1,320 4,405 13,246 11,503 - (31) 24,718
Other liabilities - - - - - - 596 596 Debt 65 112 657 834 1,054 - - 1,888
Equity - - - - 390 - 2,462 2,852
Derivative financial
instruments(3) 6,212 - - 6,212 20 - 273 6,505
Total 13,798 1,432 5,062 20,292 12,967 - 3,300 36,559
Interest Rate Sensitive Gap $ (126) $ 184 $ 708 $ 766 $ 1,582 $ 219 $ (2,567) $ -
Cumulative Gap $ (126) $ 58 $ 766 $ 766 $ 2,348 $ 2,567 $ - $ -
Cumulative Gap as a
Percentage of Total Assets (0.3)
% 0.2
% 2.1 % 2.1
% 6.4 % 7.0
% -
% -
%
January 31, 2019
Cumulative Gap $ (335) $ (460) $ 403 $ 403 $ 2,415 $ 2,500 $ - $ -
Cumulative Gap as a
Percentage of Total Assets (1.0)
% (1.3)
% 1.1 % 1.1
% 6.9 % 7.1
% -
% -
%
October 31, 2018
Cumulative Gap $ (619) $ (318) $ 287 $ 287 $ 2,326 $ 2,526 $ - $ -
Cumulative Gap as a Percentage of Total Assets (1.8)
% (0.9)
% 0.8 % 0.8
% 6.8 % 7.4
% -
% -
%
(1) Potential prepayments of fixed rate loans and early redemption of redeemable fixed term deposits have not been estimated. Redemptions of fixed term
deposits where depositors have this option are not expected to be material. The majority of fixed rate loans, mortgages and leases are either closed or
carry prepayment penalties. (2) Accrued interest is excluded in calculating interest sensitive assets and liabilities. (3) Derivative financial instruments are included in this table at the notional amount.

CWB 2019 Second Quarter Report 46
Notes to Interim Consolidated Financial Statements
The effective weighted average interest rates of financial assets and liabilities are shown below:
April 30, 2019
Floating
Rate and
Within
1 Month
1 to 3
Months
3
Months
to 1 Year
Total
Within 1
Year
1 Year to
5 Years
More
than 5
Years
Total
Total Assets 4.4 % 3.8 % 4.1 % 4.3 % 3.7 % 5.8 % 4.0 %
Total Liabilities 1.8 2.2 2.4 2.0 2.7 0.0 2.0
Interest Rate Sensitive Gap 2.6 % 1.6 % 1.7 % 2.3 % 1.0 % 5.8 % 2.0 %
January 31, 2019
Total Assets 4.7 % 4.1 % 4.0 % 4.4 % 3.7 % 5.9 % 4.1 %
Total Liabilities 1.9 2.4 2.3 2.1 2.6 - 2.0
Interest Rate Sensitive Gap 2.8 % 1.7 % 1.7 % 2.3 % 1.1 % 5.9 % 2.1 %
October 31, 2018
Total Assets 4.4 % 3.5 % 4.1 % 4.3 % 3.6 % 6.0 % 4.0 % Total Liabilities 1.7 2.3 2.2 1.9 2.5 - 2.1
Interest Rate Sensitive Gap 2.7 % 1.2 % 1.9 % 2.4 % 1.1 % 6.0 % 1.9 %
Based on the current interest rate gap position, it is estimated that a one-percentage point increase in all interest rates
would increase net interest income by approximately $10,155 (January 31, 2019 – $5,369; October 31, 2018 – $6,234) and decrease OCI by $103,564 (January 31, 2019 – $107,951; October 31, 2018 – $104,554) net of tax, respectively over the following twelve months. A one-percentage point decrease in all interest rates would decrease net interest income by approximately $13,953 (January 31, 2019 – $9,818; October 31, 2018 – $7,467) and increase OCI by $105,827 (January 31, 2019 – $109,919; October 31, 2018 – $107,162) net of tax.
14. Interest Income
The composition of CWB’s interest income follows:
For the three
months ended For the six
months ended
April 30
2019
April 30
2019
Loans measured at amortized cost(1) $ 334,390 $ 670,639
Securities Debt securities measured at FVOCI(1) 5,920 12,880
Equity securities designated at FVOCI 645 1,514
Securities purchased under resale agreements measured at amortized cost(1) 190 339
Deposits with regulated financial institutions measured at FVOCI(1) 2,018 3,783
Total $ 343,163 $ 689,155
(1) Interest income is calculated using the effective interest method.
15. Capital Management
Capital for Canadian financial institutions is managed and reported in accordance with a capital management framework specified by OSFI commonly called Basel III using the Standardized approach for calculating risk-weighted assets. Additional information about CWB’s capital management practices is provided in Note 29 of the audited consolidated financial statements for the year ended October 31, 2018 (see page 112 of the 2018 Annual Report) and in the Capital Management section in the second quarter of 2019 Management’s Discussion and Analysis.
Capital funds are managed in accordance with policies and plans that are regularly reviewed and approved by the Board of Directors and take into account forecasted capital needs and markets. The goal is to maintain adequate regulatory capital to be considered well capitalized, protect customer deposits and provide capacity for internally generated growth and strategic opportunities that do not otherwise require accessing the public capital markets, all while providing a satisfactory return for shareholders.
Significant Changes
CWB adopted IFRS 9 on November 1, 2018 and recorded an increase to shareholders’ equity of $22,734 upon transition, primarily related to the implementation of the new impairment guidelines. This resulted in an increase to the CET1 and Tier 1 capital ratios of approximately 10 basis points and a nominal impact to the Total ratio. For further details, refer to Notes 2 and 3.
During the first quarter of 2019, CWB purchased for cancellation 1,767,000 common shares at an average of $27.05 per share for gross proceeds of $47,799. This resulted in a decrease to the capital ratios of approximately 20 basis points. For further details, refer to Note 9.
On January 29, 2019, CWB issued 5,000,000 non-cumulative, 5-year rate reset NVCC First Preferred Shares Series 9 at $25.00 per share, for gross proceeds of $125,000. This resulted in an increase in the Tier 1 and Total capital ratios of approximately 55 basis points. For further details, refer to Note 9.
s to Interim Consolidated Financial Statements

CWB 2019 Second Quarter Report 47
Notes to Interim Consolidated Financial Statements
Basel III rules, effective January 1, 2013, provide for transitional adjustments with certain aspects of the rules phased in between 2013 and 2019. The only available transition allowance in the Basel III capital standards, permitted by OSFI for Canadian banks relates to the multi-year phase out of non-qualifying capital instruments. The 2019 inclusion of non-qualifying capital instruments in regulatory capital under Basel III is capped at 30% (2018 – 40%) of the balance of non-common equity instruments outstanding at January 1, 2013. At April 30, 2019 $47,500 (January 31, 2019 – $47,500; October 31, 2018– nil) was excluded from Total regulatory capital related to outstanding non-NVCC subordinated debentures. This resulted in a decrease to the Total capital ratio of approximately 20 basis points in the first quarter of 2019.
Capital Structure and Regulatory Ratios
As at
April 30
2019
As at
January 31
2019
As at
October 31
2018
Regulatory capital, net of deductions Common equity Tier 1 $ 2,219,309 $ 2,177,363 $ 2,153,019
Tier 1 2,609,455 2,567,638 2,418,231
Total 2,902,691 2,860,134 2,788,048
Capital ratios
Common equity Tier 1 9.1 % 9.1 % 9.2 % Tier 1 10.7 10.7 10.3
Total 11.9 12.0 11.9
Leverage ratio 8.4 8.5 8.0
During the six months ended April 30, 2019, CWB complied with all internal and external capital requirements.

CWB 2019 Second Quarter Report 48
Shareholder Information S Discuss
Head Office
CWB Financial Group Suite 3000, Canadian Western Bank Place 10303 Jasper Avenue Edmonton, AB T5J 3X6 Telephone: (780) 423-8888 Fax: (780) 423-8897 cwb.com
Contact Information
CWB National Leasing Inc. 1525 Buffalo Place Winnipeg, MB R3T 1L9 Toll-free: 1-800-665-1326 cwbnationalleasing.com
CWB Maxium Financial Inc. 30 Vogell Road, Suite 1 Richmond Hill, ON L4B 3K6 Toll-free: 1-800-379-5888 cwbmaxium.com CWB Optimum Mortgage Suite 1010, Canadian Western Bank Place 10303 Jasper Avenue NW Edmonton, AB T5J 3X6 Toll-free: 1-866-441-3775 optimummortgage.ca Canadian Western Trust Company Suite 300, 750 Cambie Street Vancouver, BC V6B 0A2 Toll-free: 1-800-663-1124 cwt.ca CWB Wealth Management Ltd. Suite 1250, Canadian Western Bank Place 10303 Jasper Avenue NW Edmonton, AB T5J 3N6 Telephone: (855) 292-9655 cwbwealth.com
CWB McLean & Partners Wealth Management Ltd. 801 10th Avenue SW Calgary, AB T2R 0B4 Telephone: (403) 234-0005 cwbmcleanpartners.com Stock Exchange Listings The Toronto Stock Exchange Common Shares: CWB Series 5 Preferred Shares: CWB.PR.B Series 7 Preferred Shares: CWB.PR.C
Series 9 Preferred Shares: CWB.PR.D
Transfer Agent and Registrar Computershare 100 University Avenue, 8th Floor Toronto, ON M5J 2Y1 Telephone: (416) 263-9200 Fax: 1-888-453-0330 Website: www.computershare.com
Eligible Dividends Designation
CWB designates all dividends for both common and preferred shares paid to Canadian residents as “eligible dividends”, as defined in the Income Tax Act (Canada), unless otherwise noted.
Dividend Reinvestment Plan
CWB’s dividend reinvestment plan allows common and preferred shareholders to purchase additional common shares by reinvesting their cash dividend without incurring brokerage and commission fees. For information about participation in the plan, please contact the Transfer Agent and Registrar or visit cwb.com.
Investor Relations
CWB Financial Group Telephone: (780) 969-8337 Toll-free: 1-800-836-1886 Email: [email protected]
Online Investor Information
Additional investor information including supplemental financial information and corporate presentations are available on CWB’s website at cwb.com.
Quarterly Conference Call and Webcast
CWB’s quarterly conference call and live audio webcast will take place on May 29, 2019 at 11:00 a.m. ET. The webcast will be archived on CWB’s website at cwb.com for sixty days. A replay of the conference call will be available until June 5, 2019, by dialing (888) 390-0541 and entering passcode 705607#.