Embed Size (px)
Citation preview
Design of an Apparatus for Wind Tunnel Tests of Electric UAV
Propulsion Systems
Miguel [email protected]
Instituto Superior Tecnico, Lisboa, Portugal
June 2015
Abstract
The demand for alternative energy sources has grown in recent years. The shift to electricity canalready be seen in the automotive industry, and the aviation industry is slowly follow the same path.This thesis focuses on the design, construction and validation of a system to test electrical propulsivesystems capable of being used in unmanned aerial aircraft. The system developed was a test rig capableof testing electric motors with propellers with a maximum diameter of 27 inches. The measuring systeminstalled on the test rig flexible enough to be able to perform measurements of different ranges generatedby different propulsive systems. The experimental apparatus was installed in the aero-acoustic windtunnel IST that allows out tests in a dynamic and static environment. All the mechanical designtake into account the measurement limits previously studied according to data provided the propellermanufacturers. Through this test bench it is possible to generate the data for the propulsion system ina simple and flexible way. For this, it was created an interface so that the user can have access to allthe generated data by the propulsion system in real time, but at the same time can also store that datafor further post processing.Keywords: UAV, Electric Propulsion, Test Rig, Wind Tunnel. Propeller Performance, DataAcquisition
1. Introduction
Nowadays, with the increasing price of fossil fuels,the demand for the usage of electricity has beenrising in the past years. In the aviation industry,the development of unmanned airplanes has growna lot not only because of their efficiency but alsobecause of their agility and capability of adaptingto almost every environment. The simplicity andimprovement of their components made the Un-manned Aerial Vehicle (UAV) one of the most im-portant tools for the mass emergence of unmannedvehicles[6].
These paper aims to make good use of the cur-rent computer capabilities to study the main fea-tures of the propulsion system of an UAV. With awell designed propulsive system, fitted to each dif-ferent case, it will be possible to have a more ef-ficient flight. To achieve this, it will be necessaryto design a Test Rig. This design will be based onthe physical testing limits that are proposed for thistest bench. The complete structure will be assem-bled inside the aero-acoustic wind tunnel (WT) atIST. To measure all the output data produced bythe motor, the test rig will be equipped with severalsensors that will allow the user monitor and record
all the data during a test.
The material presented here is part of a collabora-tive research project involving three research unitsbelonging to the research line of Aeronautics andSpace of LAETA, namely CCTAE, AEROG andIDMEC.These is part of project is entitled Long En-durance Electric UAV (LEEUAV)[7] and its goalsare to develop a low cost, small footprint, easy tobuild and maintain multirole electric UAV, capableof being deployed from short airfields and able toadapt to different civilian surveillance missions.
2. Background
A significant advantage of electric motors is theirrather vibration-free and quiet operation. A disad-vantage has been their high weight per unit poweroutput. With the advent of rare earth magnets,electric motors are now considerably lighter thantwo decades ago. For that reason, they are a candi-date for propulsion of certain classes of vehicles. Anexample is the solar-cell/electric-motor/propellersystem used in UAVs. A major problem with elec-tric motor propulsion still is the weight associatedwith the energy storage (i.e. battery) and/or energygeneration system.
1
2.1. Propeller ParametersThe important characteristic parameters of a pro-peller are its advance ratio, J , thrust coefficient CT ,torque coefficient CQ, power coefficient CP and thepropeller efficiency η. Similar to many other aero-dynamic problems, the aerodynamics of the pro-peller also make it convenient to express the thrustT , the torque Q, and the power P in suitable non-dimensional forms. If D represents the diameterof the propeller making N revolutions per unit oftime, take the reference length as D, reference areaas D2, reference velocity as ND and the referencepressure as ρ(ND)2. The non-dimensional coeffi-cients of thrust,torque and power can be respec-tively, defined[9] as.
CF =F
ρN2D4, CQ =
Q
ρN2D5, CP =
P
ρN3D5,
(1)The propeller efficiency is an important charac-
teristic parameter of the propeller arising due to itsrotation in the air. It answers the question, how effi-ciently is the engine power (power input) convertedto thrust power (power output). It is defined as theratio between power output to power input.
ηT =P
Pe=
FV
Qe2πN, (2)
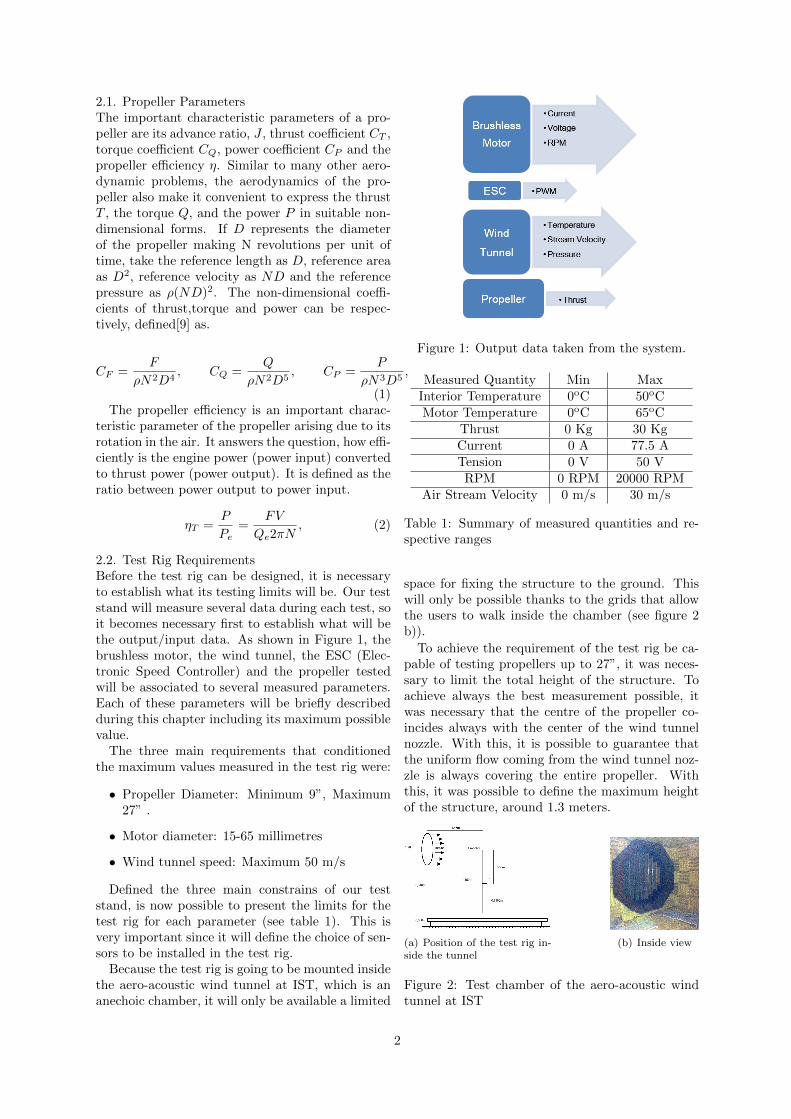
2.2. Test Rig RequirementsBefore the test rig can be designed, it is necessaryto establish what its testing limits will be. Our teststand will measure several data during each test, soit becomes necessary first to establish what will bethe output/input data. As shown in Figure 1, thebrushless motor, the wind tunnel, the ESC (Elec-tronic Speed Controller) and the propeller testedwill be associated to several measured parameters.Each of these parameters will be briefly describedduring this chapter including its maximum possiblevalue.
The three main requirements that conditionedthe maximum values measured in the test rig were:
• Propeller Diameter: Minimum 9”, Maximum27” .
• Motor diameter: 15-65 millimetres
• Wind tunnel speed: Maximum 50 m/s
Defined the three main constrains of our teststand, is now possible to present the limits for thetest rig for each parameter (see table 1). This isvery important since it will define the choice of sen-sors to be installed in the test rig.
Because the test rig is going to be mounted insidethe aero-acoustic wind tunnel at IST, which is ananechoic chamber, it will only be available a limited
Figure 1: Output data taken from the system.
Measured Quantity Min MaxInterior Temperature 0oC 50oCMotor Temperature 0oC 65oC
Thrust 0 Kg 30 KgCurrent 0 A 77.5 ATension 0 V 50 VRPM 0 RPM 20000 RPM
Air Stream Velocity 0 m/s 30 m/s
Table 1: Summary of measured quantities and re-spective ranges
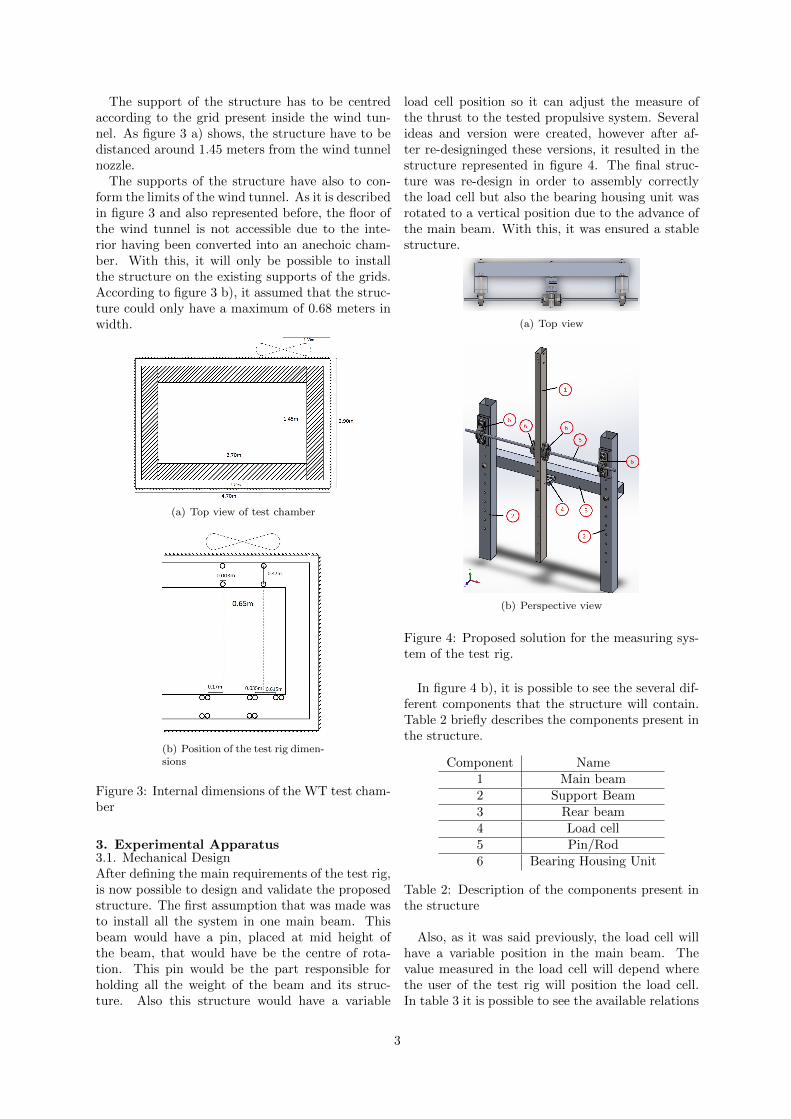
space for fixing the structure to the ground. Thiswill only be possible thanks to the grids that allowthe users to walk inside the chamber (see figure 2b)).
To achieve the requirement of the test rig be ca-pable of testing propellers up to 27”, it was neces-sary to limit the total height of the structure. Toachieve always the best measurement possible, itwas necessary that the centre of the propeller co-incides always with the center of the wind tunnelnozzle. With this, it is possible to guarantee thatthe uniform flow coming from the wind tunnel noz-zle is always covering the entire propeller. Withthis, it was possible to define the maximum heightof the structure, around 1.3 meters.
(a) Position of the test rig in-side the tunnel
(b) Inside view
Figure 2: Test chamber of the aero-acoustic windtunnel at IST
2
The support of the structure has to be centredaccording to the grid present inside the wind tun-nel. As figure 3 a) shows, the structure have to bedistanced around 1.45 meters from the wind tunnelnozzle.
The supports of the structure have also to con-form the limits of the wind tunnel. As it is describedin figure 3 and also represented before, the floor ofthe wind tunnel is not accessible due to the inte-rior having been converted into an anechoic cham-ber. With this, it will only be possible to installthe structure on the existing supports of the grids.According to figure 3 b), it assumed that the struc-ture could only have a maximum of 0.68 meters inwidth.
(a) Top view of test chamber
(b) Position of the test rig dimen-sions
Figure 3: Internal dimensions of the WT test cham-ber
3. Experimental Apparatus3.1. Mechanical DesignAfter defining the main requirements of the test rig,is now possible to design and validate the proposedstructure. The first assumption that was made wasto install all the system in one main beam. Thisbeam would have a pin, placed at mid height ofthe beam, that would have be the centre of rota-tion. This pin would be the part responsible forholding all the weight of the beam and its struc-ture. Also this structure would have a variable
load cell position so it can adjust the measure ofthe thrust to the tested propulsive system. Severalideas and version were created, however after af-ter re-designinged these versions, it resulted in thestructure represented in figure 4. The final struc-ture was re-design in order to assembly correctlythe load cell but also the bearing housing unit wasrotated to a vertical position due to the advance ofthe main beam. With this, it was ensured a stablestructure.
(a) Top view
(b) Perspective view
Figure 4: Proposed solution for the measuring sys-tem of the test rig.
In figure 4 b), it is possible to see the several dif-ferent components that the structure will contain.Table 2 briefly describes the components present inthe structure.
Component Name1 Main beam2 Support Beam3 Rear beam4 Load cell5 Pin/Rod6 Bearing Housing Unit
Table 2: Description of the components present inthe structure
Also, as it was said previously, the load cell willhave a variable position in the main beam. Thevalue measured in the load cell will depend wherethe user of the test rig will position the load cell.In table 3 it is possible to see the available relations
3
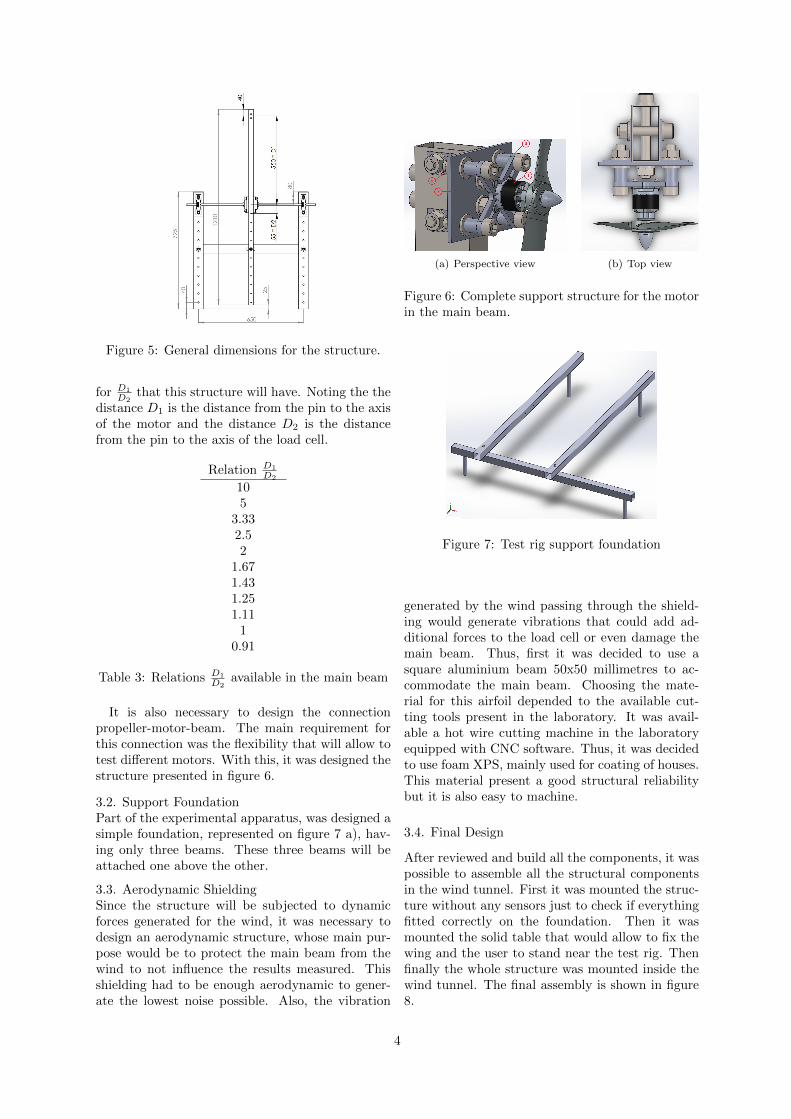
Figure 5: General dimensions for the structure.
for D1
D2that this structure will have. Noting the the
distance D1 is the distance from the pin to the axisof the motor and the distance D2 is the distancefrom the pin to the axis of the load cell.
Relation D1
D2
105
3.332.52
1.671.431.251.11
10.91
Table 3: Relations D1
D2available in the main beam
It is also necessary to design the connectionpropeller-motor-beam. The main requirement forthis connection was the flexibility that will allow totest different motors. With this, it was designed thestructure presented in figure 6.
3.2. Support FoundationPart of the experimental apparatus, was designed asimple foundation, represented on figure 7 a), hav-ing only three beams. These three beams will beattached one above the other.
3.3. Aerodynamic ShieldingSince the structure will be subjected to dynamicforces generated for the wind, it was necessary todesign an aerodynamic structure, whose main pur-pose would be to protect the main beam from thewind to not influence the results measured. Thisshielding had to be enough aerodynamic to gener-ate the lowest noise possible. Also, the vibration
(a) Perspective view (b) Top view
Figure 6: Complete support structure for the motorin the main beam.
Figure 7: Test rig support foundation
generated by the wind passing through the shield-ing would generate vibrations that could add ad-ditional forces to the load cell or even damage themain beam. Thus, first it was decided to use asquare aluminium beam 50x50 millimetres to ac-commodate the main beam. Choosing the mate-rial for this airfoil depended to the available cut-ting tools present in the laboratory. It was avail-able a hot wire cutting machine in the laboratoryequipped with CNC software. Thus, it was decidedto use foam XPS, mainly used for coating of houses.This material present a good structural reliabilitybut it is also easy to machine.
3.4. Final Design
After reviewed and build all the components, it waspossible to assemble all the structural componentsin the wind tunnel. First it was mounted the struc-ture without any sensors just to check if everythingfitted correctly on the foundation. Then it wasmounted the solid table that would allow to fix thewing and the user to stand near the test rig. Thenfinally the whole structure was mounted inside thewind tunnel. The final assembly is shown in figure8.
4
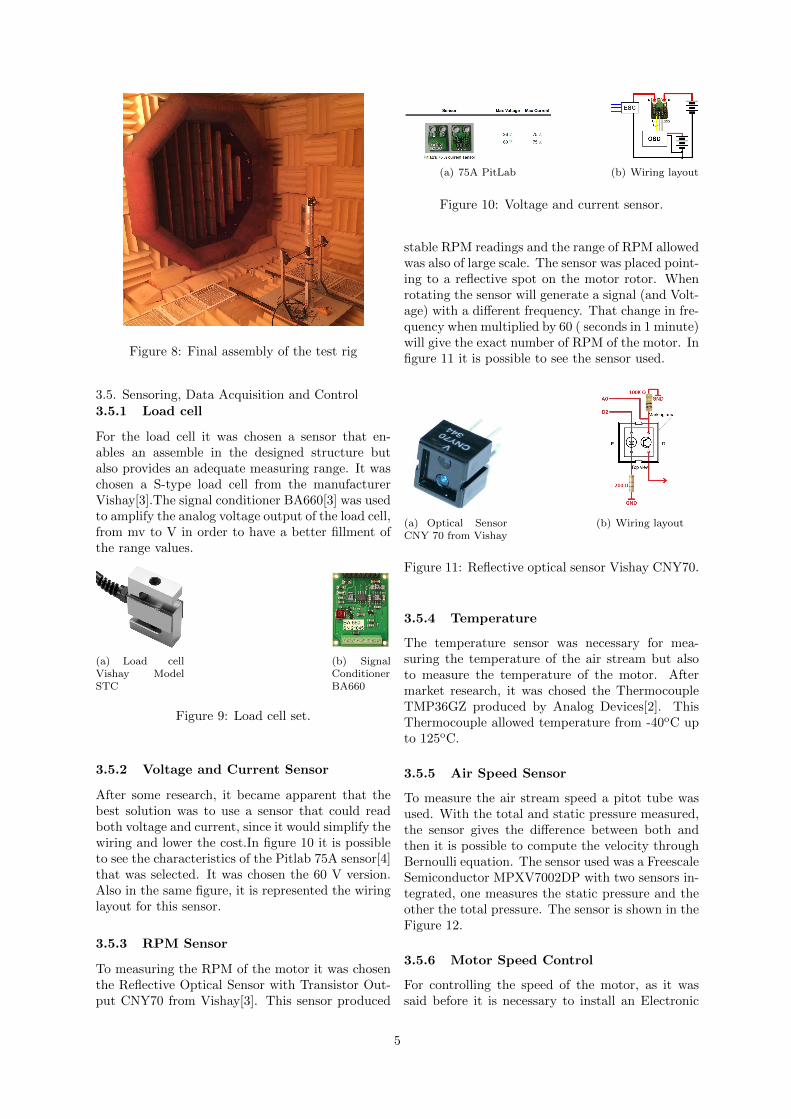
Figure 8: Final assembly of the test rig
3.5. Sensoring, Data Acquisition and Control3.5.1 Load cell
For the load cell it was chosen a sensor that en-ables an assemble in the designed structure butalso provides an adequate measuring range. It waschosen a S-type load cell from the manufacturerVishay[3].The signal conditioner BA660[3] was usedto amplify the analog voltage output of the load cell,from mv to V in order to have a better fillment ofthe range values.
(a) Load cellVishay ModelSTC
(b) SignalConditionerBA660
Figure 9: Load cell set.
3.5.2 Voltage and Current Sensor
After some research, it became apparent that thebest solution was to use a sensor that could readboth voltage and current, since it would simplify thewiring and lower the cost.In figure 10 it is possibleto see the characteristics of the Pitlab 75A sensor[4]that was selected. It was chosen the 60 V version.Also in the same figure, it is represented the wiringlayout for this sensor.
3.5.3 RPM Sensor
To measuring the RPM of the motor it was chosenthe Reflective Optical Sensor with Transistor Out-put CNY70 from Vishay[3]. This sensor produced
(a) 75A PitLab (b) Wiring layout
Figure 10: Voltage and current sensor.
stable RPM readings and the range of RPM allowedwas also of large scale. The sensor was placed point-ing to a reflective spot on the motor rotor. Whenrotating the sensor will generate a signal (and Volt-age) with a different frequency. That change in fre-quency when multiplied by 60 ( seconds in 1 minute)will give the exact number of RPM of the motor. Infigure 11 it is possible to see the sensor used.
(a) Optical SensorCNY 70 from Vishay
(b) Wiring layout
Figure 11: Reflective optical sensor Vishay CNY70.
3.5.4 Temperature
The temperature sensor was necessary for mea-suring the temperature of the air stream but alsoto measure the temperature of the motor. Aftermarket research, it was chosed the ThermocoupleTMP36GZ produced by Analog Devices[2]. ThisThermocouple allowed temperature from -40oC upto 125oC.
3.5.5 Air Speed Sensor
To measure the air stream speed a pitot tube wasused. With the total and static pressure measured,the sensor gives the difference between both andthen it is possible to compute the velocity throughBernoulli equation. The sensor used was a FreescaleSemiconductor MPXV7002DP with two sensors in-tegrated, one measures the static pressure and theother the total pressure. The sensor is shown in theFigure 12.
3.5.6 Motor Speed Control
For controlling the speed of the motor, as it wassaid before it is necessary to install an Electronic
5
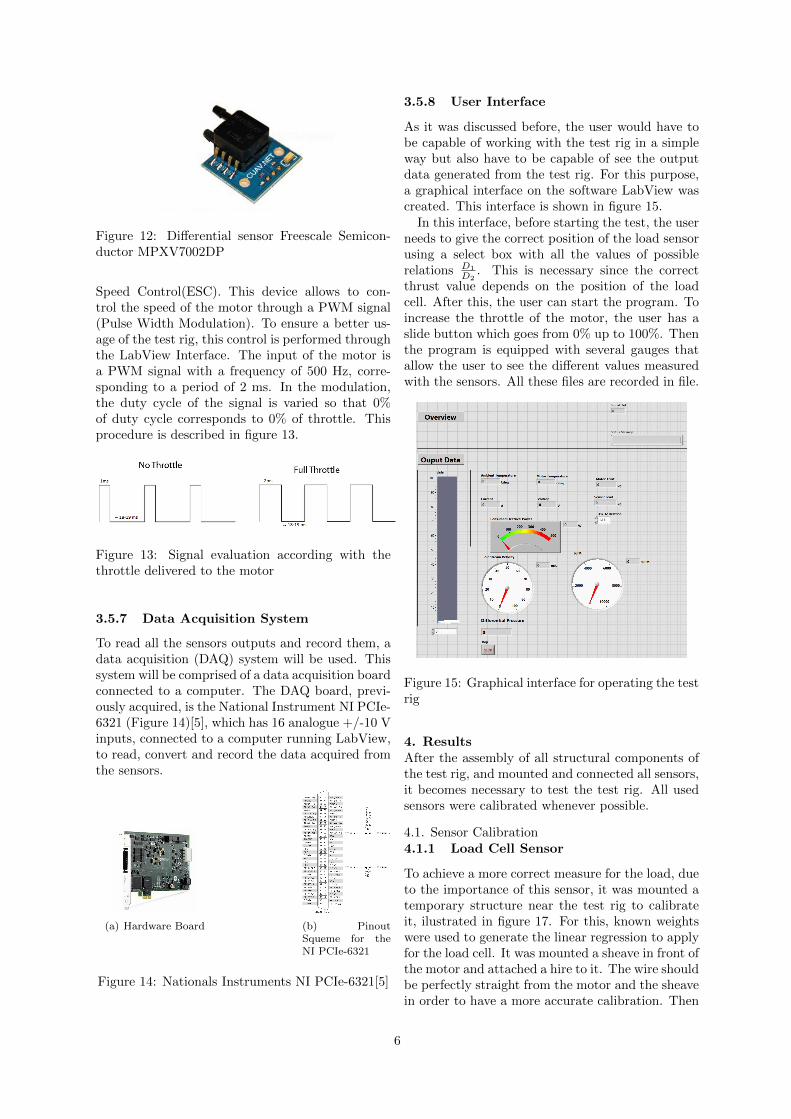
Figure 12: Differential sensor Freescale Semicon-ductor MPXV7002DP
Speed Control(ESC). This device allows to con-trol the speed of the motor through a PWM signal(Pulse Width Modulation). To ensure a better us-age of the test rig, this control is performed throughthe LabView Interface. The input of the motor isa PWM signal with a frequency of 500 Hz, corre-sponding to a period of 2 ms. In the modulation,the duty cycle of the signal is varied so that 0%of duty cycle corresponds to 0% of throttle. Thisprocedure is described in figure 13.
Figure 13: Signal evaluation according with thethrottle delivered to the motor
3.5.7 Data Acquisition System
To read all the sensors outputs and record them, adata acquisition (DAQ) system will be used. Thissystem will be comprised of a data acquisition boardconnected to a computer. The DAQ board, previ-ously acquired, is the National Instrument NI PCIe-6321 (Figure 14)[5], which has 16 analogue +/-10 Vinputs, connected to a computer running LabView,to read, convert and record the data acquired fromthe sensors.
(a) Hardware Board (b) PinoutSqueme for theNI PCIe-6321
Figure 14: Nationals Instruments NI PCIe-6321[5]
3.5.8 User Interface
As it was discussed before, the user would have tobe capable of working with the test rig in a simpleway but also have to be capable of see the outputdata generated from the test rig. For this purpose,a graphical interface on the software LabView wascreated. This interface is shown in figure 15.
In this interface, before starting the test, the userneeds to give the correct position of the load sensorusing a select box with all the values of possiblerelations D1
D2. This is necessary since the correct
thrust value depends on the position of the loadcell. After this, the user can start the program. Toincrease the throttle of the motor, the user has aslide button which goes from 0% up to 100%. Thenthe program is equipped with several gauges thatallow the user to see the different values measuredwith the sensors. All these files are recorded in file.
Figure 15: Graphical interface for operating the testrig
4. ResultsAfter the assembly of all structural components ofthe test rig, and mounted and connected all sensors,it becomes necessary to test the test rig. All usedsensors were calibrated whenever possible.
4.1. Sensor Calibration4.1.1 Load Cell Sensor
To achieve a more correct measure for the load, dueto the importance of this sensor, it was mounted atemporary structure near the test rig to calibrateit, ilustrated in figure 17. For this, known weightswere used to generate the linear regression to applyfor the load cell. It was mounted a sheave in front ofthe motor and attached a hire to it. The wire shouldbe perfectly straight from the motor and the sheavein order to have a more accurate calibration. Then
6
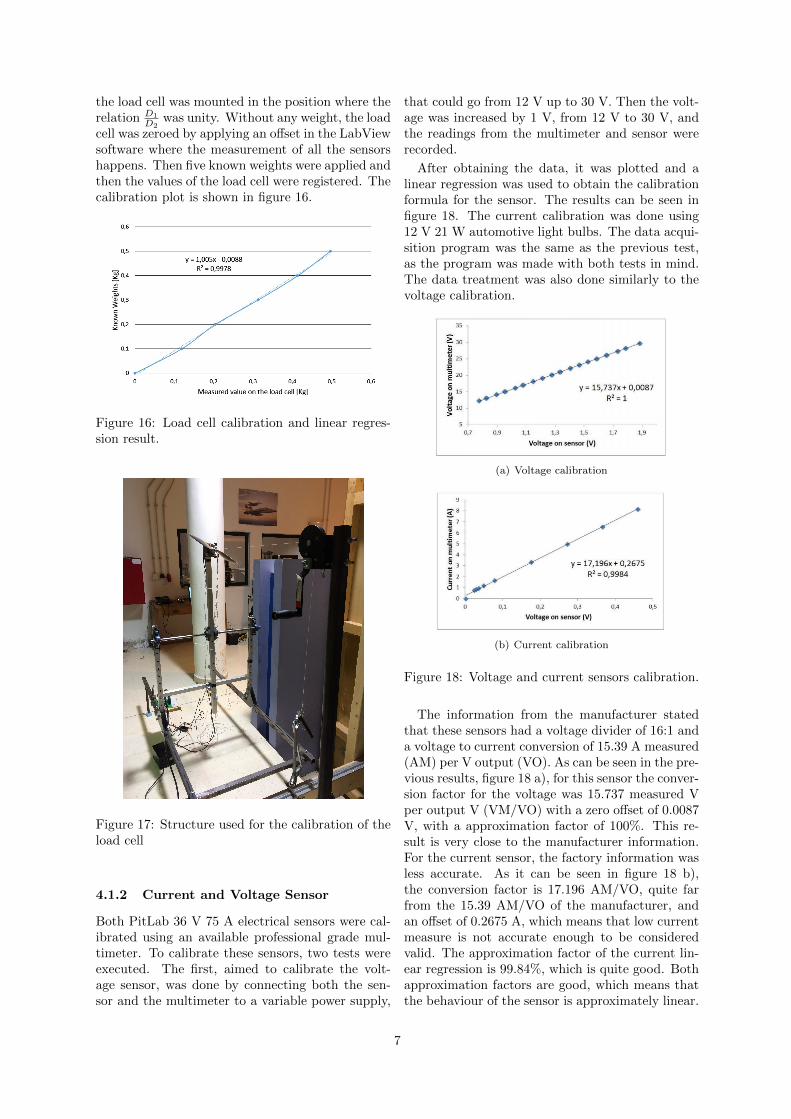
the load cell was mounted in the position where therelation D1
D2was unity. Without any weight, the load
cell was zeroed by applying an offset in the LabViewsoftware where the measurement of all the sensorshappens. Then five known weights were applied andthen the values of the load cell were registered. Thecalibration plot is shown in figure 16.
Figure 16: Load cell calibration and linear regres-sion result.
Figure 17: Structure used for the calibration of theload cell
4.1.2 Current and Voltage Sensor
Both PitLab 36 V 75 A electrical sensors were cal-ibrated using an available professional grade mul-timeter. To calibrate these sensors, two tests wereexecuted. The first, aimed to calibrate the volt-age sensor, was done by connecting both the sen-sor and the multimeter to a variable power supply,
that could go from 12 V up to 30 V. Then the volt-age was increased by 1 V, from 12 V to 30 V, andthe readings from the multimeter and sensor wererecorded.
After obtaining the data, it was plotted and alinear regression was used to obtain the calibrationformula for the sensor. The results can be seen infigure 18. The current calibration was done using12 V 21 W automotive light bulbs. The data acqui-sition program was the same as the previous test,as the program was made with both tests in mind.The data treatment was also done similarly to thevoltage calibration.
(a) Voltage calibration
(b) Current calibration
Figure 18: Voltage and current sensors calibration.
The information from the manufacturer statedthat these sensors had a voltage divider of 16:1 anda voltage to current conversion of 15.39 A measured(AM) per V output (VO). As can be seen in the pre-vious results, figure 18 a), for this sensor the conver-sion factor for the voltage was 15.737 measured Vper output V (VM/VO) with a zero offset of 0.0087V, with a approximation factor of 100%. This re-sult is very close to the manufacturer information.For the current sensor, the factory information wasless accurate. As it can be seen in figure 18 b),the conversion factor is 17.196 AM/VO, quite farfrom the 15.39 AM/VO of the manufacturer, andan offset of 0.2675 A, which means that low currentmeasure is not accurate enough to be consideredvalid. The approximation factor of the current lin-ear regression is 99.84%, which is quite good. Bothapproximation factors are good, which means thatthe behaviour of the sensor is approximately linear.
7
4.1.3 Air Speed Sensor
The Pitot tube installed in the test rig was cali-brated using a Pitot tube that was already installedin the wind tunnel and correctly calibrated. It wasprovided the relation between the frequency of theelectrical motor that drives the wind tunnel fan andthe true airspeed inside the tunnel. This informa-tion is shown in figure 19.
After this, the procedure done for calibrating thissensor was similar to the one performed for the loadcell. First the sensor was reset so it can measurezero, and then a linear regression was applied basedon the values presented in figure 19. Six measure-ments were done through the tests and the speedmeasured by the sensor was compared to the truevalue. The linear regression obtained is shown infigure 20.
Figure 19: Relation of wind tunnel motor frequencywith the true wind airspeed
Figure 20: Linear regression applied to the airspeedsensor
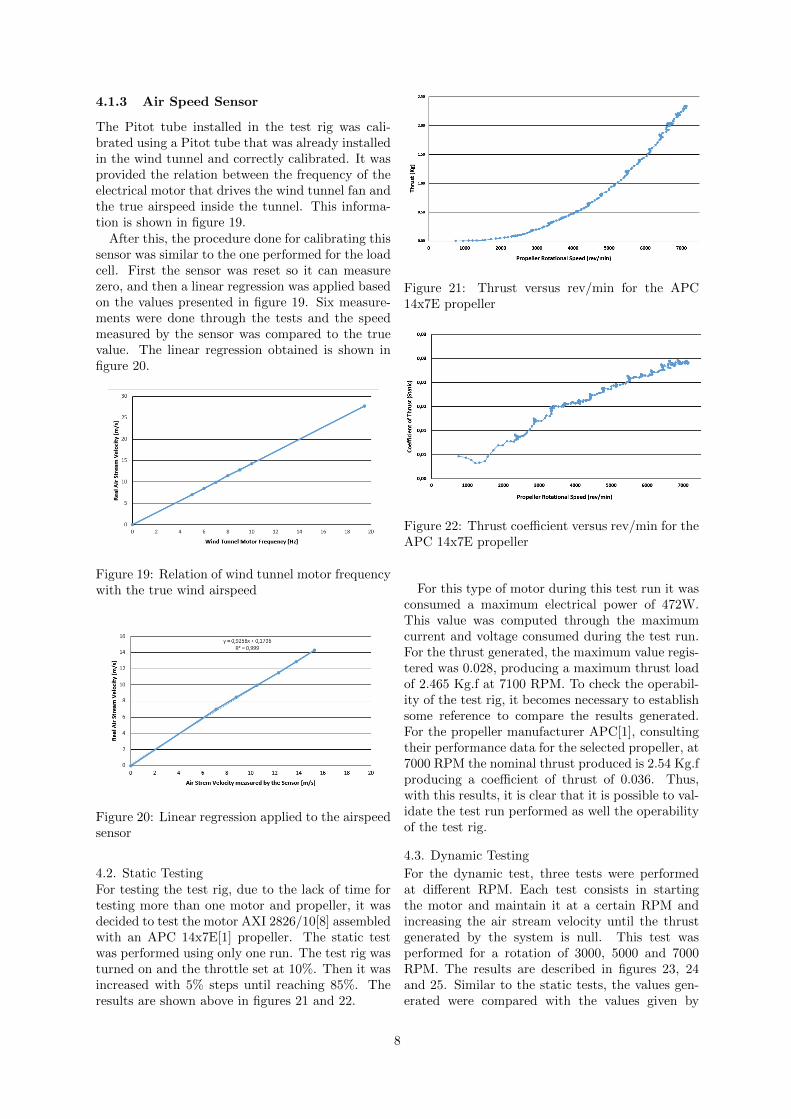
4.2. Static TestingFor testing the test rig, due to the lack of time fortesting more than one motor and propeller, it wasdecided to test the motor AXI 2826/10[8] assembledwith an APC 14x7E[1] propeller. The static testwas performed using only one run. The test rig wasturned on and the throttle set at 10%. Then it wasincreased with 5% steps until reaching 85%. Theresults are shown above in figures 21 and 22.
Figure 21: Thrust versus rev/min for the APC14x7E propeller
Figure 22: Thrust coefficient versus rev/min for theAPC 14x7E propeller
For this type of motor during this test run it wasconsumed a maximum electrical power of 472W.This value was computed through the maximumcurrent and voltage consumed during the test run.For the thrust generated, the maximum value regis-tered was 0.028, producing a maximum thrust loadof 2.465 Kg.f at 7100 RPM. To check the operabil-ity of the test rig, it becomes necessary to establishsome reference to compare the results generated.For the propeller manufacturer APC[1], consultingtheir performance data for the selected propeller, at7000 RPM the nominal thrust produced is 2.54 Kg.fproducing a coefficient of thrust of 0.036. Thus,with this results, it is clear that it is possible to val-idate the test run performed as well the operabilityof the test rig.
4.3. Dynamic Testing
For the dynamic test, three tests were performedat different RPM. Each test consists in startingthe motor and maintain it at a certain RPM andincreasing the air stream velocity until the thrustgenerated by the system is null. This test wasperformed for a rotation of 3000, 5000 and 7000RPM. The results are described in figures 23, 24and 25. Similar to the static tests, the values gen-erated were compared with the values given by
8
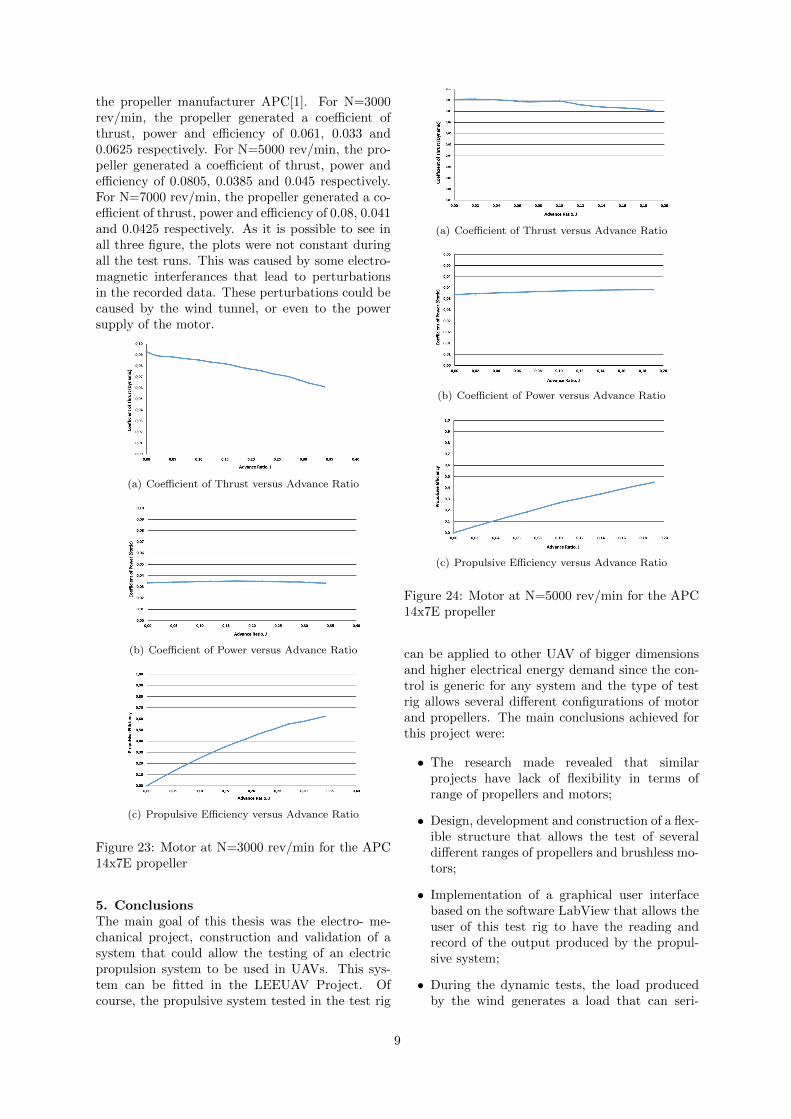
the propeller manufacturer APC[1]. For N=3000rev/min, the propeller generated a coefficient ofthrust, power and efficiency of 0.061, 0.033 and0.0625 respectively. For N=5000 rev/min, the pro-peller generated a coefficient of thrust, power andefficiency of 0.0805, 0.0385 and 0.045 respectively.For N=7000 rev/min, the propeller generated a co-efficient of thrust, power and efficiency of 0.08, 0.041and 0.0425 respectively. As it is possible to see inall three figure, the plots were not constant duringall the test runs. This was caused by some electro-magnetic interferances that lead to perturbationsin the recorded data. These perturbations could becaused by the wind tunnel, or even to the powersupply of the motor.
(a) Coefficient of Thrust versus Advance Ratio
(b) Coefficient of Power versus Advance Ratio
(c) Propulsive Efficiency versus Advance Ratio
Figure 23: Motor at N=3000 rev/min for the APC14x7E propeller
5. ConclusionsThe main goal of this thesis was the electro- me-chanical project, construction and validation of asystem that could allow the testing of an electricpropulsion system to be used in UAVs. This sys-tem can be fitted in the LEEUAV Project. Ofcourse, the propulsive system tested in the test rig
(a) Coefficient of Thrust versus Advance Ratio
(b) Coefficient of Power versus Advance Ratio
(c) Propulsive Efficiency versus Advance Ratio
Figure 24: Motor at N=5000 rev/min for the APC14x7E propeller
can be applied to other UAV of bigger dimensionsand higher electrical energy demand since the con-trol is generic for any system and the type of testrig allows several different configurations of motorand propellers. The main conclusions achieved forthis project were:
• The research made revealed that similarprojects have lack of flexibility in terms ofrange of propellers and motors;
• Design, development and construction of a flex-ible structure that allows the test of severaldifferent ranges of propellers and brushless mo-tors;
• Implementation of a graphical user interfacebased on the software LabView that allows theuser of this test rig to have the reading andrecord of the output produced by the propul-sive system;
• During the dynamic tests, the load producedby the wind generates a load that can seri-
9
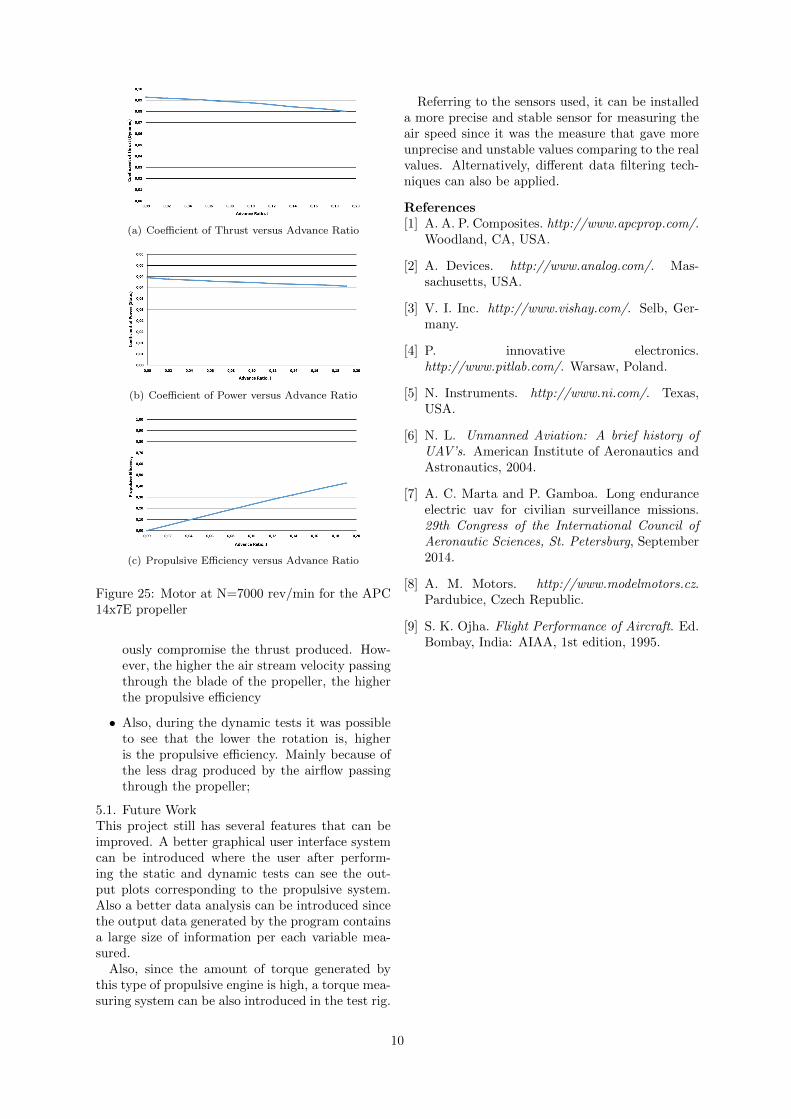
(a) Coefficient of Thrust versus Advance Ratio
(b) Coefficient of Power versus Advance Ratio
(c) Propulsive Efficiency versus Advance Ratio
Figure 25: Motor at N=7000 rev/min for the APC14x7E propeller
ously compromise the thrust produced. How-ever, the higher the air stream velocity passingthrough the blade of the propeller, the higherthe propulsive efficiency
• Also, during the dynamic tests it was possibleto see that the lower the rotation is, higheris the propulsive efficiency. Mainly because ofthe less drag produced by the airflow passingthrough the propeller;
5.1. Future WorkThis project still has several features that can beimproved. A better graphical user interface systemcan be introduced where the user after perform-ing the static and dynamic tests can see the out-put plots corresponding to the propulsive system.Also a better data analysis can be introduced sincethe output data generated by the program containsa large size of information per each variable mea-sured.
Also, since the amount of torque generated bythis type of propulsive engine is high, a torque mea-suring system can be also introduced in the test rig.
Referring to the sensors used, it can be installeda more precise and stable sensor for measuring theair speed since it was the measure that gave moreunprecise and unstable values comparing to the realvalues. Alternatively, different data filtering tech-niques can also be applied.
References[1] A. A. P. Composites. http://www.apcprop.com/.
Woodland, CA, USA.
[2] A. Devices. http://www.analog.com/. Mas-sachusetts, USA.
[3] V. I. Inc. http://www.vishay.com/. Selb, Ger-many.
[4] P. innovative electronics.http://www.pitlab.com/. Warsaw, Poland.
[5] N. Instruments. http://www.ni.com/. Texas,USA.
[6] N. L. Unmanned Aviation: A brief history ofUAV’s. American Institute of Aeronautics andAstronautics, 2004.
[7] A. C. Marta and P. Gamboa. Long enduranceelectric uav for civilian surveillance missions.29th Congress of the International Council ofAeronautic Sciences, St. Petersburg, September2014.
[8] A. M. Motors. http://www.modelmotors.cz.Pardubice, Czech Republic.
[9] S. K. Ojha. Flight Performance of Aircraft. Ed.Bombay, India: AIAA, 1st edition, 1995.
10