Embed Size (px)
Citation preview
© 2017 KPMG, an Indian Registered Partnership and a member firm of the KPMG network of independent member firms affiliated with KPMG International Cooperative (“KPMG International”),
A Swiss entity. All rights reserved.
1
India Economic Survey 2016-17 – Key highlights
Flash News
31 January 2017
KPMG.com/in
© 2017 KPMG, an Indian Registered Partnership and a member firm of the KPMG network of independent member firms affiliated with KPMG International Cooperative (“KPMG International”),
A Swiss entity. All rights reserved.
2
The Hon’ble Finance Minister, Arun Jaitley, presented the Economic Survey 2016–17 in the Parliament on 31 January 2017. This annual document covers developments in the Indian economy during the financial year 2016–17; summarises the performance of major developmental initiatives; highlights the steps taken by the Government and the prospects of the economy in the short to medium-term. Following are some key highlights of the survey:
The state of the Indian economy Performance during 2015–16 and 2016–171
• The global economy continues to face subdued growth owing to low commodity prices and low inflation rates, stagnant growth in advanced economies, and geopolitical and political uncertainties. The International Monetary Fund (IMF) projects global economic growth to be 3.1 per cent in 2016, with expectations to recover to 3.4 per cent in 2017.
• Against the dismal global conditions, the Indian economy’s expansion has been noteworthy. Despite an expected decline in the growth rate owing to slowdown in manufacturing, decline in budgetary capital expenditure and demonetisation, India is expected to continue as the fastest growing large economy.
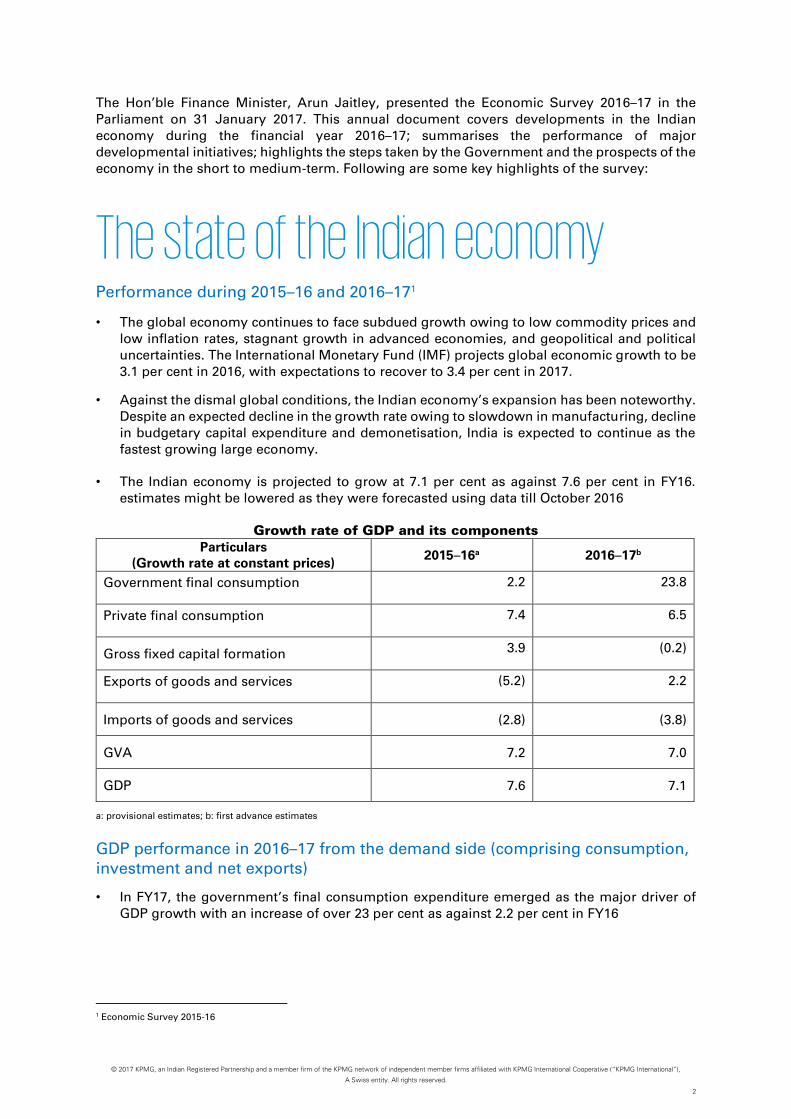
• The Indian economy is projected to grow at 7.1 per cent as against 7.6 per cent in FY16. estimates might be lowered as they were forecasted using data till October 2016
Growth rate of GDP and its components
Particulars (Growth rate at constant prices)
2015–16a 2016–17b
Government final consumption 2.2 23.8
Private final consumption 7.4 6.5
Gross fixed capital formation 3.9 (0.2)
Exports of goods and services (5.2) 2.2
Imports of goods and services (2.8) (3.8)
GVA 7.2 7.0
GDP 7.6 7.1
a: provisional estimates; b: first advance estimates
GDP performance in 2016–17 from the demand side (comprising consumption, investment and net exports)
• In FY17, the government’s final consumption expenditure emerged as the major driver of GDP growth with an increase of over 23 per cent as against 2.2 per cent in FY16
1 Economic Survey 2015-16
• The Gross Fixed Capital Formation (GFCF) to GDP at constant prices, an indicator of investments across the country, declined by 0.2 per cent in FY17, continuing the downward trend since 2011.
• In FY16, exports of goods and services witnessed a growth of 2.2 per cent (Advanced Estimates) as against a y-o-y decline of 5.2 per cent in FY15, owing to partial recovery in commodity prices. The imports witnessed a y-o-y decline of 3.8 per cent due to lower gold and other bullion imports.
Inflation and monetary policy
• India’s Wholesale Price Index (WPI) based inflation witnessed a reversal from -5.1 per cent in August 2015 to 3.4 per cent in December 2016 due to rising crude oil prices in the international market towards the end of 2016.
• The Consumer Price Index (CPI) based inflation witnessed a steep decline since July 2016, owing to lower prices of pulses as a result of a bountiful kharif crop production. The CPI based inflation averaged 4.9 per cent during April-December 2016.
GDP outlook for 2017–18
• The country’s economic growth is facing challenges such as subdued manufacturing, lower exports of services, and lower capital expenditure
• However, during FY18, cheap borrowing costs and fading impact of demonetisation could increase the private consumption and thereby drive economic growth
• The implementation of Goods and Services Tax (GST) is expected to improve tax compliance and governance, and might provide an impetus to the investments and growth in the country
• Due to favourable indicators such as moderate levels of inflation, reduced Current Account Deficit (CAD), fiscal consolidation and transitory impact of demonetisation, the country is currently characterised as a stable macroeconomic situation, the Government expects India’s GDP to expand at a growth rate between 6.75–7.5 per cent during 2017-18.
Public finance • The fiscal policy for 2016-17 reiterated the Government’s commitment to cut down the fiscal
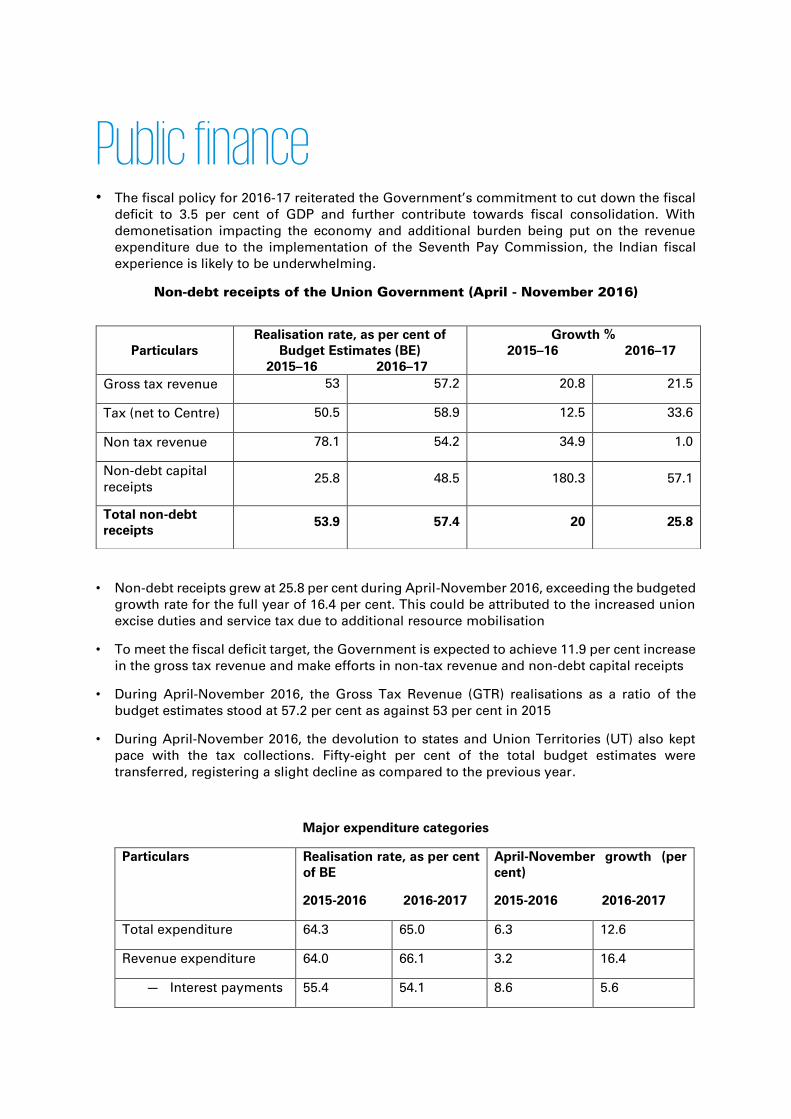
deficit to 3.5 per cent of GDP and further contribute towards fiscal consolidation. With demonetisation impacting the economy and additional burden being put on the revenue expenditure due to the implementation of the Seventh Pay Commission, the Indian fiscal experience is likely to be underwhelming.
Non-debt receipts of the Union Government (April - November 2016)
• Non-debt receipts grew at 25.8 per cent during April-November 2016, exceeding the budgeted growth rate for the full year of 16.4 per cent. This could be attributed to the increased union excise duties and service tax due to additional resource mobilisation
• To meet the fiscal deficit target, the Government is expected to achieve 11.9 per cent increase in the gross tax revenue and make efforts in non-tax revenue and non-debt capital receipts
• During April-November 2016, the Gross Tax Revenue (GTR) realisations as a ratio of the budget estimates stood at 57.2 per cent as against 53 per cent in 2015
• During April-November 2016, the devolution to states and Union Territories (UT) also kept pace with the tax collections. Fifty-eight per cent of the total budget estimates were transferred, registering a slight decline as compared to the previous year.
Major expenditure categories
Particulars Realisation rate, as per cent of BE
2015-2016 2016-2017
April-November growth (per cent)
2015-2016 2016-2017
Total expenditure 64.3 65.0 6.3 12.6
Revenue expenditure 64.0 66.1 3.2 16.4
— Interest payments 55.4 54.1 8.6 5.6
Particulars Realisation rate, as per cent of
Budget Estimates (BE) 2015–16 2016–17
Growth % 2015–16 2016–17
Gross tax revenue 53 57.2 20.8 21.5
Tax (net to Centre) 50.5 58.9 12.5 33.6
Non tax revenue 78.1 54.2 34.9 1.0
Non-debt capital receipts
25.8 48.5 180.3 57.1
Total non-debt receipts
53.9 57.4 20 25.8
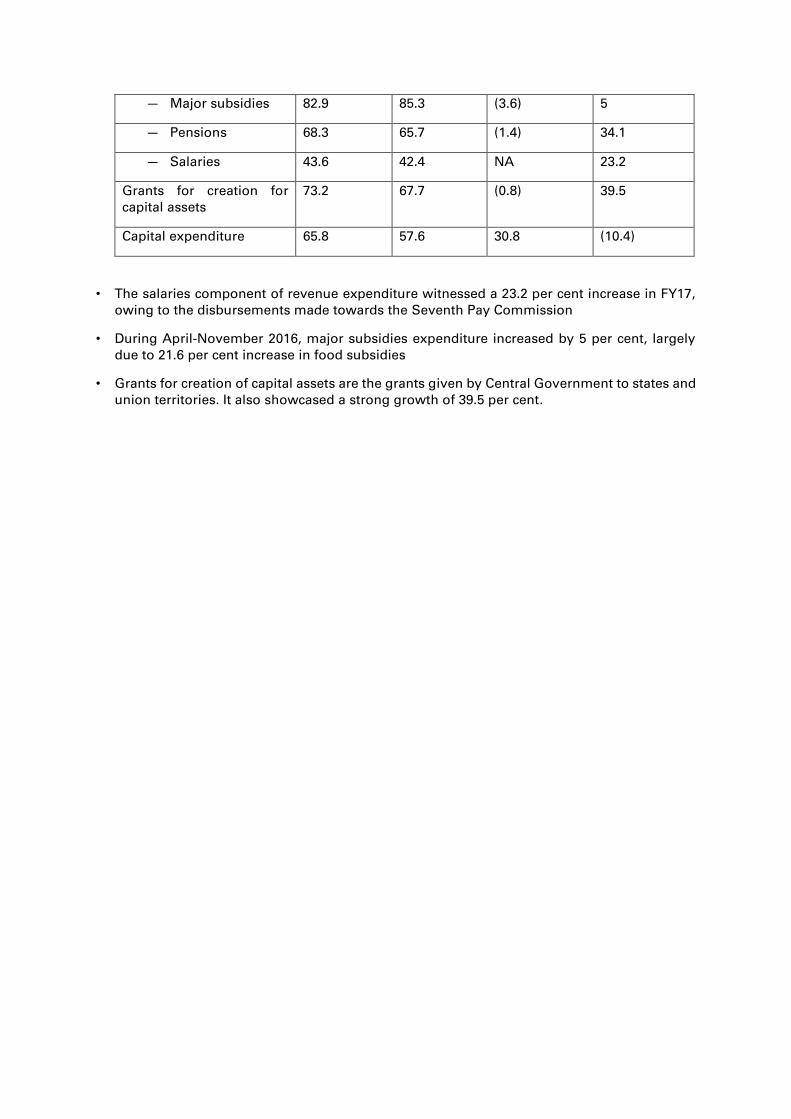
— Major subsidies 82.9 85.3 (3.6) 5
— Pensions 68.3 65.7 (1.4) 34.1
— Salaries 43.6 42.4 NA 23.2
Grants for creation for capital assets
73.2 67.7 (0.8) 39.5
Capital expenditure 65.8 57.6 30.8 (10.4)
• The salaries component of revenue expenditure witnessed a 23.2 per cent increase in FY17, owing to the disbursements made towards the Seventh Pay Commission
• During April-November 2016, major subsidies expenditure increased by 5 per cent, largely due to 21.6 per cent increase in food subsidies
• Grants for creation of capital assets are the grants given by Central Government to states and union territories. It also showcased a strong growth of 39.5 per cent.
Monetary management and financial
intermediation • The Indian Government amended the Reserve Bank of India Act during 2016–17, according to
which the Government in consultation with the Reserve Bank would set the inflation target every five years. As per the revised Monetary Policy Framework, the Government fixed the inflation target to 4 per cent with a tolerance level of +/- 2 per cent for the period 5 August 2016 to 31 March 2021.
• To manage the liquidity situation, the RBI provided durable liquidity through buying/selling Government securities and mopped surplus liquidity through variable reverse repo rate post the withdrawal of specified bank notes. The Government also increased the limit on securities under market stabilisation scheme from INR30,000 crore to INR6 lakh crore.
• Overall Non food credit growth was largely due to bank credit lending to agriculture and allied activities and personal loan segments during the current financial year. Credit growth to industrial sector remained below 1 per cent. Non food credit outstanding grew at below 10 per cent for the major part of the year.
• The performance of public sector banks followed a similar trend as seen in 2015–16 and continued to be subdued during 2016–17. Profit after tax contracted in the H1 2016–17 due to loan write-offs, decline in net interest income and growth in risk provisions.
• To strengthen the corporate bond market, RBI took a number of measures during 2016–17
Commercial banks were allowed to issue rupee-denominated bonds overseas for their capital requirements
Brokers registered with SEBI and authorised in corporate bond market were permitted to undertake repo/reverse repo contracts in corporate debt securities
Banks were allowed to increase the partial credit enhancement on corporate bonds from 20 per cent to 50 per cent
Primary dealers were allowed to act as market makers for Government bonds, which made Government securities more accessible to retail investors
Entities exposed to exchange rate risks were allowed to take hedge transactions up to a limit of USD30 million at any given time
• The Indian market recorded a moderate growth with the Sensex up by 1.95 per cent for the calendar year 2016 when compared to the losses recorded in 2015. Factors such as the Brexit, the U.S. Presidential elections and policy announcements by RBI had a sizeable impact on market sentiments.
• Net Foreign Portfolio Investment turned negative in 2016 since the meltdown of 2008, indicating that there was an outflow from the Indian market.
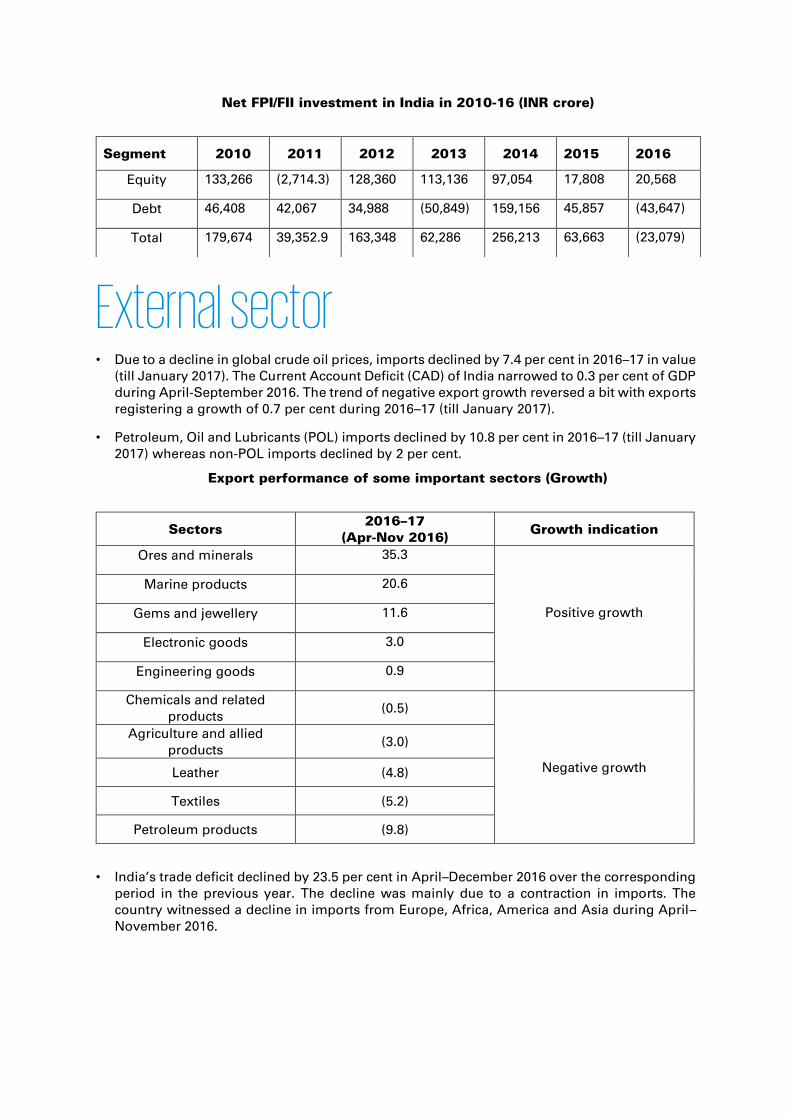
Net FPI/FII investment in India in 2010-16 (INR crore)
External sector • Due to a decline in global crude oil prices, imports declined by 7.4 per cent in 2016–17 in value
(till January 2017). The Current Account Deficit (CAD) of India narrowed to 0.3 per cent of GDP during April-September 2016. The trend of negative export growth reversed a bit with exports registering a growth of 0.7 per cent during 2016–17 (till January 2017).
• Petroleum, Oil and Lubricants (POL) imports declined by 10.8 per cent in 2016–17 (till January 2017) whereas non-POL imports declined by 2 per cent.
Export performance of some important sectors (Growth)
• India’s trade deficit declined by 23.5 per cent in April–December 2016 over the corresponding period in the previous year. The decline was mainly due to a contraction in imports. The country witnessed a decline in imports from Europe, Africa, America and Asia during April–November 2016.
Segment 2010 2011 2012 2013 2014 2015 2016
Equity 133,266 (2,714.3) 128,360 113,136 97,054 17,808 20,568
Debt 46,408 42,067 34,988 (50,849) 159,156 45,857 (43,647)
Total 179,674 39,352.9 163,348 62,286 256,213 63,663 (23,079)
Sectors 2016–17
(Apr-Nov 2016) Growth indication
Ores and minerals 35.3
Positive growth
Marine products 20.6
Gems and jewellery 11.6
Electronic goods 3.0
Engineering goods 0.9
Chemicals and related products
(0.5)
Negative growth
Agriculture and allied products
(3.0)
Leather (4.8)
Textiles (5.2)
Petroleum products (9.8)
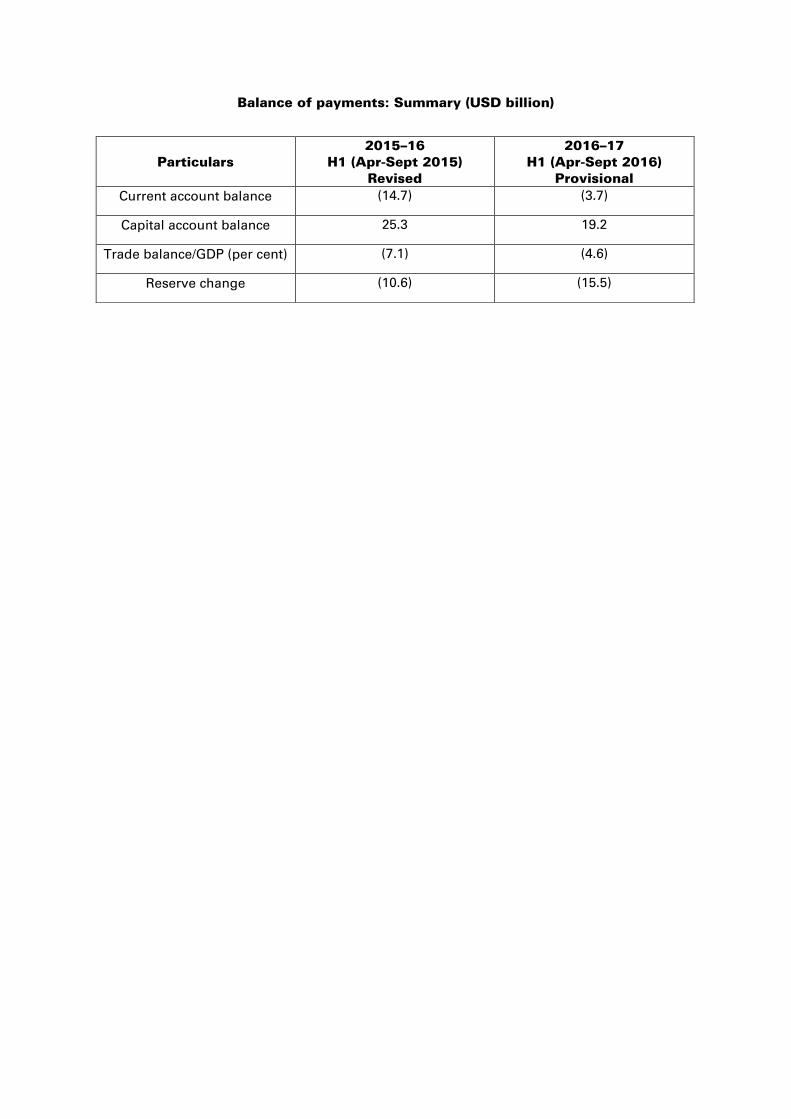
Balance of payments: Summary (USD billion)
Particulars 2015–16
H1 (Apr-Sept 2015) Revised
2016–17 H1 (Apr-Sept 2016)
Provisional
Current account balance (14.7) (3.7)
Capital account balance 25.3 19.2
Trade balance/GDP (per cent) (7.1) (4.6)
Reserve change (10.6) (15.5)
Sector-wise performance of GDP Agriculture and food management
• The Agriculture and Allied sector witnessed an improved rate of growth in FY17. According to the first advance estimates by the Central Statistical Organisation (CSO), the sector is expected to grow at 4.1 per cent in FY17. This is largely on account of a normal monsoon throughout the country for the current fiscal, as against sub-par monsoon during in FY15 and FY16.
• As per the first advance estimates released by the Ministry of Agriculture and Farmers Welfare, the production of kharif crops during FY17 is estimated at 135 million tonnes, compared with 124.1 million tonnes in FY16.
• As of 14 October 2016, total area sown for all kharif crops combined witnessed an increase of 3.5 per cent, from 1,039.7 lakh hectares in FY16 to 1,075.7 lakh hectares in FY17. Arhar registered the maximum percentage increase in acreage during the kharif season in 2016-17 compared to 2015-16.
• The coverage area for rabi crops for FY17 stood at 616.2 lakh hectares, as on 13 January 2017, which is 5.9 per cent higher compared to the corresponding week’s data in FY16.
• Area under irrigation witnessed significant regional and crop-wise variations, incumbent upon volume of rainfall throughout the year
India received 97 per cent of its Long Period Average (LPA) rainfall during the south west monsoon season between June–September 2016. Rainfall received during the period stood at 862 mm as against the LPA of 887.5 mm. Among the 36 meteorological sub-divisions, four received excess rainfall, 23 received normal rainfall, while the remaining nine divisions witnessed deficient rain.
• A committee was formed under the Chairmanship of Chief Economic Adviser, Dr. Arvind Subramanian towards incentivising production of pulses through Minimum Support Price (MSP) and other related policies.
• Minimum Selling Price was raised significantly during FY17 for several pulses in an attempt to incentivise farmers for greater production.
• The stock of food grains (wheat and rice) as on 1 December 2016 stood at 43.5 million tonnes compared to 50.5 million tonnes as on 1 December 2015.
• In an attempt to improve the flow of credit in the agriculture sector, the credit target for FY17 has been fixed at INR9 lakh crore as compared to the previous fiscal target of INR8.5 lakh crore.
• As against the target, the achievement for FY17 (up to September 2016), was 84 per cent of the target, higher than the corresponding figure of 59 per cent up to September 2015, for credit flow to the agriculture sector.
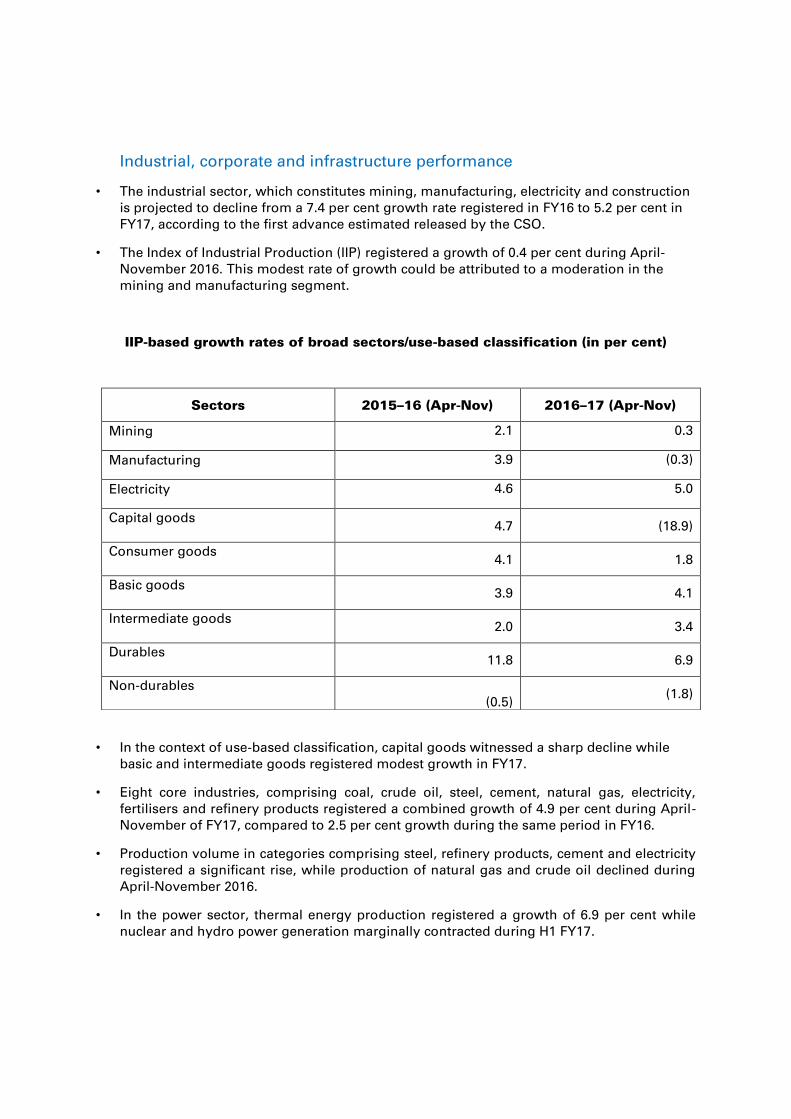
Industrial, corporate and infrastructure performance
• The industrial sector, which constitutes mining, manufacturing, electricity and construction is projected to decline from a 7.4 per cent growth rate registered in FY16 to 5.2 per cent in FY17, according to the first advance estimated released by the CSO.
• The Index of Industrial Production (IIP) registered a growth of 0.4 per cent during April-November 2016. This modest rate of growth could be attributed to a moderation in the mining and manufacturing segment.
IIP-based growth rates of broad sectors/use-based classification (in per cent)
• In the context of use-based classification, capital goods witnessed a sharp decline while basic and intermediate goods registered modest growth in FY17.
• Eight core industries, comprising coal, crude oil, steel, cement, natural gas, electricity, fertilisers and refinery products registered a combined growth of 4.9 per cent during April-November of FY17, compared to 2.5 per cent growth during the same period in FY16.
• Production volume in categories comprising steel, refinery products, cement and electricity registered a significant rise, while production of natural gas and crude oil declined during April-November 2016.
• In the power sector, thermal energy production registered a growth of 6.9 per cent while nuclear and hydro power generation marginally contracted during H1 FY17.
Sectors 2015–16 (Apr-Nov) 2016–17 (Apr-Nov)
Mining 2.1 0.3
Manufacturing 3.9 (0.3)
Electricity 4.6 5.0
Capital goods
4.7 (18.9)
Consumer goods
4.1 1.8
Basic goods
3.9 4.1
Intermediate goods
2.0 3.4
Durables
11.8 6.9
Non-durables
(0.5)
(1.8)
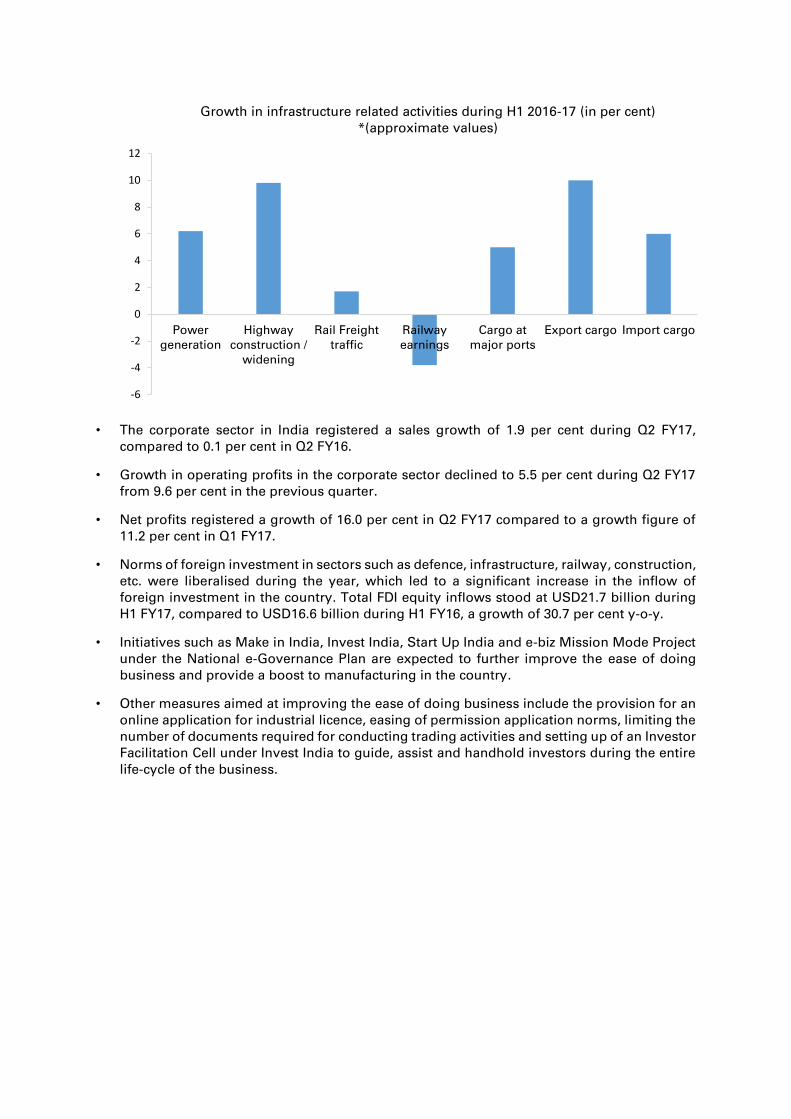
• The corporate sector in India registered a sales growth of 1.9 per cent during Q2 FY17, compared to 0.1 per cent in Q2 FY16.
• Growth in operating profits in the corporate sector declined to 5.5 per cent during Q2 FY17 from 9.6 per cent in the previous quarter.
• Net profits registered a growth of 16.0 per cent in Q2 FY17 compared to a growth figure of 11.2 per cent in Q1 FY17.
• Norms of foreign investment in sectors such as defence, infrastructure, railway, construction, etc. were liberalised during the year, which led to a significant increase in the inflow of foreign investment in the country. Total FDI equity inflows stood at USD21.7 billion during H1 FY17, compared to USD16.6 billion during H1 FY16, a growth of 30.7 per cent y-o-y.
• Initiatives such as Make in India, Invest India, Start Up India and e-biz Mission Mode Project under the National e-Governance Plan are expected to further improve the ease of doing business and provide a boost to manufacturing in the country.
• Other measures aimed at improving the ease of doing business include the provision for an online application for industrial licence, easing of permission application norms, limiting the number of documents required for conducting trading activities and setting up of an Investor Facilitation Cell under Invest India to guide, assist and handhold investors during the entire life-cycle of the business.
-6
-4
-2
0
2
4
6
8
10
12
Powergeneration
Highwayconstruction /
widening
Rail Freighttraffic
Railwayearnings
Cargo atmajor ports
Export cargo Import cargo
Growth in infrastructure related activities during H1 2016-17 (in per cent)*(approximate values)
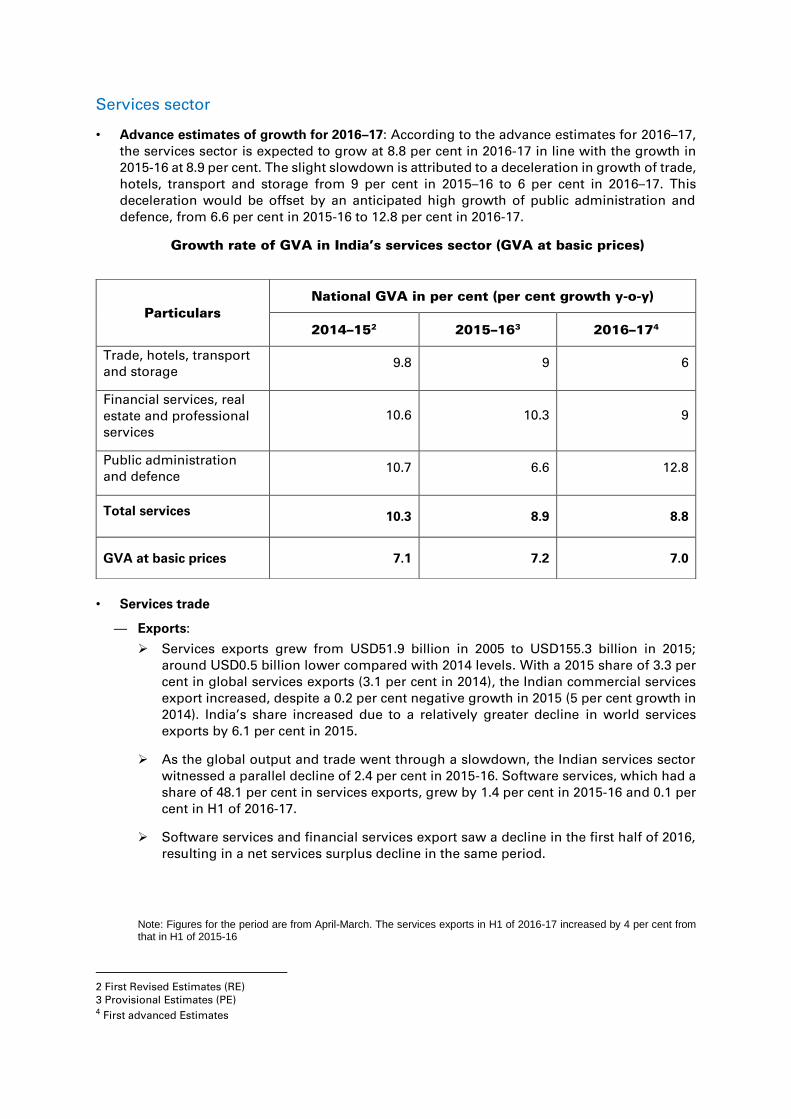
Services sector
• Advance estimates of growth for 2016–17: According to the advance estimates for 2016–17, the services sector is expected to grow at 8.8 per cent in 2016-17 in line with the growth in 2015-16 at 8.9 per cent. The slight slowdown is attributed to a deceleration in growth of trade, hotels, transport and storage from 9 per cent in 2015–16 to 6 per cent in 2016–17. This deceleration would be offset by an anticipated high growth of public administration and defence, from 6.6 per cent in 2015-16 to 12.8 per cent in 2016-17.
Growth rate of GVA in India’s services sector (GVA at basic prices)
• Services trade
— Exports:
Services exports grew from USD51.9 billion in 2005 to USD155.3 billion in 2015; around USD0.5 billion lower compared with 2014 levels. With a 2015 share of 3.3 per cent in global services exports (3.1 per cent in 2014), the Indian commercial services export increased, despite a 0.2 per cent negative growth in 2015 (5 per cent growth in 2014). India’s share increased due to a relatively greater decline in world services exports by 6.1 per cent in 2015.
As the global output and trade went through a slowdown, the Indian services sector witnessed a parallel decline of 2.4 per cent in 2015-16. Software services, which had a share of 48.1 per cent in services exports, grew by 1.4 per cent in 2015-16 and 0.1 per cent in H1 of 2016-17.
Software services and financial services export saw a decline in the first half of 2016, resulting in a net services surplus decline in the same period.
Note: Figures for the period are from April-March. The services exports in H1 of 2016-17 increased by 4 per cent from that in H1 of 2015-16
2 First Revised Estimates (RE) 3 Provisional Estimates (PE) 4 First advanced Estimates
Particulars
National GVA in per cent (per cent growth y-o-y)
2014–152 2015–163 2016–174
Trade, hotels, transport and storage
9.8 9 6
Financial services, real estate and professional services
10.6 10.3 9
Public administration and defence
10.7 6.6 12.8
Total services 10.3 8.9 8.8
GVA at basic prices 7.1 7.2 7.0
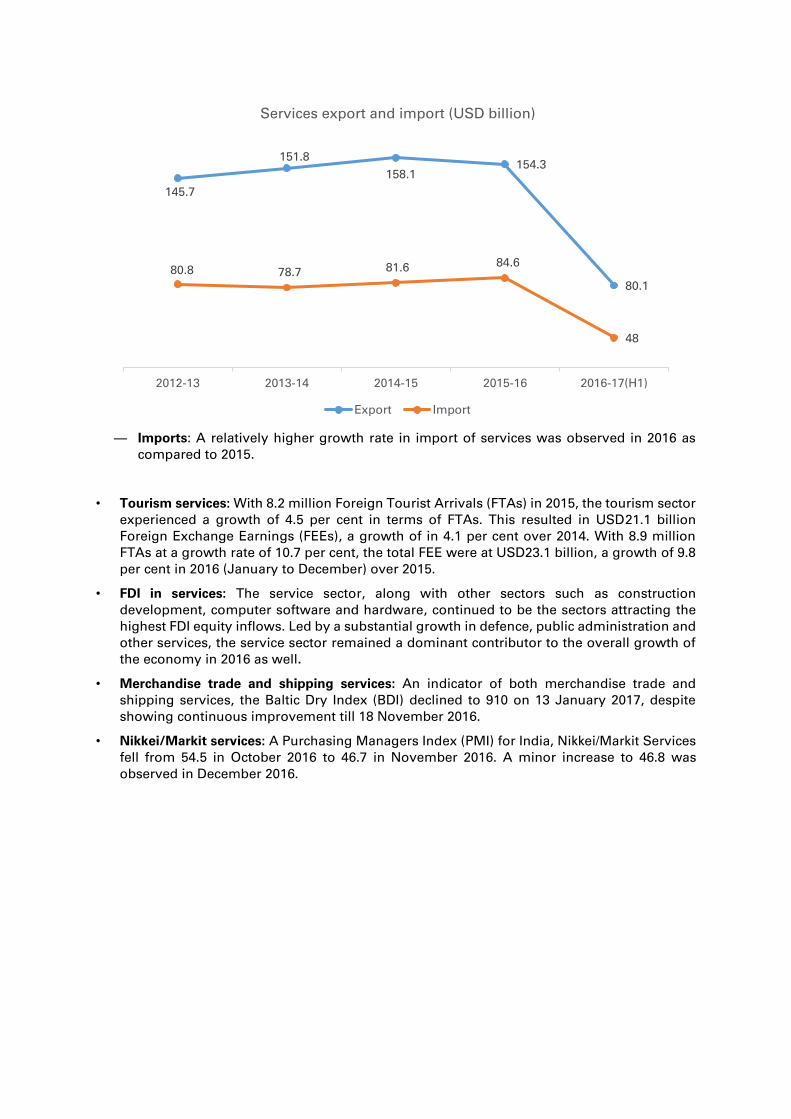
— Imports: A relatively higher growth rate in import of services was observed in 2016 as compared to 2015.
• Tourism services: With 8.2 million Foreign Tourist Arrivals (FTAs) in 2015, the tourism sector experienced a growth of 4.5 per cent in terms of FTAs. This resulted in USD21.1 billion Foreign Exchange Earnings (FEEs), a growth of in 4.1 per cent over 2014. With 8.9 million FTAs at a growth rate of 10.7 per cent, the total FEE were at USD23.1 billion, a growth of 9.8 per cent in 2016 (January to December) over 2015.
• FDI in services: The service sector, along with other sectors such as construction development, computer software and hardware, continued to be the sectors attracting the highest FDI equity inflows. Led by a substantial growth in defence, public administration and other services, the service sector remained a dominant contributor to the overall growth of the economy in 2016 as well.
• Merchandise trade and shipping services: An indicator of both merchandise trade and shipping services, the Baltic Dry Index (BDI) declined to 910 on 13 January 2017, despite showing continuous improvement till 18 November 2016.
• Nikkei/Markit services: A Purchasing Managers Index (PMI) for India, Nikkei/Markit Services fell from 54.5 in October 2016 to 46.7 in November 2016. A minor increase to 46.8 was observed in December 2016.
145.7
151.8
158.1154.3
80.1
80.8 78.7 81.6 84.6
48
2012-13 2013-14 2014-15 2015-16 2016-17(H1)
Services export and import (USD billion)
Export Import
Recent initiatives to boost economic
growth Jal Marg Vikas
Under the ‘Jal Marg Vikas’ scheme the Government of India has allocated a separate budget for the development of inland waterways for freight transportation in 2016. The objective of the scheme is to convert 106 rivers and creeks in India into transport waterways. The Government’s aim is to take the modal share of coastal shipping and inland waterways up to 10 per cent by 2020 from its current share of 0.15 per cent.
The use of inland waterways as a means of transportation is expected to reduce the cost of goods transportation to 25 paisa per km, compared to INR1.50 and INR2.50 by railways and roads respectively.5 The Government of India has allocated a budget of INR42 billion in 2016 for the development of National Waterway 1 (NW 1), over the period of four years under the Jal Marg Vikas scheme6. The Government has conducted a trial of carrying 200 newly assembled Maruti cars and 1,000 tonnes of building material from Varanasi to Kolkata in August 2016.7
Dedicated freight corridors
The Union Rail Ministry announced the development of three dedicated freight corridors in February 2016 as part of a move to attract greater industrial cargo shipments via railways. The corridors namely, Delhi-Chennai, Kharagpur-Mumbai and Kharagpur-Vijayvada are to be developed on a priority basis and completed by the end of 2019. These projects are expected to be implemented via the Public-Private Partnership (PPP) mode.
Contracts worth INR350 billion for the dedicated freight corridors have already been finalised by 11 November 2016. Additionally, in an attempt to increase the number of dedicated freight corridors in the near future, feasibility studies of Mumbai-Chennai, Delhi-Mumbai and Delhi-Kolkata corridors are being carried out.8
Power for all
The ‘Power for all’ initiative was launched in 2014, with an aim to provide uninterrupted power
supply to all Indian citizens by March 2019. The scheme has witnessed active participation from
the state governments as well – 28 states and seven union territories have signed the road map
alongside the Central Government.
The Power Ministry has accomplished several key milestones over the past year, such as
attaining the lowest ever energy deficit of 2.1 per cent, electrification of over 7,000 villages, and
addition of over 28,000 km in transmission lines.
As of May 2016, projects worth more than INR1.3 trillion have been approved under the Deen
Dayal Upadhaya Gram Jyoti Yojana (DDUGJY) and Integrated Power Development Scheme
(IPDS). In addition, the Government has rolled out Unnat Jyoti by Affordable LEDs for All
5 “ICWAI Website” Accessed on January 12, 2017 6 Jal Marg Vikas- National Waterway 1”- The Indian Express, August 30, 2016 7 “30 years on, Trail on India’s 1st National Waterway starts” - Times of India, August 15, 2016 8 “Dedicated Freight Corridor To Be Complete By 2019: Indian Railways”, NDTV, Accessed on 31 January, 2016
(UJALA) scheme with an aim of replacing 770 million incandescent bulbs with LED bulbs. As of
January 2017, over 190 million LED bulbs have been distributed.
Housing for all
The ‘Housing for all by 2022’ mission or Pradhan Mantri Awas Yojana (PMAY) was launched in
June 2015. The aim of the scheme is to provide affordable housing to all citizens of India by the
year 2022. As per Government estimates, the mission could entail construction of 20 million
houses by 2022.9
During the course of FY17, the Government has undertaken several measures towards
accomplishing its stated aim to providing housing to the people of India. The Ministry of
Housing and Urban Poverty Alleviation has identified 2,508 cities across 26 states for the
implementation of the scheme. As of November 2016, the Ministry has granted approval for
the construction of 1.1 million houses, with an outlay of INR620 billion10. Additionally, PMAY
(Gramin) was launched in November 2016 with an aim of constructing 10 million houses by
FY19 as a part of the first phase.
In December 2016, the Union Government announced interest subsidy, up to four per cent, for
urban and rural population, in an attempt to boost demand in the housing segment and
provide a further fillip to the ‘Housing for all’ initiative.
9 “"Housing for All by 2022" Mission - National Mission for Urban Housing”, NIC, 17 June 2015 10 “Narendra Modi’s ‘housing for all’ scheme doesn’t interest governments led by Arvind Kejriwal, Akhilesh Yadav”, Financial Express, 1 November 2016
Impact of demonetisation The Economic Survey 2016-17 has highlighted the impact of the demonetisation exercise
carried out by the Government in November 2016 on the health of the economy. The
assessment determined that the maximum negative impact of the exercise has been felt on the
informal and cash-intensive sectors. However these costs are expected to be transitory in
nature.
At the same time, demonetisation has the potential to generate long-term benefits in terms of
reduced corruption, greater digitalisation of the economy, increased flows of financial savings,
and greater formalisation of the economy, all of which could eventually lead to higher GDP
growth, better tax compliance and greater tax revenues. Lower interest rates and inflation are
further expected to provide a cushion to the common man towards easing the impact of
demonetisation.
A number of follow-up actions suggested in the Economic Survey could help minimise the
costs and maximise the benefits of demonetisation. These include: fast, demand-driven,
remonetisation; more tax reforms, including bringing land and real estate into the GST,
reduction in tax rates as well as stamp duties. These actions are expected to assist in boosting
growth in 2017-18, following a temporary decline in 2016-17.
In an attempt to drive the move towards a more transparent and compliant economy, the
Government has announced several measures which are expected to encourage the use of
digital means of payment, while reducing dependency on cash. Some of these measures
include:
- The National Payments Corporation of India (NPCI) successfully launching the Unified
Payments Interface (UPI) platform
- Waiver of transaction charges on debit cards
- Launch of the Bharat Interface for Money (BHIM) application to make online transactions easier
The information contained herein is of a general nature and is not intended to address the circumstances of any particular individual or entity. Although we endeavor to
provide accurate and timely information, there can be no guarantee that such information is accurate as of the date it is received or that it will continue to be accurate in
the future. No one should act on such information without appropriate professional advice after a thorough examination of the particular situation.
© 2017 KPMG, an Indian Registered Partnership and a member firm of the KPMG network of independent member firms affiliated with KPMG International Cooperative
(“KPMG International”), a Swiss entity. All rights reserved.
The KPMG name and logo are registered trademarks or trademarks of KPMG International.
www.kpmg.com/in
Ahmedabad
Commerce House V, 9th Floor,
902 & 903, Near Vodafone House,
Corporate Road,
Prahlad Nagar,
Ahmedabad – 380 051
Tel: +91 79 4040 2200
Fax: +91 79 4040 2244
Bengaluru
Maruthi Info-Tech Centre
11-12/1, Inner Ring Road
Koramangala, Bangalore 560 071
Tel: +91 80 3980 6000
Fax: +91 80 3980 6999
Chandigarh
SCO 22-23 (Ist Floor)
Sector 8C, Madhya Marg
Chandigarh 160 009
Tel: +91 172 393 5777/781
Fax: +91 172 393 5780
Chennai
No.10, Mahatma Gandhi Road
Nungambakkam
Chennai 600 034
Tel: +91 44 3914 5000
Fax: +91 44 3914 5999
Mumbai
Lodha Excelus, Apollo Mills
N. M. Joshi Marg
Mahalaxmi, Mumbai 400 011
Tel: +91 22 3989 6000
Fax: +91 22 3983 6000
Noida
6th Floor, Tower A
Advant Navis Business Park
Plot No. 07, Sector 142
Noida Express Way
Noida 201 305
Tel: +91 0120 386 8000
Fax: +91 0120 386 8999
Pune
703, Godrej Castlemaine
Bund Garden
Pune 411 001
Tel: +91 20 3050 4000
Fax: +91 20 3050 4010
Delhi
Building No.10, 8th Floor
DLF Cyber City, Phase II
Gurgaon, Haryana 122 002
Tel: +91 124 307 4000
Fax: +91 124 254 9101
Hyderabad
8-2-618/2
Reliance Humsafar, 4th Floor
Road No.11, Banjara Hills
Hyderabad 500 034
Tel: +91 40 3046 5000
Fax: +91 40 3046 5299
Kochi
Syama Business Center
3rd Floor, NH By Pass Road,
Vytilla, Kochi – 682019
Tel: +91 484 302 7000
Fax: +91 484 302 7001
Kolkata
Unit No. 603 – 604,
6th Floor, Tower – 1,
Godrej Waterside,
Sector – V, Salt Lake,
Kolkata 700 091
Tel: +91 33 44034000
Fax: +91 33 44034199