Embed Size (px)
Citation preview


THAILAND EQUITY RESEARCH
Page | 1 | PHILLIP SECURITIES (THAILAND)
STRATEGY REPORT
No end of bear grip on Thai stocks yet in sight
THAILAND | STRATEGY REPORT PSR’s Fear & Greed Index (F‐G Index), a gauge of short‐term investor sentiment in the Thai stock market developed by Phillip Research earlier plunged into ‘extreme fear’ levels, reflecting the Thai stock market was in a panic mode while the SET index’s forward P/E ratio slipped below 13x, the lower band of its recent trading norms. However, after Thai stocks plunged to a low of around 1220 points, investor sentiment had gradually been on the mend to the extent that the SET index’s forward FY16 P/E ratio successfully re‐rated back above 13x. In this report, we will look at the following four investment theses: 1. A revival in investor sentiment as reflected by PSR’s F‐G Index 2. A pickup in the SET index’s forward P/E ratio back above 13x 3. Potential risks to Thai stock market 4. Appropriate investment strategy Based on all data currently available, the odds are that the bear may not yet go into hibernation anytime soon and the room for upside in the Thai stock market would be limited unless fears subside, bullish fund flows return, domestic political situation stabilizes and profits come back. Figure 1: Stock Picks Recently Beaten‐Down Blue Chips
Ticker FY16 target price FY16e dividend yield P/E(x) P/BV(x) Upside
AP 7.30 5.75% 6.08 0.90 30%
BBL 186.00 4.49% 7.92 0.77 24%
BCP 38.00 6.09% 6.57 0.98 32%
BLAND 1.86 4.57% 8.75 0.61 32%
PTT 319.00 4.23% 8.30 0.89 32%
PTTGC 79.00 6.07% 7.31 0.86 50%
QH 2.90 5.54% 7.23 0.78 33%
High Dividend Plays
Ticker FY15e final dividend yield FY16e dividend yield
BJCHI 6.67% 7.38%
CFRESH 5.63% 6.27%
TKS 5.44% 7.48%
AP 5.23% 5.81%
TOG 4.54% 6.55%
INTUCH 4.39% 8.51%
TK 4.22% 5.33%
Analyst Teerada Charnyingyong Securities Investment Analyst #9501 662 635 1700#487 Rittiporn Songsermsawad Securities Investment Analyst #39756 662 635 1700#527 Phoobate Wiriyayuttama Securities Investment Analyst #63404 662 635 1700#498 Ref. No.: CO2015_0104
5 February 2016

Page | 2 | PHILLIP SECURITIES (THAILAND)
STRATEGY REPORT
Investor sentiment back to ‘neutral’ PSR’s Fear and Greed Index, a gauge of short‐term investor sentiment in the Thai stock
market developed by Phillip Research had gradually swung back from ‘extreme fear’ territory to ‘neutral’ zone after it plunged into ‘extreme fear’ througout Dec 2015. Now what remains to be seen next is whether the index can recover back above 0. A reading above 0 separates confidence from fear.
Figure 2: PSR’s F‐G Index back to ‘neutral’ zone for first time in more than 2 months Source: PSR Even though PSR’s F‐G Index moved back to ‘neutral’ zone, it however stayed below 0.
In a bear market, PSR’s F‐G Index normally moves below 0 for the most part as in the case of the whole 2015.
Over the past year, a sharp correction ensued after PSR’s F‐G Index inched closer towards 0. For this reason, it is worth watching whether PSR’s F‐G Index could sustain above ‘neutral’ territory in the current round of recovery. Our analysis suggests that investors should scale back equity exposure if PSR’s F‐G Index falls back from ‘neutral’ zone into ‘fear’ territory again to stave off massive losses that may follow.
Figure 3: PSR’s F‐G Index vs. SET Index Sources: Bloomberg, PSR

Page | 3 | PHILLIP SECURITIES (THAILAND)
STRATEGY REPORT
SET Index’s forward P/E ratio now back around 13x, lower band of recent trading norms Our analysis shows the forward P/E band of 13x‐15x looks justified for Thai stocks. The
SET index’s forward P/E ratio also successfully re‐rated back above 13x. In our view, the Thai stock market will likely move in sync with its fundamentals ahead
especially corporate profit outlook after consensus earnings were subject to a series of downgrades as the year progressed over the past several years.
Figure 4: SET Index’s forward P/E band Sources: Bloomberg, PSR
Potential risks that may cause bear to tighten its jaw on the Thai stock market Persistent global economic fears Key economic data out of global major economies, especially China had not yet
pointed to strong positive signs after a reading on China’s manufacturing PMI in Jan remained weak. In our opinion, Chinese economic worries would continue to be a source of concern for investors throughout the year.
Return of bullish fund flows not yet in sight The weakness and structural problems of the Thai economy make it difficult to
draw foreign funds back to the Thai stock market. Monetary policy divergence remains a focus for the overall trend in the Thai stock
market. The US is the only major economy in the midst of a rate hiking cycle while others are firmly in monetary easing mode as economic woes persist.
Despite continued fund outflows, our analysis shows there is scope for fund inflows of around Bt10bn to come into Thai stocks if sentiment further improves. Data over the past year tells us that foreign investors still engaged in cycle trading in Jan‐May with average cumulative net inflows of around Bt15bn per cycle. From Jan 19, 2016 onwards, cumulative net foreign inflows amounted to only Bt3bn, leaving room for more than Bt10bn of additional inflows to come into the Thai stock market.
Lingering domestic political uncertainty Local politics is now back into the spotlight after the first draft of the new charter
was unveiled to the public late last month as it is expected to draw more criticism especially from political parties.
The final complete draft of the new constitution is expected to be finished in late Mar and it will later be put to referendum during the middle of this year.
As things stand, it seems to us that the political temperature will likely heat up in Apr‐May. Historical statistics also shows Apr and May are typically bad months for Thai stocks.
Profit comeback still out of sight Overall corporate earnings remain a cause of worry after a continued series of
consensus earnings downgrades. Current consensus earnings forecasts are at the lowest levels in four years.
Notwithstanding that just only one month passed this year, FY16 consensus EPS forecast has already been cut by around 3% to Bt99/share from Bt102/share at the beginning of the year. The cut is also in line with PSR’s market EPS downgrade to Bt97/share from Bt100/share.

Page | 4 | PHILLIP SECURITIES (THAILAND)
STRATEGY REPORT
Figure 5: Comparison of consensus EPS forecasts in Jan and Dec Sources: Bloomberg, PSR
Appropriate investment strategy Thai stock market outlook
We believe the room for upside remains limited for Thai stocks in the near term. A key resistance level in the current leg up is pegged at 1340 points based on the SET index’s forward FY16 P/E ratio of 13.8x, equivalent to historical forward P/E averages of the SET index during the period of 2011‐2015. Support is seen at 1240 points based on the SET Index’s forward FY16 P/E ratio of 12.8x.
Trading strategy In our view, the best strategy is to gradually book profits on rallies around 1340 points and buy back on dips around 1270, 1240 points with focus on (1) recently beaten‐down blue chips and (2) high dividend plays.
Page | 5 | PHILLIP SECURITIES (THAILAND)
STRATEGY REPORT
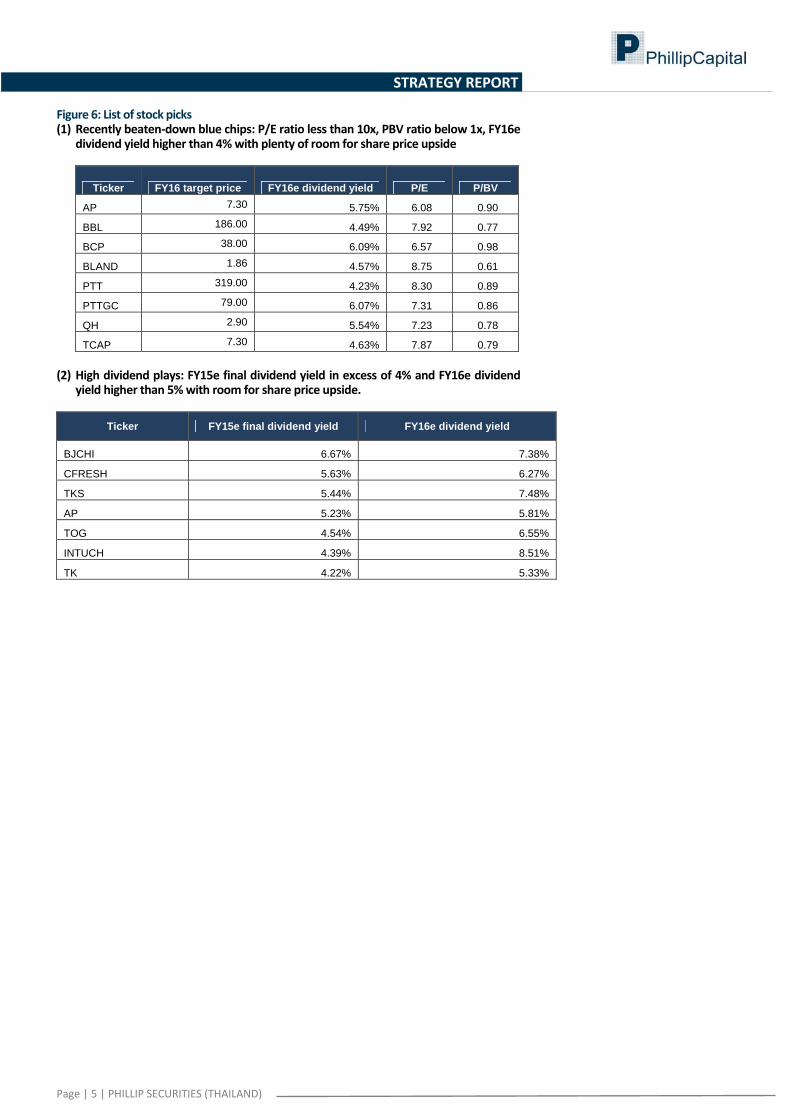
Figure 6: List of stock picks (1) Recently beaten‐down blue chips: P/E ratio less than 10x, PBV ratio below 1x, FY16e
dividend yield higher than 4% with plenty of room for share price upside
Ticker FY16 target price FY16e dividend yield P/E P/BV
AP 7.30 5.75% 6.08 0.90
BBL 186.00 4.49% 7.92 0.77
BCP 38.00 6.09% 6.57 0.98
BLAND 1.86 4.57% 8.75 0.61
PTT 319.00 4.23% 8.30 0.89
PTTGC 79.00 6.07% 7.31 0.86
QH 2.90 5.54% 7.23 0.78
TCAP 7.30 4.63% 7.87 0.79
(2) High dividend plays: FY15e final dividend yield in excess of 4% and FY16e dividend
yield higher than 5% with room for share price upside.
Ticker FY15e final dividend yield FY16e dividend yield
BJCHI 6.67% 7.38%
CFRESH 5.63% 6.27%
TKS 5.44% 7.48%
AP 5.23% 5.81%
TOG 4.54% 6.55%
INTUCH 4.39% 8.51%
TK 4.22% 5.33%

Page | 6 | PHILLIP SECURITIES (THAILAND)
STRATEGY REPORT
Corporate Governance ‐2015
ADVANC BAFS BCP BIGC BTS CK CPN DRT DTAC DTC
EASTW EGCO GRAMMY HANA HMPRO INTUCH IRPC IVL KBANK KCE
KKP KTB LHBANK LPN MCOT MINT MONO NKI PHOL PPS
PS PSL PTT PTTEP PTTGC QTC RATCH ROBINS SAMART SAMTEL
SAT SC SCB SCC SE‐ED SIM SNC SPALI THCOM TISCO
TKT TMB TOP VGI WACOAL
AAV ACAP AGE AHC AKP AMATA ANAN AOT APCS ARIP
ASIMAR ASK ASP BANPU BAY BBL BDMS BECL BKI BLA
BMCL BOL BROOK BWG CENTEL CFRESH CHO CIMBT CM CNT
COL CPF CPI CSL DCC DELTA DEMCO ECF EE ERW
GBX GC GFPT GLOBAL GUNKUL HEMRAJ HOTPOT HYDRO ICC ICHI
INET IRC KSL KTC LANNA LH LOXLEY LRH MACO MBK
MC MEGA MFEC NBC NCH NINE NSI NTV OCC OGC
OISHI OTO PAP PDI PE PG PJW PM PPP PR
PRANDA PREB PT PTG Q‐CON QH RS S & J SABINA SAMCO
SCG SEAFCO SFP SIAM SINGER SIS SITHAI SMK SMPC SMT
SNP SPI SSF SSI SSSC SST STA STEC SVI SWC
SYMC SYNTEC TASCO TBSP TCAP TF TGCI THAI THANA THANI
THIP THRE THREL TICON TIP TIPCO TK TKS TMI TMILL
TMT TNDT TNITY TNL TOG TPC TPCORP TRC TRU TRUE
TSC TSTE TSTH TTA TTCL TTW TU TVD TVO TWFP
TWS UAC UT UV VNT WAVE WINNER YUASA ZMICO
2S AEC AEONTS AF AH AIRA AIT AJ AKR AMANAH
AMARIN AP APCO AQUA AS ASIA AUCT AYUD BA BEAUTY
BEC BFIT BH BIG BJC BJCHI BKD BTNC CBG CGD
CHG CHOW CI CITY CKP CNS CPALL CPL CSC CSP
CSS CTW DNA EARTH EASON ECL EFORL ESSO FE FIRE
FOCUS FORTH FPI FSMART FSS FVC GCAP GENCO GL GLAND
GLOW GOLD GYT HTC HTECH IEC IFEC IFS IHL IRCP
ITD JSP JTS JUBILE KASET KBS KCAR KGI KKC KTIS
KWC KYE L&E LALIN LHK LIT LIVE LST M MAJOR
MAKRO MATCH MATI MBKET M‐CHAI MFC MILL MJD MK MODERN
MOONG MPG MSC MTI MTLS NC NOK NUSA NWR NYT
OCEAN PACE PATO PB PCA PCSGH PDG PF PICO PL
PLANB PLAT PPM PRG PRIN PSTC PTL PYLON QLT RCI
RCL RICHY RML RPC S SALEE SAPPE SAWAD SCCC SCN
SCP SEAOIL SIRI SKR SMG SOLAR SORKON SPA SPC SPCG
SPPT SPVI SRICHA SSC STANLY STPI SUC SUSCO SUTHA SYNEX
TAE TAKUNI TCC TCCC TCJ TEAM TFD TFI TIC TIW
TLUXE TMC TMD TOPP TPCH TPIPL TRT TSE TSR UMI
UP UPF UPOIC UREKA UWC VIBHA VIH VPO WHA WIN
XO
Score Range
< 50%
50‐59%
60‐69%
70‐79%
80‐89%
90‐100%
The disclosure of the survey result of the Thai Institute of Directors Association (IOD)
regarding corporate governance is made pursuant to the Office of the Securities and
Exchange Commission. The survey of the IOD is based on the information of a company
l isted on the Stock Exchange of Thailand and the Market for Alternative disclosure to the
public and able to be accessed by a general public investor. The results, therefore, is from
the perspective of a third party. It is not an evaluation of operation and is not based on
inside information.
The survey result is as of the date appearing in the Corporate Governance Report of Thai
Listed Companies. As a result, the survey result may be changed after that data. Phil l ip
Securities (Thailand) of securities company does not confirm nor certify the accuracy of
such survey result.
No logo given
Number of Logo
Results Presentation

Page | 7 | PHILLIP SECURITIES (THAILAND)
STRATEGY REPORT
Anti‐corruption indicators
Level 5 (Extended)
BCP CPN GYT PE PM PPP PT PTT PTTGC SAT scc
THANI TOP
Level 4 (Certified)
DCC DTC DRT EASTW ECL EGCO ERW FSS GCAP HANA HTC
INTUCH IRPC IVL KBANK KCE KGI KKP KTB LANNA LHBANK MTI
NKI PSL PTG PTTEP SABINA SCB SNC SNP SSF SSSC TCAP
THCOM TISCO TMB TMD TNITY TOG
Level 3 (Established)
Level 3A: Declaration to join CAC, etc
ABC ACAP ADVANC AGE AH AMANAH ANAN AP APCS APURE AS
ASIA ASIAN ASIMAR BIGC BROOK BTS BWG CEN CENTEL CFRESH CHARAN
CHO CHOTI CM CNT COL CPF CPI CPL DELTA DEMCO DIMET
DNA DTAC EA ECF EE EVER FPI GBX GC GFPT GLOW
HMPRO HOTPOT ICC ICHI IFEC INOX INSURE IRC JAS JTS JUBILE
KC KTC KYE LHK LPN LRH MAKRO MC MCOT MFC MFEC
MINT MJD MONO MOONG NBC MSC NDR NINE NMG NSI NTV
OGC PACE PCSGH PDI PG PHOL PLAT PPS PR PRANDA PREB
PS QLT RATCH RML ROBINS ROJNA RWI SAMCO SCCC SCG SEAOIL
SE‐ED SENA SINGER SITHAI SMK SMPC SPALI SPC SPCG SPI SRICHA
SSI STANLY SUPER SVI SYMC SYNEX SYNTEC TASCO TCMC TFI THAI
THRE THREL TICON TKT TLUXE TMILL TMT TNL TPCORP TSTE TSTH
TTCL TU TVI UOBKH UREKA VGI VNT WACOAL WHA ZMICO
Level 3B: Organization's statement but no declaration to join CAC, etc
AAV AHC AIT AKR ARROW ASK BA BDMS BEC BJCHI BUI
CGH CHG CHOW CIG CITY CK CKP COLOR CWT EARTH EASON
EPG F&D FANCY FIRE FMT FORTH GENCO GL GOLD GPSC GRAMMY
HYDRO IRCP IT JCT KCM KWC LH LIT LOXLEY MACO MANRIN
MATI MODERN MSC NOBLE NOK NPK NUSA OISHI OTO PAF PAP
PATO PF PJW PLANB PLE POLAR PRG PTL Q‐CON QTC RCI
S11 SALEE SAM SAMART SAMTEL SAPPE SC SCP SFP SIM SLP
SMT SPA SPORT SSC SST STEC STPI SUC SUTHA SVI T
TBSP TAE TCC TFD TGCI TGPRO THANA THIP TIW TK TMW
TNDT TOPP TPC TPCH TPIPL TSR TT TYCN UAC UBIS UEC
UMI UP UPF UT UV VPO WAVE WINNER YUASA
Level 2 (Declared)
2S ABICO AF AKP AMARIN AMATA AOT APCO AYUD BEAUTY BFIT
BH BKD BLAND BTNC CCP CI CSR CSS EFORL EPCO FE
FNS FVC GEL GLOBAL HEMRAJ IEC IFS INET JUTHA KASET KCAR
KKC KSL L&E LALIN LTX M MALEE MBK MBKET MEGA MK
MPG MTLS NCH NCL NPP OCC OCEAN PB PCA PRINC QH
ROCK RPC S & J SGP SIAM SIS SKR SMG SMIT SORKON SUSCO
TAKUNI TEAM TF TIC TIP TIPCO TMC TMI TPP TRT TRU
TRUE TSC TSI TTW TVD TVO UKEM UNIQ UWC VNG WIIK
WIN XO
Level 1 (Committed)
ACD AEONTS AFC AIRA AJ ALUCON AMC AQUA ARIP AUCT BAT‐3K
BIG BJC BOL BRR BSBM CBG CCET CCN CGD CMR CPH
CSC CSP CTW DCON DRACO DSGT DTCI E EMC ESSO FOCUS
FSMART GIFT GLAND GRAND GUNKUL HFT HTECH ILINK ITD JSP IHL
KDH KTIS KTP LEE LST MAJOR MAX M‐CHAI MDX MIDA MATCH
ML MPIC NC NEP NNCL OHTL PICO PK PL PPM NWR
PRAKIT PRECHA PRIN PSTC RAM RICH RS SANKO SAUCE SAWAD PYLON
SAWANG SCN SEAFCO SHANG SIRI SMART SMM SOLAR SPACK SPG SF
SPPT SPVI STAR SVH SVOA SWC TAPAC TC TCCC TCJ STA
TCOAT TKS TNH TNPC TPA TPAC TPOLY TRC TRUBB TSE TTA
TTI TTL TTTM TWP TWZ U UMS UPA UPOIC UVAN UTP
VARO VI VIBHA VIH VTE WG
Data not available/No policy
A ACC AJD AQ BCH BGT BROCK BSM BTC CHUO CRANE
CPR EIC FER JMART JMT KAMART KBS KIAT LDC MCS METCO
MBAX NEW NEWS NYT PAE PDG PERM PMTA RCL RICHY ROH
POST S SIMAT TCB TR TSF TVT
Page | 8 | PHILLIP SECURITIES (THAILAND)
STRATEGY REPORT
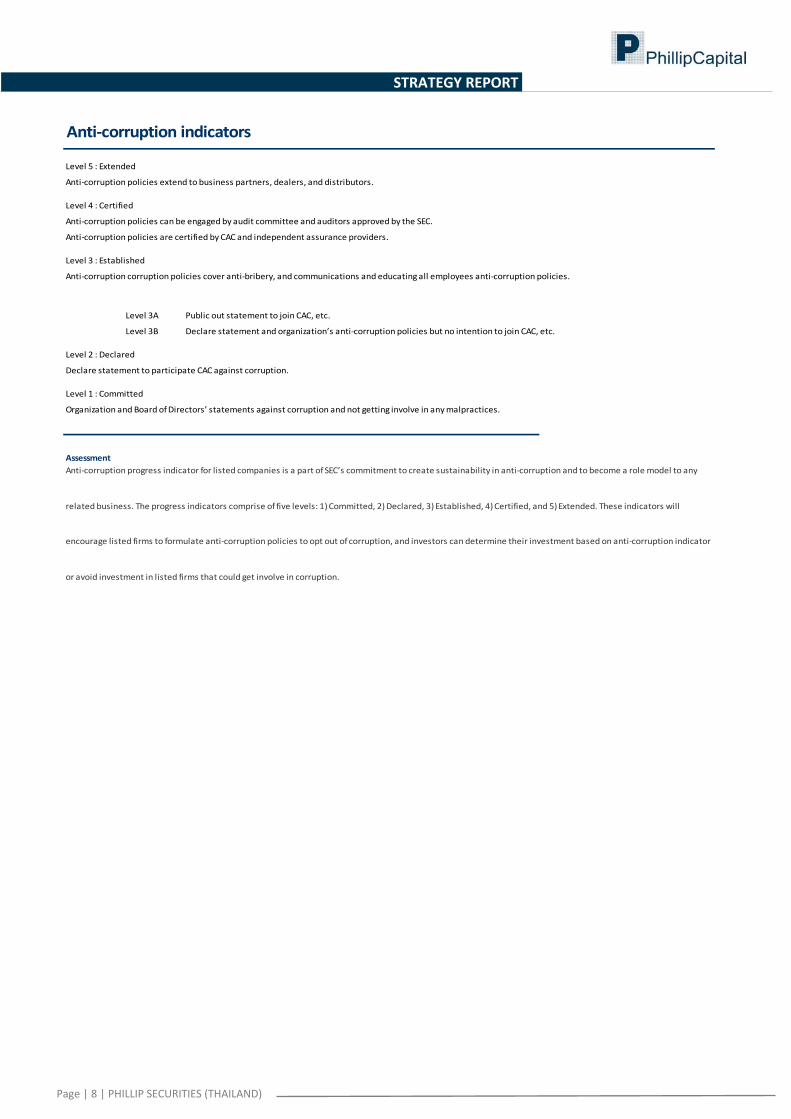
Anti‐corruption indicators
Level 5 : Extended
Anti‐corruption policies extend to business partners, dealers, and distributors.
Level 4 : Certified
Anti‐corruption policies can be engaged by audit committee and auditors approved by the SEC.
Anti‐corruption policies are certified by CAC and independent assurance providers.
Level 3 : Established
Anti‐corruption corruption policies cover anti‐bribery, and communications and educating all employees anti‐corruption policies.
Level 3A Public out statement to join CAC, etc.
Level 3B Declare statement and organization’s anti‐corruption policies but no intention to join CAC, etc.
Level 2 : Declared
Declare statement to participate CAC against corruption.
Level 1 : Committed
Organization and Board of Directors’ statements against corruption and not getting involve in any malpractices.
Assessment
Anti‐corruption progress indicator for listed companies is a part of SEC’s commitment to create sustainability in anti‐corruption and to become a role model to any
related business. The progress indicators comprise of five levels: 1) Committed, 2) Declared, 3) Established, 4) Certified, and 5) Extended. These indicators will
encourage listed firms to formulate anti‐corruption policies to opt out of corruption, and investors can determine their investment based on anti‐corruption indicator
or avoid investment in listed firms that could get involve in corruption.
PHILLIP SECURITIESS (THAILAND) | 9 | P a g e
STRATEGY REPORT
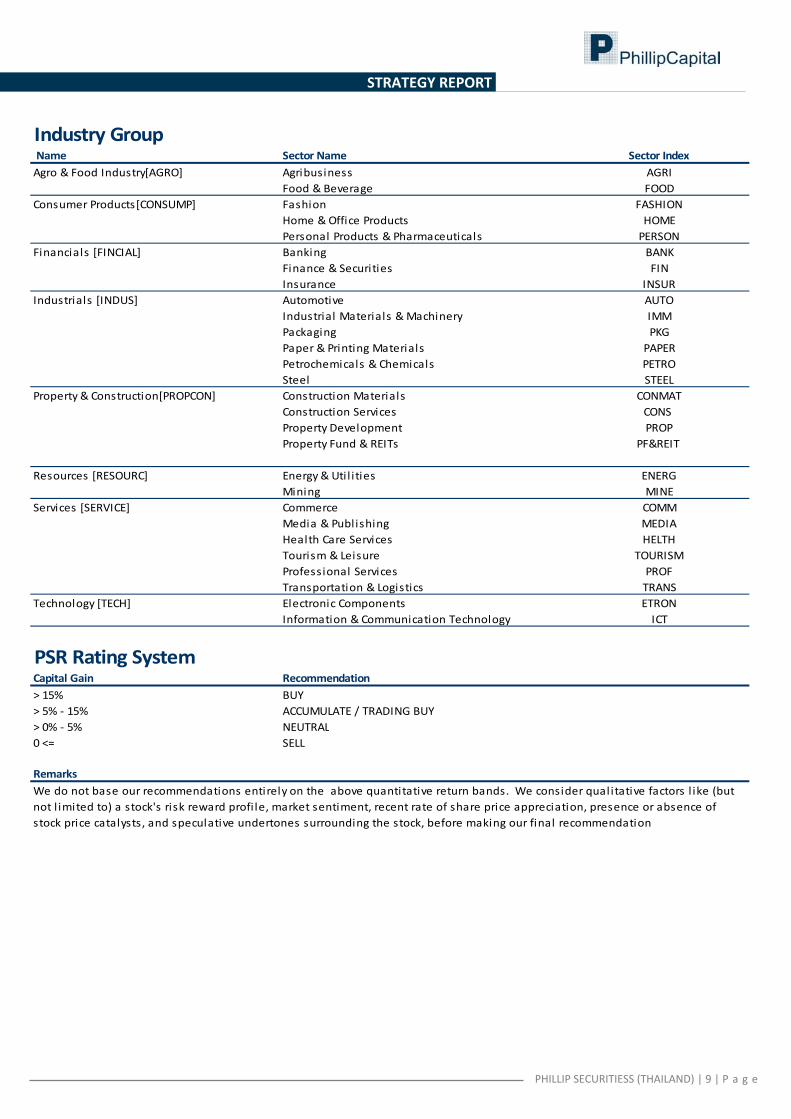
Industry Group Name Sector Name Sector Index
Agro & Food Industry[AGRO] Agribusiness AGRI
Food & Beverage FOOD
Consumer Products[CONSUMP] Fashion FASHION
Home & Office Products HOME
Personal Products & Pharmaceuticals PERSON
Financials [FINCIAL] Banking BANK
Finance & Securities FIN
Insurance INSUR
Industrials [INDUS] Automotive AUTO
Industrial Materials & Machinery IMM
Packaging PKG
Paper & Printing Materials PAPER
Petrochemicals & Chemicals PETRO
Steel STEEL
Property & Construction[PROPCON] Construction Materials CONMAT
Construction Services CONS
Property Development PROP
Property Fund & REITs PF&REIT
Resources [RESOURC] Energy & Util ities ENERG
Mining MINE
Services [SERVICE] Commerce COMM
Media & Publishing MEDIA
Health Care Services HELTH
Tourism & Leisure TOURISM
Professional Services PROF
Transportation & Logistics TRANS
Technology [TECH] Electronic Components ETRON
Information & Communication Technology ICT
PSR Rating SystemCapital Gain Recommendation
> 15% BUY
> 5% ‐ 15% ACCUMULATE / TRADING BUY
> 0% ‐ 5% NEUTRAL
0 <= SELL
Remarks
We do not base our recommendations entirely on the above quantitative return bands. We consider qualitative factors l ike (but
not l imited to) a stock's risk reward profi le, market sentiment, recent rate of share price appreciation, presence or absence of
stock price catalysts, and speculative undertones surrounding the stock, before making our final recommendation

22776846