Embed Size (px)
Citation preview

EDUCATION REPORT: EDUCATION FOR THE FUTURE IN NORTHEAST ILLINOIS February, 2010
Eileen Ryan Photography

2
TABLE OF CONTENTS
Acknowledgements Page 3
Executive Summary Page 6
Chapter One: Revitalizing Education: A Critical and Comprehensive Community Challenge Page 11 Chapter Two: Education Today and Tomorrow Page 17 Chapter Three: Major Goals and Strategic Recommendations Page 26 Chapter Four: Next Steps Page 47 Chapter Five: Indicators Page 49 Appendices
I. Seven County Region Demographics Page 51 II. Descriptions of Existing Early Childhood Programs Page 52
III. Early Childhood Program Enrollment and Demographics Page 56 IV. Illinois Early Learning Council Structure Page 61 V. Early Childhood Data Collection Page 62
VI. K – 12 Achievement Gaps in the Seven County Region Page 65 VII. Indicators Page 70
VIII. List of Illinois Colleges and Universities Page 71 IX. Bibliography Page 76
Endnotes Page 80 This report was commissioned by The Chicago Community Trust in conjunction with GO TO 2040, the comprehensive regional planning campaign of the Chicago Metropolitan Agency for Planning (CMAP). It is one of several dozen reports (http://www.goto2040.org/strategy_papers.aspx) that examine potential strategies for implementing the GO TO 2040 regional vision. The findings, conclusions, and recommendations of this report in their entirety have not been endorsed by CMAP or the Trust and do not necessarily represent their policies or positions. This report’s recommendations may be considered for inclusion in the GO TO 2040 plan, which will be adopted in October 2010.
3
ACKNOWLEDGEMENTS This report represents a summary of the work of three expert advisory groups that worked from August 2008 through May 2009 to identify and prioritize educational needs in the region, recommend strategies for improvement, and review key indicators that might be used to track the region’s progress over time. Their work was commissioned by The Chicago Community Trust to support the 2040 comprehensive regional planning effort led by the Chicago Metropolitan Agency for Planning. The expert advisory committees represent three levels of education: Birth to Age 5 (0-5), Kindergarten to 12th grade (K-12), and Higher Education. Each committee was convened by one or more lead agencies. The titles and affiliations of participants listed here represent their affiliations and positions during the convening period.
EARLY CHILDHOOD (0-5)
LEAD AGENCIES: Illinois Action for Children, Ounce of Prevention Fund, and Voices for Illinois Children
Harriet Meyer, President, Ounce of Prevention Fund
Diana Rauner, Executive Director, Ounce of Prevention
Jerry Stermer, Executive Director, Voices for Illinois Children
Maria Whelan, President, Illinois Action for Children
ADVISORY COMMITTEE
Barbara Bowman, Chief Early Childhood Education Officer, Chicago Public Schools
Chris Bzdon, Child Care Resource and Referral, Joliet
Jeanna Capito, Positive Parenting DuPage
Claire Dunham, Senior Vice President, Ounce of Prevention
Karen Freel, Vice President, National Research and Evaluation, Ounce of Prevention Fund
Gaylord Gieseke, Vice President, Voices for Illinois Children
Robert Goerge, Research Fellow, Chapin Hall Center for Children
Emily J. Harris, Program Director, Chicago Metropolis 2020
Kay Henderson, Early Childhood Division Administrator, Illinois State Board of Education
Eboni Howard, Director, Herr Research Center for Children and Social Policy, Erikson Institute
Tom Layman, Vice President, Program Development, Illinois Action for Children

4
Trinita Logue, President, Illinois Facilities Fund
Maricela Garcia, Executive Director, Latino Policy Forum
Anthony Raden, Deputy Commissioner for Policy, Chicago Department of Children and Youth Services
Linda Saterfield, Bureau of Child Care and Development, Department of Human Services
Richard Sewell, School of Public Health, University of Illinois at Chicago
Nancy Shier, Director, Kids Public Education and Policy Project, Ounce of Prevention Fund
Sara Slaughter, Director, Education Program, McCormick Foundation
Jose M. Torres, Superintendent, Elgin School District U-46
Gregory Wright, Superintendent, Posen-Robbins School District 143 ½
Josie Yanguas, Director, Illinois Resource Center
KINDERGARTEN – 12TH GRADE
LEAD AGENCY: University of Illinois at Chicago/School of Education
Steve Tozer, Professor, University of Illinois at Chicago
ADVISORY COMMITTEE
Jo Anderson, Executive Director, Illinois Education Association
Xavier Botana, Director, Office of Instructional Design and Assessment, Chicago Public
Schools
Kathleen Sullivan Brown, Executive Director, Illinois Education Research Council
Rochelle Davis, Executive Director, Healthy Schools Campaign
Arne Duncan, Chief Executive Officer, Chicago Public Schools
Sherry Eagle, Executive Director, Institute for Collaboration, University of Aurora
Barbara Eason-Watkins, Chief Education Officer, Chicago Public Schools
John Easton, Executive Director, Consortium on Chicago School Research
Josh Edelman, Director, Office of New Schools, Chicago Public Schools
Richard Elmore, Professor, Harvard Graduate School of Education
Ed Geppert, President, Illinois Federation of Teachers
Tawa Jogunosimi, Assistant to the Mayor for Education
Michael Johnson, Executive Director, Illinois Association of School Boards
Chris Koch, Superintendent, Illinois State Board of Education
Michael Lach, Director, Office of High School Teaching and Learning, Chicago Public
Schools
Cordelia (Dea) Meyer, Vice-President, Civic Committee

5
Charles Payne, Professor, University of Chicago
Elliot Regenstein, Partner of Education Counsel LLC
Darlene Ruscitti, Regional Superintendent, DuPage County
David Schuler, Superintendent, District 214
Robin Steans, Executive Director, Advance Illinois
Chuck Venegoni, JHHS Educational Services
HIGHER EDUCATION
LEAD AGENCY: Institute of Public and Government Affairs (IPGA) at the University of Illinois at Urbana-Champaign
Robert Rich, Executive Director, IPGA
ADVISORY COMMITTEE
Ron Bullock, Chairman, Illinois Manufacturers' Association
Greg Darnieder, Director, Department of College and Career Preparation, Chicago Public Schools
Miguel del Valle, City Clerk, City of Chicago
Jerry Dill, President, DeVry University
Judy Erwin, Executive Director, Illinois Board of Higher Education
Jerry Fuller, Executive Director, Associated Colleges of Illinois
Michael Garanzini, S.J., President, Loyola University
Stanley Ikenberry, Regent Professor and President Emeritus, University of Illinois
Elaine Johnson, Vice President for Academic Affairs and Workforce Development, Illinois Community College Board
Margaret Lee, President, Oakton Community College
Sylvia Manning, President, The Higher Learning Commission
Stephanie Pace Marshall, President Emerita, Illinois Math and Science Academy
Charles Middleton, President, Roosevelt University
Lance Pressl, President, Chicagoland Chamber of Commerce Foundation
Elliot Regenstein, Partner of Education Counsel LLC
Brian Spittle, Assistant Vice President, Center for Access and Attainment, DePaul University
Additional support was provided by Erin Aleman and Shana Alford at the Chicago Metropolitan Agency for Planning as well as Elizabeth Duffrin, editor. Research support for the K-12 report was provided by Heather Horsley at the University of Illinois at Chicago. Gudelia Lopez and Peggy Mueller, Senior Program Officers at The Chicago Community Trust, provided support throughout the process and prepared the final summative document.

6
Executive Summary
INTRODUCTION
The continuing vitality of the Chicago Metropolitan region depends on the quality of education available in our communities and institutions. Education is essential to a healthy society and to the development of individuals throughout their lifetimes. Effective education is key to sustaining a productive workforce, an engaged citizenry, and a high quality of life. Maintaining exemplary educational opportunity for all is thus a public good that requires public responsibility and responsiveness. Critical across the entire seven-county region is access to high quality learning opportunities for all residents, from early childhood to adulthood. Although the seven northeastern counties of Illinois are home to many outstanding early childhood programs, elementary and secondary schools, as well as postsecondary education institutions, consistent access to high quality education at all levels is at present uneven. As a result, untenable achievement gaps persist across the region, with minority students particularly vulnerable. Moreover, given that these groups are projected to show the highest growth in school enrollment over the next thirty years, it is imperative that we ensure high quality education and success for all children. Working within and across institutions at all levels to provide excellent education for all our residents is indeed a major challenge but one that we must undertake deliberately and steadfastly as a region in order to sustain and support the development of all our communities.
2040 VISION FOR EDUCATION IN THE REGION Consistently excellent educational opportunities will be available to all individuals in the seven-county region and enable them to achieve a high quality of life, meaningful engagement in society, and productive participation in the workforce. Educational institutions and agencies at all levels, moreover, will demonstrate new capacity to address the increasingly diverse strengths and needs of all students, in particular those who are low-income or from immigrant families.
Numerous institutions are currently involved in education, from day care centers through institutions of higher education. The GOTO 2040 plan provides some critical steps to improving education that were agreed upon by numerous individuals representing key educational organizations and institutions from all those levels of education. The plan provides an opportunity to develop more coordinated reform agendas and to link efforts across institutions to create seamless pathways for learning. Facilitating access to quality education and readiness for learning at each level of the various systems should result in more positive student and community outcomes. The region’s educational and civic stakeholders should respond to the state’s P-20 challenge to develop local models that coordinate and align education systems. The collaboration of institutions and agencies can thus better support the educational success of young people from

7
birth through early adulthood, enabling them to complete post-secondary education and move into the workforce with high levels of skill and attainment.
ISSUES AND CHALLENGES
The overarching issues we face in education collectively in Northeastern Illinois counties reflect those we face as a nation and can be summarized in three major imperatives:
1. Raise significantly the quality of education to prepare all our residents for successful and fulfilling lives in a 21st century global society as well as in an information economy;
2. Strengthen all residents’ equal access to quality education at all levels, while also ensuring their readiness to succeed; and
3. Create greater coherence and collaboration within and across education agencies to
strengthen developmental pathways for students and to improve economies of scale. Strengthening our region’s capacity to provide excellent learning opportunities and to support the success of all individuals at all levels of education requires collaborative, systematic and strategic responses to specific challenges that are connected to each of these issues.
CHALLENGES REGARDING THE QUALITY OF EDUCATION
Higher standards and expectations for learning are necessary for the region to be competitive. Graduates increasingly need a greater breadth of knowledge and skills to negotiate successfully the new requirements of the workplace, flexibility as learners to adjust to rapid changes in the world of work, and ability to interact effectively in a civil society that is increasingly more global and diverse. Quality educational programming is needed at all levels, beginning with early childhood education.
Preparation and development of educators for all levels of schooling needs to be strengthened. Significant shifts are needed to enable teachers to address increasingly complex subject matter as well as diverse populations of students with increasingly varied strengths and needs. This challenge requires that educators have deep knowledge in the subjects they are teaching and an understanding of how to teach those subjects. In particular, the depth of knowledge needed to teach mathematics, science and literacy in K-12 classrooms has greatly increased in recent decades.
Academic accountability measures have significantly narrowed the focus of education in recent years, especially in elementary and secondary schools, thus tending to limit the breadth of knowledge and skills taught. Pressure to raise student achievement on standardized tests in a few limited subjects has led to the use of limited resources for narrowly defined academic skills to the de-emphasis or even exclusion of others (e.g., science, social studies, arts) as well as the neglect of broader comprehensive needs of children and youth, including their civic, social-emotional, physical, and aesthetic development.

8
CHALLENGES REGARDING EQUAL ACCESS
Significant numbers of children lack access to high-quality early childhood education programs.
Extreme disparities in funding across elementary and secondary school districts in Illinois significantly affect resources available for education, especially in low income communities. The communities whose children need the greatest support are often those that have the least to offer.
At the college level, escalating tuition costs make college unaffordable for many.
Achievement gaps among racial/ethnic and low income groups begin in early childhood and persist throughout elementary and high school and into adulthood. Rates of high school and college completion are low for some groups of students, in particular African American and Latino students. Many students exit post-secondary education without the skills or direction to obtain good employment.
CHALLENGES REGARDING COHERENCE AND COLLABORATION
The lack of coordination and communication among providers across levels of education (from early childhood to K-12, from elementary to secondary, from secondary to postsecondary, and from postsecondary to the workplace) too often results in students not being ready to succeed as they advance from one level to the next.
Illinois lags behind other states in the creation of coordinated data systems to track students’ development across all levels of their education as well as to measure the effectiveness of schools, programs, and policies.
With the third-largest number of school districts in the nation (surpassed only by Texas and California), Illinois has many school districts that support only one or a handful of schools. The region’s challenge is to determine whether and how consolidations might enable resources to be directed to maximizing school supports and minimizing administrative costs.
RECOMMENDATIONS Recommendations for addressing these persistent challenges and that focus on these overarching issues will require that educational institutions and communities work not only within their own levels (birth through pre-school, elementary-secondary, and post-secondary/higher education), but also across these levels in deliberate and intentional ways. This summary presents key issues and selected recommendations for action in the region, not only at a comprehensive (P-20) level, but also at discrete levels of education. Goal 1: Raise significantly the quality of education to prepare all our residents for successful and fulfilling lives in a 21st century global society as well as in an information economy. P-20 1. Raise expectations for learning to better enable our children to compete internationally.

9
2. Strengthen the preparation and continuous development of an education workforce with deep knowledge and skills.
0-5 (BIRTH THROUGH 5 YEARS OLD) 3. Strengthen preparation and development of early childhood educators and family support
systems where they are less than reflective of best practice.
4. Create rich sources of data to inform early childhood policy.
K-12 (KINDERGARTEN THROUGH 12TH GRADE) 5. Create financial supports for public education to ensure that schools have the resources
necessary to achieve quality programming. At the same time, economies of scale should be developed where districts are reorganized into fewer, more efficient and effective organizations.
6. Strengthen the preparation of principals and district leaders for K-12 schools to ensure that they have the necessary skills to lead significant improvements in instruction and measurable gains in student learning.
7. Improve teacher preparation and the quality of ongoing professional development. 8. Organize and lead schools so that all teachers can continue to develop professionally
throughout their careers to provide students with challenging, high quality instruction. HIGHER EDUCATION 9. Improve the preparation and continuing development of educators for all levels of
education (0-5 and K-12) at higher education institutions in a comprehensive way that engages the intellectual resources of entire universities, including arts and sciences.
10. Strengthen academic links between higher education institutions and secondary school programming as well as within higher education to support successful transitions between community colleges, colleges and universities and technical schools, and the work force.
Goal 2: Strengthen all residents’ equal access to quality education at all levels, while also ensuring their readiness to succeed. P-20 11. Align learning standards across all levels of education to ensure that students are
academically prepared to succeed at each level or, at the end of their formal schooling, ready to enter the workforce.
12. Encourage participation of educational institutions at all levels in the closing of achievement gaps that exist between income groups, linguistic minorities, and racial groups.

10
0-5 (BIRTH THROUGH 5 YEARS OLD) 13. Dedicate adequate resources to early learning in order to expand access and ensure that
sufficient resources are directed to the children and geographical areas that need them the most.
14. Establish norms and measures to determine children’s readiness for school in the early years as well as schools’ readiness to teach young children appropriately.
K-12 (KINDERGARTEN THROUGH 12TH GRADE) 15. Advocate for and allocate adequate resources to schools that will enable them to provide
the supplemental supports necessary to ensure that all students succeed. HIGHER EDUCATION 16. Make higher education affordable for all students in the seven-county region.
17. Increase college enrollment rates among African American and Latino students to match the
rate of white and Asian-American students.
18. Increase college graduation rates among African American and Latino students to match the rate of white and Asian-American students.
Goal 3: Create greater coherence and collaboration within and across education agencies to strengthen developmental pathways for students and to improve economies of scale P-20 19. Create comprehensive state-level data systems to track individuals’ pathways through
education in order to evaluate the effectiveness of systems and to ensure success for all students.
0-5 (BIRTH THROUGH 5 YEARS OLD) 20. Create rich sources of data to inform early childhood practice and policy. K-12 (KINDERGARTEN THROUGH 12TH GRADE) 21. Create comprehensive data collection systems for elementary and secondary students to
measure the impact of schools on students’ learning. HIGHER EDUCATION 22. Strengthen partnerships and collaboration between higher education institutions and
professional/ business communities in the region to smooth students’ transitions to the workforce and careers and to strengthen the sharing of resources across these sectors.

11
Chapter One
REVITALIZING EDUCATION: A CRITICAL AND COMPREHENSIVE COMMUNITY CHALLENGE The continuing vitality of the Chicago Metropolitan region depends on the quality of education available in our communities and institutions. Education is essential to a healthy society and to the development of individuals throughout their lifetimes. Effective education is key to sustaining a productive workforce, an engaged citizenry, and a high quality of life. Maintaining exemplary educational opportunity for all is thus a public good that requires public responsibility and responsiveness. Critical across the entire seven-county region is access to high quality learning opportunities for all residents, from early childhood to adulthood. Although the seven northeastern counties of Illinois are home to many outstanding early childhood programs, elementary and secondary schools, as well as postsecondary education institutions, consistent access to high quality education at all levels is at present uneven. As a result, untenable achievement gaps persist across the region, with minority students particularly vulnerable. Moreover, given that these groups are projected to show the highest growth in school enrollment over the next thirty years, it is imperative that we ensure high quality education and success for all children. Working within and across institutions at all levels to provide excellent education for all our residents is indeed a major challenge but one that we must undertake deliberately and steadfastly as a region in order to sustain and support the development of all our communities.
ISSUES AND CHALLENGES The overarching issues we face in education collectively in Northeastern Illinois counties reflect those we face as a nation and can be summarized in three major imperatives:
1. Raise significantly the quality of education to prepare all our residents for successful and fulfilling lives in a 21st century global society as well as in an information economy;
2. Strengthen all residents’ equal access to quality education at all levels, while also ensuring their readiness to succeed; and
3. Create greater coherence and collaboration within and across education agencies to
strengthen developmental pathways for students and to strengthen economies of scale. Strengthening our region’s capacity to provide excellent learning opportunities and to support the success of all individuals at all levels of education requires collaborative, systematic and strategic responses to specific challenges that are connected to each of these issues.

12
CHALLENGES REGARDING THE QUALITY OF EDUCATION
Higher standards and expectations for learning are necessary for the region to be competitive. Graduates increasingly need a greater breadth of knowledge and skills to negotiate successfully the new requirements of the workplace, flexibility as learners to adjust to rapid changes in the world of work, and ability to interact effectively in a civil society that is increasingly more global and diverse. Quality educational programming is needed at all levels, beginning with early childhood education.
Preparation and development of educators for all levels of schooling needs to be strengthened. Significant shifts are needed to enable teachers to address increasingly complex subject matter as well as diverse populations of students with increasingly varied strengths and needs. This challenge requires that educators have deep knowledge in the subjects they are teaching and an understanding of how to teach those subjects. In particular, the depth of knowledge needed to teach mathematics, science and literacy in K-12 classrooms has greatly increased in recent decades.
Academic accountability measures have significantly narrowed the focus of education in recent years, especially in elementary and secondary schools, thus tending to limit the breadth of knowledge and skills taught. Pressure to raise student achievement on standardized tests in a few limited subjects has led to the use of limited resources for narrowly defined academic skills to the de-emphasis or even exclusion of others (e.g., science, social studies, arts) as well as the neglect of broader comprehensive needs of children and youth, including their civic, social-emotional, physical, and aesthetic development.
CHALLENGES REGARDING EQUAL ACCESS
Significant numbers of children lack access to high-quality early childhood education programs.
Extreme disparities in funding across elementary and secondary school districts in Illinois significantly affect resources available for education, especially in low income communities. The communities whose children need the greatest support are often those that have the least to offer.
At the college level, escalating tuition costs make college unaffordable for many.
Achievement gaps among racial/ethnic and low income groups begin in early childhood and persist throughout elementary and high school and into adulthood. Rates of high school and college completion are low for some groups of students, in particular African American and Latino students. Many students exit post-secondary education without the skills or direction to obtain good employment.
CHALLENGES REGARDING COHERENCE AND COLLABORATION
The lack of coordination and communication among providers across levels of education (from early childhood to K-12, from elementary to secondary, from secondary to postsecondary, and from postsecondary to the workplace) too often results in students not being ready to succeed as they advance from one level to the next.

13
Illinois lags behind other states in the creation of coordinated data systems to track students’ development across all levels of their education as well as to measure the effectiveness of schools, programs, and policies.
With the third-largest number of school districts in the nation (surpassed only by Texas and California), Illinois has many school districts that support only one or a handful of schools. The region’s challenge is to determine whether and how consolidations might enable resources to be directed to maximizing school supports and minimizing administrative costs.
A BOLD VISION FOR EDUCATION IN THE REGION BY 2040 Consistently excellent educational opportunities will be available to all individuals in the seven-county region and enable them to achieve a high quality of life, meaningful engagement in society, and productive participation in the workforce. Educational institutions and agencies at all levels, moreover, will demonstrate new capacity to address the increasingly diverse strengths and needs of all students, in particular those who are low-income or from immigrant families.
Numerous institutions are currently involved in education, from day care centers to universities. The GOTO 2040 plan provides some critical steps to improving education that were agreed upon by numerous individuals representing key educational organizations and institutions from all levels of education. The plan provides an opportunity to develop more coordinated reform agendas and to link efforts across institutions to create seamless pathways for learning. Facilitating access to quality education and readiness for learning at each level of the various systems should result in more positive student and community outcomes. The region’s educational and civic stakeholders should work towards the goals of the Illinois P-20 Council (described below) to develop local models that coordinate and align education systems. The collaboration of institutions and agencies can thus better support the educational success of young people from birth through early adulthood, enabling them to complete post-secondary education and move into the workforce with high levels of skill and attainment.
OPPORTUNITIES TO ACHIEVE THE VISION
While much can be accomplished at a local level to launch new collaborations and enhance existing collegial efforts, the 2040 vision cannot be accomplished in many cases without the support of policies and practices at the state and federal level.
State of Illinois Several opportunities at the state level are aligned with and will help to support strategies to achieve the regional vision, including:
1) P-20 Council

14
In 2007, the Illinois State House of Representatives passed House Bill 1648 which contains the charter for the new Illinois P-20 Council. HB 1648 outlines the expectations and goals of the P-20 Council, which has recently been appointed by the governor.
The General Assembly finds that preparing Illinoisans for success in school and the workplace requires a continuum of quality education from preschool through graduate school. This State needs a framework to guide education policy and integrate education at every level. A statewide coordinating council to study and make recommendations concerning education at all levels can avoid fragmentation of policies, promote improved teaching and learning, and continue to cultivate and demonstrate strong accountability and efficiency. Establishing an Illinois P-20 Council will develop a statewide agenda that will move the State towards the common goals of improving academic achievement, increasing college access and success, improving use of existing data and measurements, developing improved accountability, promoting lifelong learning, easing the transition to college, and reducing remediation. A pre-kindergarten through grade 20 agenda will strengthen this State's economic competitiveness by producing a highly-skilled workforce. In addition, lifelong learning plans will enhance this State's ability to leverage funding.1
P-20 has been defined in the state legislation as extending from pre-school through graduate education. However, because research shows that development before birth and in the early years of infancy (0-3) is critical to children’s learning, for purposes of this report, P-20 is being defined to include prenatal through graduate education.
2) Common Core Standards Project/American Diploma Project
Illinois’ Board of Higher Education and State Board of Education worked with several other states to create higher state learning standards for elementary and secondary students as well as college and career readiness standards for high school graduates. Illinois intends to develop new state tests aligned with these higher standards.
3) Data systems projects The Illinois State Board of Education has begun implementing a statewide Student Information System to track children enrolled in Preschool for All and K-12 education. This longitudinal student data system will allow schools to quickly identify the needs of incoming students and to monitor their progress as they move to the next level of their education. Additional work is underway to develop a more comprehensive teacher data warehouse in order to strengthen knowledge about the status of the education workforce throughout the state.
4) Preschool for All policy
In 2006, Illinois became the first state in the nation to make all three- and four-year-olds eligible for voluntary, state-funded high-quality preschool, while also funding critical services to children under three. Program capacity and funding have not yet met the demand, however.

15
5) School Leadership Development
The Illinois State Board of Education is currently preparing legislation to transform school leadership preparation in Illinois to make it highly selective in admissions, rigorous in program and assessments, intensive in clinical training, and conducted with school districts themselves as active partners in the process. Improved development of principals will require new state resources and the commitment of higher education to improve its performance. An additional arena with promising potential is the strengthening of teacher leadership by the creation of more focus on graduate coursework and credentialing in the content areas so teachers can take on distributed leadership roles in schools around the issue of instruction.
Over the past three years the Illinois State Board of Education and the Illinois Board of Higher Education have collaborated to strengthen the preparation of Pre-K to 12 school leaders in the state. To place a committed and competent principal in every school may be the single most cost effective intervention possible to support ongoing teacher development, the improvement of classroom instruction, and consequent improvement in student learning. The state agencies are seeking legislative action on a new school principal endorsement in Illinois in 2010.
6) Revisions to Illinois Professional Teaching Standards and early childhood teaching
requirements New standards for teaching are being revised to include more specific and broader competencies, including ability to teach diverse learners, depth of content knowledge and pedagogical content knowledge, and uses of assessments to track students’ development. In addition, work is under way to develop stronger competencies among early childhood educators to address the diverse strengths and needs of multilingual learners.
The U.S. Department of Education The current national agenda for education contains requirements for states seeking federal grants. These four “assurances” directly align with the vision for education in the region and include: 1) Longitudinal data systems used to improve student performance; 2) Higher standards and assessments; 3) Recruiting, developing and rewarding effective principals and teachers; and 4) Turning around the lowest achieving schools.
Much more remains to be done to prepare today’s students for future success. Neither a state, nor a county, nor a district, nor a school can by itself produce the learning outcomes the region will need to meet the demands of an uncertain economic and technological future. All of these entities must work together, with the encouragement and support of the general public, to strengthen our education services in the region to benefit all our residents, which in turn will benefit our communities.

16
REPORT OVERVIEW
This report represents a summary of the work of three expert advisory groups that worked from August 2008 through May 2009 to identify and prioritize needs in education in the region, recommend strategies for improvement, and review key indicators that might be used to track the region’s progress over time. The expert advisory committees represented three levels of education: birth to 5, kindergarten to 12th grade, and higher education. The committee on early childhood was lead by Illinois Action for Children, Ounce of Prevention, and Voices for Illinois Children; the committee on K-12 education was lead by the University of Illinois at Chicago; and the Institute of Public and Government Affairs at the University of Illinois at Urbana-Champaign lead the higher education committee. While each arena of education has specific needs, the common issues quickly emerged around raising the bar on the quality of teaching and learning
addressing high needs populations more effectively to eliminate gaps in achievement and
aligning systems to support more effective transitions for learners.
The leadership of the advisory groups agreed that this final report should consolidate their recommendations into one document that organizes their common goals into a linked agenda, as ultimately the systems need to work together. The remainder of this document provides specific goals, recommendations and strategies for regional development in education.
Chapter 2 provides an overview of the early childhood, K-12 and postsecondary education reforms that must be part of the regional planning effort. It also illustrates how students are performing on key indicators and some of the educational disparities that exist across geographic areas within the region and between racial/ethnic minorities and income groups. Finally, over the coming decades, demographic, economic and technological changes are likely to present additional challenges for raising student achievement in the region, and some of these future trends are also examined.
Chapter 3 presents recommended goals and strategies for the region. Beginning with overall principles regarding education reform and transformation, the chapter then reviews each of the major goals regarding educational quality, access, and coherence, along with specific recommended strategies for each level of education and for P-20 as a whole.
Chapter 4 provides ideas about who should be involved and how we might proceed. In addition, the next steps in education have obvious links to other arenas of community development that are addressed in the CMAP GOTO2040 plan. Education in itself is a major agenda that requires greater internal alignment, but education is also implicated in other areas of human and community development in critical ways. So it is important to link this work to other agendas in the plan in order to achieve comprehensive change.
Chapter 5 reviews the key indicators that can be used to measure our success in accomplishing each of the major goals outlined in this report.

17
Chapter Two
EDUCATION TODAY AND TOMORROW
The seven-county region supports some outstanding schools, school districts, and institutions of higher learning. Yet across the entire region, many children and youth do not receive a high quality education. The need for quality education will only grow over the next 30 years, as our region becomes home to a larger proportion of low-income, non-English-speaking residents. At the same time, remaining competitive in a global economy will demand an increasingly well-prepared workforce. Without a coordinated effort to improve the quality of education for all students from birth through post-secondary schooling, disparities in school achievement and educational attainment will preclude many from having a fulfilling life and will seriously undermine the region’s prosperity. This chapter describes the region’s current education context with some references to international and national data. It concludes with expected changes in demographics, employment trends, and technology that have the greatest potential to impact education. DEMOGRAPHICS ACROSS THE REGION The diversity of public school districts in the region creates a challenge in crafting reforms that meet a wide range of student needs. Districts range from the small, rural and homogeneous to the large, urban and multiethnic as shown below in table 1. Ethnic and racial minorities are most heavily concentrated in school districts in Cook County, where they make up 45% of the population. By contrast, only 9% of the residents living in McHenry County belong to a minority group. Poverty rates also vary across the region with 15% of Cook County residents living in poverty compared to only 3% in Kendall County. Table 1. Demographic Snapshot of the Seven County Region Cook DuPage Kane Kendall Lake McHenry Will
Pop. 2007
Est. pop. 2012
5,278,157
5,187,690
933,488
949,144
500,408
563,285
87,832
111,924
717,278
764,585
315,673
353,088
681,781
804,842
Persons/
sq. mile
5,558 2,798 962 274 1603 523 815
Ethnicity
African American
Asian
Latino
White
26%
5%
23%
54%
4%
10%
12%
79%
5%
3%
28%
76%
3%
12%
14%
86%
6%
6%
19%
76%
1%
3%
11%
91%
11%
4%
14%
78%
Income per capita
Poverty rate
$26,567
15%
$35,148
5%
$28,030
9%
$29,622
3%
$35,411
7%
$31,001
5%
$28,896
5%
Source: Compiled from individual county profiles in Profiles of Illinois (2008) Gray House Publishing

18
Note: The source identifies “Hispanics” as Hispanics of any race. As a result, individuals are counted more than once, thus explaining why the totals exceed 100%. COMPLEX EDUCATION SYSTEM Coordinating reforms throughout the region’s many educational institutions and organizations is a complex undertaking. The region is home to nearly 2,100 public K-12 schools in 287 school districts serving 1.4 million students from diverse backgrounds. Early childhood education is provided by a number of different state and federal programs.2 Higher education institutions in the region include four major public universities, one third of the state’s community colleges and many private colleges and universities.3 As shown in table 2 below, each level of education has a different governing body and funding streams.
Table 2. Education by Level in the Seven County Region in 2007 (unless otherwise noted) # Students Served Governing Body Public funding Streams
Home Visiting for 0-3 26,580/5,5701
(IL/Chicago, FY 08) Department of Human Services/Illinois State Board of Education (ISBE)
State
Early Head Start 1,752 (2009)2
Federal Federal
Preschool for All 51,565 (2009)3
ISBE State Early Childhood Block Grant
Early childhood special education
17,717 (FY 08, for all IL)
4 ISBE State, federal and local
funds
Head Start 23,249 (2009)5
ISBE Federal
Public K-12 districts 1.4 million ISBE State, federal and local funds
Colleges & universities 202,8536 (for all IL) Illinois Board of Higher
Education State, federal and local funds
Sources:1 Illinois Department of Public Health, Illinois Early Childhood Asset Map, Illinois State Board of Education
and Chicago Public Schools, 2Illinois Early Childhood Asset Map (funded enrollment for counties with available
data for Cook, DuPage, Kane, Lake and Will Counties, 3llinois Early Childhood Asset Map (proposed capacity for all
seven counties), 4Early Childhood Advisory Committee Education Report,
5llinois Early Childhood Asset Map,
6Illinois
Board of Higher Education
As noted above, education financing is a patchwork with different levels receiving funds from various sources. More critically, education funding in Illinois and in the United States in general is not where it needs to be nor is it targeted where it is most needed. Illinois uses a modified foundation level approach to fund schools, in which the state sets a per-pupil-expenditure which is supported first by local property tax dollars and then by the state. Thus, a disparity in education funding exists, with wealthier communities spending more per student than less affluent communities. The latter have the most barriers to a high quality education both in the schools and in the community. Funding inequality is a key contextual item that needs to be understood and addressed. The achievement gaps between the poor and well-to-do and majority and minority students will not disappear until these groups are provided adequate funding to improve educational outcomes for the students. Adequate funding does not mean

19
equal funding, but if the wealthier quarter of communities in Illinois were reduced to the funding levels of the poorest quarter, the newly-reduced communities would undoubtedly declare those levels to be inadequate. Higher education is a different story. While society values higher education, it is seen as an individual pursuit and thus financed as one. Although the state has invested in public colleges and universities and in the education of low-income students through the Monetary Award Program (MAP)4, individuals and their families are the ones responsible for financing a college education. Further, according to a recent report commissioned by the Illinois General Assembly (A Public Agenda for Illinois Higher Education: Planning for College and Career Success), since fiscal year 2002, the state support for higher education has decreased. This has resulted in an increase in tuition and fees, thus increasing the financial burden on students and their families. In essence, higher education—even public higher education—has become less affordable. This is an issue which must be addressed effectively if Illinois wishes to ensure a higher standard of living for its residents, attract companies, create the type of jobs that will ensure salaries on which families can live comfortably, and ensure that civic leadership includes well-educated citizens from a variety of economic and cultural backgrounds. STUDENT ACHIEVEMENT AND ATTAINMENT As measured by various assessments, student achievement is low in the United States, Illinois and the region. The U.S. lags behind other nations in educational achievement and has slipped further behind in recent years on important measures including high school and college graduation rates and math and science scores on international tests such as the Programme for International Student Assessment (PISA). As noted in the graph below, the United States falls behind most industrialized countries on the PISA math exam. Similarly, forty years ago, the U.S. was a leader in high school graduation rates. Today it ranks 18th out of 24 industrialized nations. Graph 1. 2006 Average Math Score on PISA: The top countries are Finland, Korea, Netherlands, Switzerland
and Canada in descending order. (U.S. is in blue or in the darker shade.)
Source: Highlights From PISA 2006: Performance of U.S. 15-Year-Old Students in Science and Mathematics Literacy in an International Context, December 2007, US Department of Education, Institute for Education Sciences

20
Nationally, the National Assessment of Educational Progress (NAEP) gauges students’ academic achievement in grades 4 and 8. In mathematics, scores have increased steadily over time in 8th grade and while scores rose in 4th grade up to 2007, they remain unchanged from 2007 to 2009. All racial/ethnic groups showed improvements in average scores on the math NAEP test with 4th grade black students showing greater improvement. Thus, with the exception of a narrowing of the white-black gap in grade 4, the achievement gaps of white-black and white-hispanic remains unchanged. Furthermore, a recent article in Education Week notes that the disparity among racial/ethnic groups is more dramatic for the high achieving students. The Center for Evaluation and Education Policy at Indiana University in Bloomington conducted this analysis and found that at the top end of the NAEP levels (percent at advanced), the gap between white and minority students, poor students and affluent students, males and females, and English-language learners and their English-speaking peers either grew, remained unchanged, or decreased slightly.5 In comparing Illinois to the US, graph 2 reveals that Illinois falls behind the national average on the percent of students meeting the basic achievement level. A similar trend is seen in reading, except that Illinois has a greater percentage of students in 8th grade meeting the basic achievement level than students nationally.
Graph 2. Percent of students meeting the basic achievement level on the math NAEP exam in 2009
Source: National Center for Education Statistics (NCES) and The Nation's Report Card: Mathematics 2009
Illinois has two assessments, the Illinois Standards Achievement Test (ISAT) for 3rd through 8th grade students and the Prairie State Achievement Examination (PSAE) for 11th grade students. Various trends are seen in graph 3. In most counties, schools perform better on the math portion than on the reading portion of the ISAT, with more schools having at least 60% of their

21
students meeting or exceeding state standards. However, this pattern does not persist on the PSAE. Furthermore, gaps in student achievement exist between areas of the region. Elementary and middle school achievement is relatively high in DuPage County, where over 90% of schools had at least 60% of their students meeting or exceeding state standards in both reading and math and where over 80% of schools met this standard on PSAE reading and math tests. In contrast, Cook County, almost across the board, shows a lower percentage of schools with at least 60% of students meeting or exceeding state standards on both ISAT and PSAE. Moreover, with the exception of DuPage County schools, there is a large difference in the percent of elementary/middle school and high school performance on these exams. This is due in large part to a misalignment of the two tests.6 Graph 3. Percent of Schools with at Least 60% of Students Meeting or Exceeding State Standards on ISAT in 2007
Source: Illinois State Board of Education/Illinois Interactive Report Card
Gaps in educational achievement between students from different ethnic, racial and income groups exist throughout the seven-county region.7 The variations across counties in student achievement and educational attainment are likely related to both racial/ethnic make-up of these counties as well as the socioeconomic status of families living in these counties. Educational attainment also varies across counties. In 2007, 90% of DuPage County adults aged 25 and over completed high school and 42% held bachelor’s degrees. By comparison, in Cook County, only 78% had completed high school and only 28% held bachelor’s degrees.

22
Graph 4. Adults Age 25+ who had Reached or Exceeded Each Educational Level in 2007
Source: Compiled from individual county profiles in Profiles of Illinois (2008) Gray House Publishing
National research indicates that students from middle and higher income families are more likely to complete college than students from low income families. Further, Latinos and African Americans are also less likely to be represented among college graduates. This national trend bears out in northeastern Illinois with a greater percent of Asian and white individuals earning at least a bachelor’s degree. Graph 5. Adults Age 25+ who had Reached or Exceeded Each Educational Level in 2007
Source: Census 2000.

23
RESULTS OF A LESS EDUCATED POPULACE
Low student achievement and educational attainment influence individuals and society as a whole. Lower educational attainment leads to poorer health, increased rates of incarceration, decreased rates of civic participation and lower earnings over a lifetime. For example, this region has a serious problem with students dropping out of high school.8 Over a lifetime, an 18-year-old who does not complete high school earns approximately $260,000 less than someone with a high school diploma and contributes about $60,000 less in lifetime federal and state income taxes. The combined income and tax losses aggregated for one national cohort of 18-year-olds who did not complete high school is more than $156 billion, or 1.3 percent of GDP. Furthermore, dropouts are incarcerated at twice the rate of those who graduate from high school, leading to increased public spending on law enforcement.9
LOOKING AHEAD Over the next four decades, education in the seven-county region will need to meet the challenges created by changing demographics, employment trends, and technology. Some changes with the greatest potential to affect education are the following:10
Urban growth: By 2040, the number of residents living in urban areas in the region will increase, leading to unprecedented demand for housing, jobs, resources and schools in urban environments.
Ethnic and racial demographics: By 2040, the white population in the region will decrease by nearly a quarter million, while the Hispanic population will increase by a half million, representing 32% of the total population of the region. The African American population will decline slightly, while the Asian population will more than double but remain well behind the other groups in total numbers. These changes mean that African American and Latino residents—populations that have to date fared most poorly in schools—will make up an increasing proportion of public school students. They will also make up an increasing proportion of the income-earning population in the region that supports public schools. Their ability to compete for jobs in the global marketplace will affect the tax base for education for the entire region.
Number and proportion of school-aged children: By 2040, the population of children and youth aged 5 to 19 is projected to increase from 1.8 million to 2.1 million, a growth rate of only 19%. However, the percentage of residents in that age range will decline as more people choose to remain childless, delay childbearing or have fewer children than in previous generations. As parents of school-age children make up a smaller proportion of the adult population, convincing voters to adequately fund public education will become increasingly challenging.

24
Employment: Greater mobility, professional specialization and improved communication links will allow some people to work from anywhere. The concept of a “workplace” will continue to shift and more people in the information economy will work from home or in communal spaces. However, while the greatest number of total jobs will continue to be lower-skilled, service sector positions, high-skilled and technological jobs will be proportionately among the fastest-growing. As robotics increasingly replaces workers in some sectors, jobs requiring rote tasks will likely decrease and the demand for workers will continue to shift towards those with college degrees.11
Global economy: Nations from Asia, Europe and South America will secure a foothold in the global market and the United States’ economic dominance will level out. Income gaps will continue to widen, with fewer winners and more losers in the global economy. Those societies that invest in education for an information age will see high-skilled employment increase, while those failing to make such investments will see the greatest increases in a low-skill labor market and chronic underemployment.
Environment: Environmental issues will increase in public importance and awareness. Conservation measures and renewable energy sources will become a concern for all institutions, including schools. Rising energy costs will mean that older buildings will need to become more energy-efficient, and newer buildings will be smaller and “greener.” Environmental education and eco-literacy will become important content areas for educators.
Technology: The pace and nature of change in technology is such that innovations and consequences are among the most difficult to predict. Technological innovations will continue at a rapid rate, particularly in the fields of communication, nanotechnology and biotechnology. It is clear that technological advancements also have the potential to improve the ways in which educators collect data. Such data can and already do inform evidence-based decisions to improve student learning, but we are at the beginning of this trend.
Regardless of what technological changes take place in the next three decades, the best life opportunities will continue to accrue to those who are highly literate in oral and written communication; who are comfortable and capable in their mathematical skills; who are able to think analytically using information from various domains, including science and social sciences; and who can use established and emerging technologies to accomplish personal and professional goals. Those people who cannot demonstrate such skills will be disadvantaged economically, socially and personally.
Preparing students for employment should not be the sole purpose of education, however. Although it is impossible to predict the relative proportion of information-intensive jobs vs. low-skill, service-sector jobs in the coming decades, or even whether there will be sufficient work to sustain a standard 40-hour work week, the workplace cannot be the sole or even the primary determinant of educational policy and curriculum in K-12 schools. As the nature of work changes and reduces the skill level required for some jobs, it may be tempting to “dumb down” the public school curriculum for lower-performing students to match the needs of the low-skill

25
workplace, as historians tell us occurred a century ago. This temptation must be resisted on ethical and democratic grounds, as each student deserves to be educated to his or her fullest potential. It would likely be bad economic policy as well. Even in the service sector, inadequate levels of literacy and poor analytic and problem-solving skills are costly to employers.
Given the demographic and technological changes the region is likely to undergo in the coming decades, it will be more costly NOT to improve education in the region than to improve it. While improving the quality of education for all ethnic, racial and economic groups in the region is a democratic imperative, it is also costly. However, recent evidence, as noted earlier, suggests that it is even more costly not to ensure the successful early childhood to post-secondary education for all children and young adults.
A swift and systematic approach to region-wide education reform is essential to addressing both today’s issues and the demographic and technological challenges of the coming decades. Integrating planning efforts across institutions and education levels through individual partnerships and through state-level policy will be a key component to achieving the kind of deep and lasting change that that can impact the region’s long-term prosperity and civic health.

26
Chapter Three MAJOR GOALS AND STRATEGIC RECOMMENDATIONS TO IMPROVE EDUCATION IN THE REGION Although educational services in the region are provided by multiple agencies governed by different authorities and funded by multiple sources, the ultimate goals of these services converge and are interdependent. As noted in the preceding chapter, educational outcomes in the seven counties represent the overall impact of many factors internal and external to schools and educational programs, including the impact of each level of education on the others. Ultimately, the quality and productivity of schools and programs and the impact and reach of programs to all residents in the region will be strengthened to the extent that all participants in education agencies as well as the larger public move in a concerted effort towards common goals. The vision for education excellence in the region described in Chapter 1 requires adequate funding, equal access for all, seamless pathways for continued learning, and quality programming at all levels. This document, and in particular this chapter, attempts to build out some of the explicit parameters of this high level vision and provide specific goals and recommendations that will help move the region toward achieving it. This vision for educational transformation reflects the historic and enduring multiple purposes of education, attends to the increasingly complex 21st century demands for new levels of knowledge and skills, and addresses the opportunities and challenges of successfully educating increasingly diverse populations. Ensuring access to high quality education at all levels is a challenge that requires goals and recommendations that apply to all levels of education as well as specific challenges for each level. As outlined in earlier sections of this report, the major goals that need to be addressed to achieve the vision of improved education in the region are threefold:
1. Raising significantly the quality of education to prepare all our communities’ residents for successful and fulfilling lives in a 21st century global society as well as in an information economy;
2. Strengthening all residents’ equal access to quality education at all levels, while also ensuring their readiness to succeed; and
3. Creating greater coherence and collaboration within and across education agencies to strengthen educational development pathways for students, to ensure students’ preparedness for the next level of education or for participation in the workforce, and to strengthen economies of scale.

27
Recommendations for each of these goals will be outlined in this chapter and will be represented as joint work across levels and systems of education (P-20) as well as unique to different levels of educational systems (0-5-year olds; Kindergarten – High School; Higher Education).
GOAL 1: RAISE THE QUALITY OF EDUCATION IN THE REGION
High quality education is key to sustaining a productive workforce, an engaged citizenry, and a high quality of life. Educational institutions provide the framework and platform for residents’ preparedness as adults. As expectations for learning expand and increase in a complex and global world, so do expectations for teaching. Raising the quality of education thus means both raising standards and expectations for learning as well as improving the ability of the education workforce to deliver instruction at higher levels of learning. This goal of improving the quality of education is a mandate for all levels of the education pipeline from the care and education of young children through elementary and high school. Universities and colleges are implicated as well, since they are responsible not only for improving the quality of education programming for their own students, but also for the training and development of the majority of individuals who constitute the education workforce for preschool, elementary and secondary schools.
Notes on Improving the Quality of Teaching and Schools Good educators recognize that low-income children can succeed with challenging academic work if their teachers provide high quality instruction.12
Yet, despite the documented excellent results in individual classrooms or schools, we have not found a way to consistently scale-up such success. However, in recent years, several lines of educational research and policy-making have converged in an argument that significant school improvement can be achieved at scale (e.g., in a large school district or statewide) through workforce development. Simply put, widespread academic success in low-income schools depends on developing teachers and principals in concert with each other. This research-based “scaling-up” argument proceeds like this: First, all children, including those in low-income families, can perform at high academic levels if provided the right instructional environment and high quality and challenging teaching.13
Second, to achieve high quality instruction on a school-wide basis, a few gifted or exceptionally committed teachers are insufficient. There must be a well-qualified pool of teachers prepared and certified to work with a broad range of students.14
Third, schools and early childhood programs that succeed with low-income students are not completely idiosyncratic, each with its own unique and nonreplicable path to success. They share a number of common properties or “preferred organizational states of being.”15 These
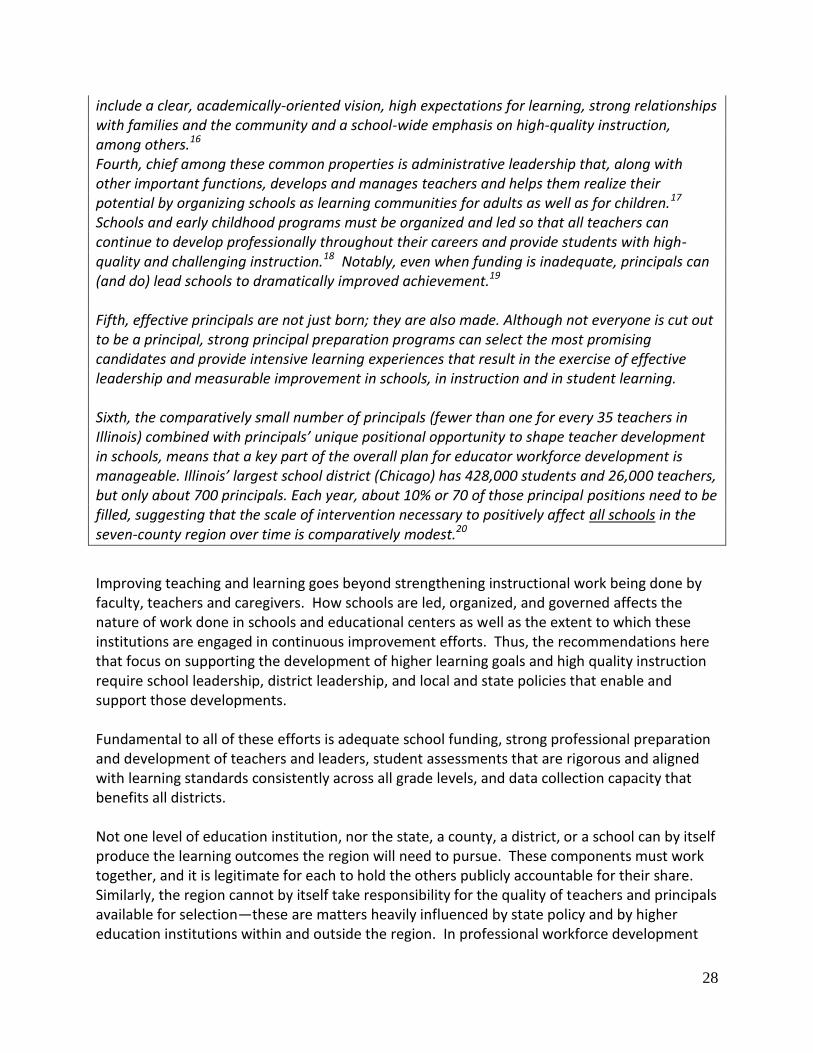
28
include a clear, academically-oriented vision, high expectations for learning, strong relationships with families and the community and a school-wide emphasis on high-quality instruction, among others.16
Fourth, chief among these common properties is administrative leadership that, along with other important functions, develops and manages teachers and helps them realize their potential by organizing schools as learning communities for adults as well as for children.17 Schools and early childhood programs must be organized and led so that all teachers can continue to develop professionally throughout their careers and provide students with high-quality and challenging instruction.18 Notably, even when funding is inadequate, principals can (and do) lead schools to dramatically improved achievement.19 Fifth, effective principals are not just born; they are also made. Although not everyone is cut out to be a principal, strong principal preparation programs can select the most promising candidates and provide intensive learning experiences that result in the exercise of effective leadership and measurable improvement in schools, in instruction and in student learning. Sixth, the comparatively small number of principals (fewer than one for every 35 teachers in Illinois) combined with principals’ unique positional opportunity to shape teacher development in schools, means that a key part of the overall plan for educator workforce development is manageable. Illinois’ largest school district (Chicago) has 428,000 students and 26,000 teachers, but only about 700 principals. Each year, about 10% or 70 of those principal positions need to be filled, suggesting that the scale of intervention necessary to positively affect all schools in the seven-county region over time is comparatively modest.20
Improving teaching and learning goes beyond strengthening instructional work being done by faculty, teachers and caregivers. How schools are led, organized, and governed affects the nature of work done in schools and educational centers as well as the extent to which these institutions are engaged in continuous improvement efforts. Thus, the recommendations here that focus on supporting the development of higher learning goals and high quality instruction require school leadership, district leadership, and local and state policies that enable and support those developments. Fundamental to all of these efforts is adequate school funding, strong professional preparation and development of teachers and leaders, student assessments that are rigorous and aligned with learning standards consistently across all grade levels, and data collection capacity that benefits all districts. Not one level of education institution, nor the state, a county, a district, or a school can by itself produce the learning outcomes the region will need to pursue. These components must work together, and it is legitimate for each to hold the others publicly accountable for their share. Similarly, the region cannot by itself take responsibility for the quality of teachers and principals available for selection—these are matters heavily influenced by state policy and by higher education institutions within and outside the region. In professional workforce development

29
for education, systemic levels of strategic thinking are required that go beyond individual institutions.
RECOMMENDED STRATEGIES P-20 (COMPREHENSIVE STRATEGIES THAT REQUIRE COLLABORATION FROM EARLY LEARNING THROUGH COLLEGE) 1. Raise expectations for learning to enable our children to compete internationally.
State and local education systems must raise standards for student learning and alter curricula to ensure students can achieve at higher levels. While the state can set higher learning standards, such as those being considered in the Common Core Standards Project (an effort of several states to raise U.S. expectations for learning) and the Diploma Project (an effort to raise expectations for high school graduation to better prepare students for entry into college), individual schools and districts should also be engaged in a deliberate and continuous effort to challenge the breadth, depth, and coherence of learning targets from one level to the next. These efforts should be mindful of and challenged by the superior academic performance and achievement of populations in other industrialized nations. At the same time, the effort to raise the bar on our learning expectations should be more attentive to the strengths of our diverse populations whose linguistic and cultural assets are often overlooked in the capacity building efforts of schools.
2. Strengthen the preparation and continuous development of an education workforce with
deep knowledge and skills.
In addition to clear understandings and skills about human development and the process of teaching, educators need more than ever a strong knowledge base about the subjects they are teaching and the ways in which students learn and develop skills in each subject. Increasingly, as the demands for learning increase, individuals teaching subjects are required to know more at a higher level. In addition, because of the increasing diversity of school populations, educators at all levels need to know more about how to teach diverse populations of learners, including English language learners and special needs children. Certification requirements at the state level need to be raised significantly for all levels, including for early childhood. Requirements for a general elementary school teaching certificate, for example, include limited preparation for teachers in the academic disciplines they will be teaching. Requirements for teaching pre-school vary widely and need to be raised significantly to make sure that teachers have the knowledge and capacity to help students develop kindergarten readiness. The role of higher education institutions in the preparation and continuous development of the education workforce needs to be revisited and revitalized. As noted ten years ago in a

30
commissioned report from the American Council on Education, presidents of colleges and universities must move the education of teachers to “the center of the institutional agenda” and articulate the “strategic connection of teacher education to the mission of the institution.”21 The report goes on to note that it is clearly in the self-interest of higher education to make strong teacher education one of its priorities, since that will ultimately result in more well-prepared students entering college. High quality teaching of our children and youth in the region will be highly affected by the level and extent of investment by university faculty, not only from the schools of education but also from arts and sciences. University connections to earlier levels of education need, furthermore, to extend beyond teacher preparation and to involve continuous learning opportunities for teachers in the form of advanced degrees and endorsements in the subjects they are teaching as well as through in-school coaching from university faculty.
0-5 (BIRTH THROUGH 5 YEARS OLD) Illinois has greatly expanded opportunities for preschool enrollment in recent years, and enrollment continues to grow.22 However, Illinois does not yet ensure that we are making progress towards offering high-quality programs to children of every socio-economic background. Research points to best practices and a wide variety of factors that help determine the effectiveness of early learning experiences. Illinois must take deliberate measures to implement practices that will make the state a national role model for early learning. Particular attention must be paid to underserved areas and to underserved populations with diverse needs, including special education students, English language-learners and students who need access to mental health treatment. 3. Strengthen preparation and development of early childhood educators and family
support systems where they are less than reflective of best practice. Improve professional development of educators. Educators need more robust, ongoing training in strategies proven effective through scientific research. They also must develop subject-specific competencies. In addition to raising the requirements for early childhood teaching credentials, early childhood education programs and schools should also require teachers to receive ongoing mentoring from an experienced educator. This is essential not only for preparing new educators, but also to attracting and retaining the most motivated, highest-performing educators. It is critical that we make early learning an attractive career that provides opportunities for advancement and challenges educators to strive for excellence. Multiple institutions have a role to play in meeting this need. Higher education institutions will have to work with administrators and teachers already in the field to develop solid teacher preparation programs and align curriculum. We must also prioritize training for areas of particular need such as infant /toddler programs and programs that serve English language learners.

31
Create a comprehensive quality assurance program. Illinois must have a coordinated system to assure the quality of early learning programs. Currently, quality assurance is fragmented. Three state departments evaluate different aspects of early learning programs. Local school districts and health departments are also involved in the evaluation. Regulatory requirements such as child care center licensing co-exist with voluntary programs including accreditation by the National Association for the Education of Young Children for preschools and early childhood centers, the Quality Rating System for child care providers and voluntary review from the Child Care Assistance Program that offers increased funding to programs that meet certain quality standards. While compliance-monitoring by the Illinois State Board of Education remains under-funded and underdeveloped, the existence of so many quality assurance efforts provides the opportunity to shape a coordinated system that draws on the strengths of existing approaches but reduces overlap and increases effectiveness. Increase compensation for early learning educators. Raising salaries in the early learning field could attract and retain more high-performing educators.
Expand early care and education networks. Broader community engagement supports children’s learning in formal and informal settings throughout the day. Initiatives to involve parents, providers and community organizations in local service planning, capacity-building and coordination have demonstrated success and need to be expanded.
4. Create rich sources of data to inform early childhood policy. Policymakers need rich sources of data on which to draw in order to make informed decisions about the capacity and quality of early childhood programs and the size and characteristics of the population to be served. Trends in the data can help identify best practices and ensure that programs are continuously improved to increase children’s school readiness. A growing body of scientific data on children’s brain development underscores the importance of quality early learning experiences and has been a key impetus for Illinois’ expansion of early childhood programs. Research-based evidence that quality programs lead to positive outcomes resonates with policymakers, the public and other key constituencies. Although studies have provided crucial support for the efficacy of quality programs, there is a need for expanded, comprehensive data measuring positive outcomes. There is a significant gap in this type of data. Illinois lags far behind other states in collecting data on early childhood education. At least ten states currently use state-level kindergarten readiness assessments to improve learning, and at least 18 states use readiness assessments to monitor trends. Illinois lacks basic information on classroom outcomes, particularly in regions outside of Chicago.

32
Policymakers and providers must have access to this type of data to improve programs and ensure that they are increasing school readiness. Advocates must have access to compelling data in order to make the case for strengthening early childhood programs and to press federal, state and local leaders for increased investment in this arena. Currently, educators, policymakers and advocates lack the data necessary to answer basic questions and shape effective policy. While important progress has been made, existing data systems are fragmented, inconsistent and incomplete. Ultimately, Illinois must create a statewide, cross-disciplinary early childhood data system that includes but is not limited to early education indicators. We must be able to define and measure school readiness.
Assess existing data systems. One of the first steps towards creating a holistic, statewide metric system would be to perform an assessment of existing data. Members of the early learning community frequently do not know what data is available or do not have easy access it. Compiling a list of existing information and then determining necessary additions and improvements is an important starting point. To be complete, a multitude of state agencies, early education providers, policymakers and advocates would need to support and participate in the assessment. Researchers with data analysis skills would also be needed.
Expand the Statewide Student Information System. The Illinois State Board of Education has implemented a statewide Student Information System (SIS) that tracks children enrolled in Preschool for All and K-12 education. This system tracks children over time, providing critical demographic and achievement information. The system needs to be expanded to cover children in all birth-to-three programs funded by ISBE, including community-based providers. It should then be further expanded to include children enrolled in Head Start and to link to similar data systems in health, child care, nutrition and social services.
K-12 (KINDERGARTEN THROUGH 12TH GRADE) To raise the achievement of all schools, particularly those that serve an increasingly low-income and ethnically diverse student population, school districts must organize themselves to support effective teaching and learning in each classroom in every school in a systematic way that has not to date been achieved. Districts need to develop strategic plans to support high-quality instruction in classrooms and to demonstrate to state agencies and to the General Assembly the kinds of support that are needed to achieve improved learning at the district level. 5. Create financial supports for public education to ensure that schools have the resources
necessary to achieve quality programming. At the same time, economies of scale should be developed where districts are reorganized into fewer, more effective organizations. Although more equitable funding across districts will not guarantee results, increasing allocations to lower-funded districts will assist their efforts to organize resources for the

33
academic success of populations that have benefited least from public education. It is in the public interest to allocate state and federal resources strategically to those districts and schools most in need of improving student learning.
Since the requirements and agendas for teaching and learning have expanded considerably, it makes sense to re-think district organization in such a way that resources for high-level teaching can be put to more efficient use. With the demands of an expanded curriculum to meet higher level learning needs of students for the 21st century, the needs of human and physical resources by schools continue to expand exponentially. Communities should consider the advantages of consolidation or other partnerships across district lines.
6. Strengthen the preparation of principals and district leaders for K-12 schools to ensure
that they have the necessary skills to lead significant improvements in instruction and measurable gains in student learning.
Over the past decade it has become increasingly clear that even the lowest performing school can be dramatically improved if a committed and competent principal assumes instructional leadership and is supported by the district in doing so. Recent studies illustrate that one of the most effective levers for improving a low-performing school is to improve the quality of principal leadership. However, with few exceptions, principal preparation in Illinois is done “on the cheap,” with programs that are essentially non-selective in admissions, low-cost to administer and include very little clinical training to ensure development and assessment of key leadership qualities and skills. This must be changed at the state level, and districts must learn to use the leverage of the principalship for improving school performance—as opposed to elevating an assistant principal who has “earned” the leadership position through years of faithful service. The Illinois State Board of Education is currently preparing legislation to transform school leadership preparation in Illinois to make it highly selective in admissions, rigorous in program and assessments, intensive in clinical training and conducted with school districts as active partners in the process. Improved principal development will require new state resources and the commitment of higher education to improve its programs for school administrators.
7. Improve teacher preparation and the quality of ongoing professional development. Teachers must continually expand their knowledge and skills to teach their assigned subjects and to meet the needs of low-income, minority, English language-learning children and those with special education needs. When teachers graduate from teacher preparation programs, even the best of them are only beginners compared to what they will be in five years if they remain in the profession. Extensive professional learning over time is necessary to meet the needs of diverse students. The region must commit to a systemic approach to teacher preparation and

34
ongoing development in schools, which will require that schools become well-led learning environments for adult professionals as well as for children and youth. Again, the region must work in collaboration with state agencies and higher education to achieve this.
8. Organize and lead schools so that all teachers can continue to develop professionally throughout their careers to provide students with challenging, high quality instruction.
Each district should demonstrate annual progress in developing the organizational capacity to support improvements in classroom instruction. Districts should be able to point towards efforts to develop instructional leadership at the school and district level, improve teacher qualifications and create time for teachers to collaborate on analyzing what students know and how to adapt instruction to enable them to move to the next level of learning. Districts should also be able to describe partnerships with higher education aimed at tailoring teacher and administrator preparation programs to meet the needs of the district. Districts must not be passive consumers of teachers and principals, but active agents in working with colleges and universities and state agencies on the preparation and ongoing professional development of educators throughout their careers. Evidence should be provided that school leaders are extensively prepared and supported by districts, in partnership with higher education wherever possible, to be instructional leaders whose main responsibility is to support improved student learning—in the classroom and in the wider school community through partnerships with service providers. Evidence of school leadership should be regularly collected, and should consist of valid and reliable measures of improved student learning as well as improved school climate and culture.
Attention to the continuum of teacher and principal preparation and development will require systemic state and district strategy and resource allocation. In addition, teacher preparation programs will have to work collaboratively with districts to meet their workforce needs and address teacher shortages in special education, secondary education math and science, and world languages.
HIGHER EDUCATION Higher education institutions have a dual responsibility in improving the quality of education in the region. One is to continuously raise the bar on the programming provided at the college level and to ensure the readiness of college students to move from one level to another (for example from two- to four-year degree programs as well as from degree completion to the world of work). The other is to participate actively in improving the preparation of the workforce for early childhood education as well as for elementary and secondary schools.
35
9. Improve the preparation and continuing development of educators for all levels of
education (0-5 and K-12) at higher education institutions in a comprehensive way that engages the intellectual resources of entire universities, including arts and sciences.
In 1999, the American Council on Education Presidents’ Task Force on Teacher Education put forward an action plan for universities in its commissioned report, To Touch the Future: Transforming the Way Teachers Are Taught. That plan was founded on three powerful premises that are salient to this 2040 Vision:
i. The quality of schooling in America is inadequate for the times. ii. Strengthening the way colleges and universities prepare teachers is a central
element in improving the nation’s schools. iii. Decisive action by college and university presidents is essential if American higher
education is to fulfill its responsibilities. Among the key strategies recommended to higher education leaders by the commissioned report include: 1) Moving the education of teachers to the center of the institutional agenda; 2) Clarifying and articulating the strategic connection of teacher education to the mission of the institution; 3) Campus-wide review of the quality of teacher education programs; and 4) Coordination between Education and Arts and Sciences faculty and coursework.
10. Strengthen academic links between higher education institutions and secondary school programming as well as within higher education to support successful transitions between community colleges, colleges and universities and technical schools, and the work force.
High school to college. Academic preparation is key to college success, yet too many students graduate needing remedial college courses. While interventions may be needed for those not ready for the academic rigor of college, colleges and secondary schools need to work more closely to align academic programming to ensure that all students are ready. Two to four-year transfers. Approximately half of the students who begin at a community college in Illinois transfer to a four-year institution by the third year of college. Agreements and alignments between two and four year institutions regarding academic expectations and rigor need to become the norm rather than the exception. College to work force. Collaborations are also needed between educational institutions and employers throughout the seven-county region. These partnerships should be designed to identify knowledge and skills required for employment and to ensure that institutions of higher education are providing a strong platform for an educated and skilled workforce in multiple arenas. In addition, where applicable, the academic preparation of students can be strengthened by such partnerships by opportunities for internships, summer employment, and work-study that is focused on potential professions and careers.

36
GOAL 2: STRENGTHEN EQUITABLE ACCESS TO HIGH QUALITY EDUCATION AND ENSURE ALL STUDENTS’ READINESS FOR SUCCESS
Improving the quality of schooling from early childhood through post secondary education will achieve only limited impact unless all individuals in our communities have equal access to quality education and are well prepared to succeed at each stage of their education and in the careers and work that follow. Equitable access to education for low-income and minority students is an issue in Illinois beginning in preschool, and many have argued, even from birth. In 2000, only 44% of three- and four-year old children from families earning less than half of the state median income were enrolled in preschool compared to 66% of those from families earning over 125% of the state median income.23 Successful completion of school is also a major issue for some communities. For example, in 2004-2005, the high school graduation rate of African Americans in Illinois was 44% compared to 83% for whites.24 At the college level, for that same year, U.S. Census data show that only 12% of African Americans and 8% of Hispanics in Illinois had achieved bachelor’s degrees compared to the state average of 34%. The absence of consistent expectations at different levels of education has resulted in many students completing one level but being inadequately prepared for the next. Nationally, for example, one third of students entering college require remediation in core subjects (reading and writing, mathematics) before they are ready to take college credit-bearing courses. Upon completing post-secondary education, furthermore, graduates need to have mastered skills and knowledge that qualify them for gainful employment or further study. The nature of work today requires that people enter all arenas of employment with strong academic skills, including problem-solving, reading comprehension, writing and other forms of communication, adaptability and the ability to work collaboratively. Whatever pathways for postsecondary education or work are selected, schools must address the needs of individual students in ways that enable them to develop the necessary skills for a broad range of options. This requires that all students are provided with a high quality education regardless of background or their intended occupation. For many decades in American education, high schools typically separated students into college (academic) or vocational training tracks with different expectations regarding academic rigor. The new basic skills required even for non-professional occupations now are similar to those required to succeed in college. Thus, all education systems, from early childhood through high school, must have higher academic expectations and curriculum pathways for all students regardless of their future goals. All individuals need equal access to high quality education programs that effectively prepare them for the next level of education or work.

37
RECOMMENDED STRATEGIES
P-20 (COMPREHENSIVE STRATEGIES THAT REQUIRE COLLABORATION FROM EARLY LEARNING THROUGH COLLEGE)
The state and our local communities need to ensure equitable access for all residents to a continuum of quality education from early childhood through post secondary education. All of our residents deserve education opportunities that enable them to move from one level to the next prepared for success. This requires work within institutions to address the differentiated needs of learners as well as across institutions to align goals for learning in a way that enables all students to succeed at higher levels. Particular attention needs to be paid in the region to communities and groups who either do not have access or who are not succeeding or persisting to completion once they are in school. 11. Align learning standards across all levels of education to ensure that students are
academically prepared to enter and succeed at each level of education or, at the end of their formal schooling, ready to enter the workforce. As mentioned in chapter 1 of this report, in 2007 the Illinois General Assembly passed an act that contains the charter for a new Illinois P-20 Council to guide and integrate education policy from preschool through graduate school. The council, similar to those that have been functioning in other states, is a promising mechanism to move the state towards common goals for improving academic achievement at all education levels, smoothing transitions between those levels, and making both early childhood learning and higher education accessible to a larger number of individuals, in particular the most disenfranchised.25
The council was recently appointed and now needs to create a bold vision for improving education in Illinois as well as strategies to support stronger links and readiness from one level of education to the next. The council should leverage support for the development of readiness assessments for kindergarten, for example, as well as guidelines for judging how well public schools, colleges and universities support entering students. Schools from elementary to the postsecondary level must be ready to offer academic and social supports to help students persist and succeed. Although it is not mandated to do so, the council should also appoint advisory committees that include expert educators in each of the disciplines who can help to create higher level benchmarks for teaching and learning, appropriate assessments, and guidance that helps schools address the differentiated needs of English language learners, special education students and African American populations that continue to be “left behind.”

38
12. Encourage participation of educational institutions at all levels in the closing of achievement gaps that exist between income groups, linguistic minorities and racial groups.
This recommendation is self-evident and needs to become a priority strategy if our region is to prosper in the coming decades. One of the more powerful opportunities in the GOTO 2040 plan is that of setting community goals and creating local strategies that will address challenges that transcend any one level of education. Each local community is charged in the education plan with addressing fundamental issues that have become endemic barriers, and collaboration is key to the development of individual communities’ goals and strategies. Altering the persistent achievement gaps cited earlier in this document should be among the highest priorities in education in our communities, and strategies outlined in this document can help to address those gaps.
0-5 (BIRTH THROUGH 5 YEARS OLD) Many children in the state do not have access to a high-quality preschool or to a birth-to-age-three program. In 2006, Illinois became the first state in the nation to make all three- and four-year-olds eligible for voluntary, state-funded high-quality preschool, while also funding critical services to children under three. Program capacity and funding have not yet met the demand, however. In FY 2008, only 75% of the students that Preschool for All was intended to serve were enrolled in either state or federal preschool programs. This percentage is equal to approximately 40% of the total statewide population of 3- and 4- year olds.26 The percent of children from birth to age three served in formal programs was only about 3 percent. During the build-up period, funding has been prioritized for programs that serve primarily at-risk and low-income children. In FY 2009, new Preschool for All funds were awarded to programs serving primarily at-risk children. Too many children of hard-working families still lack access to quality programs, however.27 In addition to increasing the number of children served by early childhood programs, available programs need to address the needs of an increasingly diverse population. A growing Latino population, in particular, has increased demand for programs that serve bilingual families and are culturally competent. Nearly one-third of children in Chicago speak Spanish at home, as do 13.6 percent of children statewide.28 Notably, families whose primary language is not English are 126 percent more likely to use home-based child care and 91 percent more likely to use parental care exclusively.29 If these children attend a formal program during the years when they develop their language skills, they are much more likely to succeed in school and other English-language environments.30

39
To prepare children at-risk for school success, Illinois’ home visiting programs are also essential. New parents of at-risk infants and toddlers can receive coaching to help foster children’s optimum development, as well as information about community services and other assistance. There are several types of home visiting programs in Illinois: the Department of Human Services’ Healthy Families program, the Parents Too Soon program, and those funded through the Illinois State Board of Education infant toddler set-aside. However, these efforts do not reach all the families who need and want services.31 13. Dedicate adequate resources to early learning in order to expand access and ensure that
sufficient resources are directed to the children and geographical areas that need them the most.
Use relevant data to compare needs and capacity of early childhood programs. Illinois policymakers should use detailed data to understand the population that needs to be served and the programs currently in place to serve them. In particular, the state should strive to ensure that all children at 200 percent of federal poverty level have access to quality programs. This will be one key measure of whether adequate resources are available. Significant progress is already being made. The Illinois Early Childhood Asset Map is an example of this.32
Ensure easy public access to data on early learning programs and resources. Members of the early learning community must have easy access to data on early learning in order to educate policymakers on the need for program revisions and increased funding. Illinois has extensive networks of advocates and providers who champion early learning. Consistent increases in funding for early learning require the continuation and growth of this network. Advocates must continually demonstrate the effectiveness of existing programs and simultaneously point to remaining gaps in access. The long-term cost-savings realized by investing in early learning will have to be continuously documented and highlighted. Efficient use of funds must be a priority. Illinois should continue working to ramp-up the efficiency of early childhood funding, simplify the funding streams, and allow blended funding to enhance quality. Furthermore, Illinois must ensure that all available federal funds are maximized.
Increase the capacity of early care programs to deliver early learning. Illinois can expand access to learning opportunities by offering supports and programs in the wide variety of settings where children receive day care. In many child care programs, there are untapped opportunities to deepen children’s cognitive, social and emotional growth. Illinois can help ensure that these diverse settings have the resources and capacity necessary to accomplish this.
14. Establish norms and measures to determine children’s readiness for school in the early years as well as schools’ readiness to teach young children appropriately.
School readiness has two sides: ready children and ready schools. A comprehensive school readiness assessment will incorporate measures in each area. Ready children exhibit age-

40
appropriate development in five domains: health and physical development, social and emotional development, approaches to learning, language and communication, and cognition/general knowledge. Ready schools have well-qualified teachers, robust professional development, low teacher turnover, rich classroom environments and consistent application of best practices. Illinois can follow the lead of several other states in developing a statewide school readiness assessment that draws on information already being reported and collects new information in critical areas that are not currently assessed. The results of the assessment will identify the strengths and weaknesses in the early childhood system and guide improvement initiatives.
K-12 (KINDERGARTEN THROUGH 12TH GRADE) 15. Advocate for and allocate adequate resources to schools that will enable them to provide
the supplemental supports necessary to ensure that all students succeed. Fundamental to closing the achievement gap at the elementary and secondary school level is the issue of appropriate funding. Illinois has one of the largest funding gaps in the nation for low income students, more than $2,000 per student.33 It is a given that school districts serving all students should have as a goal high-quality standards for teaching and learning. In addition, however, school districts serving low-income and minority students may need additional supports, such as extended school day, language specialists, social workers, psychologists and the like. Educators in those schools may also need supports for learning how to capitalize on the cognitive strengths and address the unique learning needs of English language learners. In addition, since more special needs children are mainstreamed into regular classrooms, teachers need support for how to restructure teaching so as to effectively address the differentiated learning needs of children. Individual communities across the region need to become advocates for appropriate funding from the state as well as for internal distribution of funds to support the work in schools that will enable all children to succeed.
HIGHER EDUCATION Equitable access to higher education must address two major issues: affordability and disparities in college enrollment and completion. Affordability. The Illinois Board of Higher Education has affirmed affordability as one of its highest priorities. In 1994, the board stated that “As a society we must ensure that all students, whatever their financial resources, can afford a college education and have access to the wide variety of quality higher education programs offered in the state of Illinois.” This commitment to affordability was reaffirmed by the joint IBHE/ISAC (Illinois Student Assistance Commission)

41
Committee on Affordability in 2003. The state of Illinois has one of the nation’s largest and most comprehensive need-based student aid programs in the nation, the Monetary Award Program (MAP). However, various indicators suggest that the goal of providing all state residents with access to affordable higher education has fallen short. A recent biennial state higher education report card published by the National Center for Public Policy and Higher Education gave Illinois an “F” for affordability.34 The report card also notes that the share of average family income in Illinois needed to cover the cost of attendance in all sectors (community college, public universities, private college and proprietary institutions) has increased substantially even after accounting for financial aid. College Enrollment and Completion Gap. Across the United States, college enrollment data clearly indicate that over time all racial/ethnic groups and all income groups are enrolling in college immediately following high school at higher rates. However, the gaps in the enrollment rates persist between white-black and white-Latino groups. From 1980 to 2006, the college enrollment rate has increased 12% for African Americans, 6% for Latinos and 19% for whites. While students from low-income families are going to college at higher rates, they are still enrolling at rates lower than those of students from high income families in 1976.35 Furthermore, African American and Latino students are much less likely to enroll in four year institutions of higher education. While data from 1971 to 2007 reveal an increase in college graduation rates among all racial/ethnic groups, the gaps between the groups also persist. Graph 6. Percent of 25-29 year olds with a Bachelor’s Degree or higher by race/ethnicity
Source: U.S. Department of Education, NCES, The Condition of Education 2008. Indicator 25.
As disturbing as is this continued educational attainment gap between minority groups and the majority group, the large gap in attainment of a Bachelor’s Degree by young adults from low income families versus young adults from high income families should be of equal concern.

42
Graph 7. Percent of 24 year olds with a Bachelor’s Degree by family socioeconomic status
Source: Postsecondary Education Opportunity, Number 156, June 2005, “Family Income and Higher Education Opportunity 1970 to 2003”
36
In Illinois, in 2008, whites comprised the largest percent (60%) of students enrolled in colleges and universities, including community colleges, followed by African-American at 14% and Latino students at 12%. Illinois education attainment data further illustrate the disparities among the racial/ethnic groups. Whites have much higher educational attainment than both African American and Latinos. Furthermore, while the participation of students from low-income families is increasing across the nation, in Illinois it decreased 5% from 1999 to 2006. 16. Make higher education affordable for all students in the seven-county region.
State financial aid clearly needs to increase if college is going to become affordable for more Illinois students. Information about scholarships and financial aid also needs to become more accessible to low-income students, particularly first-generation college students who are often unaware of the available options. Increasing opportunities to earn degrees at an accelerated pace could also reduce expenses for some students. Efforts should also be made to increase efficiencies at public colleges and universities in order to reduce their operating expenses. For example, the state should identify and eliminate regulations and statutory mandates that impose unnecessary costs. There are a number of potential models from other cities and states that could improve college affordability in Illinois. For example, a privately funded program in Kalamazoo, Michigan called the Kalamazoo Promise offers scholarships of up to 100% of the cost of attending any state university or community college. Syracuse, New York organized a similar program funded by the city and local businesses offering a free college education to

43
any student enrolled in the district from 10th through 12th grade who wins admission to a public college or university or one of 23 private institutions. In Iowa, the state has worked with private banks to create loan guarantee systems for students. The ideas for addressing this crisis are multiple (e.g., publicly funded tuition-free community college option), and the challenge of developing funding strategies and solutions is immediate and urgent. Addressing college affordability for all is key to achieving vibrant and economically successful communities and should become a targeted agenda at local and state levels involving state agencies, higher education institutions of all types, local governments, and the business community.
17. Increase college enrollment rates among African American and Latino students to match the rate of white and Asian-American students. Strengthening the quality of education at the earlier years will prepare students to enroll in college. However, specific strategies and programming will be needed to assist African American and Latino students to navigate the college selection and enrollment process, particularly the identification of institutions that match their needs and potential majors as well as schools with proven records of graduating these students. In addition, programs that expose these students to college campuses and course work will also further ensure that students understand their potential and increase their familiarity with these institutions.
18. Increase college graduation rates among African American and Latino students to match the rate of white and Asian-American students. Strengthening the quality of education at the earlier years will enable students to enter college with the skills they need to succeed. At the same time, it is imperative that institutions of higher education create strategies that will support all students’ success. Some possible methods of providing those supports have been put forward but need to be expanded by individual institutions and communities. These include:
Bridge programs for entering students that accurately assess areas of academic weakness (mathematics, writing, science) that can be strengthened during the summer or first semester through targeted coursework or tutoring.
Increased collaboration between two- and four-year institutions to support alignment of coursework expectations and consistency in academic supports.
Institutional efforts to strengthen the quality and effectiveness of remediation so that students can enroll in credit-bearing courses more quickly or even simultaneously.
Increasing the capacity of higher education faculty and staff to address students’ differentiated learning needs.
Tracking program progress, transfers, and degree attainment systematically and having a plan to increase the success of students at all phases of their degree/certificate program.

44
GOAL 3: CREATE GREATER COHERENCE AND COLLABORATION WITHIN AND ACROSS LEVELS OF EDUCATION Even though learning begins at birth and continues through adulthood, educational institutions and agencies that support learning continue to function in separate silos of governance, funding, mission, and standards. As individuals move from one level to the next, the transitions are particularly challenging if students are not well-prepared or if the institution is not ready to provide the supports they need to succeed. At those moments of transition, students are vulnerable and more likely to begin a downward spiral of performance. The quality and access goals put forward in this regional agenda will both be served if institutions providing educational services in the region work together in purposeful partnerships towards greater alignment, coherence, and efficient use of shared resources towards the common end of successful educational attainment for all. Essential to this collaboration are: 1) comprehensive data systems that help institutions track students’ development as well as measure their own effectiveness in raising student performance and 2) collaborative partnerships that provide opportunities for institutions and businesses to share knowledge and resources as well as provide opportunities for students to move into the next level.
RECOMMENDED STRATEGIES
P-20 (COMPREHENSIVE STRATEGIES THAT REQUIRE COLLABORATION FROM EARLY LEARNING THROUGH COLLEGE)
19. Create comprehensive state-level data systems to track individuals’ pathways through
education in order to evaluate the effectiveness of systems and to ensure success for all students.
The Illinois State Board of Education has begun implementing a statewide Student Information System to track children enrolled in Preschool for All and K-12 education. This system will allow schools quickly to identify the needs of incoming students and to monitor their progress as they move on to the next level of their education. With further development, the system should provide opportunities to track and analyze the percent of students who meet school readiness standards upon entering kindergarten, middle school and high school and the percent of students taking remedial courses upon entering college. In addition to tracking students, state and local policy makers need more detailed, comprehensive data to assess the effectiveness of reform initiatives and the

45
impact of district organization, school leadership and teachers on student learning. Improved data collection would also allow for better public monitoring of programs and systems. The goals should be to ensure that all students are learning at a level that will equip them to have a full range of post-secondary choices after high school. Assessment of student learning must also ensure that schools and state policies are adequately addressing physical health, aesthetic development, and social-emotional learning rather than focusing exclusively on narrowly-defined academic skills.
0-5 (BIRTH THROUGH 5 YEARS OLD)
20. Create rich sources of data to inform early childhood practice and policy
Illinois lags far behind other states in collecting data on early childhood education. At least ten states currently use state-level kindergarten readiness assessments to improve learning, and at least 18 states use readiness assessments to monitor trends. Illinois lacks basic information on classroom outcomes, particularly in regions outside of Chicago.
The Illinois State Board of Education has implemented a statewide Student Information System (SIS) that tracks children enrolled in Preschool for All and K-12 education. The system needs to be expanded to cover children in all birth-to-three programs funded by ISBE, including community-based providers, to include children enrolled in Head Start, and to link to similar data systems in health, child care, nutrition and social services.
K-12 (KINDERGARTEN THROUGH 12TH GRADE)
21. Create comprehensive data collection systems for elementary and secondary students in
particular to measure the impact of schools on students’ learning.
The Illinois State Board of Education is aggressively pursuing funding for a longitudinal data system that will allow information on teaching and learning to be collected systematically for the entire state over time. In addition to measuring students’ academic achievement, this data system should compile evidence of student development in the areas of physical health, social-emotional learning, and the arts. Measures could include access to specific curricular and extracurricular offerings and instructional time spent participating in arts and physical education programs.
HIGHER EDUCATION 22. Strengthen partnerships and collaboration between higher education institutions and
professional/ business communities in the region to smooth students’ transitions to the workforce and careers and to strengthen the sharing of resources across these sectors.
Educational institutions must build more extensive partnerships with employers throughout the seven-county region. These partnerships should be designed to offer undergraduates

46
work-study opportunities, internships and summer employment. Partnerships should also be designed to identify skills and knowledge which are required for employment and to insure that institutions of higher education offer preparation for these careers. To expand employment opportunities for college graduates, universities must also increase the number of postsecondary degrees in fields of critical shortages (e.g., nursing, information technology), design curriculum that is built on work-readiness assessments and develop assessment tools that gauge students’ preparedness to enter the workforce.

47
Chapter Four NEXT STEPS: WHO IS RESPONSIBLE FOR WHAT? HOW DO WE BEGIN? The quality of education and equitable access to that education by those who have been least well-served are central to the development and vitality of our communities and the region as a whole. It is therefore a public responsibility that extends beyond a few individuals or agencies. Improving the quality of education and equitable access to it will require major collaboration of a new and unprecedented kind across our governmental bodies, educational institutions, civic and business organizations and leaders, community organizations, and other human service institutions. Since we all have been “schooled” in one way or another, we all have particular ideas about what education should look like, based on our own experience or that of other members of our families. Collaboration might start by considering the importance for policy and practice of a few guiding principles, such as:
Education has multiple purposes in a democracy, including but not exclusively workforce
development, civic preparation, and individual growth and development; education is at
its best when it does all three well.
Children and our young people are capable of much more than we are expecting of
them in our schools nationally and locally.
Education is a continuous developmental pathway (not fragmented systems) from birth
through adulthood, requiring coordination within and across levels to maximize
successful transitions from one level to the next.
The quality of teaching is central to children’s success, and research has shown that high
quality teaching is the most critical factor in the success of the most at-risk children.
Because the quality of school leadership is central to improving the quality of instruction
school-wide, improving the quality of school leaders is a proven and cost-effective way
to improve student learning.
Strengthening education early on and throughout the elementary and secondary years
will yield higher performance and greater success in post secondary education and in
the workplace.
Thinking boldly about the potential of consolidating districts, connecting pre-school
more closely to the primary grades in elementary schools, providing advanced high
school students more opportunities for early college programming, and other changes
to traditional education may be worth our consideration if these changes can yield
better outcomes for more students.
The way schools are organized by grades, teaching patterns, and the like may need to be
altered to accommodate new requirements for teaching and learning and to address
differentiated needs of our populations in more effective ways.

48
Effective education in a community is a powerful investment with high level returns,
especially among those young people whose human and financial capital supports for
education are minimal.
Providing appropriate funding that will meet the educational needs of all students is
critical to raising educational attainment in the region.
Our work locally needs to be aligned with efforts at the state and regional level to create
policy supports for better practices.
Education is a public good that requires public responsibility.
While there are no rules or directives for how communities should address the issues outlined in this report, it is suggested that leaders of education institutions, civic leaders, business leaders, and leaders in community organizations begin by studying this report and thinking about what it takes to improve education, avoiding the temptation to put forward quick-fix, short-term, unproven or “single-bullet” strategies. The broad-stroke strategies outlined in this report might help to catalyze critical steps that can be taken within the community at a local, county or regional level to address the issues of quality, access and coherence. The other reports put forward as part of the GOTO 2040 Plan contain issues and goals that intersect with education. As a start, it is recommended that the Education and Workforce Development Report be included in the deliberations of any community taking on the challenge of improving education.

49
Chapter Five INDICATORS In the previous chapters, we specified strategies that will enable us to provide consistently excellent educational opportunities to all individuals in the seven-county region. Here, we identify key indicators that can be used to measure the region’s success in accomplishing the goals outlined in this report.37
1. Raising significantly the quality of education to prepare all our residents for successful and fulfilling lives in a 21st century global society as well as in an information economy 0-5 (Birth through 5 years old)
% of children entering kindergarten with appropriate social, emotional, language and cognition skills (The assessment to gauge this readiness needs to be developed.)
% of early childhood teachers with a Bachelor’s Degree and specializing in early childhood education
% of classes taught by highly qualified teachers
K-12 (Kindergarten through 12th Grade)
Performance on the Illinois Standards Achievement Test (ISAT) for 3rd through 8th grade students or any other state level exam38 (overall and by subjects)
Average ACT scores
High school dropout and graduation rates (The state does not report cohort rates but should in the future. A high school cohort enters 9th grade in the early fall. A cohort rate calculates the percent of these entering 9th graders who graduate in four or five years. Cohort rates provide a better understanding of whether students are persisting through 12th grade.)
Higher Education
% of high school graduates who enroll in college
% of students who graduate from four-year colleges or universities within six years of enrollment
2. Strengthening all residents’ equal access to quality education at all levels, while also ensuring their readiness to succeed 0-5 (Birth through 5 years old)
% of 0 to 3-year-olds enrolled in Early Head Start or state-funded home-based or center-based education
% of 3 and 4-year-olds enrolled in Head Start, preschool, and special education preschool
50
K-12 (Kindergarten through 12th Grade)
Per-Pupil Spending Higher Education
% of students receiving financial aid
In addition, the indicators listed under improving the quality of education could be used to examine the equity of access if disaggregated by gender, race/ethnicity, family income level as well as other demographic groupings. 0-5 (Birth through 5 years old)
% of children entering kindergarten with appropriate social, emotional, language and cognition skills (The assessment to gauge this readiness needs to be developed.)
K-12 (Kindergarten through 12th Grade)
Performance on the Illinois Standards Achievement Test (ISAT) for 3rd through 8th grade students or any other state level exam (overall and by subjects,)
Average ACT scores
High school dropout and graduation rates (The state does not report cohort rates but should in the future. Cohort rates provide a better understanding of whether students are persisting through 12th grade.)
Higher Education
% of high school graduates who enroll in college
% of students who graduate from four-year colleges or universities within six years of enrollment
3. Creating greater coherence and collaboration within and across education agencies to strengthen developmental pathways for students and to strengthen economies of scale Greater coherence and alignment across systems should increase the number and percent of students who are ready to enter the next level of education. 0-5 (Birth through 5 years old)
% of children entering kindergarten with appropriate social, emotional, language and cognition skills (The assessment to gauge this readiness needs to be developed.)
Higher Education
% of high school graduates who enroll in college
% of students who graduate from four-year colleges or universities within six years of enrollment

51
Appendix I: Seven County Region Demographics
Table 1. Demographic Snapshot of the Seven County Region Cook DuPage Kane Kendall Lake McHenry Will
Pop. 2007
Est. pop. 2012
5,278,157
5,187,690
933,488
949,144
500,408
563,285
87,832
111,924
717,278
764,585
315,673
353,088
681,781
804,842
Persons/
sq. mile
5,558 2,798 962 274 1603 523 815
Ethnicity
African American
Asian
Latino
White
26%
5%
23%
54%
4%
10%
12%
79%
5%
3%
28%
76%
3%
12%
14%
86%
6%
6%
19%
76%
1%
3%
11%
91%
11%
4%
14%
78%
Income per capita
Poverty rate
$26,567
15%
$35,148
5%
$28,030
9%
$29,622
3%
$35,411
7%
$31,001
5%
$28,896
5%
Source: Compiled from individual county profiles in Profiles of Illinois (2008) Gray House Publishing Note: The source identifies “Hispanics” as Hispanics of any race. As a result, individuals are counted more than once, thus explaining why the totals exceed 100%.

52
Appendix II: Descriptions of Existing Early Childhood Programs
Preschool for All Illinois’ pre-kindergarten program for at-risk three and four year-old children began in 1985, and ISBE's birth-to-three programs were implemented a few years later. In 2006, Illinois made history by creating Preschool for All, the first program in the nation that aims to offer voluntary, high-quality preschool to all three and four year-olds. This initiative maintains Illinois’ commitment to children at risk of academic failure, while also expanding services for at-risk infants and toddlers and their families.
Preschool for All is drawn from a blueprint provided by the Illinois Early Learning Council, which was created with bipartisan support by the Illinois General Assembly and the governor in 2003. More than 200 early childhood advocates, service providers, civic and law enforcement leaders, legislators and others provided input on the plan.
Preschool for All builds upon the successes of the longstanding state pre-K program, with expanded access and important investments in quality and accountability. It works through the Early Childhood Block Grant to ensure:
High-quality preschool for all three and four year-olds whose parents choose it
Priority services for at-risk children, with gradual expansion to others
Expanded support for at-risk infants and toddlers
High standards and high-quality curricula and teaching staff in a variety of settings which parents choose (schools, child care, other community-based providers)—an approach that addresses a shortage of school-based classrooms as well as some families’ needs for full day/full year care.
Preschool for All is currently set to expire in 2010 due to sunset language; advocates continue working to make the program permanent.
Head Start Head Start provides comprehensive education, health, nutrition and social services to low-income children and their families. The goal of this federally funded and administered program is to "break the cycle of poverty" and improve children's chances for success in school and later life. Participants' household income must be at or below the federal poverty level.

53
Early Head Start Early Head Start promotes healthy prenatal outcomes for pregnant women, enhances the development of very young children and promotes healthy family functioning. Early Head Start serves low-income families with infants and toddlers and pregnant women. The program is federally funded.
Early Childhood Special Education Early Childhood Special Education serves 3- and 4-year-olds with disabilities or significant delays who have Individualized Education Plans. Services are funded by federal, state, and local funds.
Home Visiting Home visiting provides individuals and families with supportive health and social services directly in their homes. Home visiting offers parents a personalized approach to enhancing their children’s readiness to learn in the ways that matter for later success. In these programs, in-home parent coaches work with families on a voluntary basis - starting in pregnancy and during the first three years of a child’s life - to promote healthy development and early learning by helping to build strong parent-child relationships and connecting families to critical services putting them on a trajectory for life success.
Early Childhood Block Grant Illinois’ Early Childhood Block Grant (ECBG) is a birth to five early childhood education funding stream administered by the Illinois State Board of Education (ISBE) that is funded entirely with state general revenue funds. The Block Grant’s purpose is to provide early, continuous, intensive, and comprehensive evidence-based child development and family support services to help families prepare their young children under age five for later school success. The ECBG funds Preschool for All and birth-to-three programs.
History of Early Childhood Education in Illinois Awareness of and support for early childhood programs has grown steadily among both policymakers and the public. There has been growing recognition of the importance of early childhood opportunities and their potential to help children succeed. Illinois’ education policy has adapted to this new knowledge, and the state has long been a leader in the early learning arena. Illinois has made great strides towards expanding access to a variety of early childhood opportunities throughout the state. Early childhood policy in the seven-county region is primarily driven by state policy and state and federal funding, rather than by local governmental policies.

54
The state has a long history of investing public funds in early childhood programs. Prior to Governor Blagojevich’s administration, legislative leaders and state agency administrators worked together to support initial and increased investments in early learning with the creation of the Illinois State Board of Education’s State Pre-Kindergarten and birth-to-three programs in the 1980s; the creation of the Early Childhood Block Grant with the birth-to-three funding set-aside in 1997 under Governor Jim Edgar; child care quality initiatives, and funding for Parents Too Soon and Healthy Families home visiting programs.
For the first time in 2003, Access to the Early Childhood Education Block Grant preschool programs was opened up to allow non-school district providers to apply in order to enhance the school readiness of children served by community-based organizations. To ensure that programs for infants and toddlers grow apace with preschool, the Block Grant’s mandated birth-to-three funding set-aside was increased from eight to eleven percent of total funding for the Early Childhood Education Block Grant with a bill moving through the legislature to increase it to 20% by FY2015.
In 2006, the legislature overwhelmingly passed historic Preschool for All legislation and Illinois became the first state in the nation to make all three- and four-year-olds eligible for voluntary, state-funded high-quality preschool, while also providing critical services to children under three through an 11 percent set-aside.
The federally-funded Head Start program is also a key component of Illinois’ early childhood learning efforts. Head Start is designed to help break the "cycle of poverty" by providing preschool children from low income families with a comprehensive program to meet their emotional, social, health, nutritional and psychological needs.
One of the biggest challenges facing Illinois is the coordination and maximization of resources. The state is moving ahead on multiple fronts to develop a comprehensive early learning system by convening key stakeholders from the public and private sectors to allow for better alignment of sectors.
Guiding collaborative efforts and making recommendations to coordinate, improve and expand upon existing early childhood programs and services is the Illinois Early Learning Council. Established in 2003, the Illinois Early Learning Council is charged with the mission of ensuring that all children in Illinois start school safe, healthy, eager to learn and ready to succeed.
The council is currently comprised of gubernatorial and legislative appointees who serve on a voluntary, unpaid basis. Council members represent a broad range of constituencies, including schools, child care centers and homes, Head Start, education, higher education, state, local, and federal government agencies, the General Assembly, business, law enforcement, foundations and parents. The council includes representation from both public and private organizations, and its membership reflects

55
regional, racial, and cultural diversity to ensure representation of the needs of all Illinois children. (See Appendix V for details on the Illinois Early Learning Council.)
In the fall of 2006, following the successful passage of Preschool for All, the council underwent a strategic planning process, which resulted in the establishment of new long-term priorities and a new committee structure to accomplish these goals. The council now has seven working committees, including: Oversight & Coordination, Public Awareness, Space Capacity, Infants & Toddlers, Workforce Development, Linguistic & Cultural Diversity and Special Populations. The council also has a Data Workgroup and Home Visiting Task Force reporting directly to its Executive Committee.

56
Appendix III: Early Childhood Program Enrollment and Demographics Child Population in Illinois Illinois has consistently averaged approximately 185,000 births annually.1 Children five years old and under comprise 7.1 percent of the state's population and 35 percent of the child population (under 18 years of age).2 Additional information about the region’s projected childhood population is needed in order to plan to meet future demand for early childhood programs.
Child Population in 2005 in the State & Seven County Region
Total population
Under 1 year old
1 year old
2 years old
3 years old
4 years old
5 years old
Total 5 years & under
Illinois 12,763,371 181,010 180,178 178,790 177,584 180,715 173,626 1,071,903
Cook 5,303,683 81,598 80,934 79,197 78,595 80,103 73,766 474,193
DuPage 929,113 12,431 12,583 12,711 12,592 13,066 13,164 76,547
Kane 482,113 8,499 8,332 8,222 8,301 8,257 7,702 49,313
Kendall 79,514 1,155 1,226 1,240 1,183 1,130 1,133 7,067
Lake 702,682 10,343 10,385 10,385 10,412 10,771 10,722 63,018
McHenry 303,990 4,072 4,095 4,136 4,324 4,276 4,441 25,344
Will 642,813 9,494 9,634 9,587 9,675 9,544 9,810 57,744
Region Total 8,443,908 127,592 127,189 125,478 125,082 127,147 120,738 753,226
Source: Illinois Early Childhood Asset Map
1 Illinois Early Learning Council, “Early Learning in Illinois: Landscape, History and Key Issues,” January 2008. 2 Ibid.

57
Preschool for All, Early Head Start and Head Start Sites and Enrollment, FY 2007
ISBE PreK/PFA
sites
ISBE PreK/PFA proposed capacity
Head Start sites
Head Start funded
enrollment
Early Head Start
funded enrollment*
Illinois State 1,448 76,782 642 34,310
Cook 667 34,143 399 20,438
DuPage 26 1,533 8 408
Kane 20 2,322 6 692 91
Kendall 3 306 1 48
Lake 30 2,611 8 636 74
McHenry 14 960 6 223
Will 21 1,513 8 835 40
Total, seven county region 781 43,388 436 23,280 205
Source: Illinois Early Childhood Asset Map *Note: Funded enrollment as of July 2007
Illinois Children Served by Early Childhood Program Type
FY03 FY06 FY07 FY08
Preschool 55,984 76,508 85,186 90,435
Head Start
34,310 34,310 34,310 34,310
Special Ed
17,717 17,717 17,717 17,717
Source: Illinois State Board of Education

58
Statewide Birth-to-Three Enrollment: ISBE 0-3 Programs (Prevention Initiative and Parental Training) FY 2005
Area Prevention Initiative (0-3)
Number of children served
Parental Training (0-3)
Number of children served
IL State 8,614 21,515
Source: Illinois Early Childhood Asset Map
Percent of 3 and 4 Year-Old Children Enrolled in Preschool by Family Income as Percent of State Median Income (SMI)
50% of SMI or less ($34,584 or less for a
family of 4)
51%-125% of SMI (between $34,585 and $84,459 for a
family of 4)
126% of SMI or more (over
$84,460 for a family of 4) Total
Illinois Total 44% 49% 66% 51%
Chicago 42% 45% 61% 45%
Suburban Cook County 45% 49% 68% 53%
DuPage County 44% 54% 68% 58%
Lake County 42% 49% 73% 56%
Will + Grundy Counties 36% 52% 67% 54%
McHenry + Kane + Kendall Counties 38% 50% 60% 50%
Source: Metro Chicago Information Center, using Census 2000 SF1 files and 5% PUMS file

59
Estimated Number of Slots in Home Visiting Programs
Healthy Families &
Parents Too Soon
Prevention Initiative
(ISBE) Total
Percent served based on need
(100% Federal Poverty Level- FPL)
Percent served based on need
(185% FPL)
Illinois 4,539 22,041 26,580 26.3% 13.6%
City of Chicago 1,209 4,361 5,570 13.7% 7.4%
Chicago as % of state enrollment 26.6% 19.8% 21%
Sources: Illinois Department of Public Health, Illinois Early Childhood Asset Map, Illinois State Board of Education and Chicago Public Schools
Linguistically Isolated Households by County in 2005
Number of households speaking Spanish at home that are linguistically isolated
Number of households speaking other non-English languages at home that are linguistically isolated
Cook 96,994 80,786
DuPage 8,325 8,310
Kane 13,403 2,590
Kendall 971 NA
Lake 9,693 4,325
McHenry 1,748 906
Will 4,286 2,107
Total seven county region 135,420 99,024
Source: Illinois Early Childhood Asset Map

60
FUNDING The Early Childhood Block Grant (ECBG) is an essential funding mechanism for Illinois’ early childhood programs. Funding for Preschool for All is provided through the Early Childhood Block Grant. Currently, 11 percent of the Early Childhood Block Grant is set aside for birth-to-three programs. Advocates are working to increase the set-aside level to 20 percent.
Early Childhood Block Grant Funding
Fiscal Year Total
FY07 $318,300,000
FY08 $347,800,000
FY09 $380,261,400

61
Appendix IV: Illinois Early Learning Council Structure
Workforce Development Committee
Charge: Ensure an adequate and stable supply of highly-qualified and diverse early childhood professionals to provide high-quality early childhood services.
Public Awareness Committee Charge: Increase participation in high quality early learning programs by providing consistent, high-quality
information, outreach and technical assistance to families, early childhood providers, and other stakeholders.
Linguistic and Cultural Diversity Committee Charge: Develop strategies for meeting the varied needs of culturally and linguistically diverse families and
young children to ensure that they are well-prepared for school.
Special Populations Committee Charge: Expand access to high quality early learning programs to children who face the greatest challenges,
such as children with disabilities, children who are homeless, children involved the child welfare system, children in domestic violence shelters, etc.
Source: Illinois Early Learning Council, “Illinois Early Learning Council Overview: Purpose, Process, and Structure.”
Oversight and Coordination Committee
Charge: Provide advice to the Early Learning Council to help ensure the effective implementation of all Preschool for All birth to five service and program quality components and Early Learning Council recommendations.
Charge: Recommend systems focusing on standards, assessments, systems-level program evaluation and quality assurance that support both individual children's learning and development and programs' continuous improvement.
Charge: Recommend strategies to improve coordination and integration across early childhood programs and systems to address the comprehensive nature of children’s healthy development and readiness for school.
Space Capacity Committee Charge: Increase the space capacity in communities to serve children in high quality preschool classrooms
and infant-toddler care and education settings, especially where there are shortages.
Infants and Toddlers Committee
Charge: Expand access to high-quality early childhood development programs for all at-risk children under three years of age.
Charge: Improve the quality of infant toddler child care. Charge: Improve coordination across infant toddler programs and services at the state and local levels.
Develop recommendations regarding the creation of an outreach system for all new parents to provide basic information and support and to identify and connect families who need more intensive services to appropriate programs and services.

62
Appendix V: Early Childhood Data Collection Defining and measuring program quality is challenging but necessary. Because Illinois doesn’t currently collect adequate data on the quality of programs, the Illinois Early Learning Council has created a new workgroup to address significant data gaps. One existing effort to assess quality is the Chicago Program Evaluation Project (C-PEP). C-PEP is a descriptive study of the largest early care and education programs operated by the Chicago Public Schools and Chicago Department of Children and Youth Services. The project provides a comprehensive picture of 4-year-old children and preschool classrooms in half-day Head Start, half-day state prekindergarten, and select full day programs. C-PEP results were released in February.
Another effort to collect quality data is the Birth to Five Evaluation Project. The project will study key questions related to access, quality, and outcomes in the four ECBG-funded programs and is a collaboration between ISBE, the Erikson Institute and an advisory council.
Existing Outcome Data
One example of solid outcome data is a Journal of American Medicine study that followed children who participated in the Chicago Child-Parent Center Program through high school graduation. It showed that such programs can indeed have long-term, positive effects on participants' achievement and prospects—if the programs are held to high-quality standards. The evaluation found that the longer the children were in the program and the younger they entered, the higher their rates of high school completion and the lower their rates of juvenile arrest, school drop-out, grade retention and special education placement.3
3 Barrett, Steven, National Institute for Early Education Research.

63
Additional outcome data has been provided by the Illinois State Board of Education, which issued the most recent of its regular reports on the prekindergarten program in June 2007. This survey covered the 2005-2006 academic year for the state’s prekindergarten program for children at risk of school failure. (This is the program upon which the Preschool for All was built.) This report indicated Illinois’ preschool efforts helped to prepare young children for:
Kindergarten readiness: Teachers rated 69 percent of former pre-k participants (83 percent downstate, 45 percent in Chicago) as “above average” or “average” in kindergarten-entry skills in FY 06.4
Success throughout school: Downstate teachers ranked about 82 percent of their former pre-k students as “above average” or “average” in reading, math and language in grades K-8. Data for Chicago Public School District 299 are unavailable.5
These figures themselves are not uniform and comprehensive enough to provide an accurate sense of the performance of preschool programs. Specifically, these rankings are based on teacher judgment influenced by local assessment practices. ISBE has just implemented a new system of providing unique identifiers for preschool children, which will provide more relevant tracking data, and there are ongoing discussions within ISBE about efforts to further address this shortcoming. It is important to note that identifiers for children ages zero to three have not been implemented but are under discussion.
While these are positive signs, we still lack proper quality and outome data: we need a professionally designed, scientific tool for kindergarten readiness assessment as well as for evaluation of Preschool for All and we need data systems that are coordinated with both K-12 and higher-education data efforts.
More Data Needed There are extensive sets of data that need to be collected if Illinois’ early learning system is going to grow and improve. Policymakers must understand the size and characteristics of the population that will need to be served, be able to assess the capacity and quality of programs and have access to outcome data that suggests trends in progress and identifies best practices. Key indicators include:
1. Outcomes/Impacts: Percent of children entering kindergarten with appropriate social, emotional, language and cognition skills.
4 Illinois State Board Of Education, “Illinois Prekindergarten Program For Children At Risk Of Academic Failure
2005-2006 Evaluation Report,” June 2007.
5 Ibid.

64
2. Enrollment: Percent of 3 and 4 year-olds from families at or below 200% the poverty level enrolled in Head Start, preschool, special education preschool, Early Head Start or state-funded home-based or center-based education.
3. Quality: Percent of early childhood teachers with a Bachelor’s Degree and specialized training in early childhood, and percent of classroom-based programs accredited by NAEYC or rated at the 3 or 4 star level in the Quality Rating System.
4. Funding: Percent of birth to 5 year-olds from families at or below 200% the poverty level enrolled in programs funded at levels sufficient to deliver the services, quality and duration commensurate with current Early Head Start and full-day Head Start.
5. Percent of children under age 6 living in families with income below the federal poverty threshold.
6. Number of births to teens ages 15-17 per 1,000 girls
7. Percent of births to mothers with less than a 12th grade education
8. Percent of births to women who receive late or no prenatal care
9. Rate of substantiated child abuse and neglect among children birth to age 6
10. Percent of children under age 6 without health insurance

65
Appendix VI: K- 12 Achievement Gaps in the Seven County Region
Number of Public K-12 Schools by County and Statewide
Cook DuPage Kane Kendall Lake McHenry Will Illinois
Total schools
1235 233 159 36 196 76 159 3951
Elementary schools
908 160 113 23 134 44 103 2585
High schools 162 22 16 5 20 13 15 658
Middle schools
118 51 28 7 39 18 34 615
Charter schools
28 0 1 0 1 0 0 35
Schools >50% low-income
749 14 56 0 32 3 31 1381
Source: Illinois State Board of Education, Illinois Interactive Report Card

66
Differences in School Performance on the 2007 State Assessments in the Seven Counties
Cook DuPage Kane Kendall Lake McHenry Will State
Schools making Adequate Yearly Progress (AYP) grades 3-8
512/908
56%
148/160
93%
69/113
61%
20/23
87%
96/134
72%
31/44
70%
78/103
76%
1904/2585
74%
>60% meet/exceeding Illinois Standards Achievement Test (ISAT) reading
624\908
69%
144/160
90%
88/113
78%
21/23
91%
109/134
81%
39/44
87%
88/103
85%
2100/2585
81%
>60% meet/exceeding ISAT math
732/908
81%
153/160
96%
110/113
97%
21/23
91%
126/134
94%
42/44
95%
95/103
92%
2317/2585
90%
High schools making AYP
19/162
12%
6/22
27%
4/16
25%
2/5
40%
7/20
35%
7/13
54%
2/15
13%
231/ 658
35%
>60% meet/exceeding Prairie State Achievement Examination (PSAE) reading.
35\162
22%
18/22
82%
8/16
50%
1/5
20%
12/20
60%
7/13
54%
4/15
27%
228/ 658
35%
>60% meet/exceeding PSAE math
42\162
26%
18/22
82%
6/16
38%
2/5
40%
11/20
55%
5/13
38%
4/15
38%
213/ 658
32%
Source: Illinois State Board of Education, Illinois Interactive Report Card

67
Gaps in Northeastern Illinois Regional School Performance by County
Difference in Performance
Highest Performing County
Lowest Performing County
Met AYP grades 3-8 37% DuPage Cook
>60% met/exceeded ISAT reading 22% Kendall Cook
>60% meet/exceeding ISAT math 16% Kane Cook
Met AYP grade 11 42% McHenry Cook
>60% meet/exc. PSAE reading 60% DuPage Cook
>60% meet/exc. PSAE math 56% DuPage Cook
Source: Illinois State Board of Education, Illinois Interactive Report Card
Gaps in Northeastern Illinois Regional Elementary and Secondary School Performance by Percentage
School performance grades 3-8
School performance grade 11
Range
Met AYP 74% 29% 45%
>60% meet/exc. Reading
83% 45% 38%
>60% meet/exc. Math
92% 44% 48%
Source: Illinois State Board of Education, Illinois Interactive Report Card

68
2007 Performance on ISAT Math by Race/Ethnicity for Illinois for Grades 3 and 8
Source: Illinois Interactive Report Card Exceeds Meets Below Warning
Grade 8 White 38 51 10 1
Native American 27 51 20 2
Multiracial 28 55 16 1
Latino 16 60 22 1
Asian 60 36 4 0
African American 9 52 35 3
Grade 3 White 52 42 5 1
Native American 40 50 8 2
Multiracial 40 48 10 3
Latino 31 54 12 4
Asian 69 28 2 1
African American 18 50 21 11

69
North East Region High School Drop Out Numbers in 2006-07
Cook DuPage Kane Kendall Lake McHenry Will Region
Total drop outs
14,786 687 1,103 110 804 275 539 18,304
Source: Illinois State Board of Education, www.isbe.net/research/pdfs/eoy_dropouts06-07.pdf
Adults Age 25+ who had Reached or Exceeded Each Educational Level in 2007 Cook DuPage Kane Kendall Lake McHenry Will
High school
77.6% 89.9% 80.7% 90.1% 86.3% 89.4% 87.5%
Some college/ assoc. degree
25.5% 27.8% 27.5% 34.5% 26.6% 33.1% 32.3%
Bachelor’s 28.2% 41.6% 27.9% 25.7% 37.8% 28% 25.9%
Master’s 10.9% 14.8% 9% 7.3% 14.1% 8.1% 7.7%
Source: Compiled from individual county profiles in Profiles of Illinois (2008) Gray House Publishing
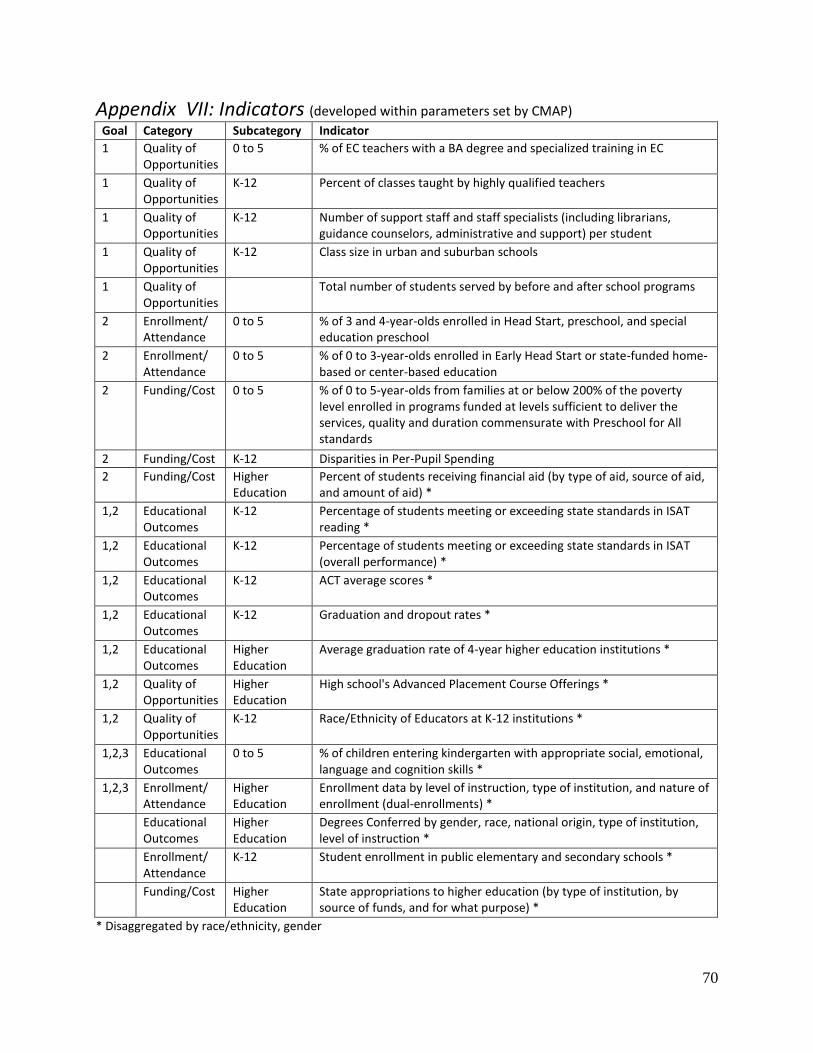
70
Appendix VII: Indicators (developed within parameters set by CMAP)
Goal Category Subcategory Indicator
1 Quality of Opportunities
0 to 5 % of EC teachers with a BA degree and specialized training in EC
1 Quality of Opportunities
K-12 Percent of classes taught by highly qualified teachers
1 Quality of Opportunities
K-12 Number of support staff and staff specialists (including librarians, guidance counselors, administrative and support) per student
1 Quality of Opportunities
K-12 Class size in urban and suburban schools
1 Quality of Opportunities
Total number of students served by before and after school programs
2 Enrollment/ Attendance
0 to 5 % of 3 and 4-year-olds enrolled in Head Start, preschool, and special education preschool
2 Enrollment/ Attendance
0 to 5 % of 0 to 3-year-olds enrolled in Early Head Start or state-funded home-based or center-based education
2 Funding/Cost 0 to 5 % of 0 to 5-year-olds from families at or below 200% of the poverty level enrolled in programs funded at levels sufficient to deliver the services, quality and duration commensurate with Preschool for All standards
2 Funding/Cost K-12 Disparities in Per-Pupil Spending
2 Funding/Cost Higher Education
Percent of students receiving financial aid (by type of aid, source of aid, and amount of aid) *
1,2 Educational Outcomes
K-12 Percentage of students meeting or exceeding state standards in ISAT reading *
1,2 Educational Outcomes
K-12 Percentage of students meeting or exceeding state standards in ISAT (overall performance) *
1,2 Educational Outcomes
K-12 ACT average scores *
1,2 Educational Outcomes
K-12 Graduation and dropout rates *
1,2 Educational Outcomes
Higher Education
Average graduation rate of 4-year higher education institutions *
1,2 Quality of Opportunities
Higher Education
High school's Advanced Placement Course Offerings *
1,2 Quality of Opportunities
K-12 Race/Ethnicity of Educators at K-12 institutions *
1,2,3 Educational Outcomes
0 to 5 % of children entering kindergarten with appropriate social, emotional, language and cognition skills *
1,2,3 Enrollment/ Attendance
Higher Education
Enrollment data by level of instruction, type of institution, and nature of enrollment (dual-enrollments) *
Educational Outcomes
Higher Education
Degrees Conferred by gender, race, national origin, type of institution, level of instruction *
Enrollment/ Attendance
K-12 Student enrollment in public elementary and secondary schools *
Funding/Cost Higher Education
State appropriations to higher education (by type of institution, by source of funds, and for what purpose) *
* Disaggregated by race/ethnicity, gender

71
Appendix VIII: List of Illinois Colleges and Universities
Sector Institution Name County
Public Universities
Chicago State University Cook
Eastern Illinois University Coles
Governors State University Will
Illinois State University McLean
Northeastern Illinois University Cook
Northern Illinois University DeKalb
Southern Illinois University Carbondale Jackson
Southern Illinois University Edwardsville Madison
U of I at Chicago Cook
U of I at Urbana/Champaign Champaign
U of I Springfield Sangamon
Western Illinois University McDonough
Community Colleges
Black Hawk College Rock Island
Carl Sandburg College Knox
CCC* - Harold Washington College Cook
CCC* - Harry S Truman College Cook
CCC* - Kennedy-King College Cook
CCC* - Malcolm X College Cook
CCC* - Olive-Harvey College Cook
CCC* - Richard J. Daley College Cook
CCC* - Wilbur Wright College Cook
College of DuPage DuPage
College of Lake County Lake
Danville Area Community College Vermilion
Elgin Community College Kane
Heartland Community College McLean
Highland Community College Stephenson
Illinois Central College Tazewell
Illinois Eastern - Frontier Wayne
Illinois Eastern - Lincoln Trail Crawford
Illinois Eastern - Olney Central Richland
Illinois Eastern - Wabash Valley Wabash
Illinois Valley Community College LaSalle
John A. Logan College Williamson
John Wood Community College Adams
Joliet Junior College Will
Kankakee Community College Kankakee
Kaskaskia College Marion
Kishwaukee College DeKalb
Lake Land College Coles
Lewis & Clark Community College Madison
Lincoln Land Community College Sangamon
McHenry County College McHenry

72
Moraine Valley Community College Cook
Sector Institution Name County
Community Colleges
Morton College Cook
Oakton Community College Cook
Parkland College Champaign
Prairie State College Cook
Rend Lake College Jefferson
Richland Community College Macon
Rock Valley College Winnebago
Sauk Valley Community College Lee
Shawnee Community College Pulaski
South Suburban Coll. of Cook Co. Cook
Southeastern Illinois College Saline
Southwestern Illinois College St. Clair
Spoon River College Fulton
Triton College Cook
Waubonsee Community College Lake
William Rainey Harper College Cook
Independent Not for Profit Institutions
Adler School of Professional Psychology Cook
Augustana College Rock Island
Aurora University Kane
Benedictine University DuPage
Blackburn College Macoupin
Blessing-Rieman College of Nursing Adams
Bradley University Peoria
Brisk Rabbinical College Cook
Catholic Theological Union Cook
Center for Psychoanalytic Study Cook
Chicago Baptist Institute Cook
Chicago School of Professional Psychology Cook
Chicago Theological Seminary Cook
Christian Life College Cook
Columbia College Chicago Cook
Concordia University Cook
DePaul University Cook
Dominican University Cook
East-West University Cook
Ellis University Cook
Elmhurst College DuPage
Erikson Institute Cook
Eureka College Woodford
Garrett - Evangelical Theological Seminary Cook
Greenville College Bond
Hebrew Theological College Cook
Illinois Baptist College Tazewell
Illinois College Morgan
Illinois College of Optometry Cook
Illinois Institute of Technology Cook

73
Illinois Wesleyan University McLean
Sector Institution Name County
Independent Not for Profit Institutions
Institute for Clinical Social Work Cook
Institute for Psychoanalysis Cook
Jewish University of America Cook
Judson University Kane
Knowledge Systems Institute Cook
Knox College Knox
Lake Forest College Lake
Lake Forest Graduate School of Mgmt. Lake
Lakeview College of Nursing Vermilion
Lewis University Will
Lexington College Cook
Lincoln Christian University Logan
Lincoln College Logan
Loyola University of Chicago Cook
Lutheran School of Theology at Chicago Cook
MacCormac College Cook
MacMurray College Morgan
McCormick Theological Seminary Cook
McKendree University St. Clair
Meadville - Lombard Theo. School Cook
Methodist College of Nursing Peoria
Midwestern University DuPage
Millikin University Macon
Monmouth College Warren
Moody Bible Institute Cook
Morrison Institute of Technology Whiteside
National College of Naprapathic Medicine Cook
National University of Health Sciences DuPage
National-Louis University Cook
North Central College DuPage
North Park University Cook
Northern Baptist Theo. Seminary DuPage
Northwestern University Cook
Olivet Nazarene University Kankakee
Principia College Jersey
Quincy University Adams
Robert Morris University-Illinois Cook
Rockford College Winnebago
Roosevelt University Cook
Rosalind Franklin University of Medicine & Science Lake
Rush University Cook
School of the Art Inst. Chicago Cook
Seabury - Western Theo. Seminary Cook
Shimer College Cook
Spertus College of Judaica Cook
Springfield College in Illinois Sangamon

74
St. Anthony College of Nursing Winnebago
Sector Institution Name County
Independent Not for Profit Institutions
St. Augustine College Cook
St. Francis Medical Center College of Nursing Peoria
St. John Institute of Catholic Thought Champaign
St. Johns College Sangamon
St. Sava Serb. Orth. Sch. Theo. Lake
St. Xavier University Cook
Telshe Yeshiva Cook
The John Marshall Law School Cook
Toyota Technological Institute at Chicago Cook
Trinity Christian College Cook
Trinity College of Nursing & Health Sciences Rock Island
Trinity International University Lake
Univ. of St. Mary of the Lake Lake
University of Chicago Cook
University of St. Francis Will
Urbana Theological Seminary Champaign
VanderCook College of Music Cook
West Suburban College of Nursing Cook
Wheaton College DuPage
Independent For-Profit Institutions
American Academy of Art Cook
American College of Education Cook
American InterContinental University Online Cook
Argosy University Chicago Campus Cook
Argosy University Schaumburg Campus Cook
Brown Mackie College-Moline Rock Island
Chamberlain College of Nursing DuPage
Computer Systems Institute Cook
Coyne American Institute Cook
DeVry University-Illinois DuPage
Fox College Cook
Harrington College of Design Cook
International Acad. of Design & Tech. Cook
ITT Tech. Inst. - Burr Ridge DuPage
ITT Tech. Inst. - Mount Prospect Cook
ITT Tech. Inst. - Orland Park Cook
Kendall College Cook
Lincoln College of Technology Cook
Midstate College Peoria
Northwestern College-Chicago Cook
Northwestern College-Southwest Cook
Rockford Career College Winnebago
Sanford-Brown College Madison
Solex College Lake
Taylor Business Institute Cook
The College of Office Technology Cook
The Cooking & Hospitality Institute Cook

75
The Illinois Institute of Art-Chicago Cook
Sector Institution Name County
Independent For-Profit Institutions
The Illinois Institute of Art-Schaumburg Cook
Vatterott College Adams
Westwood College-Chicago Loop Cook
Westwood College-DuPage DuPage
Westwood College-O'Hare Airport Cook
Westwood College-River Oaks Cook
Worsham College of Mortuary Science Lake
*Denotes Chicago Community College

76
Appendix IX: Bibliography 0-5 (BIRTH THROUGH 5 YEARS OLD) Barrett, S., National Institute for Early Education Research. Illinois Action for Children, “Access to Preschool in Illinois,” 2008. Illinois Department of Human Services, “Strong Foundations: Supporting Evidence Based Home
Visitation Programs to Prevent Child Maltreatment.” Illinois Early Childhood Asset Map, http://iecam.crc.uiuc.edu/ Illinois Early Learning Council, “Early Learning in Illinois: Landscape, History and Key Issues,”
January 2008. Illinois Early Learning Council, “Illinois Early Learning Council Overview: Purpose, Process, and
Structure.” Illinois Early Learning Council, “Preschool for All: High-Quality Early for All of Illinois’ Children,”
2006. Illinois State Board Of Education, “Illinois Prekindergarten Program For Children At Risk Of
Academic Failure 2005-2006 Evaluation Report,” June 2007. Metro Chicago Information Center, using Census 2000 SF1 files and 5% PUMS file. Ounce of Prevention Fund, “Birth to Five Project: Proposal to Build Initiative,” November 2007. Ounce of Prevention Fund, “Kindergarten Readiness Assessments,” November 2008. Ounce of Prevention Fund, Illinois Action for Children and Voices for Illinois Children, “Raising
Young Children to the Top of the Policy Agenda: Lessons from Illinois,” December 2006.” K-12 (KINDERGARTEN THROUGH 12TH GRADE)
Edmonds, R. (1979). “Some Schools Work and More Can.” Social Policy, 9, 28-32. King, M.B. (2004). “School- and District-Level Leadership for Teacher Workforce Development:
Enhancing Teacher Learning and Capacity.” In Developing the Teacher Workforce, Symlie, M.A. & Miretsky, D. (eds), Chicago: National Society for the Study of Education.
Knapp, M.S. & Associates (1995). Teaching for Meaning in High-Poverty Classrooms. New York,
NY: Teachers College Press.

77
Leithwood, K.A. & Riehl, C. (2003). What We Know About Successful School Leadership. American Educational Research Association.
Light, P.C. (1998). Sustaining Innovation. San Francisco: Jossey-Bass. National Commission on Teaching & America's Future (1996). What Matters Most: Teaching for
America's Future. New York, NY: NCTAF. Newmann, F.M., Bryk, A., & Nagaoka, J.K. (2001). Authentic Intellectual Work and Standardized
Tests: Conflict or Coexistence? Consortium on Chicago School Research, 22-26. Newmann, F.M., Smith, B., Allensworth, E., & Bryk, A.S. (2001). “Instructional Program
Coherence: What It Is and Why It Should Guide School Improvement Policy,” Educational Evaluation and Policy Analysis, 23: 297-321.
Sebring, P.B., Allensworth, E., Bryk, A.S., Easton, J.Q., & Luppescu, S. (2006). The Essential
Supports for School Improvement. Chicago, IL: Consortium on Chicago School Research. Smylie, M.A. (1995). "Teacher Learning in the Workplace: Implications for School Reform." In
Professional Development in Education: New Paradigms and Practices, Guskey, T.R. & Huberman, M., eds., New York: NY: Teachers College Press, 92-113.
Smylie, M.A., & Hart, A.W. (1999). “School Leadership for Teacher Learning and Change: A
Human and Social Capital Development Perspective.” In Handbook of Research on Educational Administration (2nd edition), Murphy, J. and Louis, K.S., eds. San Francisco, CA: Jossey-Bass, 421-441.
Superfine, B., Smylie, M.A., Tozer, S., & Mayrowetz, D. (2009). “Promising Strategies for Improving K-12 Education in Illinois: Improving the Educator Work Force.” In The Illinois Report 2009, Institute of Government & Public Affairs.
Villegas, A.M. & Lucas, T.F. (2004). “Diversifying the Teacher Workforce: A Retrospective and
Prospective Analysis.” In Teacher Workforce Development: The One Hundred and Third Yearbook of the National Society for the Study of Education, Part I, Smylie, M.A. & Miretzky, D., eds. Chicago, IL: NSSE, 70-104.
HIGHER EDUCATION American Council on Education (1999). To Touch the Future: Transforming the Way Teachers
are Taught. Washington, D.C. American Diploma Project (2008). Achieve Data Profile: Illinois. Retrieved February 25, 2009,
from http://www.achieve.org/node/913

78
Baber, L.D., Barrientos, J.I., Bragg, D.D., Castro, E., Khan, S. (2009). The Illinois College and Career Readiness Act: Year-one Evaluation Results. Office of Community College Research and Leadership, University of Illinois. Retrieved February 26, 2009, from http://occrl.ed.uiuc.edu/Projects/CCR/files/CCRYear_One_Report.pdf
Educational Needs Index (n.d._a). About ENI. Retrieved February 25, 2009, from
http://www.educationalneedsindex.com/about_eni.php Educational Needs Index (n.d. b). ENI calculations for Illinois. Retrieved February 25, 2009, from
http://www.educationalneedsindex.com/state.php?id=IL&no=0 Education Trust (2006). Education watch: Illinois. Key education facts and figures: Achievement,
attainment and opportunity from elementary school through college. Retrieved February 25, 2009, from http://www2.edtrust.org/edtrust/summaries2006/illinois.pdf
EPE Research Center (2008). Graduation Rate Map Tool. Retrieved February 25, 2009, from
http://www.edweek.org/apps/maps/ Gong, Y. & Presley, J.B. (2006). The demographics and academics of college going in Illinois
(Executive Summary). Illinois Education Research Council. Policy Research Report: IERC 2006-2. Retrieved February 26, 2009 from http://ierc.siue.edu/documents/College_Going_2006-2_Exec_Summary.pdf
Gong, Y., Presley, J.B., White, B.R. (2006). Following the Illinois high school class of 2002: Three
years into college (Executive summary). Illinois Education Research Council. Policy Research Report: IERC 2006-5. Retrieved February 25, 2009 from http://ierc.siue.edu/documents/Transitions_3_years_into_college_2006-5_Exec_Summary.pdf
Illinois Board of Higher Education. (2007). A report on the feasibility of textbook rental
programs and other textbook cost-saving alternatives in Illinois public higher education. Retrieved February 26, 2009, from http://www.ibhe.state.il.us/Board/agendas/2007/February/Item12.pdf
Illinois Course Applicability System (n.d.). Implementation Status Map. Retrieved February 26,
2009, from http://www.ibhe.state.il.us/CAS/CASMap.htm National Center for Public Policy and Higher Education (2008). Measuring up: The national
report card on higher education: Illinois. Retrieved February 25, 2009 from http://measuringup2008.highereducation.org/print/state_reports/long/IL.pdf
National Science Foundation (2008). Science and engineering indicators: Illinois. Retrieved
February 25, 2009, from http://nsf.gov/statistics/seind08/c8/data_result.cfm

79
Schott Foundation for Public Education (2008). Given half a chance: The Schott 50 state report on public education and black males. Retrieved February 25, 2009, from http://www.blackboysreport.org/files/schott50statereport-execsummary.pdf
Swanson, C.B. (2008). Cities in crisis: a special analytic report on high school graduation.
Editorial Projects in Education Research Center. Retrieved February 25, 2009, from http://www.americaspromise.org/uploadedFiles/AmericasPromiseAlliance/Dropout_Crisis/SWANSONCitiesInCrisis040108.pdf
ADDITIONAL SOURCES
Belfield, C.R. and Levin, H.M., eds (2007). The Price We Pay: Economic and Social Consequences of Inadequate Education. Washington, D.C.: Brookings Institution Press.
Chicago Metropolitan Agency for Planning. CMAP Population Projections Summary (2008).
Chicago Metropolitan Agency for Planning. Latinos in Our Region: CMAP Regional Snapshot (2009).
National Intelligence Council. Global Trends 2025: A Transformed World (2008). Washington, D.C.: U.S. Government Printing Office.
Postsecondary Education Opportunity, Number 156, June 2005, “Family Income and Higher Education Opportunity 1970 to 2003.
Profiles of Illinois: History Statistics, Demographics for 1,427 Populated Place in Illinois Including Comparative Statistics & Rankings, 2nd Edition (2008). Millertown, NY: Grey House Publishing, Inc.
Technology Counts (2009). Education Week, 28:6 (March 26, 2009).
Urban Land Institute. The City in 2050: Creating Blueprints for Change (2008). Washington, D.C.
U.S. Census 2000. U.S. Department of Education, Institute for Education Sciences. U.S. Department of Education, National Center for Education Statistics and The Nation's Report
Card: Mathematics 2009.

80
U.S. Department of Education, National Center for Education Statistics, The Condition of Education 2008.
1 http://www.ibhe.state.il.us/Academic%20Affairs/P20/HB1648.pdf 2 See Appendix III for Preschool for All, Early Head Start and Head Start Sites and Enrollment by county. 3 For a list of colleges and universities in the region, see Appendix VIII. 4 The Monetary Award Program (MAP) provides grants to Illinois residents who attend approved Illinois colleges and
demonstrate financial need. 5 Education Week. “Study Finds Wide Achievement Gaps for Top Students.” Debra Viadero. February 9, 2010. 6 The difference in achievement in elementary schools and high schools on state tests is at least partly the result of a lower bar
for meeting state standards at the elementary level, according to a recent study by the Consortium for Chicago School Research.
See From High School to the Future: The Pathway to 20. 7 Aggregate ISAT data by racial/ethnic groups and county is not readily available. However, examining the achievement patters
of various school districts clearly shows the gaps existing among racial/ethnic groups. Differences among racial/ethnic groups
are also noted in grade level Illinois data. See Appendix for grade level examples in mathematics. 8 See Appendix VI for North East Region High School Drop Out Number in 2006-07. 9 McKinsey and Company, “The Economic Impact of the Achievement Gap in America’s Schools”. April 2009. 10 Material in this section is drawn from multiple sources, including CMAP Population Projections summary (2008) based on
U.S. Census data; Latinos in Our Region: CMAP Regional Snapshot (2009), Chicago Metropolitan Agency for Planning; The
City in 2050: Creating Blueprints for Change (2008), D.C.: Urban Land Institute; Global Trends 2025: A transformed world
(2008), National Intelligence Council, U.S. Government Printing Office; Technology Counts 2009: Education Week, 28:6
(March 26, 2009); The Price We Pay: Economic and Social Consequences of Inadequate Education (2007), Belfield, C.R. and
Levin, H.M., eds., Washington, D.C.: Brookings Institution Press. 11 David H. Autor, Frank Levy, Richard J. Murnane, “The Skill Content of Recent Technological Change: An Empirical
Exploration,” Federal Reserve Bank of San Francisco, Nov. 2003. The authors found that computerization between 1970 and
1998 decreased the demand for rote manual and cognitive labor and increased demand for workers with college degrees. 12 Scholars are Fred M. Newmann, Anthony S. Bryk and Jenny K. Nagaoka, Authentic intellectual work and standardized tests:
Conflict or coexistence? (Chicago, IL: Consortium on Chicago School Research, 2001),
22-26. Also Michael S. Knapp and associates, Teaching for meaning in high-poverty classrooms, (New York, NY: Teachers
College Press, 1995). Popular media documenting real-life academic successes for low-income students include the movie Stand
and Deliver and the book, Marva Collins’s Way) 13 National Commission on Teaching & America's Future, What Matters Most: Teaching for America's Future. (New York, NY:
NCTAF, 1996); Michael S. Knapp and associates, Teaching for meaning. 14 Ana Maria Villegas and Tamara F. Lucas, “Diversifying the Teacher Workforce: A Retrospective and Prospective Analysis, in
Teacher workforce development: The one hundred and third yearbook of the National Society for the Study of Education, Part I,
eds. Mark A. Smylie and Debra Miretzky, (Chicago, IL: NSSE, 2004), 70-104. 15 Paul C. Light, Sustaining Innovation (San Francisco: Jossey-Bass, 1998). 16 Ronald Edmonds, “Some Schools Work and More Can” Social Policy, 9 (1979): 28-32; Sebring et al., Essential Supports. 17 King, “School- and District-Level Leadership for Teacher Workforce Development”; Smylie and Hart, “School Leadership for
Teacher Learning.” 18 Fred M. Newmann, Betsann Smith, Elaine Allensworth, and Anthony S. Bryk, “Instructional Program coherence: What it is
and Why it should Guide School Improvement Policy,” Educational Evaluation and Policy Analysis, 23 (2001): 297-321.
Penelope B. Sebring, Elaine Allensworth, Anthony S. Bryk, John Q. Easton, and Stuart Luppescu, The Essential Supports for
School Improvement (Chicago, IL: Consortium on Chicago School Research, 2006); Mark A. Smylie, "Teacher learning in the
workplace: implications for school reform", in Professional Development in Education: New Paradigms and Practices eds.
Thomas R. Guskey and Michael Huberman (New York: NY: Teachers College Press, 1995), 92-113; Mark A. Smylie, and Ann
W. Hart, “School Leadership for Teacher Learning and Change: A Human and Social Capital Development Perspective” in
81
Handbook of Research on Educational Administration (2nd edition) eds. Joseph Murphy and Karen S. Louis (San Francisco, CA:
Jossey-Bass, 1999), 421-441. 19 Leithwood and Riehl, “What do we already know” Sebring et al., Essential Supports. 20
The material in this six-point argument is adapted by permission from Superfine, Smylie, Tozer, and Mayrowetz,
(2009) Promising Strategies for Improving K-12 Education in Illinois: Improving the Educator Work Force. 21 To Touch the Future: Transforming the Way Teachers Are Taught: An Action Agenda for College and University Presidents,
American Council on Education, Washington, D.C., 1999. 22 See Appendix II for a history of early childhood programs in Illinois and a summary current programs. 23 See Appendix III for Percent of 3 and 4 Year-Old Children Enrolled in Preschool by Family Income as Percent of State
Median Income. (From Metro Chicago Information Center, using Census 2000 SFI files and 5% PUMS file.)
24 The Schott 50 State Report (2008). 25 For the text of the law, see text of HB 1648 at http://www.ilga.gov/legislation/. 26 Illinois Early Childhood Asset Map. 27 See Appendix III for Percent of 3 and 4 Year-Old Children Enrolled in Preschool by Family Income as Percent of State Median
Income. 28 Illinois Action for Children, “Access to Preschool in Illinois,” 2008. 29 See Appendix III for Linguistically Isolated Households by County in 2005. 30 Illinois Action for Children, “Access to Preschool in Illinois,” 2008. 31 See Appendix III for Estimated Slots in Home Visiting Programs. 32 “The Illinois Early Childhood Asset Map (IECAM) provides a comprehensive picture of early care and education services in
Illinois by combining up-to-date demographic information with early childhood program information from state agencies, Head
Start, and private sector child care”. For more information visit http://iecam.crc.uiuc.edu/ 33 Education Trust. Funding Gaps 2006. http://www.edtrust.org/dc/publication/the-funding-gap-0 34
National Center for Public Policy and Higher Education (2008). Measuring up: The national report card on
higher education: Illinois. Retrieved February 25, 2009 from
http://measuringup2008.highereducation.org/print/state_reports/long/IL.pdf 35
U.S. Department of Education, NCES, The Condition of Education 2008. Indicator 24. 36 Note: SES is a weighted variable developed by NCES, which includes parental education levels and occupations and family
income. “High” and “low” refer to the highest and lowest quartiles of SES. 37
For the recommended list of the indicators proposed by the lead agencies see Appendix VII. 38
The Illinois State Board of Education, with other states, is planning the development of a new assessment to be
used beginning in 2013.