Embed Size (px)
Citation preview
EFFECT OF STORE ATMOSPHERE DIMENSION ON CONSUMER
REPURCHASE INTENTION
(CASE STUDY IN CHANDRA SUPER STORE TANJUNG KARANG)
(Undergraduate Thesis)
By
NERISSA ARVIANA
FACULTY OF ECONOMICS AND BUSINESS
UNIVERSITY OF LAMPUNG
BANDAR LAMPUNG
2016
ABSTRACT
EFFECT OF STORE ATMOSPHERE DIMENSIONS ON
CONSUMER REPURCHASE INTENTION
(CASE STUDY IN CHANDRA SUPER STORE TANJUNG KARANG)
By
NERISSA ARVIANA
Store Atmosphere became one of the important factors for consumers whenshopping for convenience as well be one of the considerations of consumers whenchoosing a store that will be choose. To create a comfortable atmosphere of thestore it will needed some dimensions, such as dimensions cleanliness, music,scent, temperature, lighting, color and display or layout. Chandra Super Store isone of famous retail shop in Bandar Lampung that growing over time.
Problems in this research is whether the dimensions of cleanliness, music, scent,temperature, lighting, color and display or layout has an influence on the consumerrepurchase intention. The purpose of this study was to determine the effect of thedimensions of store atmosphere has an influence on consumer repurchase intention.
The object of this research is Chandra Super Store Tanjung Karang. The researchdesign is used descriptive verification. This research used multiple linearregression analysis. To view the contribution of each independent variablepartially used t test and for hypotesis testing use F test.
The results of this research shows that the contribution of variable dimensions of storeatmosphere(X) have a role in influencing variable Y (consumer repurchase intention) was53% and the rest is influenced by other variables. And t test results found that the variabledimensions of the store atmosphere (X), namely cleanliness, music, scent, temperature,lighting, color and display or layout affect consumer repurchase intention (Y).
The advice given by this research Chandra Super Store Tanjung Karang shouldimprove variable dimension of scent. Chandra Super Store Tanjung Karangshould put an automatic parfume periodically with a scent that could make theconsumers relax when shopping, at some point in the store so that the scent inChandra Super Store is fragrant and scented and can make consumer repurchaseintention increasing in Chandra Super Store.
Keywords: Store atmosphere, cleanliness, music, scent, temperature, lighting,color and display or layout, consumer repurchase intention.
EFFECT OF STORE ATMOSPHERE DIMENSION ON CONSUMER
REPURCHASE INTENTION
(CASE STUDY IN CHANDRA SUPER STORE TANJUNG KARANG)
Researcher
NERISSA ARVIANA
Undergraduate Thesis
As One of Requirements to Achieve
BACHELOR OF ECONOMICS
In
Management Department
Faculty of Economics and Business University of Lampung
FACULTY OF ECONOMICS AND BUSINESS
UNIVERSITY OF LAMPUNG
BANDARLAMPUNG
2016
BIOGRAPHY
Researcher was born on October 9th, 1994 in Jakarta, Indonesia. The first child of
two children from Usman Alfian and Yuda Sukmarina.
Researcher started formal education in 1998 at TK Islamic Village, Tangerang. In
2000, researcher continued study to Islamic Village elementary school,
Tangerang. In the middle of 2006, researcher continued to junior high school at
SMP N 89 Jakarta. In 2009, researcher get accepted in SMA N 65 Jakarta.
In 2012, researcher get accepted in Management program, Faculty of Economics
and Business University of Lampung by SNMPTN undangan, and researcher took
concentration in Marketing Management bilingual class.
MOTTO
“If you doing well, it's actually for yourself” ...
(QS. Al-Isra’: 7)
DEDICATION
Alhamdulillah all praise to Allah SWT for the strength and his blessing in
completing this undergraduate thesis. I dedicate this undergraduate thesis to:
My Mother and My Father, Usman Alfian and Yuda Sukmarina
Mom Dad thank you for all the sacrifices that you've given to me, thank you forpatienly taking care of me until I have grown until today, thank you for being
perfect parents for me, mom and dad thank you for always motivating, cheer meup and always pray for me.
O Allah, give me a chance to prove to them that all the sacrifices they have givenso far is not vain to make me a successful person in the future, and it can make
them happy and proud of me.
For My Brother, Nizariansyah
Thank you bro for all the prayers, support, and encouragement that has been givenso far to me and always be there for me. Hopefully we can make mom and dad
proud of us later.
For My friends, thank you for all the help, prayers, motivation, advice that youhave given me. All memories will be a wonderful story forever. May our
friendship forever.
ACKNOWLEDGEMENT
Alhamdulillahirobbilalamin, Praise to ALLAH SWT who has been giving out
mercy, guidance, and His good pleasure. This undergraduate thesis is still far
from perfection, for it I apologize for any shortcomings.
This undergraduate Thesis entitled "Effect of Store Atmosphere on Repurchase
Intention (Case Study in Chandra Super Store Tanjung Karang)”. This
undergraduate thesis is one of the requirements to complete the study on the
management bachelor program at the Faculty of Economics and Business,
University of Lampung.
In writing this undergraduate thesis, the author realized a lot of difficulties.
Thanks for help, guidance, encouragement, and suggestions from various parties.
In this chance, I would like deeply thanks to:
1. Allah SWT, for providing guidance mercy and His blessings and allow the
researcher completed this undergraduate thesis.
2. Family, Sidi Yusuf, Siti Ida, Embay Husna, my mom Yuda Sukmarina ,
my dad Usman Alfian and my brother Nizariansyah, thank you for all the
prayers and support of you all this time so I can finished this
undergraduate thesis.
3. Mr. Prof. Dr. H. Satria Bangsawan, S.E., M.Si. as the Dean of Faculty of
Economics and Business, University of Lampung.
i
ii
4. Mrs. Dr. Rr. Erlina, S.E., M.Si. as Head Program of Management
Department Faculty of Economics and Business University of Lampung.
5. Mrs. Yuningsih, S.E., M.M. as Secretary Program of Management
Department Faculty of Economics and Business University of Lampung.
6. Mrs. Aida Sari, S.E., M.Si. as my Advisor Lecture who always giving
advice, guide me patiently and also supprort me during the process of my
undergraduate thesis, so that I can finished it.
7. Mrs. Faila Shofa, S.E., M.S.M. as My Co-Advisor who already give his
time to discuss about my undergraduate thesis, giving advice, guide me
patiently, and also supprort me during the process of my undergraduate
thesis, so that i can finished it.
8. Mr. Aripin Ahmad, S.E., M.Si. as my Examiner who always availability
gives time, knowledge, guidance, suggestions and criticism for this
research to make this undergraduate thesis better.
9. Mr. Driya Wiryawan, S.E., M.M. as my education advisor who always
give an advise for my study plan.
10. All the lecturer at the Faculty of Economics and Business, University of
Lampung, thank you for giving knowledge and guidance in my time in the
Faculty of Economics and Business, University of Lampung.
11. All the staff in Faculty of Economics and Business, University of
Lampung.
12. Muhammad Zaini S.TP., thank you for the time, support, help, motivation
has been given so far, thanks for advices that you already given, thank you
for patiently listening me complaints about this undergraduate thesis and
iii
thanks always be there for me. Hopefully we can be successful in the
future.
13. Wanita Muslimah, Laras, Winy, Dinda, Hesta, Pipit and Firstiana, thank
you for patiently listening to my complaints, thank you a lot of
encouragement and motivation for this.
14. My Bilinguall Class batch 2012, Marlia, Ayu, Reza, Fadil, Kemas, Ikke,
Lele, saput, Dona, Citra, Brenda, Kautsar, Dirga, Abe, Elisa and Lia
Hermanto, thank you for all the thoughts, laughter and support that given
to me, I will never forget with all the experience of joy and sorrow that we
have ever experienced in this last 3 years
15. Mia, Sella, Astri, Sindy, Adriana, Elsa, Fanny, Zelta thank you for always
supporting me and gave me the passion in doing this thesis. Thank you for
already expelled my loneliness during this time, thank you always take the
time to become my travelling friends, thank you also for all the support
over the years.
16. Management Batch 2012, Rama, Nanda, Warits, Sony, Ardi, Mita, Anyi,
Yafie, Judith, Any, Diba, Fida, Heylin, Rian, Ilal, Gio, Malik, Finko, Novi,
Selvi, Puput, Delon, Nature, Lutfi and others who can not mention one by
one. Thank you friends.
17. My KKN team in Indraloka 1 Tulang Bawang Barat, Andriyana, Citra,
Mutiara, Shandy, Linda and Mahipal, thank you for support and
encouragement in working on this undergraduate thesis.
iv
18. My Presidium EEC 2014/2015 period, Iin, Yunita, Kiky, Elia, Hanum,
Pandu, Ageng, Sony, Kahfi, Nizar, Asri, thank you for the experience that
made me learn a lot of things.
19. Who helped me in completing this undergraduate thesis that can not be
listed one by one, Thank you everyone.
Finally, this undergraduate thesis is still far from perfection. Little hope that this
paper can be useful for all of us. Amin.
Bandar Lampung, April 21th 2016
Researcher
v
CONTENT LIST
PagesABSTRACTACKNOWLEDGEMENT ................................................................................ iCONTENT LIST............................................................................................... vTABLE LIST .................................................................................................... viiiFIGURE LIST .................................................................................................. ixATTACHMENT LIST ..................................................................................... x
CHAPTER I INTRODUCTION
1.1 Background ................................................................................. 11.2 Problem Formulation................................................................... 91.3 Objectives Research .................................................................. 101.4 Benefit Research.......................................................................... 11
CHAPTER II LITERATURE REVIEW, FRAMEWORK, HYPOTESIS
2.1 Definition of Marketing .............................................................. 132.2 Retail ........................................................................................... 14
2.2.1 Definition of Retail ........................................................... 142.2.2 Function of Retail ........................................................... 142.2.3 Various Type of Retail ....................................................... 15
2.3 Service ........................................................................................ 192.3.1 Definition of Service ......................................................... 192.3.2 Flower of Service .............................................................. 192.3.3 Characteristics of Service................................................... 21
2.4 Store Atmosphere ........................................................................ 222.4.1 Definition of Store Atmosphere ........................................ 242.4.2 Element of Store Atmosphere ........................................... 24
2.5 Consumer Behavior .................................................................... 352.6 Repurchase Intention .................................................................. 382.7 Previous Research ....................................................................... 402.8 Framework .................................................................................. 412.9 Hypotesis ..................................................................................... 45
CHAPTER III RESEARCH METHOD
3.1 Research Design .......................................................................... 463.2 Operational variabels .................................................................. 46
v
vi
3.3 Population and Sample ................................................................ 493.3.1 Population ........................................................................ 493.3.2 Sample .............................................................................. 49
3.4 Data Collection Techniques......................................................... 503.5 Type of Research dan Data Souces. ........................................... 513.6 Methods of Data Analysis ........................................................... 523.7 Analysis Tools ............................................................................ 543.8 Normality Test ............................................................................ 553.9 Statistical Hypotesis Testing ...................................................... 55
3.9.1 Overall Hypotesis Testing ( F Test) .................................. 553.9.2 Partial Hipotesis Testing (t Test ) ...................................... 563.9.3 The coefficient of determination R2 .................................. 56
CHAPTER IV. RESULT AND DISCUSSION
4.1 Characetristics of Respondents Description .............................. 574.1.1 Characetristics of Respondents Based on Visits Over 1
Last Month in 2016 ............................................................ 574.1.2 Characetristics of Respondents Based on Gender............. 584.1.3 Characetristics of Respondents Based on Age.................. 594.1.4 Characetristics of Respondents Based on The Last
Education Background ....................................................... 594.1.5 Characetristics of Respondents Based on Job................... 604.1.6 Characetristics of Respondents Based on Monthly
Expenditure ....................................................................... 614.2 Validity and Reliability Test ....................................................... 62
4.2.1 Validity Test....................................................................... 624.2.2 Reliability Test .................................................................. 63
4.3 Qualitatitve Data Analysis .......................................................... 644.3.1 Results of Respondents Answer on Dimension
Cleanliness (X1) ............................................................... 654.3.2 Results of Respondents Answer on Dimension
Music (X2) ......................................................................... 674.3.3 Results of Respondents Answer on Dimension Scent
(X3) .................................................................................... 704.3.4 Results of Respondents Answer on Dimension
Temperature(X4)................................................................ 714.3.5 Results of Respondents Answer on Dimension
Lighting (X5) ..................................................................... 734.3.6 Results of Respondents Answer on Dimension
Color (X6) .......................................................................... 764.3.7 Results of Respondents Answer on Dimension
Display or Layout (X7) ..................................................... 774.3.8 Results of RespondentsAnswer on Dimension Repurchase
Intention(Y)........................................................................ 804.4 Quantitative Data Analysis ......................................................... 81
4.4.1 Regression Analysis .......................................................... 814.5 Normality Testing ....................................................................... 85
vii
4.6 Hypotesis Testing........................................................................ 864.6.1 Hypotesis Testing in Overall( F Test)................................ 864.6.2 HypotesisTesting in Partial (t Test) ................................... 874.6.3Deetermination Coefficient Test (R2 Test) .......................... 88
CHAPTER V. CONCLUSIONS AND RECOMMENDATION5.1 Conclusions ................................................................................. 895.2 Suggestions ................................................................................. 905.3 Limitation of Research............................................................... 91
REFERENCESATTACHMENT
viii
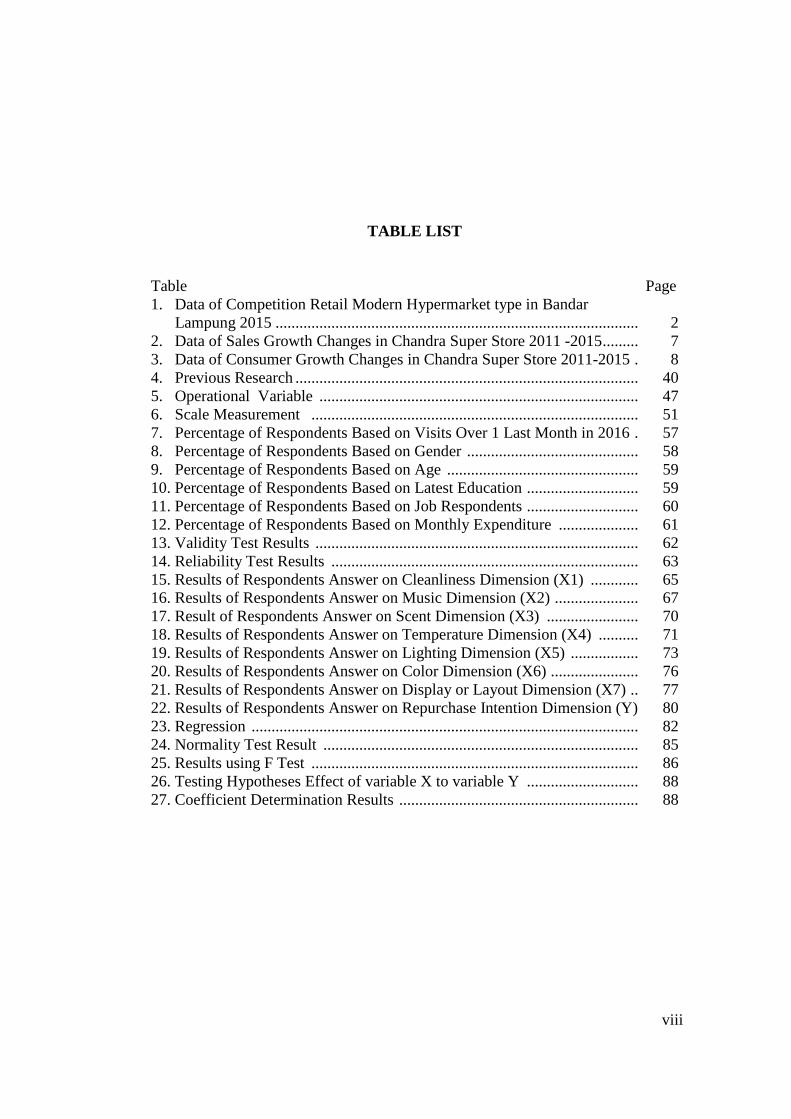
TABLE LIST
Table Page1. Data of Competition Retail Modern Hypermarket type in Bandar
Lampung 2015 ........................................................................................... 22. Data of Sales Growth Changes in Chandra Super Store 2011 -2015......... 73. Data of Consumer Growth Changes in Chandra Super Store 2011-2015 . 84. Previous Research ...................................................................................... 405. Operational Variable ................................................................................ 476. Scale Measurement .................................................................................. 517. Percentage of Respondents Based on Visits Over 1 Last Month in 2016 . 578. Percentage of Respondents Based on Gender ........................................... 589. Percentage of Respondents Based on Age ................................................ 5910. Percentage of Respondents Based on Latest Education ............................ 5911. Percentage of Respondents Based on Job Respondents ............................ 6012. Percentage of Respondents Based on Monthly Expenditure .................... 6113. Validity Test Results ................................................................................. 6214. Reliability Test Results ............................................................................. 6315. Results of Respondents Answer on Cleanliness Dimension (X1) ............ 6516. Results of Respondents Answer on Music Dimension (X2) ..................... 6717. Result of Respondents Answer on Scent Dimension (X3) ....................... 7018. Results of Respondents Answer on Temperature Dimension (X4) .......... 7119. Results of Respondents Answer on Lighting Dimension (X5) ................. 7320. Results of Respondents Answer on Color Dimension (X6) ...................... 7621. Results of Respondents Answer on Display or Layout Dimension (X7) .. 7722. Results of Respondents Answer on Repurchase Intention Dimension (Y) 8023. Regression ................................................................................................. 8224. Normality Test Result ............................................................................... 8525. Results using F Test .................................................................................. 8626. Testing Hypotheses Effect of variable X to variable Y ............................ 8827. Coefficient Determination Results ............................................................ 88
viii
ix
FIGURE LIST
Figure Page1. Data of Sales Growth Changes in Chandra Super Store 2011 -2015.......... 82. Data of Consumer Growth Changes in Chandra Super Store 2011-2015 .. 83. The Flower of Services ............................................................................... 84. Model Framework ....................................................................................... 44
x
ATTACHMENT LIST
Attachment 1 QuetionnaireAttachment 2 30 Respondents AnswerAttachment 3 Validity Test ResultAttachment 4 Reliability Test ResultAttachment 5 160 Respondents AnswerAttachment 6 Respondents Characteristics ResultAttachment 7 Frequency of Respondents AnswerAttachment 8 Regression Testing ResultAttachment 9 Normality Test Result
ixx
1
I. INTRODUCTION
1.1 Background
In the era of globalization and today’s world trading activity, there is competition
going on in marketing of products or services. Marketing activity has a very
important role in the business world, remember orientation to the consumers. The
state of the business world dynamic changes in line with changes in consumer
tastes and changes in the environment and surroundings. Needs of consumers are
becoming increasingly then it make a business opportunities.
Business opportunities that are obtained today are not only oriented towards
profit. Active marketing oriented to customer used more by business people,
although this requires the business people to define the needs and desires of the
consumers point of view. Bandar Lampung is one of the fast growing cities in
Indonesia (Lampost.co, 10/1/2016 / 3.00). As the city continues to grow, the rate
of economic growth and technological change as well as current information even
more quickly, the market is increasing dynamically, requiring business people to
constantly improvise and innovate in maintaining the customers. This has become
one of the driving factors of the creation of intense competition in the
business world.
2
Intense competition among retailers with accompanying changes in consumer
behavior needs to be observed and understood by the retail business people. The
higher and competitive competition among retail business people takes planning
strategies to seize and keep their market share including the consumer repurchase
intention. According to Utami (2006: 4) Retail is also a device of business
activities that do adding value to the products and services of sales to consumer
for use or consumption of individuals and families, and definition for hypermarket
itself is combine some store type. This store sales more routine product that
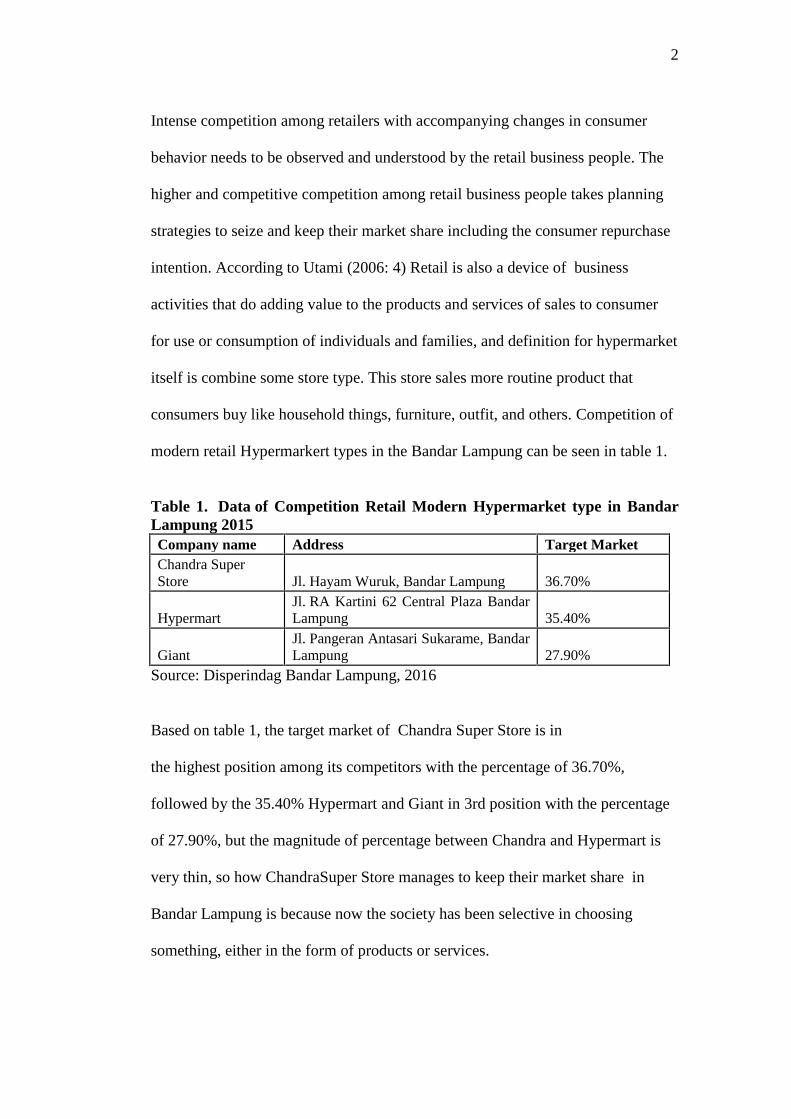
consumers buy like household things, furniture, outfit, and others. Competition of
modern retail Hypermarkert types in the Bandar Lampung can be seen in table 1.
Table 1. Data of Competition Retail Modern Hypermarket type in BandarLampung 2015Company name Address Target MarketChandra SuperStore Jl. Hayam Wuruk, Bandar Lampung 36.70%
HypermartJl. RA Kartini 62 Central Plaza BandarLampung 35.40%
GiantJl. Pangeran Antasari Sukarame, BandarLampung 27.90%
Source: Disperindag Bandar Lampung, 2016
Based on table 1, the target market of Chandra Super Store is in
the highest position among its competitors with the percentage of 36.70%,
followed by the 35.40% Hypermart and Giant in 3rd position with the percentage
of 27.90%, but the magnitude of percentage between Chandra and Hypermart is
very thin, so how ChandraSuper Store manages to keep their market share in
Bandar Lampung is because now the society has been selective in choosing
something, either in the form of products or services.
3
The important thing in choosing the store that will be visited, consumers will
choose the store which have completeness of the goods in the store, attractive
price, the layout of the store, cleanliness and other factors that allow consumers to
choose the store and visit the store regularly to meet their needs.
One of the ways to win the competition and maintain market share is to create
something different. Distinction is needed because any other businessesmust have
found similar product with little price. Continued innovation that can be taken as a
characteristic that makes it different from other business people is with
storeatmosphere aspect. Store atmosphere can be a reason for consumers to be
interested and choosethe store that they will visit and buy from. It's described by
Levy and Weitz (2001: 556) "Customer purchasing behavior isalso influenced by
the store atmosphere” This thing makes the consumer choose a store and make a
purchase. Attract consumers is one of the initial goals and then certainly aims to
stimulate consumer desire to buy (Putri at. al, 2014: 2).
Store atmosphere offered by producers, if it has positive respect by the consumer,
will get a big chance for the places to be visited. According to Levy and Weitz
(2001: 530) atmosphere refers to the design of the environment through visual
communication, lighting, color, music, and scents that stimulate customer
perceptually and emotionally, and ultimately affecttheirbuyingbehavior.Appraisal
orconsumer response to interesting store atmospherewill affect consumer
purchases.
4
Store atmosphere not only influencespurchasing decisions, but also influences
customer satisfaction. Store atmosphere is also a combination of emotional
things(Putri at. al, 2014: 2). According to Mowen and Minor (2002: 139) store
atmosphere influences shopper emotional condition, which can be pushed to
increaseor reduce spending in shopping. The impact of the storeatmospherecould
create the impression that will increase buyers’ purchase or just buy enoughand
leading to possibility notreturning again to purchase at the store. Based on that
reason, retail business is not only about price but involves other variables related
to the value on the customer shopping experience. Scope of store
atmospherebased on journal of Hussain and Mazhar (2015 : 36 ) is cleanliness,
music, scent, temperature, lighting, color, display or layout.
a. Cleanliness
According to Banat and Wandebori, cleanliness is the appearance of the retail
chain outlet that improves the atmosphere which affects the customers feeling
towards the outlet. Customers create positive or negative word of mouth about
retail chain outlet bylooking at the cleanliness, (Hussain and Ali, 2015: 36),
Gajanayake and Surangi states that cleanliness can improve store atmosphere
(Hussain and Ali, 2015: 36).
b. Music
According to Banat and Wandebori, music can be defined as a pleasant sound
that impacts consumers’ conscious and unconscious decisions (Hussainand
Ali, 2015: 36). ). Music played in retail outlet significantly impacts consumer
purchase intention. Musicstyles and tempos deeply influence consumers in
5
increasing sales of the retail outlets. According to Holbrook and Anan, Pleasant
music isassociated with longer consumption time (Hussain and Ali, 2015: 36).
c. Scent
According to Banat and Wandebori, presence or absence of scent in the retail
chain outlets has noticeable impact on the consumer purchase intention. Scent
is a pleasant fragrance that influences customer mood and emotions which
make the customers stay moretime and feel excited (Hussain and Ali,2015:36).
d. Temperature
Lam stated that temperature at retail outlet is among those atmospheric
variables that greatly impact the consumer purchase intention. Extreme
temperature—very low or very high—creates negative feelings among
customers; it leads to dissatisfaction among the customers and consequently,
customers spend less time in outlet and produce negative word of mouth
(Hussain and Ali, 2015: 36).
e. Lighting
According to Mehrabian and Albert lighting is used to highlight products. It
creates excitement and has a positive impact on consumer purchasing behavior
( Hussain and Ali, 2015: 36).
f. Color
Banat and Wandebori stated that color builds feelings and affects consumer
behavior and attitude (Hussain and Ali, 2015: 37). According to Yuksel, Color
6
has greatimpact on the consumer’s perception about the
merchandise(Hussainand Ali, 2015: 37).
g. Display or Layout ( Display or Layout )
According to Abratt, Russell, Goodey, and Stephen, products in the retail
chain outlets should be displayed in such a way that attracts the consumers.
Product display in the retail outlets is a stimulus to attract the consumers to
make impulsive buying. (Hussain and Ali, 2015: 37).
Likewise with one retail shop in Bandar Lampung, that is Chandra Super Store,
which is one of the shopping centers in Bandar Lampung. Chandra Super Store
also has seven dimensions that have been alreadymentioned.Chandra Super
Store has a large pand spacious place, cleanlinessmaintained by ISS, and various
indoors colors.For example, on Christmas, Chandra Super Store will make their
color in the store dominated by red, nice bright lighting intheir stores.
ChandraSuper Store is also facilitated with music. Music that are usually played
are Lampung songs and national pop songs. The visitors can’t feel the scent if
they enter Chandra Super Store, also the layout of the inter-rack is also large
enoughsovisitors do not feel cramped in selecting a product. It also has cool
atmosphere, cold rooms that coming fromcentral air conditioner set at 16º C that
can make consumers feel comfortable.
Chandra Super Store divide sales display based on the categories of products. The
first floor consists of consumer products, such as food, beverages, daily
appliances, and others. Second floor is for clothes, bags, makeup, and others. The
location and place of business is one factor that is decisive in the success of
7
product sales that are for sale. Chandra Super Store i located in strategic location
in Bandar Lampung, consisting of more shopping centers and hundreds of
supporting businesses in the form of shop or market, where people's needs can be
met from this complex, and Chandra Super Store store becomes one of the
society’s first choice for their daily needs . In Tanjung Karang, Bandar Lampung,
Chandra Super Store is one of the biggest retail store.
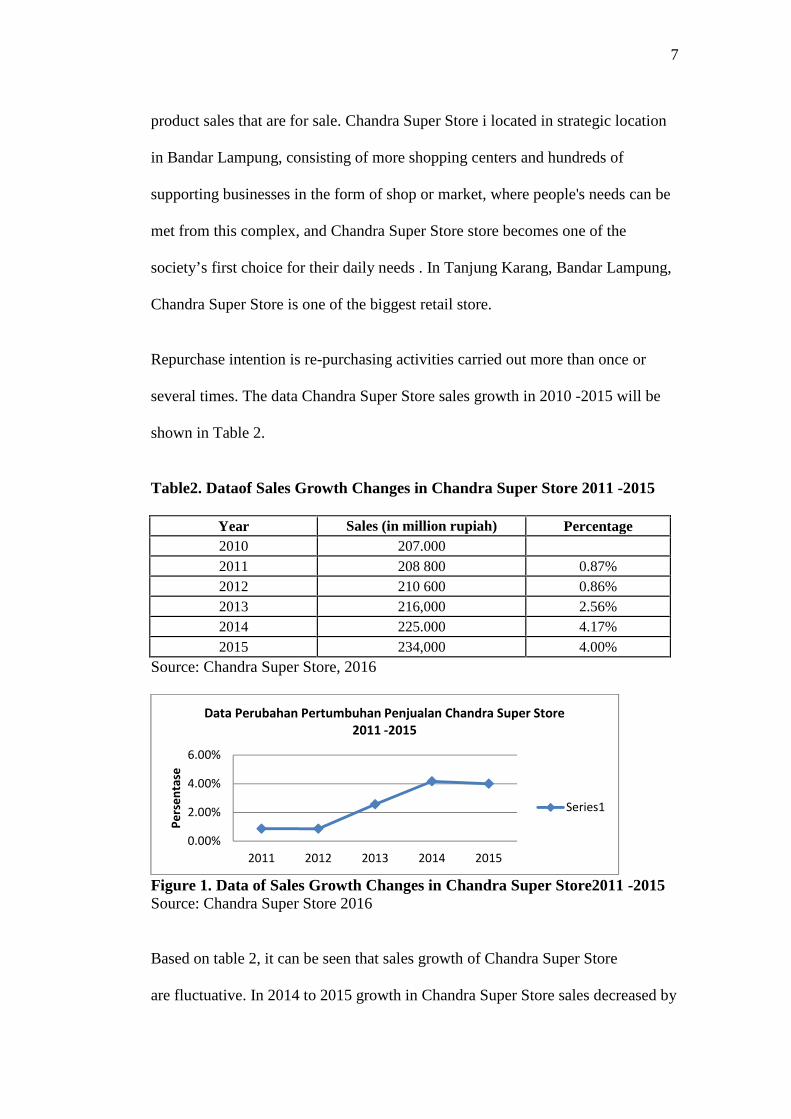
Repurchase intention is re-purchasing activities carried out more than once or
several times. The data Chandra Super Store sales growth in 2010 -2015 will be
shown in Table 2.
Table2. Dataof Sales Growth Changes in Chandra Super Store 2011 -2015
Year Sales (in million rupiah) Percentage2010 207.0002011 208 800 0.87%2012 210 600 0.86%2013 216,000 2.56%2014 225.000 4.17%2015 234,000 4.00%
Source: Chandra Super Store, 2016
Figure 1. Data of Sales Growth Changes in Chandra Super Store2011 -2015Source: Chandra Super Store 2016
Based on table 2, it can be seen that sales growth of Chandra Super Store
are fluctuative. In 2014 to 2015 growth in Chandra Super Store sales decreased by
0.00%
2.00%
4.00%
6.00%
2011 2012 2013 2014 2015
Pers
enta
se
Data Perubahan Pertumbuhan Penjualan Chandra Super Store2011 -2015
Series1
8
1.7% whereas the year 2013 to 2014 shows quite dramatic increase from 2.56% to
4.17%.
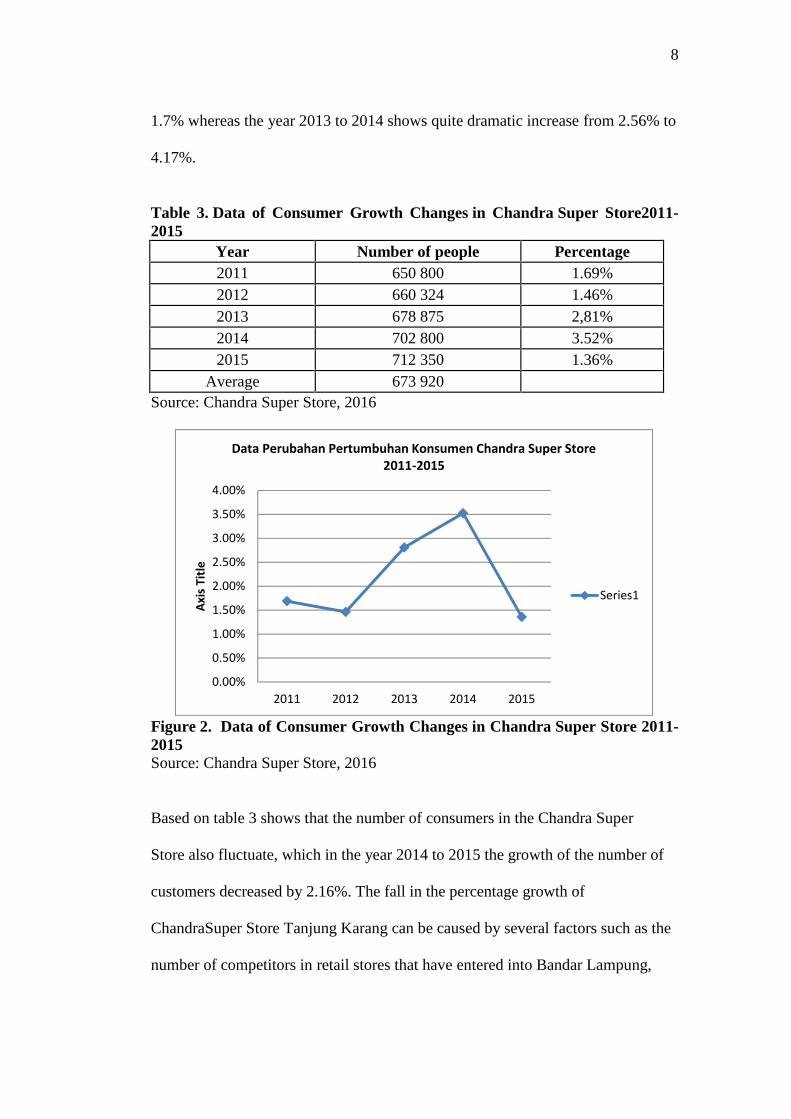
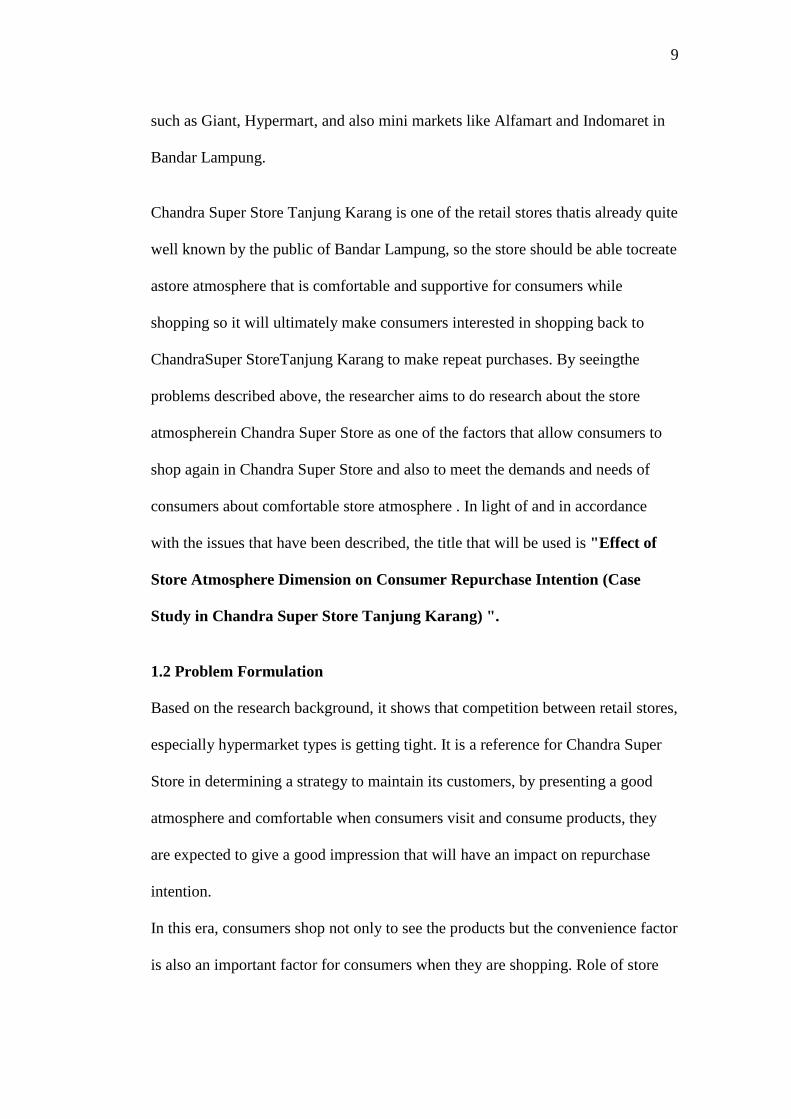
Table 3. Data of Consumer Growth Changes in Chandra Super Store2011-2015
Year Number of people Percentage2011 650 800 1.69%2012 660 324 1.46%2013 678 875 2,81%2014 702 800 3.52%2015 712 350 1.36%
Average 673 920Source: Chandra Super Store, 2016
Figure 2. Data of Consumer Growth Changes in Chandra Super Store 2011-2015Source: Chandra Super Store, 2016
Based on table 3 shows that the number of consumers in the Chandra Super
Store also fluctuate, which in the year 2014 to 2015 the growth of the number of
customers decreased by 2.16%. The fall in the percentage growth of
ChandraSuper Store Tanjung Karang can be caused by several factors such as the
number of competitors in retail stores that have entered into Bandar Lampung,
0.00%
0.50%
1.00%
1.50%
2.00%
2.50%
3.00%
3.50%
4.00%
2011 2012 2013 2014 2015
Axis
Title
Data Perubahan Pertumbuhan Konsumen Chandra Super Store2011-2015
Series1
9
such as Giant, Hypermart, and also mini markets like Alfamart and Indomaret in
Bandar Lampung.
Chandra Super Store Tanjung Karang is one of the retail stores thatis already quite
well known by the public of Bandar Lampung, so the store should be able tocreate
astore atmosphere that is comfortable and supportive for consumers while
shopping so it will ultimately make consumers interested in shopping back to
ChandraSuper StoreTanjung Karang to make repeat purchases. By seeingthe
problems described above, the researcher aims to do research about the store
atmospherein Chandra Super Store as one of the factors that allow consumers to
shop again in Chandra Super Store and also to meet the demands and needs of
consumers about comfortable store atmosphere . In light of and in accordance
with the issues that have been described, the title that will be used is "Effect of
Store Atmosphere Dimension on Consumer Repurchase Intention (Case
Study in Chandra Super Store Tanjung Karang) ".
1.2 Problem Formulation
Based on the research background, it shows that competition between retail stores,
especially hypermarket types is getting tight. It is a reference for Chandra Super
Store in determining a strategy to maintain its customers, by presenting a good
atmosphere and comfortable when consumers visit and consume products, they
are expected to give a good impression that will have an impact on repurchase
intention.
In this era, consumers shop not only to see the products but the convenience factor
is also an important factor for consumers when they are shopping. Role of store
10
atmosphere is to create convenience for consumers. Based on these descriptions,
the problems are defined in this study as follows:
1. Does the cleanliness affect consumer repurchase
intentioninChandraSuperStore?
2. Does the music affect consumer repurchase intention in Chandra Super Store?
3. Does the scent affect consumer repurchase intention in Chandra Super Store?
4. Does the temperature affect consumer repurchase
intention inChandra SuperStore?
5. Does the lighting affect consumer repurchase intention in ChandraSuperStore?
6. Does the color affect consumer repurchase intention in Chandra Super Store?
7. Does the display or layout affect consumer repurchase
intention in ChandraSuperStore?
1.3 Objectives Research
The purpose of this research are:
1. To determine the effect of cleanliness towards consumer repurchase
intentioninChandra Super Store.
2. To determine the effect of music towards consumer repurchase
intention inChandra Super Store.
3. To determine the effect of scent towards consumer repurchase
intention inChandra Super Store.
4. To determine the effect of temperature towards consumer repurchase
intentioninChandra Super Store.
11
5. To determine the effect of lighting towards consumer repurchase
intentioninChandra Super Store.
6. To determine the effect of color towards consumer repurchase
intentioninChandra Super Store.
7. To determine the effect of display or layout towards consumer repurchase
intention in Chandra Super Store.
1.4 Benefits Research
1. Practical benefits
a. For companies
This research is expected to help the company get an overview of
influence store atmosphere in consumer repurchase intention.
b. For Academic
Research result is expected to enrich knowledge and objects issues
studied in the marketing research.
c. For others
The results of the research can provide the initial information and
additional references for further researches that discuss the same topic.
2 Academic Benefit
As one of the information materials to increase knowledge in the marketing
management, especially about store atmosphere affect consumer repurchase
intention
12
3. Researcher Benefit
This research will add skills in analyzing a problem and at the same time to put
the theory that has been received in college.
13
II. LITERATURE REVIEW, FRAMEWORK, HYPOTHESIS
2.1 Definition of Marketing
Marketing is an overall concept on a range of marketing activities included in
one marketing system. Marketing is one of the main thing by employers in their
efforts to maintain survival, to grow and make a profit. To clarify understanding
of marketing, then this some opinions of experts in marketing. Marketing is the
process of society when individuals and groups obtain what they need and want
by creating, offering, and freely exchanging products and services of value with
others, (Kotler and Keller, 2009: 5).
Marketing is the activity that aimed to achieving corporate goals must be
achieved by anticipating customer or client needs and directing the flow of goods
and services that meet the needs of customers or from the
manufacturer, (Cannon, Perrcault and McCarthy, 2008: 8)
Furthermore, according to American Marketing Association in Kotler and Keller
(2009: 5), marketing is one of the organization function and set of processes for
creating, communicate, and give the value to the customer and for managing
customer relationships with get the profit for the organization and
their stakeholders. (Kotler and Keller, 200 9: 5). Based on the definition above it
14
can be concluded that marketing is an activities that the company do to achieve
their goal or make a profit.
2.2 Retail
2.2.1 Definition of Retail
Retailing includes all activities in selling goods or services directly to end users
for personal and non-business purposes. Retailers or retail store are all business
entities that their sales volume mainly came from sales of retail (Kotler, Keller,
2009: 140), while according to Berman and Evans (2004: 4) retailing
encompasses the business activities involved in selling goods and services to
consumers for their personal, family,or household use. It includes every sale to the
final consumer. Retailing is the last stage in the distribution process.
According to Gilbert (2003: 6), retail is "all business enterprises to direct
marketing capabilities to satisfy the end consumer based organizations selling
goods and services as the core of the distribution". According to Utami (2006: 4)
retail is also a device of business activities that do adding value to the products
and services of sales to consument for use or consumption of individuals and
families. Based on the definition above, it be concluded that retail is a businesses
that trade in goods directly to the final consumer and not traded back.
2.2.2 Function of Retail
Retail has several important functions that can improve the value of products and
services that sold to the consumer's easy to distribute the products for companies
that produce them. According to (Utami, 2006: 10) That function are as follows:
15
1. Providing various types of products and services
Consumers always have the option itself to various types of products and
services. For that, in its function as retailers, they try to provide a wide
range of products and services that consumers need.
2. Breaking bulk
Breaking bulk here means splitting several product sizes
become smaller, which eventually make a profit for producers and
consumers.
3. Storage inventories
The main function of retail is to maintain the supply that existing ones, so
that the product will always be available when consumers want it.
4. Service providers
Retail also can delivering the product to the place that close to the
consumer, provide services that enable consumers to purchase and use the
product, or offer credit so that consumers can have the product
immediately and pay later.
5. Improving value of products and services
With the types of goods or services, then for customer activities that may
need some stuff.
2.2.3 Various Type of Retail
Based on Utami, (2006: 10) various type of retail are two types:
a. Store Retailing
Retail stores are characterized by the presence of a place to showcase the
products permanently. Retail stores have a variety of shapes and sizes.
16
1. Specialty Store
Specialty stores is concentrate on a limited category of products with a
high service level. These types of stores more specifically in accordance
with the merchandise sold.
2. Department Store
Department store is a kind of retail that selling wide variety of products
and various types of products using staff like customers service and sales
promotion girl or boy. Purchases are usually performed on each part in the
shopping arena.
3. Conveniene Store
This shop has a variety and a limited product types with the size is
relatively small and is usually defined as a mini supermarket selling only
a limited line of products and turnover is quite high.
4. Super Store
Super store is a retail store with store size almost twice as large
as supermarket usual and sells a broad range of products consisting of
food and non-food products that are regularly bought by consumers.
5. Combination Stores
Stores that its activities selling food and medicine.
6. Hypermarket
This store is more spacious than the store combination. Hypermarkets
combine various forms of retail stores such as: supermarkets, discount
stores, and warehouse. This store sells more products are regularly
17
purchased by consumers such as household appliances, furniture, clothes,
and others.
7. Discount Stores
Types of retail selling most varieties of products with limited service and
low prices. Discount stores sell products with a label or brand itself.
8. Houses Exhibition Catalog
Type of store sells a wide range of high mark-ups with leading brands at
discounted prices. Catalog showrooms earn money by cutting costs margin
to provide a low price that will attract high-volume sales.
b. Non-Store Retailing
Non store retailing is retail store that the products are not displayed. There are
some types of non store retailing store: telemarketing, internet marketing,
direct selling, direct marketing, multi level marketing. In non store retailing,
sales promotion, direct marketing, and advertising are instrumental attract
potential buyers.
1. Electronic Retail
Format retail business uses communication with customers about products,
services, and sales via the internet in order to achieve broad
consumer coverage.
2. Catalog
Marketing through catalogs occurs when a company sends one or more
product catalog to the selected recipients. The company submit the
complete merchandise information that is a whole line of merchandise or
18
by selecting merchandise that will inform a limited basis in the form of
catalog to the special consumer.
3. Direct sales
An interactive marketing system that uses one or more advertising media
to generate responses or transactions that can be measured at a location of
the sale.
4. Television Home Shopping
Retail formats through television. Customers will see the TV
program aired merchandise product demonstrations and relaying messages
by telephone.
5. Vending Machine Retaiing
Is a non-store format that stores goods and services on a machine and
deliver goods to customers where customers insert cash or credit card into
the machine.
Chandra Super Store is a supermarket that already famous in Bandar Lampung,
because this shop providing daily products like food and household
supplies. Based on the explanation of kind of retail, it can be concluded that
Chandra Super Store entry into store retailing because there is a place for
showcase the products regularly and store is also included into the type of
hypermarket because this store sells products are routinely bought by consumers
such as household goods, furniture, clothing, etc.
19
2.3 Service
2.3 .1 Definition of Service
Service proposed by Kotler and Keller (2009: 36) are all actions or performance
that can be offered one side to the other side that is essentially intangible and does
not produce any ownership. The production can be or not can be relevant to the
physical product. Nevertheless, more manufacturers, distributors, and resellers
who provide value-added services, or do the excellent service to the customer, to
differentiate themselves.
The conclusion of the definition of services is an action that is not visible but can
be felt and be one of the factors that can determine consumers' assessment of a
business or enterprise.
2.3.2 Flower of Service
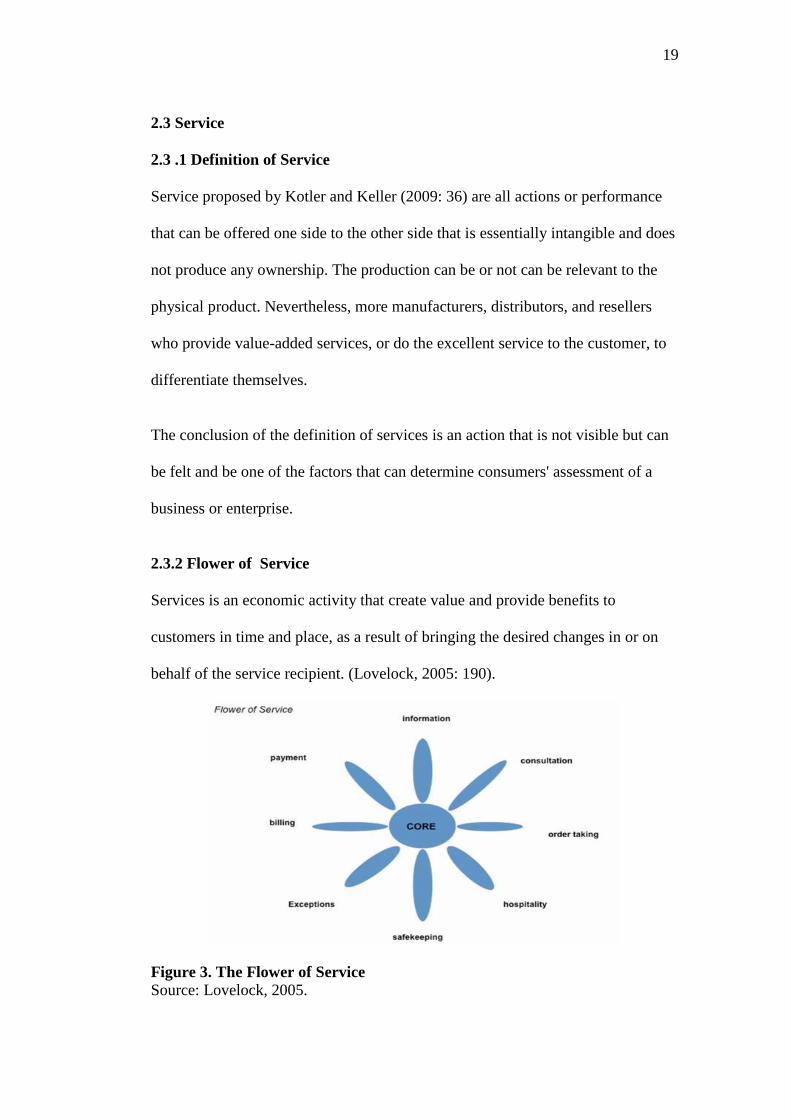
Services is an economic activity that create value and provide benefits to
customers in time and place, as a result of bringing the desired changes in or on
behalf of the service recipient. (Lovelock, 2005: 190).
Figure 3. The Flower of ServiceSource: Lovelock, 2005.
20
Additional services that facilitate
1. Information, information is crucial in service provider. Provide
information that is clear, complete, and accurate can be a force in a
service. For example, train and plane schedules, assistance to locate a
particular retail outlet, through to information about the services of
professional Integration. There are some information in each aisle about
product layout in Chandra Super Store.
2. Order taking, acceptance of orders includes the application, charging
order, and resevation or check-in. Reservations (including the making of
appointments and check in) represents the type of reception special orders
that require customers to get spesific service units .Example, aircraft
seats, tables in restaurant, hotel rooms, consultation to an expert or to
facilities such as a theater or a sports arena.
3. Billing, billing is a very common thing for all the services (except services
supplied free). Billing inaccurate, illegible or incomplete have own
disappointing risk for consumenr. Better billing is if it is clear and
informative billing and itemized so obvious calculation amount. Billing
can been seen when the consumer already in cahsier, in cashier it will
show clear detail about the product that the consumer already bought.
4. Payment, the bill requires the customer to make payment for services that
their used. Service provider is better knowing well of the customer that
they are already doing payment. For example is checks prior to entry into
cinema. Payment is in cashier in Chandra Super Store.
21
Additional services that strengthen
5. Consultation, engagement in dialogue to know the needs of its customers,
then develop solutions accordingly This service also provide in Chandra
Super Store in Customer Service.
6. Hospitality, service providers capable to give more services. For example,
provided the waiting room for customers, newspapers, magazines, tv
facilities granted to a repair shop or beauty clinic. Chandra Super Store
also have children playground facility for consumer who bring their
children.
7. Safekeeping, when customers visit the service, often, they need help to
bring their package. Service provider can provide storage for the goods.
There is deposi box for consumer who want to commend their stuff in
Chandra Super Store.
8. Exception, additional service providers are given out of the ordinary or
service delivery process. In Chandra Super Store also provide delivery
service especially for electronic or furniture.
2.3. 3 Characteristics of Services
The products have characteristics that are different from the goods (physical
product). Kotler and Keller (2009: 39) mentions that are Intangibility,
Inseparability, Variability, Perishability.
a. Intangibility
This means that services can not be seen, felt, heard, or kissed before being
bought by consumers. Therefore, the buyer or consumed should be able to see
22
the sign or evidence of the quality of services that produced. And this can be
obtained from the people, places equipment, communication tools, symbols,
and the prices that they seen.
b. Inseparibility
This means that services can not be separated from the provider, the provider
although humans or machine.
c. Variability
This means that the quality of service depends on who is providing time,
place, and how it is provided. For example, architectural services, installation
services, training services, financial services, maintenance services, and etc.
d. Perishability
This means that services can not be sold or stored for later use. That is the
relationship between the service provider withthe consumenti will stop if the
services performed have been completed.
2.4 Store Atmosphere
2.4.1 Definition of Store Atmosphere
According to Milliman's atmosphere is a term that is used to explain our feelings
towards the shopping experience which can not be seen (Hussain and
Ali, 2015: 35). Kotler describes the atmosphere as “the design of the of retail
chain outlet that produces specific emotional effects on the buyer that enhances
his purchasing probability” (Hussain and Ali, 2015: 35). According to Srinivasan
and Srivastava, the attractive and impressive atmosphere of retail chain outlets
creates an enjoyable experience among the consumers, which directly affects
23
consumers' purchase intention and their decision making process (Hussain and
Ali, 2015: 35).
Store atmosphere affects the emotional of buyers who causes or influence
purchase. The emotional state will create two dominant, there feelings are feelings
of pleasure and arouse desire. (Sutisna and Pawitra, 2001: 201) says store
atmosphere is affective and cognitive status were understood by consumer in the
store, although perhaps not fully recognized at the time of shopping. Broader
definition described by Peter and Olson (1999), which explains that thestore
atmosphere include things that are broad as well as the availability facility such
as air conditioner (AC), store layout, colour, the use of types of carpets, carpet
color, material goods storage shelves, racks and forms etc.
The concept store atmosphere is also closely related to store image. Sutisna
and Pawitra (2001: 201) say store atmosphere is one component of
the store image. Various factors that combined to form the store
image is the product sold, sevice in store, customer, shop as a place to
enjoy the pleasures of life, shop promotion activities , and the atmosphere of the
shop. Opinion was supported by a statement Bermans and Evans
(2004: 462): creation of image to a store depends on a combination of physical
adjustments that leads to ability to develop artistic value of the environment store
so that capable trigerring appeal for consumer.
24
Based on the definition above according to experts, it can be concluded that the
atmosphere of the shop is one of the components in a store that directly
or indirectly affect consumer convenience in shopping.
2.4.2 Element of Store Atmosphere
According to research Riaz Hussain and Mazhar Ali (2015: 36). The elements of
the atmosphere of the shop is divided into seven parts, namely: cleanlines, music,
scent, temperatur, lighting, color, display or l ayout.
a. Cleanliness
According Banat and Wandebori, cleanliness is the appearance of the retail
chain outlet that improves the atmosphere which affects the customers feeling
towards the outlet. Customers create positive or negative word of mouth
about retail chain outlet by looking at the cleanliness, (Hussain and
Ali, 2015: 36). Gajanayake and Surangi states that cleanliness can improve
store atmosphere (Hussain and Ali, 2015: 36). According to Wanninayake
and Randiwela Cleanliness of a store creates positive impression among
consumers and makes them stay longer in the store. Product display and
Cleanliness are very important for the outlet selection (Hussain and
Ali, 2015: 36). According to Yun and Good, cleanliness of the outlets creates
an image of comfort and luxury in the customer's mind due to which
customers stay for more time in retail chain outlets and make more purchases
(Hussain and Ali,2015: 36).
25
b. Music
According to Banat and Wandebori, music can be defined as a pleasant sound
that impacts consumers’ conscious and unconscious decisions (Hussain and
Ali, 2015: 36). ). Music played in retail outlet significantly impacts consumer
purchase intention. Music styles and tempos deeply influence consumers in
increasing sales of the retail outlets. According to Holbrook and Anan,
Pleasant music is associated with longer consumption time (Hussain and
Ali, 2015: 36). According to Bruner, the variety of the background music
significantly impacts on the consumer perceptions and
preferences (Hussain and Ali, 2015: 36). Smith, Patricia, and Ross stated that
Consumers spend less time in stores when the music is played louder as
compared to soft (Hussain and Ali, 2015: 36). According to Kellaris, James
and Ronald Impact of loudness on musical preference is moderated by
gender, with females reacting more adversely than males to louder music
(Hussain and Ali, 2015: 36). Michon and Chebat state that music generally
influences positively while fast tempo music mediates influence on the
shopper’s perception of the mall (Hussain and Ali, 2015: 36). According
to music has a constructive impact on the customers’ sum of time and money
spent due to good environment (Hussain and Ali, 2015: 36).
c. Scent
According Banat and Wandebori, presence or absence of scent in the retail
chain outlets has noticeable impact on the consumer purchase intention. Scent
is a pleasant fragrance that influences customer mood and emotions which
make the customers stay more time and feel excited (Hussain and
26
Ali, 2015: 36). Morrin and Ratneshwar it states that right use of scents
improves evaluations of products that are unfamiliar or not well liked
(Hussain and Ali, 2015: 36). Spangenberg, Sinta, Grohmann,
and Tracy argues a roma have a major impact on how customers evaluate the
merchandise (Hussain and Ali, 2015: 36). According Yalch, Richard, Eric,
and Spangenberg, Customers spend more time in shopping when the
environment contains good music and scent (Hussain and
Ali, 2015: 36). Haberland states that selection of one scent should be
preferred over multiple scents. Shoppers spend more money at the outlets
with single scent compared to those consumers who are exposed to multiple
fragrances (Hussain and Ali, 2015: 36). Spangenberg et. Al said the selection
of scent must consider the targeted gender to make theme pleasing, so that
customers spend more time and money at a retail outlet to purchase goods
(Hussain and Ali, 2015: 36). Here are some scents that are considered healthy
for the body: Coffee, coffee aroma even better than it tasted. Not only makes
the body feel more energetic, with the smell of coffee, the fatigue was gone.
Lavender flowers, this plant has long been used as one of the fragrances for
aromatherapy. Lavender can calm the mind and relieve stress, especially after
a long day of work. Fragrant citrus, citrus or citrus scent makes you more
alert, while effective to relieve nausea,
(https://m.tempo.co/read/news/2015/09/28/060704634/6-aroma-yang-baik-
untuk-kesehatan).
27
d. Temperature
Lam stated that temperature at retail outlet is among those atmospheric
variables that greatly impact the consumer purchase intention. Extreme
temperature—very low or very high—creates negative feelings among
customers; it leads to dissatisfaction among the customers and consequently,
customers spend less time in outlet and produce negative word of mouth
(Hussain and Ali, 2015: 36).
e. Lighting
According to Mehrabian and Albert lighting is used to highlight products. It
creates excitement and has a positive impact on consumer purchasing
behavior (Hussain and Ali, 2015: 36). Areni and Kim stated that when the
lighting used in the retail chain outlets is of good color, consumers are
inclined to touch products to assess quality (Hussain and
Ali, 2015: 36). Wanninayake and Randiwela said Consumer’s choice of store
is moderately influenced by the lighting and store layout (Hussainand
Ali, 2015: 36). Yoo, Park, and MacInnis stating that stores with proper
lighting, music, color, scent and displays will motivate the customers to visit
the store again in the future (Hussain and Ali, 2015: 36). The main purpose
using bright lighting in retail stores is to grab the attention of consumers so
that they start buying from the store because they feel comfortable.
f. Color
Banat and Wandebori stated that color builds feelings and affects consumer
behavior and attitude (Hussain and Ali, 2015: 37). According to Yuksel,
28
Color has great impact on the consumer’s perception about the
merchandise (Hussain and Ali, 2015: 37). Crowley argue, good color of the
retail chain outlet will grab the customers’ attention and create positive
perception about the merchandise (Hussain and Ali, 2015: 37). Color also can
influence consumers to buy. Many people are more interested in getting into
stores that predominantly red, orange and yellow (http://bisnis.liputan6.com
/read/2125035/9-trik-supermarket-bikin-pembeli-jadi-boros).
g. Display or Layout
According Abratt, Ru ssell, Goodey, and Stephen, products in the retail chain
outlets should be displayed in such a way that attracts the consumers. Product
display in the retail outlets is a stimulus to attract the consumers to make
impulse buying (Hussain and Ali, 2015: 37). Mills, Paul, and Moorman states
that design and display of products in the retail chain outlets contribute one
fourth sales of the outlets (Hussain and Ali, 2015: 37). According to
the Banat and Wandebori Visible can be defined as a grouping of products,
shelves and floor space allocation, the allocation of departments and
decorating the walls. The layout is defined as division sales area, space
utilization and structuring peoduct (Hussain and Ali, 2015: 37). Ward, Bitner,
and Barnes said that the display can be defined as grouping of products, shelf
Space, and allocation of floor space, department allocation and wall
decorations. Layout is defined as division of selling area, space utilized and
arrangement of products (Hussain and Ali, 2015: 37).
29
According to Berman and Evans (2004: 455) store atmosphere include: the
outside of the store, inside the store, the layout of the room late, and interior
point of interest display, will be explained further below this:
1. Exterior
Characteristics exterior has a strong image of the store, so it should be
planned as best as possible. The combination of these exterior can make
the outside of the store into a unique look, attractive, prominent and
inviting people to come into the store. Element-exterior elements are
composed of sub-elements as following:
a. Storefront
The face or front of the store include combined nameplate,
entrances, and building construction. Storefront must reflect the
uniqueness, stability, robustness or other things that fit the image
of the store. Especially new consumer often judging from their
appearance stores beforehand so that exterior is an important
factor to influence the consumer's visit the store.
b. Marquee
Marquee is a mark used to display a store name
or logo. Marquee can be made by staining techniques, writing
letters, or the use of fluorescent lamps. Marquee can consist of the
name or logo alone, or in combination with slogan and other
information. To be effective, must be placed on the
outside marquee, to look different, and more interesting or
striking than other stores nearby.
30
c. Entrance
The entrance must be planned as possible, so that they can
invite consumers to enter to look into shop and also reduce traffic
in or out consumer to the shop.
d. Display Window
The purpose of the display window is to identify a store
with displaying items that reflect the uniqueness of the store so that
it can attract consumers sign. In the display window makes this
good at should be considered the size of the window, the number
of items on display, color, shape, and frequency of replacement.
e. Building Height and Size
May affect certain impression to the store. Such as, high ceilings
store can make the room seemed more spacious.
f. Uniqueness (uniqueness)
The uniqueness of a store can be produced of the store building
design and different from the other.
g. Surrounding Area
Environmental circumstances society when a store is located, may
affect the image of the store. If other nearby stores have
unfavorable image, then store that others will be affected by that
image.
31
h. Parking
The parking lot is improtant for consumers. If the parking lot is
spacious, safe, and have a short distance to the shops will create a
positive Atmosphere for the store.
2. General Interior
The main thing that can make sales after consumer was in the store
is display. The interior design of a store should be to maximize
the visual merchandising. Display is good, that is can attract the attention
of visitors and help them to be easily observed, check, and
choose products and finally make a purchase.There are many things that
will affect consumer perceptions on the store. Element parliaments general
interior consists of:
a. Flooring
Determining the type of flooring, size, design and floor color is
very important, because consumers can develop their
perception based on what they see.
b. Color and Lightening
Each store should have adequate lighting to direct or attract the
consumer's attention to certain areas of store. Consumers who visit
will interested in something brightest who are in their
view. lighting which both have quality and color to create
atmosphere offer look more attractive, looks different if compared
to the actual situation.
32
c. Scent and Sound
Not all stores provide this service, but if the service is performed
will provide a more relaxed atmosphere on consumers, especially
consumers who want relaxing atmosphere with eliminate
boredom, and stress while enjoying the food.
d. Fixture
Choosing supporting equipment and how the placement of the
table should be done with both in order to obtain results in
accordance with desire. Because placement table appropriate and
comfortable can create image different.
e. Wall Texture
Texture wall can cause a certain impression on consumers and be
able to make wall look more attractive
f. Temperature
Manager store should regulate air temperature, so that the
temperature in store not too hot or cold.
g. Width of aisles
The distance between the table and chairs must arranged in such a
way that consumers feel comfortable and feel at home in the shop.
h. Dead Area
Dead Area is a space in the store where the normal display can not
be applied because it will feel awkward. For example: entrance,
toilet, and a corner of the room.
33
i. Personnel
Polite, friendly, dressed interesting, fast, and responsive
waiter to create a corporate image and consumer loyalty.
j. Price
Pricing can be imprinted on menu list given that consumers can
find out the price of the food.
k. Cash Refister
The store manager had to decide the placement of the cashier
locations easily accessible by consumers.
l. Technology Modernization
The store manager should be able to serve customers as
sophisticated as possible. For example in the process of payments
to be made as sophisticated as possible and quickly, either
payment in cash or use other means of payment, such as credit or
debit card.
m. Cleanliness
Cleanliness can be a major consideration for consumers to eat at
these places.
3. Room Layout (Layout Shop)
Store manager must had a plan for decide the loccation and store
facilities. Store managers also should utilize the existing store space as
effectively as possible. Things that need to be considered in designing the
layout is as follows:
34
a. Allocation of floor space for se lling, personnel, and customers.
In a store, the existing space should be allocated for:
Selling Space
Room to place and interact between the consumer and the
waitresses.
Personnel Space
Room that provided to meet the needs of a waiter as a place
to rest or eat.
Customers Space
The rooms were provided to enhance consumer
convenience such as toilets, waiting room.
b. Traffic Flow
Various determination of store traffic flow, namely:
Grid Layout
Fixture placement in one long main hallway.
Loop Racetrack or layout
Consists of a main aisle that starts from the entrance,
surrounds the all the room, and usually circular or square,
then back to the entrance.
Spine Layout
In the main aisle layout spine stretches from the front to the
back of the store, bringing visitors in two directions.
35
La yout free-flow
The simplest pattern in which the fixture and the goods are
placed freely.
4. Interior Point of Interest Display
Interior point of interest display has two objectives, namely to
provide the informa to consumers and increase store atmosphere, it can
increase sales and profits store.The interior point of interest
display consists of:
a. Theme Setting Display
In a particular season decoration retailers can design a store or ask
a specific theme waitresses dress accordingly.
b. Wall Decoration
The room decor on the walls can be a combination of a picture or
poster affixed, the color of the walls, and so on which can increase
the atmosphere in a shop.
2.5 Consumer Behavior
The term of consumer behavior closely related to the object studies directed at
human problems. In the field of marketing study, consumer behavior concepts
continuously developed a variety of approaches. Consumer behavior is actions
that directly involved in obtaining, consuming and spend on goods or services,
including the decision process preceding and following on this action.
36
The American Marketing Asosiation in Setiadi (2010:3) define that consumer
behavior is dynamic interaction between affection and cognition, behavior and
environment in which human conduct exchange activities in their lives. Based on
the definition that already mentioned above we can conclude that the behavior of
consumer are all activities, not the act as well as a psychological process that push
such action at the time before buying, when buy, use, and spend your products
and services after do the things above or evaluation activities. Based on Kotler
and Armstrong (2008: 159) there are several factors that influence consumer
behavior, namely:
1. Cultural factors
Cultural factors have a broad and profound influence on consumer
behavior.
a. Culture, is the cause of desire and behavior of people who from the
base.
b. Sub culture, each culture containing sub-culture smaller or group of
people who share a value system based on life experience and common
situation. Subculture include nationalities, religions, racial groups and
local geography. Many sub-cultures to form a market segment that
is important and marketing program that thay made to fill their needs
often de
c. Social class, a group that is relatively homogeneous and enduring in a
society, which are arranged in a hierarchical order.
37
2. Social Factors
Consumer behavior is also influenced by factors such as social as small
groups, families, and the role and status of social consumer.
a. Group, two or more people who has interaction to achieve personal
goals or group goals. Groups that have a direct impact and the place
where a person becomes a member, it called membership groups. On
the contrary (opposite) or indirectly in shaping attitudes or behaviors,
so marketers are always trying to identify a reference group which
became the market they target.
b. The family is the most important in consumer purchasing
organization in the community and have been studied
extensively. Family members may influence behavior purchase.
c. Role and Status One becomes a member of many groups , namely
families, clubs and organizations. The position of a person in each
group can be defined Kandala role and status. Each role carries statu s
that reflect common values given to him by community. People
usually choose a product that fits with the role and status.
3. Personal factors
Purchasing decisions are also influenced by the characteristics of personal
include:
a. Age
People changed the goods and services they buy in the whole life,
clothing, furniture and recreation is often associated with in
persons.
38
b. Work
One's job affects the goods and services they
buy. Marketers identify those jobs that have interest in above
average on products and services.
c. Lifestyle
A pattern of life that is expressed in the activities, interests and
opinions. Lifestyle involves measuring the dimensions of a major
customer AIO activities (shopping, sports, Nacarasosial),
interest (food, clothing, recreation), opinions (the problem
of social, business, products).
4. Psychological factors
a. Motivation (impulse) is a necessity with strong pressure
that encourages one to seek the satisfaction of the needs.
b. Perception is the process by which people select, organize and
interpret information to form a picture of the world.
c. Learning is a change in the person's behavior that arises from
experience.
d. Beliefs and Attitudes, belief is descriptive of one's own mind
about something. Attitude is the evaluation, feeling and
relatively consistent tendency of a person to an object or idea.
2.6 Repurchase Intention
According Soderlund and Öhman intention is attitude statements about how
someone will behave in the future (Setyaningsih et . Al , 2007 : 36 ). Repurchase
intention is behavior that appears to the object. Repurchase intention showed the
39
desire of customers to repurchase in the future (Marpaung, 2011). Repurchase
intention is a commitment to consumers that formed after the consumer purchases
a product or service. This commitment arose because consumers towards a
positive impression of the brand, and consumers are satisfied with these purchases
(Hicks et . Al , 2005 : 95 ). Butcher in Setyaningsih et .Al (2007 : 36 ) argues
that consumer interest to purcahase is one measure of the success of a company,
especially service companies. According Hellier et . Al(2003 : 1771 ) repurchase
intention is a consumer's decision to re-purchase a product or service based
on what has been obtained from the same company, expenditures to acquire goods
and services and there is a tendency to do on a regular basis. The accumulation of
experience and knowledge of consumers towards a brand is a factor yang can
influence consumers to repurchase the same brand.
With the experience that consumers get from a product with a particular brand
will create a positive impression of the product and the consumer to make a
purchase again (Hellier et . Al , 2003 : 1771 ). Ferdinand (2002 : 129 ) argues that
there are four indicators to measure repurchase intention, namely:
interests of transactional
Transactional interest is a person's tendency to buy product
Interests of explorative
Interests exploratory describing the behavior of someone who is always
looking for information about the product they're interested in and look for
information to support positive of the product.
40
Interest of Prefencial
Preferential interest is intention that describes the behavior of
someone who has a primary preference on the product, this preference
may change if anything happens tot he product of preference
Interest of referential
Referential interest is a person's tendency to refenciton products to the
others.
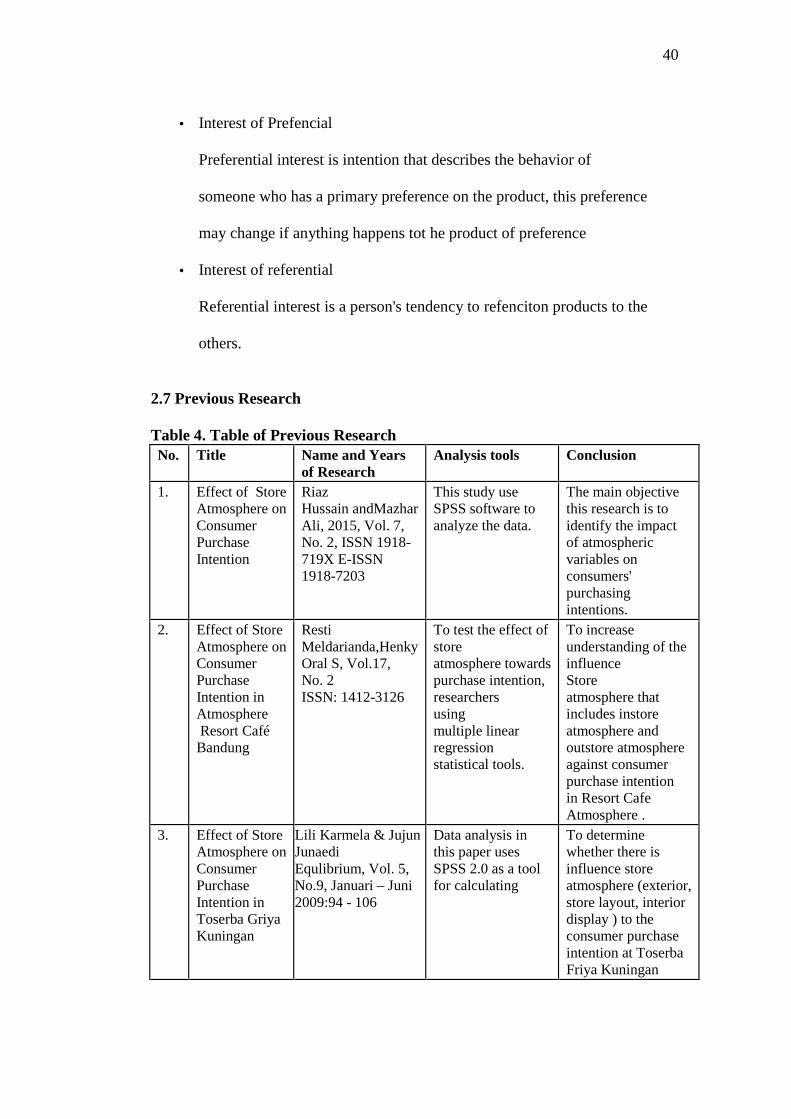
2.7 Previous Research
Table 4. Table of Previous ResearchNo. Title Name and Years
of ResearchAnalysis tools Conclusion
1. Effect of StoreAtmosphere onConsumerPurchaseIntention
RiazHussain andMazharAli, 2015, Vol. 7,No. 2, ISSN 1918-719X E-ISSN1918-7203
This study useSPSS software toanalyze the data.
The main objectivethis research is toidentify the impactof atmosphericvariables onconsumers'purchasingintentions.
2. Effect of StoreAtmosphere onConsumerPurchaseIntention inAtmosphereResort CaféBandung
RestiMeldarianda,HenkyOral S, Vol.17,No. 2ISSN: 1412-3126
To test the effect ofstoreatmosphere towardspurchase intention,researchersusingmultiple linearregressionstatistical tools.
To increaseunderstanding of theinfluenceStoreatmosphere thatincludes instoreatmosphere andoutstore atmosphereagainst consumerpurchase intentionin Resort CafeAtmosphere .
3. Effect of StoreAtmosphere onConsumerPurchaseIntention inToserba GriyaKuningan
Lili Karmela & JujunJunaediEqulibrium, Vol. 5,No.9, Januari – Juni2009:94 - 106
Data analysis inthis paper usesSPSS 2.0 as a toolfor calculating
To determinewhether there isinfluence storeatmosphere (exterior,store layout, interiordisplay ) to theconsumer purchaseintention at ToserbaFriya Kuningan
41
2.8 Framework
In the era of globalization, world trade today, there is competition in marketing of
products or services. Marketing activity has a very important role in the business
world, remember orientation to the consumers. The state of the business
world dynamic changes in line with changes in consumer tastes and changes in
the environment and surroundings. Needs of consumers are becoming
increasingly then it make a business chance.
Currently retail stores in Bandar Lampung already in anywhere. Through these
developments, it already be seen that, the price, quality and service will no longer
be a primary consideration for consumers, currently atmosphere becomes
important factor, a cozy and homey atmosphere be consideration for consumers
to visit a store .
Scope of Store atmosphere based on journal of Hussain and Mazhar (2015 : 36 ) is
cleanliness, music, scent, temperature, lighting, color, display or layout.
a. Cleanliness
According Banat and Wandebori, cleanliness is the appearance of the retail
chain outlet that improves the atmosphere which affects the customers
feeling towards the outlet. Customers create positive or negative word of
mouth about retail chain outlet by looking at the cleanliness, (Hussain and
Ali, 2015: 36), Gajanayake and Surangi states that cleanliness can improve
store atmosphere (Hussain and Ali, 2015: 36).
42
b. Music
According to Banat and Wandebori, music can be defined as a pleasant
sound that impacts consumers’ conscious and unconscious decisions
(Hussain and Ali, 2015: 36). ). Music played in retail outlet significantly
impacts consumer purchase intention. Music styles and tempos deeply
influence consumers in increasing sales of the retail outlets. According to
Holbrook and Anan, Pleasant music is associated with longer consumption
time (Hussain and Ali, 2015: 36). .
c. Scent
According Banat and Wandebori, presence or absence of scent in the retail
chain outlets has noticeable impact on the consumer purchase intention.
Scent is a pleasant fragrance that influences customer mood and emotions
which make the customers stay more time and feel excited (Hussain and
Ali, 2015: 36).
d. Temperature
Lam stated that temperature at retail outlet is among those atmospheric
variables that greatly impact the consumer purchase intention. Extreme
temperature—very low or very high—creates negative feelings among
customers; it leads to dissatisfaction among the customers and
consequently, customers spend less time in outlet and produce negative
word of mouth (Hussain and Ali, 2015: 36).
43
e. Lighting
According to Mehrabian and Albert lighting is used to highlight products.
It creates excitement and has a positive impact on consumer purchasing
behavior ( Hussain and Ali, 2015: 36).
f. Color
Banat and Wandebori stated that color builds feelings and affects
consumer behavior and attitude (Hussain and Ali, 2015: 37). According to
Yuksel, Color has great impact on the consumer’s perception about the
merchandise (Hussain and Ali, 2015: 37).
g. Display or Layout ( Display or Layout )
According Abratt, Russell, Goodey, and Stephen, products in the retail
chain outlets should be displayed in such a way that attracts the
consumers. Product display in the retail outlets is a stimulus to attract the
consumers to make impulse buying (Hussain and Ali, 2015: 37).
Repurchase intention is a commitment to consumers that formed after the
consumer purchases a product or service. This commitment arose because
consumers towards a positive impression of the brand, and consumers are satisfied
with these purchases (Hicks et . Al , 2005 : 95 ). With the experience that
consumers get from a product with a particular brand will create a positive
impression of the product and the consumer to make a purchase again
(Hellier et . Al , 2003 : 1771).
Based on the definition of store atmosphere above it will affects the consumer
repurchase intention by Sunarto (2007: 92), explains that: Selection of music as an
element of the atmosphere must be adapted to store of the event of certain
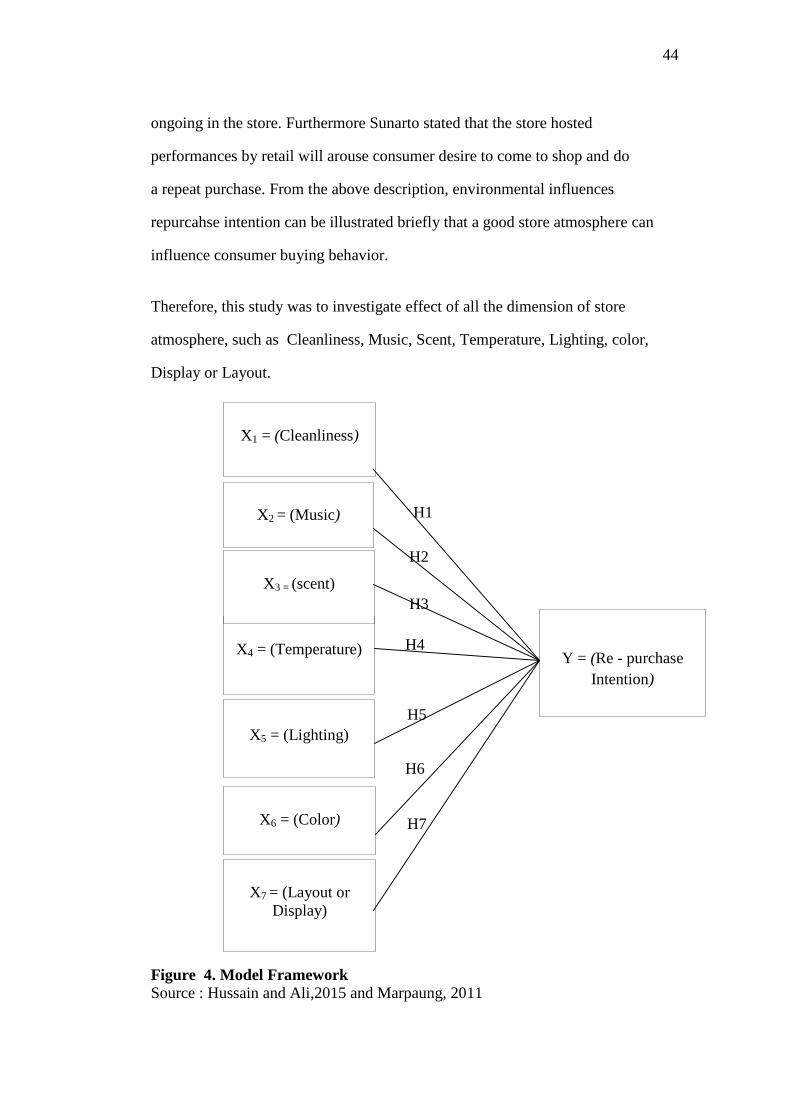
44
ongoing in the store. Furthermore Sunarto stated that the store hosted
performances by retail will arouse consumer desire to come to shop and do
a repeat purchase. From the above description, environmental influences
repurcahse intention can be illustrated briefly that a good store atmosphere can
influence consumer buying behavior.
Therefore, this study was to investigate effect of all the dimension of store
atmosphere, such as Cleanliness, Music, Scent, Temperature, Lighting, color,
Display or Layout.
Figure 4. Model FrameworkSource : Hussain and Ali,2015 and Marpaung, 2011
X1 = (Cleanliness)
X4 = (Temperature)
X3 = (scent)
X6 = (Color)
X7 = (Layout orDisplay)
X2 = (Music)
X5 = (Lighting)
Y = (Re - purchaseIntention)
H1
H2
H3
H4
H5
H7
H6
45
2.9 Hypothesis
Based on the background, problem formulation, research objectives, and benefits
of the research, the authors propose the following hypothesis:
H 1: Cleanliness influential on repurchase intention of consumers in Chandra
Super Store .
H 2: Music influential on repurchase intention of consumers in Chandra
Super Store.
H 3: Scent influential on repurchase intention of consumers in Chandra
Super Store.
H 4: Temperature influential on repurchase intention of consumers in
Chandra Super Store.
H 5: Lighting influential on repurchase intention of consumers in
Chandra Super Store.
H 6: Color influential on repurchase intention of consumers in Chandra
Super Store.
H 7: Display or layout influential on repurchase intention of consumers in
Chandra Super Store .
46
III. RESEARCH METHODS
3.1 Research Design
This research use verification descriptive research design with approach ex post
facto and surveys. Descriptive research is research that aims to describe the
circumstances or conduct object or subject of study (a person, institution,
community, etc.) at the present time based on the facts . Verivication research
shows looking for influence between the independent variables on the dependent
variable.
Ex post facto approach is one approach that is used to collect data by taking data
directly in the area of research that can describe the data of the past and the field
conditions prior to the implementation of the research. Survey is the approach
used to obtain the data from a particular place is natural (not artificial), but
research carried out in the data collection, for example by circulating
questionnaires, tests, interviews ters structures are at, and so on. (Sugiyono, 2010:
12).
3.2 Operational Variables
Sanusi (2014: 49) defines the variables are all things that shaped what is defined
by the researchers to be studied in order to obtain the information and take the
conclusions. The variables in this study is the dependent variable (Y), is a variable
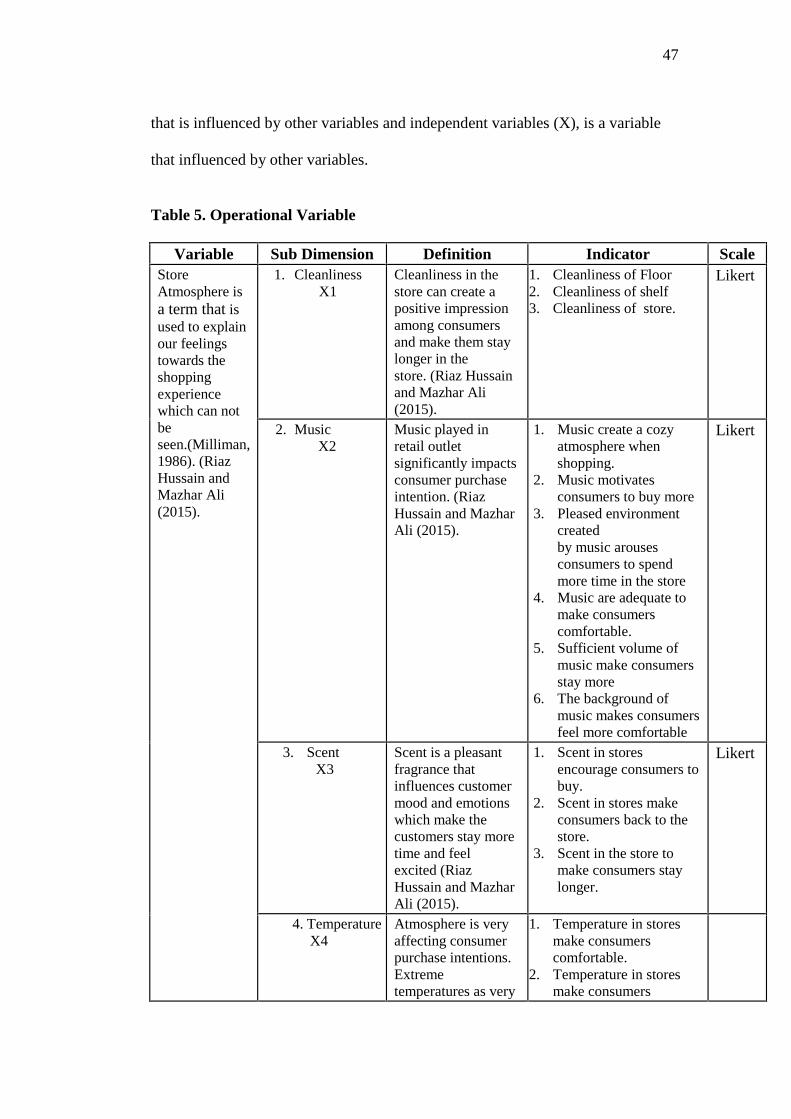
47
that is influenced by other variables and independent variables (X), is a variable
that influenced by other variables.
Table 5. Operational Variable
Variable Sub Dimension Definition Indicator ScaleStoreAtmosphere isa term that isused to explainour feelingstowards theshoppingexperiencewhich can notbeseen.(Milliman,1986). (RiazHussain andMazhar Ali(2015).
1. CleanlinessX1
Cleanliness in thestore can create apositive impressionamong consumersand make them staylonger in thestore. (Riaz Hussainand Mazhar Ali(2015).
1. Cleanliness of Floor2. Cleanliness of shelf3. Cleanliness of store.
Likert
2. MusicX2
Music played inretail outletsignificantly impactsconsumer purchaseintention. (RiazHussain and MazharAli (2015).
1. Music create a cozyatmosphere whenshopping.
2. Music motivatesconsumers to buy more
3. Pleased environmentcreatedby music arousesconsumers to spendmore time in the store
4. Music are adequate tomake consumerscomfortable.
5. Sufficient volume ofmusic make consumersstay more
6. The background ofmusic makes consumersfeel more comfortable
Likert
3. ScentX3
Scent is a pleasantfragrance thatinfluences customermood and emotionswhich make thecustomers stay moretime and feelexcited (RiazHussain and MazharAli (2015).
1. Scent in storesencourage consumers tobuy.
2. Scent in stores makeconsumers back to thestore.
3. Scent in the store tomake consumers staylonger.
Likert
4. TemperatureX4
Atmosphere is veryaffecting consumerpurchase intentions.Extremetemperatures as very
1. Temperature in storesmake consumerscomfortable.
2. Temperature in storesmake consumers
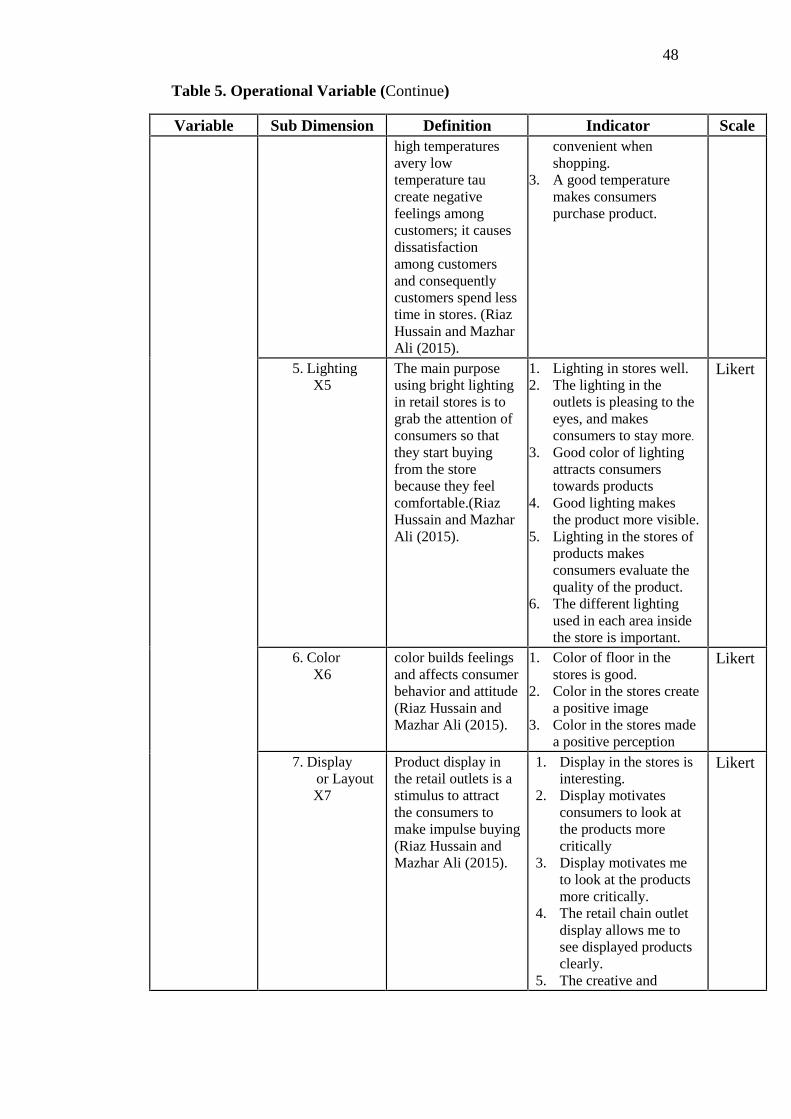
48
Table 5. Operational Variable (Continue)
Variable Sub Dimension Definition Indicator Scalehigh temperaturesavery lowtemperature taucreate negativefeelings amongcustomers; it causesdissatisfactionamong customersand consequentlycustomers spend lesstime in stores. (RiazHussain and MazharAli (2015).
convenient whenshopping.
3. A good temperaturemakes consumerspurchase product.
5. LightingX5
The main purposeusing bright lightingin retail stores is tograb the attention ofconsumers so thatthey start buyingfrom the storebecause they feelcomfortable.(RiazHussain and MazharAli (2015).
1. Lighting in stores well.2. The lighting in the
outlets is pleasing to theeyes, and makesconsumers to stay more.
3. Good color of lightingattracts consumerstowards products
4. Good lighting makesthe product more visible.
5. Lighting in the stores ofproducts makesconsumers evaluate thequality of the product.
6. The different lightingused in each area insidethe store is important.
Likert
6. ColorX6
color builds feelingsand affects consumerbehavior and attitude(Riaz Hussain andMazhar Ali (2015).
1. Color of floor in thestores is good.
2. Color in the stores createa positive image
3. Color in the stores madea positive perception
Likert
7. Displayor LayoutX7
Product display inthe retail outlets is astimulus to attractthe consumers tomake impulse buying(Riaz Hussain andMazhar Ali (2015).
1. Display in the stores isinteresting.
2. Display motivatesconsumers to look atthe products morecritically
3. Display motivates meto look at the productsmore critically.
4. The retail chain outletdisplay allows me tosee displayed productsclearly.
5. The creative and
Likert
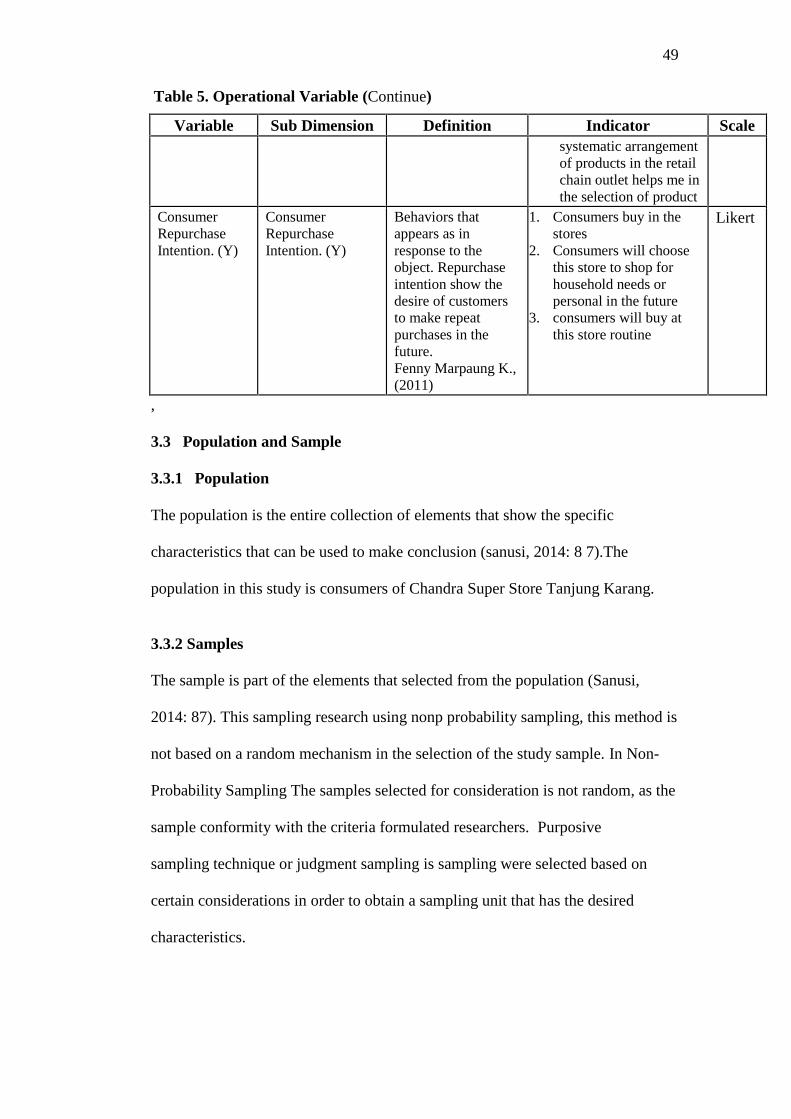
49
Table 5. Operational Variable (Continue)
Variable Sub Dimension Definition Indicator Scalesystematic arrangementof products in the retailchain outlet helps me inthe selection of product
ConsumerRepurchaseIntention. (Y)
ConsumerRepurchaseIntention. (Y)
Behaviors thatappears as inresponse to theobject. Repurchaseintention show thedesire of customersto make repeatpurchases in thefuture.Fenny Marpaung K.,(2011)
1. Consumers buy in thestores
2. Consumers will choosethis store to shop forhousehold needs orpersonal in the future
3. consumers will buy atthis store routine
Likert
,
3.3 Population and Sample
3.3.1 Population
The population is the entire collection of elements that show the specific
characteristics that can be used to make conclusion (sanusi, 2014: 8 7).The
population in this study is consumers of Chandra Super Store Tanjung Karang.
3.3.2 Samples
The sample is part of the elements that selected from the population (Sanusi,
2014: 87). This sampling research using nonp probability sampling, this method is
not based on a random mechanism in the selection of the study sample. In Non-
Probability Sampling The samples selected for consideration is not random, as the
sample conformity with the criteria formulated researchers. Purposive
sampling technique or judgment sampling is sampling were selected based on
certain considerations in order to obtain a sampling unit that has the desired
characteristics.
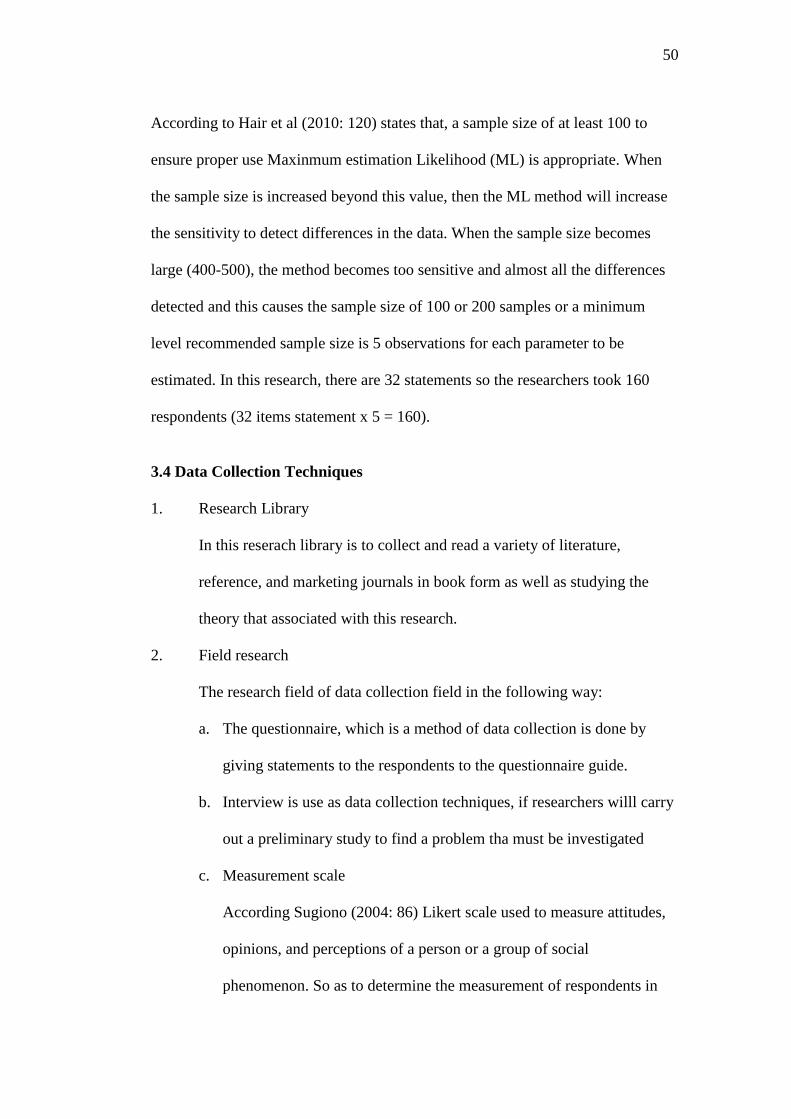
50
According to Hair et al (2010: 120) states that, a sample size of at least 100 to
ensure proper use Maxinmum estimation Likelihood (ML) is appropriate. When
the sample size is increased beyond this value, then the ML method will increase
the sensitivity to detect differences in the data. When the sample size becomes
large (400-500), the method becomes too sensitive and almost all the differences
detected and this causes the sample size of 100 or 200 samples or a minimum
level recommended sample size is 5 observations for each parameter to be
estimated. In this research, there are 32 statements so the researchers took 160
respondents (32 items statement x 5 = 160).
3.4 Data Collection Techniques
1. Research Library
In this reserach library is to collect and read a variety of literature,
reference, and marketing journals in book form as well as studying the
theory that associated with this research.
2. Field research
The research field of data collection field in the following way:
a. The questionnaire, which is a method of data collection is done by
giving statements to the respondents to the questionnaire guide.
b. Interview is use as data collection techniques, if researchers willl carry
out a preliminary study to find a problem tha must be investigated
c. Measurement scale
According Sugiono (2004: 86) Likert scale used to measure attitudes,
opinions, and perceptions of a person or a group of social
phenomenon. So as to determine the measurement of respondents in
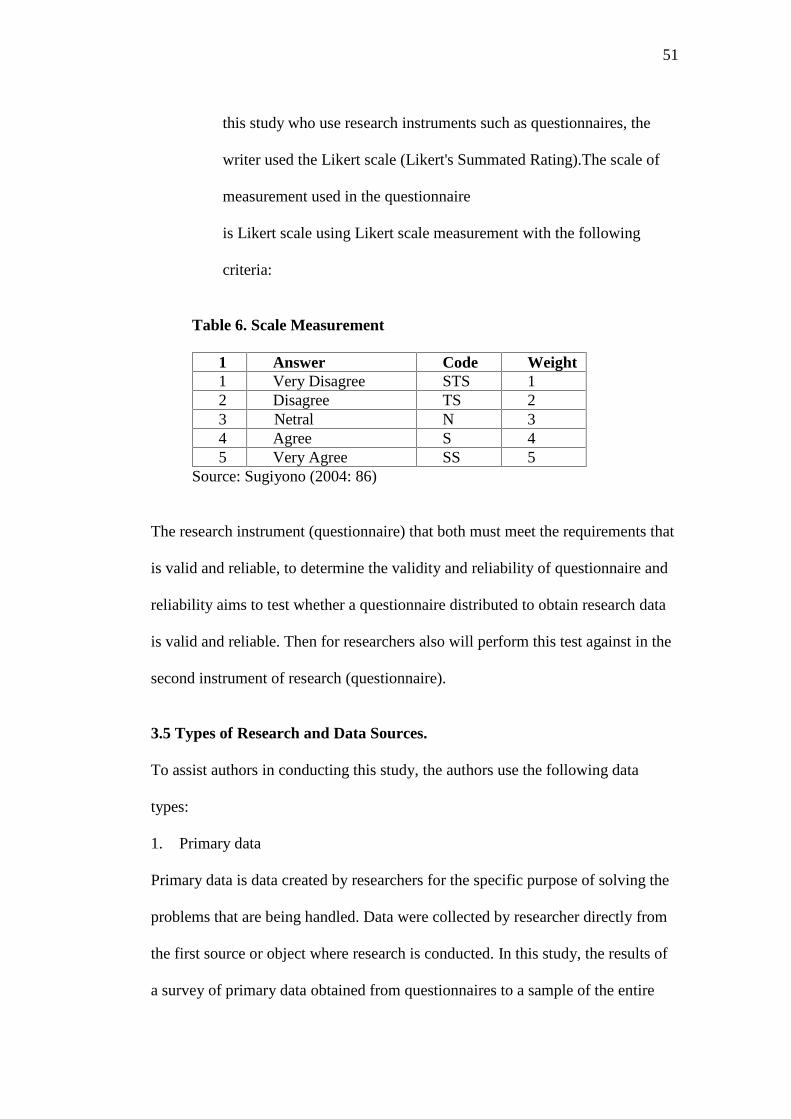
51
this study who use research instruments such as questionnaires, the
writer used the Likert scale (Likert's Summated Rating).The scale of
measurement used in the questionnaire
is Likert scale using Likert scale measurement with the following
criteria:
Table 6. Scale Measurement
1 Answer Code Weight1 Very Disagree STS 12 Disagree TS 23 Netral N 34 Agree S 45 Very Agree SS 5
Source: Sugiyono (2004: 86)
The research instrument (questionnaire) that both must meet the requirements that
is valid and reliable, to determine the validity and reliability of questionnaire and
reliability aims to test whether a questionnaire distributed to obtain research data
is valid and reliable. Then for researchers also will perform this test against in the
second instrument of research (questionnaire).
3.5 Types of Research and Data Sources.
To assist authors in conducting this study, the authors use the following data
types:
1. Primary data
Primary data is data created by researchers for the specific purpose of solving the
problems that are being handled. Data were collected by researcher directly from
the first source or object where research is conducted. In this study, the results of
a survey of primary data obtained from questionnaires to a sample of the entire
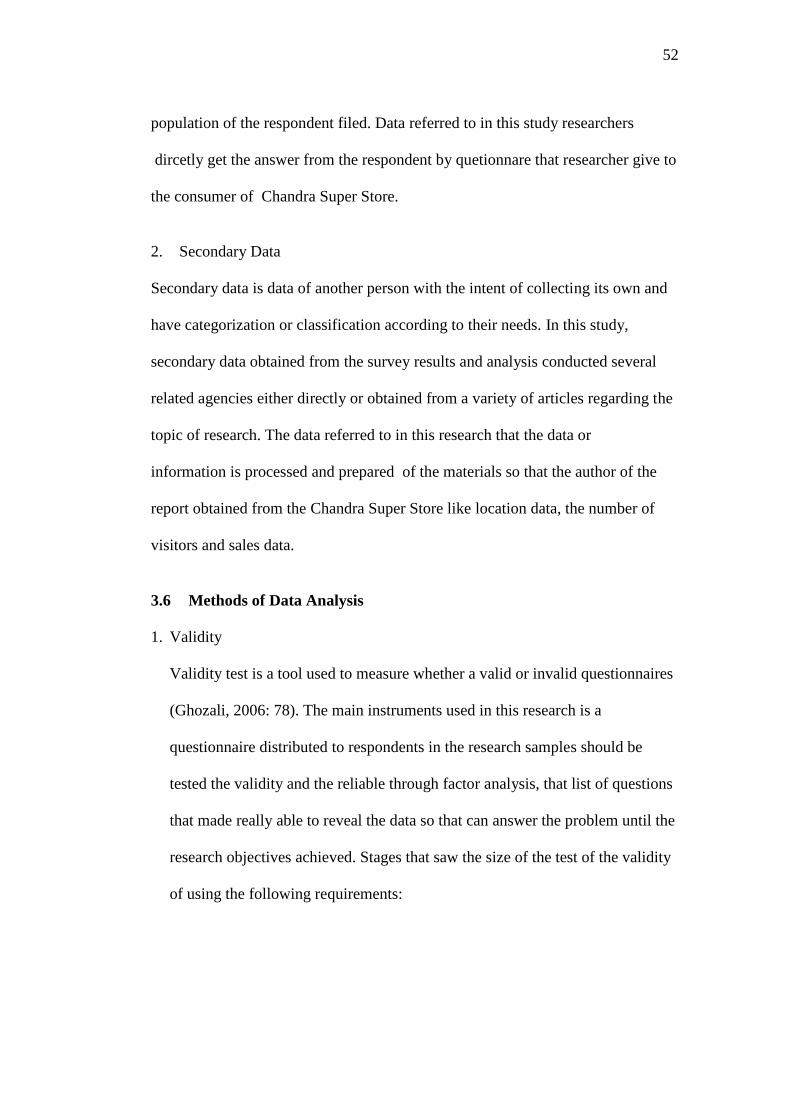
52
population of the respondent filed. Data referred to in this study researchers
dircetly get the answer from the respondent by quetionnare that researcher give to
the consumer of Chandra Super Store.
2. Secondary Data
Secondary data is data of another person with the intent of collecting its own and
have categorization or classification according to their needs. In this study,
secondary data obtained from the survey results and analysis conducted several
related agencies either directly or obtained from a variety of articles regarding the
topic of research. The data referred to in this research that the data or
information is processed and prepared of the materials so that the author of the
report obtained from the Chandra Super Store like location data, the number of
visitors and sales data.
3.6 Methods of Data Analysis
1. Validity
Validity test is a tool used to measure whether a valid or invalid questionnaires
(Ghozali, 2006: 78). The main instruments used in this research is a
questionnaire distributed to respondents in the research samples should be
tested the validity and the reliable through factor analysis, that list of questions
that made really able to reveal the data so that can answer the problem until the
research objectives achieved. Stages that saw the size of the test of the validity
of using the following requirements:
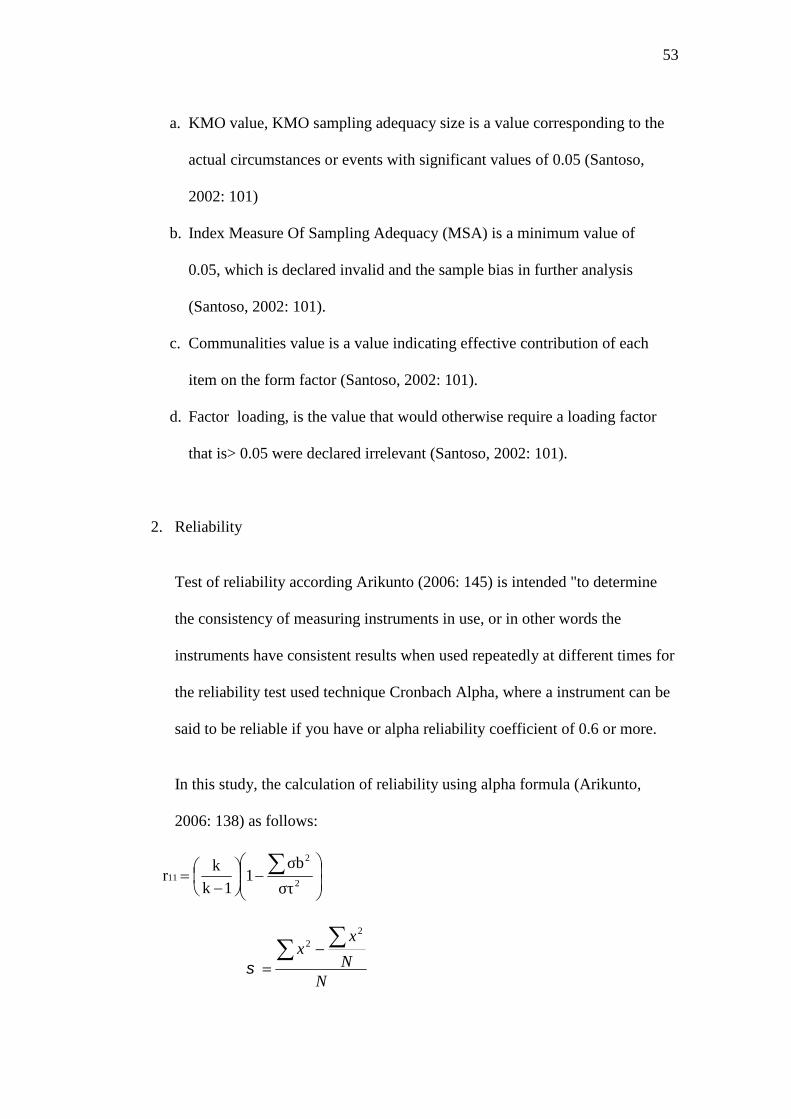
53
a. KMO value, KMO sampling adequacy size is a value corresponding to the
actual circumstances or events with significant values of 0.05 (Santoso,
2002: 101)
b. Index Measure Of Sampling Adequacy (MSA) is a minimum value of
0.05, which is declared invalid and the sample bias in further analysis
(Santoso, 2002: 101).
c. Communalities value is a value indicating effective contribution of each
item on the form factor (Santoso, 2002: 101).
d. Factor loading, is the value that would otherwise require a loading factor
that is> 0.05 were declared irrelevant (Santoso, 2002: 101).
2. Reliability
Test of reliability according Arikunto (2006: 145) is intended "to determine
the consistency of measuring instruments in use, or in other words the
instruments have consistent results when used repeatedly at different times for
the reliability test used technique Cronbach Alpha, where a instrument can be
said to be reliable if you have or alpha reliability coefficient of 0.6 or more.
In this study, the calculation of reliability using alpha formula (Arikunto,
2006: 138) as follows:
2
2
11στ
σb1
1k
kr
NN
xx
22
54
Where:
r 11 = Reliability of the instrument
k = Number of the questions
2b = Number of variants grains
2t = Total number of variants
3.7 Analysis Tools
1. Qualitative analysis
Qualitative data is data research that is not a number, that can not be
calculated in the form of information or explanation based on theoretical
approaches and logical assessment. Qualitative analysis is used to provide
a descriptive overview of the responses that respondents on the
quetionnare or a list of questions and associated with marketing theories or
approaches relating to the atmosphere of the store (store atmosphere).
2. Quantitative analysis
Analisisis quantitative research is how to use the data calculation
processing by systematic analysis. This study uses descriptive analysis
statistics that used to analyze data in ways that describe or depict the data
that has been collected as and using multiple linear regression. Multiple
regression analysis is used to examine the strength of the relationship
between independent variables and the dependent variable. Multiple linear
regression can be seen in the following equation:
Y = a + b1X1 + b2X2+ b3 X 3+ b4 X4 + b5 X5 + b6X6 + b7X7+ ε
Information:
55
Y = Repurchase Intentiona = Constant
X 1 = CleanlinessX 2 = MusicX 3 = ScentX 4 = TemperatureX 5 = LightingX 6 = ColorX 7 = Display or Layoutb1- b7 = Koefisiens variable regression store atmosphereε = Standard Error
3.8 Normality Test
According Ghozali (2006: 147) normality test aims to test whether the regression
model, both the dependent variable and independent variables both have normal
distribution or not. To prove whether the data are normally distributed can be seen
from the sig> 0.05, so it is normally distributed data.
3.9 Statistical Hypothesis testing
Hypothesis testing is a method of decision making based on the analysis of the
data, both from controlled trials, as well as from observations (uncontrolled). In
statistics a result can be said to be significant statistically, if the event is nearly
impossible due to the factors which, incidentally, in accordance with the limits of
probability that is predetermined.
3.9.1 Overall Hypothesis Testing (F Test)
This test is used to determine whether independent variable is the level of
confidence of 95% or α = 5%. The test results F test can be found in the table
Annova (analysis of variance) of output SPSS 16 .0. To answer a statistical
hypothesis, namely:
Ho = variable X no positive and significant influence to variable Y.
56
Ha = variable X is positive and significant influence on the variable Y.
Criteria:
a. Ho rejected and Ha accepted, if the value is significant (P Value)> 0.05.
b. Ho accepted and Ha rejected, if the value is significant (P Val ue) <0.05.
3.9.2 Partial Hypothesis Testing (t test)
This test is used to determine whether the independent variables in the regression
model is partially significant effect on the dependent variable (Y) at a rate of 95%
or α = 5%. By hypothesis:
a. If the value of a significant (P Value) <0.05 so (Ho) refused and
accept alternative (Ha) which means that there is influence between
independent variables and the dependent variable.
b. If the value of a significant (P Value)> 0.05 then (Ho) is accepted and (Ha)
rejected the alternative which means no influence between independent
variables and the dependent variable.
3.9.3 The coefficient of determination R 2
The higher the R 2, the more important a variable as in this study consisted of
several variables, it will be used to measure the coefficient of determination of the
contribution of the independent variable on the dependent variable. The bigger the
coefficient of determination corrected or the regression model, the model obtained
better.
89
.
V. CONCLUSIONS AND RECOMMENDATIONS
5.1 Conclusion
The conclusions that can be drawn from the results of research in this study are
support the proposed hypothesis, it is based on:
1. The overall results of testing the hypothesis by F test obtained F count is
24.491 and it has significance value under alpha which can be determined
by 0,05 (5%) is 0,000. it means that whole dependend variables have
significant effects on store atmosphere towrads consumers repurchase
intention .
2. The result of t test result is known that the value of t count on the store
atmosphere (X) which are include cleanliness, music, scent, temperature,
lighting, color, display has significance level under 0,05 (5%), it means
that all dimensions variable of store atmosphere (X) partially have
significance effects raising up consumers repurchase intention.
3. R2 test result of 0,530 shows that the contribution of variable X (dimension
of store atmosphere) affects the variable Y (consumers repurchase
intention) at 53% and the rest is influenced by other variables, such
as: price, promotion, and more.
90
5.2 Suggestions
Some things that could be addressed in this study based on the results and
discussion that has been presented, are:
1. Chandra Super Store Tanjung Karang should always increase the
dimension of Scent in the store, because this dimension is the
lowest variable affecting consumers repurchase intention, by put
automatic parfume periodically with the scent that could make the
consumers relax when shopping like a perfume with the scent of
coffee, lavender, and citrus in the some point in the store so
that the scent in Chandra Super Store are fragrant and scented as
well and it can make consumers repurchase intention in
Chandra Super Store increase.
2. Chandra Super Store Tanjung Karang should always increase the
dimension of music which is played in the store. By playing musics
that is pleasing to the ear like classical music and also play music
according to the theme or the celebration that will take place in
order to create a pleasant environment in the stores when
consumers are shopping.
3. Chandra Super Store Tanjung Karang should always increase the
dimension of cleanliness in the store, by add more
employees specially and regularly with tasked to clean the store
environment, especially the shelfs of vegetables, fruits because
91
these products can not survive long and if the conditions are not
fresh anymore then it can make the shelfs dirty and it must be
cleaned.
4. Chandra Super Store Tanjung Karang should always increase the
dimension of color in the store, by add color to the walls of the
store because the color that dominates in the Chandra Super Store
now is only white, such as add color to yellow or orange, so that
consumers who come will attract to shopping in Chandra Super
Store and interest to visit again.
5. Chandra Super Store Tanjung Karang should
always maintain dimensions of lighting, display or layout and
temperature which are already in there, because these variables are
also crucial in increasing consumers repurchase intention in
Chandra Super Store.
5.3 Limitations of Research
In this study, there are some limitations that need to be submitted for
consideration by the next study:
1. Measurement of the variables in this study using non probability sampling
technique that is weak in the conclusion it would be better if further
research using other sampling techniques.
2. For other researchers hoped this research may help to develop further
research. Researchers suggest adding the dependent variables to be more
inclusive to find out more about the dimensions of store atmosphere.
REFERENCES
Arikunto, Suharsimi. 2006. Prosedur Penelitian Suatu Pendekatan Praktik.Jakarta : Rineka Cipta.
Berman, Barry dan Evans, Joel R. 2004. Retail Management A StrategicApporoach. Ninth Editon. New Jersey. Pearson Education International.
Cannon,Perreault dan Mc Carthy. 2008. Pemasaran Dasar : PendekatanManajerial Global, Edisi 16. Bandung. Alfabet.
Ferdinand, A. 2002. “Structural Equation Modeling dalam PenelitianManajemen : Aplikasi Model-model Rumit dalam Penelitian untukTesis Magister dan Disertasi Doktor”, BP UNDIP.
Ghozali, Imam. 2006. Analisis Multivariate SPSS. Semarang. Badan PenerbitUniversitas Dipenogoro.
Gilbert, David. 2003. Retail Marketing Management. Second Edition. PrenticeHall
Hair, J.F., et al. 2010. Multivariate Data Analysis. Seventh Edition. New Jersey :Pearson Education Inc.
Hellier, P.K, G. M. Geursen, R. A. Carr and J. A. Rickard. “Customer RepurchaseIntention, a General Structural Equation Model.” European Journal ofMarketing. Vol. 37, No. 11-12, 2003, pp. 17621800.
Hicks, J.M., Page Jr, T.J., Behe, B.K., Dennis, J.H., Fernandez, R. and Thomas.(2005), “Delighted Consumers Buy Again”, Journal of ConsumerSatisfaction, Dissatisfaction and Complaining Behaviour, Vol. 18, pp. 94-104.
http://www.bppk.kemenkeu.go.id/publikasi/artikel/167-artikel-pajak/21014-penghasilan-kelas-menengah-naik-potensi-pajak
http://lampost.co/berita/bandar-lampung-pake-city
http://bisnis.liputan6.com/read/2125035/9-trik-supermarket-bikin-pembeli-jadi-boros
https://m.tempo.co/read/news/2015/09/28/060704634/6-aroma-yang-baik-untuk-kesehatan
Hussain, Riaz dan Ali, Mazhar. 2015. Effect of Store Atmosphere on ConsumerPurchase Intention. International Journal of Marketing Studies; Vol. 7,No. 2;2015.
Karmela, Lili dan Junaedi, Jujun. 2009. Pengaruh Store Atmosphere Terhadap Minat BeliKonsumen pada Toserba Griya Kuningan. Equlibrium, Vol. 5, No.9.
Kotler, P. and Keller, K.L. 2009. Marketing Management. 13th ed. New Jersey:Pearson/Prentice-Hall.
Kotler, Phillip dan G, Amstrong. 2008. Prinsip Prinsip Pemasaran. ed 12.Jakarta. Erlangga
Levy, Michael and Barton Weitz. 2001. Retailing Management. InternationalEdition. Edisi 4
Lovelock, Christoper dan Lauren Wright. 2005. Manajemen Pemasaran Jasa.Jakarta: PT. Indeks Kelompok Gramedia.
Marpaung, Fenny K. 2011. Pengaruh Store Environment Terhadap MinatPembelian Ulang Konsumen Metro Supermarket Medan Plaza. Skripsi,Universitas Sumatera Utara.
Meldarianda, resti & Lisan S, Henky. 2010. Pengaruh Store Atmosphere terhadapMinat Beli Konsumen pada Resort Café Atmosphere Bandung. JurnalBisnis dan Ekonomi. Vol. 7, No. 2, ISSN: 1412-3126
Mowen, Jhon C. dan Michael Minor. 2002. Perilaku Konsumen. Jilid Kedua.Alih Bahasa: Dwi Kartini. Jakarta: Erlangga.
Peter, J. Paul & Jerry C. Olson. 1999. Consumer Behavior, Perilaku konsumendan Strategi Pemasaran. Jilid kedua. Edisi Keempat. Terjemahan DamosSihombing dan Peter Remy Yossi Pasla. Jakarta: Erlangga.
Putri, Lily Harlina, Srikandi Kumadji, Andriani Kusumawati. 2014. PengaruhStore Atmosphere terhadap Keputusan Pembelian dan Kepuasan Pelanggan.Jurnal Administrasi Bisnis. Vol 15 no 2.
Santoso, Singgih. 2002. Statistik Parametrik. Cetakan Ketiga. Jakarta. PTGramedia Pustaka Utama
Sanusi, Anwar. 2014. Metodologi Penelitian Praktis Untuk Ilmu Sosial danEkonomi. Edisi Pertama. Cetakan Pertama. Penerbit Buntara Media,Malang.
Setiadi, Nugroho J. 2010. Perilaku Konsumen: Konsep Dan Impikasi UntukStrategi Dan Penelitian Pemasaran. Jakarta. Prenada Media Group.
Setyaningsih, Rahmawati, Suyudi Mangunwihardjo, Harry Soesanto. 2007.Analisis Faktor – Faktor yang Mempengaruhi Ekuitas Merek untukMeningkatkan Minat Beli Ulang. Jurnal Studi Manajemen danOrganisasi. Vol 4, no 2.
Sugiyono. 2010. Metode Penelitian Pendidikan Pendekatan Kuantitatif,kualitatif, dan R&D. Bandung: Alfabeta
Sugiyono. 2004. Metode Penelitian Bisnis. CV. Alfabeta, Bandung.
Sunarto, SE .,MM. 2007. Sistem Pengendalian Manajemen. Yogjakarta: Amir.
Sutisna dan Pawitra. 2001. Perilaku Konsumen dan Komunikasi Pemasaran.Bandung: PT. Remaja Rosdakarya.
Utami, Christina Whidya. 2006. “Manajemen Ritel ”. Jakarta. Salemba Empat.