Embed Size (px)
Citation preview

Power Circuits and Transformers
Electricity and New Energy
LabVolt Series
Student Manual
584079
en
Festo Didactic
Power Circuits and Transform
ersStudent M
anual
www.festo-didactic.com
Germany
Festo Didactic SE
Rechbergstr. 3
73770 Denkendorf
Tel.: +49 711 3467-0Fax: +49 711 347-54-88500
United States
Festo Didactic Inc.
607 Industrial Way WestEatontown, NJ 07724
Tel.: +1 732 938-2000
Toll Free: +1-800-522-8658
Fax: +1 732 [email protected]
CanadaFesto Didactic Ltée/Ltd
675, rue du Carbone
Québec (Québec) G2N 2K7
Tel.: +1 418 849-1000Toll Free: +1-800-522-8658
Fax: +1 418 849-1666
0000
5840
7900
0000
0001
00

Electricity and New Energy
Power Circuits and Transformers
Student Manual 584079

Order no.: 584079
Revision level: 11/2014
By the staff of Festo Didactic
© Festo Didactic Ltée/Ltd, Quebec, Canada 1995
Internet: www.festo-didactic.com
e-mail: [email protected]
Printed in Canada
All rights reserved
ISBN 978-2-89289-325-0 (Printed version)
ISBN 978-2-89747-158-3 (CD-ROM)
Legal Deposit – Bibliothèque et Archives nationales du Québec, 1995
Legal Deposit – Library and Archives Canada, 1995
The purchaser shall receive a single right of use which is non-exclusive, non-time-limited and limited
geographically to use at the purchaser's site/location as follows.
The purchaser shall be entitled to use the work to train his/her staff at the purchaser's site/location and
shall also be entitled to use parts of the copyright material as the basis for the production of his/her own
training documentation for the training of his/her staff at the purchaser's site/location with
acknowledgement of source and to make copies for this purpose. In the case of schools/technical
colleges, training centers, and universities, the right of use shall also include use by school and college
students and trainees at the purchaser's site/location for teaching purposes.
The right of use shall in all cases exclude the right to publish the copyright material or to make this
available for use on intranet, Internet and LMS platforms and databases such as Moodle, which allow
access by a wide variety of users, including those outside of the purchaser's site/location.
Entitlement to other rights relating to reproductions, copies, adaptations, translations, microfilming and
transfer to and storage and processing in electronic systems, no matter whether in whole or in part, shall
require the prior consent of Festo Didactic GmbH & Co. KG.
Information in this document is subject to change without notice and does not represent a commitment on
the part of Festo Didactic. The Festo materials described in this document are furnished under a license
agreement or a nondisclosure agreement.
Festo Didactic recognizes product names as trademarks or registered trademarks of their respective
holders.
All other trademarks are the property of their respective owners. Other trademarks and trade names may
be used in this document to refer to either the entity claiming the marks and names or their products.
Festo Didactic disclaims any proprietary interest in trademarks and trade names other than its own.

© Festo Didactic 584079 III
Safety and Common Symbols
The following safety and common symbols may be used in this manual and on the equipment:
Symbol Description
DANGER indicates a hazard with a high level of risk which, if not avoided, will result in death or serious injury.
WARNING indicates a hazard with a medium level of risk which, if not avoided, could result in death or serious injury.
CAUTION indicates a hazard with a low level of risk which, if not avoided, could result in minor or moderate injury.
CAUTION used without the Caution, risk of danger sign , indicates a hazard with a potentially hazardous situation which, if not avoided, may result in property damage.
Caution, risk of electric shock
Caution, hot surface
Caution, risk of danger
Caution, lifting hazard
Caution, hand entanglement hazard
Notice, non-ionizing radiation
Direct current
Alternating current
Both direct and alternating current
Three-phase alternating current
Earth (ground) terminal
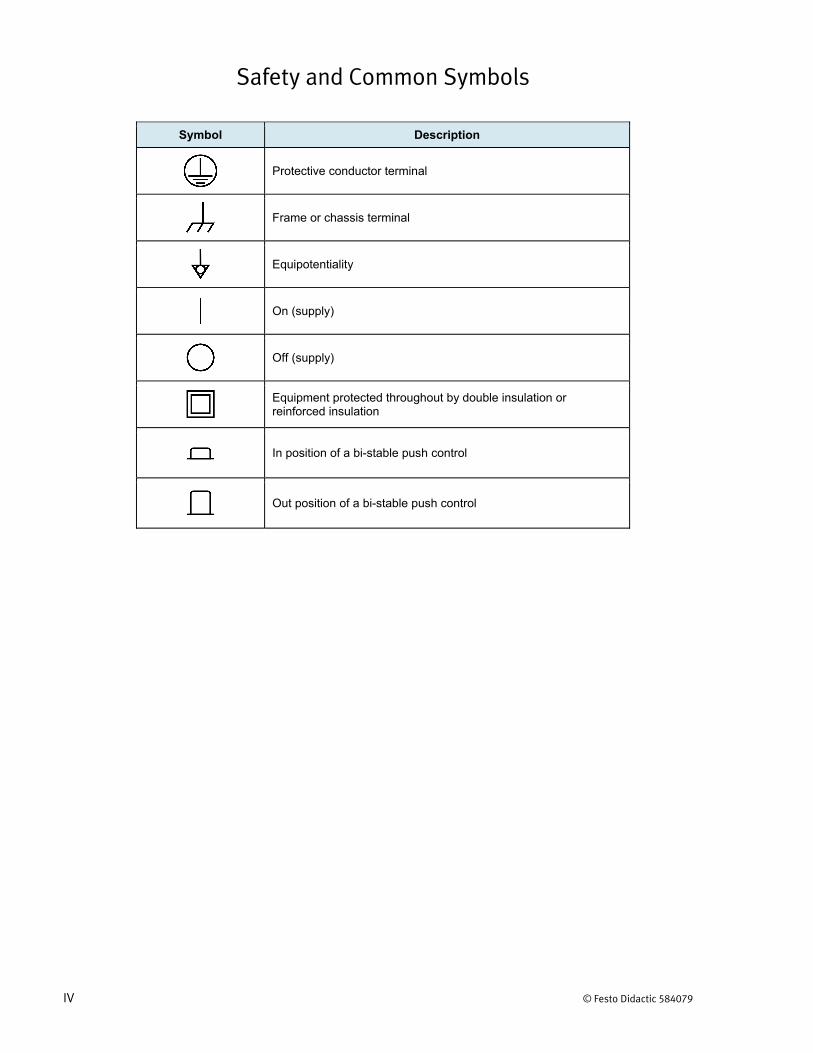
Safety and Common Symbols
IV © Festo Didactic 584079
Symbol Description
Protective conductor terminal
Frame or chassis terminal
Equipotentiality
On (supply)
Off (supply)
Equipment protected throughout by double insulation or reinforced insulation
In position of a bi-stable push control
Out position of a bi-stable push control
© Festo Didactic 584079 V
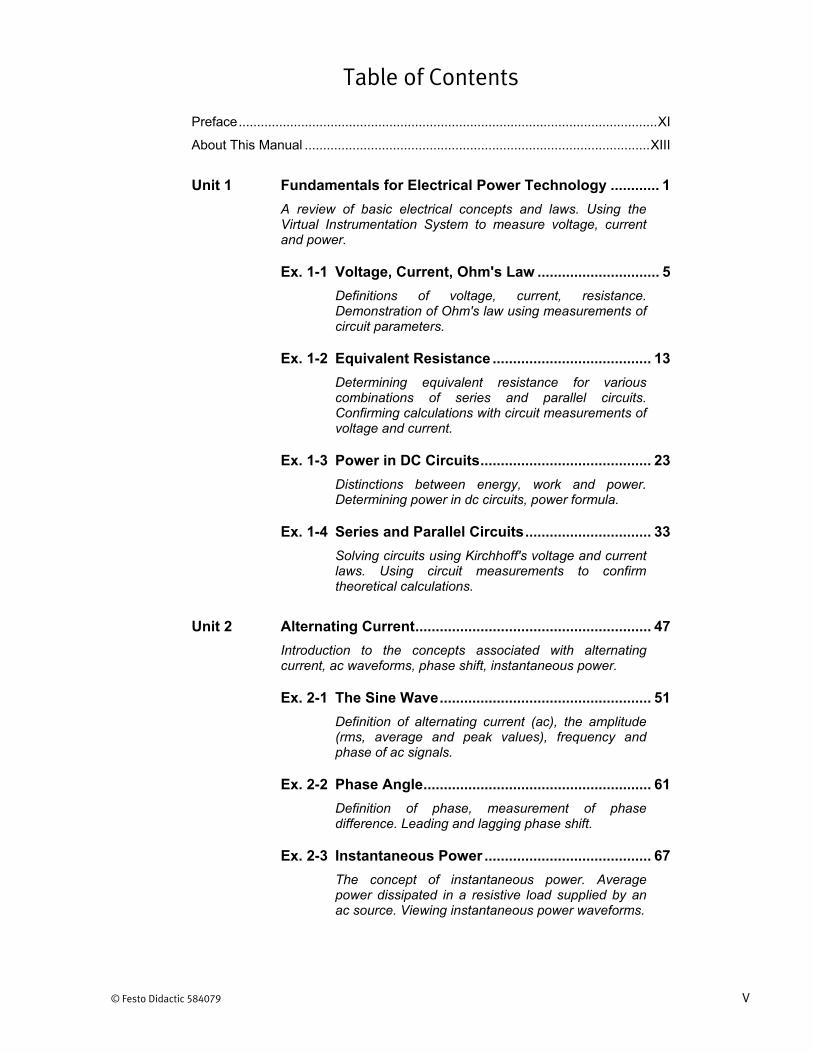
Table of Contents
Preface .................................................................................................................. XI
About This Manual .............................................................................................. XIII
Unit 1 Fundamentals for Electrical Power Technology ............ 1
A review of basic electrical concepts and laws. Using the Virtual Instrumentation System to measure voltage, current and power.
Ex. 1-1 Voltage, Current, Ohm's Law .............................. 5
Definitions of voltage, current, resistance. Demonstration of Ohm's law using measurements of circuit parameters.
Ex. 1-2 Equivalent Resistance ....................................... 13
Determining equivalent resistance for various combinations of series and parallel circuits. Confirming calculations with circuit measurements of voltage and current.
Ex. 1-3 Power in DC Circuits .......................................... 23
Distinctions between energy, work and power. Determining power in dc circuits, power formula.
Ex. 1-4 Series and Parallel Circuits ............................... 33
Solving circuits using Kirchhoff's voltage and current laws. Using circuit measurements to confirm theoretical calculations.
Unit 2 Alternating Current .......................................................... 47
Introduction to the concepts associated with alternating current, ac waveforms, phase shift, instantaneous power.
Ex. 2-1 The Sine Wave .................................................... 51
Definition of alternating current (ac), the amplitude (rms, average and peak values), frequency and phase of ac signals.
Ex. 2-2 Phase Angle ........................................................ 61
Definition of phase, measurement of phase difference. Leading and lagging phase shift.
Ex. 2-3 Instantaneous Power ......................................... 67
The concept of instantaneous power. Average power dissipated in a resistive load supplied by an ac source. Viewing instantaneous power waveforms.
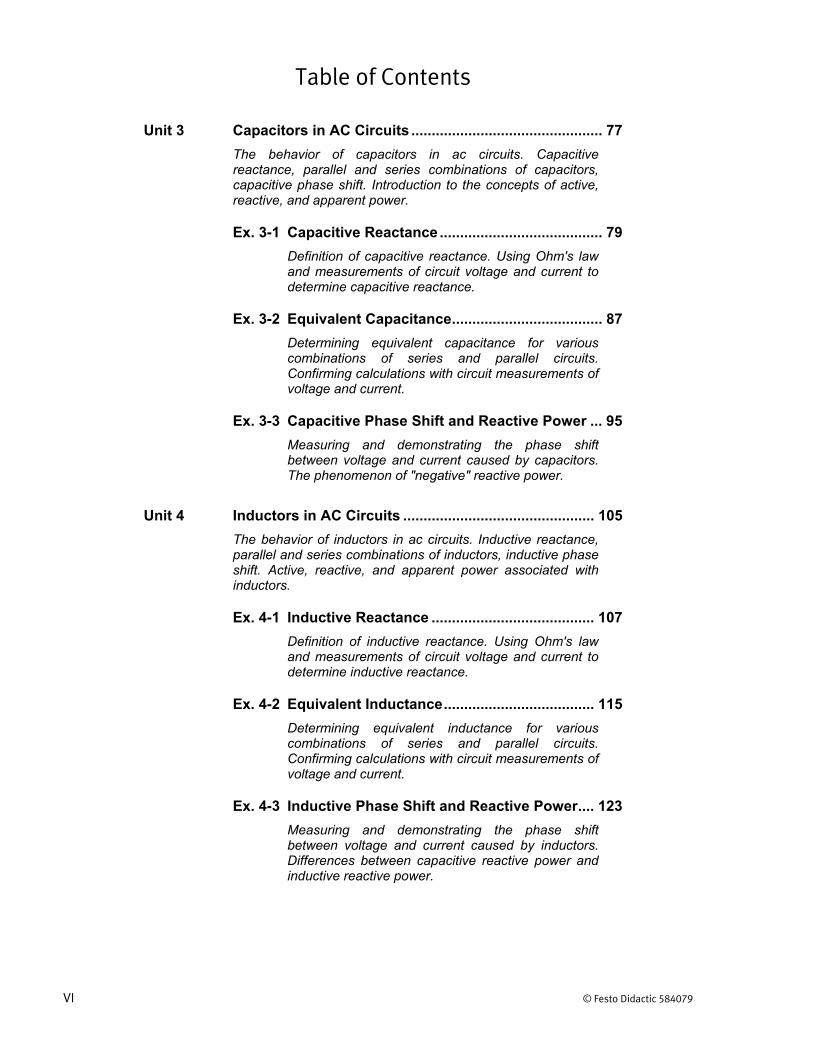
Table of Contents
VI © Festo Didactic 584079
Unit 3 Capacitors in AC Circuits ............................................... 77
The behavior of capacitors in ac circuits. Capacitive reactance, parallel and series combinations of capacitors, capacitive phase shift. Introduction to the concepts of active, reactive, and apparent power.
Ex. 3-1 Capacitive Reactance ........................................ 79
Definition of capacitive reactance. Using Ohm's law and measurements of circuit voltage and current to determine capacitive reactance.
Ex. 3-2 Equivalent Capacitance ..................................... 87
Determining equivalent capacitance for various combinations of series and parallel circuits. Confirming calculations with circuit measurements of voltage and current.
Ex. 3-3 Capacitive Phase Shift and Reactive Power ... 95
Measuring and demonstrating the phase shift between voltage and current caused by capacitors. The phenomenon of "negative" reactive power.
Unit 4 Inductors in AC Circuits ............................................... 105
The behavior of inductors in ac circuits. Inductive reactance, parallel and series combinations of inductors, inductive phase shift. Active, reactive, and apparent power associated with inductors.
Ex. 4-1 Inductive Reactance ........................................ 107
Definition of inductive reactance. Using Ohm's law and measurements of circuit voltage and current to determine inductive reactance.
Ex. 4-2 Equivalent Inductance ..................................... 115
Determining equivalent inductance for various combinations of series and parallel circuits. Confirming calculations with circuit measurements of voltage and current.
Ex. 4-3 Inductive Phase Shift and Reactive Power .... 123
Measuring and demonstrating the phase shift between voltage and current caused by inductors. Differences between capacitive reactive power and inductive reactive power.
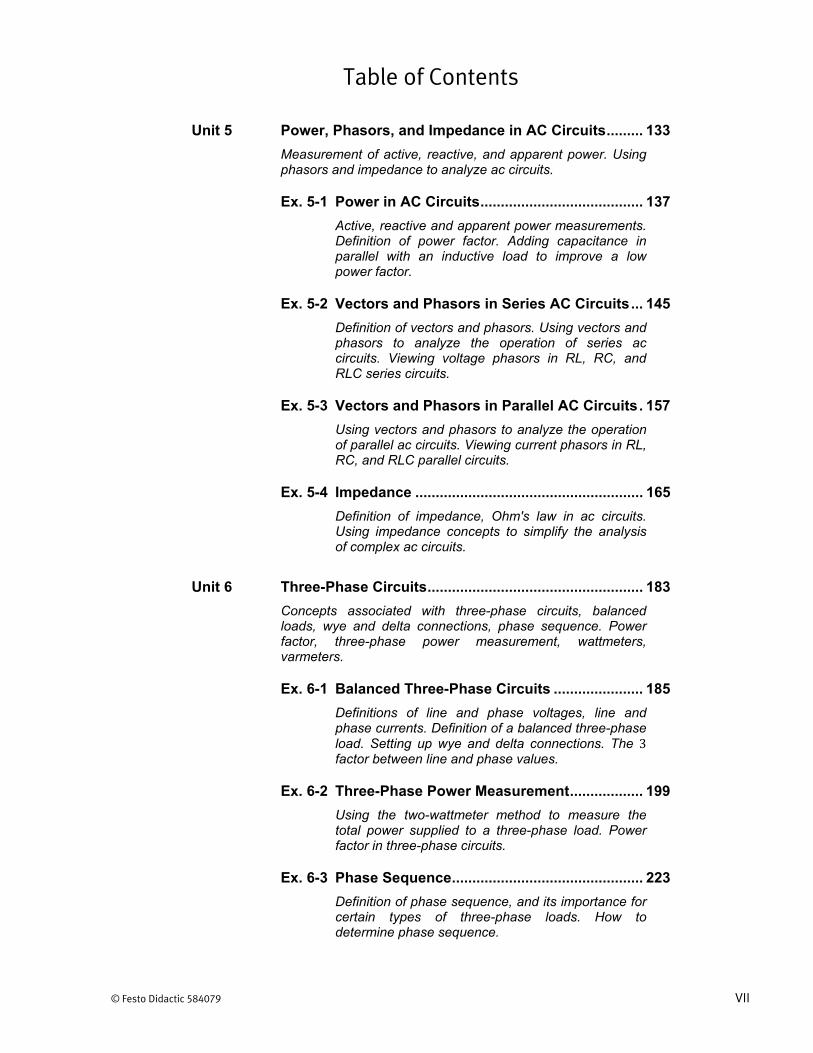
Table of Contents
© Festo Didactic 584079 VII
Unit 5 Power, Phasors, and Impedance in AC Circuits ......... 133
Measurement of active, reactive, and apparent power. Using phasors and impedance to analyze ac circuits.
Ex. 5-1 Power in AC Circuits ........................................ 137
Active, reactive and apparent power measurements. Definition of power factor. Adding capacitance in parallel with an inductive load to improve a low power factor.
Ex. 5-2 Vectors and Phasors in Series AC Circuits ... 145
Definition of vectors and phasors. Using vectors and phasors to analyze the operation of series ac circuits. Viewing voltage phasors in RL, RC, and RLC series circuits.
Ex. 5-3 Vectors and Phasors in Parallel AC Circuits . 157
Using vectors and phasors to analyze the operation of parallel ac circuits. Viewing current phasors in RL, RC, and RLC parallel circuits.
Ex. 5-4 Impedance ........................................................ 165
Definition of impedance, Ohm's law in ac circuits. Using impedance concepts to simplify the analysis of complex ac circuits.
Unit 6 Three-Phase Circuits ..................................................... 183
Concepts associated with three-phase circuits, balanced loads, wye and delta connections, phase sequence. Power factor, three-phase power measurement, wattmeters, varmeters.
Ex. 6-1 Balanced Three-Phase Circuits ...................... 185
Definitions of line and phase voltages, line and phase currents. Definition of a balanced three-phase load. Setting up wye and delta connections. The 3 factor between line and phase values.
Ex. 6-2 Three-Phase Power Measurement .................. 199
Using the two-wattmeter method to measure the total power supplied to a three-phase load. Power factor in three-phase circuits.
Ex. 6-3 Phase Sequence ............................................... 223
Definition of phase sequence, and its importance for certain types of three-phase loads. How to determine phase sequence.

Table of Contents
VIII © Festo Didactic 584079
Unit 7 Single-Phase Transformers .......................................... 237
The principles of transformer operation. Magnetic induction, transformer loading, series-aiding and series-opposing configurations.
Ex. 7-1 Voltage and Current Ratios ............................. 239
Primary and secondary windings. Definition of the turns ratio, step-up and step-down operation. Transformer saturation, voltage and current characteristics.
Ex. 7-2 Transformer Polarity ........................................ 249
Determining the polarity of transformer windings. Connecting windings in series-aiding so that winding voltages add, or in series-opposing so that winding voltages subtract.
Ex. 7-3 Transformer Regulation .................................. 257
Definition of transformer regulation. Determining the voltage regulation of a transformer with varying loads. Inductive and capacitive loading.
Unit 8 Special Transformer Connections ............................... 265
Connecting transformer windings in different ways to obtain special-use transformers. Volt-ampere ratings.
Ex. 8-1 The Autotransformer ....................................... 267
Interconnecting primary and secondary windings of a standard transformer to obtain an autotransformer. Step-up and step-down connections.
Ex. 8-2 Transformers in Parallel .................................. 277
Connecting transformers in parallel to supply greater load power. Measuring the efficiency of parallel-connected transformers.
Ex. 8-3 Distribution Transformers ............................... 285
Introduction to basic characteristics of distribution transformers. The behavior of a distribution transformer under different load conditions.
Unit 9 Three-Phase Transformers ........................................... 293
Operating characteristics of three-phase transformers. The four types of wye and delta connections.
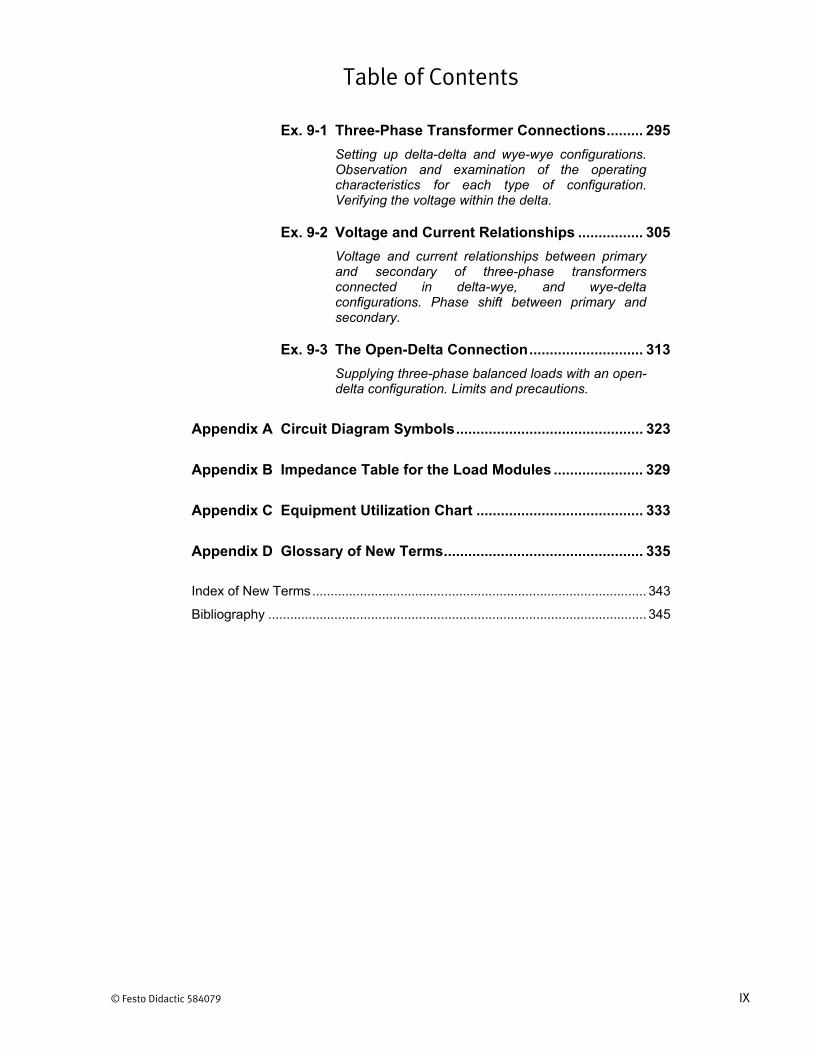
Table of Contents
© Festo Didactic 584079 IX
Ex. 9-1 Three-Phase Transformer Connections ......... 295
Setting up delta-delta and wye-wye configurations. Observation and examination of the operating characteristics for each type of configuration. Verifying the voltage within the delta.
Ex. 9-2 Voltage and Current Relationships ................ 305
Voltage and current relationships between primary and secondary of three-phase transformers connected in delta-wye, and wye-delta configurations. Phase shift between primary and secondary.
Ex. 9-3 The Open-Delta Connection ............................ 313
Supplying three-phase balanced loads with an open-delta configuration. Limits and precautions.
Appendix A Circuit Diagram Symbols .............................................. 323
Appendix B Impedance Table for the Load Modules ...................... 329
Appendix C Equipment Utilization Chart ......................................... 333
Appendix D Glossary of New Terms ................................................. 335
Index of New Terms ........................................................................................... 343
Bibliography ....................................................................................................... 345


© Festo Didactic 584079 XI
Preface
Computer-based teaching technologies are becoming more and more widespread in the field of education, and the Data Acquisition and Control for Electromechanical Systems (LVDAC-EMS), the Data Acquisition and Management for Electromechanical Systems (LVDAM-EMS), and the Simulation Software for Electromechanical Systems (LVSIM®-EMS) are witness to this new approach.
The LVDAC-EMS (or LVDAM-EMS) system is a complete set of measuring instruments that runs on a Pentium-type personal computer under the Microsoft® Windows® operating environment. Computer-based instruments (voltmeters, ammeters, power meters, an oscilloscope, a phasor analyzer, and an harmonic analyzer) provide instructors the opportunity to clearly demonstrate concepts related to electric power technology that, until now, could only be presented using traditional textbook methods and static drawings.
The LVDAC-EMS (or LVDAM-EMS) system uses a customized data acquisition module to interconnect modules of the Electromechanical System with the personal computer. Dedicated software routes the measured values from the data acquisition module to the computer-based instruments that provide all the standard measurements associated with voltage, current, power, and other electrical parameters. However, the system does much more: it provides built-in capabilities for waveform observation and phasor analysis, data storage and graphical representation, as well as programmable meter functions, thereby allowing unimagined possibilities for presenting courseware material.
LVSIM®-EMS is a software that faithfully simulates the Electromechanical System (EMS). Like the LVDAC-EMS (or LVDAM-EMS) system, LVSIM®-EMS runs on a PC-type computer under the Microsoft® Windows® operating environment.
LVSIM®-EMS recreates a three-dimensional classroom laboratory on a computer screen. Using the mouse, students can install an EMS training system in this virtual laboratory, make equipment setups, and perform exercises in the same way as if actual EMS equipment were used. The EMS equipment that can be installed in the virtual laboratory faithfully reproduces the actual EMS equipment included in the Computer-Assisted 0.2-kW Electromechanical Training System (Model 8006) in every detail. As in the actual EMS system, the operation and behavior of the circuits simulated with LVSIM®-EMS can be observed by performing voltage, current, speed, and torque measurements, using the same computer-based instruments as in the LVDAC-EMS (or LVDAM-EMS) system.
The existing EMS courseware has been completely revised and adapted for the LVDAC-EMS (or LVDAM-EMS) system as well as LVSIM®-EMS, and the new series is titled Electrical Power Technology Using Data Acquisition. Exercises have been grouped in two separate manuals: manual 1, titled Power Circuits and Transformers, and manual 2, titled AC/DC Motors and Generators.
Each exercise approaches the subject matter from a practical point of view, and uses a hands-on approach to the study of electrical power technology. Students are guided through step-by-step exercise procedures that confirm concepts and theory presented in the exercise discussion. A conclusion and set of review questions complete each exercise, and a 10-question unit test helps evaluate knowledge gained in the courseware unit.

Preface
XII © Festo Didactic 584079
Do you have suggestions or criticism regarding this manual?
If so, send us an e-mail at [email protected].
The authors and Festo Didactic look forward to your comments.
© Festo Didactic 584079 XIII
About This Manual
The 29 exercises in this manual, Power Circuits and Transformers, provide a foundation for the study of electrical power technology. Completion of these exercises allows students to continue with the second manual, AC/DC Motors and Generators using data acquisition.
This manual is divided into nine units:
Units 1 to 4 provide a basic review of electrical concepts and theory, aswell as highlighting specific details relating to capacitors, inductors andsingle-phase circuits.
Unit 5 introduces and explores the concepts of vectors, phasors, andimpedance, and how they are used in analyzing ac circuit operation.
Units 6 to 9 deal with three-phase circuits, single- and three-phasetransformers, as well as special transformer connections.
The hands-on exercises in this manual can be performed using either the Electromechanical System (EMS system) or the Electromechanical System using Virtual Laboratory Equipment (LVSIM®-EMS). When using the EMS system, you should turn on the computer and start Windows® before each exercise. On the other hand, when using LVSIM®-EMS, you should turn on the computer, start Windows®, and start LVSIM®-EMS before each exercise.
The hands-on exercises guide students through circuit setup and operation, and explore many of the measurement and observation capabilities of the virtual instrumentation system. Much detailed information about circuit parameters (voltage and current levels, waveforms, phase angles, etc.) can be visualized with the virtual instruments, and students are encouraged to fully explore system capabilities.
Various symbols are used in many of the circuit diagrams given in the exercises. Each symbol is a functional representation of a device used in Electrical Power Technology. The use of these symbols greatly simplifies the circuit diagrams by reducing the number of interconnections shown, and makes it easier to understand circuit operation. Appendix A lists the symbols used, the name of the device which each symbol represents, and a diagram showing the equipment and connections required to obtain the device.
The exercises in this manual can be carried out with ac network voltages of 120 V, 220 V, and 240 V. The component values used in the different circuits often depend on the ac line voltage. For this reason, components in the circuit diagrams are identified where necessary with letters and subscripts. A table accompanying the circuit diagram indicates the component value required for each ac network voltage (120 V, 220 V, 240 V).
Appendix B provides a table giving the usual impedance values that can be obtained with each of the 120-V, 220-V, and 240-V versions of the EMS load modules. Finally, Appendix C provides a chart outlining the exact equipment required for each exercise.

About This Manual
XIV © Festo Didactic 584079
Safety considerations
Safety symbols that may be used in this manual and on the equipment are listed in the Safety Symbols table at the beginning of the manual.
Safety procedures related to the tasks that you will be asked to perform are indicated in each exercise.
Make sure that you are wearing appropriate protective equipment when performing the tasks. You should never perform a task if you have any reason to think that a manipulation could be dangerous for you or your teammates.

© Festo Didactic 584079 1
When you have completed this unit, you will be able to demonstrate and apply basic concepts for solving simple electric circuits. You will also be able to measure circuit voltages and currents using the Data Acquisition and Control (LVDAC-EMS) [or the Data Acquisition and Management (LVDAM-EMS) system.]
The study of electricity and electric circuits revolves around just a few fundamental laws, principles, key words and terms. The symbols used to represent them are universal and form the basic language of people working in the electrical field. It is therefore important to learn the symbols and terminology. Whether one is talking about voltage ( ), current ( ), resistance ( ), power ( ), or other electrical concepts, they are all represented in a compact way using different symbols. Appendix A lists the symbols and terms used in the circuit diagrams of this manual.
In order to better understand the relationship between voltage, current and resistance, a basic understanding of the nature of electricity is useful. Electricity is just another kind of energy. Present in various forms, such as atomic, chemical, thermal, hydraulic, etc., energy in one form can be transformed to another form. For example, the chemical energy of a dry-cell battery produces electricity to power everyday electronic devices.
Electricity is intimately linked to the atomic structure of matter and one of the atomic particles present in matter is the electron. It has a negative electric charge and orbits around the atomic nucleus. Since the nucleus has a positive electric charge, it attracts the negatively charged electron and holds it in place. The further the electron is from the nucleus, the lower the atomic force attracting it. Certain materials, called conductors, have electrons in their outer orbit that can be easily dislodged using external means like heating, or applying an electric field. The electrons thus removed from their orbit become free electrons and move between atoms. This leads to the flow of electric current, which is simply the movement of many electrons at the same time. Figure 1-1a to d shows simplified representations of the electric field around a single positive electric charge, around a single negative electric charge, between electric charges of opposite polarities, and between electric charges of the same polarity.
Fundamentals for Electrical Power Technology
Unit 1
UNIT OBJECTIVE
DISCUSSION OF
FUNDAMENTALS
Unit 1 – Fundamentals for Electrical Power Technology Discussion of Fundamentals
2 © Festo Didactic 584079
Figure 1-1. Simplified representations of electric fields.
The greater the electric field, the greater the number of electrons that move at the same time, and the greater the electric current. The magnitude of the electric field is measured between two points of the field, and is referred to as potential difference, or voltage. The idea of potential difference is similar to that for hydraulic pressure. A water dam 300 meters high produces a higher pressure on water flowing in a pipe than a dam which is only 30 meters high. This is because potential energy increases when height increases. Similarly, a voltage of 100 V therefore creates a greater electrical pressure on the electrons (so that they move) than a voltage of 10 V. Some of the various sources of electricity that produce different levels of electrical pressure, or voltage, are mechanical generators and alternators, lead-acid and dry-cell batteries, and photoelectric cells.
Unit 1 – Fundamentals for Electrical Power Technology Discussion of Fundamentals
© Festo Didactic 584079 3
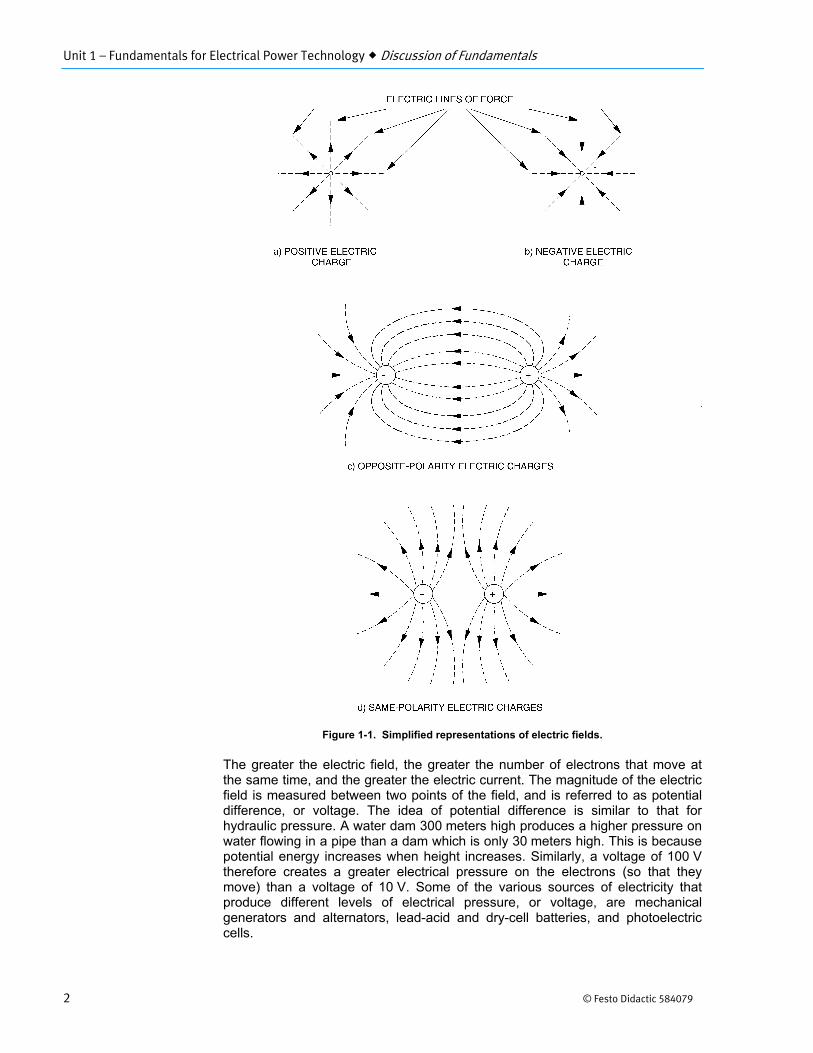
As mentioned previously in this discussion, it is easy to dislodge electrons in materials that have electrons in the outer orbit of atoms, and thereby, create an electric current. Conversely, it is difficult to dislodge electrons in materials whose electrons are all located in the inner orbits of atoms, and thereby, create an electric current. Therefore, the opposition to electric current flow is different from one material to another. This opposition is referred to as resistance. Copper, aluminum, and gold, although considered good electrical conductors, do offer some resistance, while ceramic, plastic, and rubber, which are considered good insulators, have a great resistance. Figure 1-2 shows the simplified atomic structure of two conductors: copper and aluminium.
A German physicist, George Simon Ohm (1787-1854), discovered that the ratio of voltage to current is constant for a given metal conductor of specified length and cross-sectional area. This ratio is the resistance and is expressed in units of ohms (Ω), in his honour.
Figure 1-2. Conducting materials have electrons in the outer orbits of their atoms.
Early experimenters in electricity recognized that electric current was the movement of charges along a conductor. The direction of current flow was not known and was arbitrarily chosen to be from a positively charged body to a negatively charged body (positive to negative). This convention has been so firmly established that it is now almost universal. Thus, the conventional, or positive direction of current flow, is taken to be from positive to negative, even though the direction of electron flow is from negative to positive. In this manual, conventional current flow from a positive terminal to a negative terminal is used.
The basic principles used in the study of electricity are the Ohm's law and the Kirchhoff's voltage and current laws. These laws are dealt with in this unit. You will use these laws to calculate voltages, currents, resistances, etc. in series circuits as well as in parallel circuits.

© Festo Didactic 584079 5
When you have completed this exercise, you will be able to measure circuit voltages and currents, and demonstrate Ohm's Law using measurements of these circuit parameters.
Ohm's law is often referred to as the foundation of circuit analysis and is expressed by the following formula:
where is the current that flows through the electric device, expressed in amperes (A).
is the potential difference, or voltage, across an electric device, expressed in volts (V).
is the resistance of the electric device, expressed in ohms (Ω).
This equation simply states that a current flows through an electric device having a resistance when a voltage is applied across this device. Two useful expressions can be derived from Ohm's law, namely:
and
The basic instrument for the measurement of resistance is the ohmmeter. It generally contains a dc voltage source (usually a battery), a current meter, and a range switch to select internal calibration resistors. The meter scale is calibrated in terms of the resistance value that corresponds to a given current. The unknown resistor is placed across the terminals of the ohmmeter and the resistance value is read from the meter scale or display. The ohm (Ω) is the measurement unit for resistance.
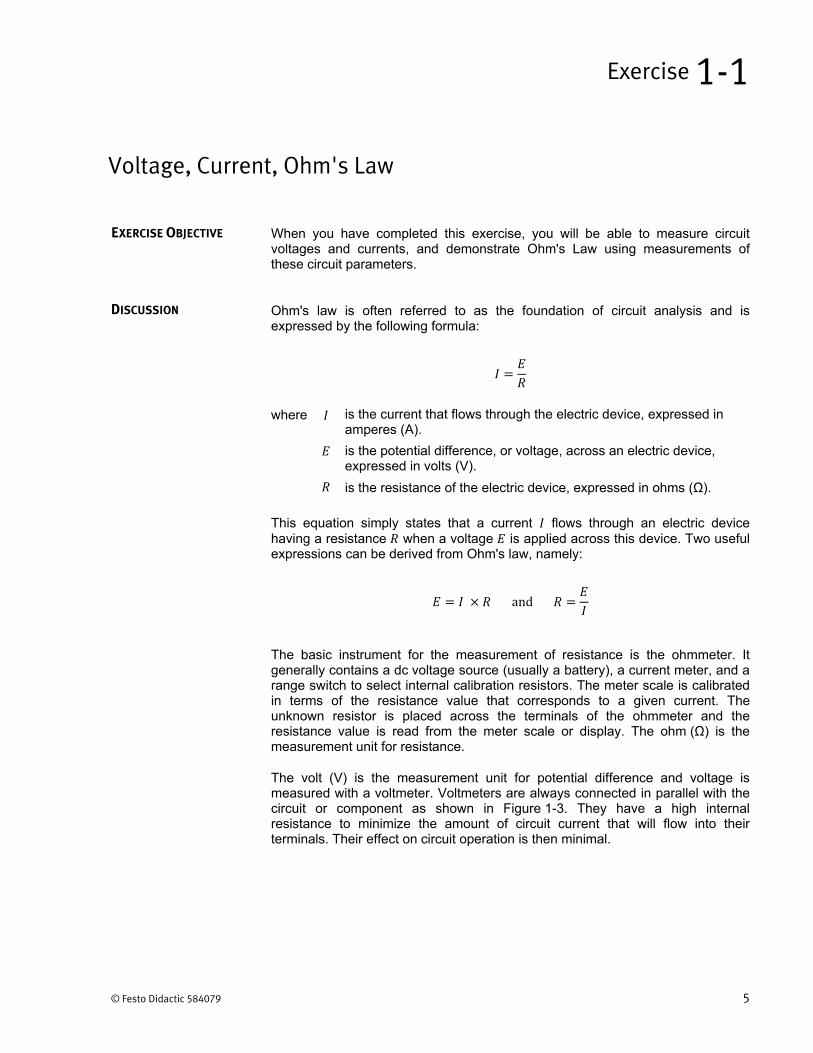
The volt (V) is the measurement unit for potential difference and voltage is measured with a voltmeter. Voltmeters are always connected in parallel with the circuit or component as shown in Figure 1-3. They have a high internal resistance to minimize the amount of circuit current that will flow into their terminals. Their effect on circuit operation is then minimal.
Voltage, Current, Ohm's Law
Exercise 1-1
EXERCISE OBJECTIVE
DISCUSSION
Ex. 1-1 – Voltage, Current, Ohm's Law Discussion
6 © Festo Didactic 584079
Figure 1-3. Measuring voltage with a voltmeter.
Note that the polarities marked on standard analog meter terminals must be observed to obtain a positive (up-scale) reading. If the connections are reversed, the reading will be negative (the pointer will deflect in the negative direction).
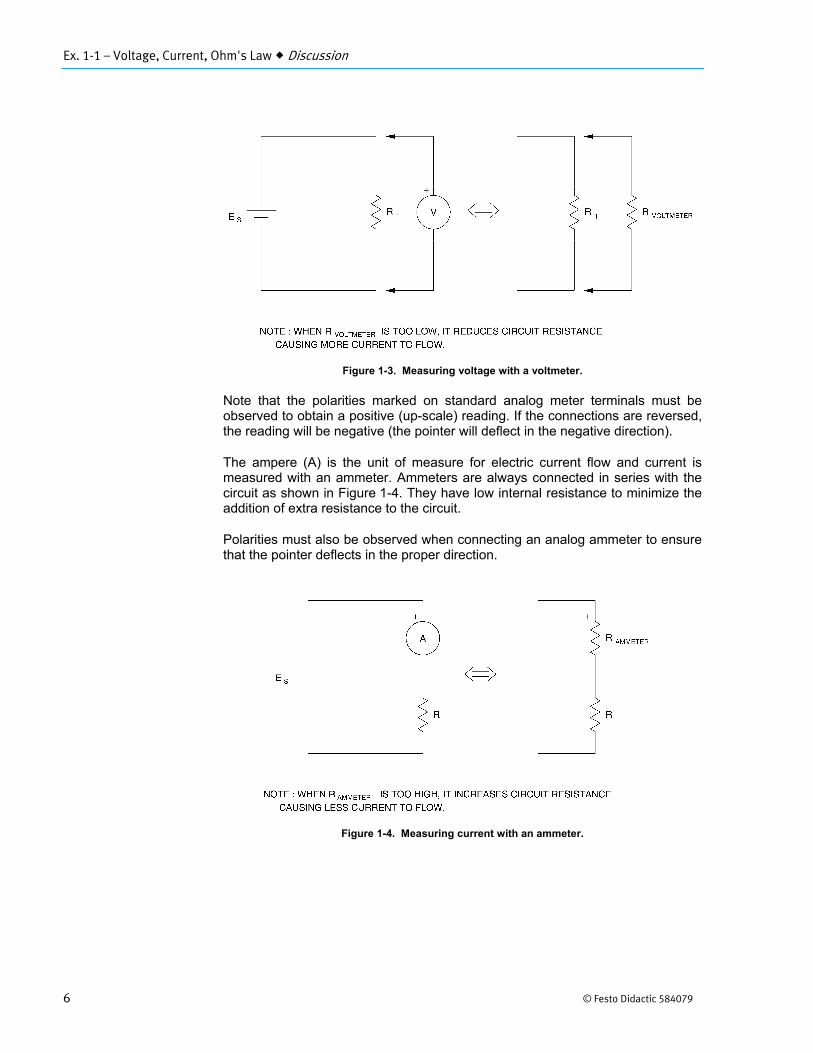
The ampere (A) is the unit of measure for electric current flow and current is measured with an ammeter. Ammeters are always connected in series with the circuit as shown in Figure 1-4. They have low internal resistance to minimize the addition of extra resistance to the circuit.
Polarities must also be observed when connecting an analog ammeter to ensure that the pointer deflects in the proper direction.
Figure 1-4. Measuring current with an ammeter.
Ex. 1-1 – Voltage, Current, Ohm's Law Procedure
© Festo Didactic 584079 7
EQUIPMENT REQUIRED
Refer to the Equipment Utilization Chart in Appendix C to obtain the list of equipment required for this exercise.
High voltages are present in this laboratory exercise. Do not make or modify any banana jack connections with the power on unless otherwise specified.
a If you are performing this exercise using LVSIM-EMS, skip manipulation 1and 2.
1. Use an ohmmeter to check the resistance of one pair of voltage inputterminals (E1, E2, E3) on the data acquisition module.
Ω
2. Use an ohmmeter to check the resistance of one pair of current inputterminals (I1,I2,I3) on the data acquisition module.
Ω
3. Does the voltmeter input have a much higher resistance than the currentinput? Why?
4. Install the Power Supply, data acquisition module, and Resistive Loadmodule in the EMS Workstation.
5. Make sure the main power switch of the Power Supply is set to the O (OFF)position and the voltage control knob is turned fully counterclockwise (ccw).Make sure that the Power Supply is connected to a three-phase wallreceptacle.
6. Make sure that the data acquisition module is connected to a USB port of thecomputer.
Connect the POWER INPUT of the data acquisition module to the24 V - AC output of the Power Supply. Set the 24 V - AC power switch to theI (ON) position.
PROCEDURE
Ex. 1-1 – Voltage, Current, Ohm's Law Procedure
8 © Festo Didactic 584079
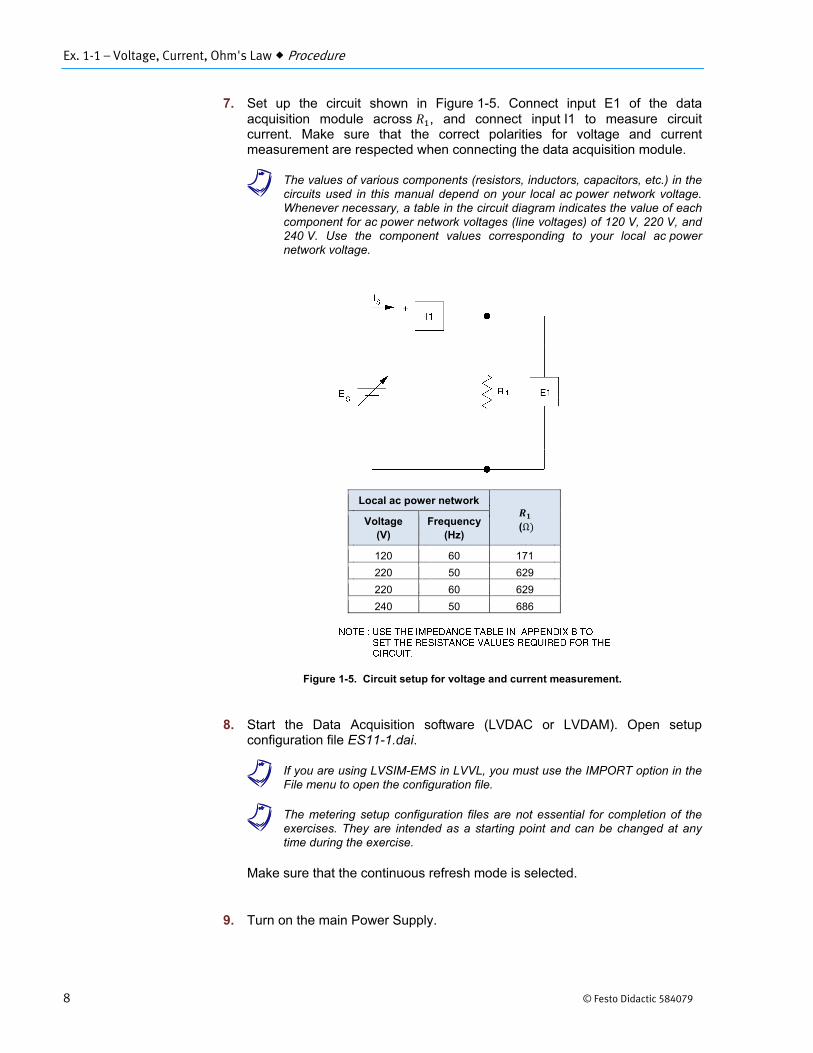
7. Set up the circuit shown in Figure 1-5. Connect input E1 of the dataacquisition module across , and connect input I1 to measure circuitcurrent. Make sure that the correct polarities for voltage and currentmeasurement are respected when connecting the data acquisition module.
a The values of various components (resistors, inductors, capacitors, etc.) in thecircuits used in this manual depend on your local ac power network voltage.Whenever necessary, a table in the circuit diagram indicates the value of eachcomponent for ac power network voltages (line voltages) of 120 V, 220 V, and240 V. Use the component values corresponding to your local ac powernetwork voltage.
Figure 1-5. Circuit setup for voltage and current measurement.
8. Start the Data Acquisition software (LVDAC or LVDAM). Open setupconfiguration file ES11-1.dai.
a If you are using LVSIM-EMS in LVVL, you must use the IMPORT option in theFile menu to open the configuration file.
a The metering setup configuration files are not essential for completion of theexercises. They are intended as a starting point and can be changed at anytime during the exercise.
Make sure that the continuous refresh mode is selected.
9. Turn on the main Power Supply.
Local ac power network
(Ω Voltage
(V) Frequency
(Hz)
120 60 171
220 50 629
220 60 629
240 50 686
Ex. 1-1 – Voltage, Current, Ohm's Law Procedure
© Festo Didactic 584079 9
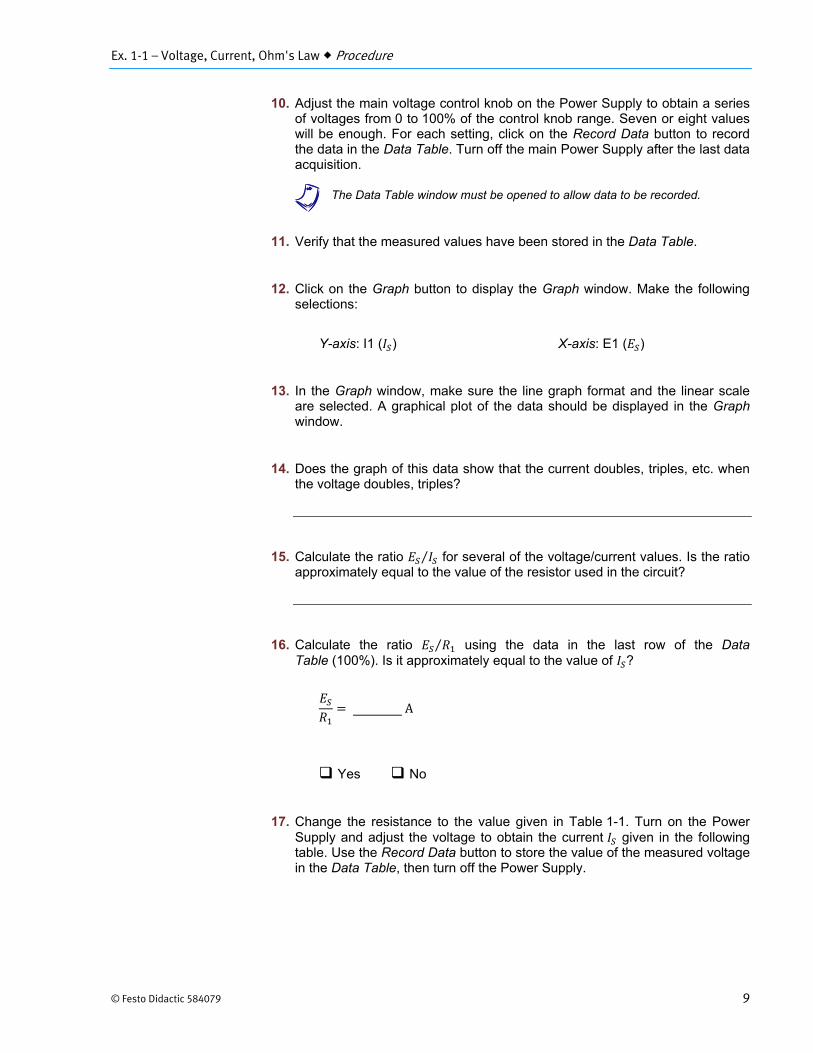
10. Adjust the main voltage control knob on the Power Supply to obtain a seriesof voltages from 0 to 100% of the control knob range. Seven or eight valueswill be enough. For each setting, click on the Record Data button to recordthe data in the Data Table. Turn off the main Power Supply after the last dataacquisition.
a The Data Table window must be opened to allow data to be recorded.
11. Verify that the measured values have been stored in the Data Table.
12. Click on the Graph button to display the Graph window. Make the followingselections:
Y-axis: I1 ( ) X-axis: E1 ( )
13. In the Graph window, make sure the line graph format and the linear scaleare selected. A graphical plot of the data should be displayed in the Graphwindow.
14. Does the graph of this data show that the current doubles, triples, etc. whenthe voltage doubles, triples?
15. Calculate the ratio ⁄ for several of the voltage/current values. Is the ratioapproximately equal to the value of the resistor used in the circuit?
16. Calculate the ratio ⁄ using the data in the last row of the DataTable (100%). Is it approximately equal to the value of ?
A
Yes No
17. Change the resistance to the value given in Table 1-1. Turn on the PowerSupply and adjust the voltage to obtain the current given in the followingtable. Use the Record Data button to store the value of the measured voltagein the Data Table, then turn off the Power Supply.
Ex. 1-1 – Voltage, Current, Ohm's Law Procedure
10 © Festo Didactic 584079
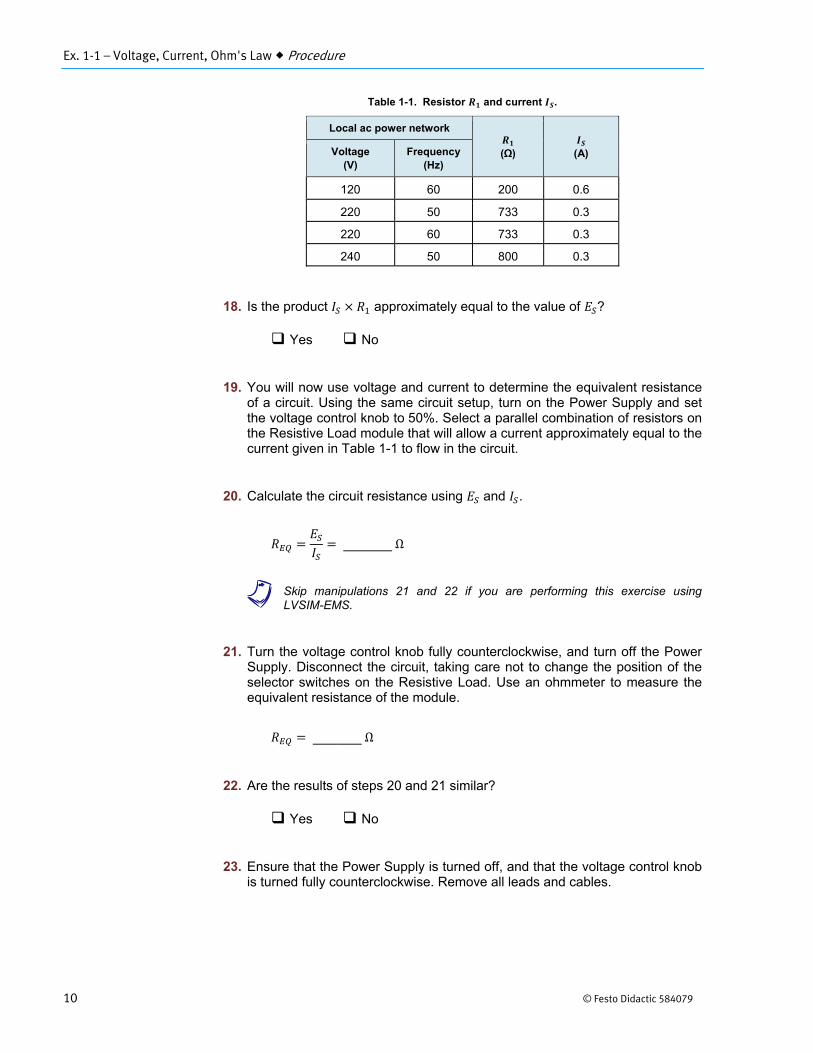
Table 1-1. Resistor and current .
Local ac power network
(Ω)
(A) Voltage (V)
Frequency (Hz)
120 60 200 0.6
220 50 733 0.3
220 60 733 0.3
240 50 800 0.3
18. Is the product approximately equal to the value of ?
Yes No
19. You will now use voltage and current to determine the equivalent resistanceof a circuit. Using the same circuit setup, turn on the Power Supply and setthe voltage control knob to 50%. Select a parallel combination of resistors onthe Resistive Load module that will allow a current approximately equal to thecurrent given in Table 1-1 to flow in the circuit.
20. Calculate the circuit resistance using and .
Ω
a Skip manipulations 21 and 22 if you are performing this exercise usingLVSIM-EMS.
21. Turn the voltage control knob fully counterclockwise, and turn off the PowerSupply. Disconnect the circuit, taking care not to change the position of theselector switches on the Resistive Load. Use an ohmmeter to measure theequivalent resistance of the module.
Ω
22. Are the results of steps 20 and 21 similar?
Yes No
23. Ensure that the Power Supply is turned off, and that the voltage control knobis turned fully counterclockwise. Remove all leads and cables.
Ex. 1-1 – Voltage, Current, Ohm's Law Conclusion
© Festo Didactic 584079 11
In this exercise, you used voltage and current measurements to demonstrate Ohm's law, and you determined unknown voltage, current, and equivalent resistance values. Also, you saw that Ohm's law can be used to predict circuit values for voltage, current, and resistance.
1. A voltmeter with an internal resistance of 100 000 ohms has less effect oncircuit operation than one with an internal resistance of 1 000 000 ohms?
a. True.b. False.c. It depends on the circuit voltage.d. There is no difference.
2. An ammeter has an internal resistance equal to the equivalent resistance ofthe circuit in which measurements are to be taken. How will this affect thecurrent?
a. There will be no effect.b. The current will decrease by half.c. The current will double.d. The current will triple.
3. The term potential difference refers to the electrical pressure of a voltagesource that causes current flow in a circuit.
a. True.b. False.c. True only in dc circuits.d. None of the above.
4. What is the resistance of a circuit in which 2.5 A flows when a dc voltage of120 V is applied?
a. 300 Ωb. 48 Ωc. 0.03 Ωd. 480 Ω
5. What voltage applied to a 15-Ω resistor will cause 3 A of current to flow?
a. 5 Vb. 0.2 Vc. 45 Vd. 50 V
CONCLUSION
REVIEW QUESTIONS

© Festo Didactic 584079 13
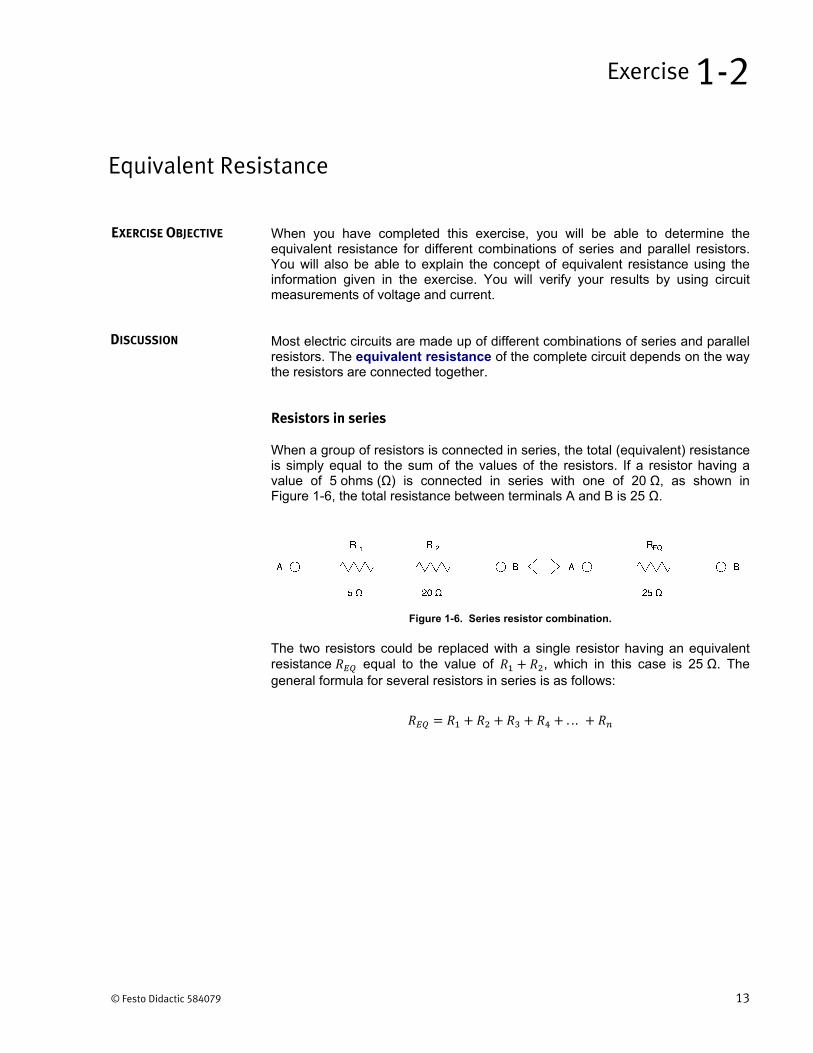
When you have completed this exercise, you will be able to determine the equivalent resistance for different combinations of series and parallel resistors. You will also be able to explain the concept of equivalent resistance using the information given in the exercise. You will verify your results by using circuit measurements of voltage and current.
Most electric circuits are made up of different combinations of series and parallel resistors. The equivalent resistance of the complete circuit depends on the way the resistors are connected together.
Resistors in series
When a group of resistors is connected in series, the total (equivalent) resistance is simply equal to the sum of the values of the resistors. If a resistor having a value of 5 ohms (Ω) is connected in series with one of 20 Ω, as shown in Figure 1-6, the total resistance between terminals A and B is 25 Ω.
Figure 1-6. Series resistor combination.
The two resistors could be replaced with a single resistor having an equivalent resistance equal to the value of , which in this case is 25 Ω. The general formula for several resistors in series is as follows:
. . .
Equivalent Resistance
Exercise 1-2
EXERCISE OBJECTIVE
DISCUSSION
Ex. 1-2 – Equivalent Resistance Discussion
14 © Festo Didactic 584079
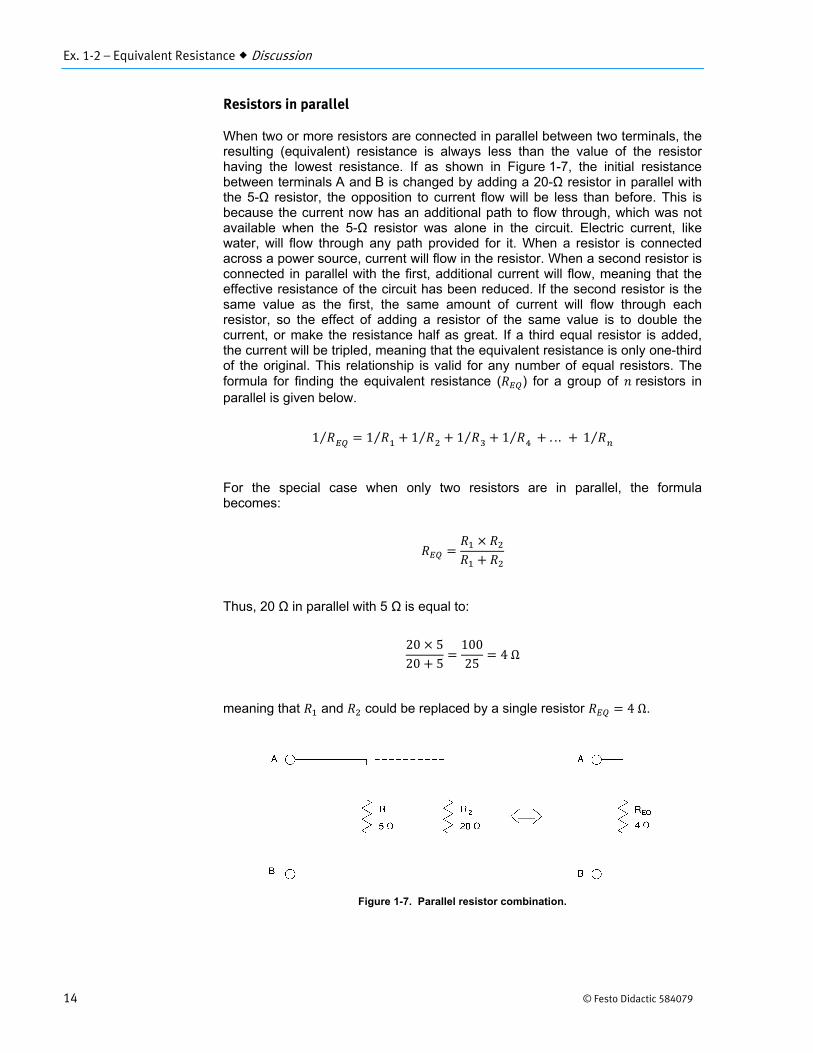
Resistors in parallel
When two or more resistors are connected in parallel between two terminals, the resulting (equivalent) resistance is always less than the value of the resistor having the lowest resistance. If as shown in Figure 1-7, the initial resistance between terminals A and B is changed by adding a 20-Ω resistor in parallel with the 5-Ω resistor, the opposition to current flow will be less than before. This is because the current now has an additional path to flow through, which was not available when the 5-Ω resistor was alone in the circuit. Electric current, like water, will flow through any path provided for it. When a resistor is connected across a power source, current will flow in the resistor. When a second resistor is connected in parallel with the first, additional current will flow, meaning that the effective resistance of the circuit has been reduced. If the second resistor is the same value as the first, the same amount of current will flow through each resistor, so the effect of adding a resistor of the same value is to double the current, or make the resistance half as great. If a third equal resistor is added, the current will be tripled, meaning that the equivalent resistance is only one-third of the original. This relationship is valid for any number of equal resistors. The formula for finding the equivalent resistance ( ) for a group of resistors in parallel is given below.
1⁄ 1⁄ 1⁄ 1⁄ 1⁄ . . . 1⁄
For the special case when only two resistors are in parallel, the formula becomes:
Thus, 20 Ω in parallel with 5 Ω is equal to:
20 520 5
10025
4 Ω
meaning that and could be replaced by a single resistor 4Ω.
Figure 1-7. Parallel resistor combination.
Ex. 1-2 – Equivalent Resistance Procedure
© Festo Didactic 584079 15
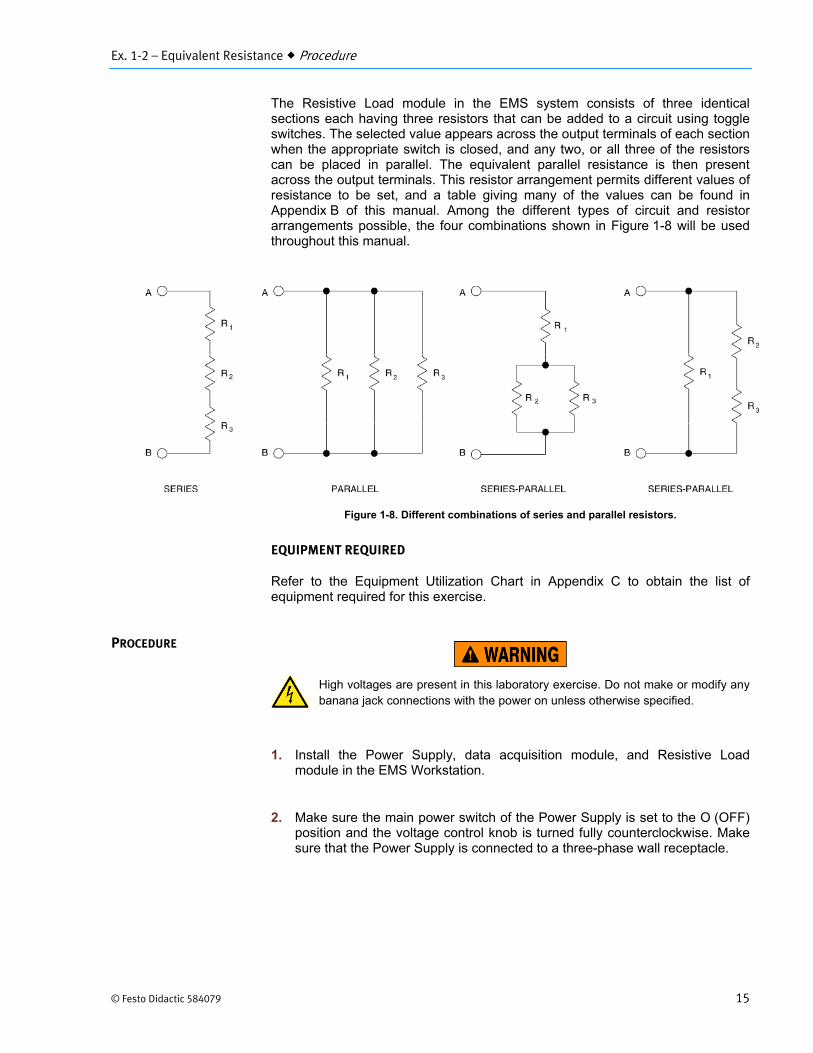
The Resistive Load module in the EMS system consists of three identical sections each having three resistors that can be added to a circuit using toggle switches. The selected value appears across the output terminals of each section when the appropriate switch is closed, and any two, or all three of the resistors can be placed in parallel. The equivalent parallel resistance is then present across the output terminals. This resistor arrangement permits different values of resistance to be set, and a table giving many of the values can be found in Appendix B of this manual. Among the different types of circuit and resistor arrangements possible, the four combinations shown in Figure 1-8 will be used throughout this manual.
Figure 1-8. Different combinations of series and parallel resistors.
EQUIPMENT REQUIRED
Refer to the Equipment Utilization Chart in Appendix C to obtain the list of equipment required for this exercise.
High voltages are present in this laboratory exercise. Do not make or modify anybanana jack connections with the power on unless otherwise specified.
1. Install the Power Supply, data acquisition module, and Resistive Loadmodule in the EMS Workstation.
2. Make sure the main power switch of the Power Supply is set to the O (OFF)position and the voltage control knob is turned fully counterclockwise. Makesure that the Power Supply is connected to a three-phase wall receptacle.
PROCEDURE
Ex. 1-2 – Equivalent Resistance Procedure
16 © Festo Didactic 584079
3. Make sure that the data acquisition module is connected to a USB port of thecomputer.
Connect the POWER INPUT of the data acquisition module to the24 V - AC output of the Power Supply. Set the 24 V - AC power switch to theI (ON) position.
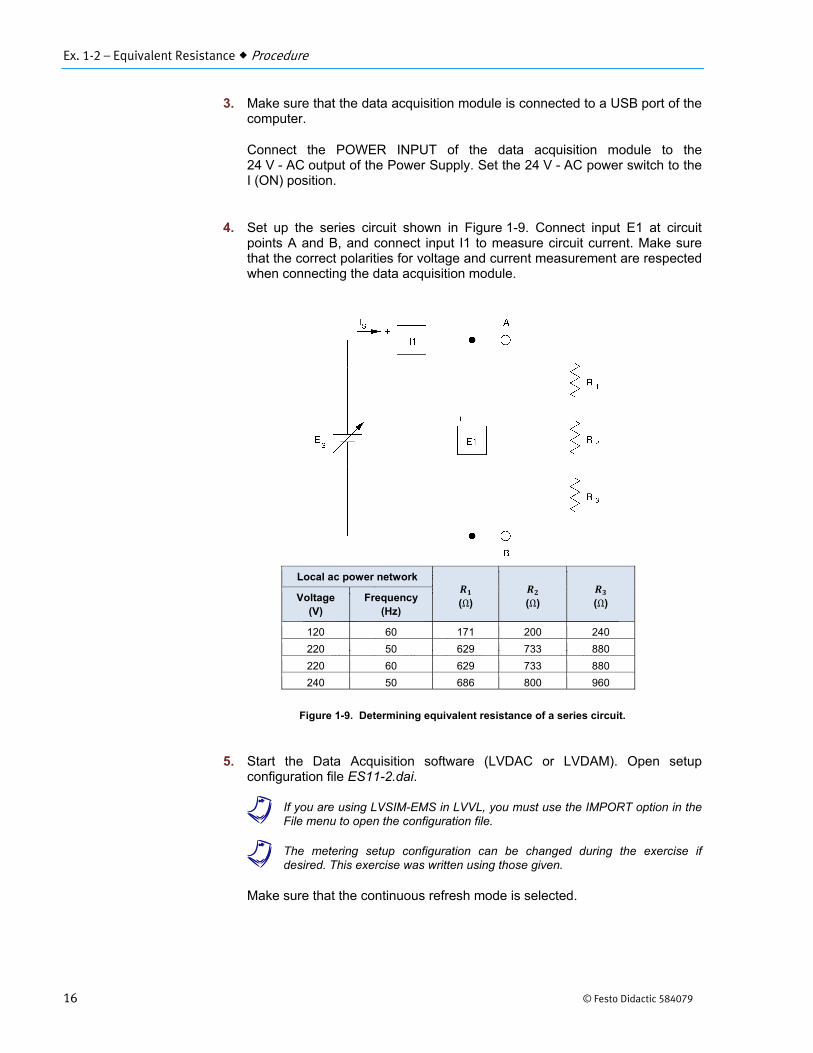
4. Set up the series circuit shown in Figure 1-9. Connect input E1 at circuitpoints A and B, and connect input I1 to measure circuit current. Make surethat the correct polarities for voltage and current measurement are respectedwhen connecting the data acquisition module.
Figure 1-9. Determining equivalent resistance of a series circuit.
5. Start the Data Acquisition software (LVDAC or LVDAM). Open setupconfiguration file ES11-2.dai.
a If you are using LVSIM-EMS in LVVL, you must use the IMPORT option in theFile menu to open the configuration file.
a The metering setup configuration can be changed during the exercise ifdesired. This exercise was written using those given.
Make sure that the continuous refresh mode is selected.
Local ac power network
(Ω)
(Ω)
(Ω) Voltage(V)
Frequency(Hz)
120 60 171 200 240
220 50 629 733 880
220 60 629 733 880
240 50 686 800 960
Ex. 1-2 – Equivalent Resistance Procedure
© Festo Didactic 584079 17
6. Turn on the main Power Supply and adjust the voltage control knob to 100%.From the Data Table application, click the Record Data button to store thevalues of the measured circuit voltage and current. Turn off the PowerSupply.
7. Calculate the equivalent resistance for the series circuit of Figure 1-9.
Ω
8. Calculate using the values of the measured voltage and current.
Ω
a If you are performing this exercise using LVSIM-EMS, skip the nextmanipulation and go directly to manipulation 10.
9. Make sure that the Power Supply is turned off and use an ohmmeter tomeasure the equivalent resistance of the circuit.
Ω
10. Are the results of steps 7, 8, and 9 approximately the same?
Yes No
11. Set up the parallel circuit shown in Figure 1-10. Connect input E1 at circuitpoints A and B, and connect input I1 to measure circuit current. Make surethat the correct polarities for voltage and current measurement are respectedwhen connecting the data acquisition module.
Ex. 1-2 – Equivalent Resistance Procedure
18 © Festo Didactic 584079
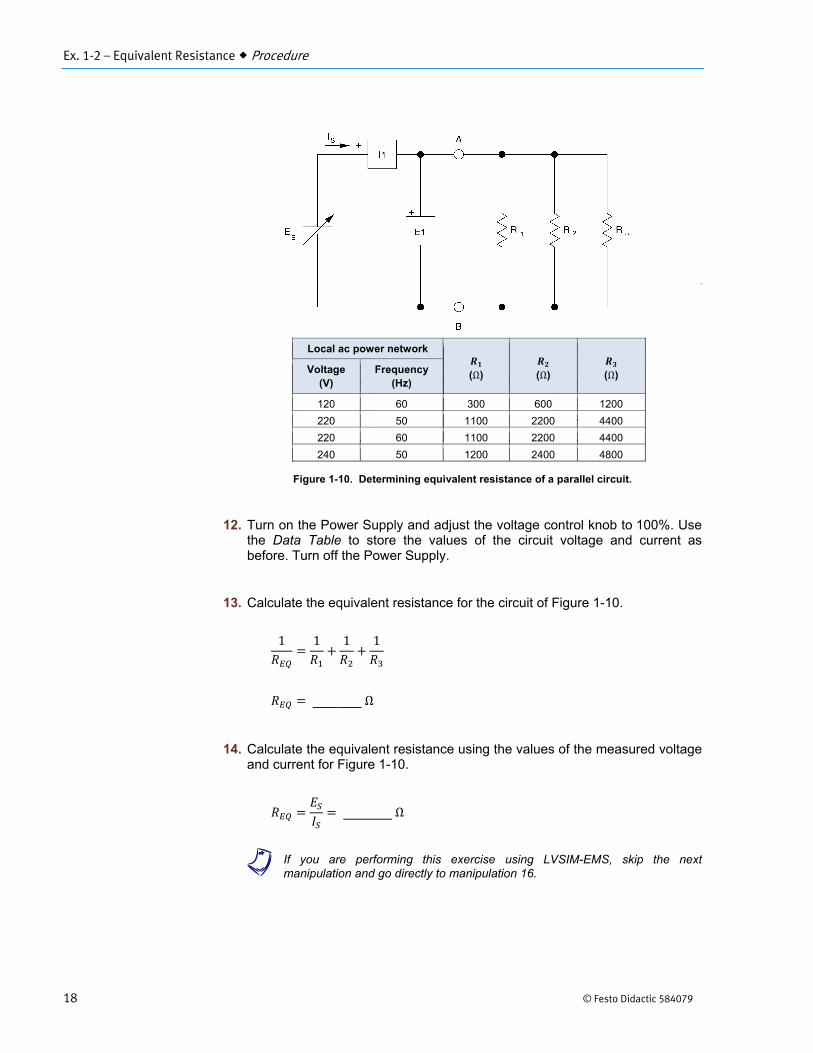
Figure 1-10. Determining equivalent resistance of a parallel circuit.
12. Turn on the Power Supply and adjust the voltage control knob to 100%. Usethe Data Table to store the values of the circuit voltage and current asbefore. Turn off the Power Supply.
13. Calculate the equivalent resistance for the circuit of Figure 1-10.
1 1 1 1
Ω
14. Calculate the equivalent resistance using the values of the measured voltageand current for Figure 1-10.
Ω
a If you are performing this exercise using LVSIM-EMS, skip the nextmanipulation and go directly to manipulation 16.
Local ac power network
(Ω)
(Ω) (Ω) Voltage(V)
Frequency(Hz)
120 60 300 600 1200
220 50 1100 2200 4400
220 60 1100 2200 4400
240 50 1200 2400 4800
Ex. 1-2 – Equivalent Resistance Procedure
© Festo Didactic 584079 19
15. Make sure that the Power Supply is turned off and use an ohmmeter tomeasure the equivalent resistance of the circuit.
Ω
16. Are the results of steps 13, 14, and 15 approximately the same?
Yes No
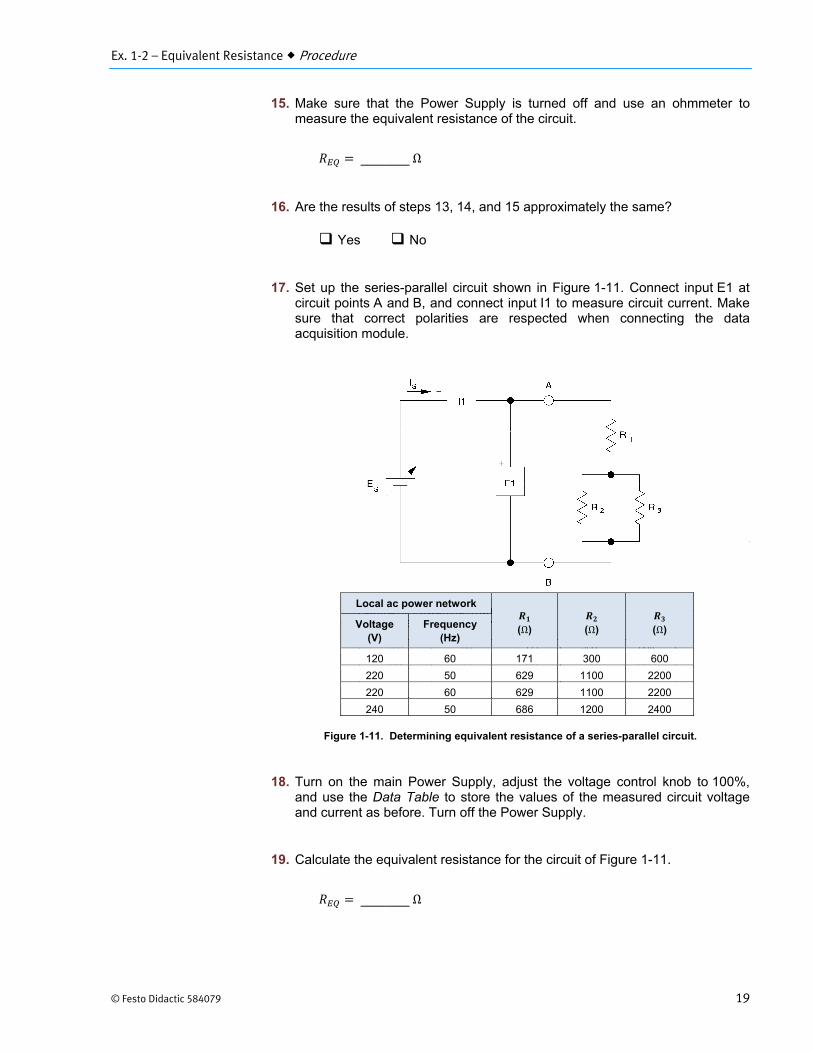
17. Set up the series-parallel circuit shown in Figure 1-11. Connect input E1 atcircuit points A and B, and connect input I1 to measure circuit current. Makesure that correct polarities are respected when connecting the dataacquisition module.
Figure 1-11. Determining equivalent resistance of a series-parallel circuit.
18. Turn on the main Power Supply, adjust the voltage control knob to 100%,and use the Data Table to store the values of the measured circuit voltageand current as before. Turn off the Power Supply.
19. Calculate the equivalent resistance for the circuit of Figure 1-11.
Ω
Local ac power network
(Ω) (Ω) (Ω) Voltage(V)
Frequency(Hz)
120 60 171 300 600
220 50 629 1100 2200
220 60 629 1100 2200
240 50 686 1200 2400
Ex. 1-2 – Equivalent Resistance Procedure
20 © Festo Didactic 584079
20. Calculate the equivalent resistance using the values of the measured voltageand current for Figure 1-11.
Ω
a If you are performing this exercise using LVSIM-EMS, skip the nextmanipulation and go directly to manipulation 22.
21. Make sure that the Power Supply is turned off and use an ohmmeter tomeasure the equivalent resistance of the circuit.
Ω
22. Are the results of steps 19, 20, and 21 the same?
Yes No
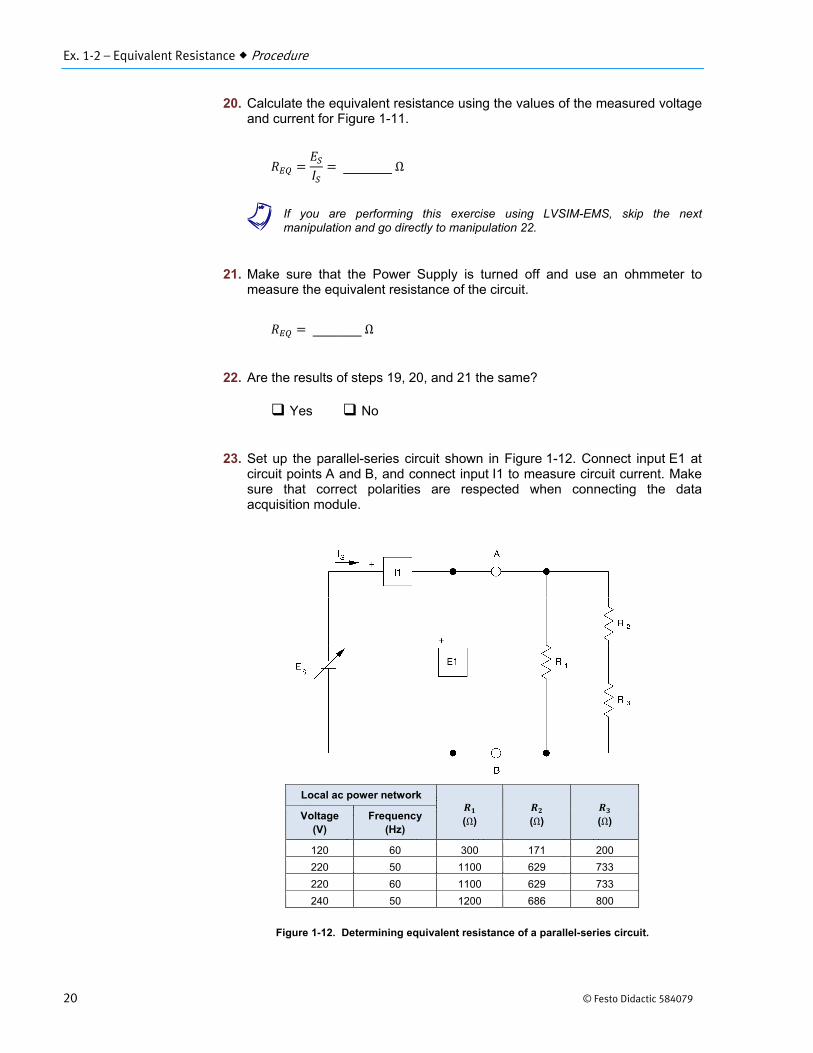
23. Set up the parallel-series circuit shown in Figure 1-12. Connect input E1 atcircuit points A and B, and connect input I1 to measure circuit current. Makesure that correct polarities are respected when connecting the dataacquisition module.
.
Figure 1-12. Determining equivalent resistance of a parallel-series circuit.
Local ac power network
(Ω) (Ω) (Ω) Voltage(V)
Frequency(Hz)
120 60 300 171 200
220 50 1100 629 733
220 60 1100 629 733
240 50 1200 686 800

Ex. 1-2 – Equivalent Resistance Procedure
© Festo Didactic 584079 21
24. Turn on the Power Supply, adjust the voltage control knob to 100%, and usethe Data Table to store the values of the measured circuit voltage andcurrent as before. Turn off the Power Supply.
25. Calculate the equivalent resistance for the circuit of Figure 1-12.
Ω
26. Calculate the equivalent resistance using the values of the measured voltageand current for Figure 1-12.
Ω
a If you are performing this exercise using LVSIM-EMS, skip the nextmanipulation and go directly to step 28.
27. Make sure that the Power Supply is turned off and use an ohmmeter tomeasure the equivalent resistance of the circuit.
Ω
28. Are the results of steps 25, 26, and 27 the same?
Yes No
29. Ensure that the Power Supply is turned off, and that the voltage control knobis turned fully counterclockwise. Remove all leads and cables.
Ex. 1-2 – Equivalent Resistance Conclusion
22 © Festo Didactic 584079
In this exercise, you determined the equivalent resistance for different combinations of resistors by using the formulas for series and parallel equivalent resistance. You also used measurements of circuit voltages and currents to find equivalent circuit resistance, and were able to compare your calculations with actual ohmmeter measurements.
1. What is the formula for finding the equivalent resistance of a series circuit?
a. 1 1⁄ 1⁄ 1⁄ 1⁄ . . . 1⁄⁄b. ⁄c. 1⁄ 1⁄ 1⁄ 1⁄ . . . 1⁄d. . . .
2. What formula is used to find the equivalent resistance of a parallel circuit?
a. 1⁄ 1⁄ 1⁄ 1⁄ . . . 1⁄b. ⁄c. 1 1⁄ 1⁄ 1⁄ 1⁄ . . . 1⁄⁄d. . . .
3. When each of the three resistors in Figure 1-10 has a value of 100 Ω, theequivalent resistance is
a. 300Ω.b. 1/3Ω.c. 33.3Ω.d. impossible to determine.
4. When a resistor of 100 Ω is connected across points A and B in Figure 1-11,the equivalent resistance of the resulting circuit is
a. greater than before.b. less than before.c. the same as before.d. impossible to determine.
5. The equivalent resistance of a circuit with one hundred 100-Ω resistors allconnected in parallel combined with a series resistor of 1 Ω is
a. 100Ω.b. 10000Ω.c. 1 100⁄ 100Ω.d. 2Ω.
CONCLUSION
REVIEW QUESTIONS
© Festo Didactic 584079 23
When you have completed this exercise, you will be able to determine the power dissipated in a dc circuit. You will verify power calculations using voltage and current measurements.
A power source in an electric circuit is used to supply energy to a load. The load uses this energy to perform some useful function or work. In electricity, work is performed by the movement of electrons and power is the rate of doing work. A voltage of one volt producing one ampere of current flow through a resistor of one ohm equals one watt of power. In dc circuits, the power supplied to a load is always equal to the product of the dc voltage across the load and the dc current through the load.
This fact, along with the conservation of energy law, allows us to conclude that the power dissipated by a combination of several resistors in a circuit is equal to the total power supplied by the source. The total power can be obtained by adding the individual powers dissipated by each resistor.
When electrical energy is supplied to a resistor, it is immediately converted to heat, and the resistor heats up. The more power supplied to the resistor, the hotter it will become, until a point is reached where the resistor or nearby components burn out. In order to maintain acceptable temperatures, resistors having to dissipate large amounts of power are made physically large, while those dissipating small amounts are physically smaller. It is for this reason that the physical size of a resistor depends almost entirely on the power it has to dissipate and not its resistance value. That is why 150-W lamps are physically larger than 25-W lamps. The increased size allows better cooling both by convection and by radiation.
The formula for calculating power in any two-terminal device is given below.
where is the power in the device, expressed in watts (W).
is the voltage across the device, expressed in volts (V).
is the current flowing through the device, expressed in amperes (A).
Power in DC Circuits
Exercise 1-3
EXERCISE OBJECTIVE
DISCUSSION
Ex. 1-3 – Power in DC Circuits Procedure
24 © Festo Didactic 584079
Other useful equations can be derived from the formula for calculating power, including the equations below.
and
Since voltage and current are related to resistance through Ohm's Law, the formula for calculating power in any two-terminal device can be written in terms of either the current or the voltage.
Substituting for gives:
Substituting ⁄ for gives:
Therefore, power in a resistor can be calculated using the voltage and current related to the resistor or the value of resistance and either the voltage or the current.
EQUIPMENT REQUIRED
Refer to the Equipment Utilization Chart in Appendix C to obtain the list of equipment required for this exercise.
High voltages are present in this laboratory exercise. Do not make or modify anybanana jack connections with the power on unless otherwise specified.
a If you are performing this exercise using LVSIM-EMS, skip manipulation 1.
1. Examine the resistors in the Resistive Load module. Based on their size, listthem in order of their power dissipation capability and state which one cansafely handle the most power.
2. Install the Power Supply, data acquisition module, and Resistive Loadmodule in the EMS Workstation.
PROCEDURE
Ex. 1-3 – Power in DC Circuits Procedure
© Festo Didactic 584079 25
3. Make sure that the main power switch of the Power Supply is set to theO (OFF) position and the voltage control knob is turned fullycounterclockwise. Make sure that the Power Supply is connected to a three-phase wall receptacle.
4. Make sure that the data acquisition module is connected to a USB port of thecomputer.
Connect the POWER INPUT of the data acquisition module to the 24 V - ACoutput of the Power Supply. Set the 24 V - AC power switch to the I (ON)position.
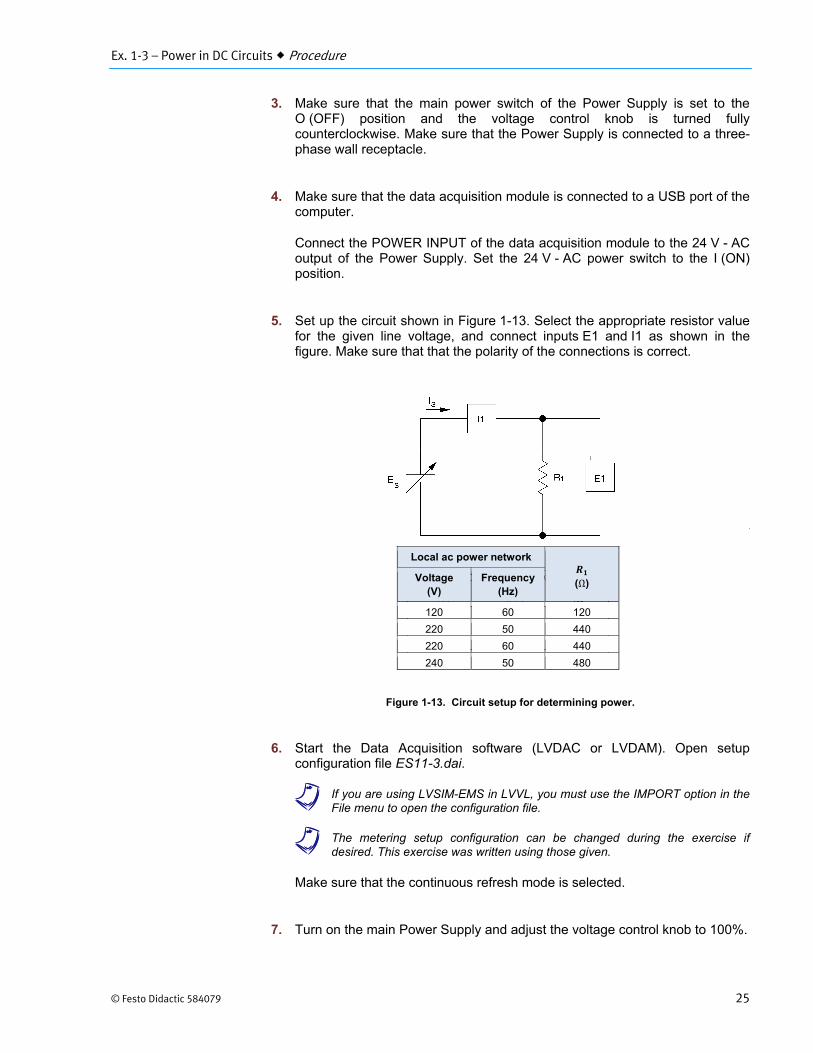
5. Set up the circuit shown in Figure 1-13. Select the appropriate resistor valuefor the given line voltage, and connect inputs E1 and I1 as shown in thefigure. Make sure that that the polarity of the connections is correct.
Figure 1-13. Circuit setup for determining power.
6. Start the Data Acquisition software (LVDAC or LVDAM). Open setupconfiguration file ES11-3.dai.
a If you are using LVSIM-EMS in LVVL, you must use the IMPORT option in theFile menu to open the configuration file.
a The metering setup configuration can be changed during the exercise ifdesired. This exercise was written using those given.
Make sure that the continuous refresh mode is selected.
7. Turn on the main Power Supply and adjust the voltage control knob to 100%.
Local ac power network
(Ω) Voltage(V)
Frequency(Hz)
120 60 120
220 50 440
220 60 440
240 50 480
Ex. 1-3 – Power in DC Circuits Procedure
26 © Festo Didactic 584079
8. From the Data Acquisition software (LVDAC or LVDAM), use the Data Tableto store the values of the measured circuit voltage and current. Turn off thePower Supply.
9. Use the measured values to calculate the power dissipated in the circuit.
W
a If you are performing this exercise using LVSIM-EMS, skip the nextmanipulation and go directly to manipulation 11.
10. Turn on the Power Supply and adjust the voltage control knob to 100%. Waita few minutes then turn off the Power Supply. Place your hand near theresistor and verify that it is quite hot (it is designed to operate at a continuoustemperature of 350°C). Be very careful not to touch the resistor.
Be careful not to touch the resistors since some of them can become quite hot. Contactwith hot resistors can result in burn injuries.
11. Double the circuit resistance value. Turn on the Power Supply and adjust thevoltage control knob to 100%. Use the Data Table to store the values of themeasured circuit voltage and current, then turn off the Power Supply.
12. Calculate the power dissipated by the resistor using the three forms of thepower formula given in the DISCUSSION.
W
W
W
13. Do the three formulas give approximately the same results?
Yes No
14. Set up the circuit shown in Figure 1-14, and use the Impedance Table inAppendix B to select the resistor values indicated in the figure. Connectinput E1 across , input E2 across , and input E3 across , and useinput I1 to measure the total circuit current . Select the ES11-4.dai file forthe metering setup. Make sure that the correct polarities for voltage andcurrent measurement are respected.
Ex. 1-3 – Power in DC Circuits Procedure
© Festo Didactic 584079 27
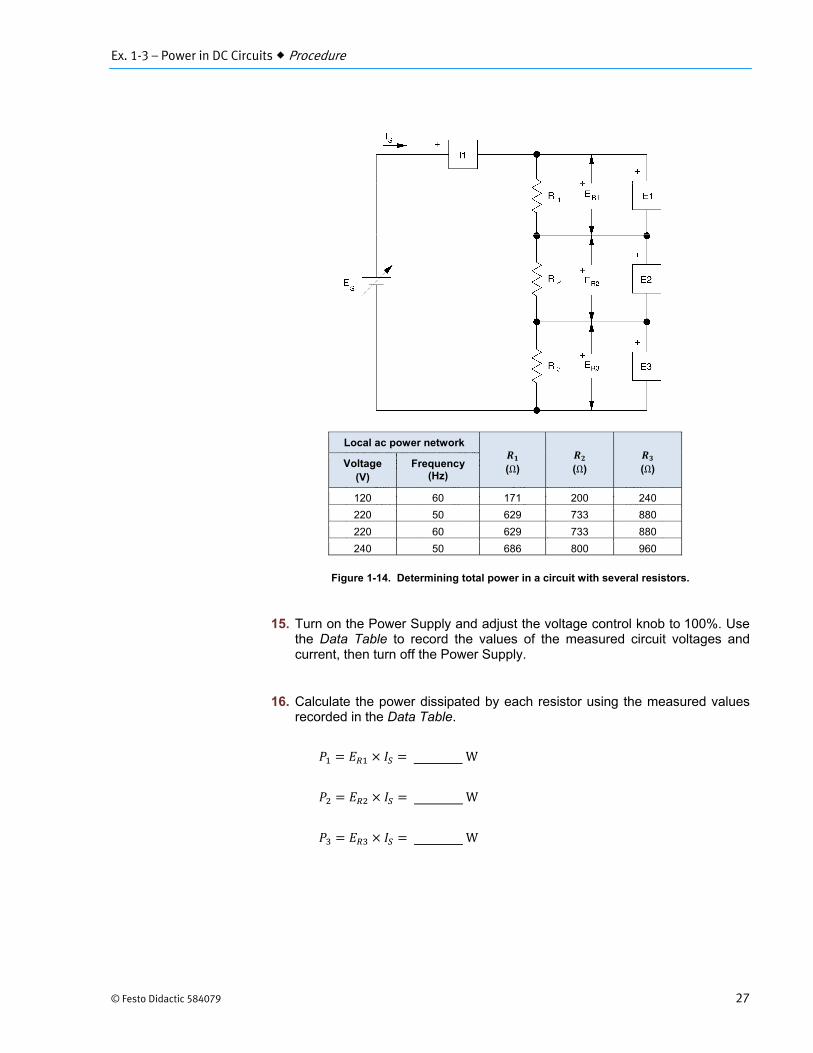
Figure 1-14. Determining total power in a circuit with several resistors.
15. Turn on the Power Supply and adjust the voltage control knob to 100%. Usethe Data Table to record the values of the measured circuit voltages andcurrent, then turn off the Power Supply.
16. Calculate the power dissipated by each resistor using the measured valuesrecorded in the Data Table.
W
W
W
Local ac power network
(Ω) (Ω) (Ω) Voltage(V)
Frequency (Hz)
120 60 171 200 240
220 50 629 733 880
220 60 629 733 880
240 50 686 800 960
Ex. 1-3 – Power in DC Circuits Procedure
28 © Festo Didactic 584079
17. Calculate the total power dissipated, and compare it to the total powersupplied by the source.
W
W
18. Are the results approximately the same?
Yes No
19. Remove the connections for voltage measurement from the circuit ofFigure 1-14, and connect input E1 to measure the supply voltage atterminals 7-N. Leave input I1 connected to measure the circuit current. Editthe label of the meter associated with input E1 so that it indicates insteadof .
20. Turn on the Power Supply and set the voltage control knob to 75%. Use theData Table to record the values of the measured circuit voltage and current,return the voltage to zero and turn off the Power Supply.
21. Calculate the power dissipated by each of the resistors.
W
W
W
22. Calculate the total power dissipated, and compare it to the total powersupplied by the source.
W
W
Ex. 1-3 – Power in DC Circuits Procedure
© Festo Didactic 584079 29
23. Are the results approximately the same?
Yes No
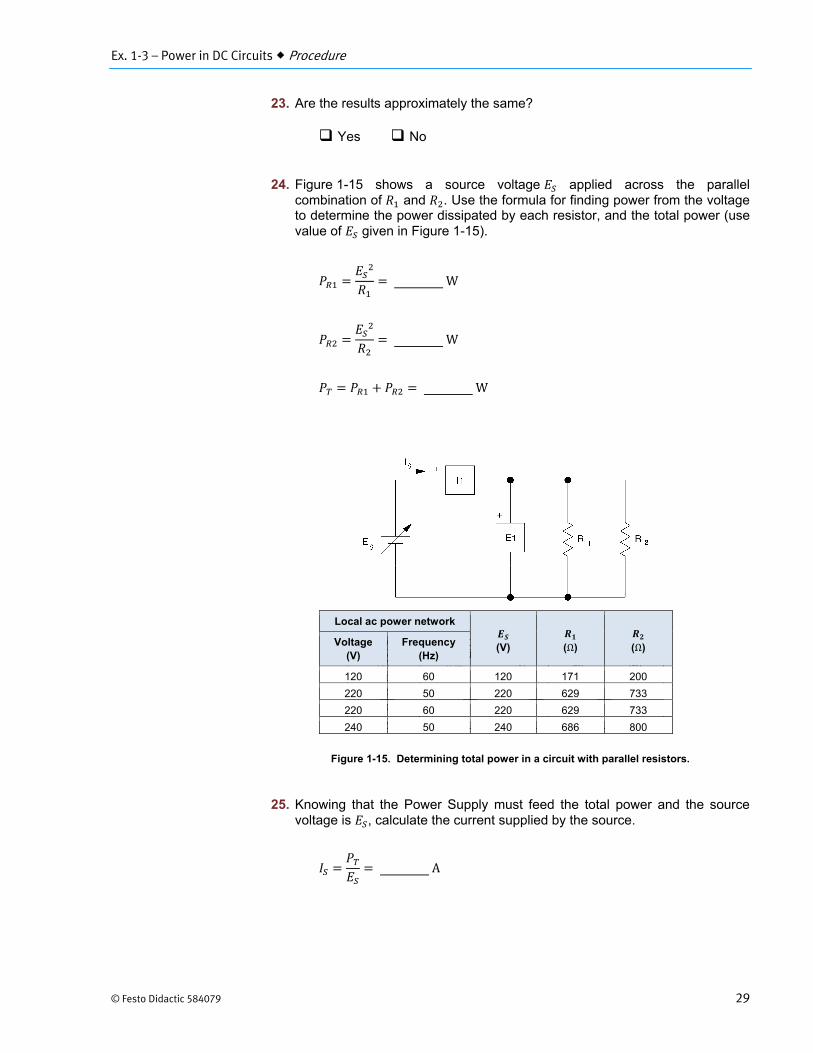
24. Figure 1-15 shows a source voltage applied across the parallelcombination of and . Use the formula for finding power from the voltageto determine the power dissipated by each resistor, and the total power (usevalue of given in Figure 1-15).
W
W
W
Figure 1-15. Determining total power in a circuit with parallel resistors.
25. Knowing that the Power Supply must feed the total power and the sourcevoltage is , calculate the current supplied by the source.
A
Local ac power network
(V) (Ω) (Ω) Voltage(V)
Frequency(Hz)
120 60 120 171 200
220 50 220 629 733
220 60 220 629 733
240 50 240 686 800
Ex. 1-3 – Power in DC Circuits Procedure
30 © Festo Didactic 584079
26. Set up the circuit shown in Figure 1-15. Connect input E1 to measure thesource voltage , and use input I1 to measure the total circuit current .
Do not save the modification made to the ES11-4.dai file. Select theES11-5.dai file for the metering setup.
Turn on the Power Supply and set for the value given in Figure 1-15. Usethe Data Table to record the values of and , then turn off the PowerSupply.
27. Compare the value of the measured current with the value calculated instep 25. Are they approximately the same?
Yes No
28. Ensure that the Power Supply is turned off, and that the voltage control knobis turned fully counterclockwise. Remove all leads and cables.
Ex. 1-3 – Power in DC Circuits Conclusion
© Festo Didactic 584079 31
In this exercise, you demonstrated that power in a dc circuit can be determined from voltage and current measurements. You also demonstrated that the total power in a circuit with several resistors is the sum of the powers dissipated in each resistor. Finally, you verified the fact that power can be calculated using either the circuit voltage or current in combination with the resistance. It is not necessary to know both.
1. An electrical potential of one volt causing one ampere of current flow througha resistor of one ohm is the definition of?
a. workb. voltagec. one watt of power.d. resistance.
2. The power dissipated in a resistive dc circuit can be determined
a. from and .b. from and .c. from and .d. all of the above.
3. The shunt-field winding of a dc motor has a resistance of 240 Ω. Whatamount of power is dissipated when the dc voltage across the winding is120 V?
a. 480 Wb. 120 Wc. 60 Wd. 600 W
4. The earth ground resistance at the base of a transmission tower is 2 Ω. If thetower is struck by a lightning bolt of 20 000 A, what power will be dissipatedin the ground?
a. 800 megawattsb. 80 kilowattsc. 40 kilovoltsd. None
5. A dc motor draws a current of 50 A at 230 V, and 1200 W of power isdissipated as heat by the motor. How much power is left for mechanicalwork?
a. 11 500 Wb. 10 300 Wc. 12 100 Wd. 11 900 W
CONCLUSION
REVIEW QUESTIONS

© Festo Didactic 584079 33
When you have completed this exercise, you will be able to solve series and parallel circuits and demonstrate Kirchhoff's voltage and current laws.
As you advance in your study of electric circuits, it will become obvious that even the most complex circuits can be solved using just a few fundamental rules. These rules are summarized in two groups, as shown below: one for series circuits, and one for parallel circuits. They are directly related to Ohm's law, the formulas for equivalent resistance, and the Kirchhoff's voltage and current laws. The Kirchhoff's voltage law states that the sum of the voltages in a closed-circuit loop is equal to zero. Its counterpart, the Kirchhoff's current law, states that the sum of the currents entering a circuit node is equal to the sum of the currents leaving the node.
Rules for series circuits
1. The sum of the voltage drops across each resistor in a series circuit equalsthe applied voltage.
2. The same current flows in each series resistor.
3. The total series-circuit resistance is the sum of the individual resistor values.
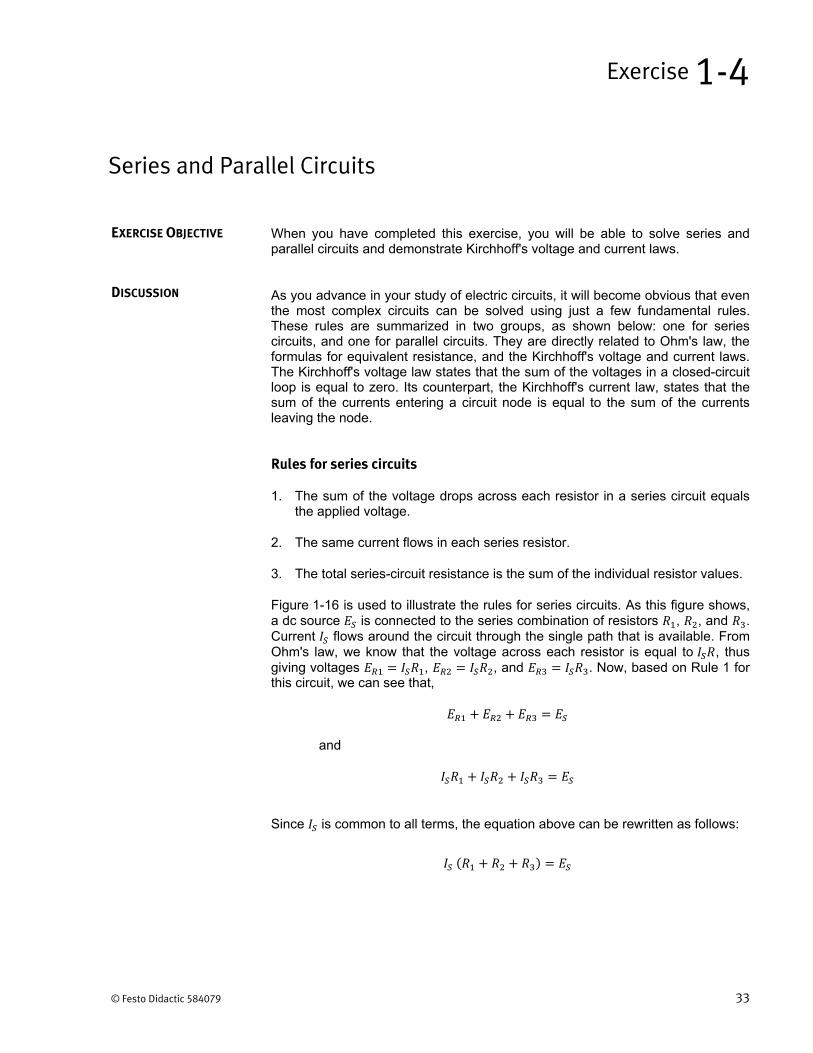
Figure 1-16 is used to illustrate the rules for series circuits. As this figure shows, a dc source is connected to the series combination of resistors , , and . Current flows around the circuit through the single path that is available. From Ohm's law, we know that the voltage across each resistor is equal to , thus giving voltages , , and . Now, based on Rule 1 for this circuit, we can see that,
and
Since is common to all terms, the equation above can be rewritten as follows:
Series and Parallel Circuits
Exercise 1-4
EXERCISE OBJECTIVE
DISCUSSION
Ex. 1-4 – Series and Parallel Circuits Discussion
34 © Festo Didactic 584079
Using the equation for calculating the equivalent resistance in a series circuit , or Rule 3, we obtain:
Figure 1-16. A typical series circuit.
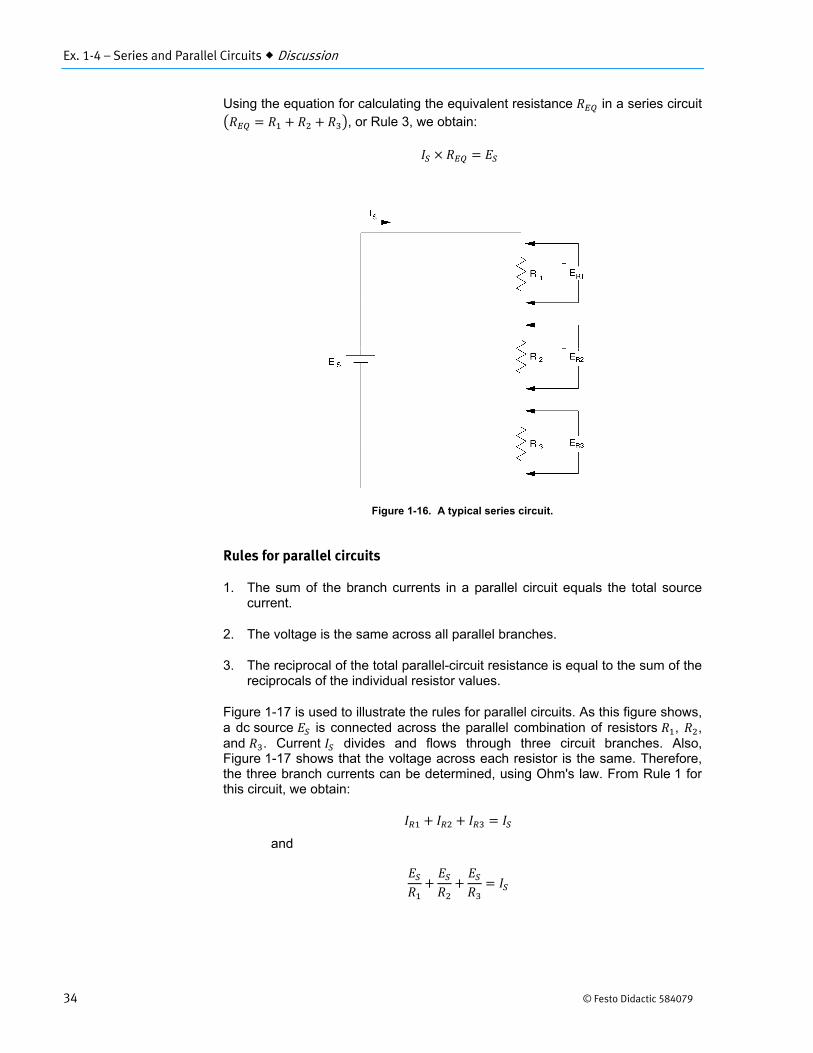
Rules for parallel circuits
1. The sum of the branch currents in a parallel circuit equals the total sourcecurrent.
2. The voltage is the same across all parallel branches.
3. The reciprocal of the total parallel-circuit resistance is equal to the sum of thereciprocals of the individual resistor values.
Figure 1-17 is used to illustrate the rules for parallel circuits. As this figure shows, a dc source is connected across the parallel combination of resistors , , and . Current divides and flows through three circuit branches. Also, Figure 1-17 shows that the voltage across each resistor is the same. Therefore, the three branch currents can be determined, using Ohm's law. From Rule 1 for this circuit, we obtain:
and
Ex. 1-4 – Series and Parallel Circuits Discussion
© Festo Didactic 584079 35
Since is common to all terms, the equation can be rewritten as follows:
1 1 1
Using the equation for equivalent resistance in a parallel circuit 1 1 1 ⁄ 1 ⁄⁄⁄ , or rule 3, we obtain:
1
and
Figure 1-17. A typical parallel circuit.
Two other fundamental principles used in solving electric circuits are the voltage divider principle and the current divider principle. Stated simply, the voltage divider principle states that when a voltage is applied across two series resistors and , it divides so that the ratio of the voltage drops across the resistors ( and ) is equal to the ratio of the resistors. This can be written as follows:
This leads to the following two equations:
and
Ex. 1-4 – Series and Parallel Circuits Procedure
36 © Festo Didactic 584079
The current divider principle states that current splits between two parallel resistors and , so that the ratio of the currents in the resistors ( and ) is equal to the inverse ratio of the resistors. This can be written as follows:
This leads to the following two equations:
and
EQUIPMENT REQUIRED
Refer to the Equipment Utilization Chart in Appendix C to obtain the list of equipment required for this exercise.
High voltages are present in this laboratory exercise. Do not make or modify anybanana jack connections with the power on unless otherwise specified.
1. Install the Power Supply, data acquisition module, and Resistive Loadmodule in the EMS Workstation.
2. Make sure the main power switch of the Power Supply is set to theO (OFF) position and the voltage control knob is turned fullycounterclockwise. Set the voltmeter select switch on the Power Supply tothe 7-N DC position. Make sure that the Power Supply is connected to athree-phase wall receptacle.
3. Make sure that the data acquisition module is connected to a USB port of thecomputer.
Connect the POWER INPUT of the data acquisition module to the 24 V – ACoutput of the Power Supply. Set the 24 V - AC power switch to the I (ON)position.
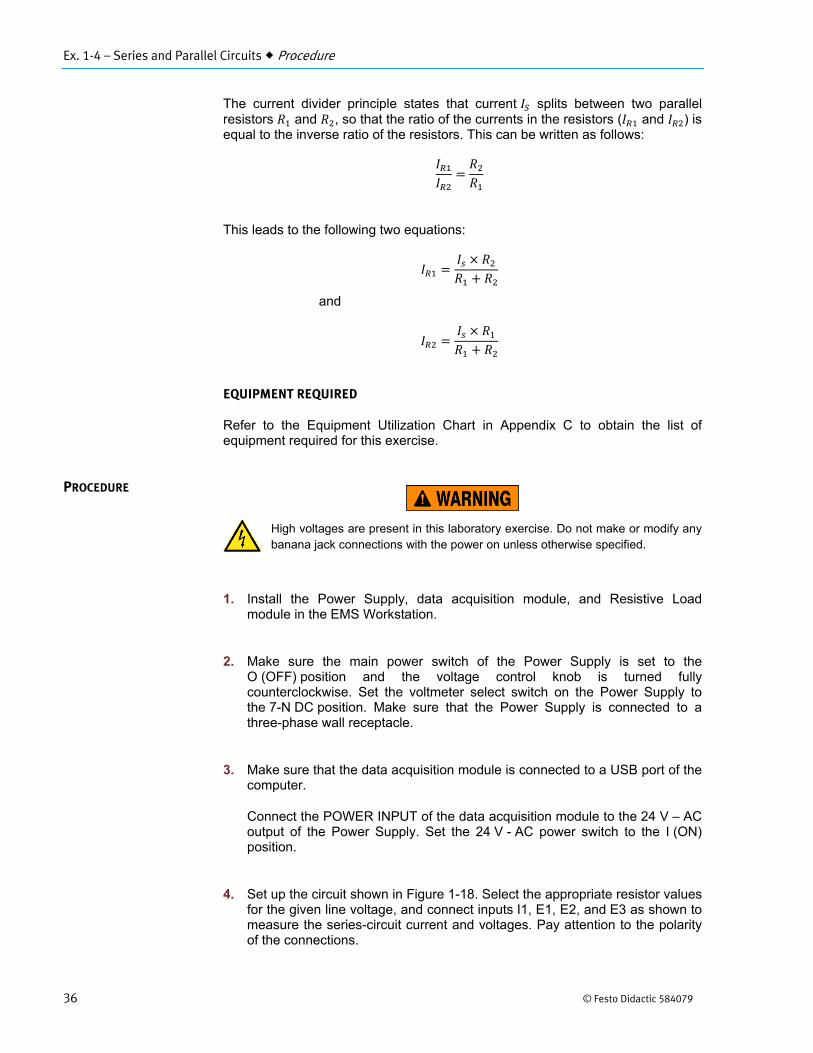
4. Set up the circuit shown in Figure 1-18. Select the appropriate resistor valuesfor the given line voltage, and connect inputs I1, E1, E2, and E3 as shown tomeasure the series-circuit current and voltages. Pay attention to the polarityof the connections.
PROCEDURE
Ex. 1-4 – Series and Parallel Circuits Procedure
© Festo Didactic 584079 37
Figure 1-18. Setup for a typical series circuit.
5. Start the Data Acquisition software (LVDAC or LVDAM). Open setupconfiguration file ES11-6.dai.
a If you are using LVSIM-EMS in LVVL, you must use the IMPORT option in theFile menu to open the configuration file.
a The metering setup configuration can be changed during the exercise ifdesired. This exercise was written using those given.
Make sure that the continuous refresh mode is selected.
6. Turn on the main Power Supply and adjust the voltage control knob for thevalue of voltage given in Figure 1-18.
7. Use the Data Table to store the values of the measured circuit voltages andcurrent. Turn off the Power Supply.
Local ac power network
(V) (Ω) (Ω) (Ω) Voltage(V)
Frequency(Hz)
120 60 120 171 220 240
220 50 220 629 733 880
220 60 220 629 733 880
240 50 240 686 800 960
Ex. 1-4 – Series and Parallel Circuits Procedure
38 © Festo Didactic 584079
8. Calculate the circuit equivalent resistance and the circuit current , usingthe values given in Figure 1-18.
Ω
A
9. Calculate the voltage drops for each resistor using the current calculated inthe previous step and the resistor values given in Figure 1-18. Compare withthe measured values in Figure 1-18.
V
V
V
10. Are the results approximately the same?
Yes No
11. Set up the series combination circuit in Figure 1-19, and set the ResistiveLoad module for the given resistor values. Connect inputs I1, E1, and E2 tomeasure the circuit parameters. Use setup configuration file ES11-7.dai forthe circuit measurements.
Ex. 1-4 – Series and Parallel Circuits Procedure
© Festo Didactic 584079 39
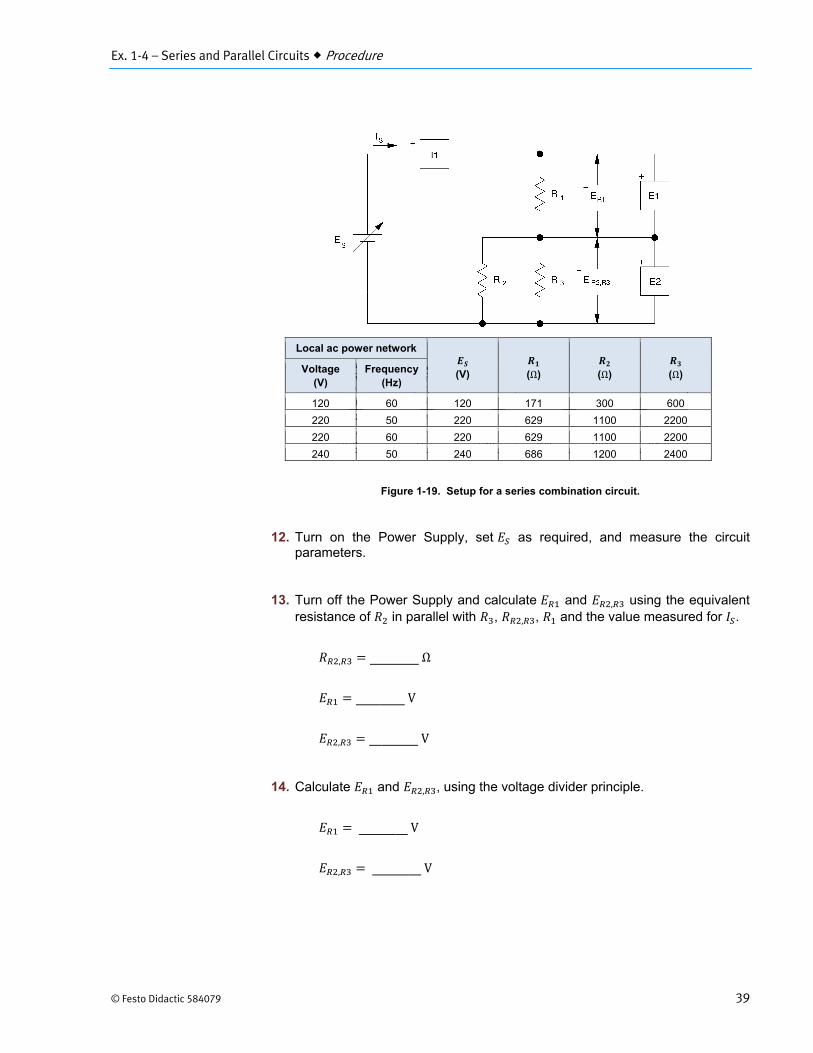
Figure 1-19. Setup for a series combination circuit.
12. Turn on the Power Supply, set as required, and measure the circuitparameters.
13. Turn off the Power Supply and calculate and , using the equivalentresistance of in parallel with , , , and the value measured for .
, Ω
V
, V
14. Calculate and , , using the voltage divider principle.
V
, V
Local ac power network
(V) (Ω) (Ω) (Ω) Voltage(V)
Frequency(Hz)
120 60 120 171 300 600
220 50 220 629 1100 2200
220 60 220 629 1100 2200
240 50 240 686 1200 2400
Ex. 1-4 – Series and Parallel Circuits Procedure
40 © Festo Didactic 584079
15. Compare the values obtained in the previous steps. Are they approximatelythe same?
Yes No
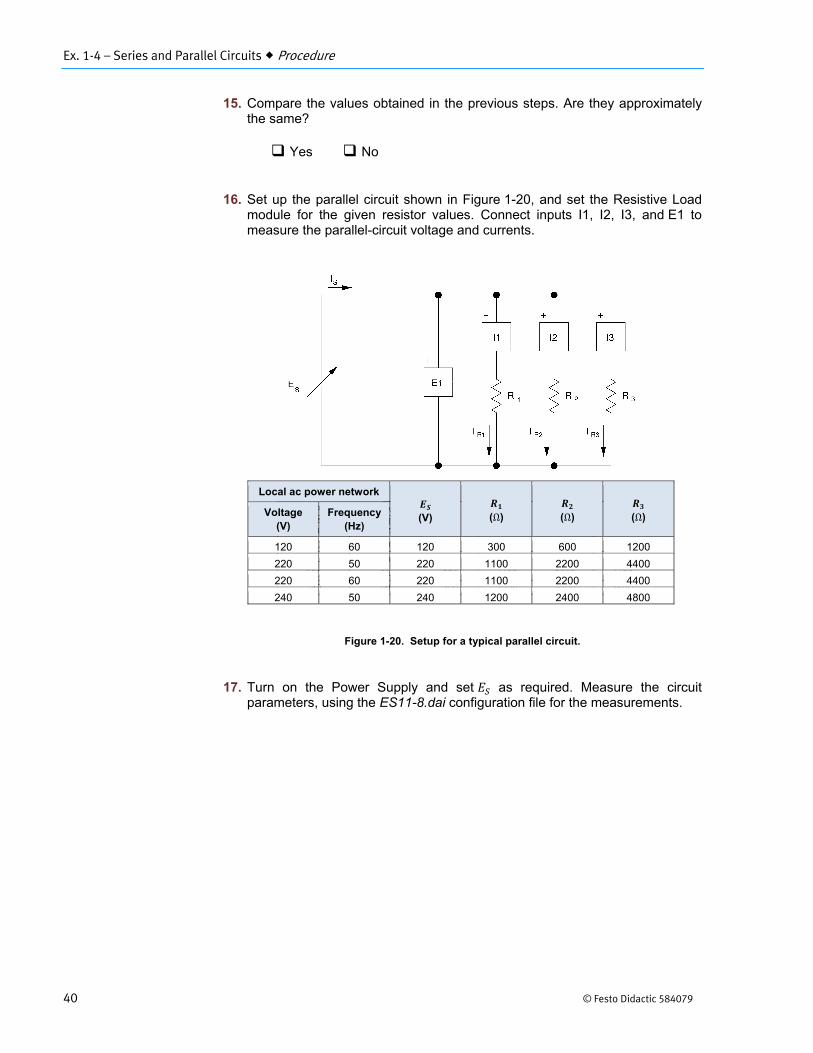
16. Set up the parallel circuit shown in Figure 1-20, and set the Resistive Loadmodule for the given resistor values. Connect inputs I1, I2, I3, and E1 tomeasure the parallel-circuit voltage and currents.
Figure 1-20. Setup for a typical parallel circuit.
17. Turn on the Power Supply and set as required. Measure the circuitparameters, using the ES11-8.dai configuration file for the measurements.
Local ac power network
(V) (Ω) (Ω) (Ω) Voltage (V)
Frequency(Hz)
120 60 120 300 600 1200
220 50 220 1100 2200 4400
220 60 220 1100 2200 4400
240 50 240 1200 2400 4800

Ex. 1-4 – Series and Parallel Circuits Procedure
© Festo Didactic 584079 41
18. Turn off the Power Supply and calculate the values for , , and thebranch currents, using the values given in Figure 1-20.
Ω
A
A
A
A
19. Determine the branch currents using the current divider principle.
A
A
A
20. Compare the calculated and measured values. Are they approximately thesame?
Yes No
21. Set up the parallel combination circuit in Figure 1-21, and set the ResistiveLoad module for the given resistor values. Connect inputs I1, I2, I3, E1,and E2 to measure the circuit parameters.
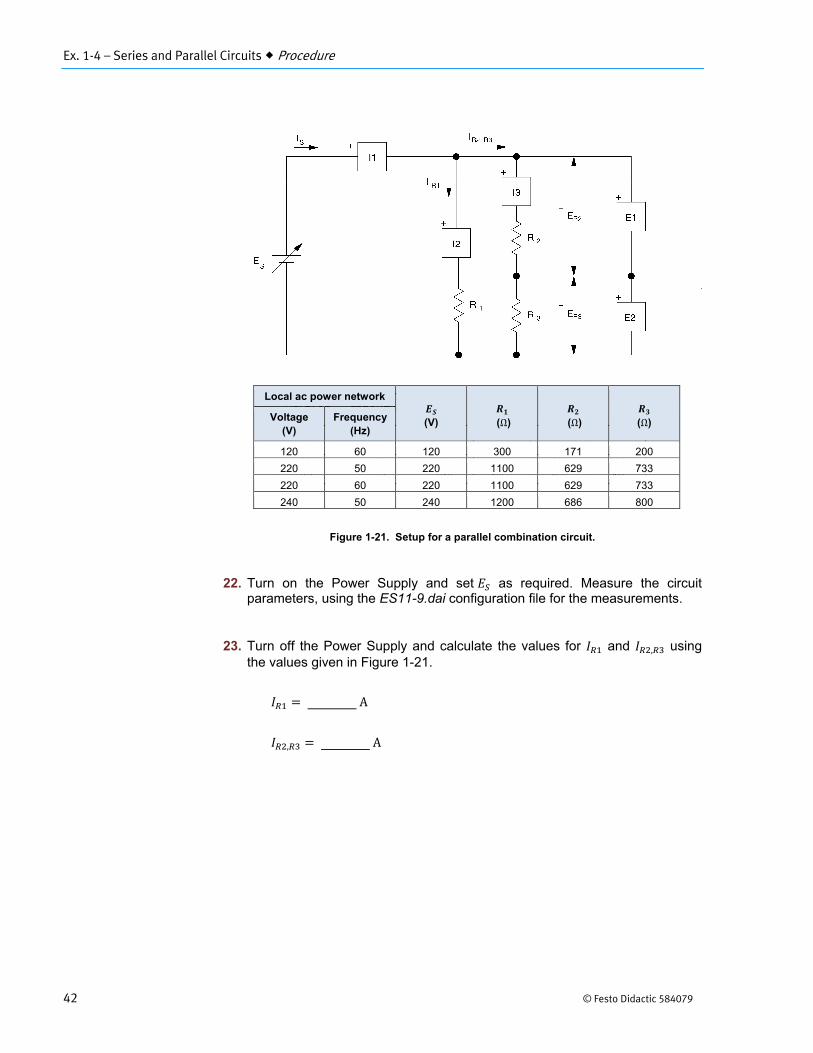
Ex. 1-4 – Series and Parallel Circuits Procedure
42 © Festo Didactic 584079
.
Figure 1-21. Setup for a parallel combination circuit.
22. Turn on the Power Supply and set as required. Measure the circuitparameters, using the ES11-9.dai configuration file for the measurements.
23. Turn off the Power Supply and calculate the values for and , usingthe values given in Figure 1-21.
A
, A
Local ac power network
(V) (Ω) (Ω) (Ω) Voltage (V)
Frequency(Hz)
120 60 120 300 171 200
220 50 220 1100 629 733
220 60 220 1100 629 733
240 50 240 1200 686 800

Ex. 1-4 – Series and Parallel Circuits Procedure
© Festo Didactic 584079 43
24. Compare the measured and calculated values. Are they approximately thesame?
Yes No
25. Compare the source current with the sum of the branch currents. Are theseresults approximately the same?
Yes No
26. Calculate the values for and using the values given in Figure 1-21,and compare with the measured values
V
V
27. Are the calculated and measured values approximately the same?
Yes No
28. Ensure that the Power Supply is turned off, and that the voltage control knobis turned fully counterclockwise. Remove all leads and cables.

Ex. 1-4 – Series and Parallel Circuits Conclusion
44 © Festo Didactic 584079
In this exercise, you demonstrated that different combinations of series and parallel circuits can be solved using rules and principles based on Ohm's law and Kirchhoff's laws. You also had the opportunity to practice the techniques presented in the previous exercises.
1. The main rules and principles for solving electric circuits are related to
a. the conservation of energy law.b. combinations of different circuits.c. Kirchhoff's law, Ohm's law, and rules for equivalent
resistance.d. the random operation of a circuit.
2. The source voltage in the circuit of Figure 1-19 is doubled. What effect doesthis have on the circuit current and voltages?
a. Both will double.b. Both will decrease by half.c. Both will increase by half.d. There will be no change.
3. The value of resistor in Figure 1-19 is reduced by half. Will the currentthrough increase or decrease?
a. Increase.b. Decrease.c. It will not change.d. None of the above.
4. What will be the effect of removing one of the resistors in Figure 1-20?
a. The source voltage will drop.b. The source current will increase.c. The source current will decrease.d. There will be no effect.
5. How can current be reduced by half in the circuit of Figure 1-21?
a. By reducing the source voltage by half, or doubling .b. By increasing the source voltage by half, or doubling .c. By reducing the source voltage by half, or doubling .d. By increasing the source voltage by half and doubling .
CONCLUSION
REVIEW QUESTIONS

Unit 1 – Fundamentals for Electrical Power Technology Unit Test
© Festo Didactic 584079 45
Unit Test
1. Voltage can be defined as
a. the ratio between current and resistance.b. the potential difference between two points in an electric circuit.c. the flow of free electrons in an electrical conductor.d. the ratio of resistance to current.
2. Which of the following is a valid expression for Ohm's law?
a.b. ⁄c.d. Both a and c.
3. The formula for finding the equivalent resistance of a series circuit is
a. 1 1⁄ 1⁄ 1⁄ 1⁄ . . . 1⁄⁄b. ⁄c. 1⁄ 1⁄ 1⁄ 1⁄ . . . 1⁄d. . . .
4. The formula for finding the equivalent resistance of a parallel circuit is
a. 1⁄ 1⁄ 1⁄ 1⁄ . . . 1⁄b. ⁄c. 1 1⁄ 1⁄ 1⁄ 1⁄ . . . 1⁄⁄d. . . .
5. What is the equivalent resistance of four 1-Ω resistors in parallel?
a. 4 Ωb. 12 Ωc. 0.25 Ωd. 1 Ω
6. Power can be defined as
a. the product of voltage and current in a dc circuit.b. the ratio of voltage to current in a dc circuit.c. the ratio of current to voltage in a dc circuit.d. the product of current and resistance in a dc circuit.
7. Power in a resistive dc circuit can be calculated using
a. the current and the voltage.b. the current and the resistance.c. the voltage and the resistance.d. any two of the voltage, current, and resistance parameters.

Unit 1 – Fundamentals for Electrical Power Technology Unit Test
46 © Festo Didactic 584079
8. Solving electric circuits requires knowledge of
a. the conservation of energy law.b. Kirchhoff's law, Ohm's law, and rules for equivalent resistance.c. vectorial calculation.d. the natural conservation of energy law.
9. If the source voltage in a circuit is doubled, the current will increase
a. True, if the circuit resistance is doubled.b. True, if the circuit resistance stays the same.c. False, because voltage and current are independent.d. There will be no change.
10. If the resistance of a parallel circuit branch is doubled, the voltage across thebranch will change.
a. True because the product will be different.b. True, because the voltage is proportional to resistance.c. False, there will be no change in the voltage across the branch.d. True, because the circuit current also change.

© Festo Didactic 584079 47
When you have completed this unit, you will be able to explain and demonstrate the amplitude, frequency and phase of alternating voltage and current waveforms. You will also demonstrate concepts related to instantaneous power.
Alternating current (ac) is universally used throughout the world for driving motors and for powering electrical equipment. As its name suggests, an alternating voltage is one which is continually reversing (alternating) its polarity. When speaking of ac voltages, it is quite correct to consider them as being dc voltages which are continually in the process of changing their value and polarity. The number of times that the polarity passes from positive to negative and then from negative to positive in one second is called the frequency. The normal ac line frequency in North America is 60 Hz, while most countries in Europe, and several others, have an ac line frequency of 50 Hz.
Besides reversing polarity periodically, ac voltages also change in value from instant to instant, in a way that depends on the type of power supply. It is possible to obtain a square wave, a triangular wave, or other types of waveforms for the voltage. Theory and practical evidence has shown though, that the type of waveform best suited for running electrical machinery is the sine wave. This periodic waveform permits us to obtain the highest efficiency from transformers, motors, and generators, and also results in the quietest operation. Although sine waves seem more complicated than triangular or square waves, they make calculations of voltages and currents in electrical circuitry simpler. The value of a sine wave can be calculated for any instant of its cycle using the sine function, and this value always repeats after one complete cycle.
Alternating Current
Unit 2
UNIT OBJECTIVE
DISCUSSION OF
FUNDAMENTALS
Unit 2 – Alternating Current Discussion of Fundamentals
48 © Festo Didactic 584079
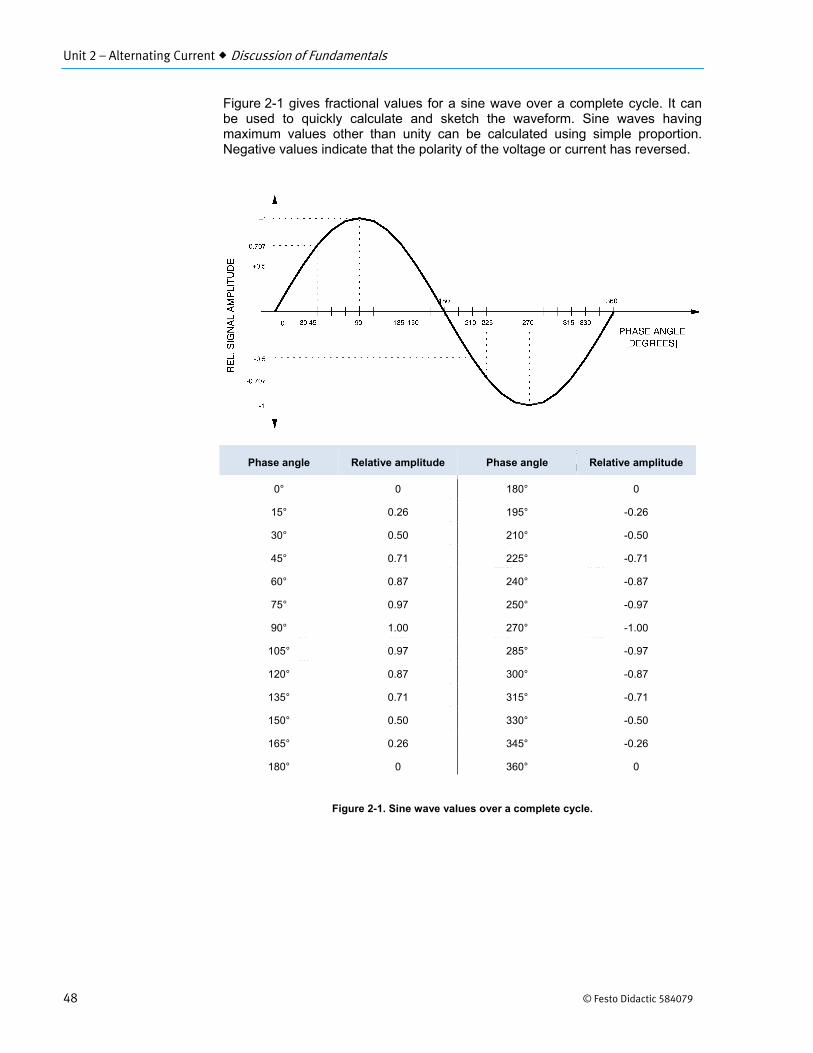
Figure 2-1 gives fractional values for a sine wave over a complete cycle. It can be used to quickly calculate and sketch the waveform. Sine waves having maximum values other than unity can be calculated using simple proportion. Negative values indicate that the polarity of the voltage or current has reversed.
Figure 2-1. Sine wave values over a complete cycle.
Phase angle Relative amplitude Phase angle Relative amplitude
0° 0 180° 0
15° 0.26 195° -0.26
30° 0.50 210° -0.50
45° 0.71 225° -0.71
60° 0.87 240° -0.87
75° 0.97 250° -0.97
90° 1.00 270° -1.00
105° 0.97 285° -0.97
120° 0.87 300° -0.87
135° 0.71 315° -0.71
150° 0.50 330° -0.50
165° 0.26 345° -0.26
180° 0 360° 0
Unit 2 – Alternating Current Discussion of Fundamentals
© Festo Didactic 584079 49
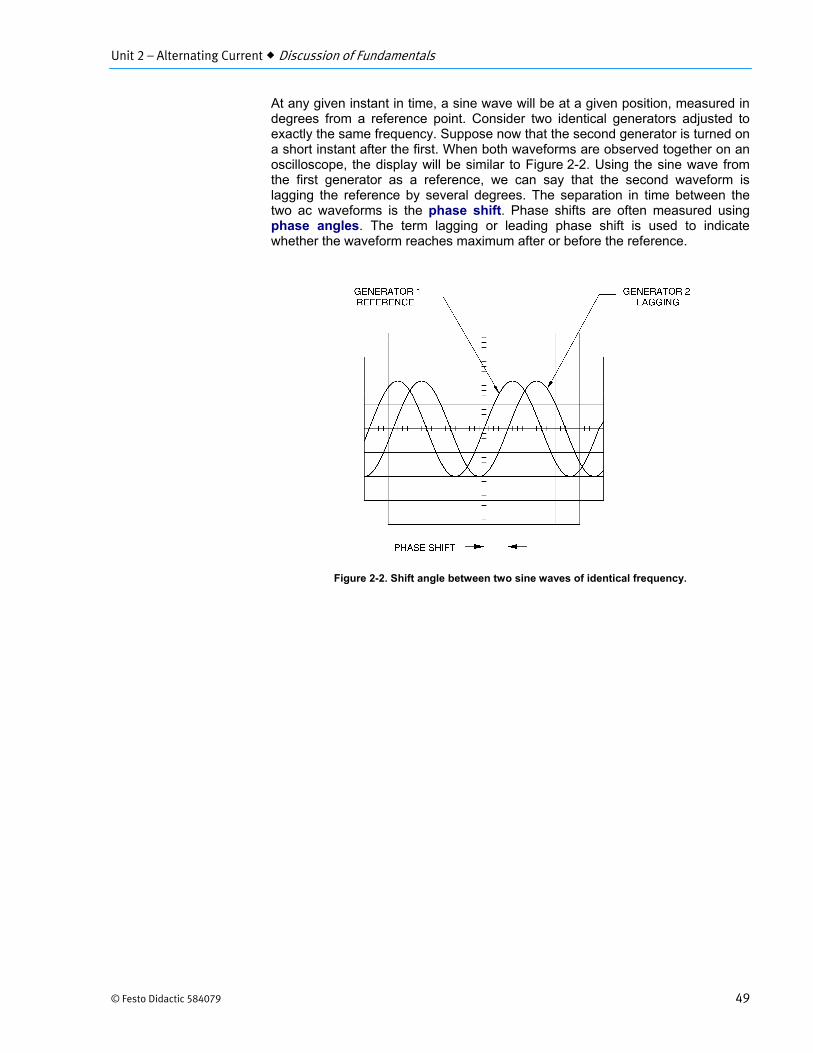
At any given instant in time, a sine wave will be at a given position, measured in degrees from a reference point. Consider two identical generators adjusted to exactly the same frequency. Suppose now that the second generator is turned on a short instant after the first. When both waveforms are observed together on an oscilloscope, the display will be similar to Figure 2-2. Using the sine wave from the first generator as a reference, we can say that the second waveform is lagging the reference by several degrees. The separation in time between the two ac waveforms is the phase shift. Phase shifts are often measured using phase angles. The term lagging or leading phase shift is used to indicate whether the waveform reaches maximum after or before the reference.
Figure 2-2. Shift angle between two sine waves of identical frequency.

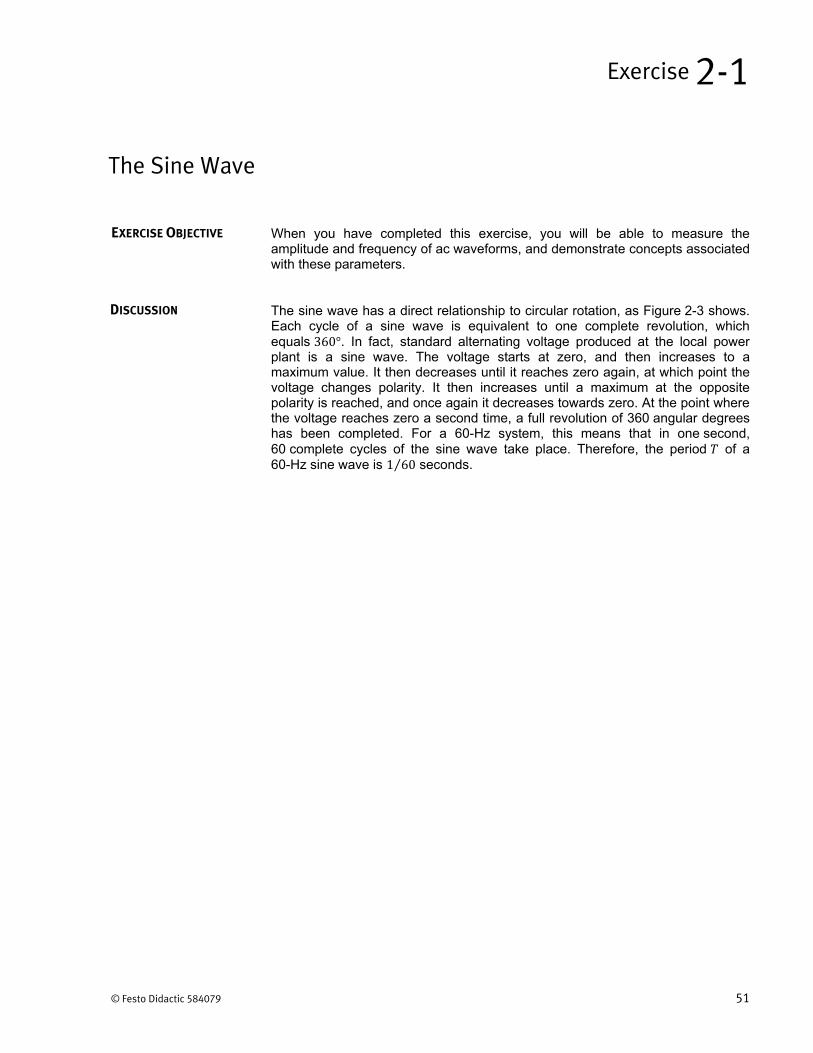
© Festo Didactic 584079 51
When you have completed this exercise, you will be able to measure the amplitude and frequency of ac waveforms, and demonstrate concepts associated with these parameters.
The sine wave has a direct relationship to circular rotation, as Figure 2-3 shows. Each cycle of a sine wave is equivalent to one complete revolution, which equals 360°. In fact, standard alternating voltage produced at the local power plant is a sine wave. The voltage starts at zero, and then increases to a maximum value. It then decreases until it reaches zero again, at which point the voltage changes polarity. It then increases until a maximum at the opposite polarity is reached, and once again it decreases towards zero. At the point where the voltage reaches zero a second time, a full revolution of 360 angular degrees has been completed. For a 60-Hz system, this means that in one second, 60 complete cycles of the sine wave take place. Therefore, the period of a 60-Hz sine wave is 1 60⁄ seconds.
The Sine Wave
Exercise 2-1
EXERCISE OBJECTIVE
DISCUSSION
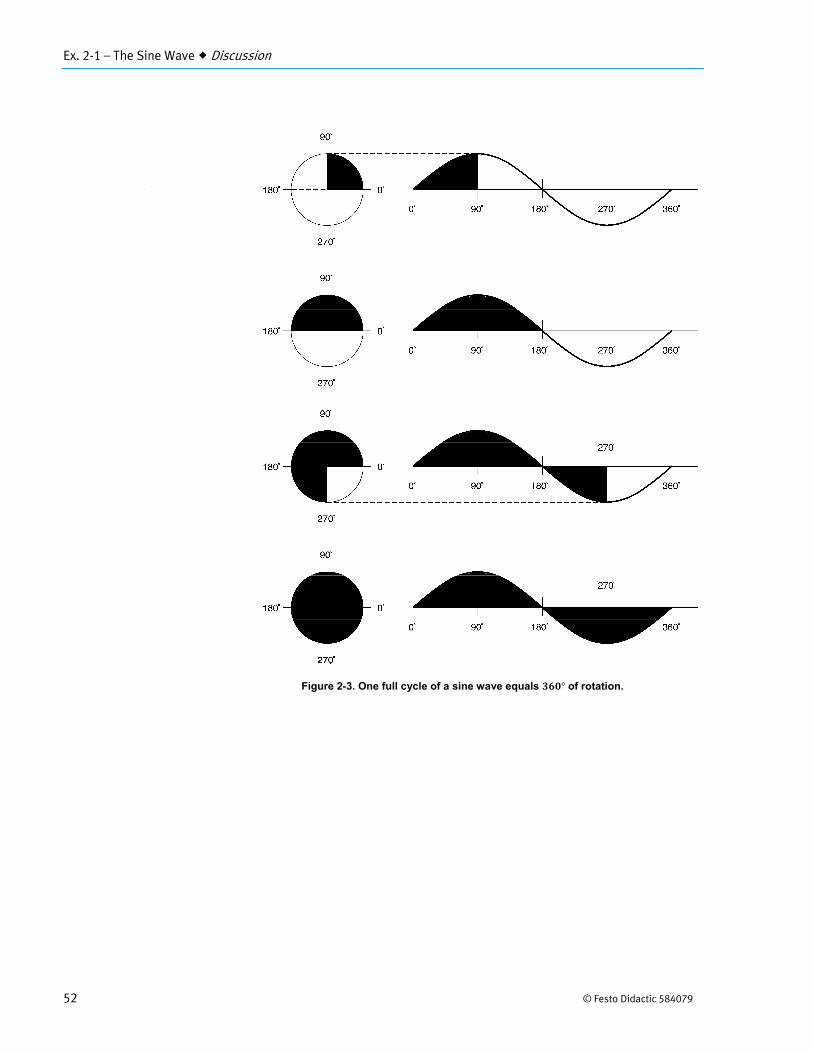
Ex. 2-1 – The Sine Wave Discussion
52 © Festo Didactic 584079
Figure 2-3. One full cycle of a sine wave equals ° of rotation.
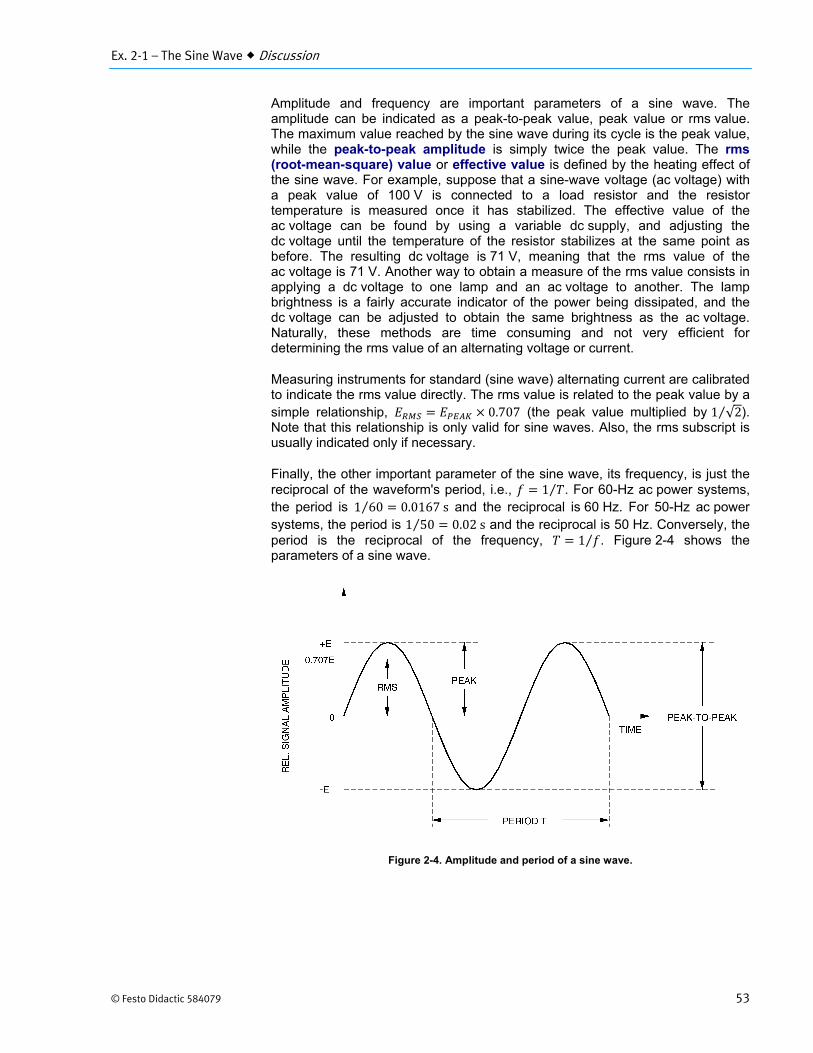
Ex. 2-1 – The Sine Wave Discussion
© Festo Didactic 584079 53
Amplitude and frequency are important parameters of a sine wave. The amplitude can be indicated as a peak-to-peak value, peak value or rms value. The maximum value reached by the sine wave during its cycle is the peak value, while the peak-to-peak amplitude is simply twice the peak value. The rms (root-mean-square) value or effective value is defined by the heating effect of the sine wave. For example, suppose that a sine-wave voltage (ac voltage) with a peak value of 100 V is connected to a load resistor and the resistor temperature is measured once it has stabilized. The effective value of the ac voltage can be found by using a variable dc supply, and adjusting the dc voltage until the temperature of the resistor stabilizes at the same point as before. The resulting dc voltage is 71 V, meaning that the rms value of the ac voltage is 71 V. Another way to obtain a measure of the rms value consists in applying a dc voltage to one lamp and an ac voltage to another. The lamp brightness is a fairly accurate indicator of the power being dissipated, and the dc voltage can be adjusted to obtain the same brightness as the ac voltage. Naturally, these methods are time consuming and not very efficient for determining the rms value of an alternating voltage or current.
Measuring instruments for standard (sine wave) alternating current are calibrated to indicate the rms value directly. The rms value is related to the peak value by a simple relationship, 0.707 (the peak value multiplied by 1 √2⁄ ). Note that this relationship is only valid for sine waves. Also, the rms subscript is usually indicated only if necessary.
Finally, the other important parameter of the sine wave, its frequency, is just the reciprocal of the waveform's period, i.e., 1⁄ . For 60-Hz ac power systems, the period is 1 60⁄ 0.0167s and the reciprocal is 60 Hz. For 50-Hz ac power systems, the period is 1 50⁄ 0.02s and the reciprocal is 50 Hz. Conversely, the period is the reciprocal of the frequency, 1⁄ . Figure 2-4 shows the parameters of a sine wave.
Figure 2-4. Amplitude and period of a sine wave.
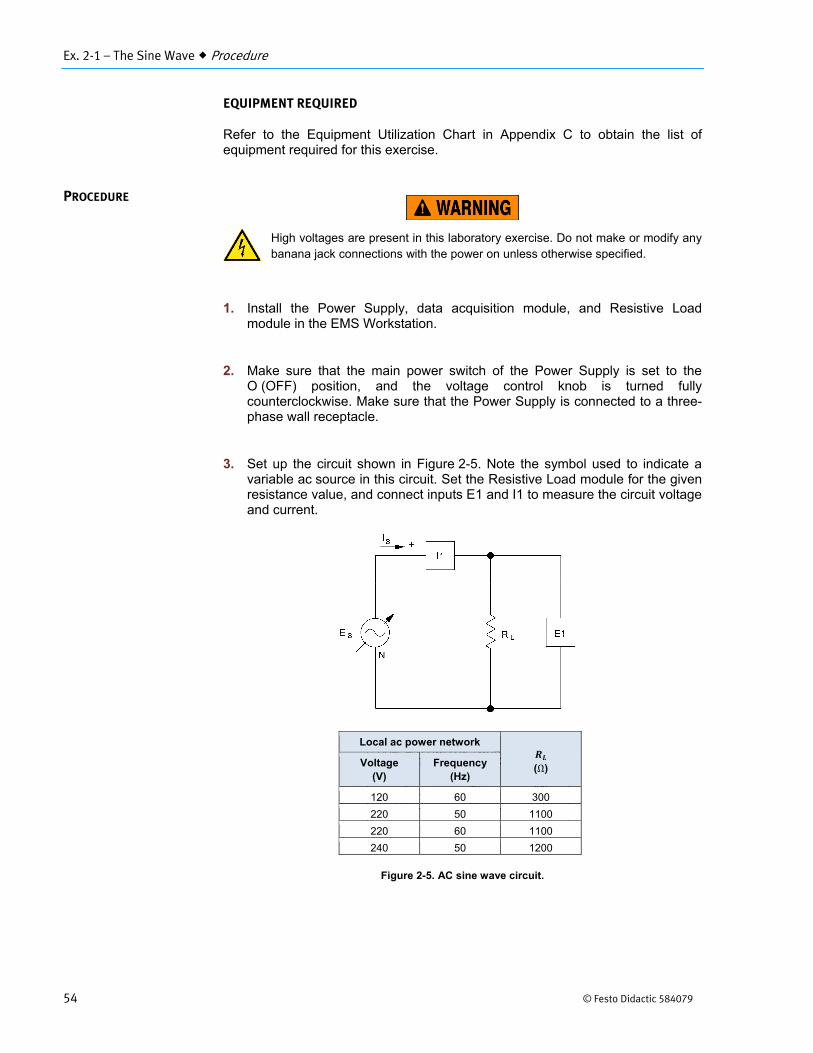
Ex. 2-1 – The Sine Wave Procedure
54 © Festo Didactic 584079
EQUIPMENT REQUIRED
Refer to the Equipment Utilization Chart in Appendix C to obtain the list of equipment required for this exercise.
High voltages are present in this laboratory exercise. Do not make or modify anybanana jack connections with the power on unless otherwise specified.
1. Install the Power Supply, data acquisition module, and Resistive Loadmodule in the EMS Workstation.
2. Make sure that the main power switch of the Power Supply is set to theO (OFF) position, and the voltage control knob is turned fullycounterclockwise. Make sure that the Power Supply is connected to a three-phase wall receptacle.
3. Set up the circuit shown in Figure 2-5. Note the symbol used to indicate avariable ac source in this circuit. Set the Resistive Load module for the givenresistance value, and connect inputs E1 and I1 to measure the circuit voltageand current.
Figure 2-5. AC sine wave circuit.
PROCEDURE
Local ac power network
(Ω) Voltage(V)
Frequency(Hz)
120 60 300
220 50 1100
220 60 1100
240 50 1200
Ex. 2-1 – The Sine Wave Procedure
© Festo Didactic 584079 55
4. Make sure that the data acquisition module is connected to a USB port of thecomputer.
Connect the POWER INPUT of the data acquisition module to the24 V - AC output of the Power Supply. Set the 24 V - AC power switch to theI (ON) position.
5. Start the Data Acquisition software (LVDAC or LVDAM). Open setupconfiguration file ES12-1.dai.
a If you are using LVSIM-EMS in LVVL, you must use the IMPORT option in theFile menu to open the configuration file.
a The metering setup configuration can be changed during the exercise ifdesired. This exercise was written using those given.
Make sure that the continuous refresh mode is selected.
6. Turn on the main Power Supply and adjust the voltage control knob to 100%.
7. Use the Data Table to store the values of the measured circuit voltage andcurrent.
8. Click on the Oscilloscope button and display E1 and I1 on CH1 and CH2. Ifnecessary, readjust the time base to show at least two cycles of the sinewaves.
9. Set convenient vertical scales for the display and note the peak amplitudes ofthe voltage and current.
V
A
10. Multiply the peak values by 0.707 and compare with the results stored in theData Table.
0.707 V
0.707 A
Ex. 2-1 – The Sine Wave Procedure
56 © Festo Didactic 584079
11. Is there a difference between your calculations and the stored values?
a The results in the Data Table are rms values. Also, the waveform data box ofthe Oscilloscope screen gives the rms value of the signals applied to the inputchannels, their average value, and the frequency.
12. Compare the current waveform with the voltage waveform. Are they bothsine waves?
Yes No
13. What is the approximate amplitude of the voltage sine wave at 225°?
Amplitude V
14. What is the time period for one complete cycle of the ac voltage waveform?
ms
15. Calculate the frequency.
1Hz
16. Compare the frequency of the current waveform to that of the voltage. Arethey the same?
Yes No
17. Do the current and voltage waveforms reach their maximum and minimumvalues at the same time, as well as passing through zero amplitude?
a When the conditions of going through zero and reaching maximum at thesame time occur, the waveforms are said to be in phase, meaning that there isno phase angle separation between them.
Yes No
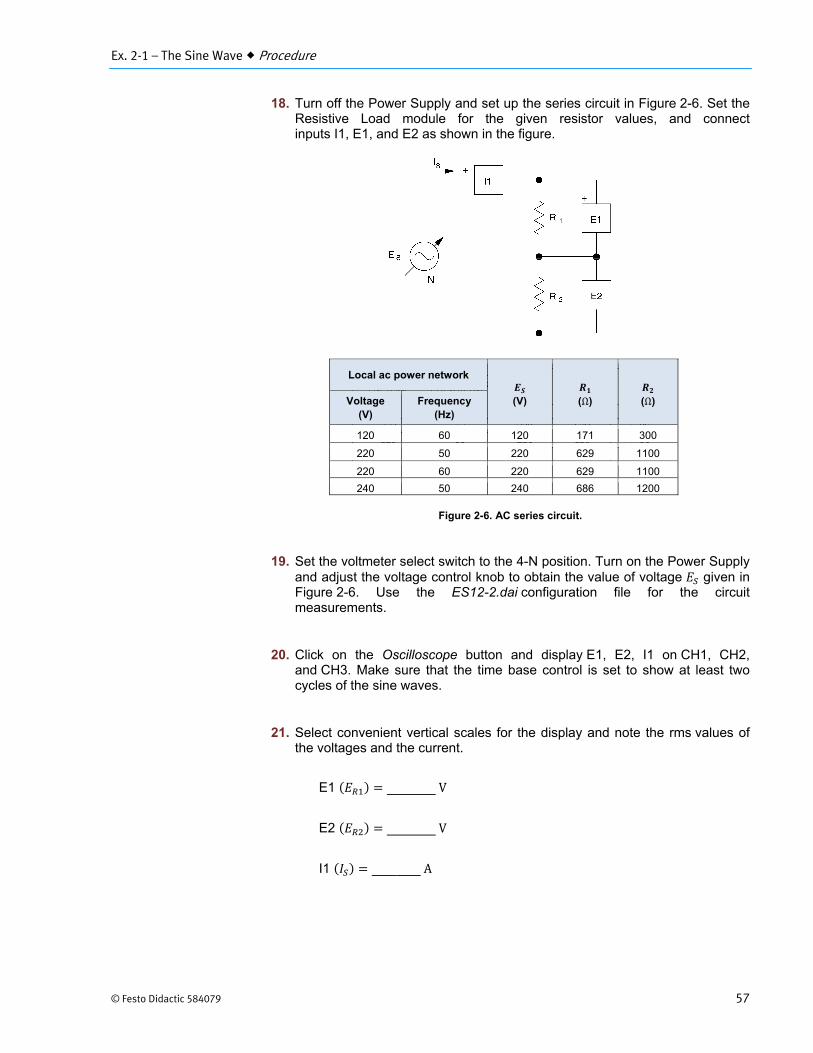
Ex. 2-1 – The Sine Wave Procedure
© Festo Didactic 584079 57
18. Turn off the Power Supply and set up the series circuit in Figure 2-6. Set theResistive Load module for the given resistor values, and connectinputs I1, E1, and E2 as shown in the figure.
Figure 2-6. AC series circuit.
19. Set the voltmeter select switch to the 4-N position. Turn on the Power Supplyand adjust the voltage control knob to obtain the value of voltage given inFigure 2-6. Use the ES12-2.dai configuration file for the circuitmeasurements.
20. Click on the Oscilloscope button and display E1, E2, I1 on CH1, CH2,and CH3. Make sure that the time base control is set to show at least twocycles of the sine waves.
21. Select convenient vertical scales for the display and note the rms values ofthe voltages and the current.
E1 V
E2 V
I1 A
Local ac power network
(V) (Ω) (Ω) Voltage(V)
Frequency(Hz)
120 60 120 171 300
220 50 220 629 1100
220 60 220 629 1100
240 50 240 686 1200
Ex. 2-1 – The Sine Wave Procedure
58 © Festo Didactic 584079
22. Compare the ratio of the voltages to the ratio of the resistors.
23. Calculate the voltage drops for each resistor using the values given inFigure 2-6 and compare with the measured rms values of step 21.
V
V
24. Calculate the value of source current that should flow in this circuit andcompare with the measured rms value of step 21.
A
25. Do the results of steps 21, 22, 23, and 24 demonstrate that Ohm's law,Kirchhoff's laws, and the other circuit theory of Unit 1 is valid for ac circuits?
Yes No
26. Observe the current and voltage waveforms and notice that they have thesame type of relationship as the waveforms in step 17. Does this mean thatthey are in phase?
Yes No
27. Ensure that the Power Supply is turned off, and that the voltage control knobis turned fully counterclockwise. Remove all leads and cables.

Ex. 2-1 – The Sine Wave Conclusion
© Festo Didactic 584079 59
In this exercise, you demonstrated that a sine wave of voltage produces a sine wave of current, and that the rms value of a sine wave equals 0.707 times the peak amplitude. You also confirmed that the frequency is the reciprocal of the waveform's period, and you saw that the theory presented in Unit 1 is valid for ac circuits.
1. The peak-to-peak amplitude of a sine wave is 200 V. What is the rms value?
a. 282 Vb. 70.7 Vc. 141 Vd. 14.1 V
2. The period of a sine wave is 0.02 seconds. What is its frequency?
a. 5 Hzb. 50 Hzc. 50 sd. 0.02 Hz
3. An ac voltage can be considered as a dc voltage that is continually changingits amplitude and polarity.
a. False.b. True in cases when the current is zero.c. True.d. None of the above.
4. One complete cycle of a sine wave is the same as one circular rotation of360°.
a. True in cases where the frequency is less than 100 Hz.b. True.c. False because a sine wave is not a circle.d. False.
5. When are two sine waves said to be in phase?
a. When the current leads the voltage.b. When they both attain their maximum values at the same
time.c. When they both go through zero at the same time.d. Both b and c together.
CONCLUSION
REVIEW QUESTIONS

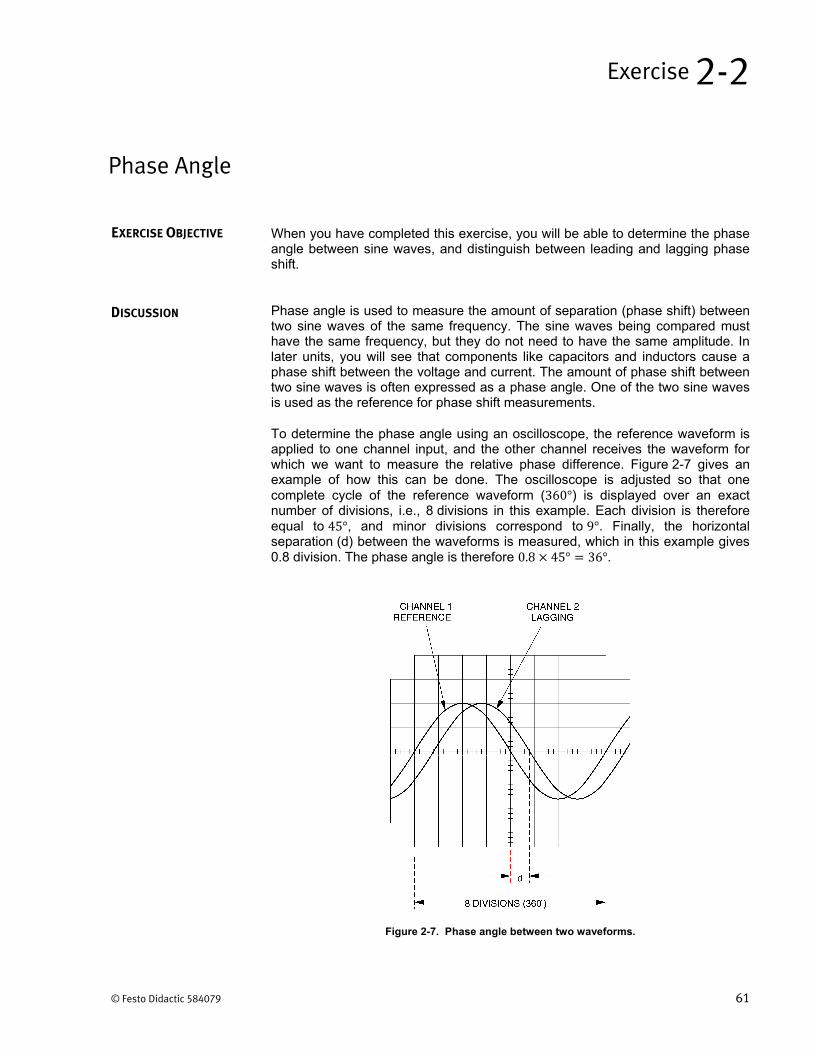
© Festo Didactic 584079 61
When you have completed this exercise, you will be able to determine the phase angle between sine waves, and distinguish between leading and lagging phase shift.
Phase angle is used to measure the amount of separation (phase shift) between two sine waves of the same frequency. The sine waves being compared must have the same frequency, but they do not need to have the same amplitude. In later units, you will see that components like capacitors and inductors cause a phase shift between the voltage and current. The amount of phase shift between two sine waves is often expressed as a phase angle. One of the two sine waves is used as the reference for phase shift measurements.
To determine the phase angle using an oscilloscope, the reference waveform is applied to one channel input, and the other channel receives the waveform for which we want to measure the relative phase difference. Figure 2-7 gives an example of how this can be done. The oscilloscope is adjusted so that one complete cycle of the reference waveform (360°) is displayed over an exact number of divisions, i.e., 8 divisions in this example. Each division is therefore equal to 45°, and minor divisions correspond to 9°. Finally, the horizontal separation (d) between the waveforms is measured, which in this example gives 0.8 division. The phase angle is therefore 0.8 45° 36°.
Figure 2-7. Phase angle between two waveforms.
Phase Angle
Exercise 2-2
EXERCISE OBJECTIVE
DISCUSSION
Ex. 2-2 – Phase Angle Procedure
62 © Festo Didactic 584079
The second waveform lags the reference waveform since it reaches maximum amplitude after the reference waveform. As the figure shows, a lagging waveform is shifted to the right of the reference on the oscilloscope display. Since the phase is lagging, it is common to see a minus sign or the word lagging included with the number, i.e. 36°, or 36° lagging. This is a standard shorthand way of indicating whether the phase is leading or lagging. If the second waveform were shifted to the left on the oscilloscope, the phase shift would be leading, since the second waveform reaches maximum before the reference waveform. Phase shift could also be indicated by using positive numbers for phase differences greater than 180°. If you examine closely the waveforms in Figure 2-3, it becomes clear that a phase shift of 270° leading is the same as 90° lagging. Further along in the study program, you will set up circuits with capacitors and inductors that cause large phase shifts between voltages and currents.
EQUIPMENT REQUIRED
Refer to the Equipment Utilization Chart in Appendix C to obtain the list of equipment required for this exercise.
High voltages are present in this laboratory exercise. Do not make or modify any banana jack connections with the power on unless otherwise specified.
1. Install the Power Supply and data acquisition module in theEMS Workstation.
2. Make sure that the main power switch of the Power Supply is set to theO (OFF) position, and the voltage control knob is turned fullycounterclockwise. Make sure that the Power Supply is connected to a three-phase wall receptacle.
3. Set up the circuit shown in Figure 2-8. Connect inputs E1, E2, and E3 tomeasure the phase voltages of the Power Supply at 1-N, 2-N, and 3-N.
Make sure that that the data acquisition module is connected to a USB portof the computer. Connect the POWER INPUT of the data acquisition moduleto the 24 V - AC output of the Power Supply. Set the 24 V - AC power switchto the I (ON) position.
PROCEDURE
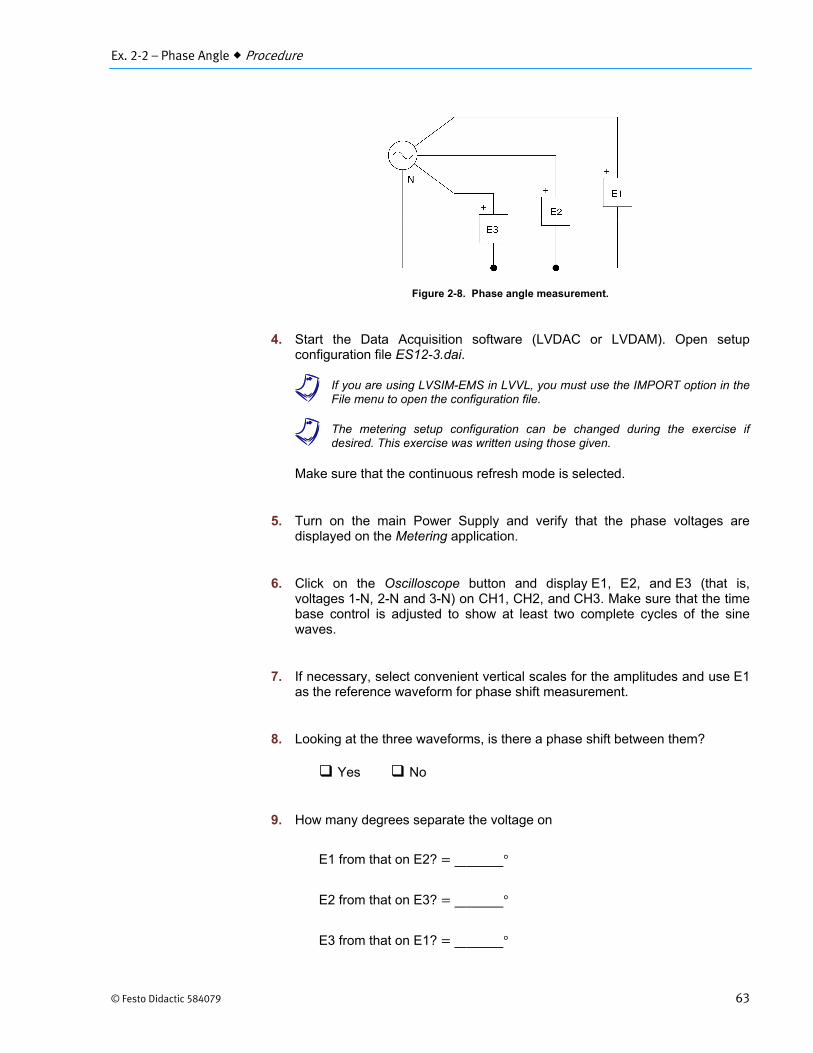
Ex. 2-2 – Phase Angle Procedure
© Festo Didactic 584079 63
Figure 2-8. Phase angle measurement.
4. Start the Data Acquisition software (LVDAC or LVDAM). Open setupconfiguration file ES12-3.dai.
a If you are using LVSIM-EMS in LVVL, you must use the IMPORT option in theFile menu to open the configuration file.
a The metering setup configuration can be changed during the exercise ifdesired. This exercise was written using those given.
Make sure that the continuous refresh mode is selected.
5. Turn on the main Power Supply and verify that the phase voltages aredisplayed on the Metering application.
6. Click on the Oscilloscope button and display E1, E2, and E3 (that is,voltages 1-N, 2-N and 3-N) on CH1, CH2, and CH3. Make sure that the timebase control is adjusted to show at least two complete cycles of the sinewaves.
7. If necessary, select convenient vertical scales for the amplitudes and use E1as the reference waveform for phase shift measurement.
8. Looking at the three waveforms, is there a phase shift between them?
Yes No
9. How many degrees separate the voltage on
E1 from that on E2? °
E2 from that on E3? °
E3 from that on E1? °
Ex. 2-2 – Phase Angle Procedure
64 © Festo Didactic 584079
10. Is the voltage on E1 leading or lagging the voltage on E2 by 120°?
11. Is the voltage on E3 leading or lagging the voltage on E1 by 240°?
12. You will have noticed that the voltages on E1, E2, and E3 are separatedby 120°, which is the case for standard three-phase alternating current. If thevoltage on E2 is now used as the reference waveform, is it leading or laggingthe voltage on E1 by 120°?
13. Change the time base setting on the oscilloscope to increase the number ofcycles displayed. Does the amount of phase shift between the waveformschange?
Yes No
14. Change the vertical scale settings on the oscilloscope. Does the amount ofphase shift between the waveforms change?
Yes No
15. Turn on the Cursors, and use the left and right cursors to measure the timedifference between the waveforms displayed on channels E1, E2, and E3at the point where they pass through zero amplitude.
(E1 - E2)
(E3 - E1)
(E2 - E3)
16. Determine the phase angle between the waveforms. Note that is the periodof the reference waveform.
Phaseangle 360° °

Ex. 2-2 – Phase Angle Procedure
© Festo Didactic 584079 65
17. Are the measured values similar to the results of step 9?
Yes No
18. Ensure that the Power Supply is turned off, and that the voltage control knobis turned fully counterclockwise. Remove all leads and cables.
Ex. 2-2 – Phase Angle Conclusion
66 © Festo Didactic 584079
In this exercise, you observed three sine waves that were separated in phase by 120°. You also saw that to determine whether one waveform leads or lags another, it is necessary to decide which waveform will be used as the reference.
1. Phase angle can be used as
a. a measurement of the period of a periodic waveform.b. an indication of a signal's frequency.c. a measurement of the separation between two waveforms.d. only valid when three-phase signals are considered.
2. A sine wave has a leading phase angle of 72°. Will it reach maximum beforeor after the reference waveform?
a. After.b. Before.c. It depends on the frequency.d. None of the above.
3. Three-phase ac power consists of three sine waves separated by 120°?
a. True in North America only.b. False.c. True.d. False since square waves are sometimes used.
4. A sine wave has a phase angle of 45°. Is the reference waveform leadingor lagging this sine wave?
a. Leading.b. Lagging.c. Neither, it is in phase.d. The reference cannot lead or lag another waveform.
5. The oscilloscope waveforms of the current and voltage in a circuit show thata large phase difference exists between the two. What does this indicateabout the type of circuit components?
a. Nothingb. They must be defective.c. They are all resistors.d. There must be capacitors and/or inductors in the circuit.
CONCLUSION
REVIEW QUESTIONS

© Festo Didactic 584079 67
When you have completed this exercise, you will be able to explain and demonstrate the concept of instantaneous power. You will also be able to determine the average power dissipated in a resistive load when it is connected to a source of alternating current.
When electrical power is supplied to a dc motor, part of the power is converted into mechanical energy and the remainder is converted into heat. When power is supplied to a storage battery during charging, some of the power is converted to chemical energy, while the rest is converted into heat. However, when power is supplied to a resistor, all of it is converted into heat. This conversion of electrical power into heat is a very efficient process, and we make use of it every day in electric toasters, stoves, and electrically-heated homes.
As you have seen in Unit 1, power is the product of the voltage and the current in dc circuits. The same is true for ac circuits, except that it is important to know whether one is talking about instantaneous power or average power. From what has been seen so far, it should be clear that the power dissipated by a resistor connected to an ac source varies sinusoidally with time, since the circuit voltage and current are sine waves. Instantaneous power is simply the product of calculated at each instant in the sine wave cycle. If a wattmeter were connected to measure power in the circuit of Figure 2-9, it would indicate a value other than zero, even though the average value of the voltage and current waveforms is zero over a period.
Instantaneous Power
Exercise 2-3
EXERCISE OBJECTIVE
DISCUSSION
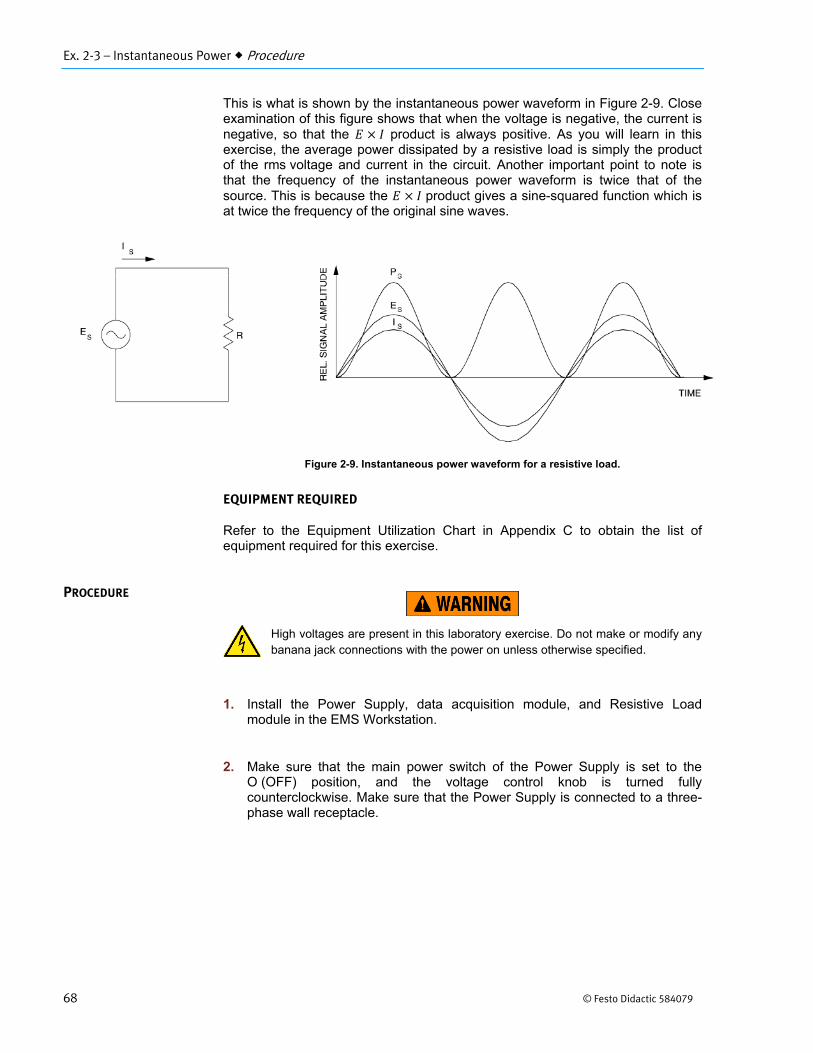
Ex. 2-3 – Instantaneous Power Procedure
68 © Festo Didactic 584079
This is what is shown by the instantaneous power waveform in Figure 2-9. Close examination of this figure shows that when the voltage is negative, the current is negative, so that the product is always positive. As you will learn in this exercise, the average power dissipated by a resistive load is simply the product of the rms voltage and current in the circuit. Another important point to note is that the frequency of the instantaneous power waveform is twice that of the source. This is because the product gives a sine-squared function which is at twice the frequency of the original sine waves.
Figure 2-9. Instantaneous power waveform for a resistive load.
EQUIPMENT REQUIRED
Refer to the Equipment Utilization Chart in Appendix C to obtain the list of equipment required for this exercise.
High voltages are present in this laboratory exercise. Do not make or modify any banana jack connections with the power on unless otherwise specified.
1. Install the Power Supply, data acquisition module, and Resistive Loadmodule in the EMS Workstation.
2. Make sure that the main power switch of the Power Supply is set to theO (OFF) position, and the voltage control knob is turned fullycounterclockwise. Make sure that the Power Supply is connected to a three-phase wall receptacle.
PROCEDURE
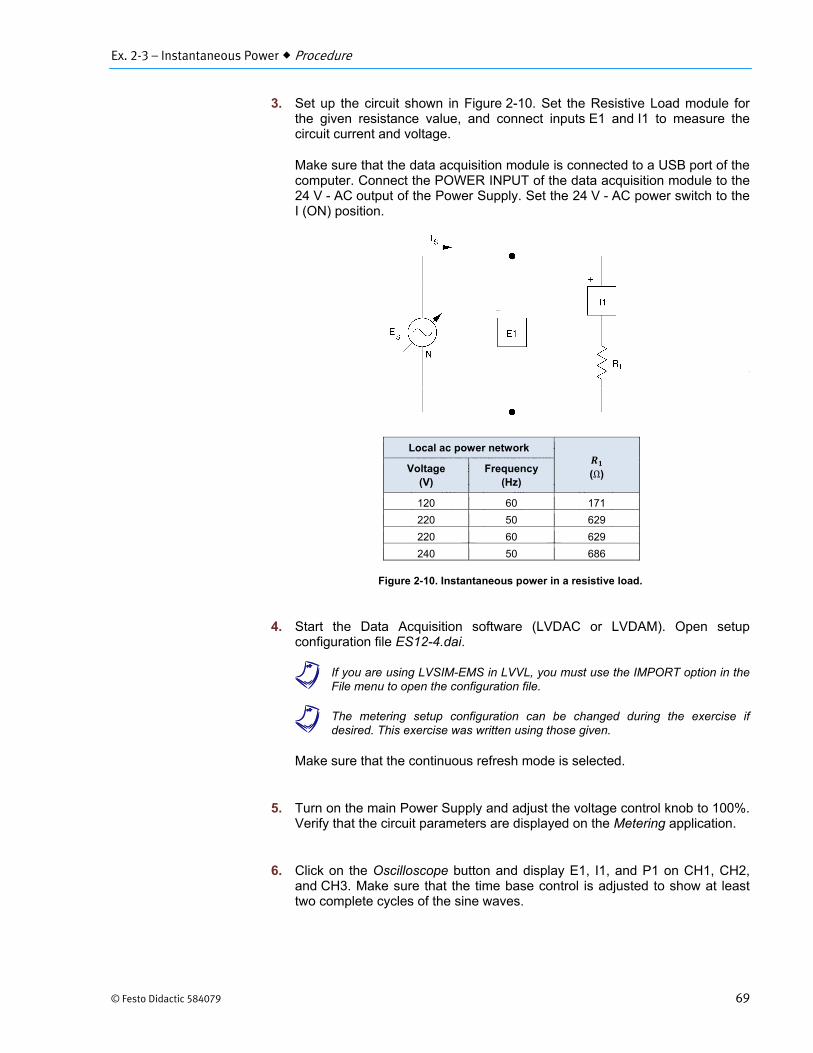
Ex. 2-3 – Instantaneous Power Procedure
© Festo Didactic 584079 69
3. Set up the circuit shown in Figure 2-10. Set the Resistive Load module forthe given resistance value, and connect inputs E1 and I1 to measure thecircuit current and voltage.
Make sure that the data acquisition module is connected to a USB port of thecomputer. Connect the POWER INPUT of the data acquisition module to the24 V - AC output of the Power Supply. Set the 24 V - AC power switch to theI (ON) position.
Figure 2-10. Instantaneous power in a resistive load.
4. Start the Data Acquisition software (LVDAC or LVDAM). Open setupconfiguration file ES12-4.dai.
a If you are using LVSIM-EMS in LVVL, you must use the IMPORT option in theFile menu to open the configuration file.
a The metering setup configuration can be changed during the exercise ifdesired. This exercise was written using those given.
Make sure that the continuous refresh mode is selected.
5. Turn on the main Power Supply and adjust the voltage control knob to 100%.Verify that the circuit parameters are displayed on the Metering application.
6. Click on the Oscilloscope button and display E1, I1, and P1 on CH1, CH2,and CH3. Make sure that the time base control is adjusted to show at leasttwo complete cycles of the sine waves.
Local ac power network
(Ω) Voltage(V)
Frequency(Hz)
120 60 171
220 50 629
220 60 629
240 50 686

Ex. 2-3 – Instantaneous Power Procedure
70 © Festo Didactic 584079
7. Select convenient vertical scales for the display and note the rms values ofthe voltage and current, and the average power (AVG) for P1.
E1 V
I1 A
P1 W
8. Compare the current waveform with the voltage waveform. Do they have thesame frequency?
Yes No
9. What are the time period and frequency of the instantaneous powerwaveform?
ms
1Hz
10. How does the frequency of the instantaneous power waveform compare withthose of the current and voltage waveforms?
11. Are the current, voltage, and power waveforms in phase?
12. Calculate the product of the rms values of the current and voltage andcompare it with the AVG value for P1 given in the waveform data box of theOscilloscope screen.
W
P1 W
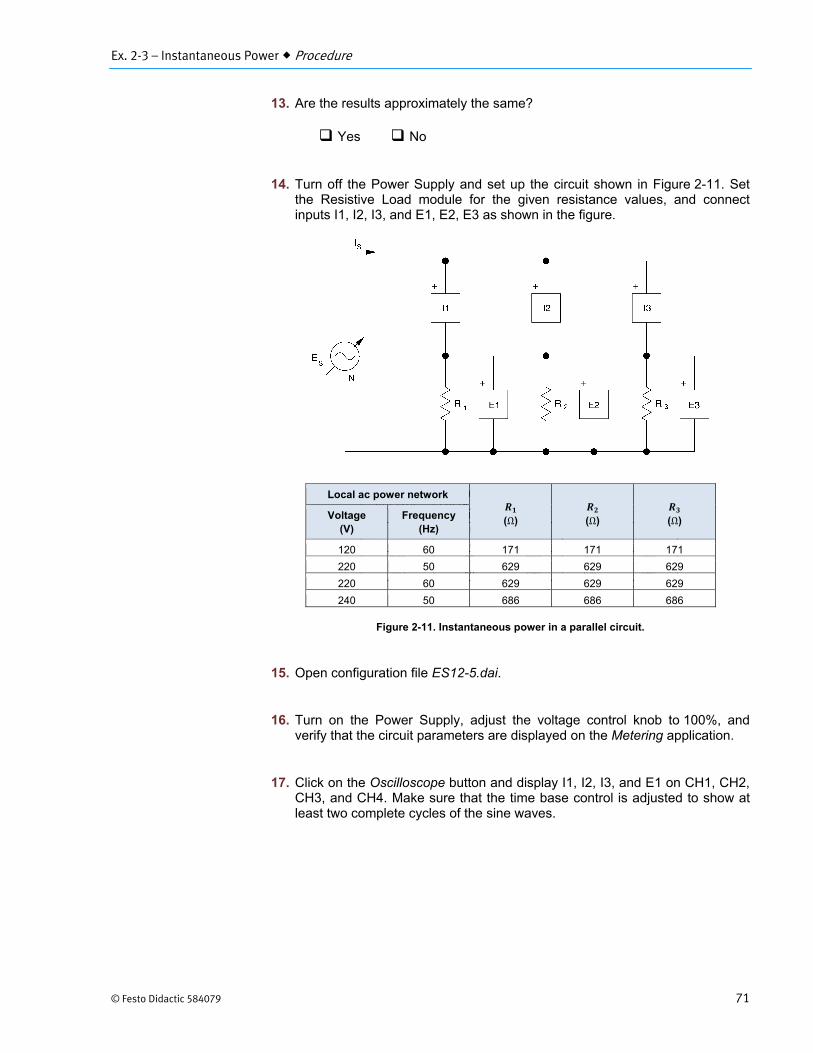
Ex. 2-3 – Instantaneous Power Procedure
© Festo Didactic 584079 71
13. Are the results approximately the same?
Yes No
14. Turn off the Power Supply and set up the circuit shown in Figure 2-11. Setthe Resistive Load module for the given resistance values, and connectinputs I1, I2, I3, and E1, E2, E3 as shown in the figure.
Figure 2-11. Instantaneous power in a parallel circuit.
15. Open configuration file ES12-5.dai.
16. Turn on the Power Supply, adjust the voltage control knob to 100%, andverify that the circuit parameters are displayed on the Metering application.
17. Click on the Oscilloscope button and display I1, I2, I3, and E1 on CH1, CH2,CH3, and CH4. Make sure that the time base control is adjusted to show atleast two complete cycles of the sine waves.
Local ac power network
(Ω) (Ω) (Ω) Voltage(V)
Frequency(Hz)
120 60 171 171 171
220 50 629 629 629
220 60 629 629 629
240 50 686 686 686

Ex. 2-3 – Instantaneous Power Procedure
72 © Festo Didactic 584079
18. Select convenient vertical scales for the display and note the rms value of thevoltage and currents below.
E1 V
I1 A
I2 A
I3 A
19. Calculate the product of the voltage and the currents to obtain the powerdissipated in each of the three resistors R1, R2, and R3.
W
W
W
20. What is the total power dissipated by the circuit?
W
21. On the Oscilloscope, display P1, P2, and P3 on CH5, CH6, and CH7. Notethe values given in the waveform data box.
P1 W
P2 W
P3 W
22. What is the total measured power?
W

Ex. 2-3 – Instantaneous Power Procedure
© Festo Didactic 584079 73
23. Compare the results of steps 20 and 22. Is the total power approximately thesame in both cases?
Yes No
24. Compare the phase angles between the different waveforms. Is there anyappreciable phase shift?
Yes No
25. Do the instantaneous power waveforms of , , and confirm that thepower dissipated in a resistive circuit is always positive?
Yes No
26. Ensure that the Power Supply is turned off, and that the voltage control knobis turned fully counterclockwise. Remove all leads and cables.
Ex. 2-3 – Instantaneous Power Conclusion
74 © Festo Didactic 584079
In this exercise, you demonstrated that the instantaneous power waveform produced when alternating current is connected to a resistive load is always positive and has a frequency twice that of the ac source. You also saw that the average power dissipated by the load is the product of the rms values of the circuit currents and voltages.
1. The average power dissipated in an ac circuit is equal to
a. zero over a period.b. the square of the voltage divided by the current.c. one-half the peak value.d. equal to the product of the rms values of and .
2. The power waveform in an ac circuit is a sine wave at double the sourcefrequency.
a. True.b. False, because the average power is greater than zero.c. True, but only with a resistive load.d. False, the power waveform is a square wave.
3. The instantaneous power waveform shows that the power is always positiveeven though the voltage and current waveforms in an ac circuit alternatebetween positive and negative values.
a. False.b. True when the load is resistive.c. True all the time.d. It depends on the waveform frequency.
4. What is the average power dissipated by a 100-Ω resistor when it isconnected to an ac source with a peak value of 141 V
a. 1410 Wb. 14.1 Wc. 141 Wd. 100 W
5. Is it possible to have "negative power" in an ac circuit?
a. Yes, when capacitors or inductors are connected.b. No.c. Only if the source frequency is very low.d. Negative power is possible only in extreme cases.
CONCLUSION
REVIEW QUESTIONS

Unit 2 – Alternating Current Unit Test
© Festo Didactic 584079 75
Unit Test
1. The rms value of a sine wave voltage equals 1 √2⁄ , which is thedc equivalent value that will produce the same heating effect.
a. False.b. True.c. It depends on the load.d. It depends on the frequency.
2. What is the period of a sine wave whose frequency is 120 Hz?
a. 120 msb. 8.3 msc. 33.4 msd. 16.7 ms
3. Alternating current is one which periodically changes direction and alternatesbetween maximum positive and negative values.
a. True.b. False.c. Only if the rms value is greater than zero.d. None of the above.
4. What is the normal phase shift between the voltage and current in a circuitwith only a resistive load?
a. 180°b. 90°c. There is no phase shift.d. It depends on the power dissipated in the load.
5. What is the period of a sine wave whose frequency is 50 Hz?
a. 35 msb. 25 msc. 20 msd. 16.7 ms
6. Knowing the phase angle between the voltage and current allows us to
a. know the frequency.b. determine if the power is instantaneous.c. determine the rms amplitude of the waveforms.d. know if only resistors are present in the circuit.

Unit 2 – Alternating Current Unit Test
76 © Festo Didactic 584079
7. Alternating current will produce more power in a given circuit than adc voltage with the same value as the peak ac voltage.
a. True.b. False, because the average ac value is zero over a complete period.c. False, because the dc voltage is greater than the rms ac voltage.d. True, because power equals the product of the rms values of and .
8. The instantaneous power waveform in a dc circuit is the same as in anac circuit.
a. True.b. False, it is a straight line.c. True, but the frequency is very low.d. False, instantaneous power does not exist in dc circuits.
9. It is impossible to solve ac circuits since Ohm's law and Kirchhoff's laws usedin solving dc circuits do not apply.
a. True.b. False except when dealing with inductive loads.c. True if the circuit only has resistors.d. False, all the laws used so far apply to ac circuits.
10. What is the peak ac voltage required to produce the same average power asa dc voltage of 50 V?
a. 141 Vb. 70.7 Vc. 50 Vd. 50 √2⁄ V
© Festo Didactic 584079 77
When you have completed this unit, you will be able to demonstrate and explain the effects of capacitors in ac circuits. You will use circuit measurements to determine the capacitive reactance of capacitors, and you will measure and observe the phase shift between voltage and current caused by capacitors.
The fundamental property of capacitors is to oppose voltage changes across their terminals. The opposition to voltage changes is proportional to the capacitor's capacitance (C). When capacitance is added to an ac circuit, an effect similar to that produced by circuit resistance is observed, that is, there is opposition to the flow of current. This effect is due to capacitive reactance ( ), which is defined as the opposition created by capacitance to the flow of alternating current.
Capacitance is a measure of the amount of electrical charge that a capacitor can store in the dielectric between its two conducting plates when a given voltage is applied across them. The measurement unit for capacitance is the farad (F), which is an extremely large quantity. Most typical capacitors have values in the range of microfarads and picofarads, depending on whether they are used in electric power circuits or electronic circuits.
When a dc voltage is applied suddenly to a capacitor, a large current flows into the capacitor. The current continues to flow at a decreasing rate until the capacitor has charged up to the value of the source voltage . At that point, the current becomes zero because the voltage across the capacitor is no longer changing, and the capacitor is neither charging nor discharging. The current can be quite large if the voltage across the capacitor changes quickly. If the source voltage increases at a rapid rate, a large charging current flows into the capacitor, and the capacitor acts as a load and stores energy. Conversely, if the source voltage decreases at a rapid rate, a large discharging current flows out of the capacitor, the capacitor acts as a momentary source of power just like a generator, and releases energy. The ability to store electric energy comes from the electric field set up between the plates of the capacitor. The quantity of energy stored depends on the capacitor's capacitance and the applied voltage. When a capacitor is charging, it receives and stores energy but does not dissipate it. When it discharges, the stored energy will be released until the voltage across the capacitor drops to zero. These facts help in understanding the behavior of a capacitor when it is connected to an ac power source.
Capacitors in AC Circuits
Unit 3
UNIT OBJECTIVE
DISCUSSION OF
FUNDAMENTALS
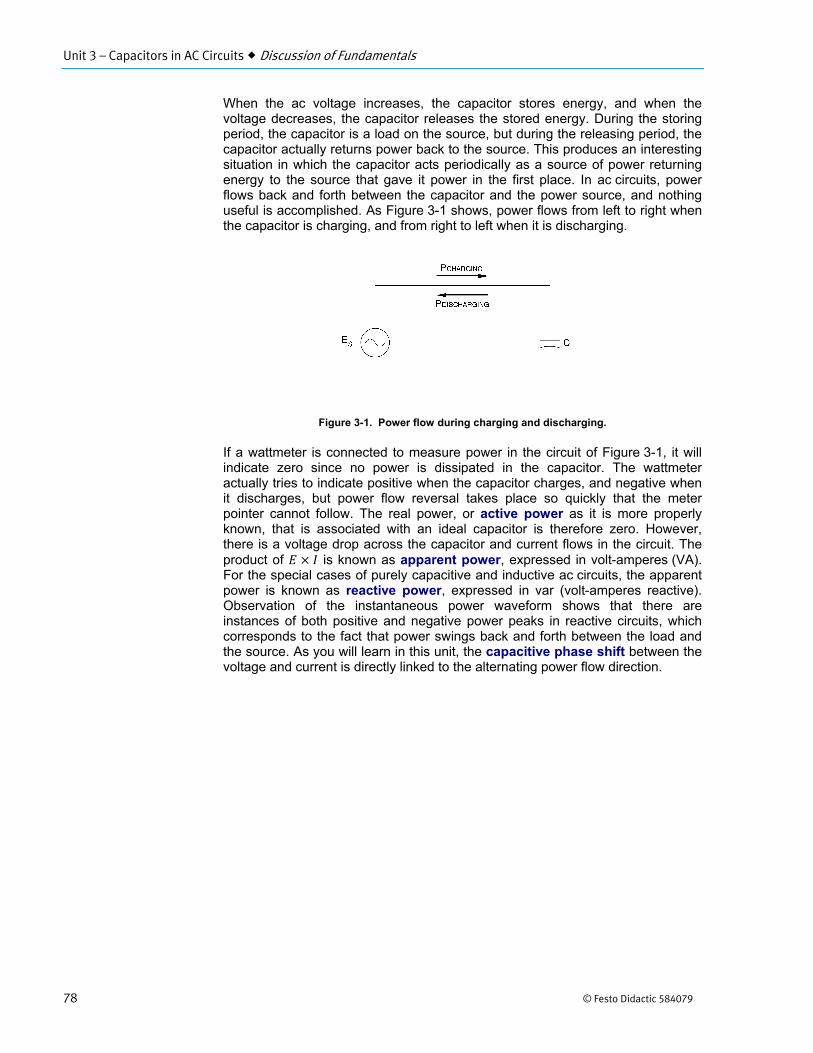
Unit 3 – Capacitors in AC Circuits Discussion of Fundamentals
78 © Festo Didactic 584079
When the ac voltage increases, the capacitor stores energy, and when the voltage decreases, the capacitor releases the stored energy. During the storing period, the capacitor is a load on the source, but during the releasing period, the capacitor actually returns power back to the source. This produces an interesting situation in which the capacitor acts periodically as a source of power returning energy to the source that gave it power in the first place. In ac circuits, power flows back and forth between the capacitor and the power source, and nothing useful is accomplished. As Figure 3-1 shows, power flows from left to right when the capacitor is charging, and from right to left when it is discharging.
Figure 3-1. Power flow during charging and discharging.
If a wattmeter is connected to measure power in the circuit of Figure 3-1, it will indicate zero since no power is dissipated in the capacitor. The wattmeter actually tries to indicate positive when the capacitor charges, and negative when it discharges, but power flow reversal takes place so quickly that the meter pointer cannot follow. The real power, or active power as it is more properly known, that is associated with an ideal capacitor is therefore zero. However, there is a voltage drop across the capacitor and current flows in the circuit. The product of is known as apparent power, expressed in volt-amperes (VA). For the special cases of purely capacitive and inductive ac circuits, the apparent power is known as reactive power, expressed in var (volt-amperes reactive). Observation of the instantaneous power waveform shows that there are instances of both positive and negative power peaks in reactive circuits, which corresponds to the fact that power swings back and forth between the load and the source. As you will learn in this unit, the capacitive phase shift between the voltage and current is directly linked to the alternating power flow direction.
© Festo Didactic 584079 79
When you have completed this exercise, you will be able to determine capacitive reactance by using measurements of circuit currents and voltages.
Capacitive reactance is defined as the opposition to alternating current flow caused by capacitance. Its effect is similar to that caused by the resistance of resistors, but unlike resistance, capacitive reactance is dependent on frequency. It also depends on the capacitance value of the capacitor. Capacitance exists whenever two conducting surfaces are separated by a non-conducting medium. The contacts of an open switch, the terminals of a battery, the insulated windings of a coil or transformer, even the parallel conductors of a power transmission line, are capacitors. Practical capacitors, however are manufactured to be compact devices with specific capacitance that meet specific circuit requirements.
When a dc circuit containing capacitance is first energized, current flows and electrons pile up on one capacitor plate and leave the other. An electric field is created in the space between the plates as the excess electrons on one plate try to cross over to the other. The initial current, which is maximum, decreases as the potential across the capacitor plates increases to the potential of the source, at which point no more current can flow. If the capacitor were now removed from the circuit, it would retain this potential for some time. When a conducting path is provided between the capacitor plates, current flows for a short period of time until the capacitor is discharged. After a capacitor is charged in a dc circuit, it represents an open circuit, since current can no longer flow.
The formula for determining capacitive reactance in an ac circuit is as follows:
12
where is the capacitive reactance, expressed in ohms (Ω).
is the capacitance, expressed in farads (F).
is the ac source frequency, expressed in hertz (Hz).
Using the numerical value of 6.28 to replace the constant 2 is sufficient for most calculations dealing with capacitive reactance. Also, for 50 and 60 Hz circuits, 2 can be replaced with the equivalent numerical values 314 (50 Hz) and 377 (60 Hz), without causing much error.
The formula for determining capacitive reactance shows that it is inversely proportional to frequency and capacitance. Because of this, the reactance is reduced by half each time the capacitance is doubled. The same result is obtained if the frequency is doubled.
Capacitive Reactance
Exercise 3-1
EXERCISE OBJECTIVE
DISCUSSION
Ex. 3-1 – Capacitive Reactance Procedure
80 © Festo Didactic 584079
Since Ohm's law applies equally to ac and dc circuits, the capacitive reactance can also be determined from the circuit voltage and current, using the familiar formula seen in Unit 1 (repeated below):
This gives ⁄ , along with the equivalent expressions ⁄ and . and used in these expressions represent rms voltage and
current values.
These expressions of Ohm's law, along with the laws of Kirchhoff seen in earlier exercises are all valid for solving capacitive ac circuits.
The EMS Capacitive Load module used in this exercise consists of three identical sections each having three capacitors that can be added to a circuit using toggle switches. The selected value appears across the output terminals of each section when the appropriate switch is closed, and any two, or all three of the capacitors can be placed in parallel. The equivalent parallel capacitance is then present across the output terminals. This arrangement permits different values of capacitance, and consequently capacitive reactance, to be set. A table listing many of the reactance values which can be obtained is given in Appendix B of this manual. Also, the capacitance, current, and reactance values of each individual capacitor are silkscreened next to them on the module front panel. The current and reactance values are the nominal values obtained at the specified line voltage and frequency.
EQUIPMENT REQUIRED
Refer to the Equipment Utilization Chart in Appendix C to obtain the list of equipment required for this exercise.
High voltages are present in this laboratory exercise. Do not make or modify anybanana jack connections with the power on unless otherwise specified.
1. Install the Power Supply, data acquisition module, and Capacitive Loadmodule in the EMS Workstation.
2. Make sure that the main switch of the Power Supply is set to the O (OFF)position, and the voltage control knob is turned fully counterclockwise. Setthe voltmeter select switch to the 4-N position. Make sure that the PowerSupply is connected to a three-phase wall receptacle.
PROCEDURE
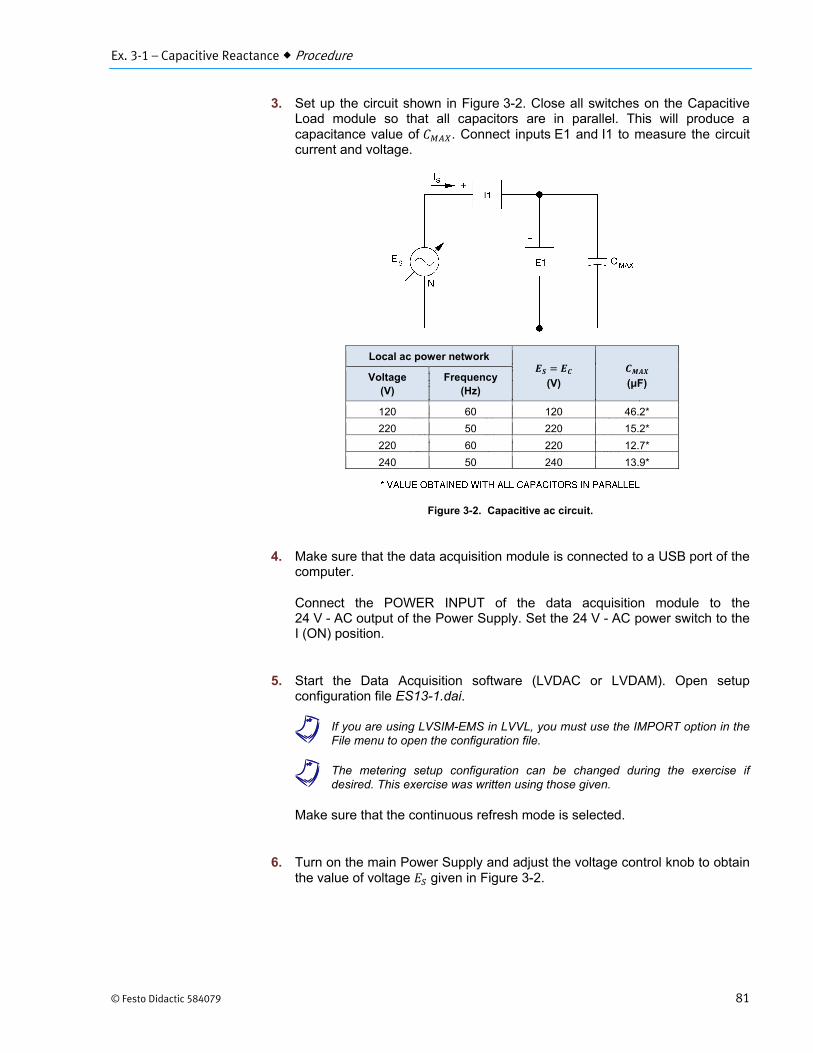
Ex. 3-1 – Capacitive Reactance Procedure
© Festo Didactic 584079 81
3. Set up the circuit shown in Figure 3-2. Close all switches on the CapacitiveLoad module so that all capacitors are in parallel. This will produce acapacitance value of . Connect inputs E1 and I1 to measure the circuitcurrent and voltage.
Figure 3-2. Capacitive ac circuit.
4. Make sure that the data acquisition module is connected to a USB port of thecomputer.
Connect the POWER INPUT of the data acquisition module to the24 V - AC output of the Power Supply. Set the 24 V - AC power switch to theI (ON) position.
5. Start the Data Acquisition software (LVDAC or LVDAM). Open setupconfiguration file ES13-1.dai.
a If you are using LVSIM-EMS in LVVL, you must use the IMPORT option in theFile menu to open the configuration file.
a The metering setup configuration can be changed during the exercise ifdesired. This exercise was written using those given.
Make sure that the continuous refresh mode is selected.
6. Turn on the main Power Supply and adjust the voltage control knob to obtainthe value of voltage given in Figure 3-2.
Local ac power network
(V)
(μF) Voltage
(V) Frequency
(Hz)
120 60 120 46.2*
220 50 220 15.2*
220 60 220 12.7*
240 50 240 13.9*
Ex. 3-1 – Capacitive Reactance Procedure
82 © Festo Didactic 584079
7. Use the Data Table to store the values of the measured circuit voltage andcurrent. Note the results below.
V
A
8. Use the measured values of and to determine the capacitivereactance of the circuit. , and .
Ω
9. Use the value obtained for to determine circuit capacitance .
12
μF
10. Is the value calculated in step 9 approximately equal to the value ofcapacitance set on the Capacitive Load module?
Yes No
11. Reduce the circuit capacitance by opening the three switches of onecomplete section on the Capacitive Load module. Measure and record and .
V
A
12. Determine for the new values of voltage and current obtained in theprevious step.
Ω

Ex. 3-1 – Capacitive Reactance Procedure
© Festo Didactic 584079 83
13. Reduce circuit capacitance once again by opening the switches on a secondsection of capacitors. Measure and , and calculate .
V
A
Ω
14. Calculate the ratios of the changes in reactance for the different circuits.
15. Knowing that the initial circuit was made up of three parallel capacitorshaving the same capacitance, do the ratios of step 14 show that thecapacitive reactance changed in inverse proportion to the ratios of thechanges in capacitance?
Yes No
16. With equal to 50% of the value used in step 6, calculate the circuit currentfor the present circuit reactance set in step 13.
A
17. Use the voltage control knob to set equal to 50% of the value used instep 6, and measure the circuit voltage and current.
V
A

Ex. 3-1 – Capacitive Reactance Procedure
84 © Festo Didactic 584079
18. Compare the measured value of current with the value calculated in step 16.Are they approximately equal?
Yes No
19. Does the ratio of circuit voltage to current correspond to the present value ofcircuit capacitive reactance ? Explain.
20. Did the change in source voltage affect the value of circuit reactance?
Yes No
21. Did the measured values of circuit voltages and currents demonstrate thatOhm's law is valid for capacitive ac circuits?
Yes No
22. Ensure that the Power Supply is turned off, and that the voltage control knobis turned fully counterclockwise. Remove all leads and cables.
Ex. 3-1 – Capacitive Reactance Conclusion
© Festo Didactic 584079 85
In this exercise, you determined the capacitive reactance for different ac circuits using Ohm's law and measurements of circuit voltages and currents. You also observed that Ohm's law is valid for capacitive ac circuits, and demonstrated that reactance changed in inverse proportion to the amount of circuit capacitance.
1. In a capacitive ac circuit with two unequal parallel capacitors, the rms valuesof the circuit voltage and current are 100 V and 2 A. What is the value of ?
a. 200 Ωb. 50 Ωc. 35.3 Ωd. 35.3 F
2. What will happen to the capacitive reactance of a circuit if the ac sourcefrequency is reduced by half?
a. It will double.b. It will be reduced by one-half.c. It will not change.d. It will change only if there is no resistance in the circuit.
3. At what frequency will a 27-μF capacitor have a reactance of 98 Ω?
a. 300 Hzb. 60 Hzc. 16 Hzd. 6 Hz
4. The formula used to determine capacitive reactance is
a. ⁄b.c. 2d. 1 2⁄
5. How does capacitive reactance vary with frequency and capacitance?
a. It varies directly with frequency and inversely withcapacitance.
b. It varies directly with frequency and capacitance.c. It varies inversely with frequency and capacitance.d. It varies inversely with frequency and directly with
capacitance.
CONCLUSION
REVIEW QUESTIONS

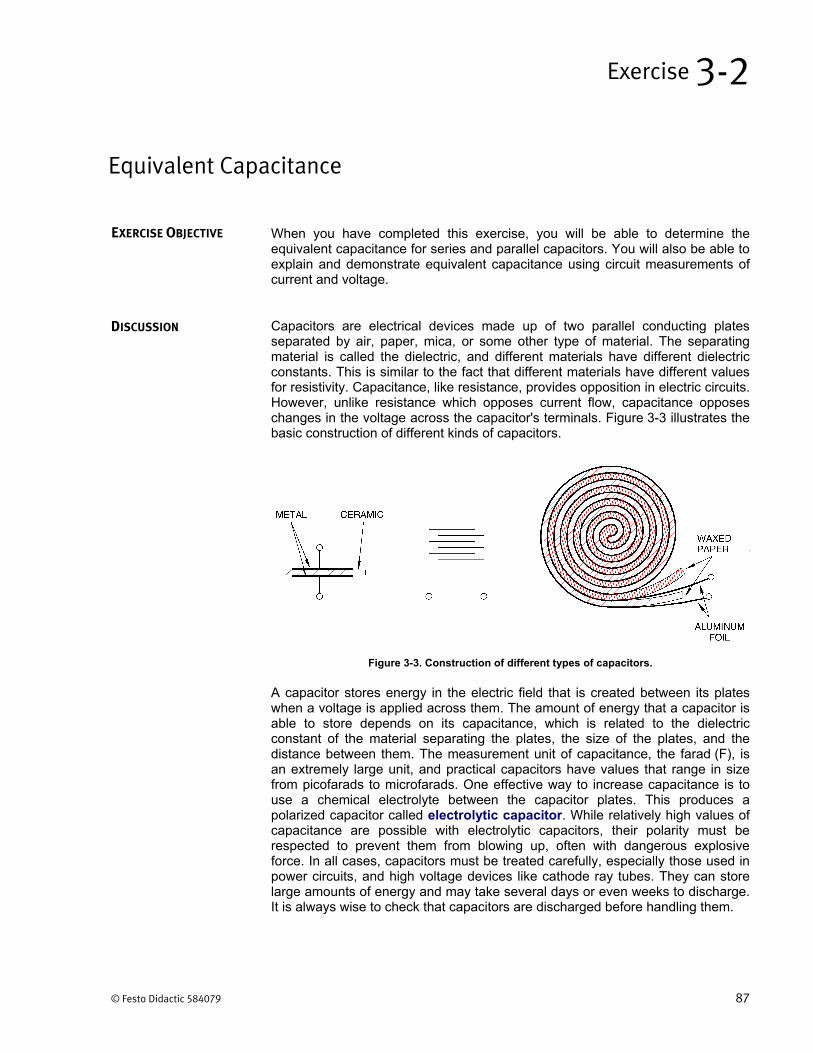
© Festo Didactic 584079 87
When you have completed this exercise, you will be able to determine the equivalent capacitance for series and parallel capacitors. You will also be able to explain and demonstrate equivalent capacitance using circuit measurements of current and voltage.
Capacitors are electrical devices made up of two parallel conducting plates separated by air, paper, mica, or some other type of material. The separating material is called the dielectric, and different materials have different dielectric constants. This is similar to the fact that different materials have different values for resistivity. Capacitance, like resistance, provides opposition in electric circuits. However, unlike resistance which opposes current flow, capacitance opposes changes in the voltage across the capacitor's terminals. Figure 3-3 illustrates the basic construction of different kinds of capacitors.
Figure 3-3. Construction of different types of capacitors.
A capacitor stores energy in the electric field that is created between its plates when a voltage is applied across them. The amount of energy that a capacitor is able to store depends on its capacitance, which is related to the dielectric constant of the material separating the plates, the size of the plates, and the distance between them. The measurement unit of capacitance, the farad (F), is an extremely large unit, and practical capacitors have values that range in size from picofarads to microfarads. One effective way to increase capacitance is to use a chemical electrolyte between the capacitor plates. This produces a polarized capacitor called electrolytic capacitor. While relatively high values of capacitance are possible with electrolytic capacitors, their polarity must be respected to prevent them from blowing up, often with dangerous explosive force. In all cases, capacitors must be treated carefully, especially those used in power circuits, and high voltage devices like cathode ray tubes. They can store large amounts of energy and may take several days or even weeks to discharge. It is always wise to check that capacitors are discharged before handling them.
Equivalent Capacitance
Exercise 3-2
EXERCISE OBJECTIVE
DISCUSSION
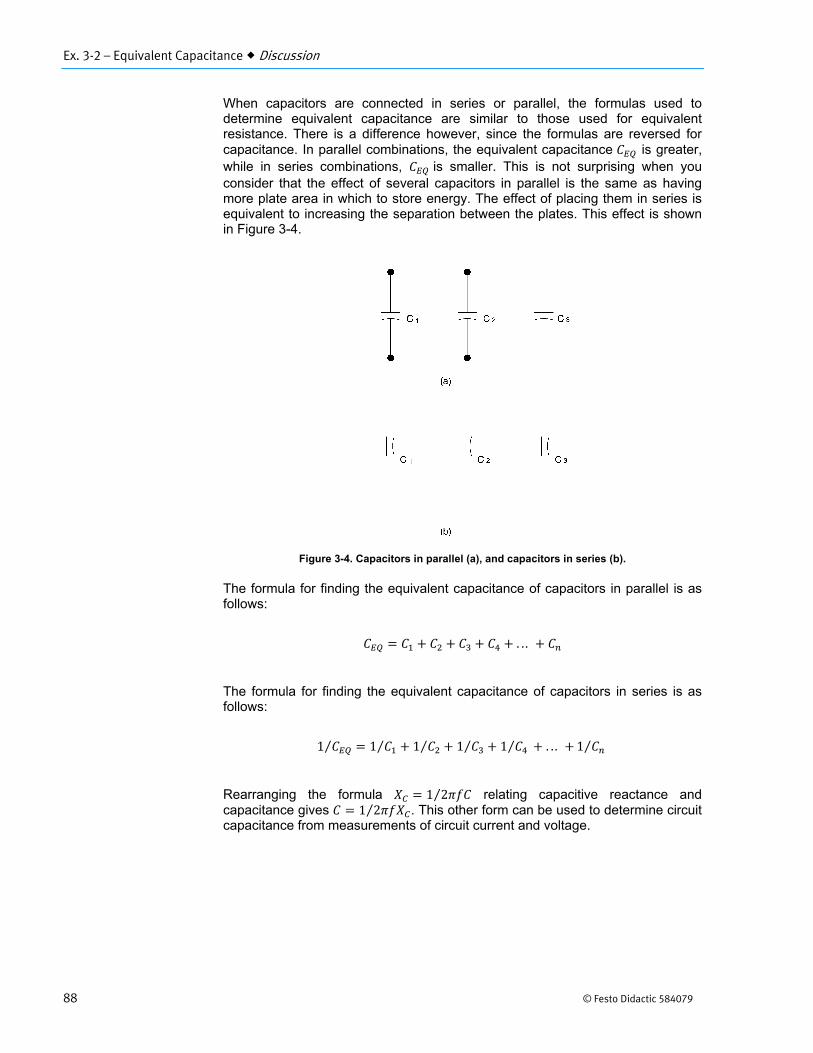
Ex. 3-2 – Equivalent Capacitance Discussion
88 © Festo Didactic 584079
When capacitors are connected in series or parallel, the formulas used to determine equivalent capacitance are similar to those used for equivalent resistance. There is a difference however, since the formulas are reversed for capacitance. In parallel combinations, the equivalent capacitance is greater, while in series combinations, is smaller. This is not surprising when you consider that the effect of several capacitors in parallel is the same as having more plate area in which to store energy. The effect of placing them in series is equivalent to increasing the separation between the plates. This effect is shown in Figure 3-4.
Figure 3-4. Capacitors in parallel (a), and capacitors in series (b).
The formula for finding the equivalent capacitance of capacitors in parallel is as follows:
. . .
The formula for finding the equivalent capacitance of capacitors in series is as follows:
1⁄ 1⁄ 1⁄ 1⁄ 1⁄ . . . 1⁄
Rearranging the formula 1 2⁄ relating capacitive reactance and capacitance gives 1 2⁄ . This other form can be used to determine circuit capacitance from measurements of circuit current and voltage.
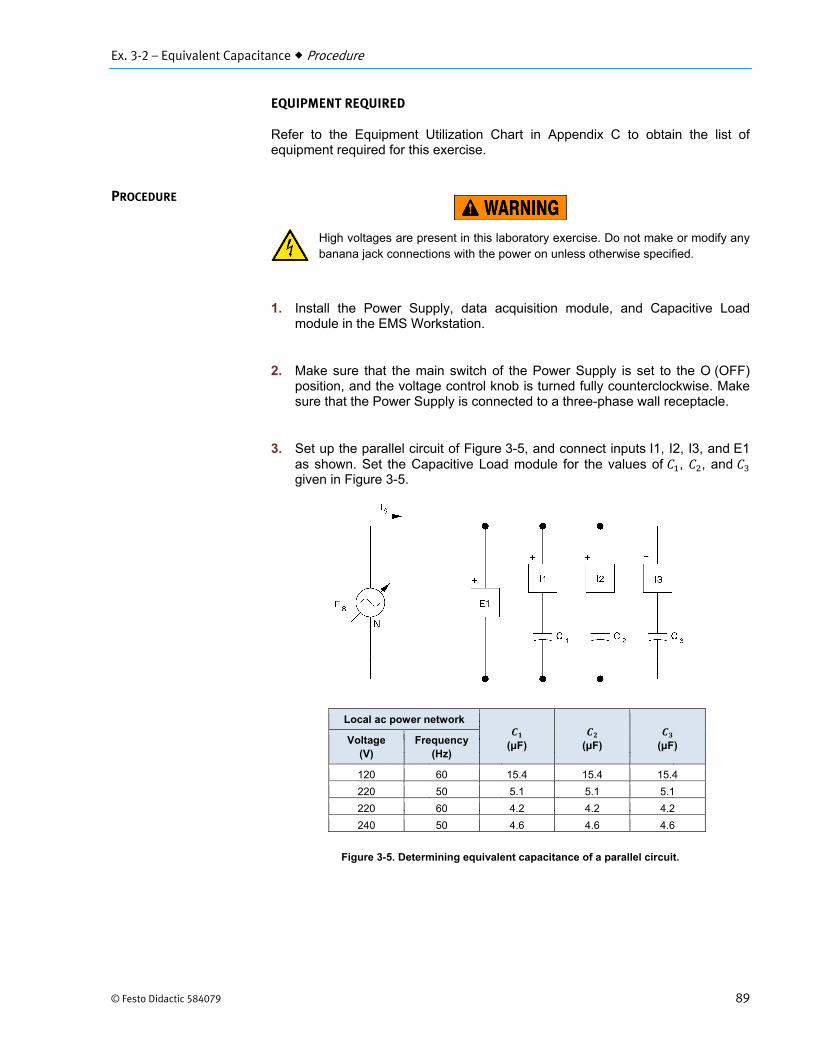
Ex. 3-2 – Equivalent Capacitance Procedure
© Festo Didactic 584079 89
EQUIPMENT REQUIRED
Refer to the Equipment Utilization Chart in Appendix C to obtain the list of equipment required for this exercise.
High voltages are present in this laboratory exercise. Do not make or modify anybanana jack connections with the power on unless otherwise specified.
1. Install the Power Supply, data acquisition module, and Capacitive Loadmodule in the EMS Workstation.
2. Make sure that the main switch of the Power Supply is set to the O (OFF)position, and the voltage control knob is turned fully counterclockwise. Makesure that the Power Supply is connected to a three-phase wall receptacle.
3. Set up the parallel circuit of Figure 3-5, and connect inputs I1, I2, I3, and E1as shown. Set the Capacitive Load module for the values of , , and given in Figure 3-5.
Figure 3-5. Determining equivalent capacitance of a parallel circuit.
PROCEDURE
Local ac power network
(μF) (μF) (μF) Voltage(V)
Frequency(Hz)
120 60 15.4 15.4 15.4
220 50 5.1 5.1 5.1
220 60 4.2 4.2 4.2
240 50 4.6 4.6 4.6
Ex. 3-2 – Equivalent Capacitance Procedure
90 © Festo Didactic 584079
4. Calculate the equivalent circuit capacitance using the capacitance valuesgiven in Figure 3-5.
μF
5. Make sure that the data acquisition module is connected to a USB port of thecomputer.
Connect the POWER INPUT of the data acquisition module to the24 V - AC output of the Power Supply. Set the 24 V - AC power switch to theI (ON) position.
6. Start the Data Acquisition software (LVDAC or LVDAM). Open setupconfiguration file ES13-2.dai.
a If you are using LVSIM-EMS in LVVL, you must use the IMPORT option in theFile menu to open the configuration file.
a The metering setup configuration can be changed during the exercise ifdesired. This exercise was written using those given.
Make sure that the continuous refresh mode is selected.
7. Turn on the main Power Supply and adjust the voltage control knob to 100%.
8. Use the Data Table to store the values of the measured circuit currents andvoltage. Note the results below.
A
A
A
V
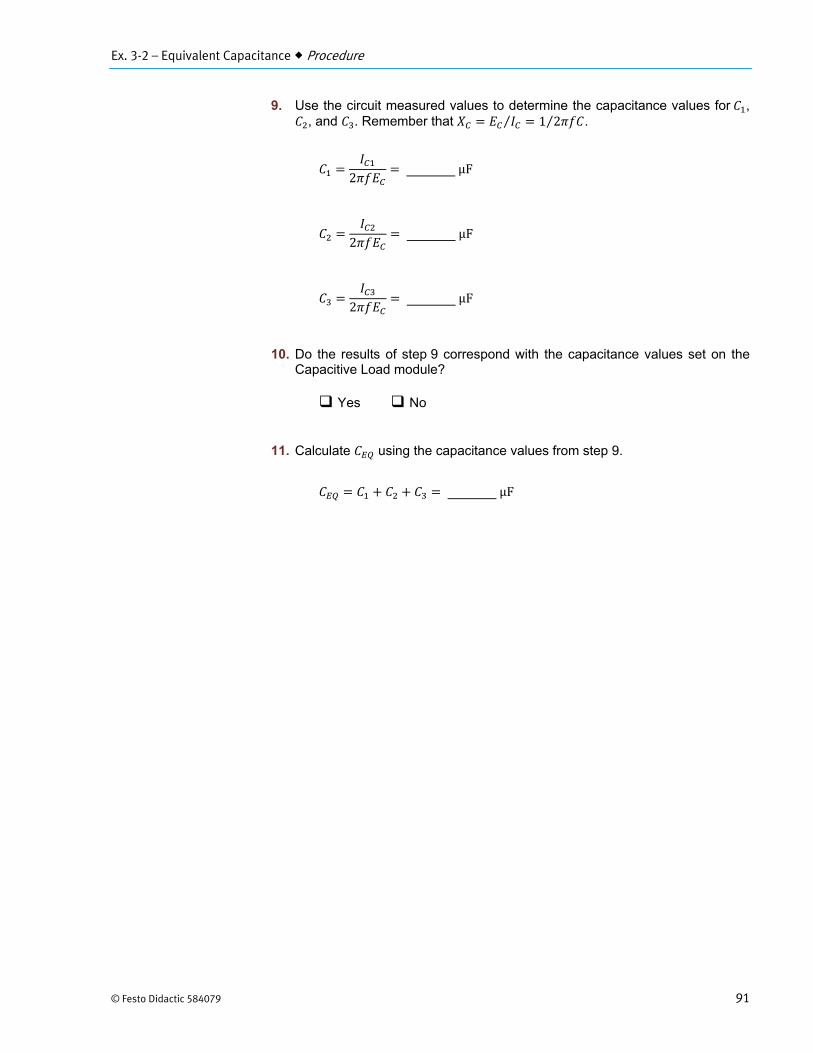
Ex. 3-2 – Equivalent Capacitance Procedure
© Festo Didactic 584079 91
9. Use the circuit measured values to determine the capacitance values for ,, and . Remember that 1 2⁄⁄ .
2μF
2μF
2μF
10. Do the results of step 9 correspond with the capacitance values set on theCapacitive Load module?
Yes No
11. Calculate using the capacitance values from step 9.
μF
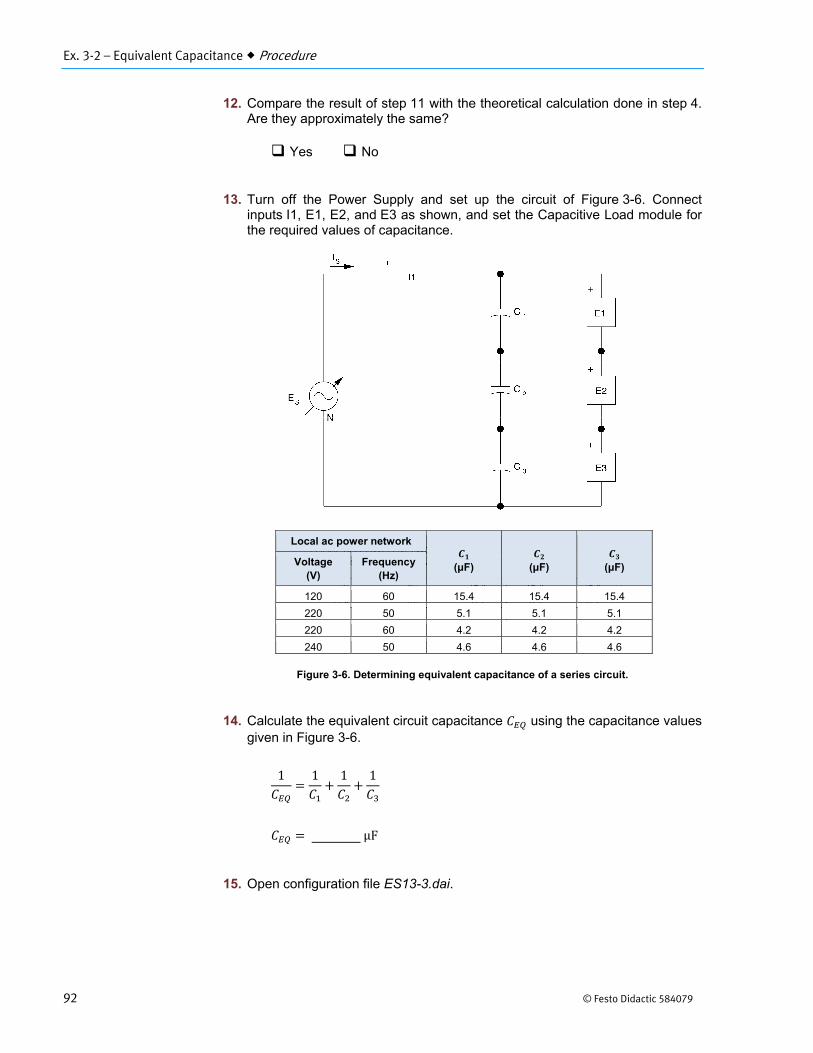
Ex. 3-2 – Equivalent Capacitance Procedure
92 © Festo Didactic 584079
12. Compare the result of step 11 with the theoretical calculation done in step 4.Are they approximately the same?
Yes No
13. Turn off the Power Supply and set up the circuit of Figure 3-6. Connectinputs I1, E1, E2, and E3 as shown, and set the Capacitive Load module forthe required values of capacitance.
Figure 3-6. Determining equivalent capacitance of a series circuit.
14. Calculate the equivalent circuit capacitance using the capacitance valuesgiven in Figure 3-6.
1 1 1 1
μF
15. Open configuration file ES13-3.dai.
Local ac power network
(μF) (μF) (μF) Voltage(V)
Frequency(Hz)
120 60 15.4 15.4 15.4
220 50 5.1 5.1 5.1
220 60 4.2 4.2 4.2
240 50 4.6 4.6 4.6
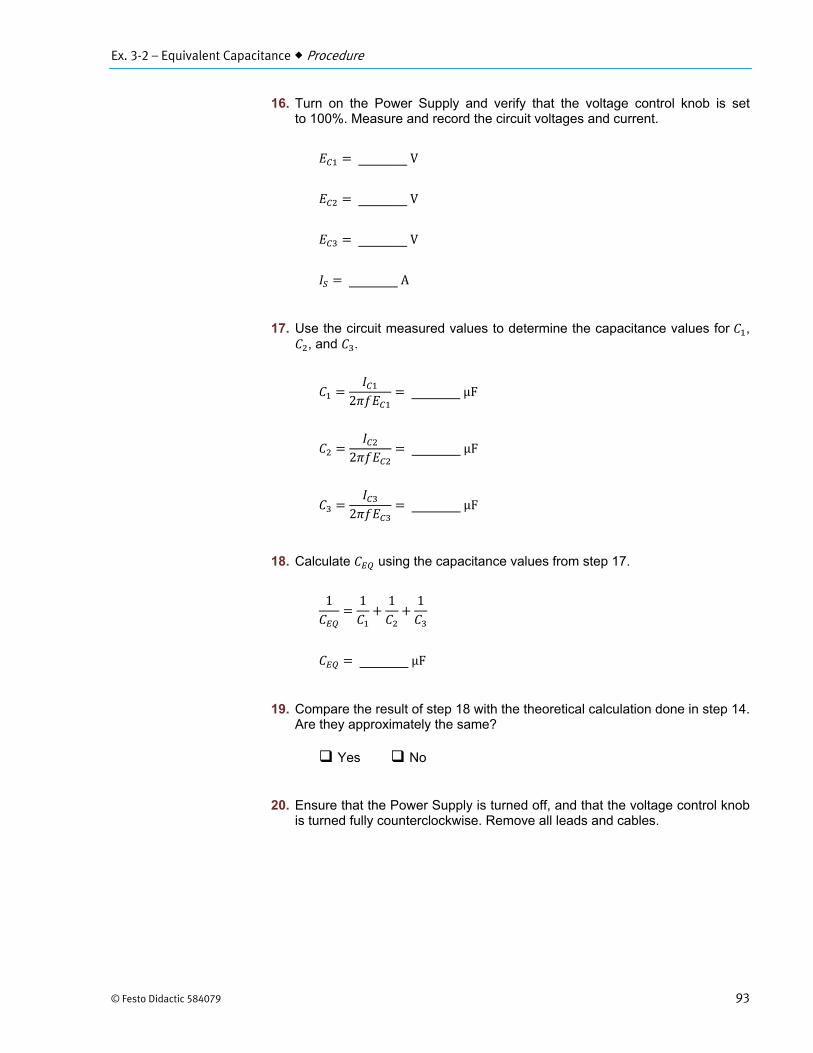
Ex. 3-2 – Equivalent Capacitance Procedure
© Festo Didactic 584079 93
16. Turn on the Power Supply and verify that the voltage control knob is setto 100%. Measure and record the circuit voltages and current.
V
V
V
A
17. Use the circuit measured values to determine the capacitance values for ,, and .
2μF
2μF
2μF
18. Calculate using the capacitance values from step 17.
1 1 1 1
μF
19. Compare the result of step 18 with the theoretical calculation done in step 14.Are they approximately the same?
Yes No
20. Ensure that the Power Supply is turned off, and that the voltage control knobis turned fully counterclockwise. Remove all leads and cables.
Ex. 3-2 – Equivalent Capacitance Conclusion
94 © Festo Didactic 584079
In this exercise, you determined the equivalent circuit capacitance for parallel and series combinations of capacitors, using the formulas for equivalent capacitance. You also combined the use of these formulas with measurements of circuit voltages, currents, and capacitive reactance.
1. What is the formula for determining the equivalent capacitance of a parallelcircuit?
a. 1⁄ 1⁄ 1⁄ 1⁄ . . . 1⁄b. 1 1⁄ 1⁄ 1⁄ 1⁄ . . . 1⁄⁄c. . . . d. 1⁄ . . .
2. What is the formula for determining the equivalent capacitance of a seriescircuit?
a. . . . b. 1 1⁄ 1⁄ 1⁄ 1⁄ . . . 1⁄⁄c. 1 . . . ⁄d. 1⁄ . . .
3. What is the equivalent capacitance of three 15-μF capacitors connected inparallel?
a. 50 μFb. 4.5 μFc. 45 μFd. 5.0 μF
4. What is the equivalent capacitance of three series-connected capacitors withvalues of 1 μF, 2 μF, and 4 μF?
a. 7 μFb. 8 μFc. 1.75 μFd. 0.57 μF
5. What is the equivalent capacitance of two parallel-connected,10-μF capacitors connected in series with a 5-μF capacitor?
a. 50 μFb. 25 μFc. 10 μFd. 4 μF
CONCLUSION
REVIEW QUESTIONS
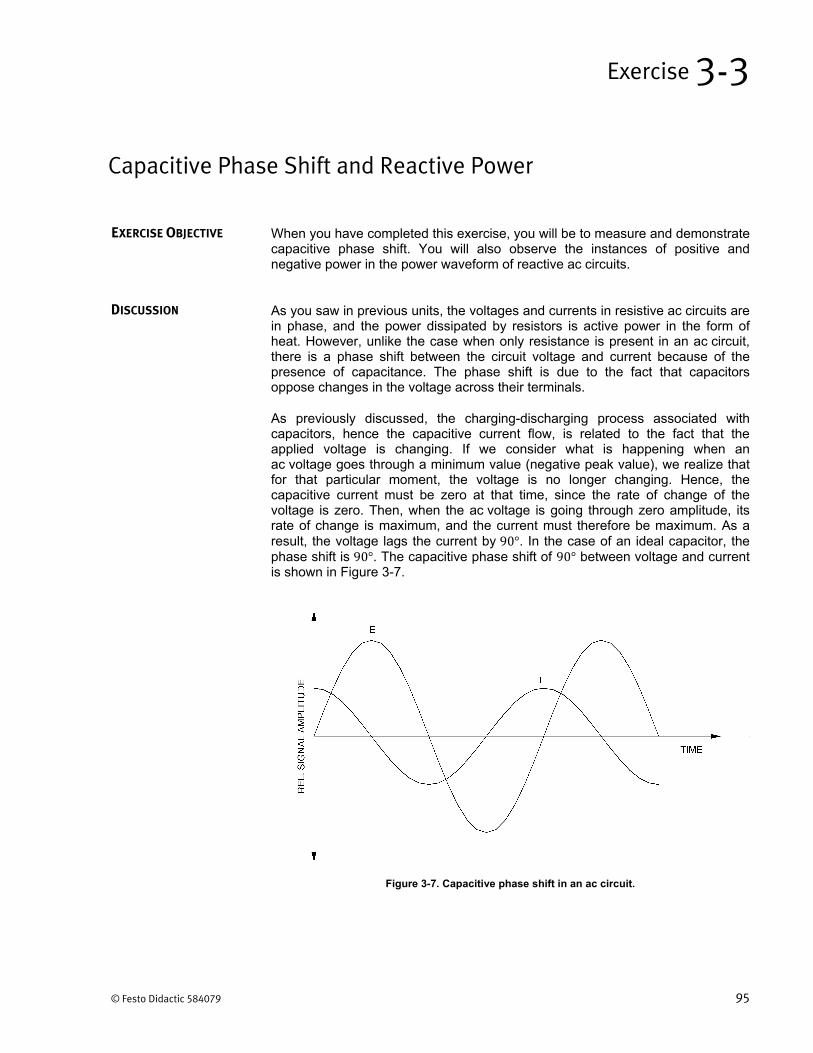
© Festo Didactic 584079 95
When you have completed this exercise, you will be to measure and demonstrate capacitive phase shift. You will also observe the instances of positive and negative power in the power waveform of reactive ac circuits.
As you saw in previous units, the voltages and currents in resistive ac circuits are in phase, and the power dissipated by resistors is active power in the form of heat. However, unlike the case when only resistance is present in an ac circuit, there is a phase shift between the circuit voltage and current because of the presence of capacitance. The phase shift is due to the fact that capacitors oppose changes in the voltage across their terminals.
As previously discussed, the charging-discharging process associated with capacitors, hence the capacitive current flow, is related to the fact that the applied voltage is changing. If we consider what is happening when an ac voltage goes through a minimum value (negative peak value), we realize that for that particular moment, the voltage is no longer changing. Hence, the capacitive current must be zero at that time, since the rate of change of the voltage is zero. Then, when the ac voltage is going through zero amplitude, its rate of change is maximum, and the current must therefore be maximum. As a result, the voltage lags the current by 90°. In the case of an ideal capacitor, the phase shift is 90°. The capacitive phase shift of 90° between voltage and current is shown in Figure 3-7.
Figure 3-7. Capacitive phase shift in an ac circuit.
Capacitive Phase Shift and Reactive Power
Exercise 3-3
EXERCISE OBJECTIVE
DISCUSSION
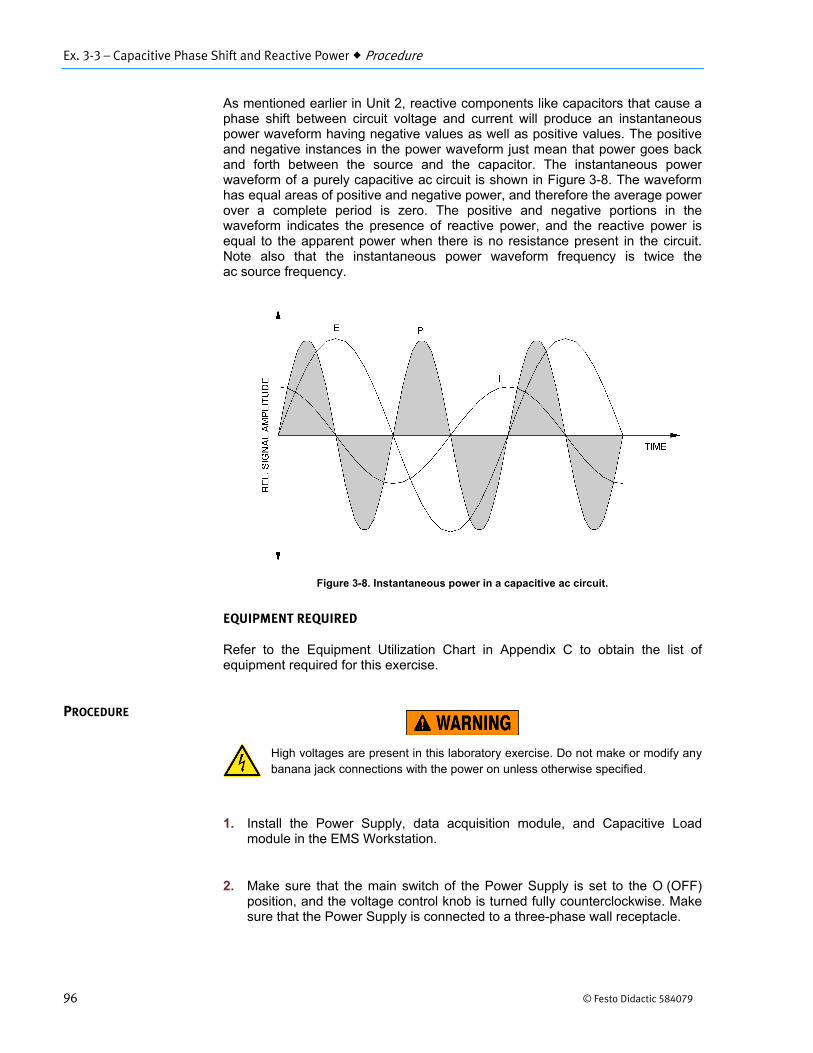
Ex. 3-3 – Capacitive Phase Shift and Reactive Power Procedure
96 © Festo Didactic 584079
As mentioned earlier in Unit 2, reactive components like capacitors that cause a phase shift between circuit voltage and current will produce an instantaneous power waveform having negative values as well as positive values. The positive and negative instances in the power waveform just mean that power goes back and forth between the source and the capacitor. The instantaneous power waveform of a purely capacitive ac circuit is shown in Figure 3-8. The waveform has equal areas of positive and negative power, and therefore the average power over a complete period is zero. The positive and negative portions in the waveform indicates the presence of reactive power, and the reactive power is equal to the apparent power when there is no resistance present in the circuit. Note also that the instantaneous power waveform frequency is twice the ac source frequency.
Figure 3-8. Instantaneous power in a capacitive ac circuit.
EQUIPMENT REQUIRED
Refer to the Equipment Utilization Chart in Appendix C to obtain the list of equipment required for this exercise.
High voltages are present in this laboratory exercise. Do not make or modify any banana jack connections with the power on unless otherwise specified.
1. Install the Power Supply, data acquisition module, and Capacitive Loadmodule in the EMS Workstation.
2. Make sure that the main switch of the Power Supply is set to the O (OFF)position, and the voltage control knob is turned fully counterclockwise. Makesure that the Power Supply is connected to a three-phase wall receptacle.
PROCEDURE
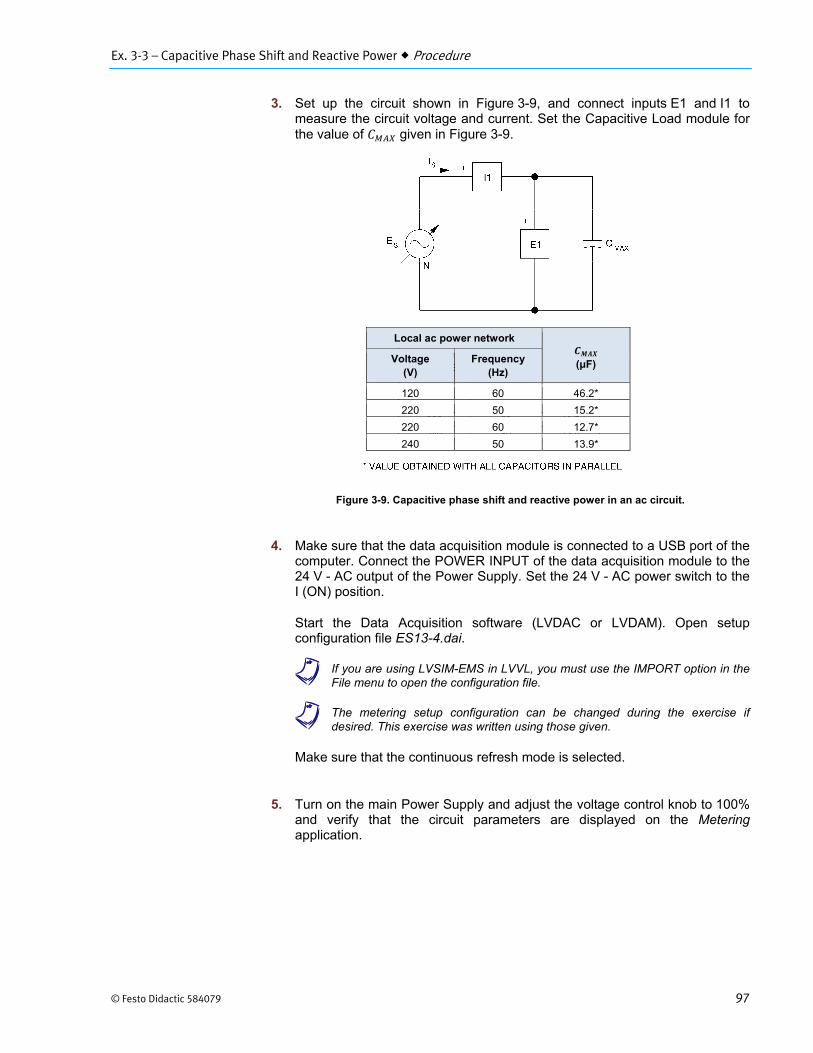
Ex. 3-3 – Capacitive Phase Shift and Reactive Power Procedure
© Festo Didactic 584079 97
3. Set up the circuit shown in Figure 3-9, and connect inputs E1 and I1 tomeasure the circuit voltage and current. Set the Capacitive Load module forthe value of given in Figure 3-9.
Figure 3-9. Capacitive phase shift and reactive power in an ac circuit.
4. Make sure that the data acquisition module is connected to a USB port of thecomputer. Connect the POWER INPUT of the data acquisition module to the24 V - AC output of the Power Supply. Set the 24 V - AC power switch to theI (ON) position.
Start the Data Acquisition software (LVDAC or LVDAM). Open setupconfiguration file ES13-4.dai.
a If you are using LVSIM-EMS in LVVL, you must use the IMPORT option in theFile menu to open the configuration file.
a The metering setup configuration can be changed during the exercise ifdesired. This exercise was written using those given.
Make sure that the continuous refresh mode is selected.
5. Turn on the main Power Supply and adjust the voltage control knob to 100%and verify that the circuit parameters are displayed on the Meteringapplication.
Local ac power network
(μF) Voltage(V)
Frequency(Hz)
120 60 46.2*
220 50 15.2*
220 60 12.7*
240 50 13.9*

Ex. 3-3 – Capacitive Phase Shift and Reactive Power Procedure
98 © Festo Didactic 584079
6. Note the rms values of the voltage and current, and the apparent power ( )displayed by the meters.
V
A
(PQS1) VA
7. Is the apparent power equal to the product of the rms values of voltage andcurrent?
Yes No
8. Click on the Oscilloscope button and display E1, I1, and P1 on CH1, CH2,and CH3. Make sure that the time base control is adjusted to show at leasttwo complete cycles of the sine waves.
9. Compare the current waveform with the voltage waveform. Are they bothsine waves at the same frequency?
Yes No
10. What is the phase shift between the voltage and current?
Phase shift °
11. Does step 10 confirm that the current leads the voltage by about 90°?
Yes No
12. Does the current waveform attain its maximum when the voltage is goingthrough zero amplitude, and become zero when the voltage is going throughits maximum?
Yes No
13. Determine the period and frequency of the instantaneous power waveform.
ms
1Hz
Ex. 3-3 – Capacitive Phase Shift and Reactive Power Procedure
© Festo Didactic 584079 99
14. How does the frequency of the instantaneous power waveform compare withthat of the ac source?
15. Does the instantaneous power waveform show that the areas of positive andnegative power are approximately equal?
Yes No
16. Calculate the apparent power ( ) by multiplying the rms values of the currentand voltage displayed on the oscilloscope and compare your result with theactive power [average (AVG) power value of P1 given in the waveformdata box of the Oscilloscope screen].
Apparent power VA
Active power W
17. Do the results of step 16 confirm that the apparent power and the activepower are different, due to the presence of reactive power ( ) in the circuit?
Yes No
18. What is the total active power consumed by the circuit?
W
19. Is the instantaneous power null when the current or the voltage is zero?
Yes No
20. Change the circuit capacitance by opening the three switches on one sectionof the Capacitive Load module.
21. What effect does the change in capacitive reactance produce on the circuitcurrent, voltage and reactive power?

Ex. 3-3 – Capacitive Phase Shift and Reactive Power Procedure
100 © Festo Didactic 584079
22. Did the phase shift between the current and voltage change?
Yes No
23. Why is the instantaneous power waveform different in amplitude?
24. Ensure that the Power Supply is turned off, and that the voltage control knobis turned fully counterclockwise. Remove all leads and cables.
Ex. 3-3 – Capacitive Phase Shift and Reactive Power Conclusion
© Festo Didactic 584079 101
In this exercise, you determined capacitive phase shift in an ac circuit using measurements of the current and voltage waveforms. You examined the instantaneous power waveform and saw that there was no active power dissipated in a purely capacitive circuit. Finally, observation of the circuit waveforms allowed you to confirm the theoretical behavior of the circuit current and voltage.
1. Capacitors store energy in the electric field set up between their plates whena voltage is applied across them.
a. True.b. False.c. False, the energy is stored in the dielectric.d. True in ac circuits only.
2. The phase shift between current and voltage caused by a capacitor equals
a. 90°, if the voltage is used as reference.b. 90°, if the current is used as reference.c. 90°, if the voltage is used as reference.d. Both b and c.
3. In a purely capacitive ac circuit, when is the instantaneous power waveformequal to zero?
a. Whenever the voltage or the current is zero.b. Whenever the voltage and current waveforms intersect.c. Whenever the rms voltage and current values are
maximum.d. None of the above because the active power equals zero.
4. What is the reactive power in a purely capacitive ac circuit when therms voltage and current values are 250 V and 3 A respectively?
a. 750 Wb. 750 VAc. 750 vard. 83.3 var
5. The instantaneous power waveform for a circuit has equal positive andnegative areas. What does this indicate?
a. That the circuit is resistive.b. That the circuit contains only reactive components.c. That the active power is zero.d. Both b and c.
CONCLUSION
REVIEW QUESTIONS


Unit 3 – Capacitors in AC Circuits Unit Test
© Festo Didactic 584079 103
Unit Test
1. What will be the voltage drop across a 100-Ω capacitive reactance when thecircuit current is 1.2 A?
a. 1200 Vb. 80 Vc. 120 Vd. 120 kV
2. The capacitive reactance of a circuit can be doubled by
a. increasing the source frequency by one-half.b. doubling the source voltage.c. doubling the capacitance.d. reducing the capacitance by one-half.
3. The formula 1 2⁄ can be used to determine the
a. reactance of resistors.b. capacitive resistance of capacitors.c. capacitive reactance of capacitors.d. capacitive phase shift of a circuit.
4. Frequency and capacitance directly affect
a. the resistance of a power source.b. the amount of active power dissipated by a resistor.c. the polarity of the current flowing in a circuit.d. a circuit's capacitive reactance.
5. What formula is used to determine for parallel-connected capacitors?
a. 1⁄ 1⁄ 1⁄ 1⁄ … 1⁄b. 1 1⁄ 1⁄⁄ 1⁄ 1⁄ …1⁄c. …d. 1 …⁄
6. What formula is used to determine for series-connected capacitors?
a. …b. 1 1⁄ 1⁄⁄ 1⁄ 1⁄ …1⁄c. 1/ …d. 1 …⁄
Unit 3 – Capacitors in AC Circuits Unit Test
104 © Festo Didactic 584079
7. What is the equivalent capacitance of three 15-μF capacitors connected inseries?
a. 45 μFb. 4.5 μFc. 50 μFd. 5.0 μF
8. What is the equivalent capacitance of three parallel-connected capacitorswith values of 1 μF, 2 μF, and 4 μF?
a. 8 μFb. 7 μFc. 0.57 μFd. 1.75 μF
9. In a purely capacitive ac circuit, the phase shift between voltage and currentis
a. 90° if the current is used as reference.b. 90° if the voltage is used as reference.c. 90° if the current is used as reference.d. Either a or b, depending on which is used as reference.
10. What is the reactive power in a purely capacitive ac circuit with anrms voltage of 75 V and a current of 5 A?
a. 375 Wb. 375 VAc. 375 vard. 15 var
© Festo Didactic 584079 105
When you have completed this unit, you will be able to demonstrate and explain the effects of inductors in ac circuits. You will use circuit measurements to determine the inductive reactance of inductors, and you will measure and observe the phase shift between voltage and current caused by inductors.
The exercises in this unit are quite similar to those in Unit 3, and as you will discover, inductor behavior in electric circuits is the converse to capacitor behavior in electric circuits. Both components store energy, and both cause a phase shift of 90° between voltage and current. Capacitors store energy in an electric field set up by the application of a voltage, while inductors store energy in a magnetic field set up by a current that flows in a coil of wire.
Inductors are frequently called chokes or coils. The entire electrical industry revolves around coils, which are found in motors, generators, relays, and numerous other electrical devices. The fundamental property of inductors is to oppose changes in the current flowing through its coil. The opposition to current changes is proportional to the inductor's inductance (L). The inductance is a measure of the amount of energy that an inductor stores in the magnetic field set up when a current flows through its coil, and the measurement unit for inductance is the henry (H).
When inductance is added to an ac circuit, an effect similar to that of capacitance is observed, that is, there is opposition to the flow of current. This effect is referred to as the inductive reactance ( ), which is defined as the opposition created by inductance to the flow of alternating current. When current flows through a coil of wire, a magnetic field is set up and this field contains energy. As the current increases, the energy contained in the field also increases. When the current decreases, energy contained in the field is released, and the magnetic field eventually falls to zero when the current is zero. The situation is analogous to the capacitor, except that in a capacitor, it is the voltage that determines the amount of stored energy, while in the inductor it is the current.
Consider the inductive circuit shown in Figure 4-1. The ac power source will cause alternating current flow in the inductor coil, and the current will increase, decrease, and change polarity in the same alternating manner as the source voltage. Consequently, the coil will alternately receive energy from the source and then return it, depending on whether the current through the inductor is increasing (magnetic field is expanding) or decreasing (magnetic field is collapsing). In ac circuits, power flows back and forth between the inductor and the power source and nothing useful is accomplished, just like the case for capacitors. Figure 4-1 shows that power flow is from left to right while the magnetic field is expanding (current magnitude is increasing), and from right to left when the magnetic field is collapsing (current magnitude is decreasing). As you will later see, the alternating power flow in inductive ac circuits is related to the inductive phase shift between current and voltage, in a manner similar to capacitive phase shift.
Inductors in AC Circuits
Unit 4
UNIT OBJECTIVE
DISCUSSION OF
FUNDAMENTALS
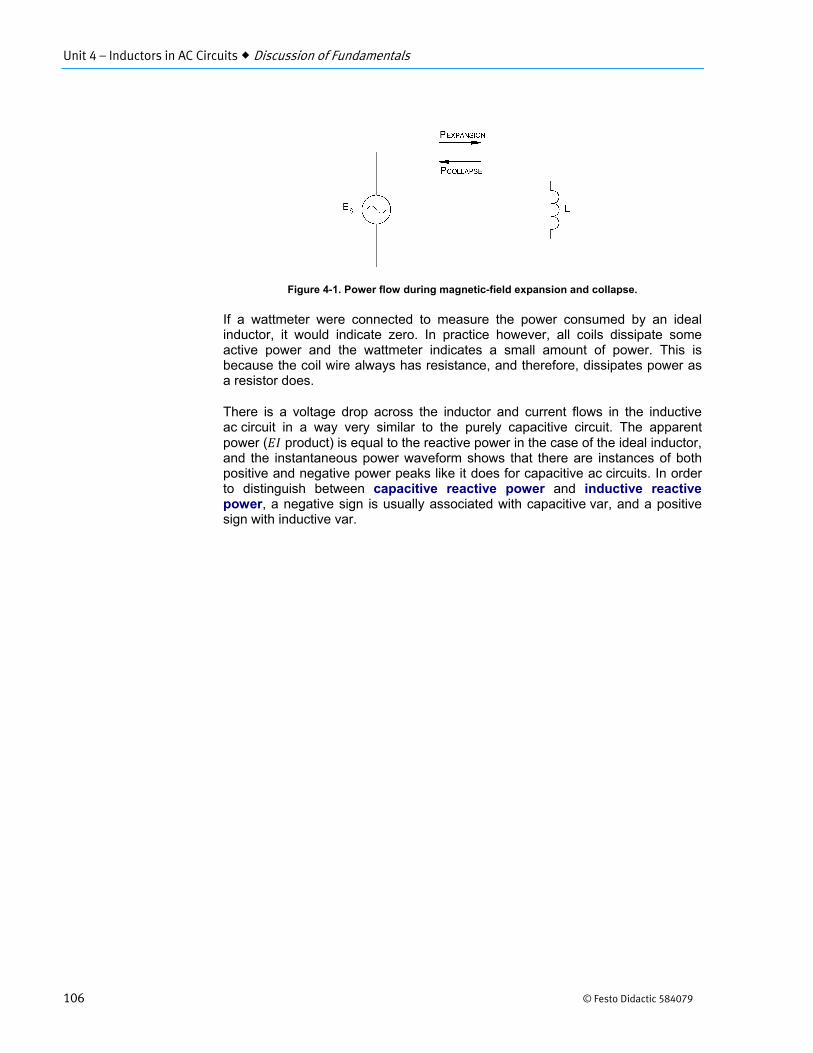
Unit 4 – Inductors in AC Circuits Discussion of Fundamentals
106 © Festo Didactic 584079
Figure 4-1. Power flow during magnetic-field expansion and collapse.
If a wattmeter were connected to measure the power consumed by an ideal inductor, it would indicate zero. In practice however, all coils dissipate some active power and the wattmeter indicates a small amount of power. This is because the coil wire always has resistance, and therefore, dissipates power as a resistor does.
There is a voltage drop across the inductor and current flows in the inductive ac circuit in a way very similar to the purely capacitive circuit. The apparent power ( product) is equal to the reactive power in the case of the ideal inductor, and the instantaneous power waveform shows that there are instances of both positive and negative power peaks like it does for capacitive ac circuits. In order to distinguish between capacitive reactive power and inductive reactive power, a negative sign is usually associated with capacitive var, and a positive sign with inductive var.
© Festo Didactic 584079 107
When you have completed this exercise, you will be able to determine inductive reactance by using measurements of circuit currents and voltages.
Inductive reactance is defined as the opposition to alternating current flow caused by inductance. Inductance is a property of inductors and increases when the inductor has an iron core. The measurement unit for inductance is the henry (H). Its effect is very similar to that caused by capacitance, and like capacitive reactance, inductive reactance changes with frequency. However, since it is directly proportional to frequency, inductive reactance increases when the frequency increases, which is opposite to capacitive reactance. Also, increasing an inductor's inductance increases its inductive reactance.
When a dc voltage is applied to an inductor, a dc current flows through the inductor's coil. Because the dc current does not change with time, the inductor does not oppose current flow and the current magnitude is only limited by the resistance of the coil wire. When an alternating voltage having an rms value equal to the dc voltage is applied to the same inductor, an alternating current flows through the inductor's coil. Because the current changes continuously, the inductor opposes changes in current and the current magnitude is limited to a much lower value than that obtained with the dc voltage. The greater the inductance of the inductor, the greater the opposition to current changes. The opposition to ac current flow caused by an inductor is referred to as inductive reactance.
The formula for determining inductive reactance in an ac circuit is as follows:
2
where is the inductive reactance, expressed in ohms (Ω).
is the inductance, expressed in henries (H).
is the ac source frequency, expressed in Hz.
Using the numerical value of 6.28 to replace the constant 2 is sufficient for most calculations dealing with inductive reactance. Also, for 50 and 60 Hz circuits, 2 can be replaced with the equivalent numerical values 314 (50 Hz) and 377 (60 Hz), without causing much error. The formula for determining inductive reactance shows that it is directly proportional to frequency and inductance, and will double whenever the frequency or the inductance is doubled.
Inductive Reactance
Exercise 4-1
EXERCISE OBJECTIVE
DISCUSSION
Ex. 4-1 – Inductive Reactance Procedure
108 © Festo Didactic 584079
Inductive reactance can be determined from circuit voltage and current using the familiar Ohm's law, which gives ⁄ , along with the equivalent expressions ⁄ and . and used in these expressions represent rms voltage and current values.
These expressions of Ohm's law, along with the laws of Kirchhoff seen in earlier exercises are all valid for solving inductive ac circuits.
The EMS Inductive Load module used in this exercise consists of three identical sections each having three inductors that can be added to a circuit using toggle switches. The selected value appears across the output terminals of each section when the appropriate switch is closed, and any two, or all three of the inductors can be placed in parallel. The equivalent parallel inductance is then present across the output terminals. This arrangement permits different values of inductance, and consequently inductive reactance, to be set. A table listing many of the reactance values which can be obtained is given in Appendix B of this manual. Also, the inductance, current, and reactance values of each individual inductor are silkscreened next to each of them on the module front panel. The current and reactance values are the nominal values obtained at the specified line voltage and frequency.
EQUIPMENT REQUIRED
Refer to the Equipment Utilization Chart in Appendix C to obtain the list of equipment required for this exercise.
High voltages are present in this laboratory exercise. Do not make or modify any banana jack connections with the power on unless otherwise specified.
1. Install the Power Supply, data acquisition module, and Inductive Loadmodule in the EMS Workstation.
2. Make sure that the main switch of the Power Supply is set to the O (OFF)position, and the voltage control knob is turned fully counterclockwise. Setthe voltmeter select switch to the 4-N position. Make sure that the PowerSupply is connected to a three-phase wall receptacle.
3. Set up the circuit shown in Figure 4-2. Close all switches on the InductiveLoad module so that all inductors are in parallel. This will produce aninductance value of . Connect inputs E1 and I1 to measure the circuitcurrent and voltage.
PROCEDURE
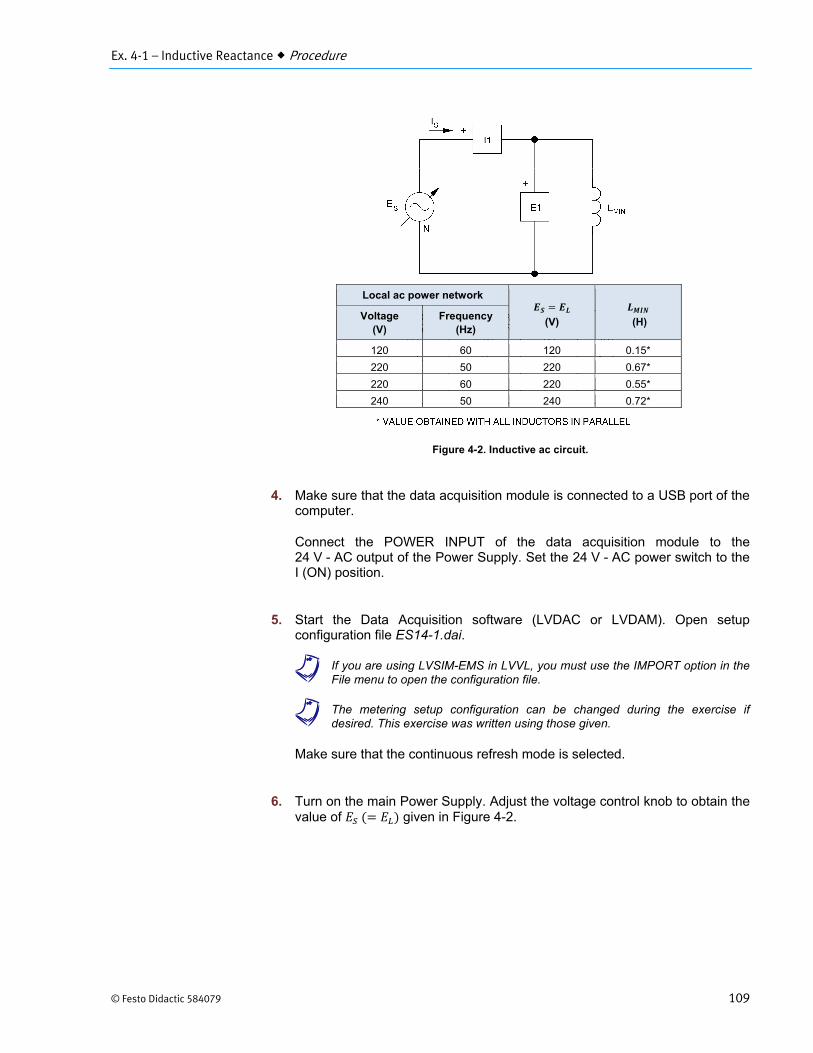
Ex. 4-1 – Inductive Reactance Procedure
© Festo Didactic 584079 109
Figure 4-2. Inductive ac circuit.
4. Make sure that the data acquisition module is connected to a USB port of thecomputer.
Connect the POWER INPUT of the data acquisition module to the24 V - AC output of the Power Supply. Set the 24 V - AC power switch to theI (ON) position.
5. Start the Data Acquisition software (LVDAC or LVDAM). Open setupconfiguration file ES14-1.dai.
a If you are using LVSIM-EMS in LVVL, you must use the IMPORT option in theFile menu to open the configuration file.
a The metering setup configuration can be changed during the exercise ifdesired. This exercise was written using those given.
Make sure that the continuous refresh mode is selected.
6. Turn on the main Power Supply. Adjust the voltage control knob to obtain thevalue of given in Figure 4-2.
Local ac power network
(V)
(H) Voltage
(V) Frequency
(Hz)
120 60 120 0.15*
220 50 220 0.67*
220 60 220 0.55*
240 50 240 0.72*
Ex. 4-1 – Inductive Reactance Procedure
110 © Festo Didactic 584079
7. Use the Data Table to store the values of the measured circuit voltage andcurrent. Note the results below.
V
A
8. Use the measured values of and to determine the inductivereactance of the circuit.
Ω
9. Use the value obtained for to determine circuit capacitance .
2H
10. Is the value calculated in step 9 approximately equal to the value of thecapacitance set on the Capacitive Load module?
Yes No
11. Increase the circuit inductance by opening the three switches of onecomplete section on the Inductive Load module. Measure and record and .
V
A
12. Determine for the new values of voltage and current obtained in theprevious step.
Ω

Ex. 4-1 – Inductive Reactance Procedure
© Festo Didactic 584079 111
13. Increase circuit capacitance once again by opening the switches on a secondsection of inductors. Measure and , and calculate .
V
A
Ω
14. Calculate the ratios of the changes in reactance for the different circuits.
15. Knowing that the initial circuit was made up of three parallel inductors havingthe same inductance, do the ratios of step 14 show that the inductivereactance changed in direct proportion to the ratios of the changes ininductance?
Yes No
16. With equal to 50% of the value used in step 6, calculate the circuit currentfor the present circuit reactance set in step 13.
A
17. Use the voltage control knob to set equal to 50% of the value in step 6,and measure the circuit voltage and current.
V
A

Ex. 4-1 – Inductive Reactance Procedure
112 © Festo Didactic 584079
18. Compare the measured value of current with the value calculated in step 16.Are they approximately the same?
Yes No
19. How well does the ratio of circuit voltage to current correspond with thepresent value of circuit inductive reactance ?
20. Did the change in source voltage affect the value of circuit reactance?
Yes No
21. Did the measured values of the circuit voltages and currents demonstratethat Ohm's law is valid for inductive ac circuits?
Yes No
22. Ensure that the Power Supply is turned off, and that the voltage control knobis turned fully counterclockwise. Remove all leads and cables.

Ex. 4-1 – Inductive Reactance Conclusion
© Festo Didactic 584079 113
In this exercise, you determined the inductive reactance for different ac circuits using Ohm's law and measurements of circuit voltages and currents. You also observed that Ohm's law is valid for inductive ac circuits, and demonstrated that reactance changed in direct proportion to the amount of circuit inductance.
1. In an inductive ac circuit with one series inductor, the rms values of the circuitvoltage and current are 120 V and 3 A. What is the value of ?
a. 360 Ωb. 36 Ωc. 40 Ωd. 40 H
2. What will happen to the inductive reactance of a circuit if the ac sourcefrequency is reduced by half?
a. It will double.b. It will be reduced by one-half.c. It will not change.d. It will change only if there is no resistance in the circuit.
3. What happens when the current flow through an inductor in a dc circuit issuddenly interrupted?
a. The magnetic field expands and a very high circuit potentialdevelops.
b. The magnetic field collapses and the voltage dropsinstantly.
c. The magnetic field collapses and a very high circuitpotential develops.
d. The magnetic field expands and the voltage drops instantly.
4. The formula used to determine inductive reactance is
a. ⁄b.c. 2d. 1 2⁄
5. How does inductive reactance vary with frequency and inductance?
a. It varies directly with frequency and inversely withinductance.
b. It varies directly with frequency and inductance.c. It varies inversely with frequency and inductance.d. It varies inversely with frequency and directly with
inductance.
CONCLUSION
REVIEW QUESTIONS

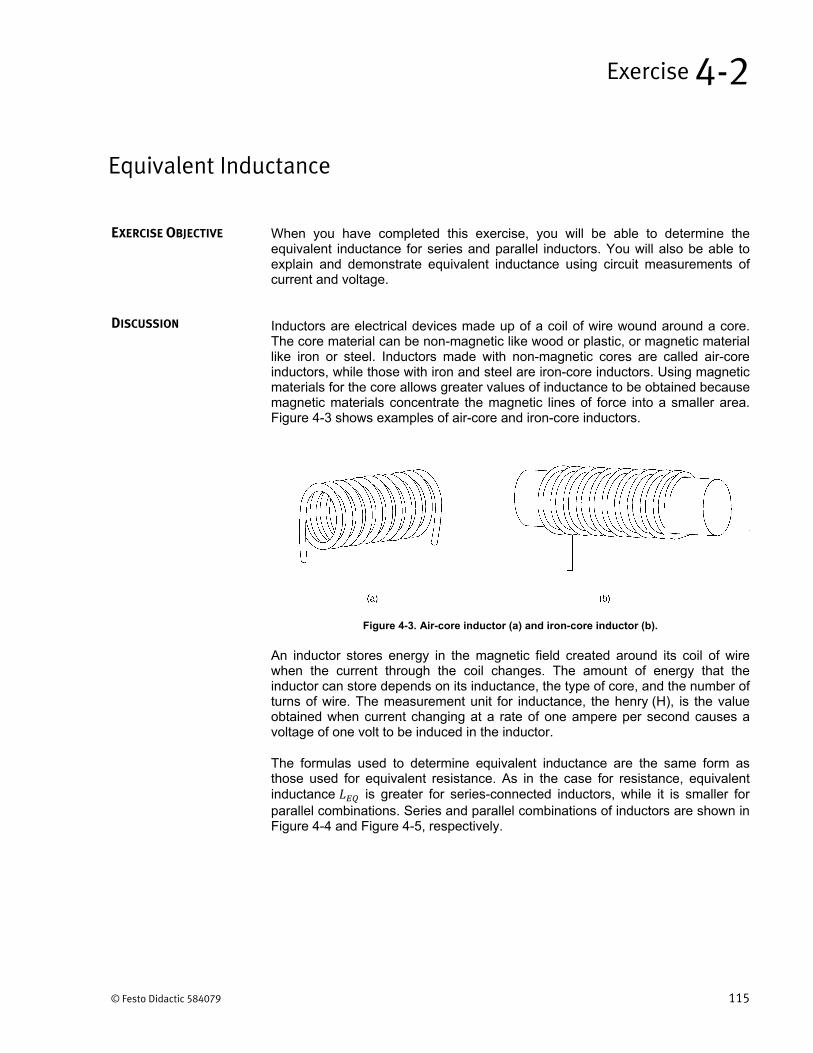
© Festo Didactic 584079 115
When you have completed this exercise, you will be able to determine the equivalent inductance for series and parallel inductors. You will also be able to explain and demonstrate equivalent inductance using circuit measurements of current and voltage.
Inductors are electrical devices made up of a coil of wire wound around a core. The core material can be non-magnetic like wood or plastic, or magnetic material like iron or steel. Inductors made with non-magnetic cores are called air-core inductors, while those with iron and steel are iron-core inductors. Using magnetic materials for the core allows greater values of inductance to be obtained because magnetic materials concentrate the magnetic lines of force into a smaller area. Figure 4-3 shows examples of air-core and iron-core inductors.
Figure 4-3. Air-core inductor (a) and iron-core inductor (b).
An inductor stores energy in the magnetic field created around its coil of wire when the current through the coil changes. The amount of energy that the inductor can store depends on its inductance, the type of core, and the number of turns of wire. The measurement unit for inductance, the henry (H), is the value obtained when current changing at a rate of one ampere per second causes a voltage of one volt to be induced in the inductor.
The formulas used to determine equivalent inductance are the same form as those used for equivalent resistance. As in the case for resistance, equivalent inductance is greater for series-connected inductors, while it is smaller for parallel combinations. Series and parallel combinations of inductors are shown in Figure 4-4 and Figure 4-5, respectively.
Equivalent Inductance
Exercise 4-2
EXERCISE OBJECTIVE
DISCUSSION
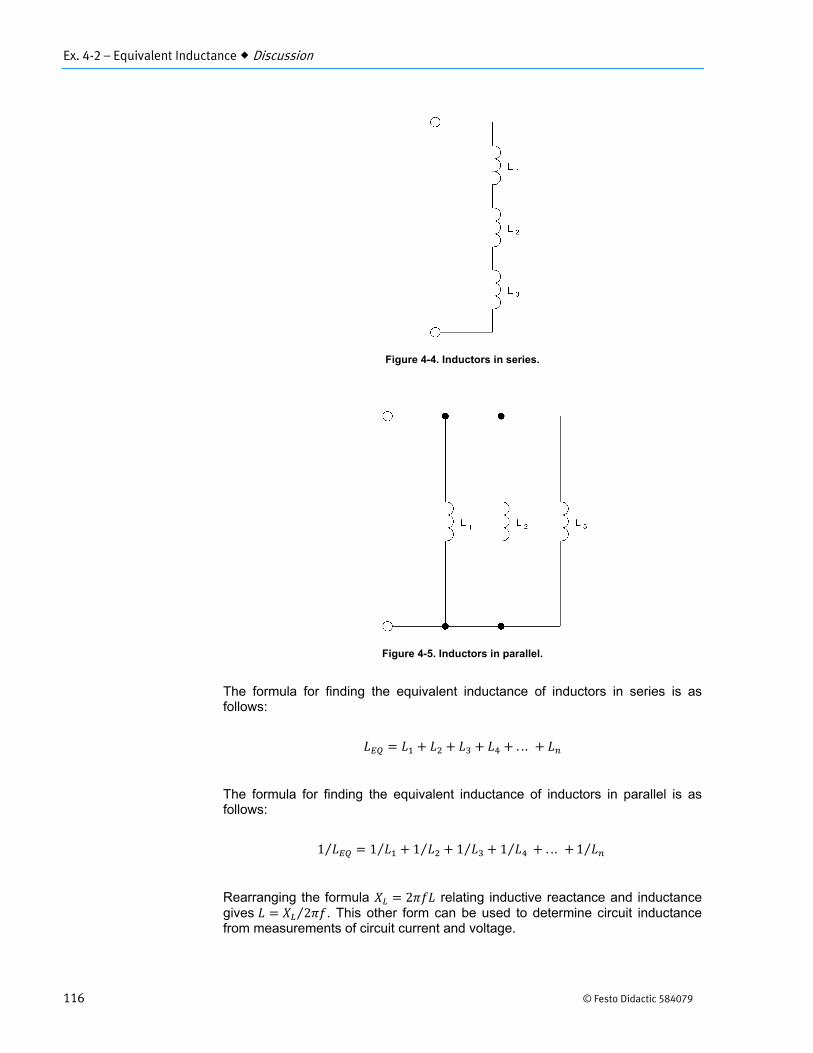
Ex. 4-2 – Equivalent Inductance Discussion
116 © Festo Didactic 584079
Figure 4-4. Inductors in series.
Figure 4-5. Inductors in parallel.
The formula for finding the equivalent inductance of inductors in series is as follows:
. . .
The formula for finding the equivalent inductance of inductors in parallel is as follows:
1⁄ 1⁄ 1⁄ 1⁄ 1⁄ . . . 1⁄
Rearranging the formula 2 relating inductive reactance and inductance gives 2⁄ . This other form can be used to determine circuit inductance from measurements of circuit current and voltage.
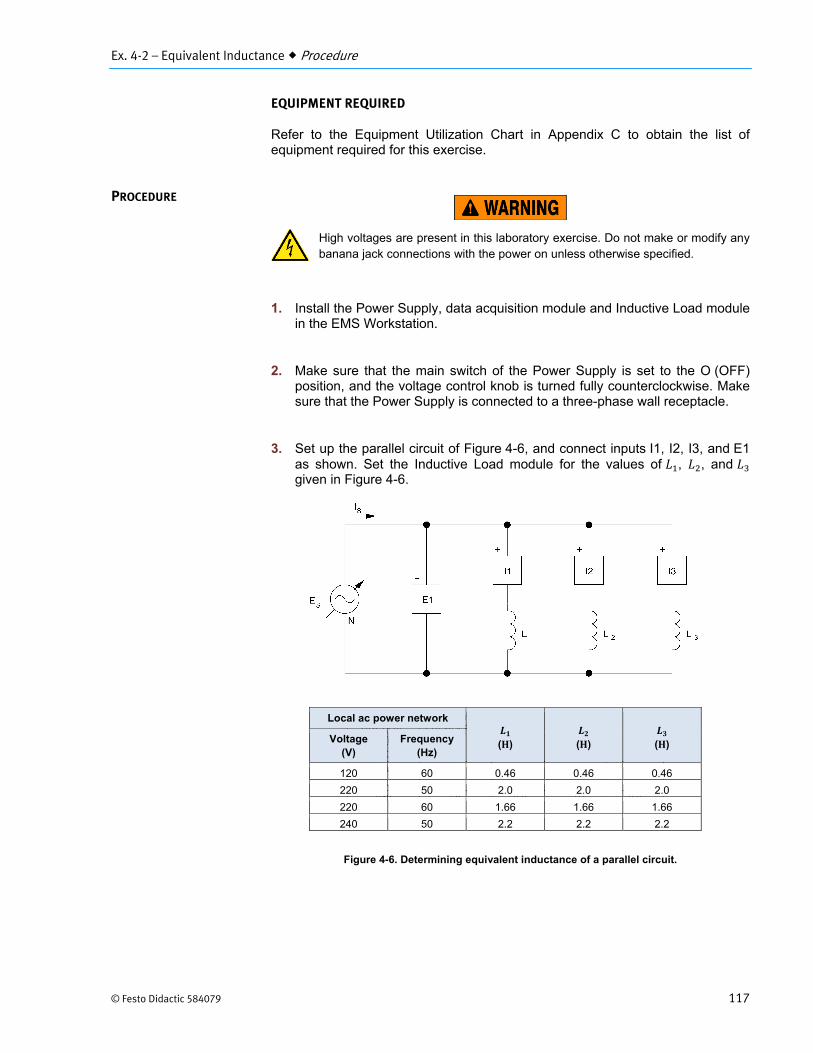
Ex. 4-2 – Equivalent Inductance Procedure
© Festo Didactic 584079 117
EQUIPMENT REQUIRED
Refer to the Equipment Utilization Chart in Appendix C to obtain the list of equipment required for this exercise.
High voltages are present in this laboratory exercise. Do not make or modify anybanana jack connections with the power on unless otherwise specified.
1. Install the Power Supply, data acquisition module and Inductive Load modulein the EMS Workstation.
2. Make sure that the main switch of the Power Supply is set to the O (OFF)position, and the voltage control knob is turned fully counterclockwise. Makesure that the Power Supply is connected to a three-phase wall receptacle.
3. Set up the parallel circuit of Figure 4-6, and connect inputs I1, I2, I3, and E1as shown. Set the Inductive Load module for the values of , , and given in Figure 4-6.
Figure 4-6. Determining equivalent inductance of a parallel circuit.
PROCEDURE
Local ac power network
( ) ( ) ( ) Voltage(V)
Frequency(Hz)
120 60 0.46 0.46 0.46
220 50 2.0 2.0 2.0
220 60 1.66 1.66 1.66
240 50 2.2 2.2 2.2
Ex. 4-2 – Equivalent Inductance Procedure
118 © Festo Didactic 584079
4. Calculate the equivalent circuit inductance using the inductance valuesgiven in Figure 4-6.
1 1 1 1
H
5. Make sure that the data acquisition module is connected to a USB port of thecomputer.
Connect the POWER INPUT of the data acquisition module to the24 V - AC output of the Power Supply. Set the 24 V - AC power switch to theI (ON) position.
6. Start the Data Acquisition software (LVDAC or LVDAM). Open setupconfiguration file ES14-2.dai.
a If you are using LVSIM-EMS in LVVL, you must use the IMPORT option in theFile menu to open the configuration file.
a The metering setup configuration can be changed during the exercise ifdesired. This exercise was written using those given.
Make sure that the continuous refresh mode is selected.
7. Turn on the main Power Supply and set the voltage control knob to 100%.
8. Use the Data Table to store the values of the measured circuit voltage andcurrents. Note the results below.
A
A
A
V
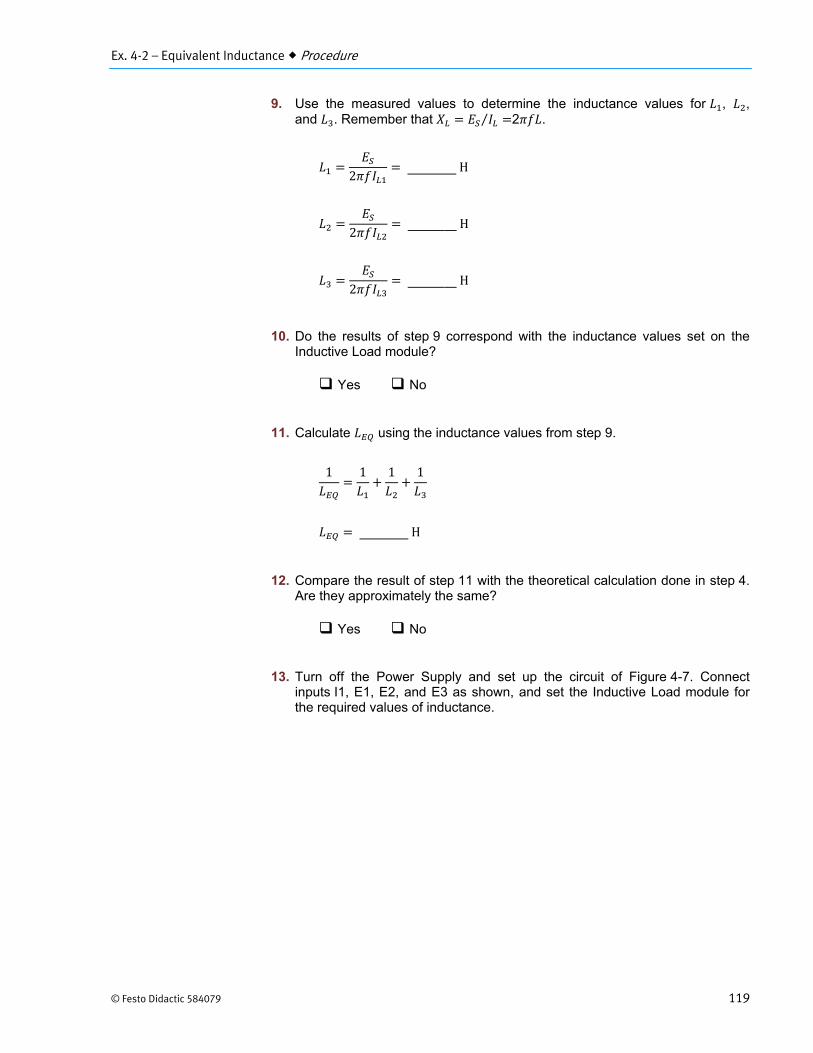
Ex. 4-2 – Equivalent Inductance Procedure
© Festo Didactic 584079 119
9. Use the measured values to determine the inductance values for , ,and . Remember that ⁄ 2 .
2H
2H
2H
10. Do the results of step 9 correspond with the inductance values set on theInductive Load module?
Yes No
11. Calculate using the inductance values from step 9.
1 1 1 1
H
12. Compare the result of step 11 with the theoretical calculation done in step 4.Are they approximately the same?
Yes No
13. Turn off the Power Supply and set up the circuit of Figure 4-7. Connectinputs I1, E1, E2, and E3 as shown, and set the Inductive Load module forthe required values of inductance.
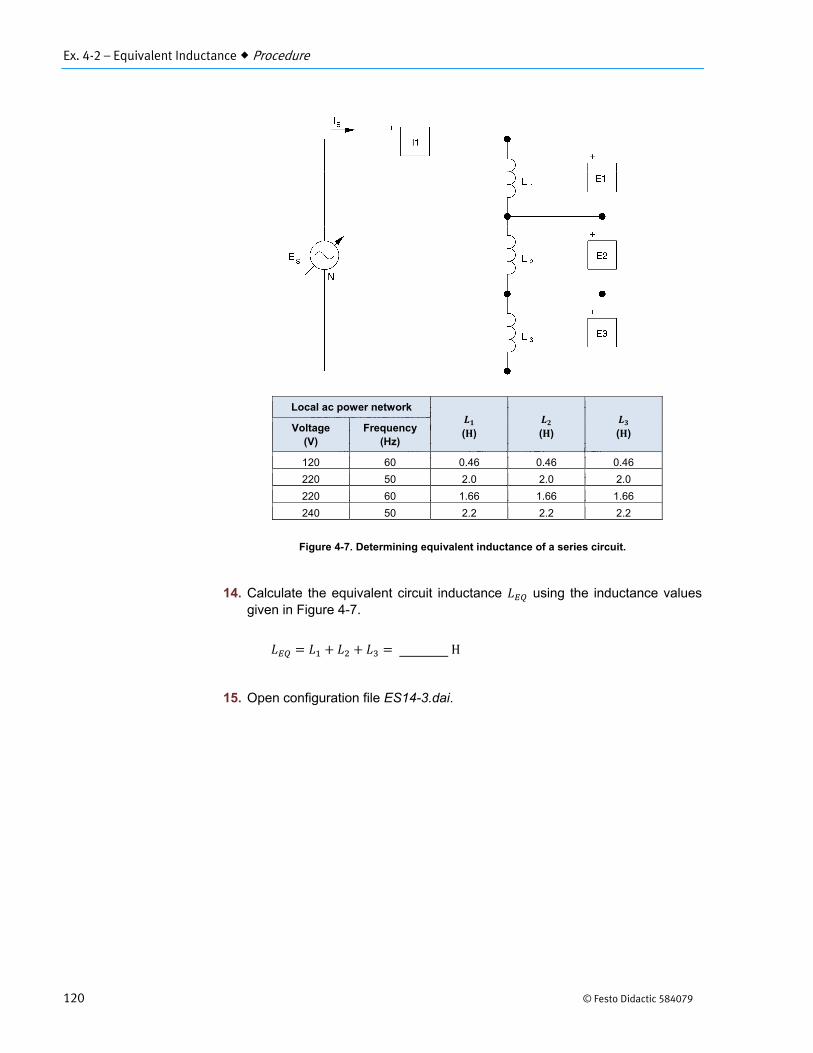
Ex. 4-2 – Equivalent Inductance Procedure
120 © Festo Didactic 584079
Figure 4-7. Determining equivalent inductance of a series circuit.
14. Calculate the equivalent circuit inductance using the inductance valuesgiven in Figure 4-7.
H
15. Open configuration file ES14-3.dai.
Local ac power network
( ) ( ) ( ) Voltage(V)
Frequency(Hz)
120 60 0.46 0.46 0.46
220 50 2.0 2.0 2.0
220 60 1.66 1.66 1.66
240 50 2.2 2.2 2.2
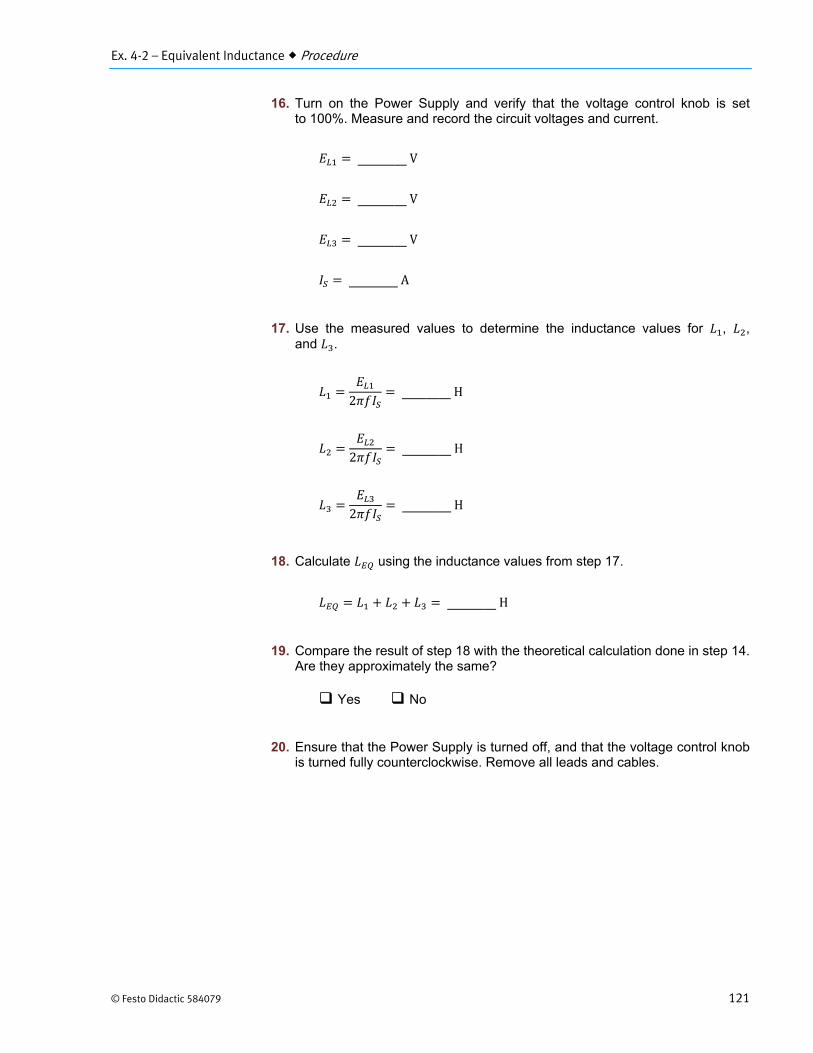
Ex. 4-2 – Equivalent Inductance Procedure
© Festo Didactic 584079 121
16. Turn on the Power Supply and verify that the voltage control knob is setto 100%. Measure and record the circuit voltages and current.
V
V
V
A
17. Use the measured values to determine the inductance values for , ,and .
2H
2H
2H
18. Calculate using the inductance values from step 17.
H
19. Compare the result of step 18 with the theoretical calculation done in step 14.Are they approximately the same?
Yes No
20. Ensure that the Power Supply is turned off, and that the voltage control knobis turned fully counterclockwise. Remove all leads and cables.
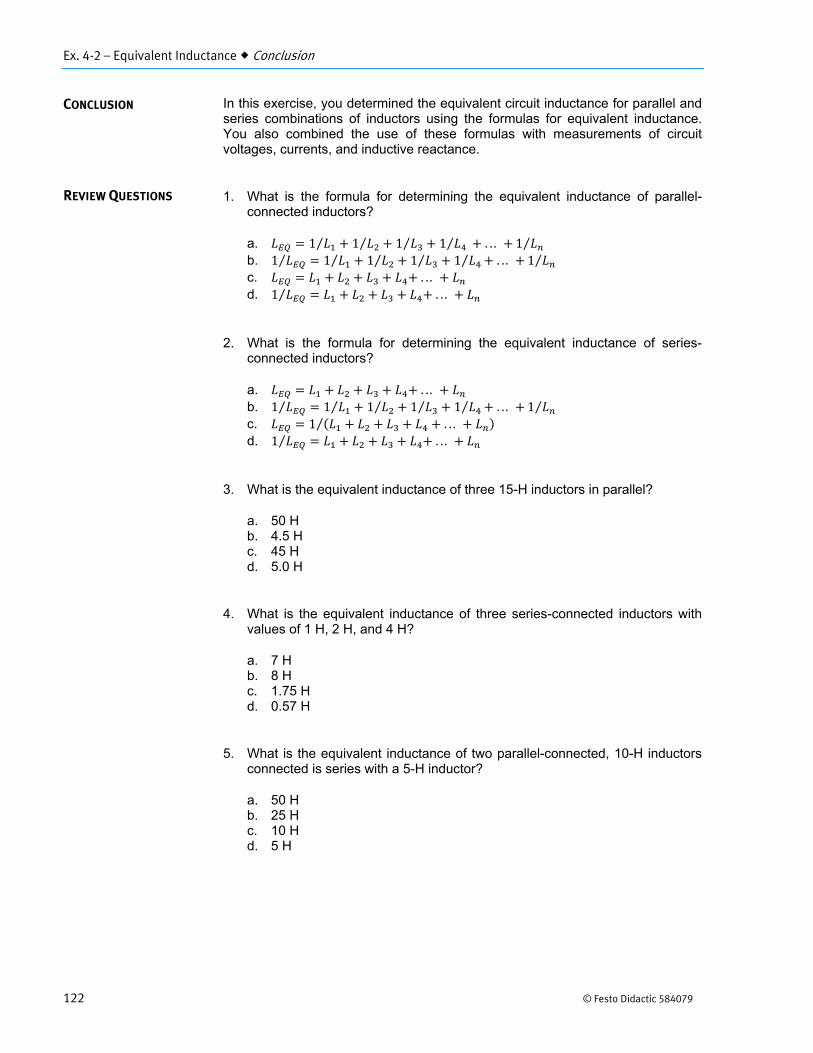
Ex. 4-2 – Equivalent Inductance Conclusion
122 © Festo Didactic 584079
In this exercise, you determined the equivalent circuit inductance for parallel and series combinations of inductors using the formulas for equivalent inductance. You also combined the use of these formulas with measurements of circuit voltages, currents, and inductive reactance.
1. What is the formula for determining the equivalent inductance of parallel-connected inductors?
a. 1⁄ 1⁄ 1⁄ 1⁄ . . . 1⁄b. 1 1⁄ 1⁄ 1⁄ 1⁄ . . . 1⁄⁄c. . . . d. 1⁄ . . .
2. What is the formula for determining the equivalent inductance of series-connected inductors?
a. . . . b. 1 1⁄ 1⁄ 1⁄ 1⁄ . . . 1⁄⁄c. 1 . . . ⁄d. 1⁄ . . .
3. What is the equivalent inductance of three 15-H inductors in parallel?
a. 50 Hb. 4.5 Hc. 45 Hd. 5.0 H
4. What is the equivalent inductance of three series-connected inductors withvalues of 1 H, 2 H, and 4 H?
a. 7 Hb. 8 Hc. 1.75 Hd. 0.57 H
5. What is the equivalent inductance of two parallel-connected, 10-H inductorsconnected is series with a 5-H inductor?
a. 50 Hb. 25 Hc. 10 Hd. 5 H
CONCLUSION
REVIEW QUESTIONS
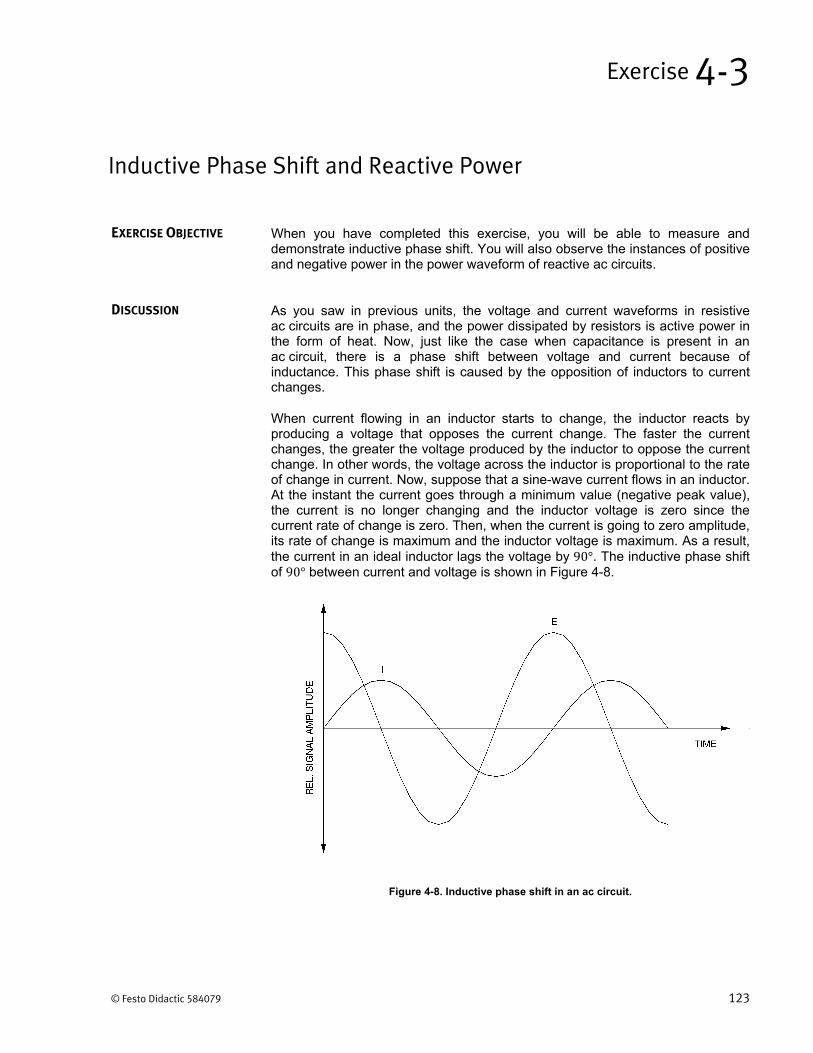
© Festo Didactic 584079 123
When you have completed this exercise, you will be able to measure and demonstrate inductive phase shift. You will also observe the instances of positive and negative power in the power waveform of reactive ac circuits.
As you saw in previous units, the voltage and current waveforms in resistive ac circuits are in phase, and the power dissipated by resistors is active power in the form of heat. Now, just like the case when capacitance is present in an ac circuit, there is a phase shift between voltage and current because of inductance. This phase shift is caused by the opposition of inductors to current changes.
When current flowing in an inductor starts to change, the inductor reacts by producing a voltage that opposes the current change. The faster the current changes, the greater the voltage produced by the inductor to oppose the current change. In other words, the voltage across the inductor is proportional to the rate of change in current. Now, suppose that a sine-wave current flows in an inductor. At the instant the current goes through a minimum value (negative peak value), the current is no longer changing and the inductor voltage is zero since the current rate of change is zero. Then, when the current is going to zero amplitude, its rate of change is maximum and the inductor voltage is maximum. As a result, the current in an ideal inductor lags the voltage by 90°. The inductive phase shift of 90° between current and voltage is shown in Figure 4-8.
Figure 4-8. Inductive phase shift in an ac circuit.
Inductive Phase Shift and Reactive Power
Exercise 4-3
EXERCISE OBJECTIVE
DISCUSSION
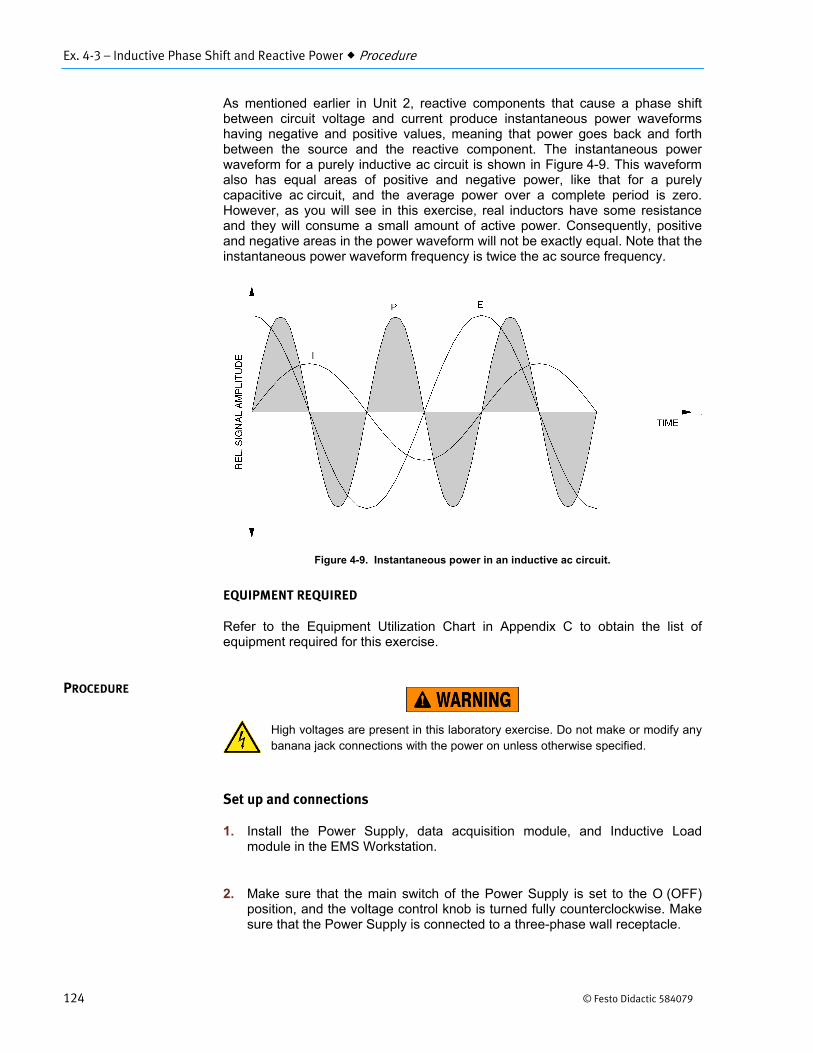
Ex. 4-3 – Inductive Phase Shift and Reactive Power Procedure
124 © Festo Didactic 584079
As mentioned earlier in Unit 2, reactive components that cause a phase shift between circuit voltage and current produce instantaneous power waveforms having negative and positive values, meaning that power goes back and forth between the source and the reactive component. The instantaneous power waveform for a purely inductive ac circuit is shown in Figure 4-9. This waveform also has equal areas of positive and negative power, like that for a purely capacitive ac circuit, and the average power over a complete period is zero. However, as you will see in this exercise, real inductors have some resistance and they will consume a small amount of active power. Consequently, positive and negative areas in the power waveform will not be exactly equal. Note that the instantaneous power waveform frequency is twice the ac source frequency.
Figure 4-9. Instantaneous power in an inductive ac circuit.
EQUIPMENT REQUIRED
Refer to the Equipment Utilization Chart in Appendix C to obtain the list of equipment required for this exercise.
High voltages are present in this laboratory exercise. Do not make or modify any banana jack connections with the power on unless otherwise specified.
Set up and connections
1. Install the Power Supply, data acquisition module, and Inductive Loadmodule in the EMS Workstation.
2. Make sure that the main switch of the Power Supply is set to the O (OFF)position, and the voltage control knob is turned fully counterclockwise. Makesure that the Power Supply is connected to a three-phase wall receptacle.
PROCEDURE
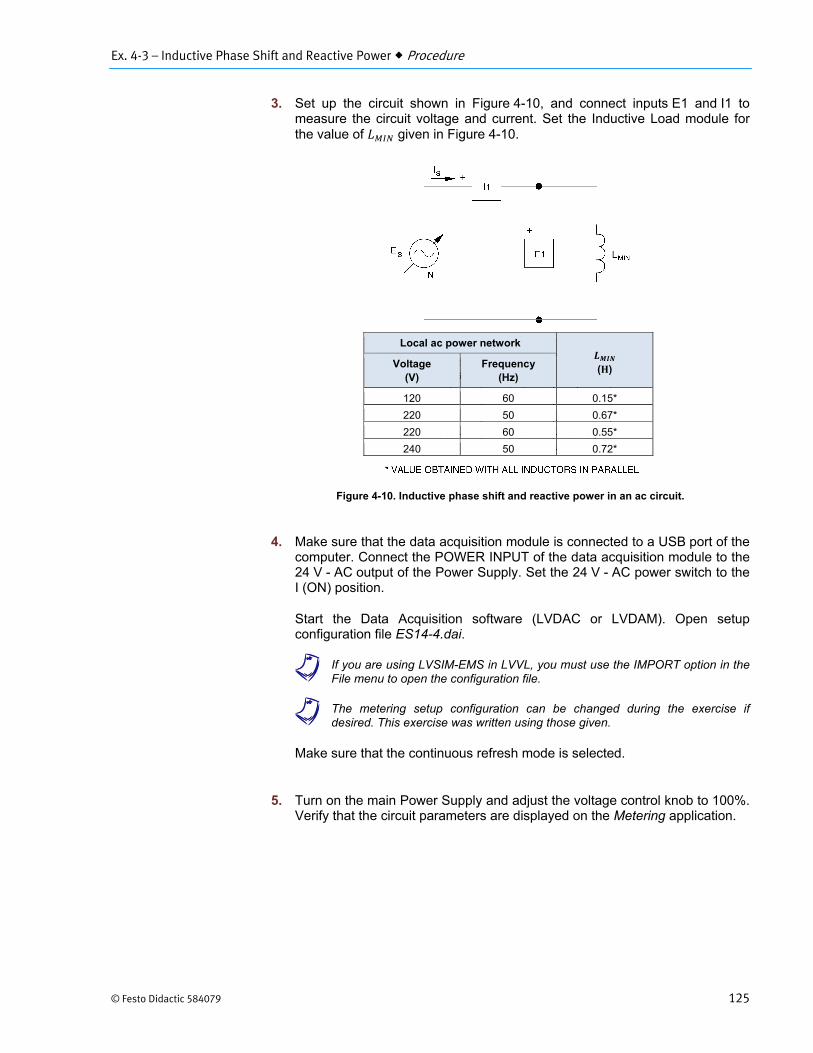
Ex. 4-3 – Inductive Phase Shift and Reactive Power Procedure
© Festo Didactic 584079 125
3. Set up the circuit shown in Figure 4-10, and connect inputs E1 and I1 tomeasure the circuit voltage and current. Set the Inductive Load module forthe value of given in Figure 4-10.
Figure 4-10. Inductive phase shift and reactive power in an ac circuit.
4. Make sure that the data acquisition module is connected to a USB port of thecomputer. Connect the POWER INPUT of the data acquisition module to the24 V - AC output of the Power Supply. Set the 24 V - AC power switch to theI (ON) position.
Start the Data Acquisition software (LVDAC or LVDAM). Open setupconfiguration file ES14-4.dai.
a If you are using LVSIM-EMS in LVVL, you must use the IMPORT option in theFile menu to open the configuration file.
a The metering setup configuration can be changed during the exercise ifdesired. This exercise was written using those given.
Make sure that the continuous refresh mode is selected.
5. Turn on the main Power Supply and adjust the voltage control knob to 100%.Verify that the circuit parameters are displayed on the Metering application.
Local ac power network
( ) Voltage(V)
Frequency(Hz)
120 60 0.15*
220 50 0.67*
220 60 0.55*
240 50 0.72*

Ex. 4-3 – Inductive Phase Shift and Reactive Power Procedure
126 © Festo Didactic 584079
6. Note the rms values of the voltage and current, and the apparent power ( )displayed by the meters.
V
A
(PQS1) VA
7. Is the apparent power equal to the product of the rms values of voltage andcurrent?
Yes No
8. Click on the Oscilloscope button and display E1, I1, and P1 on CH1, CH2,and CH3. Make sure that the time base control is adjusted to show at leasttwo complete cycles of the sine waves.
9. Compare the current waveform with the voltage waveform. Are both sinewaves at the same frequency?
Yes No
10. What is the phase shift between the voltage and current?
Phase shift °
11. Does the phase shift show that the inductor current lags the voltage byabout 80°?
Yes No
a The resistance of the inductor wire causes the phase shift to be less than thetheoretical value of 90° and causes real inductors to consume some active power.
Ex. 4-3 – Inductive Phase Shift and Reactive Power Procedure
© Festo Didactic 584079 127
12. Does the current waveform attain its maximum when the voltage is goingthrough zero amplitude, and become zero when the voltage is going throughits maximum?
Yes No
13. Determine the period and frequency of the instantaneous power waveform.
ms
1Hz
14. How does the frequency of the instantaneous power waveform compare withthat of the ac source?
15. Does the instantaneous power waveform have unequal areas of positive andnegative power, thus demonstrating that real inductors consume activepower?
Yes No
16. Calculate the apparent power ( ) by multiplying the rms values of the currentand voltage displayed on the oscilloscope and compare your result with theactive power [average (AVG) power value of P1 given in the waveformdata box of the Oscilloscope screen].
Apparent power VA
Active power W
17. Do the results of step 16 confirm that the apparent power and the activepower are different, due to the presence of reactive power in the circuit?
Yes No
18. What is the total active power consumed by the circuit?
W
19. When does the instantaneous power waveform go through zero amplitude?

Ex. 4-3 – Inductive Phase Shift and Reactive Power Procedure
128 © Festo Didactic 584079
20. Does step 19 confirm that the instantaneous power is zero when the currentor the voltage is zero?
Yes No
21. Change the circuit inductance by opening the three switches on one sectionof the Inductive Load module Load module.
22. What effect does the change in inductive reactance produce on the circuitcurrent, voltage and reactive power?
23. Did the phase shift between the current and voltage change?
Yes No
24. Why is the instantaneous power waveform different in amplitude?
25. Ensure that the Power Supply is turned off, and that the voltage control knobis turned fully counterclockwise. Remove all leads and cables.

Ex. 4-3 – Inductive Phase Shift and Reactive Power Conclusion
© Festo Didactic 584079 129
In this exercise, you determined inductive phase shift in an ac circuit using measurements of the current and voltage waveforms. You demonstrated that some active power is dissipated in inductive circuits because of the resistance of the inductor wire. Finally, observation of the circuit waveforms allowed you to confirm the theoretical behavior of the circuit current and voltage.
1. Inductors store energy in a magnetic field created and sustained by
a. current flowing through a coil of wire.b. voltage connected to the resistive part of the inductor.c. connecting the inductor to a capacitor.d. connecting the ends of the inductor together.
2. The phase shift between current and voltage caused by an inductor is
a. 90°, if the voltage is used as reference.b. 90°, if the current is used as reference.c. ‐90°, if the voltage is used as reference.d. Both b and c.
3. When does the instantaneous power waveform cross through zero amplitudein an ideal inductive circuit?
a. When the voltage and current are both maximum.b. When the voltage and current waveforms intersect.c. When the rms values of voltage and current are maximum.d. Whenever the voltage or current is zero.
4. What is the reactive power in a purely inductive ac circuit when therms voltage and current values are 80 V and 3 A?
a. 240 Wb. 240 VAc. 240 vard. 26.7 var
5. The instantaneous power waveform for a circuit has unequal positive andnegative areas. What can this indicate?
a. That the circuit is resistive, as well as being reactive.b. That the circuit contains only reactive components.c. That the apparent power is zero.d. Both a and c.
CONCLUSION
REVIEW QUESTIONS

Unit 4 – Inductors in AC Circuits Unit Test
© Festo Didactic 584079 131
Unit Test
1. How much current will flow in an inductive ac circuit having a reactance of60 Ω, when the circuit voltage is 120 V?
a. 20 Ab. 0.5 Ac. 2 Ad. 2 H
2. How can the inductive reactance of a circuit be reduced by half withoutchanging any circuit components?
a. By increasing the reactance by one-half.b. By reducing the source frequency by one-half.c. By increasing the source frequency by one-half.d. By reducing the source voltage by one-half.
3. How can inductive reactance be tripled in an ac circuit?
a. By tripling the source voltage.b. By reducing the source frequency by one-third.c. By tripling the inductance.d. By reducing the inductance by one-third.
4. Inductive reactance can be determined from
a. 2 b. ⁄c. 2d. a, b, and c
5. What is the formula for determining the equivalent inductance of inductors inparallel?
a. 1⁄ 1⁄ 1⁄ 1⁄ . . . 1⁄b. 1 1⁄ 1⁄ 1⁄ 1⁄ . . . 1⁄⁄c. . . . d. 1⁄ . . .
6. What is the formula for determining the equivalent inductance of inductors inseries?
a. . . . b. 1 1⁄ 1⁄ 1⁄ 1⁄ . . . 1⁄⁄c. 1 . . . ⁄d. 1⁄ . . .

Unit 4 – Inductors in AC Circuits Unit Test
132 © Festo Didactic 584079
7. What is the equivalent inductance of three 15-H inductors connected inseries?
a. 5.0 Hb. 45 Hc. 4.5 Hd. 50 H
8. What is the equivalent inductance of three parallel-connected inductors withvalues of 1 H, 2 H, and 4 H?
a. 7 Hb. 1.75 Hc. 0.57 Hd. 8 H
9. In a purely inductive ac circuit, the voltage leads the current by
a. 80°b. 90°c. 270°d. Both b and c.
10. What is the reactive power in a purely inductive ac circuit when the voltageand current values are 85 V and 10 A respectively?
a. 850 Wb. 850 VAc. 850 vard. 8.5 var
© Festo Didactic 584079 133
When you have completed this unit, you will be able to determine the active, reactive and apparent power in ac circuits, and calculate the power factor. You will use vector diagrams to solve ac circuits and determine circuit impedance. Concepts associated with phasors, impedance and ac power will be verified through circuit measurements and waveform observations.
As seen in the last two units, an ac circuit containing pure reactance, either capacitive or inductive, has voltages and currents that are 90° out-of-phase with each other, and no active power is consumed. Most practical ac circuits have both resistance and reactance, and the apparent power in volt-amperes is greater than the active power in watts. The difference between apparent power and active power is caused by the reactance, and is known as reactive power, expressed in var. Since capacitive reactive power has the opposite sign to inductive reactive power, apparent power in ac circuits can be minimized by adjusting the amount of capacitive and inductive reactance in the circuit. This allows the current drawn from the ac power source (line current) to be reduced to a minimum value without changing the active power consumed by the load. Minimizing the line current corresponds to increasing the power factor (cos ) which in the case of a purely resistive load equals 1. Circuits with purely reactive loads have a power factor of zero since they consume no active power, even though they draw line current and are a load on the source.
Power, Phasors, and Impedance in AC Circuits
Unit 5
UNIT OBJECTIVE
DISCUSSION OF
FUNDAMENTALS
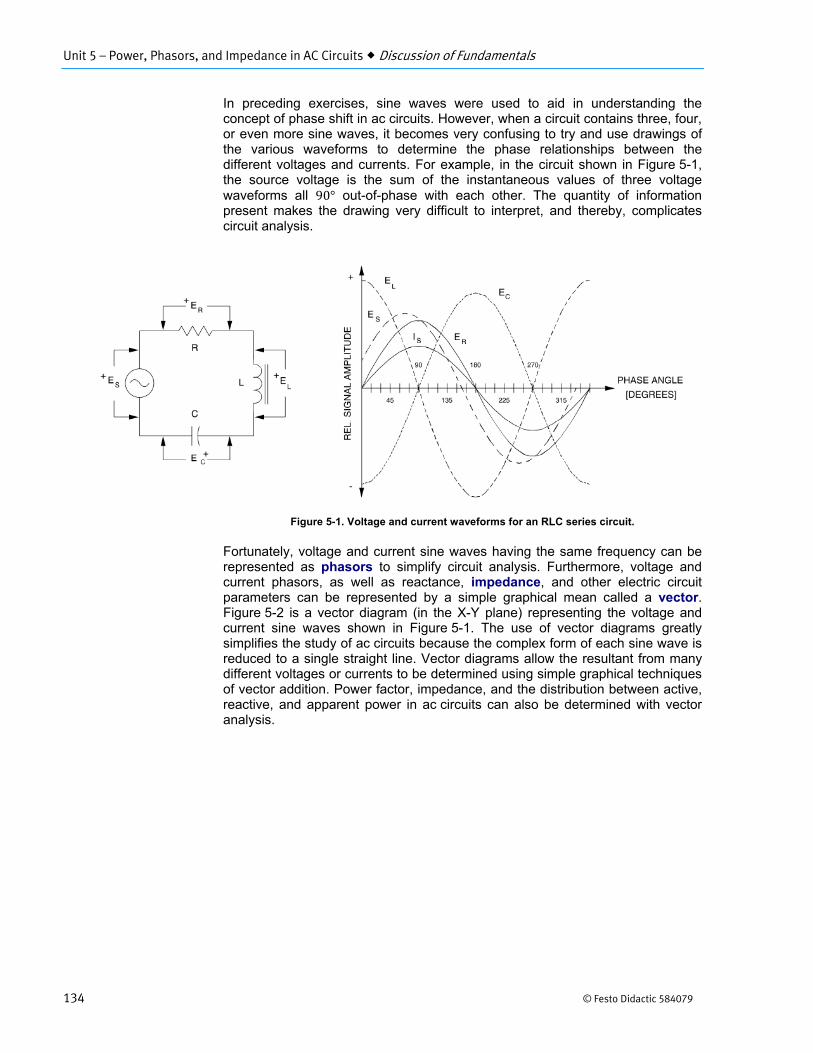
Unit 5 – Power, Phasors, and Impedance in AC Circuits Discussion of Fundamentals
134 © Festo Didactic 584079
In preceding exercises, sine waves were used to aid in understanding the concept of phase shift in ac circuits. However, when a circuit contains three, four, or even more sine waves, it becomes very confusing to try and use drawings of the various waveforms to determine the phase relationships between the different voltages and currents. For example, in the circuit shown in Figure 5-1, the source voltage is the sum of the instantaneous values of three voltage waveforms all 90° out-of-phase with each other. The quantity of information present makes the drawing very difficult to interpret, and thereby, complicates circuit analysis.
Figure 5-1. Voltage and current waveforms for an RLC series circuit.
Fortunately, voltage and current sine waves having the same frequency can be represented as phasors to simplify circuit analysis. Furthermore, voltage and current phasors, as well as reactance, impedance, and other electric circuit parameters can be represented by a simple graphical mean called a vector. Figure 5-2 is a vector diagram (in the X-Y plane) representing the voltage and current sine waves shown in Figure 5-1. The use of vector diagrams greatly simplifies the study of ac circuits because the complex form of each sine wave is reduced to a single straight line. Vector diagrams allow the resultant from many different voltages or currents to be determined using simple graphical techniques of vector addition. Power factor, impedance, and the distribution between active, reactive, and apparent power in ac circuits can also be determined with vector analysis.
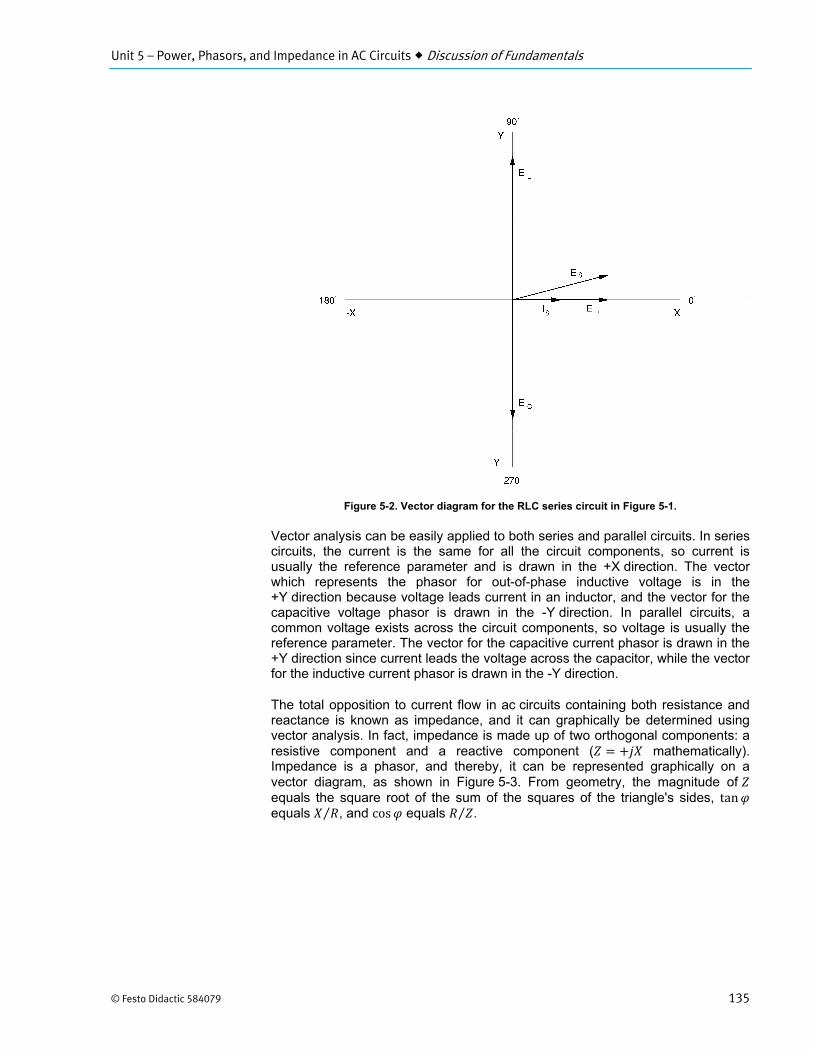
Unit 5 – Power, Phasors, and Impedance in AC Circuits Discussion of Fundamentals
© Festo Didactic 584079 135
Figure 5-2. Vector diagram for the RLC series circuit in Figure 5-1.
Vector analysis can be easily applied to both series and parallel circuits. In series circuits, the current is the same for all the circuit components, so current is usually the reference parameter and is drawn in the +X direction. The vector which represents the phasor for out-of-phase inductive voltage is in the +Y direction because voltage leads current in an inductor, and the vector for thecapacitive voltage phasor is drawn in the -Y direction. In parallel circuits, acommon voltage exists across the circuit components, so voltage is usually thereference parameter. The vector for the capacitive current phasor is drawn in the+Y direction since current leads the voltage across the capacitor, while the vectorfor the inductive current phasor is drawn in the -Y direction.
The total opposition to current flow in ac circuits containing both resistance and reactance is known as impedance, and it can graphically be determined using vector analysis. In fact, impedance is made up of two orthogonal components: a resistive component and a reactive component ( mathematically). Impedance is a phasor, and thereby, it can be represented graphically on a vector diagram, as shown in Figure 5-3. From geometry, the magnitude of equals the square root of the sum of the squares of the triangle's sides, tan equals ⁄ , and cos equals ⁄ .
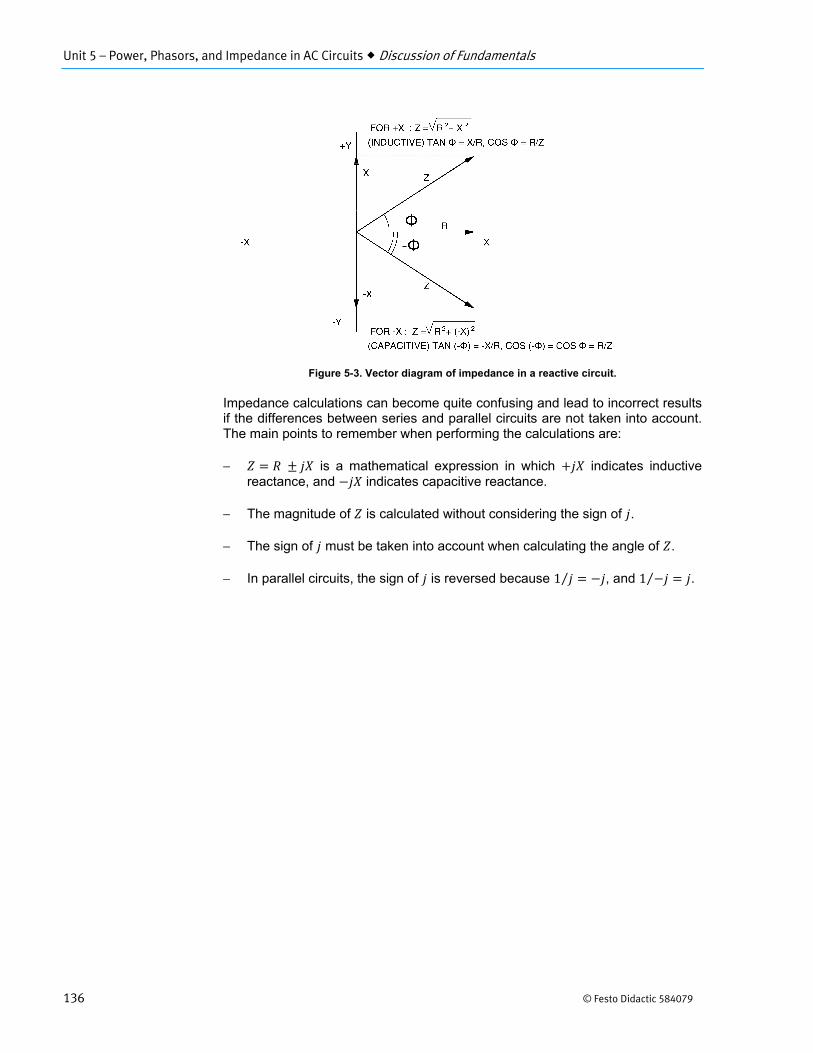
Unit 5 – Power, Phasors, and Impedance in AC Circuits Discussion of Fundamentals
136 © Festo Didactic 584079
Figure 5-3. Vector diagram of impedance in a reactive circuit.
Impedance calculations can become quite confusing and lead to incorrect results if the differences between series and parallel circuits are not taken into account. The main points to remember when performing the calculations are:
is a mathematical expression in which indicates inductive reactance, and indicates capacitive reactance.
The magnitude of is calculated without considering the sign of .
The sign of must be taken into account when calculating the angle of .
In parallel circuits, the sign of is reversed because 1⁄ , and 1⁄ .
© Festo Didactic 584079 137
When you have completed this exercise, you will be able to determine the active, reactive, and apparent power supplied to an inductive load by using measurements of circuit currents and voltages. You will also learn how to improve the power factor.
As stated previously, the apparent power supplied to a load equals the product of the load voltage and current. In ac circuits, apparent power is always greater than active power when the load contains reactance, because reactive power must be supplied by the source. The reactive power may be inductive or capacitive, but in most electromechanical devices it will be inductive because of the inductance of the coils in transformers and motors.
The formula for determining reactive power in an ac circuit is as follows:
where is the reactive power in var.
is the apparent power in VA.
is the active power in W.
When the phase shift between the voltage and current is known, active power can be determined from the following formula:
cos cos
In ac circuits where the voltage and current are sine waves, the term cos is called the power factor and it is equal to the ratio of active power to apparent power, ⁄ . The actual value of the power factor depends on how much the current and voltage are out-of-phase. If and are in phase (purely resistive circuit), meaning phase shift is 0°, then cos 1 and the active power is equal to the product (apparent power). When the phase shift between current and voltage is 90° (purely reactive circuit), cos 0, therefore the active power is zero. When a circuit contains both resistance and reactance, the phase shift lies between 0° and 90°, depending on whether circuit reactance is inductive or capacitive, cos has a value between 0 and 1, and the active power equals a fraction of the apparent power.
Power in AC Circuits
Exercise 5-1
EXERCISE OBJECTIVE
DISCUSSION
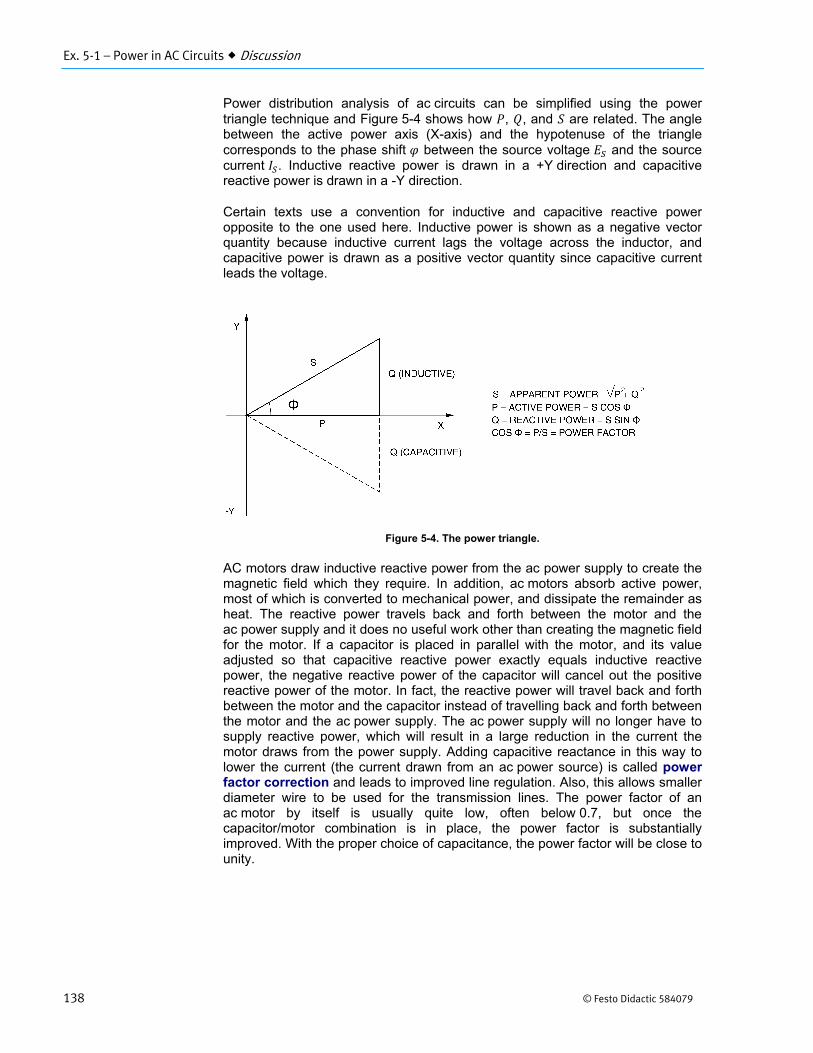
Ex. 5-1 – Power in AC Circuits Discussion
138 © Festo Didactic 584079
Power distribution analysis of ac circuits can be simplified using the power triangle technique and Figure 5-4 shows how , , and are related. The angle between the active power axis (X-axis) and the hypotenuse of the triangle corresponds to the phase shift between the source voltage and the source current . Inductive reactive power is drawn in a +Y direction and capacitive reactive power is drawn in a -Y direction.
Certain texts use a convention for inductive and capacitive reactive power opposite to the one used here. Inductive power is shown as a negative vector quantity because inductive current lags the voltage across the inductor, and capacitive power is drawn as a positive vector quantity since capacitive current leads the voltage.
Figure 5-4. The power triangle.
AC motors draw inductive reactive power from the ac power supply to create the magnetic field which they require. In addition, ac motors absorb active power, most of which is converted to mechanical power, and dissipate the remainder as heat. The reactive power travels back and forth between the motor and the ac power supply and it does no useful work other than creating the magnetic field for the motor. If a capacitor is placed in parallel with the motor, and its value adjusted so that capacitive reactive power exactly equals inductive reactive power, the negative reactive power of the capacitor will cancel out the positive reactive power of the motor. In fact, the reactive power will travel back and forth between the motor and the capacitor instead of travelling back and forth between the motor and the ac power supply. The ac power supply will no longer have to supply reactive power, which will result in a large reduction in the current the motor draws from the power supply. Adding capacitive reactance in this way to lower the current (the current drawn from an ac power source) is called power factor correction and leads to improved line regulation. Also, this allows smaller diameter wire to be used for the transmission lines. The power factor of an ac motor by itself is usually quite low, often below 0.7, but once the capacitor/motor combination is in place, the power factor is substantially improved. With the proper choice of capacitance, the power factor will be close to unity.
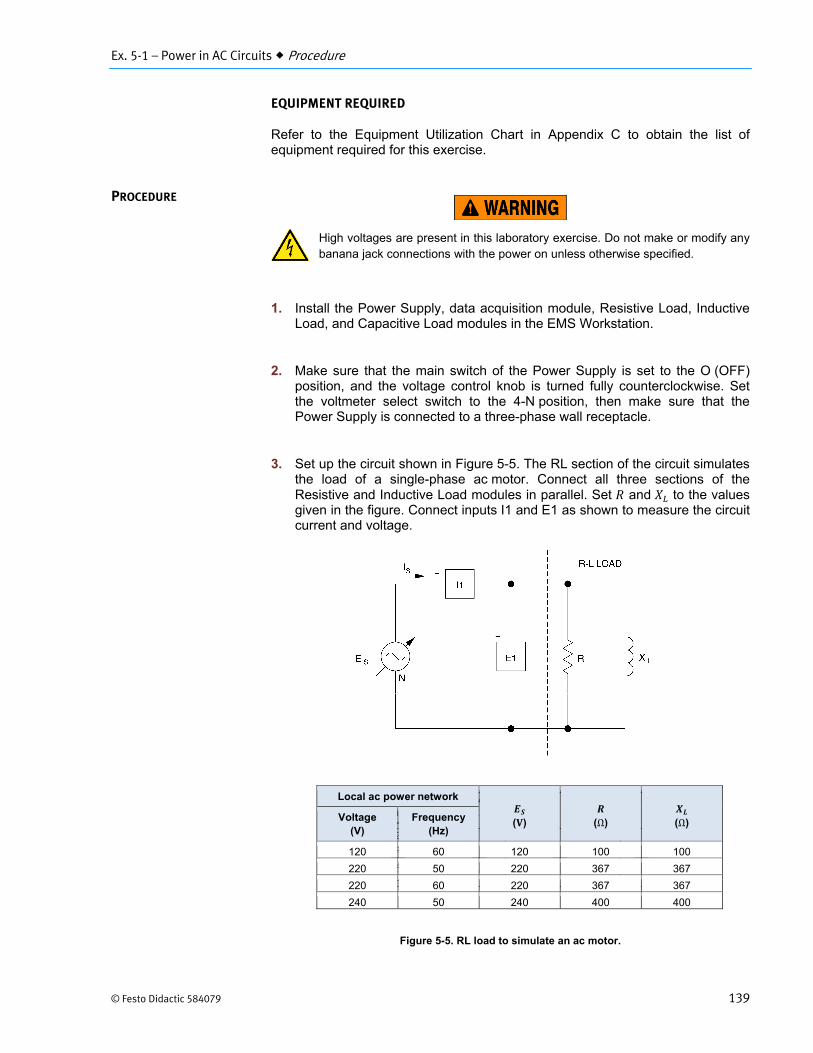
Ex. 5-1 – Power in AC Circuits Procedure
© Festo Didactic 584079 139
EQUIPMENT REQUIRED
Refer to the Equipment Utilization Chart in Appendix C to obtain the list of equipment required for this exercise.
High voltages are present in this laboratory exercise. Do not make or modify anybanana jack connections with the power on unless otherwise specified.
1. Install the Power Supply, data acquisition module, Resistive Load, InductiveLoad, and Capacitive Load modules in the EMS Workstation.
2. Make sure that the main switch of the Power Supply is set to the O (OFF)position, and the voltage control knob is turned fully counterclockwise. Setthe voltmeter select switch to the 4-N position, then make sure that thePower Supply is connected to a three-phase wall receptacle.
3. Set up the circuit shown in Figure 5-5. The RL section of the circuit simulatesthe load of a single-phase ac motor. Connect all three sections of theResistive and Inductive Load modules in parallel. Set and to the valuesgiven in the figure. Connect inputs I1 and E1 as shown to measure the circuitcurrent and voltage.
Figure 5-5. RL load to simulate an ac motor.
PROCEDURE
Local ac power network
( ) (Ω) (Ω) Voltage(V)
Frequency(Hz)
120 60 120 100 100
220 50 220 367 367
220 60 220 367 367
240 50 240 400 400
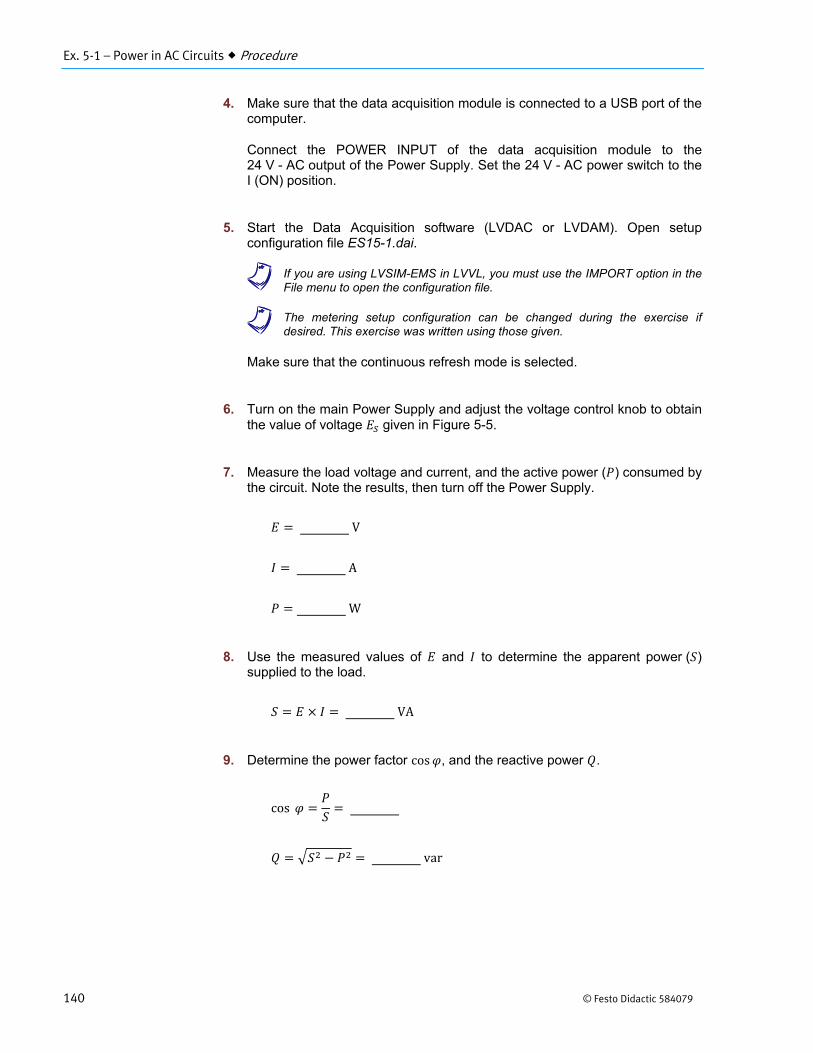
Ex. 5-1 – Power in AC Circuits Procedure
140 © Festo Didactic 584079
4. Make sure that the data acquisition module is connected to a USB port of thecomputer.
Connect the POWER INPUT of the data acquisition module to the24 V - AC output of the Power Supply. Set the 24 V - AC power switch to theI (ON) position.
5. Start the Data Acquisition software (LVDAC or LVDAM). Open setupconfiguration file ES15-1.dai.
a If you are using LVSIM-EMS in LVVL, you must use the IMPORT option in theFile menu to open the configuration file.
a The metering setup configuration can be changed during the exercise ifdesired. This exercise was written using those given.
Make sure that the continuous refresh mode is selected.
6. Turn on the main Power Supply and adjust the voltage control knob to obtainthe value of voltage given in Figure 5-5.
7. Measure the load voltage and current, and the active power ( ) consumed bythe circuit. Note the results, then turn off the Power Supply.
V
A
W
8. Use the measured values of and to determine the apparent power ( )supplied to the load.
VA
9. Determine the power factor cos , and the reactive power .
cos
var
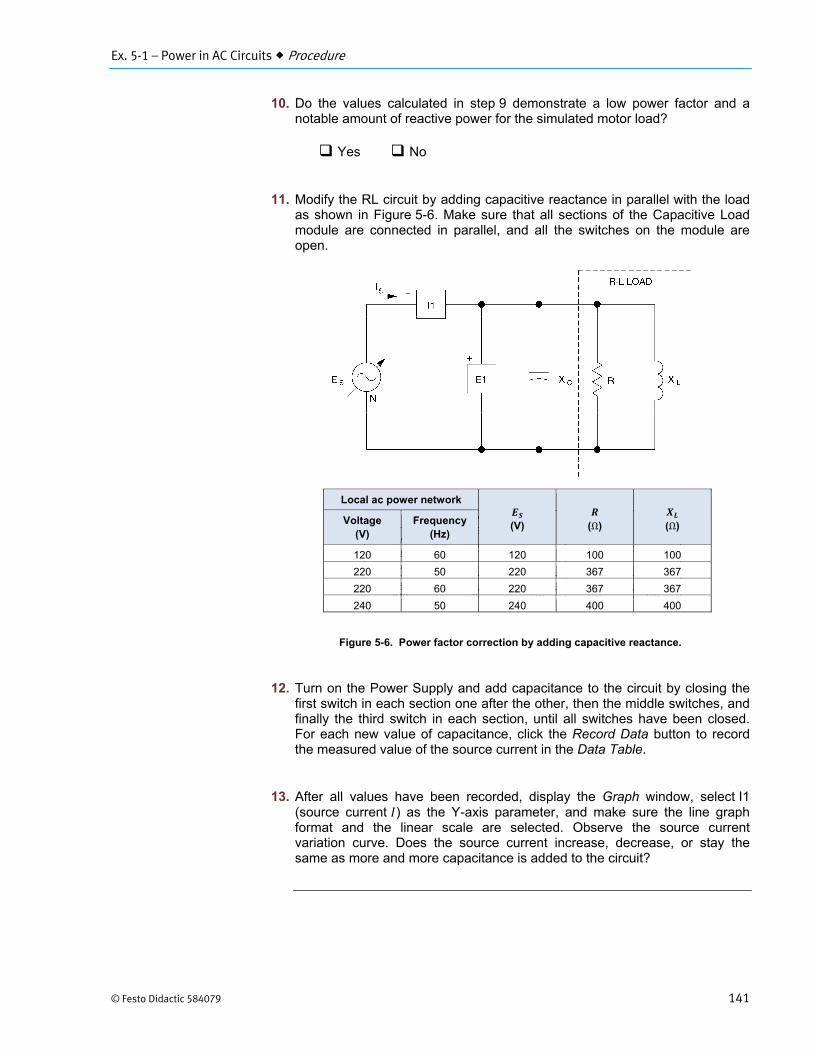
Ex. 5-1 – Power in AC Circuits Procedure
© Festo Didactic 584079 141
10. Do the values calculated in step 9 demonstrate a low power factor and anotable amount of reactive power for the simulated motor load?
Yes No
11. Modify the RL circuit by adding capacitive reactance in parallel with the loadas shown in Figure 5-6. Make sure that all sections of the Capacitive Loadmodule are connected in parallel, and all the switches on the module areopen.
Figure 5-6. Power factor correction by adding capacitive reactance.
12. Turn on the Power Supply and add capacitance to the circuit by closing thefirst switch in each section one after the other, then the middle switches, andfinally the third switch in each section, until all switches have been closed.For each new value of capacitance, click the Record Data button to recordthe measured value of the source current in the Data Table.
13. After all values have been recorded, display the Graph window, select I1(source current ) as the Y-axis parameter, and make sure the line graphformat and the linear scale are selected. Observe the source currentvariation curve. Does the source current increase, decrease, or stay thesame as more and more capacitance is added to the circuit?
Local ac power network
(V) (Ω) (Ω) Voltage(V)
Frequency(Hz)
120 60 120 100 100
220 50 220 367 367
220 60 220 367 367
240 50 240 400 400
Ex. 5-1 – Power in AC Circuits Procedure
142 © Festo Didactic 584079
14. Is there a point at which the source current stops decreasing, and then startsto increase again when more capacitance is added?
Yes No
15. Carefully adjust the switches on the Capacitive Load module to obtainminimum source current, while readjusting the voltage control knob asnecessary to maintain the exact value of voltage given in the table. Usethe settings on the module to determine the value of capacitive reactancethat produces minimum source current.
12
Ω
a You will have noticed that the source current is minimum when the capacitivereactance equals the inductive reactance. The negative reactive power then cancels the positive reactive power, and line current is minimized.
16. With adjusted for minimum source current, record the value of , , andthe active power .
V
A
W
17. Determine the apparent power .
VA
18. Calculate the power factor cos , and the reactive power .
cos
var

Ex. 5-1 – Power in AC Circuits Procedure
© Festo Didactic 584079 143
19. Has the reactive power consumed by the circuit decreased between step 9and step 18?
Yes No
20. Has the line current been reduced by a significant amount with the addition ofcapacitance?
Yes No
21. Is the active power consumed by the RL load approximately the same withand without capacitance?
Yes No
22. Ensure that the Power Supply is turned off, and that the voltage control knobis turned fully counterclockwise. Remove all leads and cables.

Ex. 5-1 – Power in AC Circuits Conclusion
144 © Festo Didactic 584079
In this exercise, you determined the active, reactive and apparent power for an inductive load, and were able to observe the effect produced by adding capacitance in parallel with the load. You saw how the power factor can be improved with the addition of capacitance, and you were able to demonstrate that line current can be reduced without affecting the amount of active power consumed by the load.
1. An electromagnet draws 3 kW of active power and 4 kvar of inductivereactive power. What is the apparent power?
a. 500 VAb. 5 kVAc. 50 kVAd. 7 kVA
2. What is the power factor cos for the electromagnet in Question 1?
a. 0.75b. 1.33c. 0.60d. 1.00
3. A capacitor drawing 4 kvar of reactive power is placed in parallel with theelectromagnet in Question 1. How does this affect the apparent power andthe power factor cos ?
a. Apparent power now equals the active power and cosequals 1.
b. Apparent power is doubled and cos remains the same.c. Apparent power remains the same and cos decreases.d. Both apparent power and cos increase.
4. What is the formula used to determine reactive power ?
a.b. cosc. cosd. √
5. A capacitor drawing 8 kvar is placed in parallel with an electromagnet thatdraws 3 kW of active power and 4 kvar of reactive power. What effect doesthis have on the reactive power provided by the ac power source and thepower factor cos ?
a. goes from +4 to −4 kvar and cos is corrected to unity.b. goes from +4 to −8 kvar and cos remains the same.c. goes from +4 to −4 kvar and cos remains the same.d. goes from +4 to −8 kvar and cos is corrected to unity.
CONCLUSION
REVIEW QUESTIONS
© Festo Didactic 584079 145
When you have completed this exercise, you will be able to use phasors to solve series ac circuits and determine the circuit voltages. Basic vector concepts combined with measurements of circuit currents and voltages will be used to verify your work.
In ac circuits, sine-wave currents flow through the circuit components and sine-wave voltages appear across the components. Each of the voltage and current sine waves has its own amplitude, but all these sine waves have the same frequency. As a result, there is a fixed phase relationship between the various voltage and current sine waves. Each of the voltage and current sine waves in ac circuits can be described by an amplitude and a phase angle. This allows a phasor (in polar coordinates) to be used to represent each of the voltage and current sine waves, the modulus and phase angle of the phasor corresponding to the amplitude and phase angle of the sine wave, respectively.
Phasors representing voltage and current sine waves in ac circuits (voltage and current phasors) can be represented graphically using vectors drawn in the X-Y plane. This graphical representation is referred to as a vector diagram. This allows each of the sine waves in an ac circuit to be reduced to a single line in the vector diagram. This greatly simplifies ac circuit analysis as will be demonstrated in the rest of this discussion.
Figure 5-7 shows two voltage sine waves and the corresponding vector diagram. Sine wave leads sine wave by 90°. In this example, sine wave is selected as the reference. It is therefore described by a voltage phasor having a magnitude equal to the amplitude of sine wave and a phase angle of 0° 0° . As a result, sine wave will be described by a voltage phasor having a magnitude equal to the amplitude of sine wave and a phase angle of 90° 90° because sine wave leads sine wave by 90°. The vector corresponding to voltage phasor is drawn along the positive-value X-axis because it is used as the reference. Its length corresponds tomagnitude . The vector corresponding to voltage phasor is drawn in the+Y direction so that it is at right angle with vector . Its length corresponds tomagnitude . The vector diagram clearly shows that leads by 90°, and and have the same amplitude.
a Angles measured in the counterclockwise direction from the reference phasorare considered positive, and thereby, indicate a phase lead. Conversely, angles measured in the clockwise direction from the reference phasor are considered negative, and thereby, indicate a phase lag.
Vectors and Phasors in Series AC Circuits
Exercise 5-2
EXERCISE OBJECTIVE
DISCUSSION
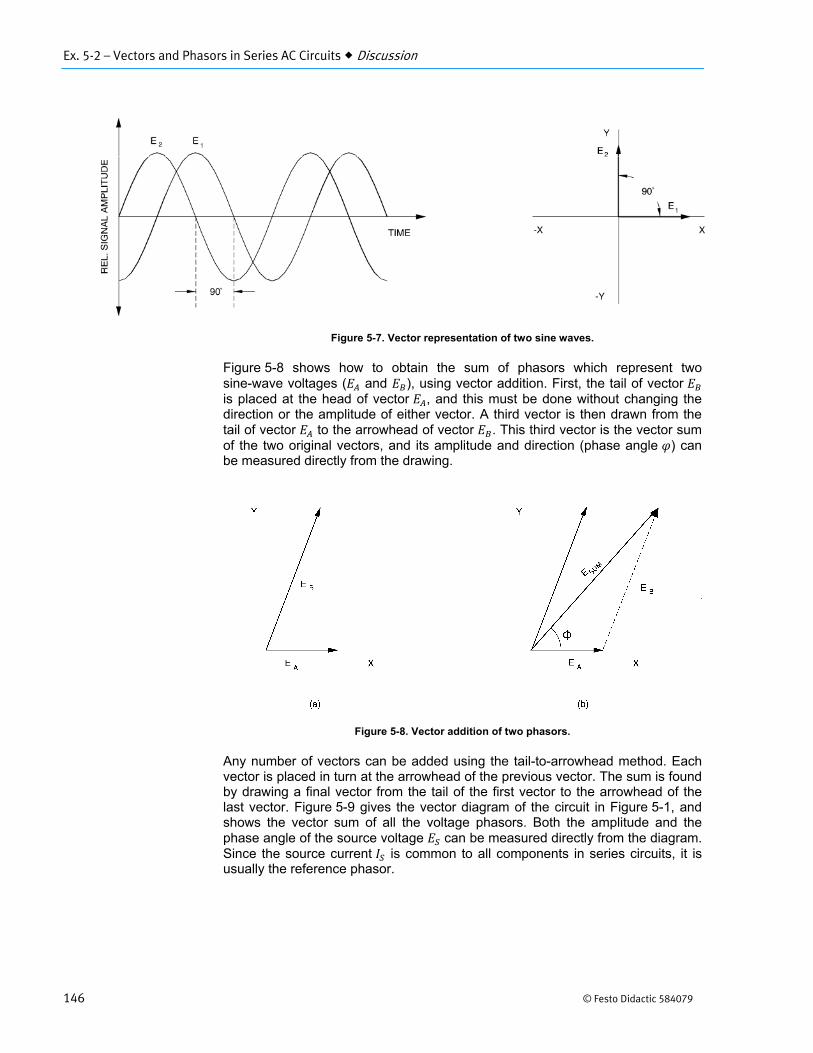
Ex. 5-2 – Vectors and Phasors in Series AC Circuits Discussion
146 © Festo Didactic 584079
Figure 5-7. Vector representation of two sine waves.
Figure 5-8 shows how to obtain the sum of phasors which represent two sine-wave voltages ( and ), using vector addition. First, the tail of vector is placed at the head of vector , and this must be done without changing the direction or the amplitude of either vector. A third vector is then drawn from the tail of vector to the arrowhead of vector . This third vector is the vector sum of the two original vectors, and its amplitude and direction (phase angle ) can be measured directly from the drawing.
Figure 5-8. Vector addition of two phasors.
Any number of vectors can be added using the tail-to-arrowhead method. Each vector is placed in turn at the arrowhead of the previous vector. The sum is found by drawing a final vector from the tail of the first vector to the arrowhead of the last vector. Figure 5-9 gives the vector diagram of the circuit in Figure 5-1, and shows the vector sum of all the voltage phasors. Both the amplitude and the phase angle of the source voltage can be measured directly from the diagram. Since the source current is common to all components in series circuits, it is usually the reference phasor.
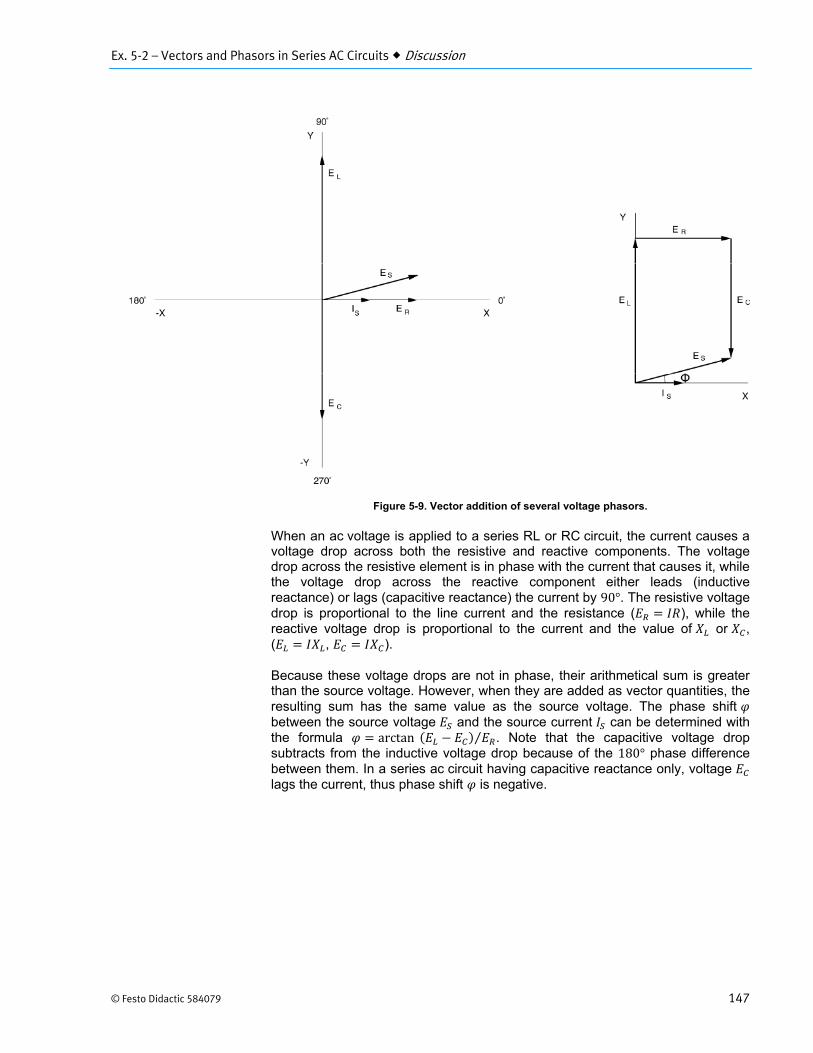
Ex. 5-2 – Vectors and Phasors in Series AC Circuits Discussion
© Festo Didactic 584079 147
Figure 5-9. Vector addition of several voltage phasors.
When an ac voltage is applied to a series RL or RC circuit, the current causes a voltage drop across both the resistive and reactive components. The voltage drop across the resistive element is in phase with the current that causes it, while the voltage drop across the reactive component either leads (inductive reactance) or lags (capacitive reactance) the current by 90°. The resistive voltage drop is proportional to the line current and the resistance ( ), while the reactive voltage drop is proportional to the current and the value of or , ( , ).
Because these voltage drops are not in phase, their arithmetical sum is greater than the source voltage. However, when they are added as vector quantities, the resulting sum has the same value as the source voltage. The phase shift between the source voltage and the source current can be determined with the formula arctan ⁄ . Note that the capacitive voltage drop subtracts from the inductive voltage drop because of the 180° phase difference between them. In a series ac circuit having capacitive reactance only, voltage lags the current, thus phase shift is negative.
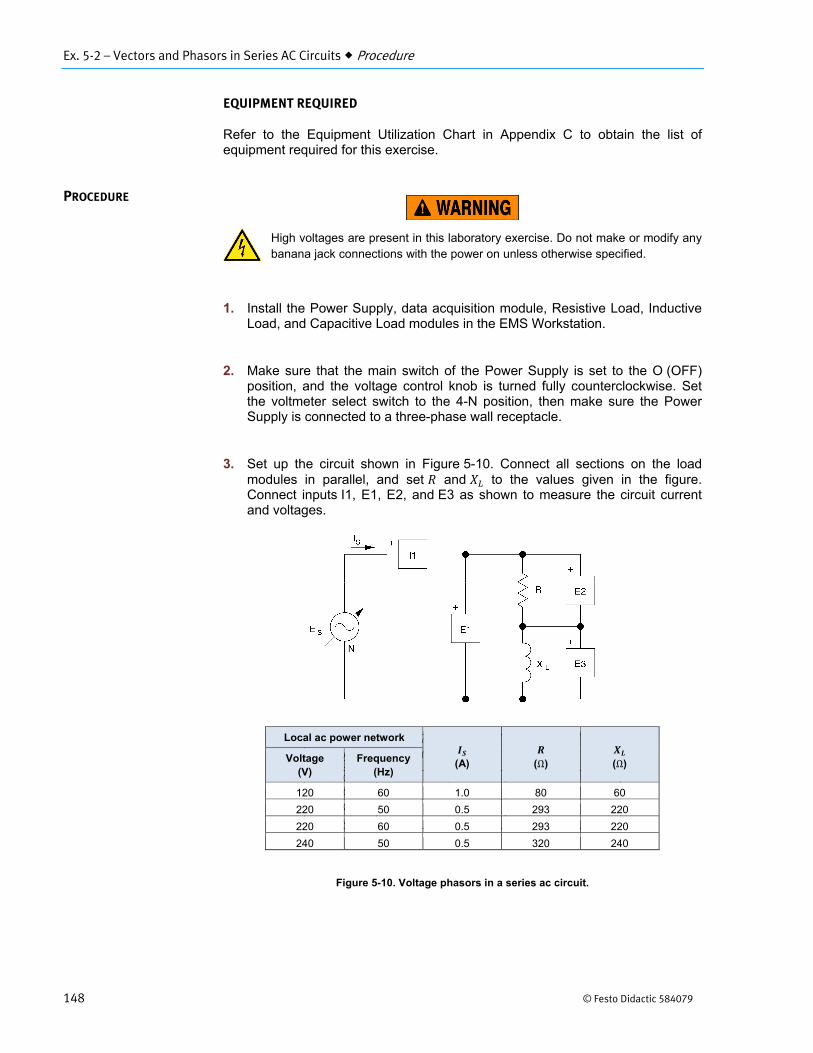
Ex. 5-2 – Vectors and Phasors in Series AC Circuits Procedure
148 © Festo Didactic 584079
EQUIPMENT REQUIRED
Refer to the Equipment Utilization Chart in Appendix C to obtain the list of equipment required for this exercise.
High voltages are present in this laboratory exercise. Do not make or modify anybanana jack connections with the power on unless otherwise specified.
1. Install the Power Supply, data acquisition module, Resistive Load, InductiveLoad, and Capacitive Load modules in the EMS Workstation.
2. Make sure that the main switch of the Power Supply is set to the O (OFF)position, and the voltage control knob is turned fully counterclockwise. Setthe voltmeter select switch to the 4-N position, then make sure the PowerSupply is connected to a three-phase wall receptacle.
3. Set up the circuit shown in Figure 5-10. Connect all sections on the loadmodules in parallel, and set and to the values given in the figure.Connect inputs I1, E1, E2, and E3 as shown to measure the circuit currentand voltages.
Figure 5-10. Voltage phasors in a series ac circuit.
PROCEDURE
Local ac power network
(A)
(Ω) (Ω) Voltage (V)
Frequency(Hz)
120 60 1.0 80 60
220 50 0.5 293 220
220 60 0.5 293 220
240 50 0.5 320 240

Ex. 5-2 – Vectors and Phasors in Series AC Circuits Procedure
© Festo Didactic 584079 149
4. Make sure that the data acquisition module is connected to a USB port of thecomputer.
Connect the POWER INPUT of the data acquisition module to the24 V - AC output of the Power Supply. Set the 24 V - AC power switch to theI (ON) position.
5. Start the Data Acquisition software (LVDAC or LVDAM). Open setupconfiguration file ES15-2.dai.
a If you are using LVSIM-EMS in LVVL, you must use the IMPORT option in theFile menu to open the configuration file.
a The metering setup configuration can be changed during the exercise ifdesired. This exercise was written using those given.
Make sure that the continuous refresh mode is selected.
6. Turn on the main Power Supply and slowly adjust the voltage control knob toobtain the exact value of current given in Figure 5-10.
7. Measure the circuit voltages, and note the results below.
V
V
V
8. Determine the arithmetical sum of and , and compare it to themeasured value of .
V
Ex. 5-2 – Vectors and Phasors in Series AC Circuits Procedure
150 © Festo Didactic 584079
9. Does the sum of the voltage drops equal the measured value of the sourcevoltage?
Yes No
10. Calculate the magnitude of the source voltage, and the phase shift between the source voltage and the source current .
V
arctan °
11. Click on the Phasor Analyzer button and display the three phasorsrepresenting the circuit voltages ( , , on channels E1, E2, and E3,respectively), as well as the reference phasor (channel I1). Does thephasor diagram show that is the vector sum of and ?
a The phasor of voltage is not in perfect quadrature with the phasor of .This is because the resistance of the inductor is not negligible when comparedto the reactance of the inductor.
Yes No
12. Are the results of your calculations in step 10 approximately equal to thevalues of magnitude and phase shown in the Phasor Data section of thePhasor Analyzer?
a Due to the fact that the inductor has a resistive component, the measuredvalues differ slightly from the calculated values.
Yes No
13. Turn off the Power Supply and replace the inductive reactance in thecircuit of Figure 5-10 with a capacitive reactance. Set equal to the valuepreviously used for and set the resistance to the same value as . Turnon the Power Supply and readjust the source voltage to obtain the samevalue of current that was used in step 6.
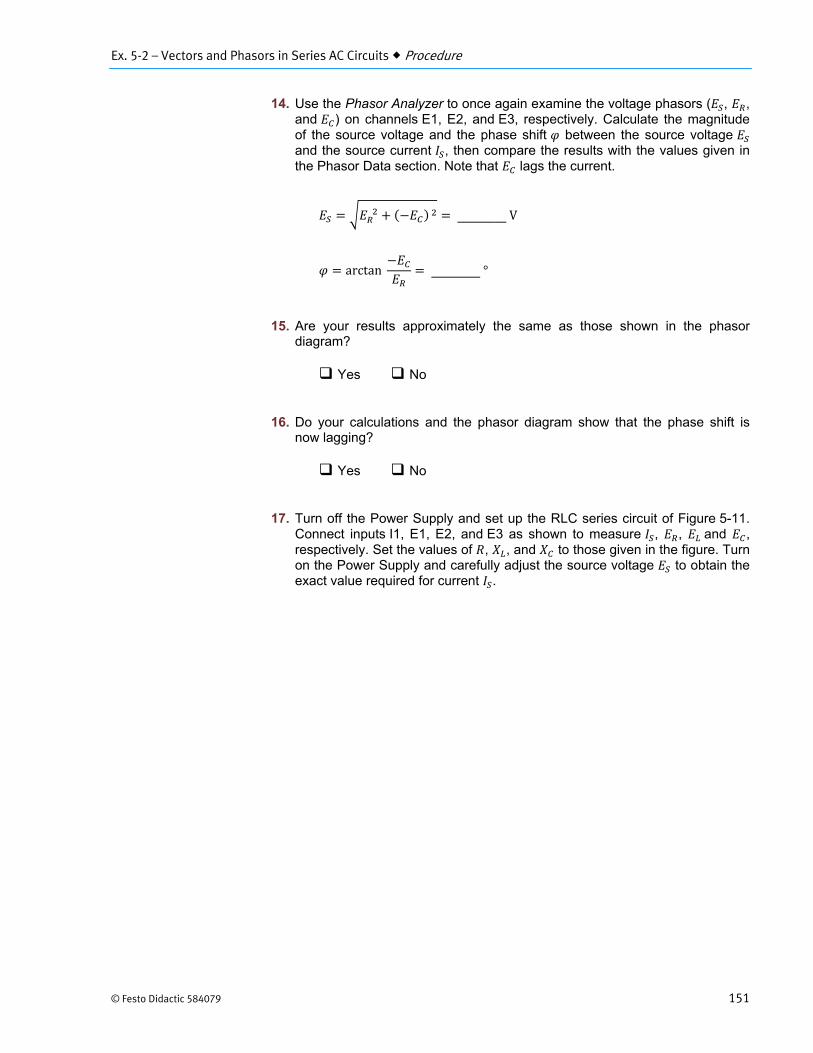
Ex. 5-2 – Vectors and Phasors in Series AC Circuits Procedure
© Festo Didactic 584079 151
14. Use the Phasor Analyzer to once again examine the voltage phasors ( , ,and ) on channels E1, E2, and E3, respectively. Calculate the magnitudeof the source voltage and the phase shift between the source voltage and the source current , then compare the results with the values given inthe Phasor Data section. Note that lags the current.
V
arctan °
15. Are your results approximately the same as those shown in the phasordiagram?
Yes No
16. Do your calculations and the phasor diagram show that the phase shift isnow lagging?
Yes No
17. Turn off the Power Supply and set up the RLC series circuit of Figure 5-11.Connect inputs I1, E1, E2, and E3 as shown to measure , , and ,respectively. Set the values of , , and to those given in the figure. Turnon the Power Supply and carefully adjust the source voltage to obtain theexact value required for current .
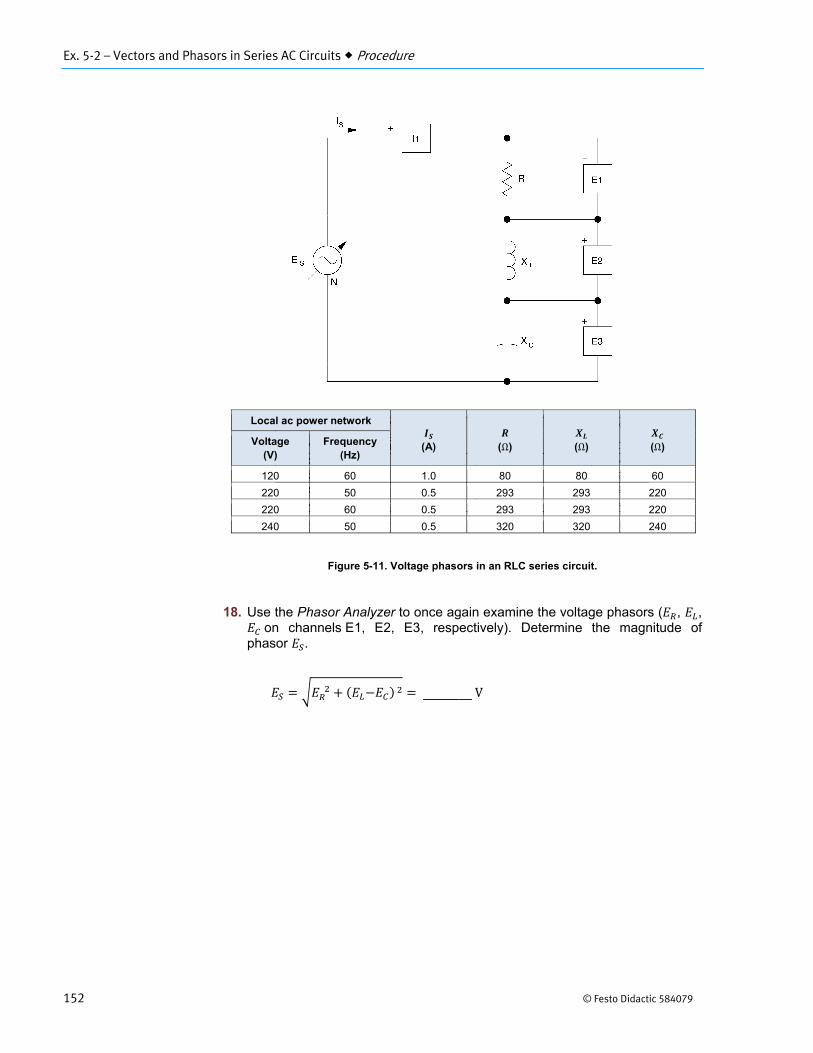
Ex. 5-2 – Vectors and Phasors in Series AC Circuits Procedure
152 © Festo Didactic 584079
Figure 5-11. Voltage phasors in an RLC series circuit.
18. Use the Phasor Analyzer to once again examine the voltage phasors ( , ,on channels E1, E2, E3, respectively). Determine the magnitude of
phasor .
V
Local ac power network
(A)
(Ω)
(Ω)
(Ω) Voltage (V)
Frequency(Hz)
120 60 1.0 80 80 60
220 50 0.5 293 293 220
220 60 0.5 293 293 220
240 50 0.5 320 320 240
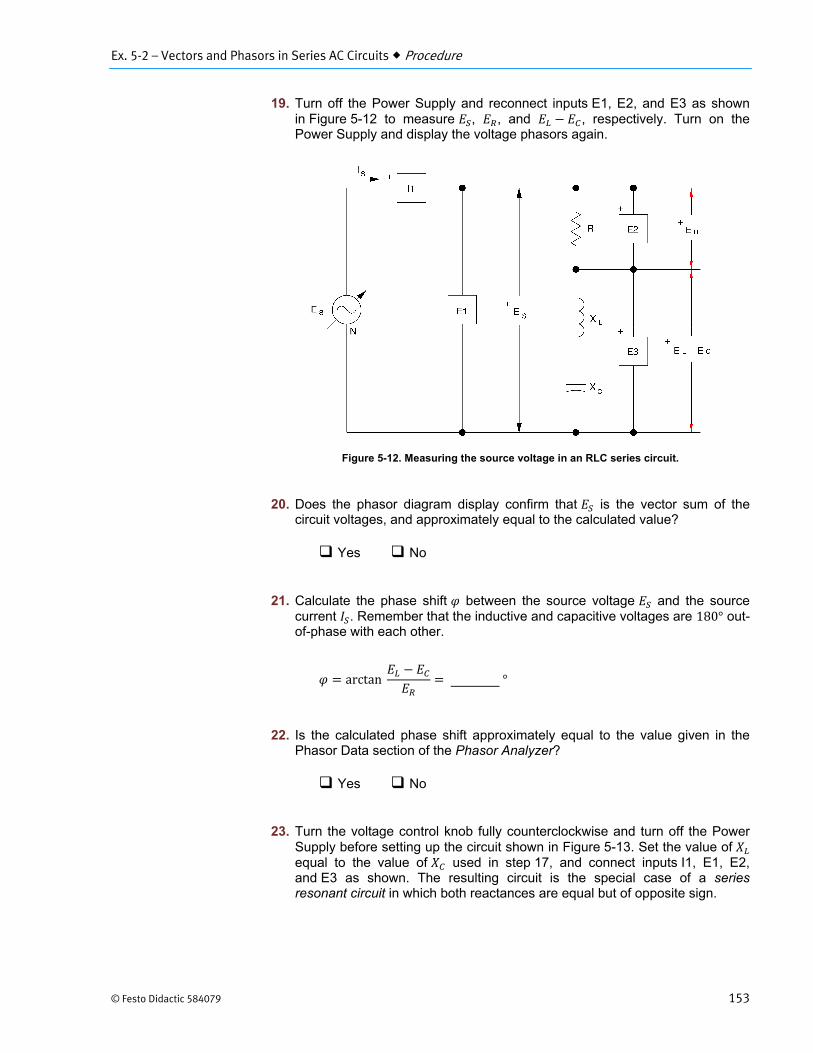
Ex. 5-2 – Vectors and Phasors in Series AC Circuits Procedure
© Festo Didactic 584079 153
19. Turn off the Power Supply and reconnect inputs E1, E2, and E3 as shownin Figure 5-12 to measure , , and , respectively. Turn on thePower Supply and display the voltage phasors again.
Figure 5-12. Measuring the source voltage in an RLC series circuit.
20. Does the phasor diagram display confirm that is the vector sum of thecircuit voltages, and approximately equal to the calculated value?
Yes No
21. Calculate the phase shift between the source voltage and the sourcecurrent . Remember that the inductive and capacitive voltages are 180° out-of-phase with each other.
arctan °
22. Is the calculated phase shift approximately equal to the value given in thePhasor Data section of the Phasor Analyzer?
Yes No
23. Turn the voltage control knob fully counterclockwise and turn off the PowerSupply before setting up the circuit shown in Figure 5-13. Set the value of equal to the value of used in step 17, and connect inputs I1, E1, E2,and E3 as shown. The resulting circuit is the special case of a seriesresonant circuit in which both reactances are equal but of opposite sign.
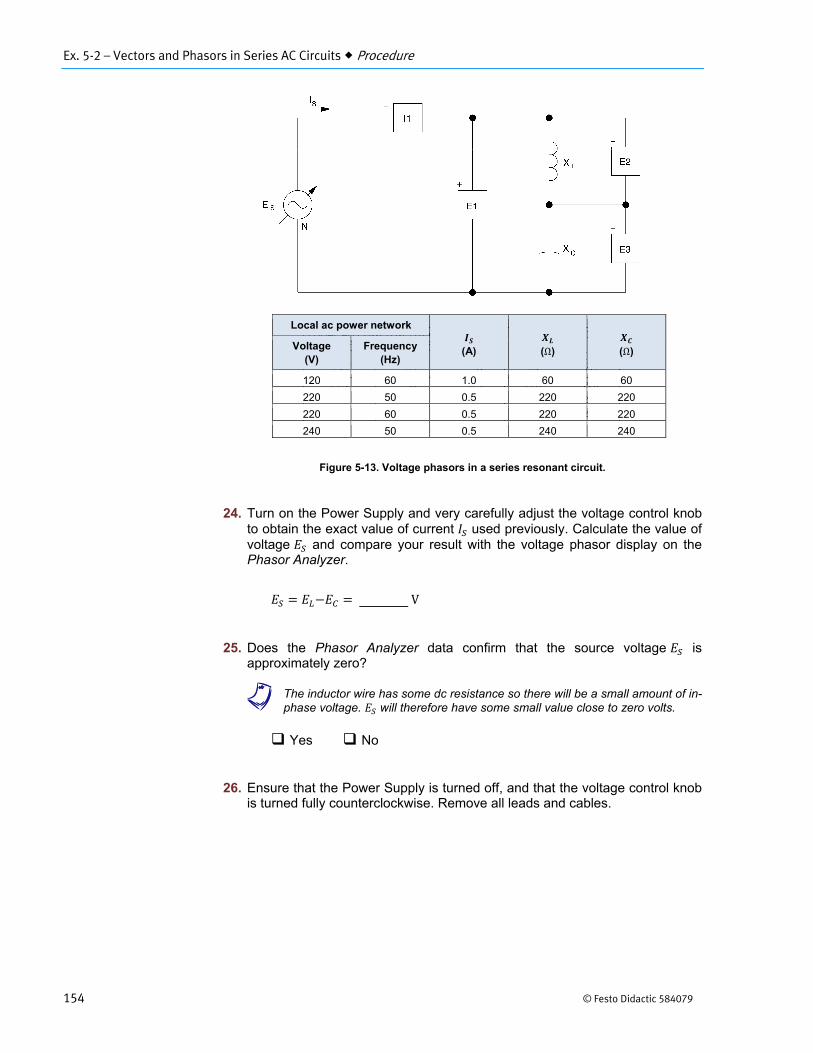
Ex. 5-2 – Vectors and Phasors in Series AC Circuits Procedure
154 © Festo Didactic 584079
Figure 5-13. Voltage phasors in a series resonant circuit.
24. Turn on the Power Supply and very carefully adjust the voltage control knobto obtain the exact value of current used previously. Calculate the value ofvoltage and compare your result with the voltage phasor display on thePhasor Analyzer.
V
25. Does the Phasor Analyzer data confirm that the source voltage isapproximately zero?
a The inductor wire has some dc resistance so there will be a small amount of in-phase voltage. will therefore have some small value close to zero volts.
Yes No
26. Ensure that the Power Supply is turned off, and that the voltage control knobis turned fully counterclockwise. Remove all leads and cables.
Local ac power network
(A)
(Ω)
(Ω) Voltage(V)
Frequency(Hz)
120 60 1.0 60 60
220 50 0.5 220 220
220 60 0.5 220 220
240 50 0.5 240 240
Ex. 5-2 – Vectors and Phasors in Series AC Circuits Conclusion
© Festo Didactic 584079 155
In this exercise, you used phasors and vector analysis techniques to determine the different voltages in series ac circuits. You used source current as the reference phasor since it is common to all components of series circuits. You saw that the equal but opposite-sign reactances in a series-resonant circuit reduced the opposition to source current to a very small value. Phasor displays (vector diagrams) of the different circuit voltages were used to confirm your calculations.
1. In an RL series circuit, what is the phase shift between the source voltageand current when and are both equal to 100 Ω?
a. 37°b. 53°c. 45°d. 90°
2. The main characteristic of a series resonant circuit is that the
a. source voltage is a high value.b. source current is a low value.c. source voltage is almost equal to zero.d. source current is almost equal to zero.
3. In an RL series circuit, the parameter used as reference for drawing a vectordiagram is the
a. voltage.b. current.c. reactance.d. resistance.
4. The magnitude of the vector sum of the two voltages in an RL series circuitcan be determined with the formula
a.b.c. 2
d.
5. When an ac voltage is applied to a series RL or RC circuit, the currentcauses a voltage drop across
a. the resistive component of the circuit.b. the reactive component of the circuit, and this voltage drop lags the
current by 90° when the component has a capacitive reactance.c. the reactive component of the circuit, and this voltage drop leads the
current by 90° when the component has an inductive reactance.d. all of the above.
CONCLUSION
REVIEW QUESTIONS

© Festo Didactic 584079 157
When you have completed this exercise, you will be able to use phasors to solve parallel ac circuits and determine branch currents. Basic vector concepts and measurements of circuit currents and voltages will be used to verify your work.
When an ac voltage is applied to a parallel RL or RC circuit, the source voltage causes current to flow through both the resistive and reactive components. The resistive current is in phase with the source voltage, while the reactive current either leads (capacitive reactance) or lags (inductive reactance) the source voltage by 90°.
Because the same voltage is present across all components in a parallel circuit, it is used as the reference phasor. In vector diagrams, the vector which represents the phasor for capacitive current is drawn in the +Y direction because it leads the voltage across the capacitor, while the vector which represents the inductive current phasor is drawn in the -Y direction.
Since the different branch currents in a parallel circuit are out-of-phase with each other, their arithmetical sum is greater than the actual current supplied by the source. However, when the branch currents are presented as phasors, their vector sum equals the source current. The phase shift between the source voltage and the source current can be determined with the formula arctan ⁄ . Notice that the inductive current subtracts from the capacitive current because of the 180° phase difference between them. In a parallel ac circuit having inductive reactance only, current lags the voltage, thus phase shift will be negative. Note that this laboratory exercise is very similar to the previous one, but the parallel circuits are solved by performing vector addition of current phasors instead of voltage phasors.
EQUIPMENT REQUIRED
Refer to the Equipment Utilization Chart in Appendix C to obtain the list of equipment required for this exercise.
High voltages are present in this laboratory exercise. Do not make or modify anybanana jack connections with the power on unless otherwise specified.
1. Install the Power Supply, data acquisition module, Resistive Load, InductiveLoad, and Capacitive Load modules in the EMS Workstation.
Vectors and Phasors in Parallel AC Circuits
Exercise 5-3
EXERCISE OBJECTIVE
DISCUSSION
PROCEDURE
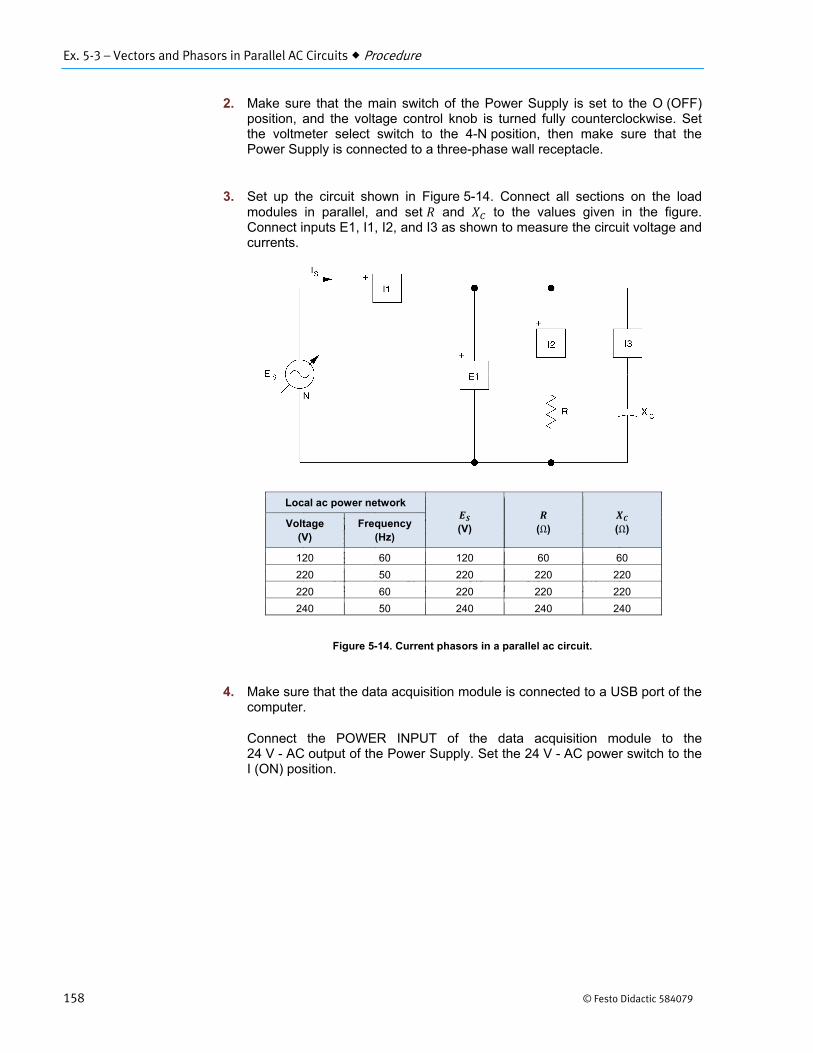
Ex. 5-3 – Vectors and Phasors in Parallel AC Circuits Procedure
158 © Festo Didactic 584079
2. Make sure that the main switch of the Power Supply is set to the O (OFF)position, and the voltage control knob is turned fully counterclockwise. Setthe voltmeter select switch to the 4-N position, then make sure that thePower Supply is connected to a three-phase wall receptacle.
3. Set up the circuit shown in Figure 5-14. Connect all sections on the loadmodules in parallel, and set and to the values given in the figure.Connect inputs E1, I1, I2, and I3 as shown to measure the circuit voltage andcurrents.
Figure 5-14. Current phasors in a parallel ac circuit.
4. Make sure that the data acquisition module is connected to a USB port of thecomputer.
Connect the POWER INPUT of the data acquisition module to the24 V - AC output of the Power Supply. Set the 24 V - AC power switch to theI (ON) position.
Local ac power network
(V)
(Ω)
(Ω) Voltage (V)
Frequency(Hz)
120 60 120 60 60
220 50 220 220 220
220 60 220 220 220
240 50 240 240 240
Ex. 5-3 – Vectors and Phasors in Parallel AC Circuits Procedure
© Festo Didactic 584079 159
5. Start the Data Acquisition software (LVDAC or LVDAM). Open setupconfiguration file ES15-3.dai.
a If you are using LVSIM-EMS in LVVL, you must use the IMPORT option in theFile menu to open the configuration file.
a The metering setup configuration can be changed during the exercise ifdesired. This exercise was written using those given.
Make sure that the continuous refresh mode is selected.
6. Turn on the main Power Supply and slowly adjust the voltage control knob toobtain the exact value of voltage given in Figure 5-14.
7. Measure the circuit currents, and note the results below.
(current 1) A
(current 2) A
(current 3) A
8. Determine the arithmetical sum of and , and compare it to the measuredvalue of .
A
9. Does the sum of the branch currents equal the measured value of the sourcecurrent?
Yes No
10. Calculate the magnitude of the source current, and the phase shift between the source voltage and the source current .
A
arctan °
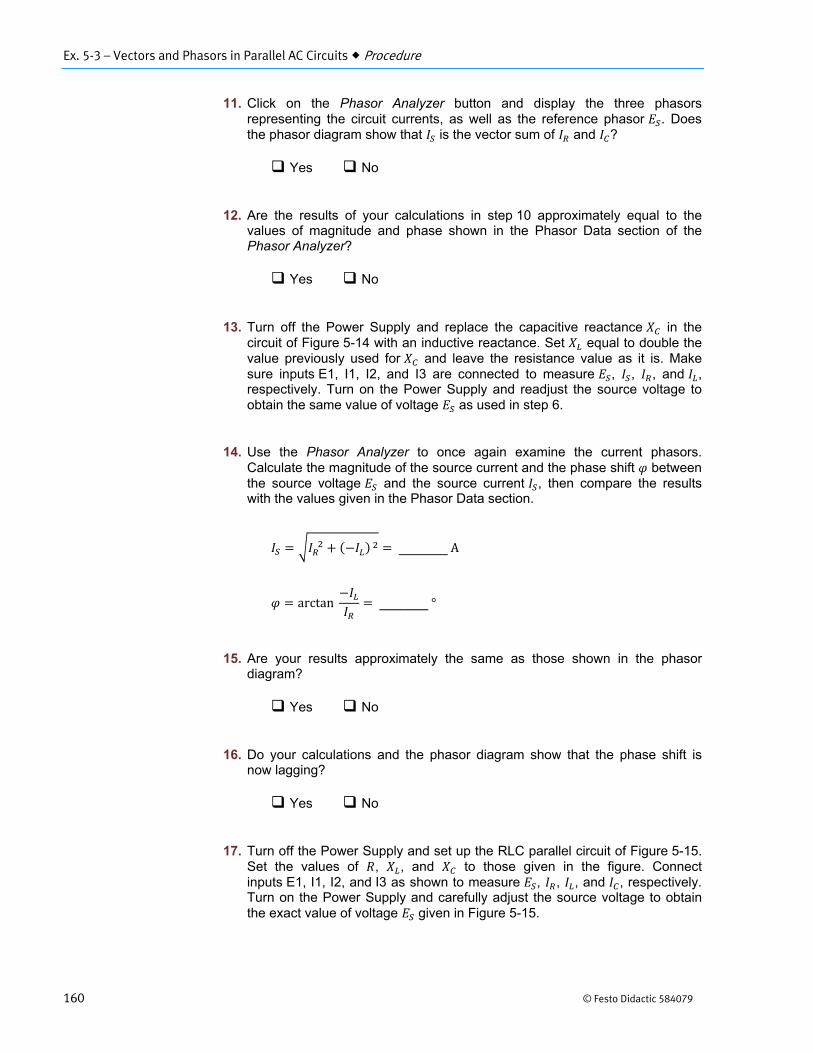
Ex. 5-3 – Vectors and Phasors in Parallel AC Circuits Procedure
160 © Festo Didactic 584079
11. Click on the Phasor Analyzer button and display the three phasorsrepresenting the circuit currents, as well as the reference phasor . Doesthe phasor diagram show that is the vector sum of and ?
Yes No
12. Are the results of your calculations in step 10 approximately equal to thevalues of magnitude and phase shown in the Phasor Data section of thePhasor Analyzer?
Yes No
13. Turn off the Power Supply and replace the capacitive reactance in thecircuit of Figure 5-14 with an inductive reactance. Set equal to double thevalue previously used for and leave the resistance value as it is. Makesure inputs E1, I1, I2, and I3 are connected to measure , , , and ,respectively. Turn on the Power Supply and readjust the source voltage toobtain the same value of voltage as used in step 6.
14. Use the Phasor Analyzer to once again examine the current phasors.Calculate the magnitude of the source current and the phase shift betweenthe source voltage and the source current , then compare the resultswith the values given in the Phasor Data section.
A
arctan °
15. Are your results approximately the same as those shown in the phasordiagram?
Yes No
16. Do your calculations and the phasor diagram show that the phase shift isnow lagging?
Yes No
17. Turn off the Power Supply and set up the RLC parallel circuit of Figure 5-15.Set the values of , , and to those given in the figure. Connectinputs E1, I1, I2, and I3 as shown to measure , , , and , respectively.Turn on the Power Supply and carefully adjust the source voltage to obtainthe exact value of voltage given in Figure 5-15.
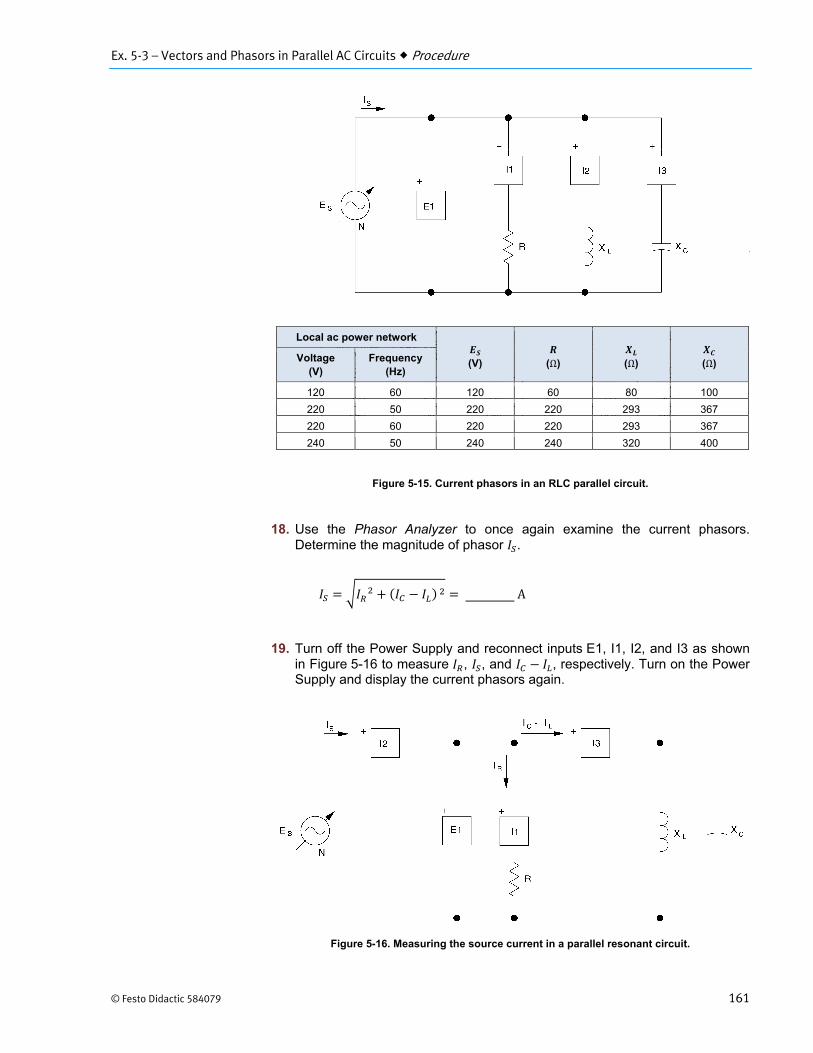
Ex. 5-3 – Vectors and Phasors in Parallel AC Circuits Procedure
© Festo Didactic 584079 161
Figure 5-15. Current phasors in an RLC parallel circuit.
18. Use the Phasor Analyzer to once again examine the current phasors.Determine the magnitude of phasor .
A
19. Turn off the Power Supply and reconnect inputs E1, I1, I2, and I3 as shownin Figure 5-16 to measure , , and , respectively. Turn on the PowerSupply and display the current phasors again.
Figure 5-16. Measuring the source current in a parallel resonant circuit.
Local ac power network
(V)
(Ω)
(Ω)
(Ω) Voltage(V)
Frequency(Hz)
120 60 120 60 80 100
220 50 220 220 293 367
220 60 220 220 293 367
240 50 240 240 320 400
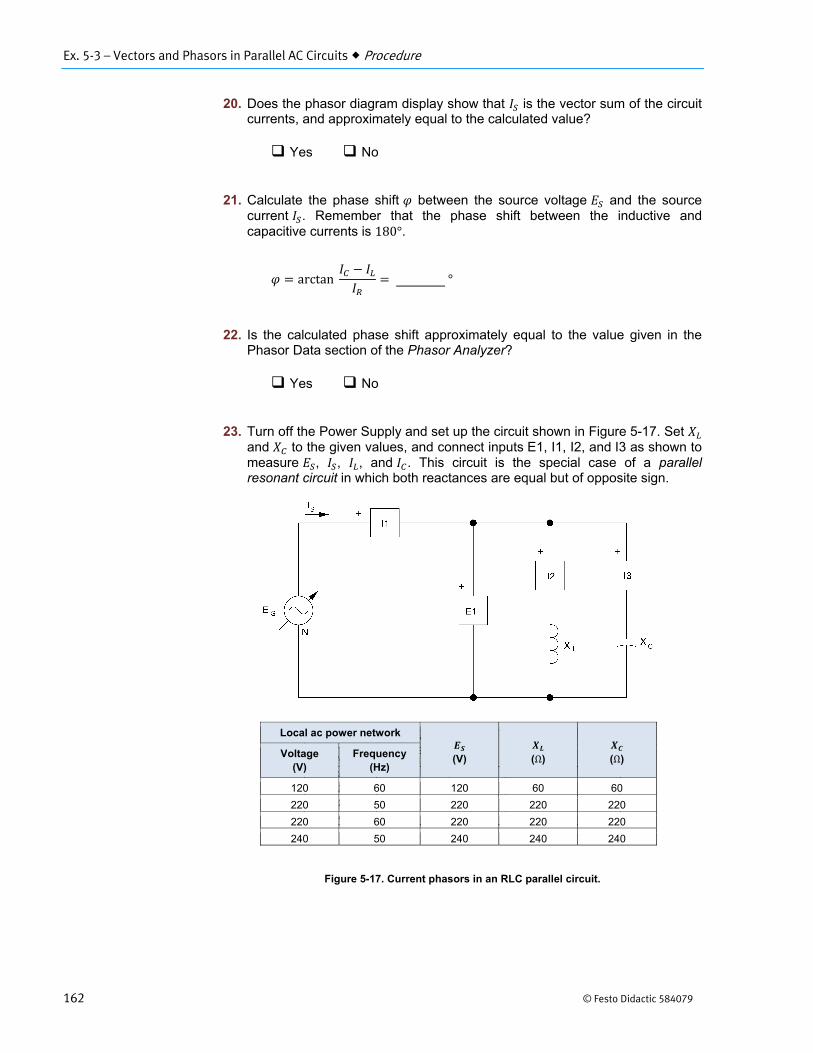
Ex. 5-3 – Vectors and Phasors in Parallel AC Circuits Procedure
162 © Festo Didactic 584079
20. Does the phasor diagram display show that is the vector sum of the circuitcurrents, and approximately equal to the calculated value?
Yes No
21. Calculate the phase shift between the source voltage and the sourcecurrent . Remember that the phase shift between the inductive andcapacitive currents is 180°.
arctan °
22. Is the calculated phase shift approximately equal to the value given in thePhasor Data section of the Phasor Analyzer?
Yes No
23. Turn off the Power Supply and set up the circuit shown in Figure 5-17. Set and to the given values, and connect inputs E1, I1, I2, and I3 as shown tomeasure , , , and . This circuit is the special case of a parallelresonant circuit in which both reactances are equal but of opposite sign.
Figure 5-17. Current phasors in an RLC parallel circuit.
Local ac power network
(V)
(Ω)
(Ω) Voltage (V)
Frequency(Hz)
120 60 120 60 60
220 50 220 220 220
220 60 220 220 220
240 50 240 240 240

Ex. 5-3 – Vectors and Phasors in Parallel AC Circuits Procedure
© Festo Didactic 584079 163
24. Turn on the Power Supply and very carefully adjust the voltage control knobto obtain the exact value of voltage given in Figure 5-17. Calculate andcompare your result with the Phasor Analyzer data.
A
25. Does the Phasor Data confirm that the source current is approximately zero?
a The inductor wire has some dc resistance so there will be a small amount of in-phase current. will therefore have some small value close to 0 A.
Yes No
26. Ensure that the Power Supply is turned off, and that the voltage control knobis turned fully counterclockwise. Remove all leads and cables.

Ex. 5-3 – Vectors and Phasors in Parallel AC Circuits Conclusion
164 © Festo Didactic 584079
In this exercise, you used phasors and vector analysis to determine the different currents in parallel ac circuits. Source voltage was used as the reference phasor since it is common to all components of parallel circuits. You saw that the equal but opposite-sign reactances in a parallel-resonant circuit caused the source current to be a very small value. Phasor displays (vector diagrams) of the different circuit currents were used to confirm your calculations.
1. In an RC parallel circuit, what is the phase shift between the source voltageand current when and are 30 Ω and 40 Ω, respectively?
a. 37°b. 53°c. 45°d. 90°
2. The main characteristic of a parallel resonant circuit is that the
a. source current is a high value.b. source voltage is a low value.c. source current is almost equal to zero.d. source voltage is almost equal to zero.
3. In an RL parallel circuit, the parameter used as reference for drawing avector diagram is the
a. voltage.b. current.c. reactance.d. resistance.
4. The formula used to determine the magnitude of the vector sum of the twocurrents in an RL parallel circuit is
a.
b. ⁄c. 2
d.
5. The phase shift between the source voltage and the source current inan RL parallel circuit can be determined from
a. the ratio ⁄b. the ratio ⁄c. the ratio ⁄d. none of the above.
CONCLUSION
REVIEW QUESTIONS
© Festo Didactic 584079 165
When you have completed this exercise, you will be able to determine and demonstrate the impedance of ac circuits. Circuit measurements of currents and voltages will be used to verify the theory and formulas presented with the impedance equations.
You observed in previous exercises that the total opposition to current flow in circuits containing both resistance and reactance ( or ) is not the simple sum of resistance and reactance. The reactance must be added to the resistance in such a way as to take into account the 90° phase difference between the two voltages in series circuits, or the two currents in parallel circuits. The total opposition to current flow is called impedance ( ), and is expressed mathematically as a phasor using either rectangular or polar coordinates:
(rectangular coordinates)
(polar coordinates)
where is the magnitude of the impedance.
is the phase angle related to the impedance.
In a series RL or RC circuit, the voltage across a resistor, inductor or capacitor equals the product of the current and the resistance, the inductive reactance or the capacitive reactance. Ohm's law for the RL series circuit in Figure 5-18 gives:
and
The total voltage is the current times the total opposition to current flow in the circuit and is expressed as . The impedance, as the total voltage drop across the components (the source voltage ), may also be determined graphically using vectors, as shown in Figure 5-18.
Impedance
Exercise 5-4
EXERCISE OBJECTIVE
DISCUSSION
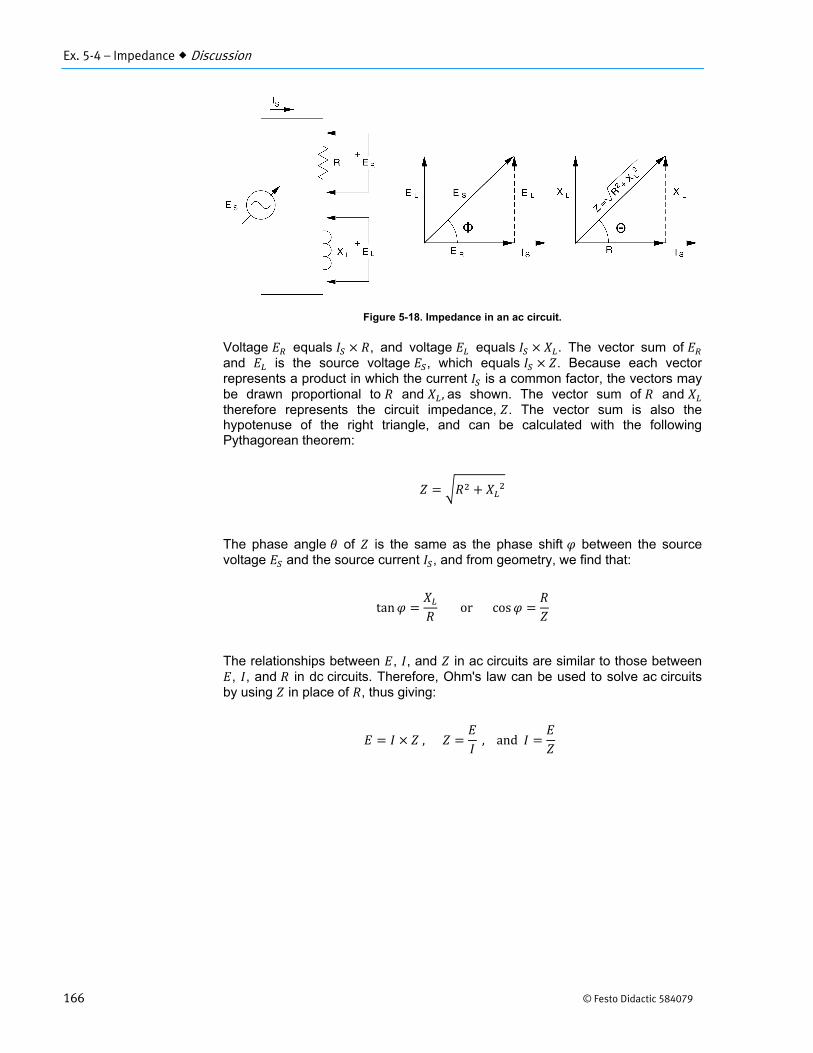
Ex. 5-4 – Impedance Discussion
166 © Festo Didactic 584079
Figure 5-18. Impedance in an ac circuit.
Voltage equals , and voltage equals . The vector sum of and is the source voltage , which equals . Because each vector represents a product in which the current is a common factor, the vectors may be drawn proportional to and ,as shown. The vector sum of and therefore represents the circuit impedance, . The vector sum is also the hypotenuse of the right triangle, and can be calculated with the following Pythagorean theorem:
The phase angle of is the same as the phase shift between the source voltage and the source current , and from geometry, we find that:
tan or cos
The relationships between , , and in ac circuits are similar to those between , , and in dc circuits. Therefore, Ohm's law can be used to solve ac circuits
by using in place of , thus giving:
, , and
Ex. 5-4 – Impedance Discussion
© Festo Didactic 584079 167
In a parallel RL or RC circuit, the applied voltage is the same across each branch, thus it is used as the reference. The current in each of the branches is found by dividing by the branch impedance, , , or . The source current is then found by adding the branch currents vectorially. This gives:
and
The impedance of parallel circuits can be found using Ohm's law, ⁄ . The magnitude of can also be found by vector addition of the resistance and reactance values, using the following formulas:
and
The phase shift for parallel circuits can be determined using the following relationships:
tan / and cos
When a circuit contains both inductive and capacitive elements, first solve for the equivalent reactance and use this value in the preceding formulas. For series circuits, , while for parallel circuits, ⁄ . Depending on whether is positive or negative, the combined reactance will be inductive or capacitive, and the corresponding phase shift will be leading (positive) or lagging (negative).
This exercise is divided into two distinct parts, Impedance in series circuits and Impedance in parallel circuits. It can be completed over two consecutive laboratory sessions if insufficient time is available in one period.
Ex. 5-4 – Impedance Procedure
168 © Festo Didactic 584079
EQUIPMENT REQUIRED
Refer to the Equipment Utilization Chart in Appendix C to obtain the list of equipment required for this exercise.
High voltages are present in this laboratory exercise. Do not make or modify anybanana jack connections with the power on unless otherwise specified.
Impedance in series circuits
1. Install the Power Supply, data acquisition module, Resistive Load, InductiveLoad, and Capacitive Load modules in the EMS Workstation.
2. Make sure that the main switch of the Power Supply is set to the O (OFF)position, and the voltage control knob is turned fully counterclockwise. Setthe voltmeter select switch to the 4-N position, then make sure the PowerSupply is connected to a three-phase wall receptacle.
3. Set up the circuit shown in Figure 5-19. Connect all sections on the loadmodules in parallel, and set and to the values given in the figure.Connect inputs I1, I2, I3, E1, E2, and E3 as shown to measure the circuitcurrents and voltages.
4. Make sure that the data acquisition module is connected to a USB port of thecomputer.
Connect the POWER INPUT of the data acquisition module to the24 V - AC output of the Power Supply. Set the 24 V - AC power switch tothe I (ON) position.
5. Start the Data Acquisition software (LVDAC or LVDAM). Open setupconfiguration file ES15-4.dai.
a If you are using LVSIM-EMS in LVVL, you must use the IMPORT option in theFile menu to open the configuration file.
a The metering setup configuration can be changed during the exercise ifdesired. This exercise was written using those given.
Make sure that the continuous refresh mode is selected.
PROCEDURE
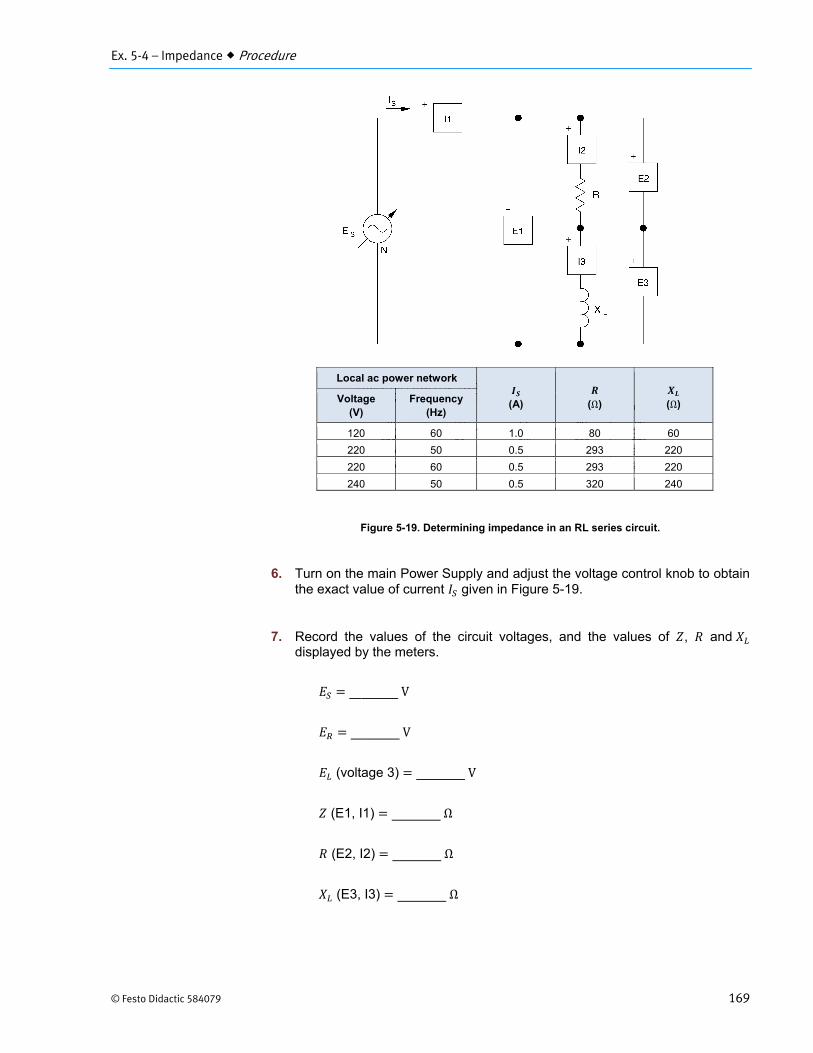
Ex. 5-4 – Impedance Procedure
© Festo Didactic 584079 169
Figure 5-19. Determining impedance in an RL series circuit.
6. Turn on the main Power Supply and adjust the voltage control knob to obtainthe exact value of current given in Figure 5-19.
7. Record the values of the circuit voltages, and the values of , and displayed by the meters.
V
V
(voltage 3) V
(E1, I1) Ω
(E2, I2) Ω
(E3, I3) Ω
Local ac power network
(A)
(Ω)
(Ω) Voltage(V)
Frequency(Hz)
120 60 1.0 80 60
220 50 0.5 293 220
220 60 0.5 293 220
240 50 0.5 320 240
Ex. 5-4 – Impedance Procedure
170 © Festo Didactic 584079
8. Calculate and using the circuit values given in Figure 5-19.
Ω
arctan °
9. Use Ohm's law, the value of calculated in the previous step, and the valuesof , , and given in Figure 5-19 to calculate the circuit voltages (
), , and ).
V
V
V
10. Compare the calculated and measured values of and those for the differentvoltages. Are they approximately the same?
a The actual results should slightly differ from the calculated values since theinductor coil resistance is not negligible.
Yes No
11. Are the measured values of and approximately the same as the valuesset on the load modules?
Yes No
12. Use the Phasor Analyzer to observe the phase shift between the sourcevoltage and the source current . Is the magnitude of the measuredphase shift approximately equal to the calculated value?
a The actual results should slightly differ from the calculated values since theinductor coil resistance is not negligible.
Yes No
13. Turn off the Power Supply and replace the inductive reactance in the circuitof Figure 5-19 with a capacitive reactance. Set the value of equal to thevalue used for , and set the value of equal to that of . Turn on thePower Supply and adjust the voltage control knob to obtain the same valueof current used in step 6.
Ex. 5-4 – Impedance Procedure
© Festo Didactic 584079 171
14. Record the values displayed by the meters.
a The minus sign on meter X (E3,I3) indicates that a capacitive reactance ismeasured. Neglect the minus sign when recording the value of .
V
V
(voltage 3) V
(E1, I1) Ω
(E2, I2) Ω
(E3, I3) Ω
15. Calculate Z and φ using the circuit values set in step 13.
Ω
arctan °
16. Once again, use Ohm's law, the value of calculated in the previous step,and the values of , , and used in step 13 to calculate the circuitvoltages.
V
V
V
17. Compare the calculated and measured values of and those for the differentvoltages. Are they approximately the same?
Yes No
18. Are the measured values of and approximately the same as the valuesset on the load modules?
Yes No
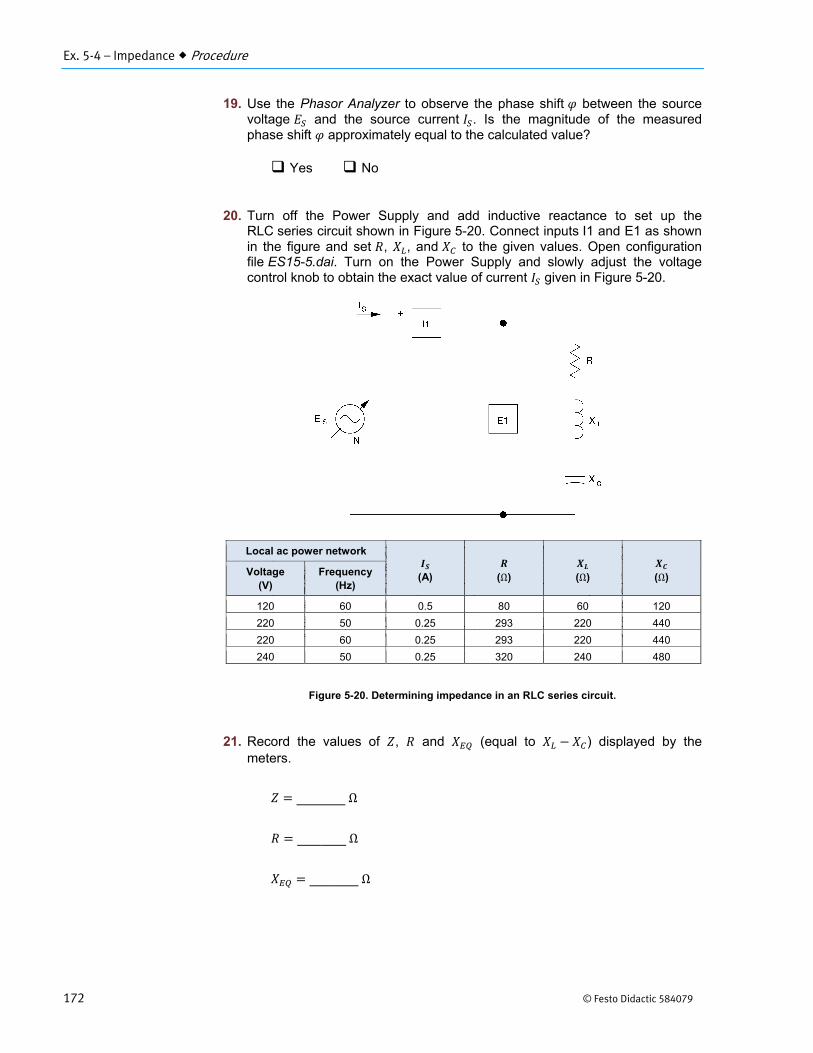
Ex. 5-4 – Impedance Procedure
172 © Festo Didactic 584079
19. Use the Phasor Analyzer to observe the phase shift between the sourcevoltage and the source current . Is the magnitude of the measuredphase shift approximately equal to the calculated value?
Yes No
20. Turn off the Power Supply and add inductive reactance to set up theRLC series circuit shown in Figure 5-20. Connect inputs I1 and E1 as shownin the figure and set , , and to the given values. Open configurationfile ES15-5.dai. Turn on the Power Supply and slowly adjust the voltagecontrol knob to obtain the exact value of current given in Figure 5-20.
Figure 5-20. Determining impedance in an RLC series circuit.
21. Record the values of , and (equal to ) displayed by themeters.
Ω
Ω
Ω
Local ac power network
(A)
(Ω)
(Ω)
(Ω) Voltage (V)
Frequency(Hz)
120 60 0.5 80 60 120
220 50 0.25 293 220 440
220 60 0.25 293 220 440
240 50 0.25 320 240 480
Ex. 5-4 – Impedance Procedure
© Festo Didactic 584079 173
22. Calculate and using the circuit values given in Figure 5-20.
Ω
arctan °
23. Compare the calculated and measured values of . Are they approximatelythe same?
Yes No
24. Are the measured values of and approximately the same as those setin the circuit?
Yes No
25. Use the Phasor Analyzer to observe the phase shift between the sourcevoltage and the source current . Is the magnitude of the measuredphase shift approximately equal to the calculated value?
a The actual results should slightly differ from the calculated values since theinductor coil resistance is not negligible.
Yes No
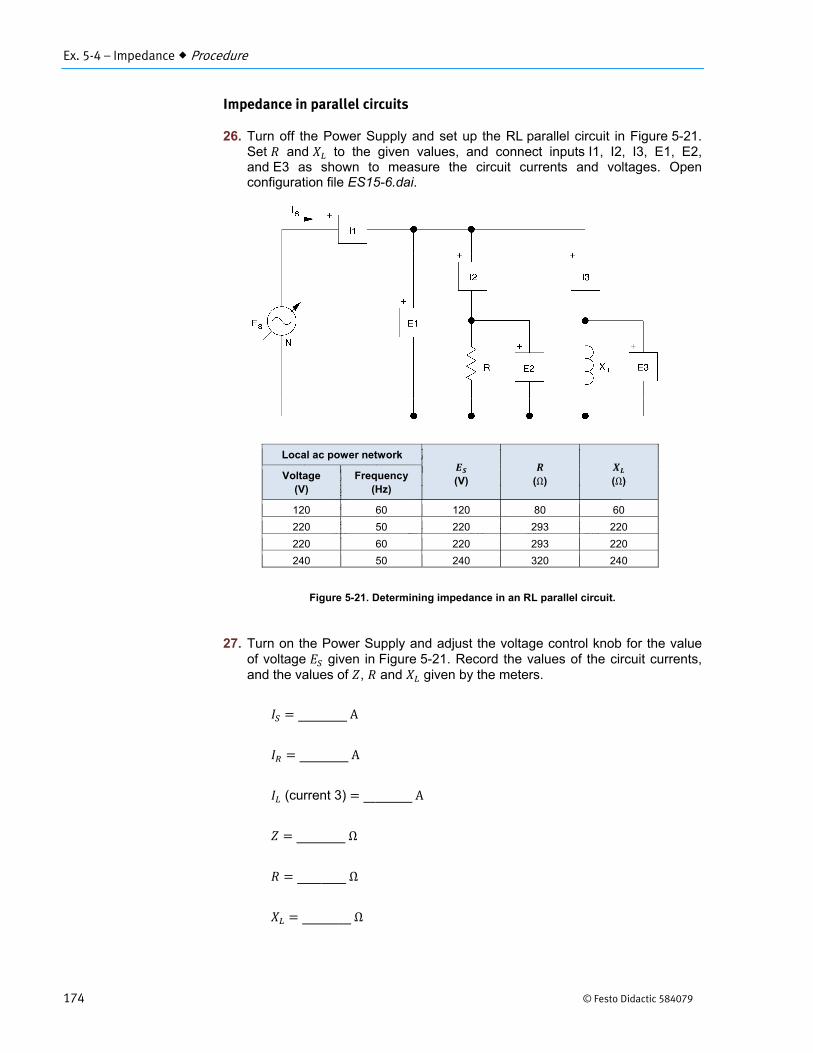
Ex. 5-4 – Impedance Procedure
174 © Festo Didactic 584079
Impedance in parallel circuits
26. Turn off the Power Supply and set up the RL parallel circuit in Figure 5-21.Set and to the given values, and connect inputs I1, I2, I3, E1, E2,and E3 as shown to measure the circuit currents and voltages. Openconfiguration file ES15-6.dai.
Figure 5-21. Determining impedance in an RL parallel circuit.
27. Turn on the Power Supply and adjust the voltage control knob for the valueof voltage given in Figure 5-21. Record the values of the circuit currents,and the values of , and given by the meters.
A
A
(current 3) A
Ω
Ω
Ω
Local ac power network
(V)
(Ω)
(Ω) Voltage (V)
Frequency(Hz)
120 60 120 80 60
220 50 220 293 220
220 60 220 293 220
240 50 240 320 240
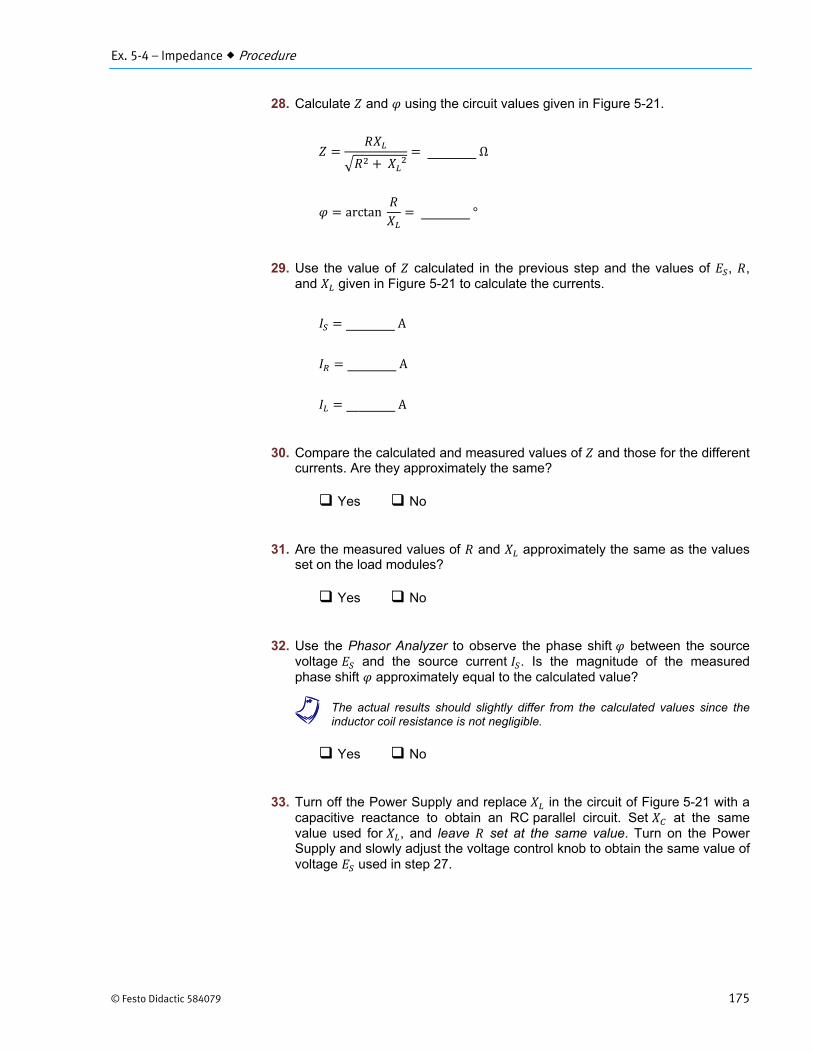
Ex. 5-4 – Impedance Procedure
© Festo Didactic 584079 175
28. Calculate and using the circuit values given in Figure 5-21.
Ω
arctan °
29. Use the value of calculated in the previous step and the values of , ,and given in Figure 5-21 to calculate the currents.
A
A
A
30. Compare the calculated and measured values of and those for the differentcurrents. Are they approximately the same?
Yes No
31. Are the measured values of and approximately the same as the valuesset on the load modules?
Yes No
32. Use the Phasor Analyzer to observe the phase shift between the sourcevoltage and the source current . Is the magnitude of the measuredphase shift approximately equal to the calculated value?
a The actual results should slightly differ from the calculated values since theinductor coil resistance is not negligible.
Yes No
33. Turn off the Power Supply and replace in the circuit of Figure 5-21 with acapacitive reactance to obtain an RC parallel circuit. Set at the samevalue used for , and leave set at the same value. Turn on the PowerSupply and slowly adjust the voltage control knob to obtain the same value ofvoltage used in step 27.
Ex. 5-4 – Impedance Procedure
176 © Festo Didactic 584079
34. Record the values indicated by the meters.
a A minus sign indicates that a capacitive reactance is measured. Neglect theminus sign when recording the value of .
A
A
(current 3) A
Ω
Ω
Ω
35. Calculate and using the circuit values set in step 33.
Ω
arctan °
36. Use Ohm's law, the value of calculated in the previous step, and the valuesof , , and set in step 33 to calculate the circuit currents.
A
A
A
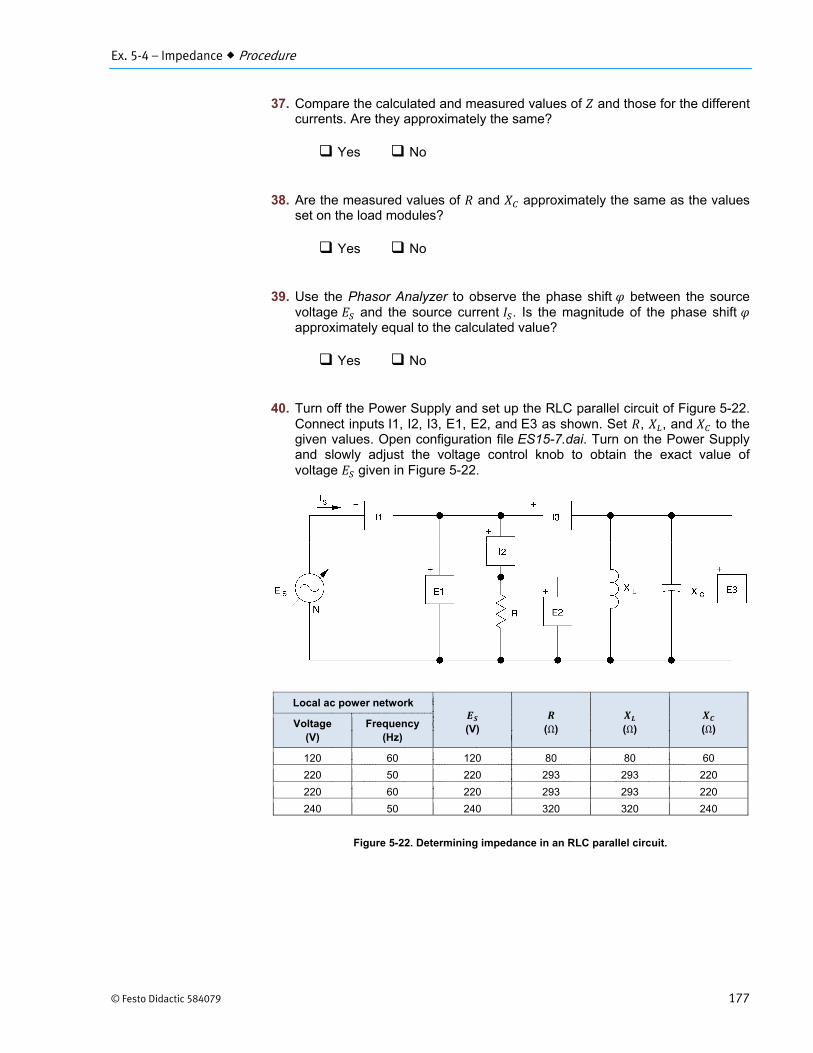
Ex. 5-4 – Impedance Procedure
© Festo Didactic 584079 177
37. Compare the calculated and measured values of and those for the differentcurrents. Are they approximately the same?
Yes No
38. Are the measured values of and approximately the same as the valuesset on the load modules?
Yes No
39. Use the Phasor Analyzer to observe the phase shift between the sourcevoltage and the source current . Is the magnitude of the phase shift approximately equal to the calculated value?
Yes No
40. Turn off the Power Supply and set up the RLC parallel circuit of Figure 5-22.Connect inputs I1, I2, I3, E1, E2, and E3 as shown. Set , , and to thegiven values. Open configuration file ES15-7.dai. Turn on the Power Supplyand slowly adjust the voltage control knob to obtain the exact value ofvoltage given in Figure 5-22.
Figure 5-22. Determining impedance in an RLC parallel circuit.
Local ac power network
(V)
(Ω)
(Ω)
(Ω) Voltage(V)
Frequency(Hz)
120 60 120 80 80 60
220 50 220 293 293 220
220 60 220 293 293 220
240 50 240 320 320 240
Ex. 5-4 – Impedance Procedure
178 © Festo Didactic 584079
41. Record the values of , , and [equal to ⁄ ] displayedby the meters.
Ω
Ω
Ω
42. Calculate , , and using the circuit values given in Figure 5-22.
a Neglect the minus sign of when calculating the impedance and thephase shift .
Ω
Ω
arctan °

Ex. 5-4 – Impedance Procedure
© Festo Didactic 584079 179
43. Compare the calculated and measured values of . Are they approximatelythe same?
a The actual results should slightly differ from the calculated values since theinductor coil resistance is not negligible.
Yes No
44. Are the measured values of and approximately the same as those setin the circuit?
a The actual results should slightly differ from the calculated values since theinductor coil resistance is not negligible.
Yes No
45. Use the Phasor Analyzer to observe the phase shift between the sourcevoltage and the source current . Is the magnitude of the measuredphase shift approximately equal to the calculated value?
Yes No
46. Ensure that the Power Supply is turned off, and that the voltage control knobis turned fully counterclockwise. Remove all leads and cables.
Ex. 5-4 – Impedance Conclusion
180 © Festo Didactic 584079
In this exercise, you calculated the impedance in series and parallel circuits and compared your results with those obtained using measurements of the current and voltage. You demonstrated that impedance is the quotient of source voltage to current, and that the combined reactance in RLC circuits is either inductive or capacitive, depending on the relative values of and . Finally, observation of the voltage and current phasors with the Phasor Analyzer allowed you to verify your calculations of the impedance phase shift.
1. The total opposition to current flow in an ac circuit is called
a. resistance.b. reactance.c. impedance.d. inductance.
2. Circuit impedance can be determined from
a. ⁄b.c.d. ⁄
3. What is the impedance of an RLC parallel circuit when , , and are allequal, equals 120 V, and is 2 A?
a. 60 Ωb. 240 Ωc. 20 Ωd. 180 Ω
4. The combined reactance in a series ac circuit results in the impedancehaving a positive phase shift. Does the circuit current lead or lag the sourcevoltage?
a. The current leads the voltage because the reactance iscapacitive.
b. The current lags the voltage because the reactance isinductive.
c. The current leads the voltage because the reactance isinductive.
d. The current lags the voltage because the reactance iscapacitive.
5. The impedance of an RLC parallel circuit can be determined from
a. the quotient of source voltage to circuit current.b. the product of source voltage with circuit current.
c. the formula
.
d. Both a and c.
CONCLUSION
REVIEW QUESTIONS

Unit 5 – Power, Phasors, and Impedance in AC Circuits Unit Test
© Festo Didactic 584079 181
Unit Test
1. A motor whose power factor is 0.8 draws 4 kW of active power. What is theapparent power supplied to the motor?
a. cos 0.80⁄ , therefore 5kVAb. cos 0.80⁄ , therefore 3.2kVAc. cos 0.80, therefore 7.2kVAd. cos 0.8⁄ , therefore 8.8kVA
2. Apparent power is related to active and reactive power by the formula
a.b.
c.
d.
3. A capacitor drawing 8 kvar is placed in parallel with an electromagnet thatdraws 6 kW of active power and 6 kvar of reactive power. What effect doesthis have on cos ?
a. The power factor is corrected to unity.b. The power factor goes from 0.5 to 0.67.c. The power factor changes polarity from positive to negative.d. None of the above.
4. In an RLC series circuit, what is the phase shift between the voltage andcurrent when , , and are all equal to 100 Ω?
a. 45°b. 37°c. 0°d. 30°
5. The parameter used as reference for vector analysis is
a. voltage in series circuits, and current in parallel circuits.b. current in series circuits, and voltage in parallel circuits.c. reactance in both series and parallel circuits.d. always the voltage.
6. The phase shift between and in an RL series circuit can be determined
a. from the ratio .⁄b. from the ratio .⁄c. from the ratio .⁄d. none of the above.

Unit 5 – Power, Phasors, and Impedance in AC Circuits Unit Test
182 © Festo Didactic 584079
7. In an RC parallel circuit, what is the phase shift between the voltage andcurrent when and are 60 Ω and 100 Ω, respectively?
a. 53°b. 31°c. 59°d. 37°
8. Impedance is the total opposition to current in a circuit and is made up of
a. resistance and reactance.b. reactance only.c. capacitance only.d. inductance only.
9. What is the impedance of an RLC series circuit when , , and are allequal, equals 120 V, and is 2 A?
a. 60 Ωb. 240 Ωc. 20 Ωd. 180 Ω
10. The impedance in a parallel ac circuit has a positive phase shift. Does thesource current lead or lag the source voltage?
a. The current leads the voltage because the reactance is capacitive.b. The current lags the voltage because the reactance is inductive.c. The current leads the voltage because the reactance is inductive.d. The current lags the voltage because the reactance is capacitive.
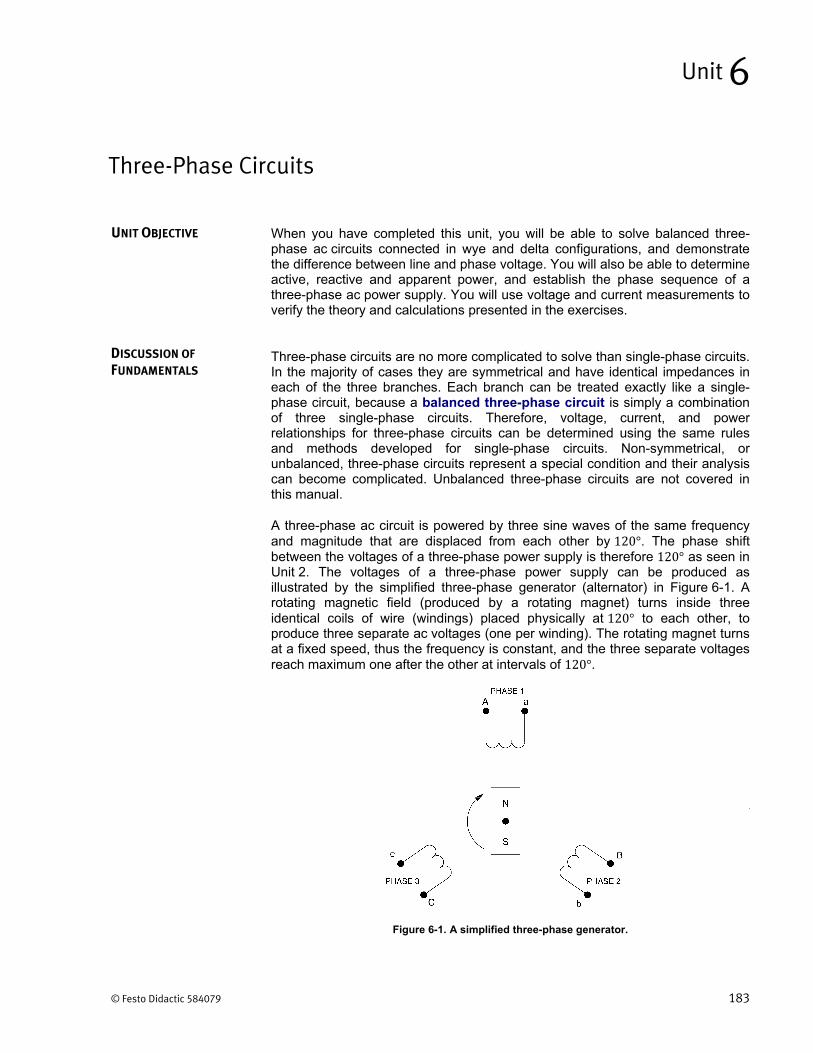
© Festo Didactic 584079 183
When you have completed this unit, you will be able to solve balanced three-phase ac circuits connected in wye and delta configurations, and demonstrate the difference between line and phase voltage. You will also be able to determine active, reactive and apparent power, and establish the phase sequence of a three-phase ac power supply. You will use voltage and current measurements to verify the theory and calculations presented in the exercises.
Three-phase circuits are no more complicated to solve than single-phase circuits. In the majority of cases they are symmetrical and have identical impedances in each of the three branches. Each branch can be treated exactly like a single-phase circuit, because a balanced three-phase circuit is simply a combination of three single-phase circuits. Therefore, voltage, current, and power relationships for three-phase circuits can be determined using the same rules and methods developed for single-phase circuits. Non-symmetrical, or unbalanced, three-phase circuits represent a special condition and their analysis can become complicated. Unbalanced three-phase circuits are not covered in this manual.
A three-phase ac circuit is powered by three sine waves of the same frequency and magnitude that are displaced from each other by 120°. The phase shift between the voltages of a three-phase power supply is therefore 120° as seen in Unit 2. The voltages of a three-phase power supply can be produced as illustrated by the simplified three-phase generator (alternator) in Figure 6-1. A rotating magnetic field (produced by a rotating magnet) turns inside three identical coils of wire (windings) placed physically at 120° to each other, to produce three separate ac voltages (one per winding). The rotating magnet turns at a fixed speed, thus the frequency is constant, and the three separate voltages reach maximum one after the other at intervals of 120°.
Figure 6-1. A simplified three-phase generator.
Three-Phase Circuits
Unit 6
UNIT OBJECTIVE
DISCUSSION OF
FUNDAMENTALS
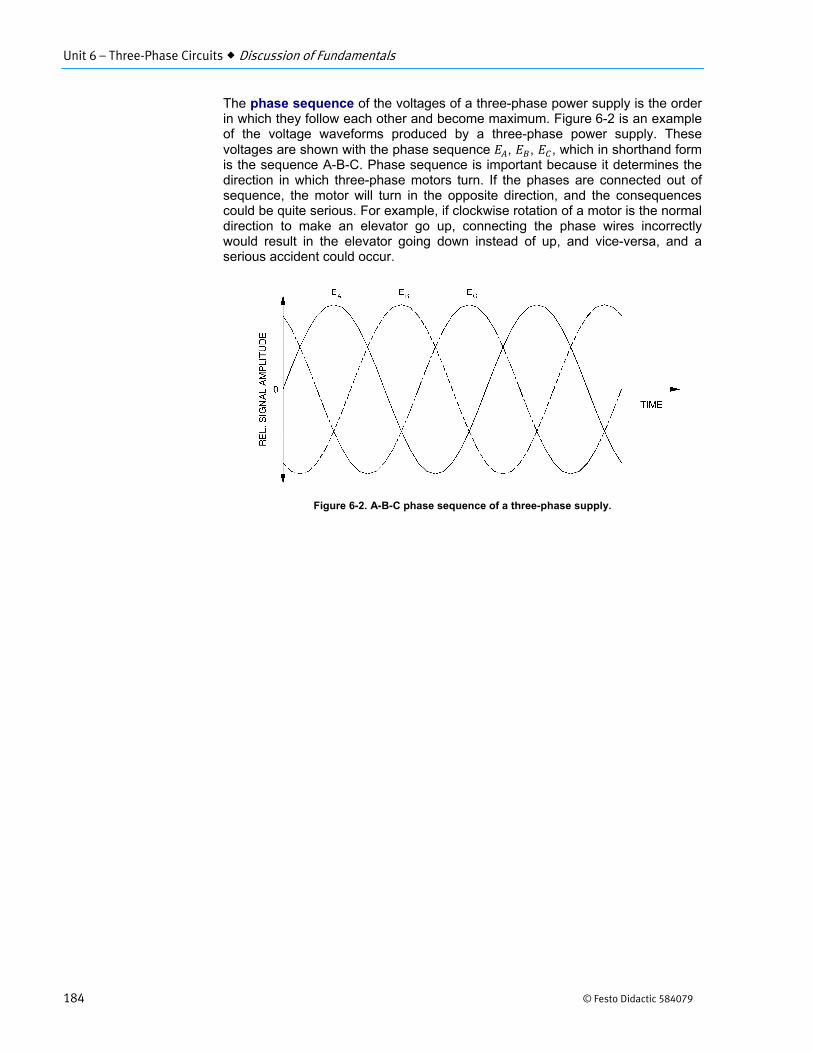
Unit 6 – Three-Phase Circuits Discussion of Fundamentals
184 © Festo Didactic 584079
The phase sequence of the voltages of a three-phase power supply is the order in which they follow each other and become maximum. Figure 6-2 is an example of the voltage waveforms produced by a three-phase power supply. These voltages are shown with the phase sequence , , , which in shorthand form is the sequence A-B-C. Phase sequence is important because it determines the direction in which three-phase motors turn. If the phases are connected out of sequence, the motor will turn in the opposite direction, and the consequences could be quite serious. For example, if clockwise rotation of a motor is the normal direction to make an elevator go up, connecting the phase wires incorrectly would result in the elevator going down instead of up, and vice-versa, and a serious accident could occur.
Figure 6-2. A-B-C phase sequence of a three-phase supply.
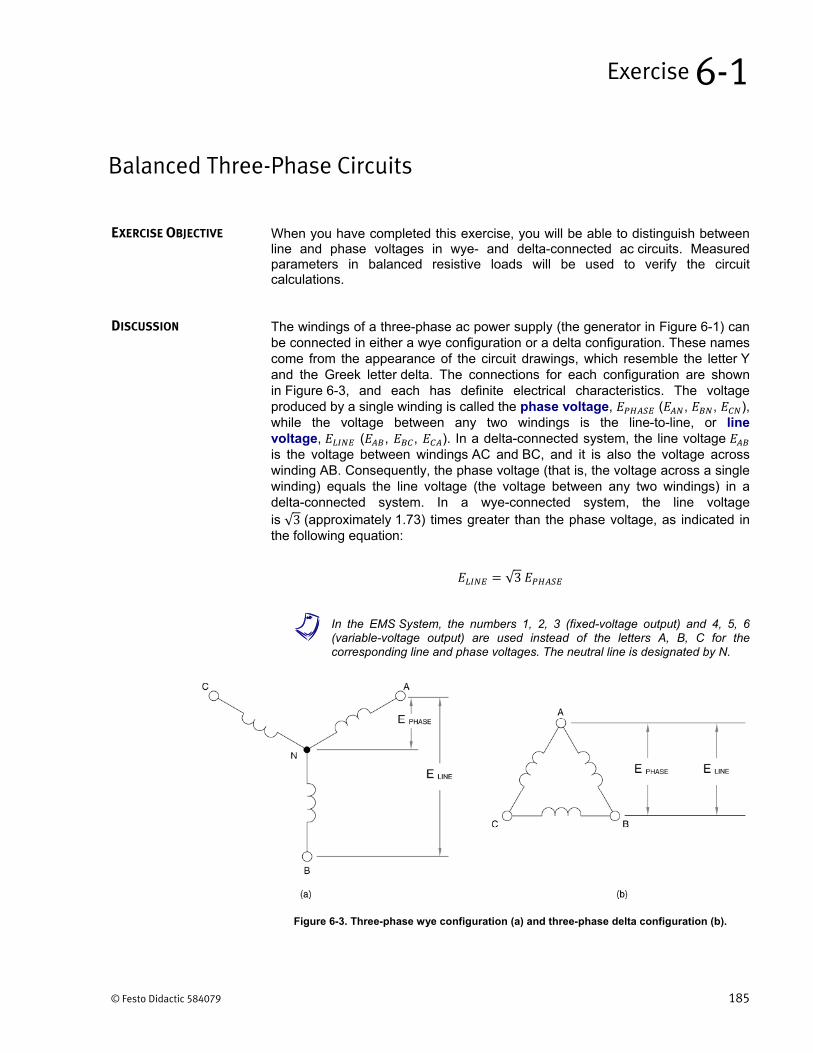
© Festo Didactic 584079 185
When you have completed this exercise, you will be able to distinguish between line and phase voltages in wye- and delta-connected ac circuits. Measured parameters in balanced resistive loads will be used to verify the circuit calculations.
The windings of a three-phase ac power supply (the generator in Figure 6-1) can be connected in either a wye configuration or a delta configuration. These names come from the appearance of the circuit drawings, which resemble the letter Y and the Greek letter delta. The connections for each configuration are shown in Figure 6-3, and each has definite electrical characteristics. The voltage produced by a single winding is called the phase voltage, ( , , ), while the voltage between any two windings is the line-to-line, or line voltage, ( , , ). In a delta-connected system, the line voltage is the voltage between windings AC and BC, and it is also the voltage across winding AB. Consequently, the phase voltage (that is, the voltage across a single winding) equals the line voltage (the voltage between any two windings) in a delta-connected system. In a wye-connected system, the line voltage is √3 (approximately 1.73) times greater than the phase voltage, as indicated in the following equation:
√3
a In the EMS System, the numbers 1, 2, 3 (fixed-voltage output) and 4, 5, 6 (variable-voltage output) are used instead of the letters A, B, C for the corresponding line and phase voltages. The neutral line is designated by N.
Figure 6-3. Three-phase wye configuration (a) and three-phase delta configuration (b).
Balanced Three-Phase Circuits
Exercise 6-1
EXERCISE OBJECTIVE
DISCUSSION
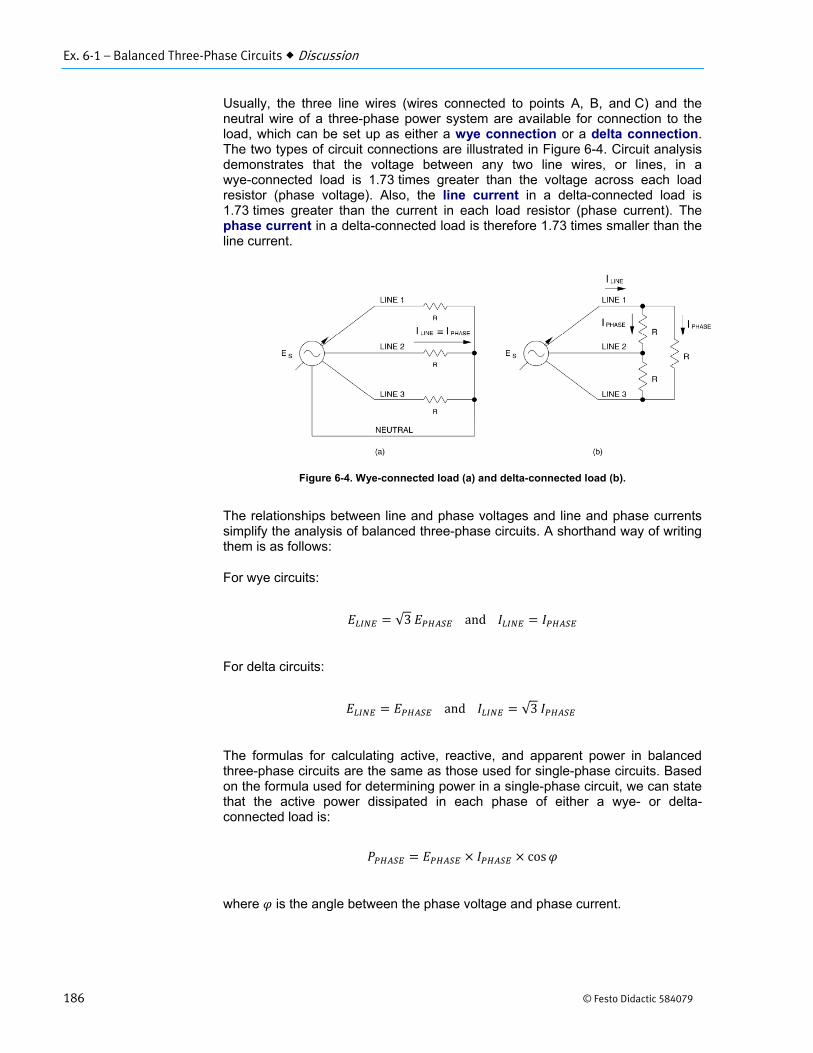
Ex. 6-1 – Balanced Three-Phase Circuits Discussion
186 © Festo Didactic 584079
Usually, the three line wires (wires connected to points A, B, and C) and the neutral wire of a three-phase power system are available for connection to the load, which can be set up as either a wye connection or a delta connection. The two types of circuit connections are illustrated in Figure 6-4. Circuit analysis demonstrates that the voltage between any two line wires, or lines, in a wye-connected load is 1.73 times greater than the voltage across each load resistor (phase voltage). Also, the line current in a delta-connected load is 1.73 times greater than the current in each load resistor (phase current). The phase current in a delta-connected load is therefore 1.73 times smaller than the line current.
Figure 6-4. Wye-connected load (a) and delta-connected load (b).
The relationships between line and phase voltages and line and phase currents simplify the analysis of balanced three-phase circuits. A shorthand way of writing them is as follows:
For wye circuits:
√3 and
For delta circuits:
and √3
The formulas for calculating active, reactive, and apparent power in balanced three-phase circuits are the same as those used for single-phase circuits. Based on the formula used for determining power in a single-phase circuit, we can state that the active power dissipated in each phase of either a wye- or delta-connected load is:
cos
where is the angle between the phase voltage and phase current.
Ex. 6-1 – Balanced Three-Phase Circuits Procedure
© Festo Didactic 584079 187
The total active power supplied to the load is therefore:
3 3 cos
For a resistive load, cos equals 1. Therefore,
3
EQUIPMENT REQUIRED
Refer to the Equipment Utilization Chart in Appendix C to obtain the list of equipment required for this exercise.
High voltages are present in this laboratory exercise. Do not make or modify any banana jack connections with the power on unless otherwise specified.
1. Install the Power Supply, data acquisition module, and Resistive Loadmodules in the EMS Workstation.
2. Make sure that the main switch of the Power Supply is set to the O (OFF)position, and the voltage control knob is turned fully counterclockwise. Makesure that the Power Supply is connected to a three-phase wall receptacle.
3. Make sure that the data acquisition module is connected to a USB port of thecomputer.
Connect the POWER INPUT of the data acquisition module to the24 V - AC output of the Power Supply. Set the 24 V - AC power switch tothe I (ON) position.
4. Start the Data Acquisition software (LVDAC or LVDAM). Open setupconfiguration file ES16-1.dai.
a If you are using LVSIM-EMS in LVVL, you must use the IMPORT option in theFile menu to open the configuration file.
a The metering setup configuration can be changed during the exercise ifdesired. This exercise was written using those given.
Make sure that the continuous refresh mode is selected.
PROCEDURE
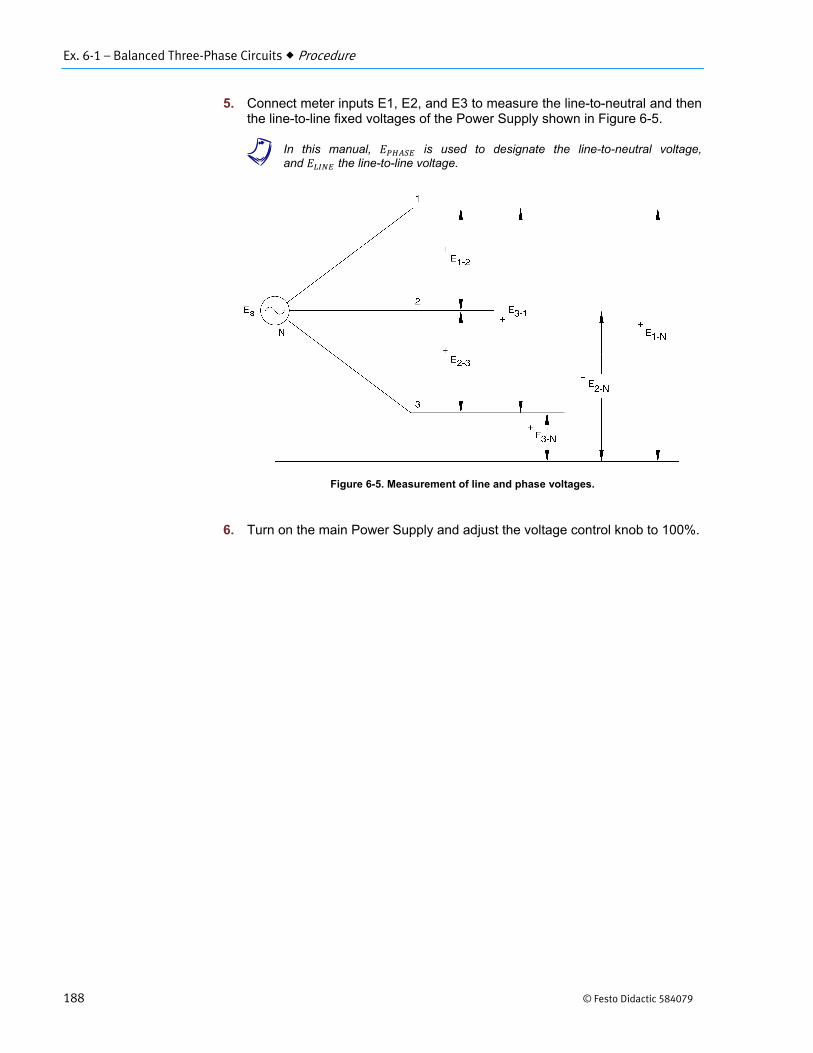
Ex. 6-1 – Balanced Three-Phase Circuits Procedure
188 © Festo Didactic 584079
5. Connect meter inputs E1, E2, and E3 to measure the line-to-neutral and thenthe line-to-line fixed voltages of the Power Supply shown in Figure 6-5.
a In this manual, is used to designate the line-to-neutral voltage,and the line-to-line voltage.
Figure 6-5. Measurement of line and phase voltages.
6. Turn on the main Power Supply and adjust the voltage control knob to 100%.

Ex. 6-1 – Balanced Three-Phase Circuits Procedure
© Festo Didactic 584079 189
7. Record the measured values, then turn off the Power Supply. Determine theaverage value of the phase and line voltages.
V
V
V
Average3
V
V
V
V
Average3
V
8. Calculate the ratio of the average line to phase voltage.
AverageAverage
9. Is the ratio approximately equal to 1.73 (√3)?
Yes No
10. Connect meter inputs E1, E2, and E3 to measure the line-to-neutral andline-to-line variable voltages of the Power Supply, , , ,and , , .
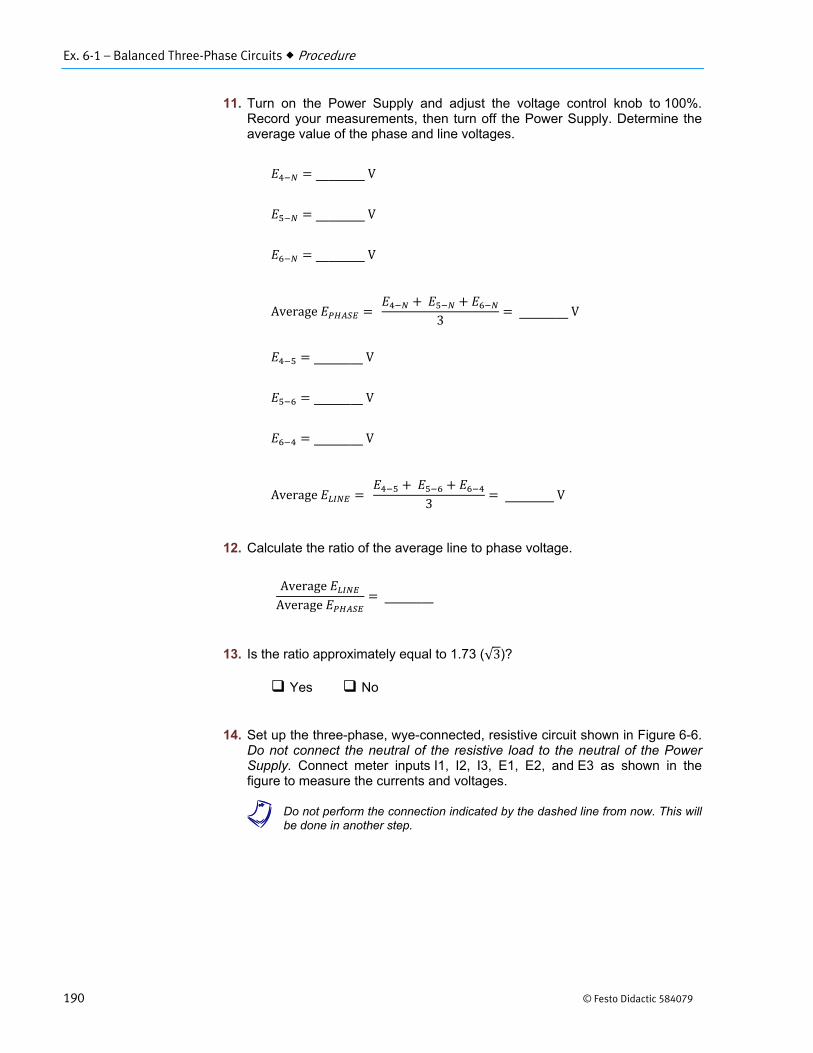
Ex. 6-1 – Balanced Three-Phase Circuits Procedure
190 © Festo Didactic 584079
11. Turn on the Power Supply and adjust the voltage control knob to 100%.Record your measurements, then turn off the Power Supply. Determine theaverage value of the phase and line voltages.
V
V
V
Average3
V
V
V
V
Average3
V
12. Calculate the ratio of the average line to phase voltage.
AverageAverage
13. Is the ratio approximately equal to 1.73 (√3)?
Yes No
14. Set up the three-phase, wye-connected, resistive circuit shown in Figure 6-6.Do not connect the neutral of the resistive load to the neutral of the PowerSupply. Connect meter inputs I1, I2, I3, E1, E2, and E3 as shown in thefigure to measure the currents and voltages.
a Do not perform the connection indicated by the dashed line from now. This willbe done in another step.
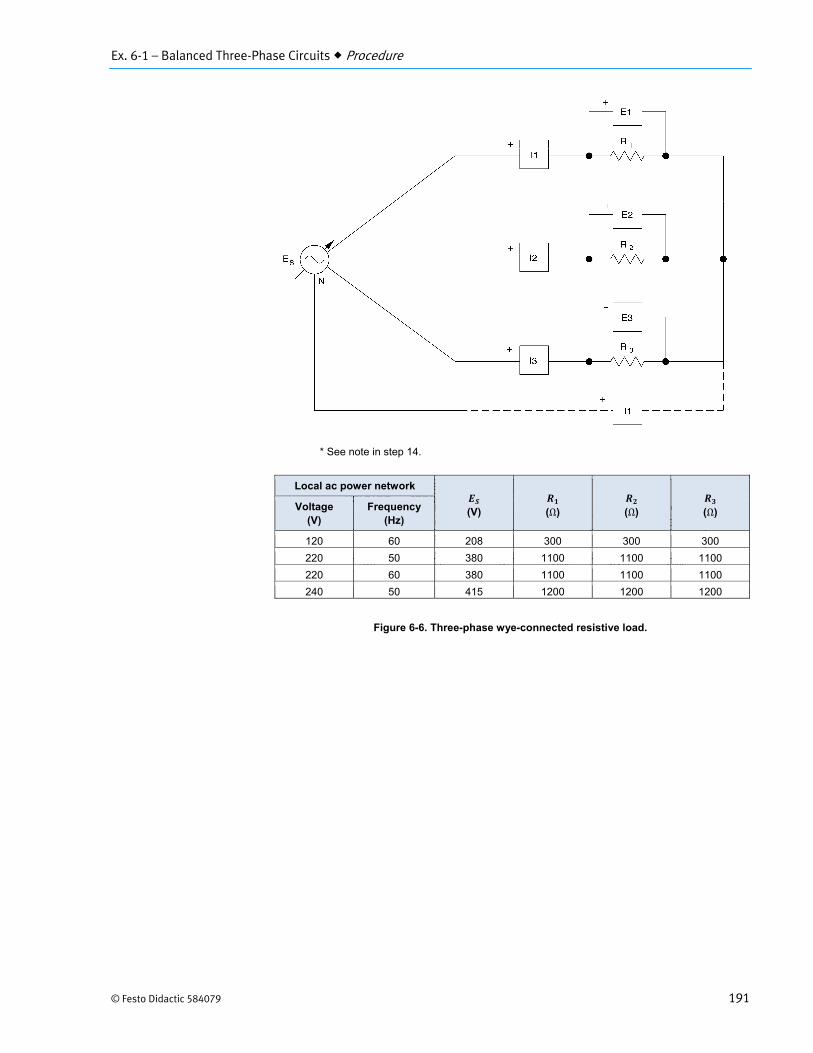
Ex. 6-1 – Balanced Three-Phase Circuits Procedure
© Festo Didactic 584079 191
Figure 6-6. Three-phase wye-connected resistive load.
Local ac power network
(V)
(Ω)
(Ω)
(Ω) Voltage(V)
Frequency(Hz)
120 60 208 300 300 300
220 50 380 1100 1100 1100
220 60 380 1100 1100 1100
240 50 415 1200 1200 1200
* See note in step 14.
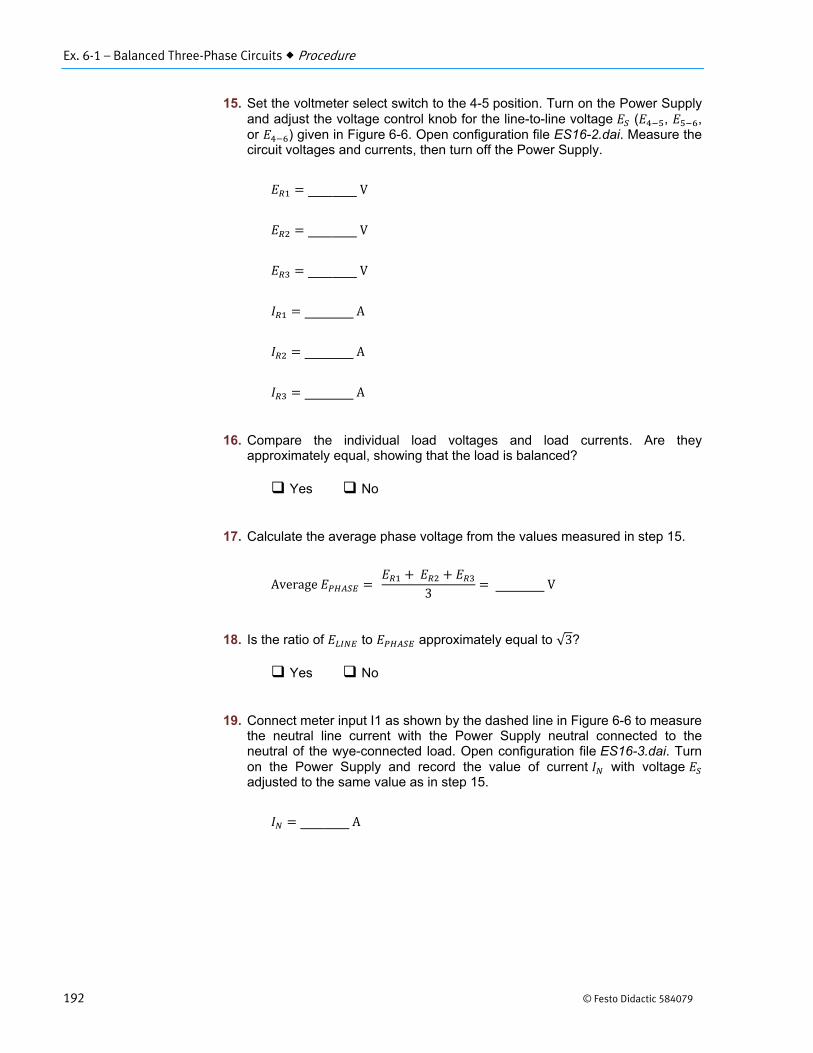
Ex. 6-1 – Balanced Three-Phase Circuits Procedure
192 © Festo Didactic 584079
15. Set the voltmeter select switch to the 4-5 position. Turn on the Power Supplyand adjust the voltage control knob for the line-to-line voltage ( , ,or ) given in Figure 6-6. Open configuration file ES16-2.dai. Measure thecircuit voltages and currents, then turn off the Power Supply.
V
V
V
A
A
A
16. Compare the individual load voltages and load currents. Are theyapproximately equal, showing that the load is balanced?
Yes No
17. Calculate the average phase voltage from the values measured in step 15.
Average3
V
18. Is the ratio of to approximately equal to √3?
Yes No
19. Connect meter input I1 as shown by the dashed line in Figure 6-6 to measurethe neutral line current with the Power Supply neutral connected to theneutral of the wye-connected load. Open configuration file ES16-3.dai. Turnon the Power Supply and record the value of current with voltage adjusted to the same value as in step 15.
A

Ex. 6-1 – Balanced Three-Phase Circuits Procedure
© Festo Didactic 584079 193
20. Is the neutral current equal to zero?
Yes No
21. Using the results of step 15, calculate the active power consumed in eachphase of the circuit, and the total power consumed by the load.
W
W
W
W
22. Determine the phase current using the values measured in step 15.
A
Calculate using the phase voltage and current, and compare it with the result obtained in step 21. Are both values approximately the same?
3 W
Yes No
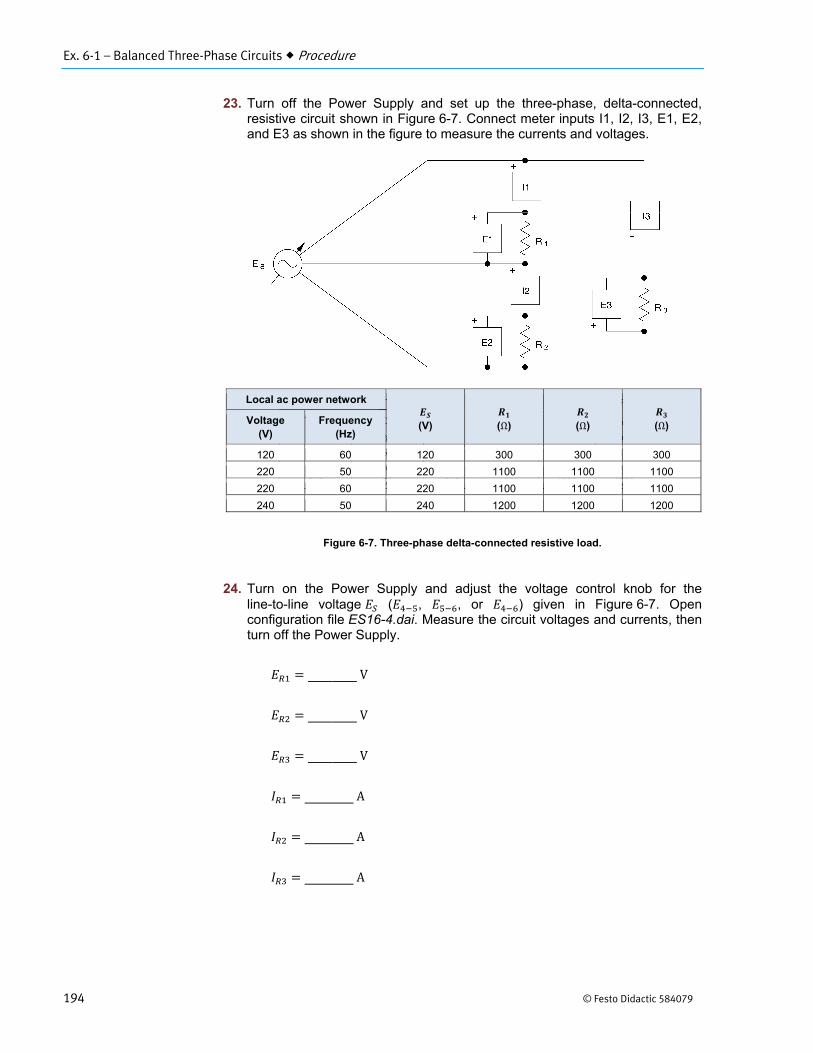
Ex. 6-1 – Balanced Three-Phase Circuits Procedure
194 © Festo Didactic 584079
23. Turn off the Power Supply and set up the three-phase, delta-connected,resistive circuit shown in Figure 6-7. Connect meter inputs I1, I2, I3, E1, E2,and E3 as shown in the figure to measure the currents and voltages.
Figure 6-7. Three-phase delta-connected resistive load.
24. Turn on the Power Supply and adjust the voltage control knob for theline-to-line voltage ( , , or ) given in Figure 6-7. Openconfiguration file ES16-4.dai. Measure the circuit voltages and currents, thenturn off the Power Supply.
V
V
V
A
A
A
Local ac power network
(V)
(Ω)
(Ω)
(Ω) Voltage (V)
Frequency(Hz)
120 60 120 300 300 300
220 50 220 1100 1100 1100
220 60 220 1100 1100 1100
240 50 240 1200 1200 1200
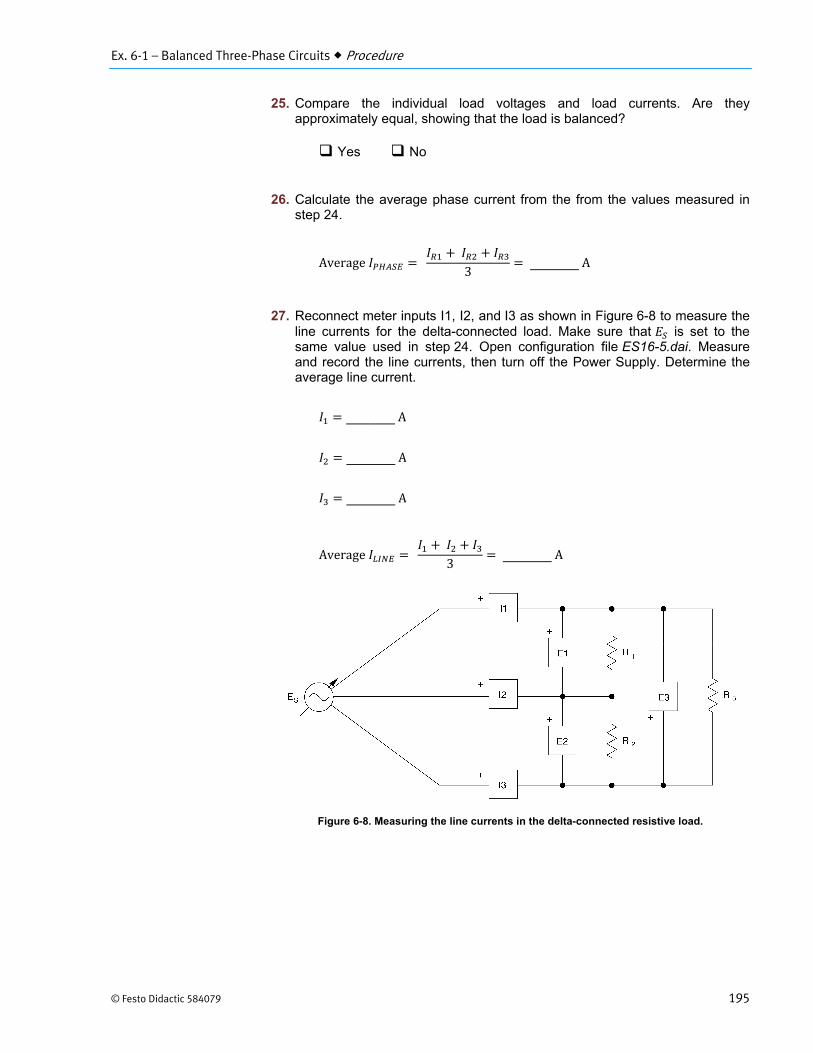
Ex. 6-1 – Balanced Three-Phase Circuits Procedure
© Festo Didactic 584079 195
25. Compare the individual load voltages and load currents. Are theyapproximately equal, showing that the load is balanced?
Yes No
26. Calculate the average phase current from the from the values measured instep 24.
Average3
A
27. Reconnect meter inputs I1, I2, and I3 as shown in Figure 6-8 to measure theline currents for the delta-connected load. Make sure that is set to thesame value used in step 24. Open configuration file ES16-5.dai. Measureand record the line currents, then turn off the Power Supply. Determine theaverage line current.
A
A
A
Average3
A
Figure 6-8. Measuring the line currents in the delta-connected resistive load.

Ex. 6-1 – Balanced Three-Phase Circuits Procedure
196 © Festo Didactic 584079
28. Calculate the ratio of the average line current to the average phase current.
AverageAverage
Is it approximately equal to √3?
Yes No
29. Using the results of step 24, calculate the active power consumed in eachphase of the circuit, and the total power consumed by the load.
W
W
W
W
30. Determine the phase voltage using the values measured in step 24.
V
Calculate using the phase voltage and current, and compare it with the result obtained in step 29. Are both values approximately the same?
3 W
Yes No
31. Ensure that the Power Supply is turned off, and that the voltage control knobis turned fully counterclockwise. Remove all leads and cables.
Ex. 6-1 – Balanced Three-Phase Circuits Conclusion
© Festo Didactic 584079 197
In this exercise, you measured the line and phase voltages and currents for balanced wye- and delta-connected resistive loads, and saw that the line and phase values were related by the factor √3. You saw that no current flows in the neutral wire of a balanced wye-connected load, and demonstrated that individual line voltages and currents are equal with balanced three-phase loads. Finally, you demonstrated that total power for a three-phase resistive load is three times the power supplied to one of the circuit branches.
1. In a balanced wye-connected circuit the
a. line voltages and currents equal the load values.b. line voltage is √3 times greater than the phase voltage.c. line voltage is √3 times smaller than the phase voltage.d. line current is √3 times greater than the phase current.
2. In a balanced delta-connected circuit the
a. line voltages and currents equal the load values.b. line current is √3 times smaller than the phase current.c. line current is √3 times greater than the phase current.d. line voltage is √3 times greater than the phase voltage.
3. What is the line-to-neutral (phase) voltage in a balanced wye-connectedcircuit when the line-to-line voltage is 346 V?
a. 346 Vb. 600 Vc. 200 Vd. 245 V
4. What is the line current in a balanced delta-connected resistive load whenthe load current through each branch is 10 A?
a. 27.3 Ab. 17.3 Ac. 11.6 Ad. 5.8 A
5. The line current in a balanced three-phase, wye-connected, resistive load is25 A. What will happen if the neutral wire is disconnected?
a. The power protection circuits will operate because of theimbalance.
b. Nothing, because there is no current in the neutral line.c. The line voltage will become unbalanced.d. The phase current will increase to dangerous levels.
CONCLUSION
REVIEW QUESTIONS

© Festo Didactic 584079 199
When you have completed this exercise, you will be able to calculate active, reactive, and apparent power in balanced, wye- or delta-connected, three-phase circuits. You will know how to use a power meter to measure power in single-phase circuits. You will also know how to measure power in three- and four-wire, three-phase circuits.
Calculating power in balanced three-phase circuits
As seen in the previous exercise, the total active power supplied to a balanced three-phase load (i.e., the total active power dissipated in a circuit) can be calculated using the following equation:
3 3 cos
In a wye-connected circuit, √3⁄ and the phase current is equal to the line current . The above equation then becomes:
3
√3cos
The 3 √3⁄ factor can be simplified to √3, so that the final equation for the total active power dissipated in the wye-connected circuit is
√3 cos
where is the total active power dissipated in the three-phase circuit, expressed in watts (W).
In a delta-connected circuit, the above equation is obtained because the phase voltage is equal to the line voltage , and √3⁄ . Therefore, in either a balanced wye-connected circuit or a balanced delta-connected circuit, the total active power dissipated in the three-phase circuit can be calculated using the equation above.
Three-Phase Power Measurement
Exercise 6-2
EXERCISE OBJECTIVE
DISCUSSION
Ex. 6-2 – Three-Phase Power Measurement Discussion
200 © Festo Didactic 584079
Since cos is the expression representing the active power dissipated in a single phase of a three-phase circuit, it follows that the expression represents the apparent power in a single phase. The total apparent power in a balanced, wye- or delta-connected, three-phase circuit can thus be calculated using the following equation:
3
where is the total apparent power in the three-phase circuit, expressed in volt-amperes (VA).
Following the same steps used to obtain the equation for calculating the total active power in three-phase circuits using the line voltage and the line current , the equation for the total apparent power in a three-phase circuit can be rewritten as follows:
√3
The power factor of a balanced three-phase circuit is the ratio of the total active power to the total apparent power (i.e., ⁄ ), and the relationship between ,
, and is the same as for single-phase ac circuits (i.e., ). Thus, the total reactive power in a three-phase circuit can be calculated using the following equation:
where is the total reactive power in the three-phase circuit, expressed in reactive volt-amperes (var).
Power measurements in single-phase circuits
Commercial instruments are available to measure active, reactive, and apparent power directly. These instruments are referred to as power meters. A selector on the power meter usually allows the unit to measure active, reactive, or apparent power. A power meter determines power by measuring the circuit voltage and current. All power meters thus generally have at least a voltage input and a current input to measure the circuit voltage and current. Figure 6-9a shows the typical connections of a power meter in a single-phase circuit and Figure 6-9b shows the equivalent connections required to measure power using the data acquisition module.
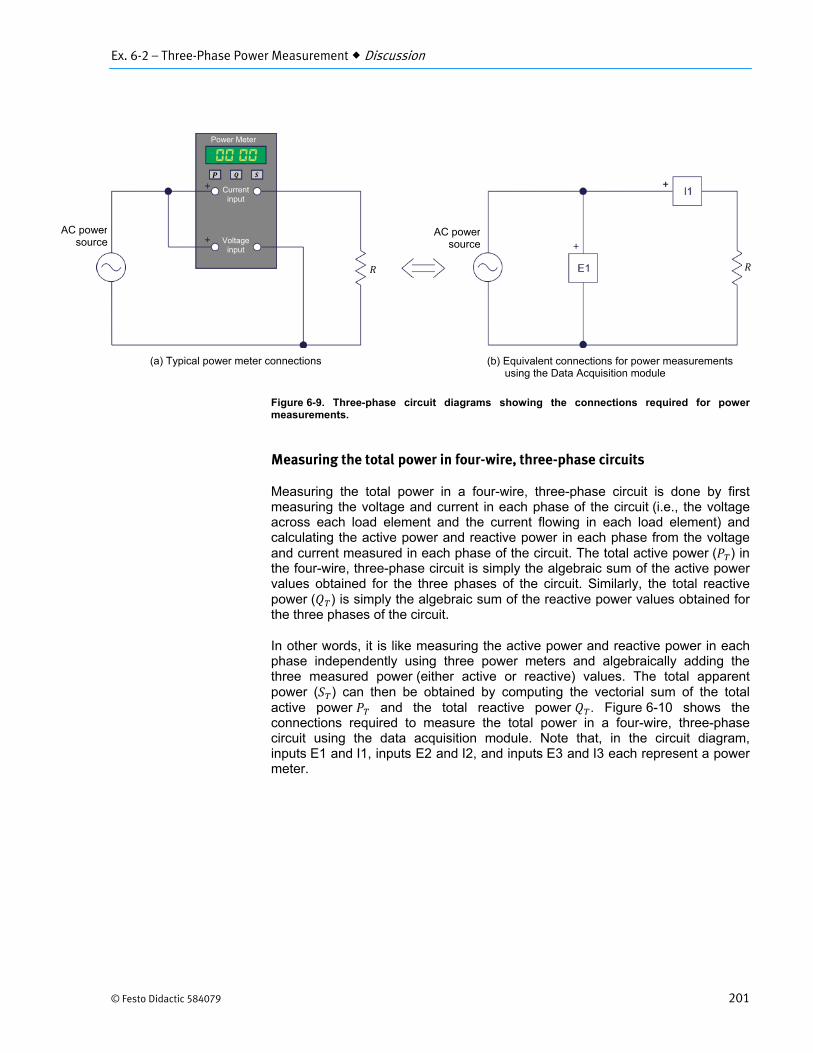
Ex. 6-2 – Three-Phase Power Measurement Discussion
© Festo Didactic 584079 201
Figure 6-9. Three-phase circuit diagrams showing the connections required for power measurements.
Measuring the total power in four-wire, three-phase circuits
Measuring the total power in a four-wire, three-phase circuit is done by first measuring the voltage and current in each phase of the circuit (i.e., the voltage across each load element and the current flowing in each load element) and calculating the active power and reactive power in each phase from the voltage and current measured in each phase of the circuit. The total active power ( ) in the four-wire, three-phase circuit is simply the algebraic sum of the active power values obtained for the three phases of the circuit. Similarly, the total reactive power ( ) is simply the algebraic sum of the reactive power values obtained for the three phases of the circuit.
In other words, it is like measuring the active power and reactive power in each phase independently using three power meters and algebraically adding the three measured power (either active or reactive) values. The total apparent power ( ) can then be obtained by computing the vectorial sum of the total active power and the total reactive power . Figure 6-10 shows the connections required to measure the total power in a four-wire, three-phase circuit using the data acquisition module. Note that, in the circuit diagram, inputs E1 and I1, inputs E2 and I2, and inputs E3 and I3 each represent a power meter.
(a) Typical power meter connections (b) Equivalent connections for power measurementsusing the Data Acquisition module
Power Meter
Voltage input
Current input
AC powersource
AC powersource
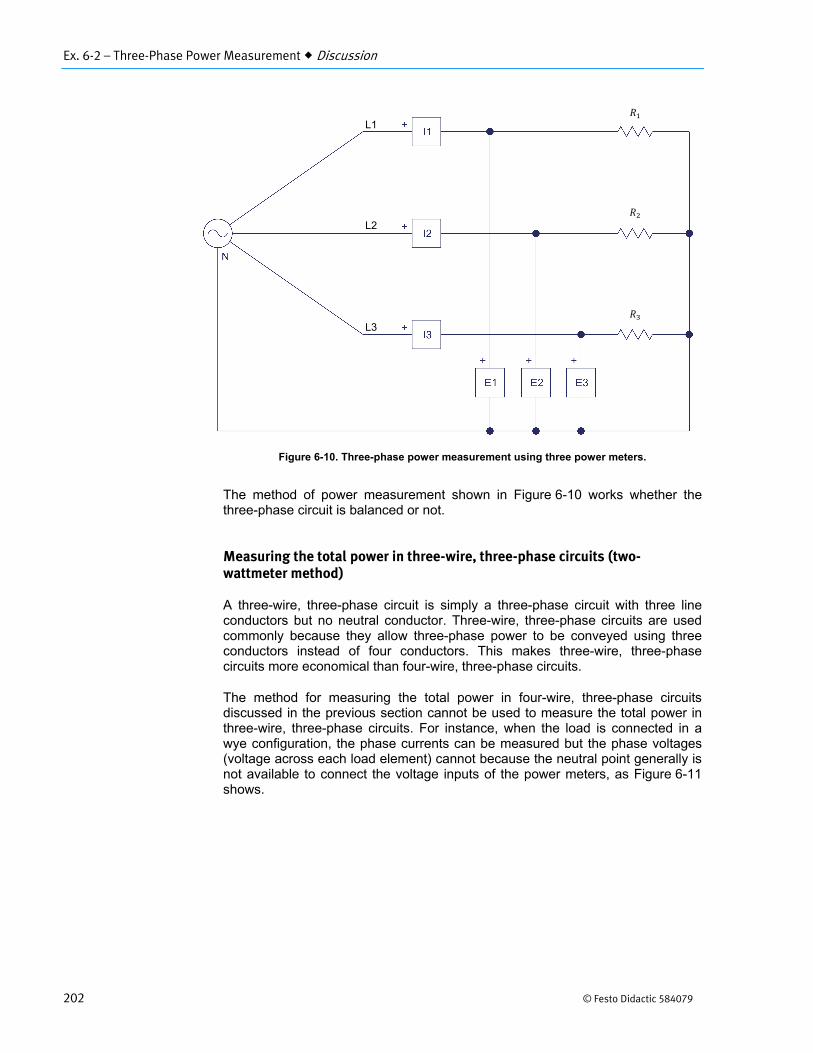
Ex. 6-2 – Three-Phase Power Measurement Discussion
202 © Festo Didactic 584079
Figure 6-10. Three-phase power measurement using three power meters.
The method of power measurement shown in Figure 6-10 works whether the three-phase circuit is balanced or not.
Measuring the total power in three-wire, three-phase circuits (two-wattmeter method)
A three-wire, three-phase circuit is simply a three-phase circuit with three line conductors but no neutral conductor. Three-wire, three-phase circuits are used commonly because they allow three-phase power to be conveyed using three conductors instead of four conductors. This makes three-wire, three-phase circuits more economical than four-wire, three-phase circuits.
The method for measuring the total power in four-wire, three-phase circuits discussed in the previous section cannot be used to measure the total power in three-wire, three-phase circuits. For instance, when the load is connected in a wye configuration, the phase currents can be measured but the phase voltages (voltage across each load element) cannot because the neutral point generally is not available to connect the voltage inputs of the power meters, as Figure 6-11 shows.
L1
L2
L3
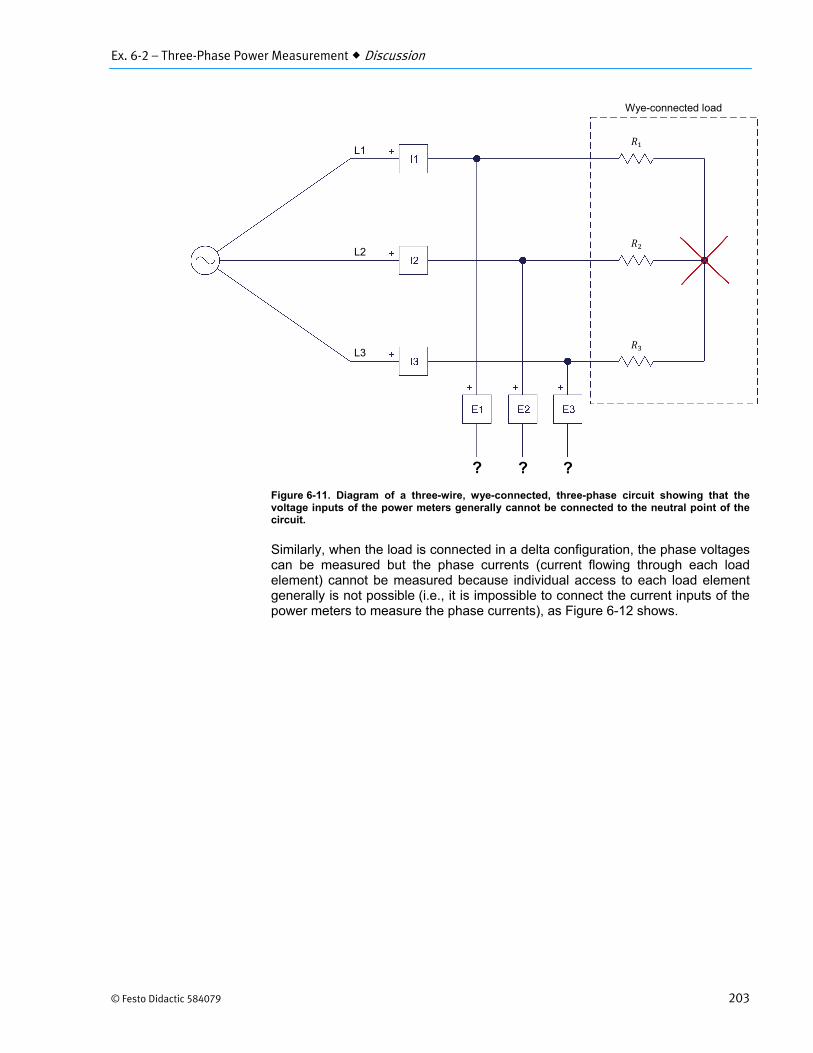
Ex. 6-2 – Three-Phase Power Measurement Discussion
© Festo Didactic 584079 203
Figure 6-11. Diagram of a three-wire, wye-connected, three-phase circuit showing that the voltage inputs of the power meters generally cannot be connected to the neutral point of the circuit.
Similarly, when the load is connected in a delta configuration, the phase voltages can be measured but the phase currents (current flowing through each load element) cannot be measured because individual access to each load element generally is not possible (i.e., it is impossible to connect the current inputs of the power meters to measure the phase currents), as Figure 6-12 shows.
Wye-connected load
? ? ?
L1
L2
L3
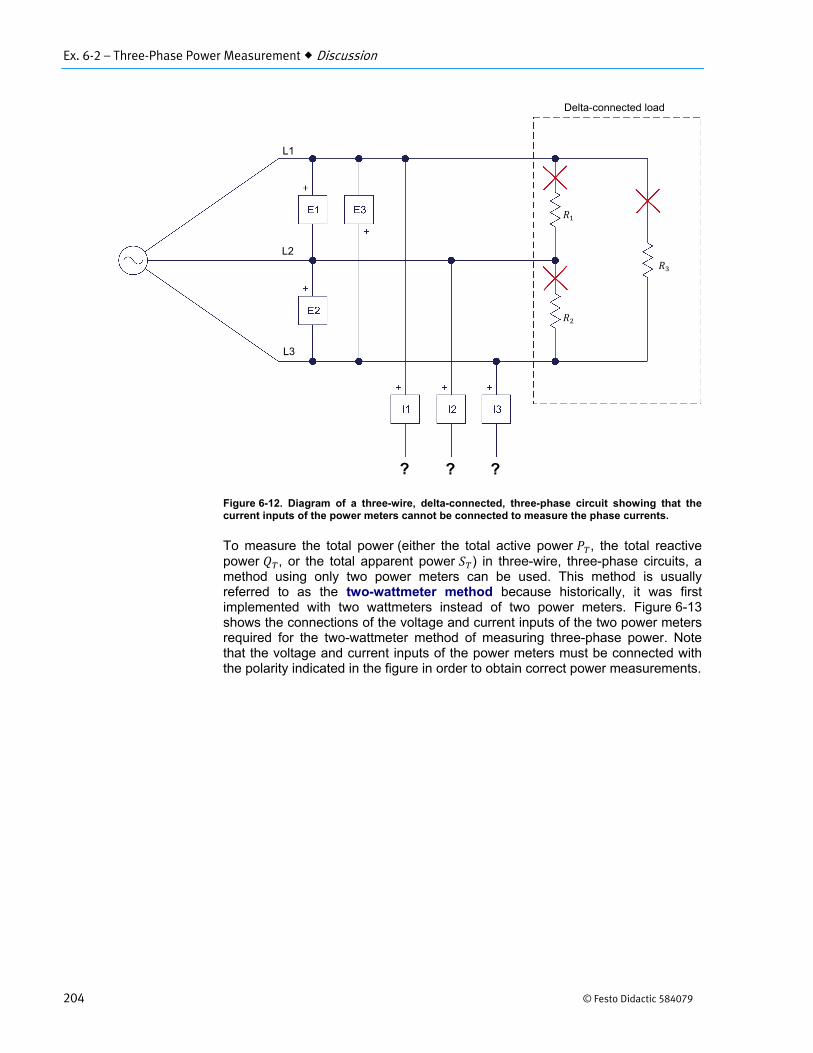
Ex. 6-2 – Three-Phase Power Measurement Discussion
204 © Festo Didactic 584079
Figure 6-12. Diagram of a three-wire, delta-connected, three-phase circuit showing that the current inputs of the power meters cannot be connected to measure the phase currents.
To measure the total power (either the total active power , the total reactive power , or the total apparent power ) in three-wire, three-phase circuits, a method using only two power meters can be used. This method is usually referred to as the two-wattmeter method because historically, it was first implemented with two wattmeters instead of two power meters. Figure 6-13 shows the connections of the voltage and current inputs of the two power meters required for the two-wattmeter method of measuring three-phase power. Note that the voltage and current inputs of the power meters must be connected with the polarity indicated in the figure in order to obtain correct power measurements.
Delta-connected load
L1
L2
L3
? ? ?
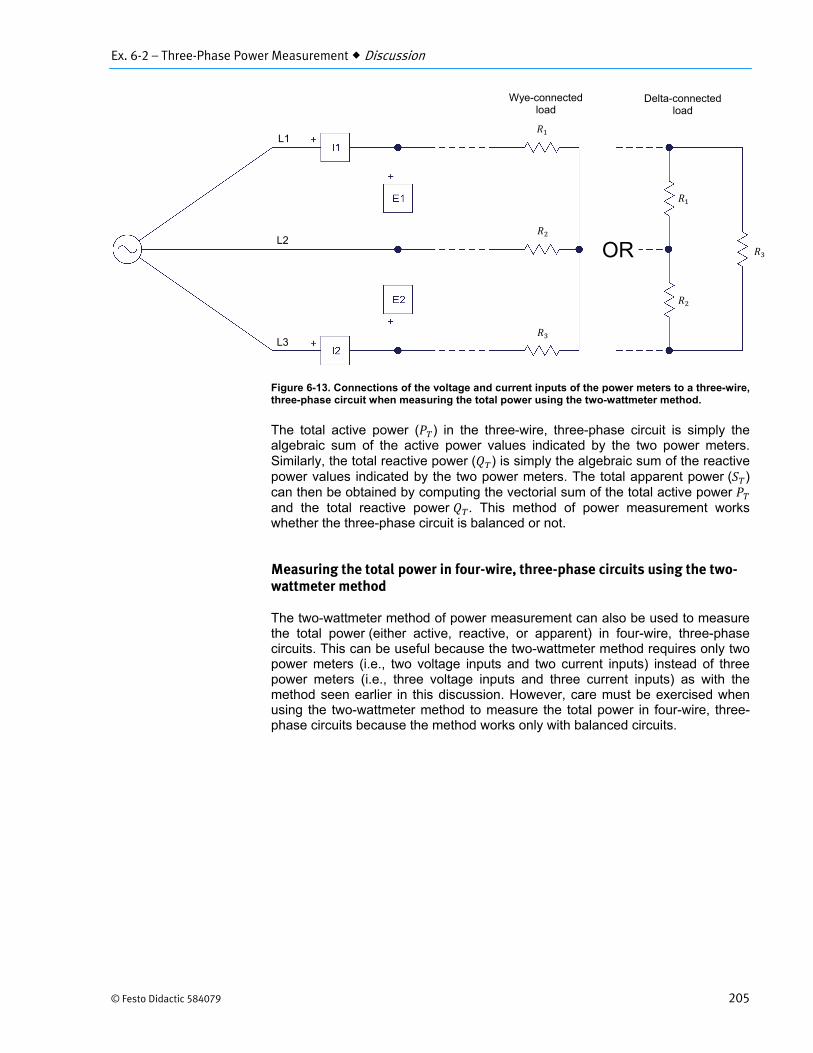
Ex. 6-2 – Three-Phase Power Measurement Discussion
© Festo Didactic 584079 205
Figure 6-13. Connections of the voltage and current inputs of the power meters to a three-wire, three-phase circuit when measuring the total power using the two-wattmeter method.
The total active power ( ) in the three-wire, three-phase circuit is simply the algebraic sum of the active power values indicated by the two power meters. Similarly, the total reactive power ( ) is simply the algebraic sum of the reactive power values indicated by the two power meters. The total apparent power ( ) can then be obtained by computing the vectorial sum of the total active power and the total reactive power . This method of power measurement works whether the three-phase circuit is balanced or not.
Measuring the total power in four-wire, three-phase circuits using the two-wattmeter method
The two-wattmeter method of power measurement can also be used to measure the total power (either active, reactive, or apparent) in four-wire, three-phase circuits. This can be useful because the two-wattmeter method requires only two power meters (i.e., two voltage inputs and two current inputs) instead of three power meters (i.e., three voltage inputs and three current inputs) as with the method seen earlier in this discussion. However, care must be exercised when using the two-wattmeter method to measure the total power in four-wire, three-phase circuits because the method works only with balanced circuits.
Wye-connected load
Delta-connected load
OR
L1
L2
L3
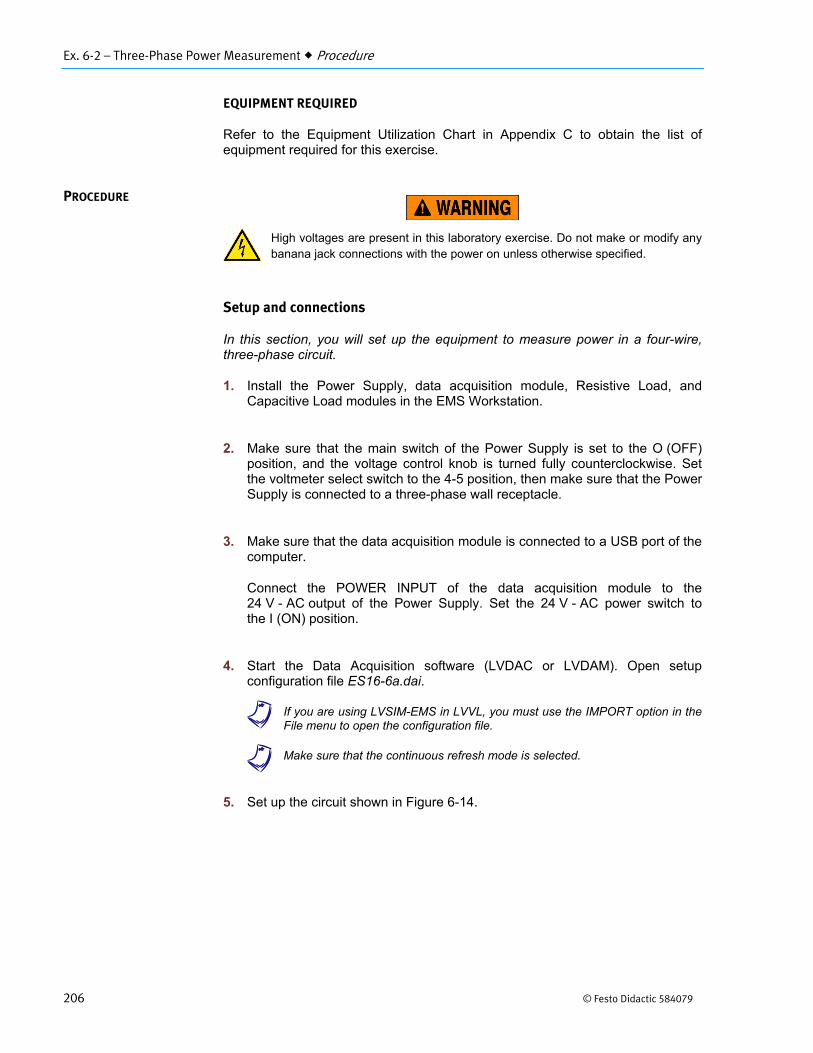
Ex. 6-2 – Three-Phase Power Measurement Procedure
206 © Festo Didactic 584079
EQUIPMENT REQUIRED
Refer to the Equipment Utilization Chart in Appendix C to obtain the list of equipment required for this exercise.
High voltages are present in this laboratory exercise. Do not make or modify any banana jack connections with the power on unless otherwise specified.
Setup and connections
In this section, you will set up the equipment to measure power in a four-wire, three-phase circuit.
1. Install the Power Supply, data acquisition module, Resistive Load, andCapacitive Load modules in the EMS Workstation.
2. Make sure that the main switch of the Power Supply is set to the O (OFF)position, and the voltage control knob is turned fully counterclockwise. Setthe voltmeter select switch to the 4-5 position, then make sure that the PowerSupply is connected to a three-phase wall receptacle.
3. Make sure that the data acquisition module is connected to a USB port of thecomputer.
Connect the POWER INPUT of the data acquisition module to the24 V - AC output of the Power Supply. Set the 24 V - AC power switch tothe I (ON) position.
4. Start the Data Acquisition software (LVDAC or LVDAM). Open setupconfiguration file ES16-6a.dai.
a If you are using LVSIM-EMS in LVVL, you must use the IMPORT option in theFile menu to open the configuration file.
a Make sure that the continuous refresh mode is selected.
5. Set up the circuit shown in Figure 6-14.
PROCEDURE
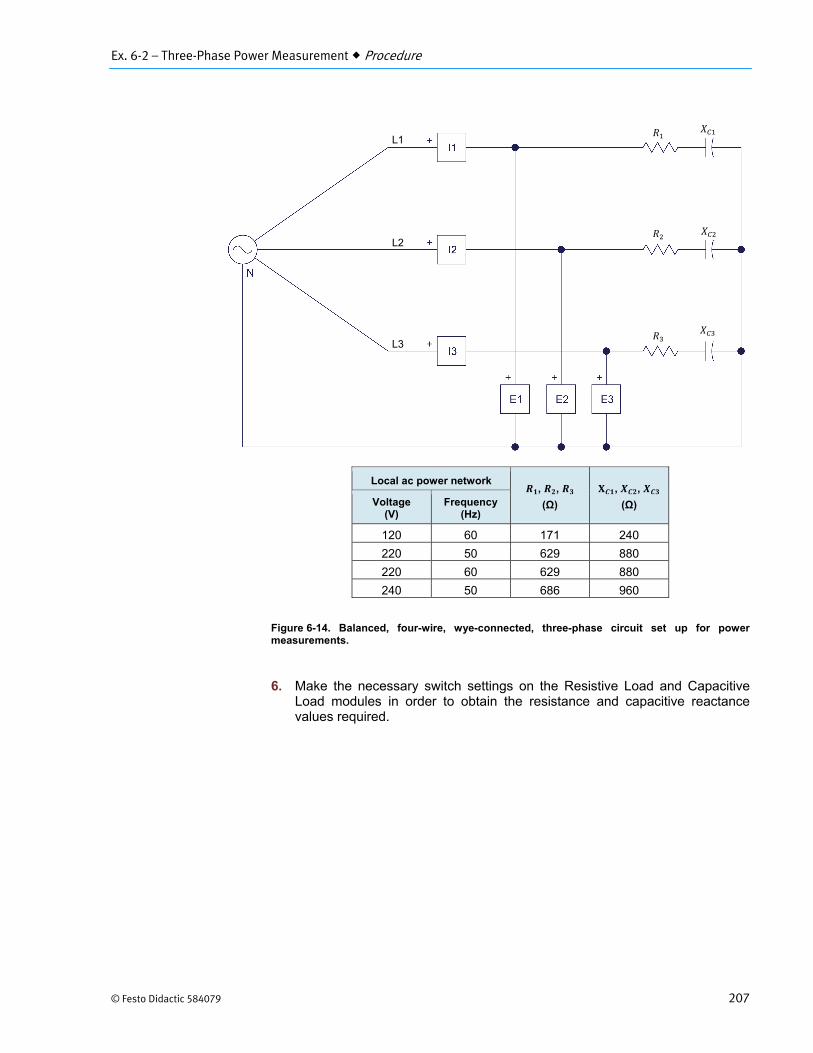
Ex. 6-2 – Three-Phase Power Measurement Procedure
© Festo Didactic 584079 207
Local ac power network , ,
(Ω)
, ,
(Ω) Voltage (V)
Frequency (Hz)
120 60 171 240
220 50 629 880
220 60 629 880
240 50 686 960
Figure 6-14. Balanced, four-wire, wye-connected, three-phase circuit set up for power measurements.
6. Make the necessary switch settings on the Resistive Load and CapacitiveLoad modules in order to obtain the resistance and capacitive reactancevalues required.
L1
L2
L3
Ex. 6-2 – Three-Phase Power Measurement Procedure
208 © Festo Didactic 584079
Measuring the total power in four-wire, three-phase circuits
In this section, you will solve the circuit you set up in the previous section by calculating the active, reactive, and apparent power values in each phase of the circuit, and the total active, reactive, and apparent power values in the circuit. You will measure the circuit’s voltage, current, and power values, and confirm that the measured circuit parameters are equal to the calculated circuit parameters. You will then unbalance the three-phase circuit by modifying the impedance in one phase of the circuit, and solve the resulting unbalanced, three-phase circuit. Finally, you will measure the total active, reactive, and apparent power values in the circuit, and verify that the measured circuit parameters are equal to the calculated circuit parameters, thus confirming that the total power in both balanced and unbalanced, four-wire, three-phase circuits can be measured using three power meters.
7. Solve the circuit in Figure 6-14 to determine the following parameters: theactive power , reactive power , and apparent power in each phase of thecircuit, as well as the total active power , total reactive power , and totalapparent power in the circuit.
8. Turn on the main Power Supply and set the voltage control knob so that theac power source voltage (indicated by meter ) is equal to the nominalvoltage of the ac power network. Do not change the setting of the voltagecontrol knob until the end of the exercise.
Measure and record below the voltages and currents in the circuit ofFigure 6-14, as well as the active power, reactive power, and apparent powerin each phase of the circuit, then turn off the Power Supply.
a You can change the type of power (i.e., active, reactive, or apparent)measured by a power meter in the Metering window by clicking on the meterMode button. With this method, you can rapidly perform all active powermeasurements, then all reactive power measurements, and finally all apparentpower measurements using the same three meters.
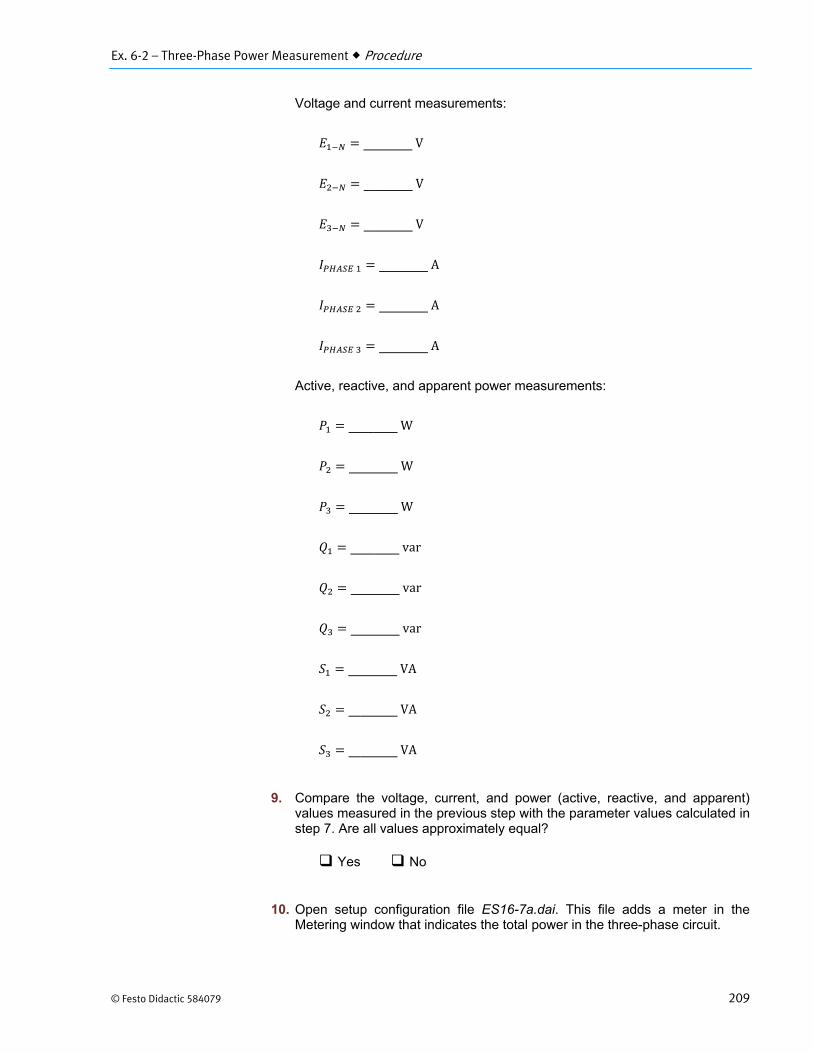
Ex. 6-2 – Three-Phase Power Measurement Procedure
© Festo Didactic 584079 209
Voltage and current measurements:
V
V
V
A
A
A
Active, reactive, and apparent power measurements:
W
W
W
var
var
var
VA
VA
VA
9. Compare the voltage, current, and power (active, reactive, and apparent)values measured in the previous step with the parameter values calculated instep 7. Are all values approximately equal?
Yes No
10. Open setup configuration file ES16-7a.dai. This file adds a meter in theMetering window that indicates the total power in the three-phase circuit.
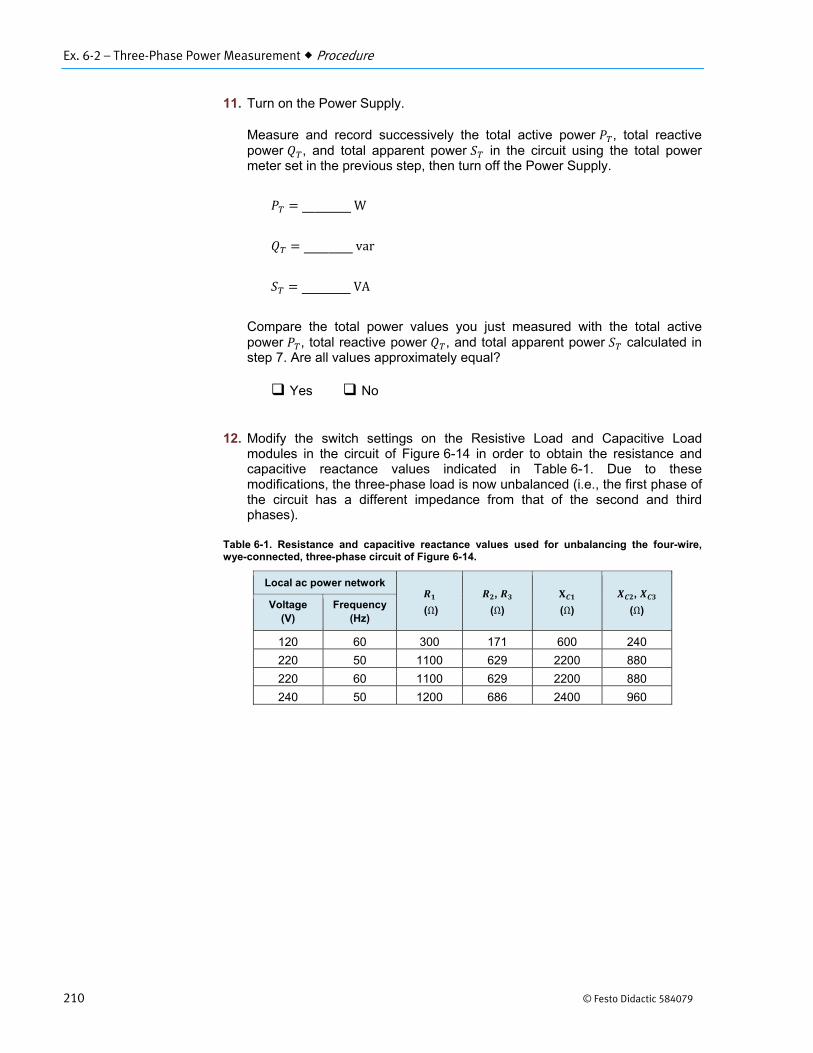
Ex. 6-2 – Three-Phase Power Measurement Procedure
210 © Festo Didactic 584079
11. Turn on the Power Supply.
Measure and record successively the total active power , total reactivepower , and total apparent power in the circuit using the total powermeter set in the previous step, then turn off the Power Supply.
W
var
VA
Compare the total power values you just measured with the total active power , total reactive power , and total apparent power calculated in step 7. Are all values approximately equal?
Yes No
12. Modify the switch settings on the Resistive Load and Capacitive Loadmodules in the circuit of Figure 6-14 in order to obtain the resistance andcapacitive reactance values indicated in Table 6-1. Due to thesemodifications, the three-phase load is now unbalanced (i.e., the first phase ofthe circuit has a different impedance from that of the second and thirdphases).
Table 6-1. Resistance and capacitive reactance values used for unbalancing the four-wire, wye-connected, three-phase circuit of Figure 6-14.
Local ac power network
(Ω)
,
(Ω)
(Ω)
,
(Ω) Voltage (V)
Frequency(Hz)
120 60 300 171 600 240
220 50 1100 629 2200 880
220 60 1100 629 2200 880
240 50 1200 686 2400 960

Ex. 6-2 – Three-Phase Power Measurement Procedure
© Festo Didactic 584079 211
13. Solve the circuit in Figure 6-14 using the resistance and capacitive reactancevalues indicated in Table 6-1, to determine the following parameters: the totalactive power , total reactive power , and total apparent power in thecircuit.
14. Turn on the Power Supply.
Successively measure and record the active power , reactive power ,and apparent power in the circuit using the total power meter you set upbefore, then turn off the Power Supply.
W
var
VA
15. Compare the total active power , total reactive power , and totalapparent power measured in the previous step with the total power valuescalculated in step 13. Are all values approximately equal?
Yes No
Do the circuit measurements performed in this section confirm that the total power in both balanced and unbalanced, four-wire, three-phase circuits can be measured using three power meters?
Yes No
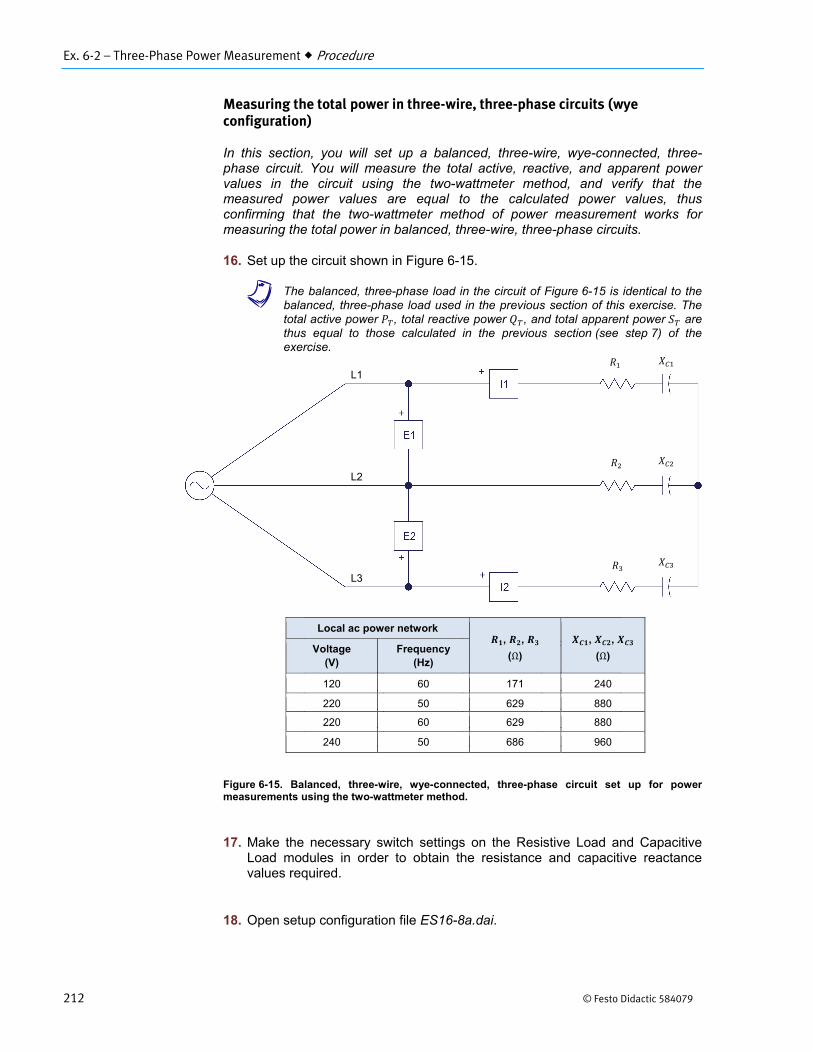
Ex. 6-2 – Three-Phase Power Measurement Procedure
212 © Festo Didactic 584079
Measuring the total power in three-wire, three-phase circuits (wye configuration)
In this section, you will set up a balanced, three-wire, wye-connected, three-phase circuit. You will measure the total active, reactive, and apparent power values in the circuit using the two-wattmeter method, and verify that the measured power values are equal to the calculated power values, thus confirming that the two-wattmeter method of power measurement works for measuring the total power in balanced, three-wire, three-phase circuits.
16. Set up the circuit shown in Figure 6-15.
a The balanced, three-phase load in the circuit of Figure 6-15 is identical to thebalanced, three-phase load used in the previous section of this exercise. Thetotal active power , total reactive power , and total apparent power arethus equal to those calculated in the previous section (see step 7) of theexercise.
Local ac power network , , (Ω)
, , (Ω) Voltage
(V) Frequency
(Hz)
120 60 171 240
220 50 629 880
220 60 629 880
240 50 686 960
Figure 6-15. Balanced, three-wire, wye-connected, three-phase circuit set up for power measurements using the two-wattmeter method.
17. Make the necessary switch settings on the Resistive Load and CapacitiveLoad modules in order to obtain the resistance and capacitive reactancevalues required.
18. Open setup configuration file ES16-8a.dai.
L1
L2
L3
Local ac power network , ,
(Ω)
, ,
(Ω) Voltage
(V) Frequency
(Hz)
120 60 171 240
220 50 629 880
220 60 629 880
240 50 686 960
Ex. 6-2 – Three-Phase Power Measurement Procedure
© Festo Didactic 584079 213
19. Turn on the Power Supply.
Successively measure and record the total active power , total reactivepower , and total apparent power in the circuit using the meter you setup for total power measurement, then off the Power Supply.
W
var
VA
20. Compare the total active power , total reactive power , and totalapparent power measured in the previous step with the total power valuescalculated in step 7. Are all values approximately equal?
Yes No
Do the circuit measurements performed in this section confirm that the two-wattmeter method of power measurement can be used to measure the total power in balanced, three-wire, wye-connected, three-phase circuits?
Yes No
Measuring the total power in three-wire, three-phase circuits (delta configuration)
In this section, you will set up a balanced, three-wire, delta-connected, three-phase circuit. You will solve the circuit by calculating the active, reactive, and apparent power values in each phase of the circuit, and the total active, reactive, and apparent power values in the circuit. You will measure the total active, reactive, and apparent power values in the circuit using the two-wattmeter method, and confirm that the measured values are equal to the calculated values. You will then unbalance the three-phase circuit by modifying the impedance in one phase of the circuit, and solve the resulting unbalanced three-phase circuit. Finally, you will measure the total active, reactive, and apparent power values in the circuit using the two-wattmeter method, and verify that the measured values are equal to the calculated values, thus confirming that the two-wattmeter method of power measurement can be used to measure the total power in both balanced and unbalanced, three-wire, three-phase circuits.
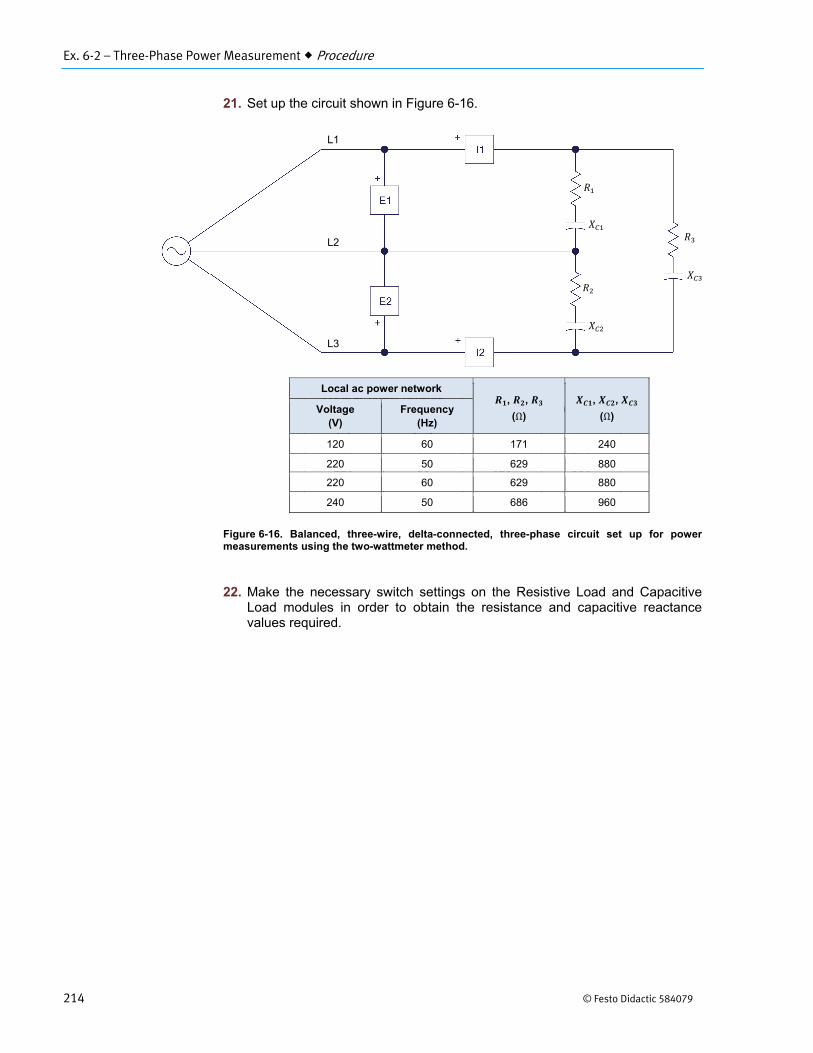
Ex. 6-2 – Three-Phase Power Measurement Procedure
214 © Festo Didactic 584079
21. Set up the circuit shown in Figure 6-16.
Local ac power network , , (Ω)
, , (Ω) Voltage
(V) Frequency
(Hz)
120 60 171 240
220 50 629 880
220 60 629 880
240 50 686 960
Figure 6-16. Balanced, three-wire, delta-connected, three-phase circuit set up for power measurements using the two-wattmeter method.
22. Make the necessary switch settings on the Resistive Load and CapacitiveLoad modules in order to obtain the resistance and capacitive reactancevalues required.
L1
L2
L3
Local ac power network , ,
(Ω)
, ,
(Ω) Voltage
(V) Frequency
(Hz)
120 60 171 240
220 50 629 880
220 60 629 880
240 50 686 960

Ex. 6-2 – Three-Phase Power Measurement Procedure
© Festo Didactic 584079 215
23. Solve the circuit in Figure 6-16 to determine the following parameters: theactive power and reactive power in each phase of the circuit, as well asthe total active power , total reactive power , and total apparentpower in the circuit.
24. Turn on the Power Supply.
Successively measure and record the total active power , total reactivepower , and total apparent power in the circuit using the meter you setup for total power measurement, then off the power.
W
var
VA
25. Compare the total active power , total reactive power , and totalapparent power measured in the previous step with the total power valuescalculated in step 23. Are all values approximately equal?
Yes No
26. Modify the switch settings on the Resistive Load and Capacitive Loadmodules in the circuit of Figure 6-16 in order to obtain the resistance andcapacitive reactance values indicated in Table 6-2. Due to thesemodifications, the three-phase load is now unbalanced (i.e., the first phase ofthe circuit has a different impedance from that of the second and thirdphases).
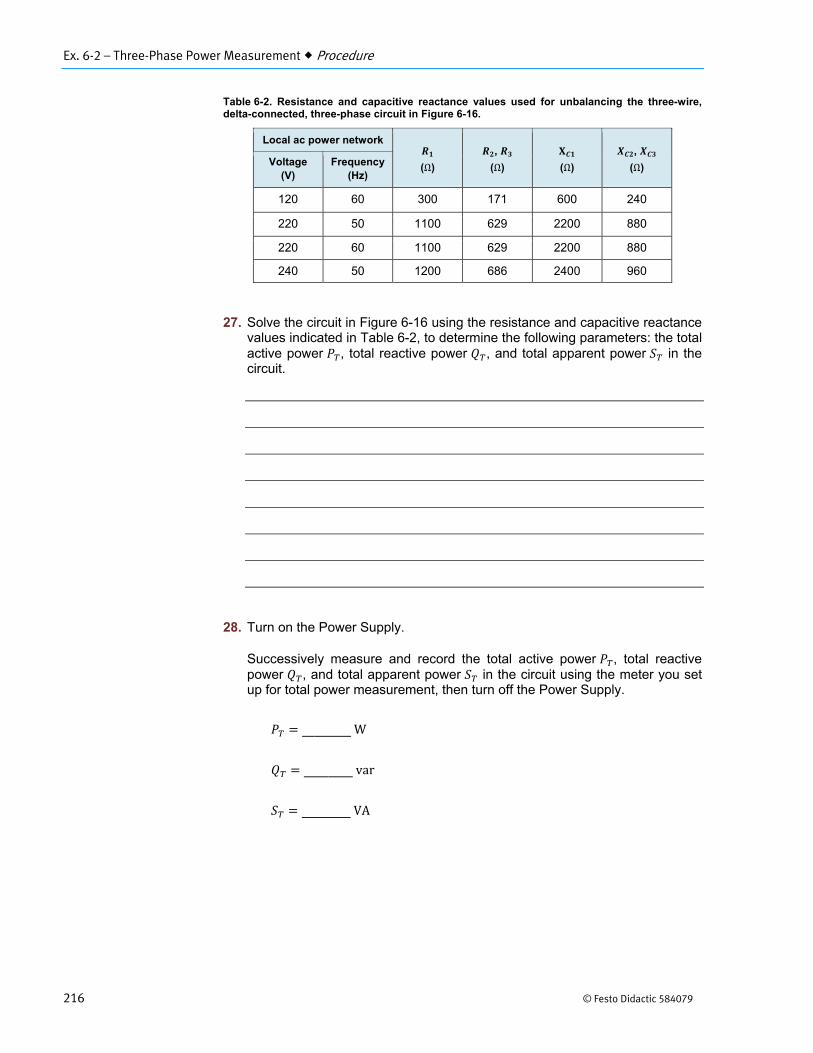
Ex. 6-2 – Three-Phase Power Measurement Procedure
216 © Festo Didactic 584079
Table 6-2. Resistance and capacitive reactance values used for unbalancing the three-wire, delta-connected, three-phase circuit in Figure 6-16.
Local ac power network
(Ω)
,
(Ω)
(Ω)
,
(Ω) Voltage (V)
Frequency(Hz)
120 60 300 171 600 240
220 50 1100 629 2200 880
220 60 1100 629 2200 880
240 50 1200 686 2400 960
27. Solve the circuit in Figure 6-16 using the resistance and capacitive reactancevalues indicated in Table 6-2, to determine the following parameters: the totalactive power , total reactive power , and total apparent power in thecircuit.
28. Turn on the Power Supply.
Successively measure and record the total active power , total reactivepower , and total apparent power in the circuit using the meter you setup for total power measurement, then turn off the Power Supply.
W
var
VA
Ex. 6-2 – Three-Phase Power Measurement Procedure
© Festo Didactic 584079 217
29. Compare the total active power , total reactive power , and totalapparent power measured in the previous step with the total power valuescalculated in step 27. Are all values approximately equal?
Yes No
Do the circuit measurements performed in this section confirm that the two-wattmeter method of power measurement can be used to measure the total power in both balanced and unbalanced, three-wire, delta-connected, three-phase circuits?
Yes No
Measuring the total power in four-wire, three-phase circuits using the two-wattmeter method
In this section, you will set up a balanced, four-wire, wye-connected, three-phase circuit similar (same load but voltage and current inputs connected for total power measurement using the two-wattmeter method) to the one you set up in the “Measuring the total power in four-wire, three-phase circuits” section of this exercise. You will measure the total active, reactive, and apparent power values in the circuit using the two-wattmeter method, and confirm that the measured values are equal to the values calculated for this balanced, three-phase circuit in the “Measuring the total power in four-wire, three-phase circuits” section of this exercise. You will then unbalance the three-phase circuit by modifying the impedance in one phase of the circuit. Finally, you will measure the total active, reactive, and apparent power values in the circuit, and verify that the measured values differ from the values calculated for this unbalanced, three-phase circuit in the section “Measuring the total power in four-wire, three-phase circuits” of this exercise. You will confirm that the two-wattmeter method of power measurement can only be used to measure power in four-wire, three-phase circuits that are balanced.
30. Set up the circuit shown in Figure 6-17.
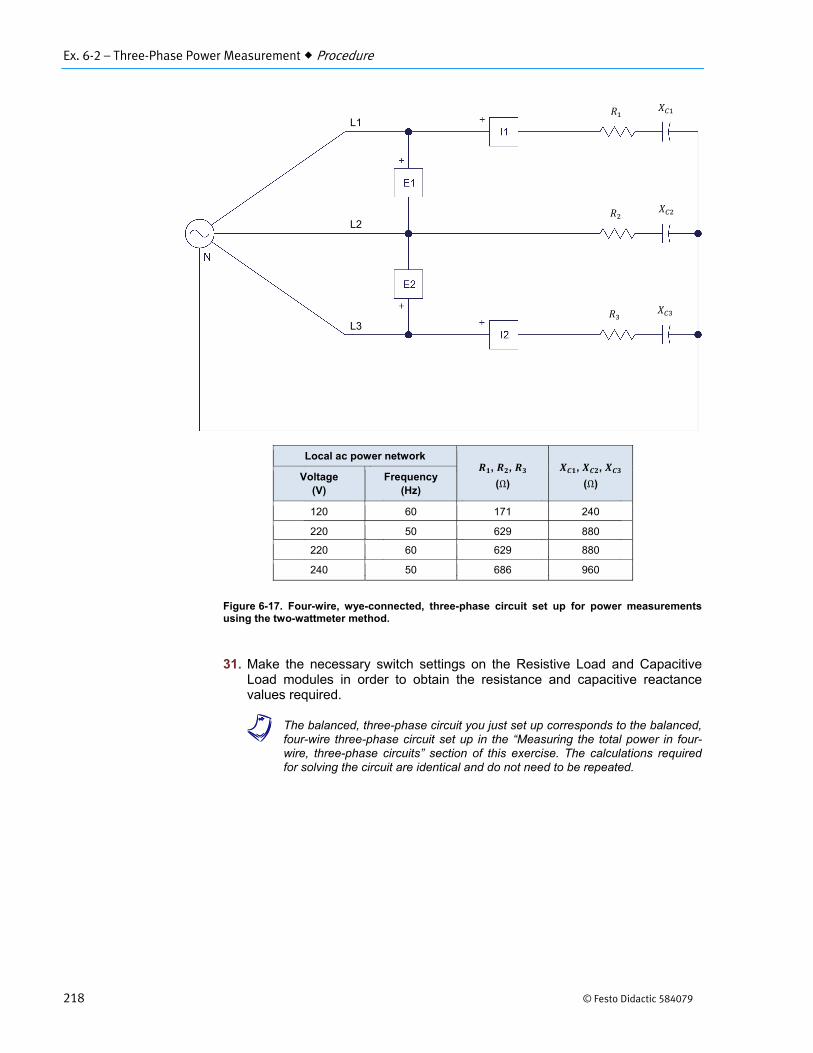
Ex. 6-2 – Three-Phase Power Measurement Procedure
218 © Festo Didactic 584079
Local ac power network , , (Ω)
, , (Ω) Voltage
(V) Frequency
(Hz)
120 60 171 240
220 50 629 880
220 60 629 880
240 50 686 960
Figure 6-17. Four-wire, wye-connected, three-phase circuit set up for power measurements using the two-wattmeter method.
31. Make the necessary switch settings on the Resistive Load and CapacitiveLoad modules in order to obtain the resistance and capacitive reactancevalues required.
a The balanced, three-phase circuit you just set up corresponds to the balanced,four-wire three-phase circuit set up in the “Measuring the total power in four-wire, three-phase circuits” section of this exercise. The calculations requiredfor solving the circuit are identical and do not need to be repeated.
L1
L2
L3
Local ac power network , ,
(Ω)
, ,
(Ω) Voltage
(V) Frequency
(Hz)
120 60 171 240
220 50 629 880
220 60 629 880
240 50 686 960
Ex. 6-2 – Three-Phase Power Measurement Procedure
© Festo Didactic 584079 219
32. Turn on the Power Supply.
Successively measure and record the total active power , total reactivepower , and total apparent power in the circuit using the meter you setup for total power measurement, then turn off the Power Supply.
W
var
VA
33. Compare the total active power , total reactive power , and totalapparent power measured in the previous step with the total power valuescalculated in step 7. Are all values approximately equal?
Yes No
34. Modify the switch settings on the Resistive Load and Capacitive Loadmodules in the circuit of Figure 6-17 in order to obtain the resistance andcapacitive reactance values indicated in Table 6-3. Due to thesemodifications, the three-phase load is now unbalanced (i.e., the first phase ofthe circuit has a different impedance from that of the second and thirdphases).
a The unbalanced, three-phase circuit you just set up corresponds to theunbalanced, four-wire, three-phase circuit set up in the section “Measuring thetotal power in four-wire, three-phase circuits” of this exercise. The calculationsrequired for solving the circuit are identical and do not need to be repeated.
Table 6-3. Resistance and capacitive reactance values used for unbalancing the four-wire, wye-connected, three-phase circuit.
Local ac power network
(Ω)
,
(Ω)
(Ω)
,
(Ω) Voltage(V)
Frequency(Hz)
120 60 300 171 600 240
220 50 1100 629 2200 880
220 60 1100 629 2200 880
240 50 1200 686 2400 960

Ex. 6-2 – Three-Phase Power Measurement Procedure
220 © Festo Didactic 584079
35. Turn on the Power Supply.
Successively measure and record the total active power , total reactivepower , and total apparent power in the circuit using the meter you setup for total power measurement, then turn off the Power Supply.
W
var
VA
36. Compare the total active power , total reactive power , and totalapparent power values measured in the previous step with the total powervalues calculated in step 13. Are all values equal?
Yes No
What conclusions can you draw concerning the two-wattmeter method of power measurement when measuring power in four-wire, three-phase circuits?
37. Ensure that the Power Supply is turned off, and that the voltage control knobis turned fully counterclockwise. Remove all leads and cables.
Ex. 6-2 – Three-Phase Power Measurement Conclusion
© Festo Didactic 584079 221
In this exercise, you learned how to calculate active, reactive, and apparent power in balanced, wye- and delta-connected, three-phase circuits. You also learned how to use power meters to measure power in three-phase circuits. You saw how to measure power in three- and four-wire, three-phase circuits, as well as when it is possible to use the two-wattmeter method of power measurement to measure power in a three-phase circuit.
1. A balanced, delta-connected, purely resistive, three-phase circuit has a linevoltage of 100 V and a line current of 1.5 A. What is the totalamount of active power dissipated in the resistive load of the circuit?
a. 260 Wb. 300 Wc. 450 Wd. 150 W
2. Explain how to connect the two power meters to the lines of a three-wire,three-phase circuit when using the two-wattmeter method of powermeasurement.
a. the current input of one of the power meters is connected tomeasure the line current flowing in one of the circuit line wires,while the second power meter current input is connected tomeasure the neutral line current. One voltage input of a powermeter in then connected to measure the line voltage betweentwo line wires and the other between a line wire and the neutralline wire.
b. the current inputs of the power meters are connected to measurethe line current flowing in two of the circuit line wires, while thevoltage inputs of the power meters are connected to measurethe line voltage between each of the two line wires connected tothe current inputs and the neutral wire.
c. the current inputs of the power meters are connected to measurethe line current flowing in two of the circuit line wires, while thevoltage inputs of the power meters are connected to measurethe line voltage between each of the two line wires connected tothe current inputs and the remaining line wire.
d. the current input of one of the power meters is connected tomeasure the line current flowing in one of the circuit line wires,while the second power meter current input is connected tomeasure the line current flowing in two of the circuit line wires.One voltage input of a power meter in then connected tomeasure the line voltage between a line wire and the neutral linewire.
CONCLUSION
REVIEW QUESTIONS
Ex. 6-2 – Three-Phase Power Measurement Review Questions
222 © Festo Didactic 584079
3. A balanced, wye-connected, resistive and capacitive, three-phase circuit hasa phase voltage of 80 V and a phase current of 2.5 A. Calculatethe total apparent power in the circuit.
a. 350 VAb. 800 VAc. 600 VAd. 1000 VA
4. A balanced, three-wire, resistive and capacitive, three-phase circuit isconnected to two power meters set up to measure power using the two-wattmeter method of power measurement. The two power meters indicateactive power readings of 175 W and -35 W. Calculate the total activepower dissipated in the circuit.
a. 120 Wb. 375 Wc. 230 Wd. 140 W
5. In which type of three-phase circuits does the two-wattmeter method ofpower measurement not work to measure the total power in the circuit?
a. The two-wattmeter method of power measurement does notwork to measure power in unbalanced, four-wire, three-phasecircuits.
b. The two-wattmeter method of power measurement does notwork to measure power in balanced, three-wire, three-phasecircuits.
c. The two-wattmeter method of power measurement does notwork to measure power in unbalanced, three-wire, three-phasecircuits.
d. None of the above
© Festo Didactic 584079 223
When you have completed this exercise, you will know what a phase sequence is and why it is important to know the phase sequence of a three-phase power system. You will be able to determine the phase sequence of a three-phase power system using an oscilloscope.
Phase sequence fundamentals
As mentioned earlier in this manual, a three-phase power system is a polyphase system in which three voltages , , and have an equal magnitude and are displaced 120° from each other. However, simply stating that the voltages are 120° out of phase with each other is not sufficient to fully describe the system. The order in which the voltages succeed each other, i.e., the phase sequence of the power system, is also important.
The phase sequence of a power system is determined directly at the power generating station by the direction of rotation of the ac generators. Figure 6-18a shows a three-phase power system rotating in clockwise (cw) direction. The phase sequence is thus A-B-C-A-B-C…. Figure 6-18b and Figure 6-18c show the resulting phase voltage waveforms and phase voltage phasor diagram, respectively.
Phase Sequence
Exercise 6-3
EXERCISE OBJECTIVE
DISCUSSION
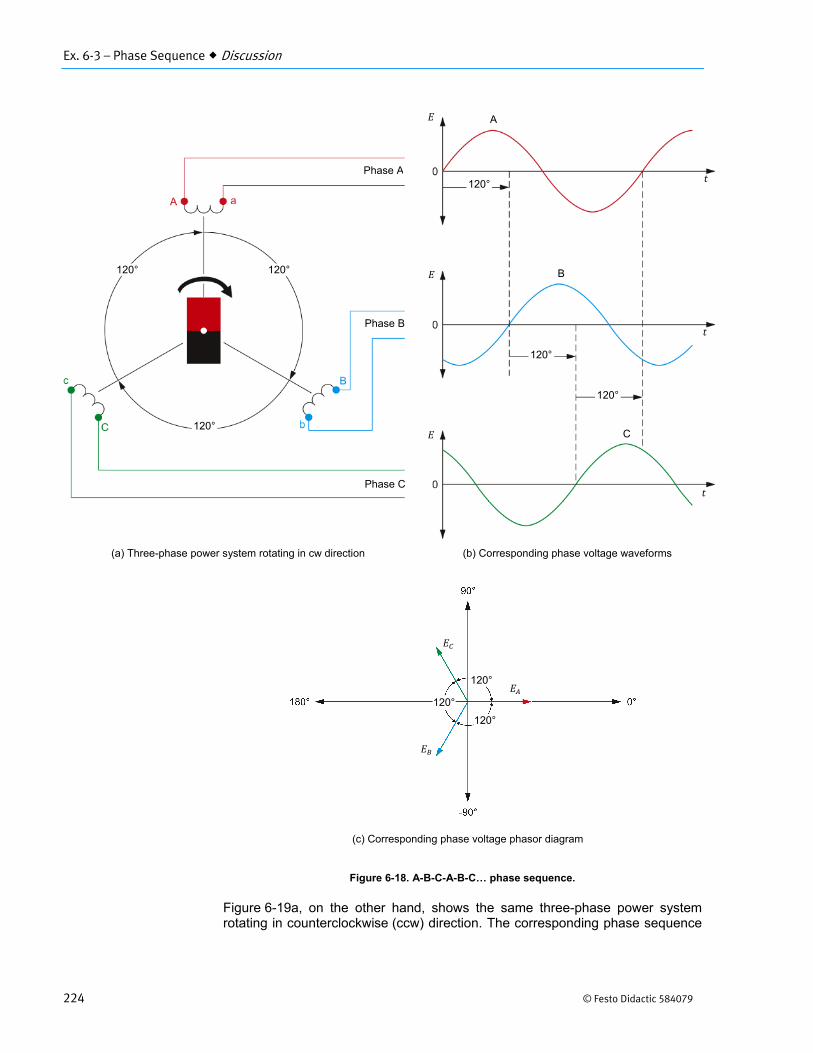
Ex. 6-3 – Phase Sequence Discussion
224 © Festo Didactic 584079
Figure 6-18. A-B-C-A-B-C… phase sequence.
Figure 6-19a, on the other hand, shows the same three-phase power system rotating in counterclockwise (ccw) direction. The corresponding phase sequence
(a) Three-phase power system rotating in cw direction (b) Corresponding phase voltage waveforms
Phase B
Phase A
Phase C
N
S
A
B
C
(c) Corresponding phase voltage phasor diagram
120°
120°
120°
120°
120°
120°
120°
120°
120°
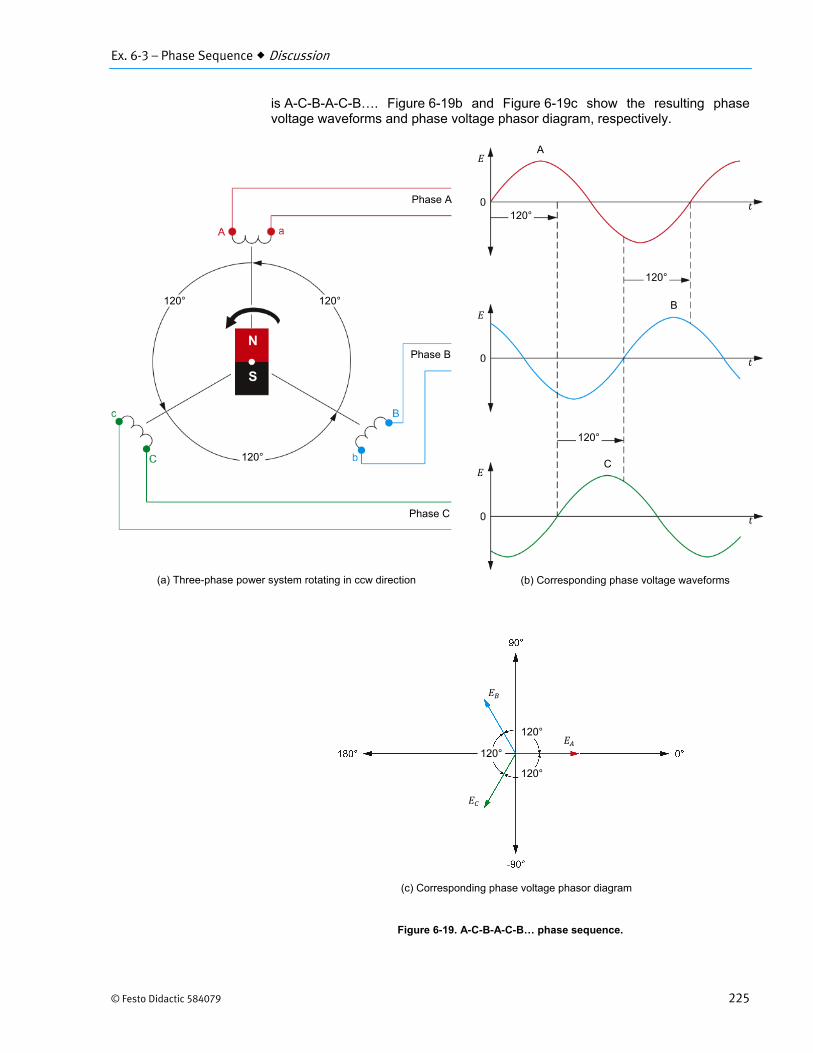
Ex. 6-3 – Phase Sequence Discussion
© Festo Didactic 584079 225
is A-C-B-A-C-B…. Figure 6-19b and Figure 6-19c show the resulting phase voltage waveforms and phase voltage phasor diagram, respectively.
Figure 6-19. A-C-B-A-C-B… phase sequence.
120°
120°
120°
(c) Corresponding phase voltage phasor diagram
(a) Three-phase power system rotating in ccw direction (b) Corresponding phase voltage waveforms
Phase B
Phase A
Phase C
N
S
A
B
C 120°
120°
120°
120°
120°
120°
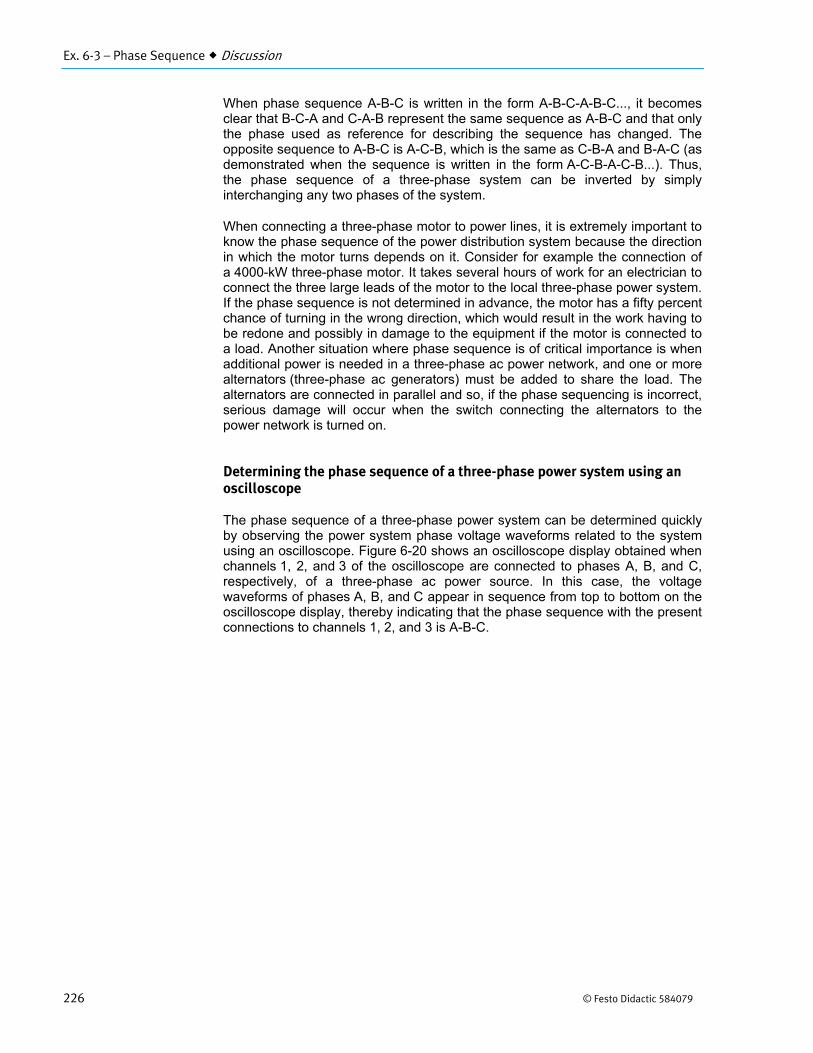
Ex. 6-3 – Phase Sequence Discussion
226 © Festo Didactic 584079
When phase sequence A-B-C is written in the form A-B-C-A-B-C..., it becomes clear that B-C-A and C-A-B represent the same sequence as A-B-C and that only the phase used as reference for describing the sequence has changed. The opposite sequence to A-B-C is A-C-B, which is the same as C-B-A and B-A-C (as demonstrated when the sequence is written in the form A-C-B-A-C-B...). Thus, the phase sequence of a three-phase system can be inverted by simply interchanging any two phases of the system.
When connecting a three-phase motor to power lines, it is extremely important to know the phase sequence of the power distribution system because the direction in which the motor turns depends on it. Consider for example the connection of a 4000-kW three-phase motor. It takes several hours of work for an electrician to connect the three large leads of the motor to the local three-phase power system. If the phase sequence is not determined in advance, the motor has a fifty percent chance of turning in the wrong direction, which would result in the work having to be redone and possibly in damage to the equipment if the motor is connected to a load. Another situation where phase sequence is of critical importance is when additional power is needed in a three-phase ac power network, and one or more alternators (three-phase ac generators) must be added to share the load. The alternators are connected in parallel and so, if the phase sequencing is incorrect, serious damage will occur when the switch connecting the alternators to the power network is turned on.
Determining the phase sequence of a three-phase power system using an oscilloscope
The phase sequence of a three-phase power system can be determined quickly by observing the power system phase voltage waveforms related to the system using an oscilloscope. Figure 6-20 shows an oscilloscope display obtained when channels 1, 2, and 3 of the oscilloscope are connected to phases A, B, and C, respectively, of a three-phase ac power source. In this case, the voltage waveforms of phases A, B, and C appear in sequence from top to bottom on the oscilloscope display, thereby indicating that the phase sequence with the present connections to channels 1, 2, and 3 is A-B-C.
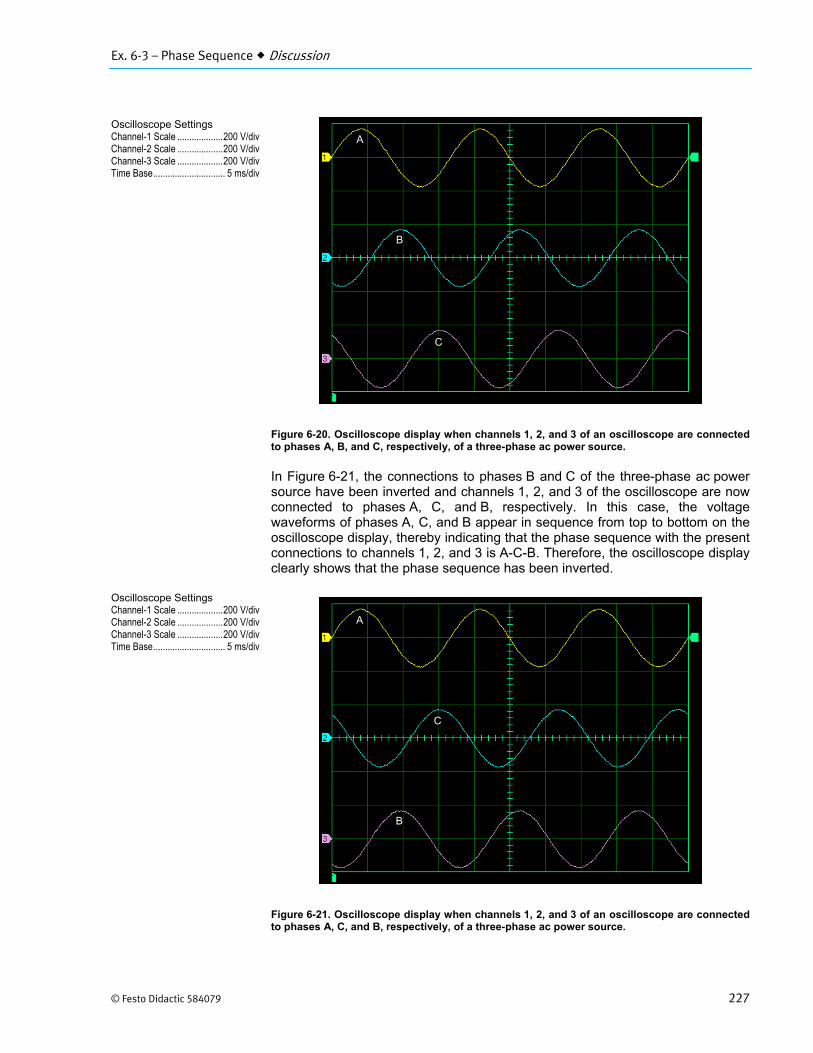
Ex. 6-3 – Phase Sequence Discussion
© Festo Didactic 584079 227
Figure 6-20. Oscilloscope display when channels 1, 2, and 3 of an oscilloscope are connected to phases A, B, and C, respectively, of a three-phase ac power source.
In Figure 6-21, the connections to phases B and C of the three-phase ac power source have been inverted and channels 1, 2, and 3 of the oscilloscope are now connected to phases A, C, and B, respectively. In this case, the voltage waveforms of phases A, C, and B appear in sequence from top to bottom on the oscilloscope display, thereby indicating that the phase sequence with the present connections to channels 1, 2, and 3 is A-C-B. Therefore, the oscilloscope display clearly shows that the phase sequence has been inverted.
Figure 6-21. Oscilloscope display when channels 1, 2, and 3 of an oscilloscope are connected to phases A, C, and B, respectively, of a three-phase ac power source.
Oscilloscope Settings Channel-1 Scale ................... 200 V/div Channel-2 Scale ................... 200 V/div Channel-3 Scale ................... 200 V/div Time Base .............................. 5 ms/div
Oscilloscope Settings Channel-1 Scale ................... 200 V/div Channel-2 Scale ................... 200 V/div Channel-3 Scale ................... 200 V/div Time Base .............................. 5 ms/div
A
C
B
A
B
C
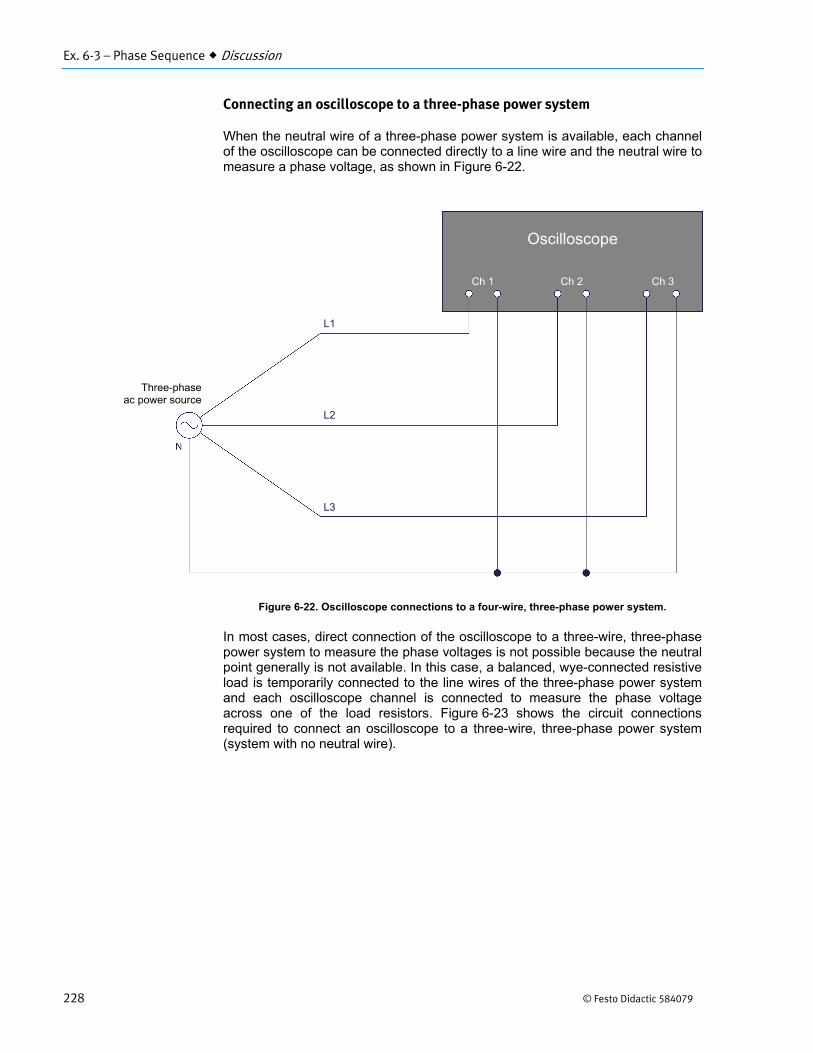
Ex. 6-3 – Phase Sequence Discussion
228 © Festo Didactic 584079
Connecting an oscilloscope to a three-phase power system
When the neutral wire of a three-phase power system is available, each channel of the oscilloscope can be connected directly to a line wire and the neutral wire to measure a phase voltage, as shown in Figure 6-22.
Figure 6-22. Oscilloscope connections to a four-wire, three-phase power system.
In most cases, direct connection of the oscilloscope to a three-wire, three-phase power system to measure the phase voltages is not possible because the neutral point generally is not available. In this case, a balanced, wye-connected resistive load is temporarily connected to the line wires of the three-phase power system and each oscilloscope channel is connected to measure the phase voltage across one of the load resistors. Figure 6-23 shows the circuit connections required to connect an oscilloscope to a three-wire, three-phase power system (system with no neutral wire).
Ch 1 Ch 2 Ch 3
Oscilloscope
Three-phaseac power source
L1
L2
L3
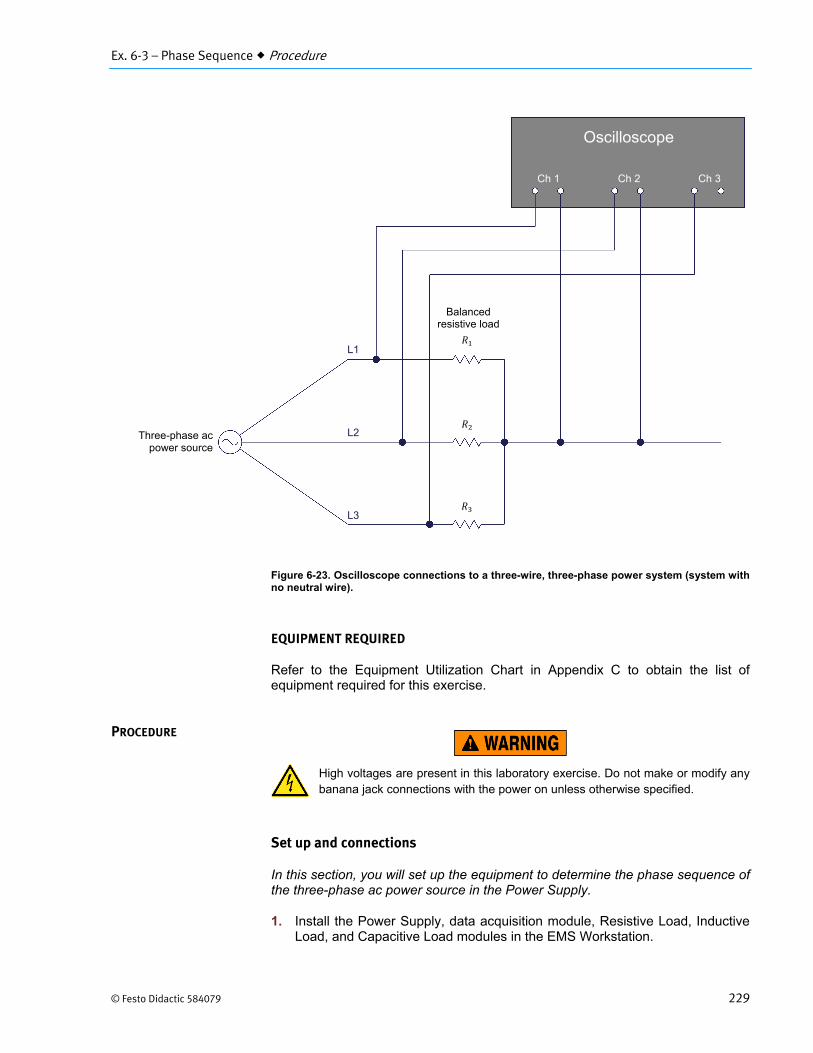
Ex. 6-3 – Phase Sequence Procedure
© Festo Didactic 584079 229
Figure 6-23. Oscilloscope connections to a three-wire, three-phase power system (system with no neutral wire).
EQUIPMENT REQUIRED
Refer to the Equipment Utilization Chart in Appendix C to obtain the list of equipment required for this exercise.
High voltages are present in this laboratory exercise. Do not make or modify anybanana jack connections with the power on unless otherwise specified.
Set up and connections
In this section, you will set up the equipment to determine the phase sequence of the three-phase ac power source in the Power Supply.
1. Install the Power Supply, data acquisition module, Resistive Load, InductiveLoad, and Capacitive Load modules in the EMS Workstation.
PROCEDURE
Ch 1 Ch 2 Ch 3
Oscilloscope
Three-phase ac power source
Balanced resistive load
L1
L2
L3
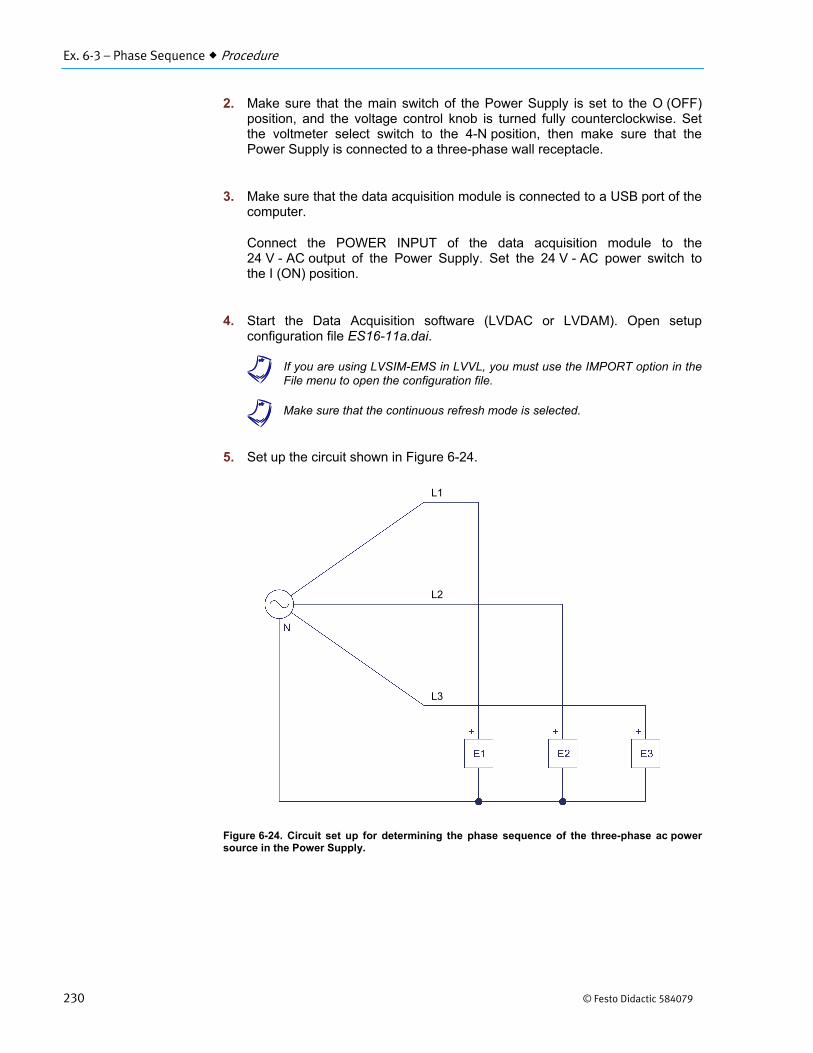
Ex. 6-3 – Phase Sequence Procedure
230 © Festo Didactic 584079
2. Make sure that the main switch of the Power Supply is set to the O (OFF)position, and the voltage control knob is turned fully counterclockwise. Setthe voltmeter select switch to the 4-N position, then make sure that thePower Supply is connected to a three-phase wall receptacle.
3. Make sure that the data acquisition module is connected to a USB port of thecomputer.
Connect the POWER INPUT of the data acquisition module to the24 V - AC output of the Power Supply. Set the 24 V - AC power switch tothe I (ON) position.
4. Start the Data Acquisition software (LVDAC or LVDAM). Open setupconfiguration file ES16-11a.dai.
a If you are using LVSIM-EMS in LVVL, you must use the IMPORT option in theFile menu to open the configuration file.
a Make sure that the continuous refresh mode is selected.
5. Set up the circuit shown in Figure 6-24.
Figure 6-24. Circuit set up for determining the phase sequence of the three-phase ac power source in the Power Supply.
L1
L2
L3
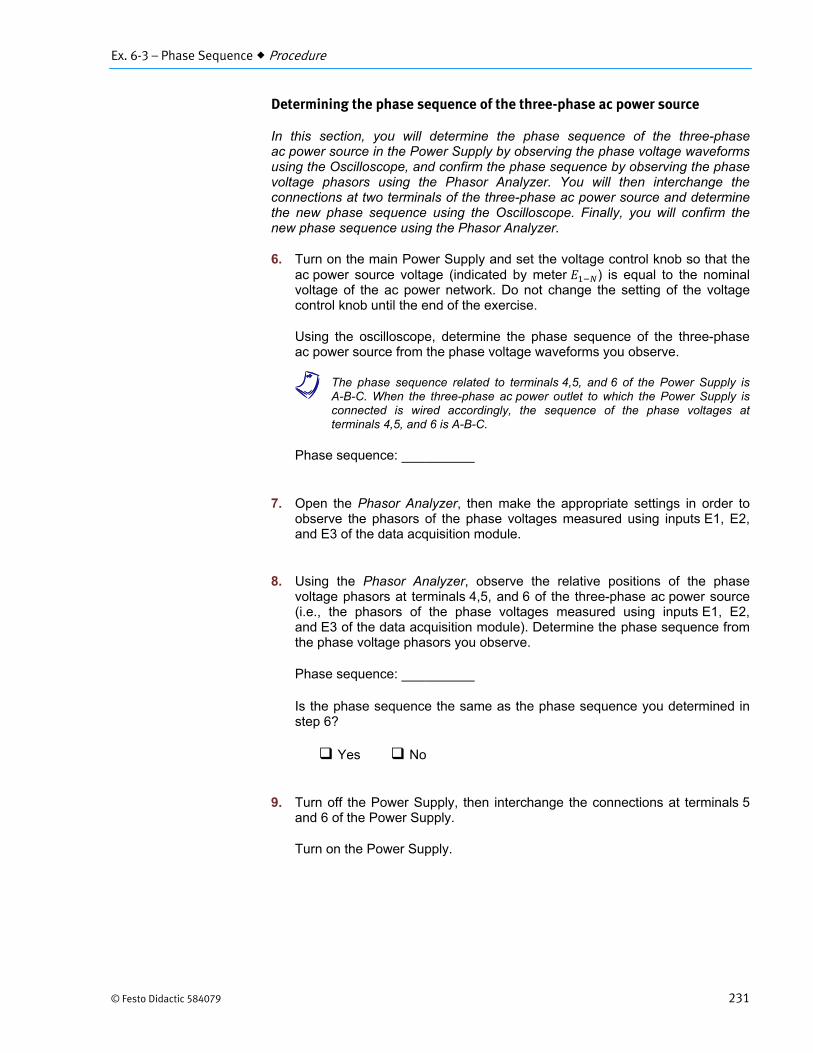
Ex. 6-3 – Phase Sequence Procedure
© Festo Didactic 584079 231
Determining the phase sequence of the three-phase ac power source
In this section, you will determine the phase sequence of the three-phase ac power source in the Power Supply by observing the phase voltage waveforms using the Oscilloscope, and confirm the phase sequence by observing the phase voltage phasors using the Phasor Analyzer. You will then interchange the connections at two terminals of the three-phase ac power source and determine the new phase sequence using the Oscilloscope. Finally, you will confirm the new phase sequence using the Phasor Analyzer.
6. Turn on the main Power Supply and set the voltage control knob so that theac power source voltage (indicated by meter ) is equal to the nominalvoltage of the ac power network. Do not change the setting of the voltagecontrol knob until the end of the exercise.
Using the oscilloscope, determine the phase sequence of the three-phaseac power source from the phase voltage waveforms you observe.
a The phase sequence related to terminals 4,5, and 6 of the Power Supply isA-B-C. When the three-phase ac power outlet to which the Power Supply isconnected is wired accordingly, the sequence of the phase voltages atterminals 4,5, and 6 is A-B-C.
Phase sequence:
7. Open the Phasor Analyzer, then make the appropriate settings in order toobserve the phasors of the phase voltages measured using inputs E1, E2,and E3 of the data acquisition module.
8. Using the Phasor Analyzer, observe the relative positions of the phasevoltage phasors at terminals 4,5, and 6 of the three-phase ac power source(i.e., the phasors of the phase voltages measured using inputs E1, E2,and E3 of the data acquisition module). Determine the phase sequence fromthe phase voltage phasors you observe.
Phase sequence:
Is the phase sequence the same as the phase sequence you determined instep 6?
Yes No
9. Turn off the Power Supply, then interchange the connections at terminals 5and 6 of the Power Supply.
Turn on the Power Supply.
Ex. 6-3 – Phase Sequence Conclusion
232 © Festo Didactic 584079
10. Using the Oscilloscope, determine the phase sequence of the three-phaseac power source from the phase voltage waveforms you observe and recordit below.
Phase sequence:
Is the phase voltage sequence opposite to the one you recorded in step 6?
Yes No
11. Using the Phasor Analyzer, observe the relative positions of the phasevoltage phasors at terminals 4,5, and 6 of the three-phase ac power source(i.e., the phasors of the phase voltages measured using inputs E1, E2,and E3). Determine the phase sequence from the phase voltage phasors youobserve.
Phase sequence:
Is the phase sequence the same as the phase sequence you determined inthe previous step?
Yes No
12. What is the effect on the phase sequence of the three-phase ac powersource in the Power Supply of interchanging the connections at two terminalsof the Power Supply?
13. Ensure that the Power Supply is turned off, and that the voltage control knobis turned fully counterclockwise. Remove all leads and cables.
In this exercise, you saw what a phase sequence is and why it is important to know the phase sequence of a three-phase ac power system. You learned how to determine the phase sequence of a three-phase ac power source using an oscilloscope.
1. The opposite phase sequence to B-A-C is
a. B-C-A (C-A-B, A-B-C).b. A-C-B.c. C-B-A.d. Both A and B are correct.
CONCLUSION
REVIEW QUESTIONS
Ex. 6-3 – Phase Sequence Review Questions
© Festo Didactic 584079 233
2. A three-phase motor rotates clockwise when the ac supply lines A, B, C areconnected to motor leads 1, 2, 3, respectively. If the connections arechanged so that lines A, B, C are now connected to leads 3, 1, and 2,respectively, the motor
a. will rotate counterclockwise because the sequence is reversed.b. will still rotate clockwise as the new phase sequence at motor
leads 1, 2, and 3 is B-C-A, which is equivalent to the originalphase sequence A-B-C.
c. will oscillate between clockwise and counterclockwise rotations.d. will stop because the sequence is incorrect.
3. How is it possible to use an oscilloscope to determine the phase sequence ofa three-wire, three-phase ac power system?
a. a direct connection of the oscilloscope to a wye-configured,three-wire, three-phase power system to measure the phasevoltage is not possible because the neutral point generally is notavailable.
b. by first connecting a delta-configured, three phase resistive loadto the line wires of the power system. Three channels of theoscilloscope are then used to observe the phase voltages acrossthe load resistors and determine the phase sequence.
c. by first connecting a wye-configured, three phase resistive loadto the line wires of the power system. Three channels of theoscilloscope are then used to observe the phase voltages acrossthe load resistors and determine the phase sequence.
d. None of the above.
4. Why is it important to know the phase sequence of a three-phase powerdistribution system when connecting a three-phase motor to the system?
a. The phase sequence of the distribution system determines thedirection in which the motor turns.
b. Connecting the motor in the wrong phase sequence will makethe motor rotate in the wrong direction.
c. Connecting the motor in the wrong phase sequence may resultin damage to the motor and the surrounding equipment.
d. All of the above.
5. Determine the phase sequence of the voltage waveforms shown in thefollowing figure.
a. The phase sequence shown is B-A-C (A-C-B, C-B-A).b. The phase sequence shown is B-C-A (A-B-C, C-A-B).c. The phase sequence shown is all of the above.d. The phase sequence shown is none of the above.
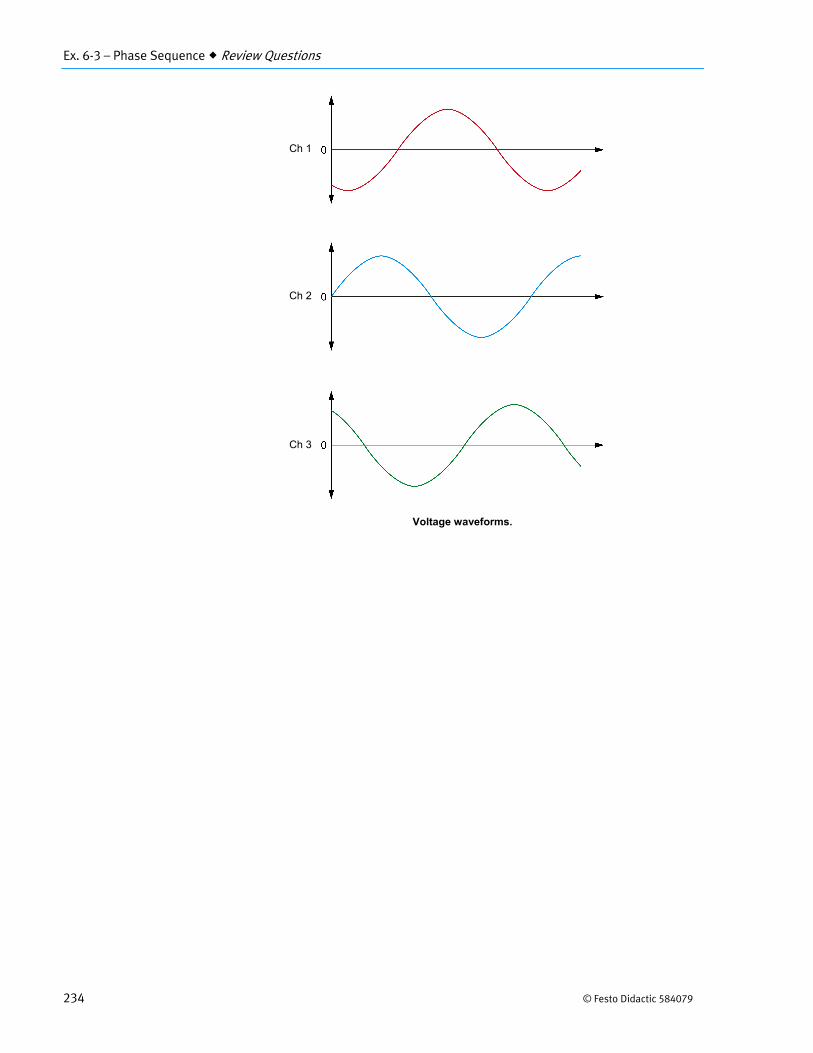
Ex. 6-3 – Phase Sequence Review Questions
234 © Festo Didactic 584079
Voltage waveforms.
Ch 1
Ch 2
Ch 3

Unit 6 – Three-Phase Circuits Unit Test
© Festo Didactic 584079 235
Unit Test
1. The line current is √3 times greater than the phase current
a. with a balanced wye-connected load.b. with a balanced delta-connected load.c. when the line voltage is √3 times smaller than the phase voltage.d. when the line voltage is √3 times greater than the phase voltage.
2. The line voltage is √3 times greater than the phase voltage
a. with a balanced wye-connected load.b. with a balanced delta-connected load.c. when the line current is √3 times greater than the phase current.d. when the line current is √3 times smaller than the phase current.
3. What is the neutral line current in a wye-connected circuit when the line-to-line voltage is 346 V, and the load resistors are 100 Ω?
a. 3.46 Ab. 10.38 Ac. 0 Ad. 2 A
4. What is the current in each phase of a balanced delta-connected resistiveload when the line current is 34.6 A?
a. 60 Ab. 11.5 Ac. 20 Ad. 104 A
5. The apparent power in a three-phase balanced circuit is 150 VA, and theactive power is 100 W. What is the load power factor?
a. 0.67b. 1.5c. 0.33d. 0.25
6. The two-wattmeter method of power measurement
a. allows reactive power in a single-phase circuit to be determined.b. allows active power in a single-phase circuit to be determined.c. allows active power in a three-phase circuit to be determined.d. allows apparent power in a single-phase circuit to be determined.
Unit 6 – Three-Phase Circuits Unit Test
236 © Festo Didactic 584079
7. The formula for total apparent power in a three-phase balanced circuit is
a. 1.73 cosb. 1.73 cosc. 1.73 cosd. 1.73
8. The two wattmeter readings for a three-phase balanced load are 200 W and50 W. Knowing that the power measurements have been made using thetwo-wattmeter method, what is the total power consumed by the load?
a. 250 Wb. 150 Wc. 500 Wd. 750 W
9. The phase sequence A-C-B is the same as
a. A-B-C.b. C-B-A.c. B-C-A.d. both a and c.
10. What changes in supply-line connections must be made for a three-phasemotor to reverse direction?
a. All leads must be reversed.b. The leads must be connected through a transformer.c. Two leads must be interchanged.d. Motor direction cannot be changed in this way.
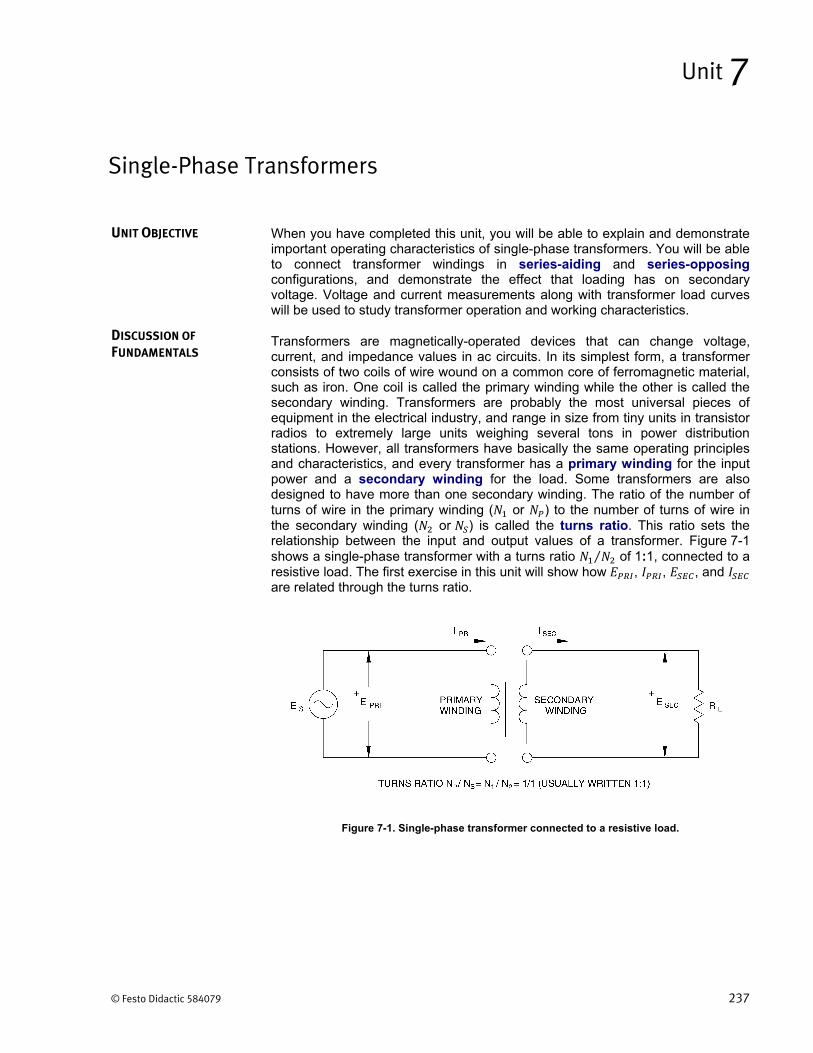
© Festo Didactic 584079 237
When you have completed this unit, you will be able to explain and demonstrate important operating characteristics of single-phase transformers. You will be able to connect transformer windings in series-aiding and series-opposing configurations, and demonstrate the effect that loading has on secondary voltage. Voltage and current measurements along with transformer load curves will be used to study transformer operation and working characteristics.
Transformers are magnetically-operated devices that can change voltage, current, and impedance values in ac circuits. In its simplest form, a transformer consists of two coils of wire wound on a common core of ferromagnetic material, such as iron. One coil is called the primary winding while the other is called the secondary winding. Transformers are probably the most universal pieces of equipment in the electrical industry, and range in size from tiny units in transistor radios to extremely large units weighing several tons in power distribution stations. However, all transformers have basically the same operating principles and characteristics, and every transformer has a primary winding for the input power and a secondary winding for the load. Some transformers are also designed to have more than one secondary winding. The ratio of the number of turns of wire in the primary winding ( or ) to the number of turns of wire in the secondary winding ( or ) is called the turns ratio. This ratio sets the relationship between the input and output values of a transformer. Figure 7-1 shows a single-phase transformer with a turns ratio ⁄ of 1:1, connected to a resistive load. The first exercise in this unit will show how , , , and are related through the turns ratio.
Figure 7-1. Single-phase transformer connected to a resistive load.
Single-Phase Transformers
Unit 7
UNIT OBJECTIVE
DISCUSSION OF
FUNDAMENTALS

Unit 7 – Single-Phase Transformers Discussion of Fundamentals
238 © Festo Didactic 584079
When mutual inductance exists between two coils or windings, a change in current in one coil induces a voltage in the other. Also, when the primary winding of a transformer is connected to an ac power source, it receives electrical energy from the source and couples the energy to the secondary winding by means of a changing magnetic flux. This energy appears as an electromotive force (a voltage) across the secondary winding, and when a load is connected to the secondary, the energy is transferred to the load. This process of magnetic coupling allows electrical energy to be transferred from one circuit to another without any physical connection between the two, therefore providing electrical isolation between them. Because transformers allow power at one voltage and current level to be converted into equivalent power at some other voltage and current level, they are indispensable in ac power distribution systems.
Because alternating current flows in the windings of a transformer, an alternating magnetic field is created in the iron core. Active power is dissipated in the transformer because of copper loss and iron loss, and the transformer heats up. The resistance of the wire used in the winding causes the copper loss, and the iron loss results from eddy currents and hysteresis, the property of magnetic materials causing resistance to changes in magnetization.
Despite the copper and iron losses, transformers are among the most efficient electrical devices that exist, and the apparent power at the primary is frequently considered equal to the apparent power at the secondary. The voltage at the secondary, however, usually varies with changes in the load, from a given value at no load to a lesser value when the secondary is fully loaded. The amount of variation in secondary voltage as the load applied to the secondary changes is called transformer regulation and depends on the type of load (resistive, inductive, or capacitive) connected to the secondary. As will be seen in this unit, the secondary voltage can even rise above its rated value instead of decreasing.
© Festo Didactic 584079 239
When you have completed this exercise, you will be familiar with voltage and current characteristics of a single-phase transformer, and able to use the transformer turns ratio to predict the voltage and current that will flow in the secondary winding.
The windings of a standard single-phase transformer are called the primary winding and the secondary winding, as shown in Figure 7-1 of the Unit Discussion. The primary winding is the power input winding and this is the side that is connected to the ac power source. The secondary winding is connected to the load and is physically and electrically isolated from the primary. The voltage and current that flow in the secondary are related to the primary voltage and current by the transformer turns ratio ⁄ (or ⁄ ) through a very simple relationship. The ratio of primary voltage to secondary voltage equals ⁄ , while the ratio of primary to secondary current is equal to the inverse of the turns ratio, ⁄ . This results in the following:
which gives:
and
which gives:
Transformers are designed with fixed ratios between primary and secondary voltages, and are widely used to step-up (increase) or step-down (decrease) load voltages and currents. The Single-Phase Transformer module used in these exercises has its nominal ratings silk-screened on the front panel, and most transformers have markings to indicate their nominal characteristics. Also, many transformers have intermediate taps, or connection terminals on the secondary side, so that different voltage ratios can be obtained using a single transformer.
Voltage and Current Ratios
Exercise 7-1
EXERCISE OBJECTIVE
DISCUSSION
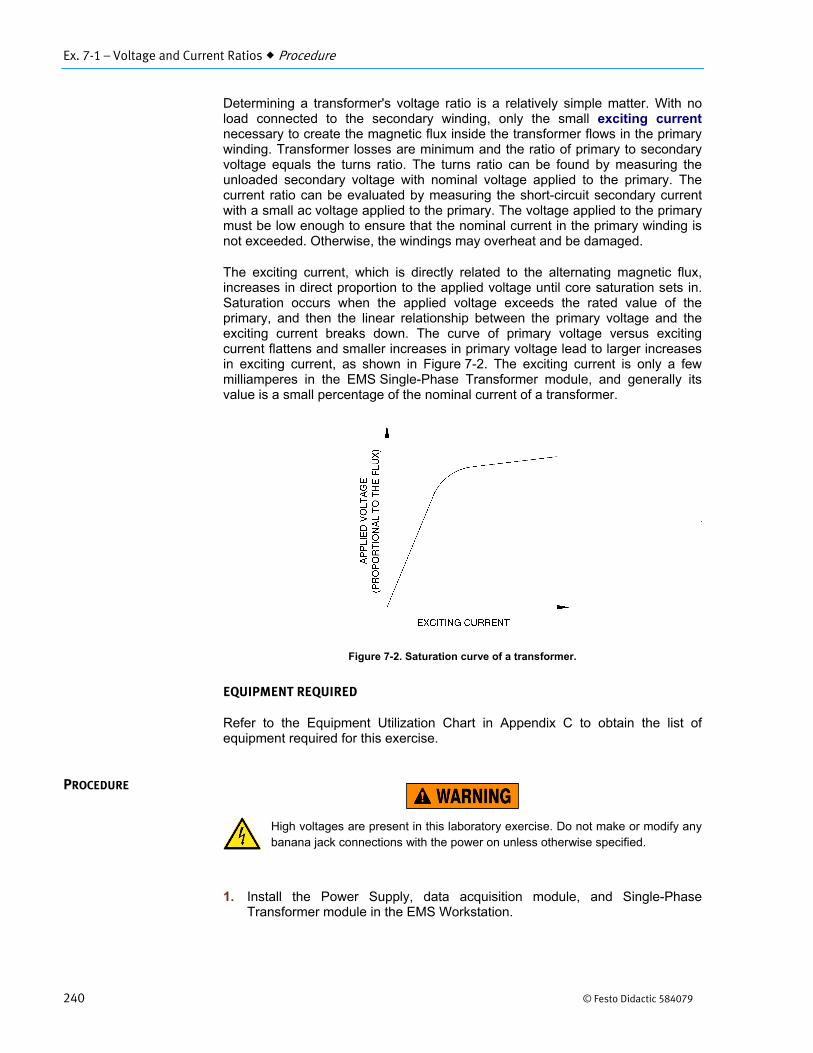
Ex. 7-1 – Voltage and Current Ratios Procedure
240 © Festo Didactic 584079
Determining a transformer's voltage ratio is a relatively simple matter. With no load connected to the secondary winding, only the small exciting current necessary to create the magnetic flux inside the transformer flows in the primary winding. Transformer losses are minimum and the ratio of primary to secondary voltage equals the turns ratio. The turns ratio can be found by measuring the unloaded secondary voltage with nominal voltage applied to the primary. The current ratio can be evaluated by measuring the short-circuit secondary current with a small ac voltage applied to the primary. The voltage applied to the primary must be low enough to ensure that the nominal current in the primary winding is not exceeded. Otherwise, the windings may overheat and be damaged.
The exciting current, which is directly related to the alternating magnetic flux, increases in direct proportion to the applied voltage until core saturation sets in. Saturation occurs when the applied voltage exceeds the rated value of the primary, and then the linear relationship between the primary voltage and the exciting current breaks down. The curve of primary voltage versus exciting current flattens and smaller increases in primary voltage lead to larger increases in exciting current, as shown in Figure 7-2. The exciting current is only a few milliamperes in the EMS Single-Phase Transformer module, and generally its value is a small percentage of the nominal current of a transformer.
Figure 7-2. Saturation curve of a transformer.
EQUIPMENT REQUIRED
Refer to the Equipment Utilization Chart in Appendix C to obtain the list of equipment required for this exercise.
High voltages are present in this laboratory exercise. Do not make or modify anybanana jack connections with the power on unless otherwise specified.
1. Install the Power Supply, data acquisition module, and Single-PhaseTransformer module in the EMS Workstation.
PROCEDURE
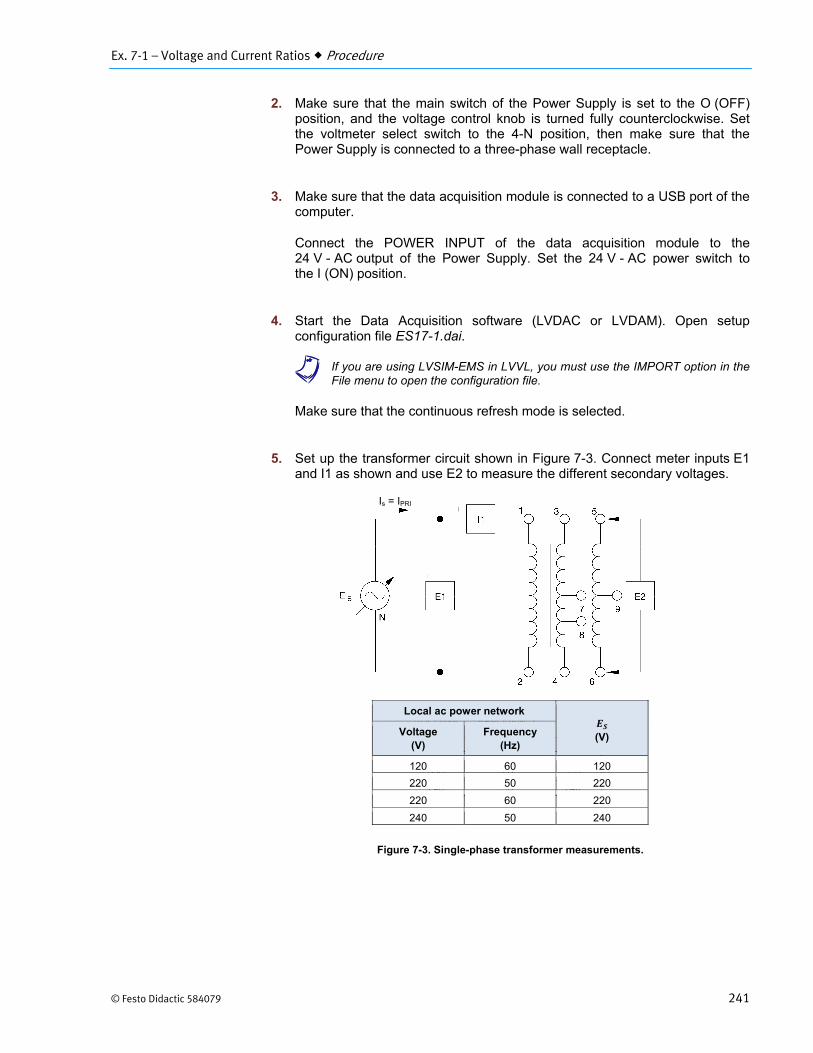
Ex. 7-1 – Voltage and Current Ratios Procedure
© Festo Didactic 584079 241
2. Make sure that the main switch of the Power Supply is set to the O (OFF)position, and the voltage control knob is turned fully counterclockwise. Setthe voltmeter select switch to the 4-N position, then make sure that thePower Supply is connected to a three-phase wall receptacle.
3. Make sure that the data acquisition module is connected to a USB port of thecomputer.
Connect the POWER INPUT of the data acquisition module to the24 V - AC output of the Power Supply. Set the 24 V - AC power switch tothe I (ON) position.
4. Start the Data Acquisition software (LVDAC or LVDAM). Open setupconfiguration file ES17-1.dai.
a If you are using LVSIM-EMS in LVVL, you must use the IMPORT option in theFile menu to open the configuration file.
Make sure that the continuous refresh mode is selected.
5. Set up the transformer circuit shown in Figure 7-3. Connect meter inputs E1and I1 as shown and use E2 to measure the different secondary voltages.
Figure 7-3. Single-phase transformer measurements.
Local ac power network
(V) Voltage(V)
Frequency(Hz)
120 60 120
220 50 220
220 60 220
240 50 240
Is = IPRI
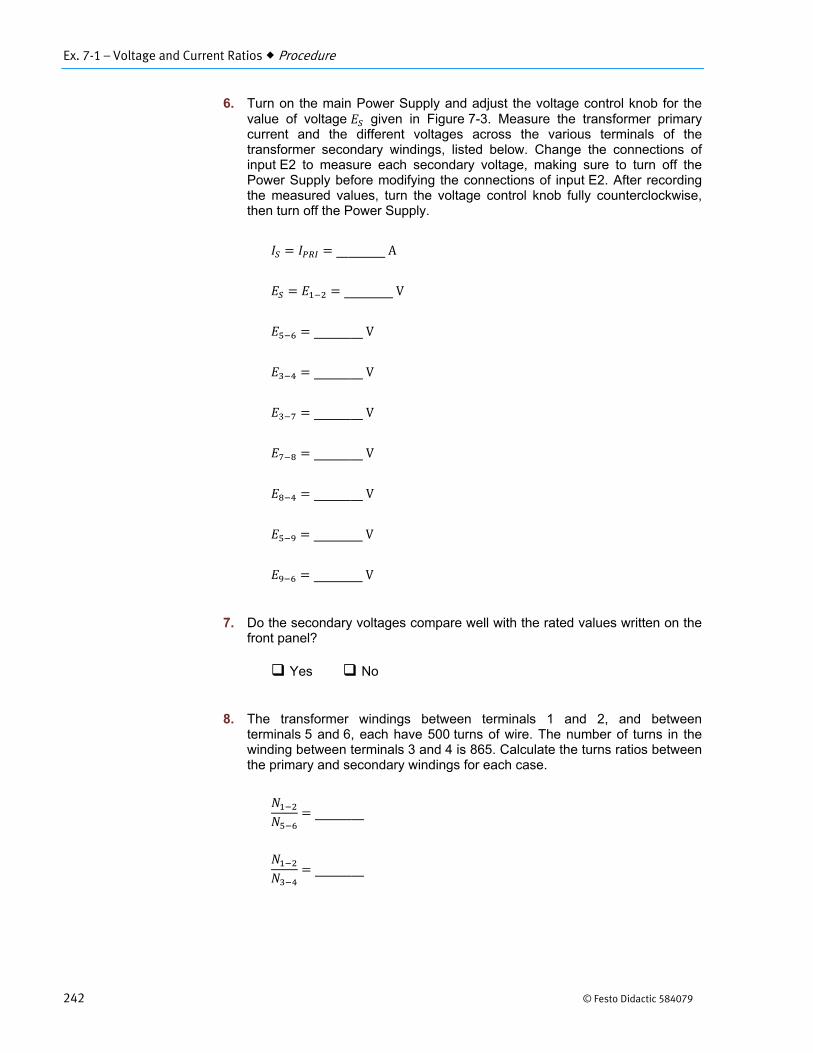
Ex. 7-1 – Voltage and Current Ratios Procedure
242 © Festo Didactic 584079
6. Turn on the main Power Supply and adjust the voltage control knob for thevalue of voltage given in Figure 7-3. Measure the transformer primarycurrent and the different voltages across the various terminals of thetransformer secondary windings, listed below. Change the connections ofinput E2 to measure each secondary voltage, making sure to turn off thePower Supply before modifying the connections of input E2. After recordingthe measured values, turn the voltage control knob fully counterclockwise,then turn off the Power Supply.
A
V
V
V
V
V
V
V
V
7. Do the secondary voltages compare well with the rated values written on thefront panel?
Yes No
8. The transformer windings between terminals 1 and 2, and betweenterminals 5 and 6, each have 500 turns of wire. The number of turns in thewinding between terminals 3 and 4 is 865. Calculate the turns ratios betweenthe primary and secondary windings for each case.
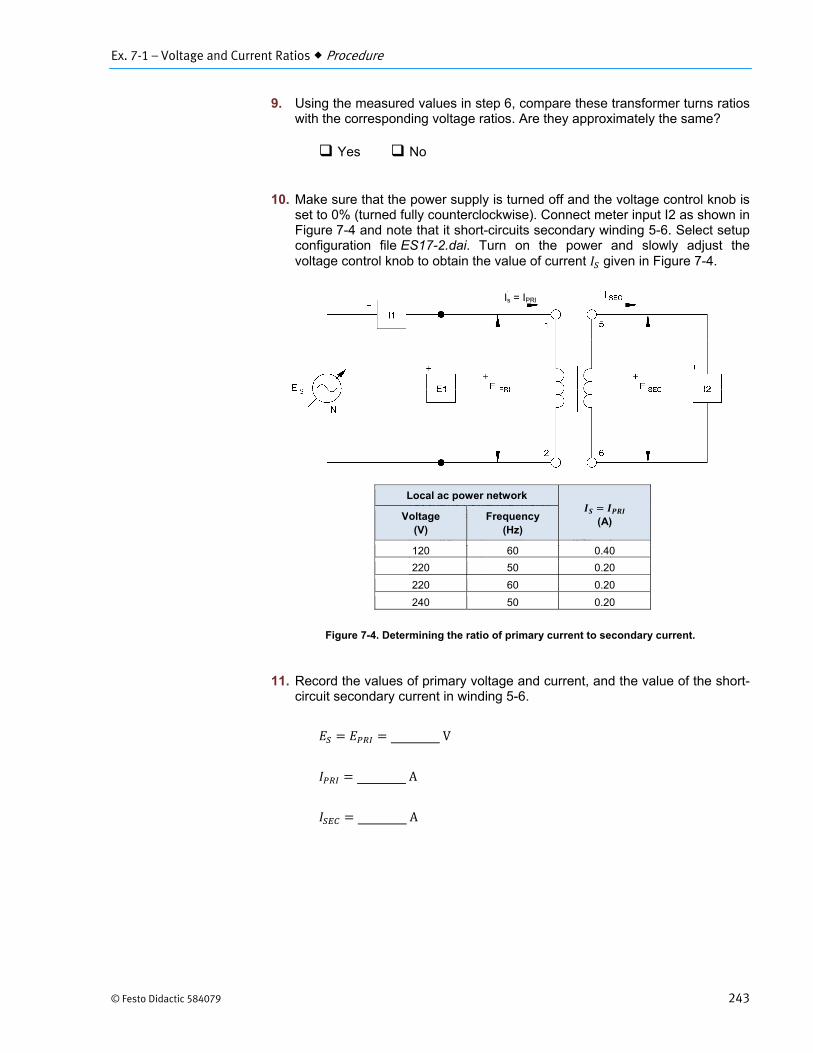
Ex. 7-1 – Voltage and Current Ratios Procedure
© Festo Didactic 584079 243
9. Using the measured values in step 6, compare these transformer turns ratioswith the corresponding voltage ratios. Are they approximately the same?
Yes No
10. Make sure that the power supply is turned off and the voltage control knob isset to 0% (turned fully counterclockwise). Connect meter input I2 as shown inFigure 7-4 and note that it short-circuits secondary winding 5-6. Select setupconfiguration file ES17-2.dai. Turn on the power and slowly adjust thevoltage control knob to obtain the value of current given in Figure 7-4.
Figure 7-4. Determining the ratio of primary current to secondary current.
11. Record the values of primary voltage and current, and the value of the short-circuit secondary current in winding 5-6.
V
A
A
Local ac power network
(A) Voltage(V)
Frequency(Hz)
120 60 0.40
220 50 0.20
220 60 0.20
240 50 0.20
Is = IPRI
Ex. 7-1 – Voltage and Current Ratios Procedure
244 © Festo Didactic 584079
12. Return the voltage control knob to zero and turn off the Power Supply.Calculate the ratio of primary current to secondary current.
13. Is the ratio approximately equal to ⁄ [ ⁄ ]?
Yes No
14. Connect meter input I2 so that it now short-circuits secondary terminals 3-4.Turn on the Power Supply and slowly adjust the voltage control knob for thesame value of primary current used in step 10. Once again, record thevalues of primary voltage and current, and the secondary winding current.
V
A
A
15. Return the voltage control knob to zero and turn off the Power Supply. Again,calculate the ratio of primary current to secondary current. Is it equalto ⁄ [ ⁄ ]?
Yes No
16. Set up the transformer circuit shown in Figure 7-5. It will be used to showhow exciting current is affected when the transformer core becomessaturated. Since the exciting current is so small, the correspondingvoltage across a sense resistor ( ) will be used to illustrate its variation.Connect the transformer primary terminals to Power Supply terminals 4and 5 through sense resistor . Connect meter inputs E1, E2, and E3 tomeasure the transformer voltages, , , and , respectively. Connectmeter input I1 to measure the primary current, .
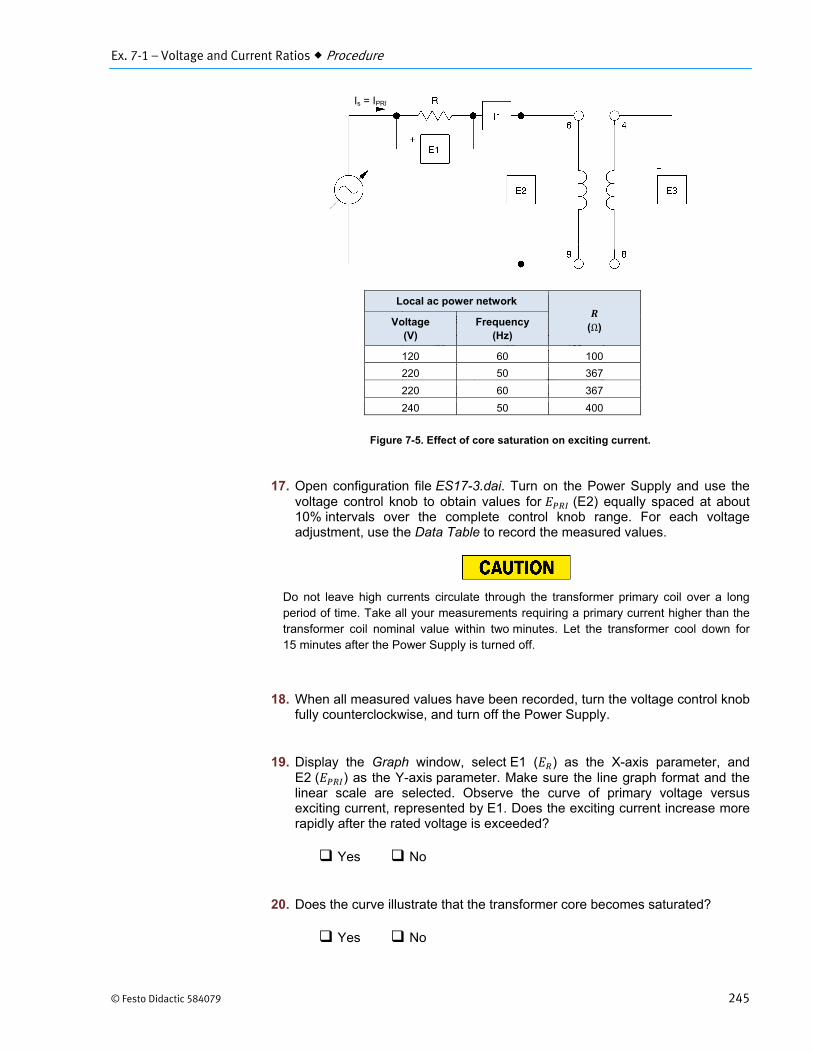
Ex. 7-1 – Voltage and Current Ratios Procedure
© Festo Didactic 584079 245
Figure 7-5. Effect of core saturation on exciting current.
17. Open configuration file ES17-3.dai. Turn on the Power Supply and use thevoltage control knob to obtain values for (E2) equally spaced at about10% intervals over the complete control knob range. For each voltageadjustment, use the Data Table to record the measured values.
Do not leave high currents circulate through the transformer primary coil over a long period of time. Take all your measurements requiring a primary current higher than thetransformer coil nominal value within two minutes. Let the transformer cool down for 15 minutes after the Power Supply is turned off.
18. When all measured values have been recorded, turn the voltage control knobfully counterclockwise, and turn off the Power Supply.
19. Display the Graph window, select E1 ( ) as the X-axis parameter, andE2 ( ) as the Y-axis parameter. Make sure the line graph format and thelinear scale are selected. Observe the curve of primary voltage versusexciting current, represented by E1. Does the exciting current increase morerapidly after the rated voltage is exceeded?
Yes No
20. Does the curve illustrate that the transformer core becomes saturated?
Yes No
Local ac power network
(Ω) Voltage(V)
Frequency(Hz)
120 60 100
220 50 367
220 60 367
240 50 400
Is = IPRI

Ex. 7-1 – Voltage and Current Ratios Procedure
246 © Festo Didactic 584079
21. Review the measured data to determine how the primary-to-secondaryvoltage ratio was affected when the transformer core became saturated.
22. Ensure that the Power Supply is turned off, and that the voltage control knobis turned fully counterclockwise. Remove all leads and cables.
Ex. 7-1 – Voltage and Current Ratios Conclusion
© Festo Didactic 584079 247
In this exercise, you measured the primary and secondary voltages in a single-phase transformer and confirmed that the ratio of primary-to-secondary voltage equals the transformer turns ratio ⁄ . Measurements of primary and secondary currents showed that the ratio of currents was equal to the inverse of the turns ratio. You also observed the phenomenon of core saturation, and saw that transformer saturation did not affect the voltage ratio.
1. The turns ratio for a transformer with 225 turns of wire in its primary windingand 675 turns in the secondary is
a. 1:3b. 3:1c. ⁄d. ⁄
2. The short-circuit secondary current in a transformer is 5 A. What is theprimary current if the transformer turns ratio is 1:4?
a. 20 Ab. 1.25 Ac. 2.0 Ad. 0.8 A
3. Transformer saturation occurs when the
a. primary current is greater than the rated value.b. secondary winding is short-circuited.c. secondary voltage is lower than the rated value.d. primary voltage is greater than the rated value.
4. When 200 V is applied to the primary winding of a step-up transformer thatdoubles the primary voltage, how much current will flow in a 100-Ω loadresistor connected across the secondary winding?
a. 1 Ab. 2 Ac. 3 Ad. 4 A
5. Why is it necessary to apply a low voltage to the primary winding instead ofthe rated voltage when evaluating the current ratio of a transformer?
a. To ensure that rated current will flow in the secondary.b. To ensure that the current rating of the primary is not
exceeded.c. To ensure that the voltage rating of the secondary is
respected.d. To ensure that exciting current is maximum.
CONCLUSION
REVIEW QUESTIONS

© Festo Didactic 584079 249
When you have completed this exercise, you will be able to determine and use transformer polarities to properly connect separate windings so that the voltages add (series-aiding) or subtract (series-opposing).
When the primary winding of a transformer is energized by an ac source, an alternating magnetic flux is established in the iron core. This alternating flux links, or couples, the turns of each winding on the transformer and induces ac voltages in the windings. Polarity might seem to be of minor importance for transformers since they are ac devices. However, when two or more windings are connected together, their relative instantaneous polarities have a significant effect on the resulting net voltage. If the voltage in one winding is at its maximum positive peak when the voltage in another winding is at its maximum negative peak, that is, they are 180° out of phase, they will oppose each other and the resulting voltage will be the difference between the two. For this reason, standards have been adopted for marking the polarity of transformer leads. In North American standards, the high-voltage leads are identified H1 and H2, and low voltage leads are marked X1 and X2. When H1 is instantaneously positive, X1 is also instantaneously positive. This system of marking allows transformers to be properly connected so that winding voltages will add or subtract as desired. Other types of markings are also used to identify the polarity of transformers, and transformer terminals could be marked with dots, crosses, numerals, or other convenient symbols. In Figure 7-6, dots have been used in the schematic drawing of a transformer and its windings.
Figure 7-6. Transformer polarity markings.
Transformer Polarity
Exercise 7-2
EXERCISE OBJECTIVE
DISCUSSION
Ex. 7-2 – Transformer Polarity Discussion
250 © Festo Didactic 584079
When we speak of the polarity of transformer windings, we are identifying all terminals that have the same polarity, either negative or positive, at any instant in time. The dots used in Figure 7-6 indicate that at a given instant in time, when terminal 1 is positive with respect to terminal 2, then
terminal 3 is positive with respect to terminal 4;
terminal 6 is positive with respect to terminal 5;
terminal 7 is positive with respect to terminal 8;
terminal 10 is positive with respect to terminal 9.
Note that a terminal cannot be positive by itself, it can only be positive with respect to another terminal. Therefore, terminals 1, 3, 6, 7 and 10 are all positive with respect to terminals 2, 4, 5, 8 and 9 at any given instant in time.
When two dc cells or batteries are connected in series to obtain a higher output voltage, the positive terminal of one battery must be connected to the negative terminal of the other. In the same manner, if two transformer windings are to be connected in series so that their voltages add, the marked terminal of one of the windings must be connected to the unmarked terminal of the other winding. Conversely, if two transformer windings are to be connected in series so that their voltages subtract, the marked terminal of one of the windings must be connected to the marked terminal of the other winding.
It is also very important to respect polarities when connecting transformer windings having the same nominal voltage in parallel to share the current supplied to a load. Connecting transformer windings in parallel with opposite polarities will cause a large current to flow in the windings. An exercise in the next unit of this manual deals with parallel connections of transformers.
There are two methods for determining the polarity of a transformer, one using a dc source, the other an ac source. In the dc method, a dc voltmeter is connected across the secondary winding and a small dc voltage is applied to the primary. The direction in which the voltmeter pointer temporarily deflects when power is turned on will indicate the polarity of the secondary winding. The pointer will temporarily deflect to the right if the secondary winding terminal to which the voltmeter positive probe is connected has the same polarity as the primary winding terminal to which the positive side of the source is connected. If it deflects to the left, the primary and secondary terminals have opposite polarities. With the ac source method, an ac voltage is connected to the primary winding which is temporarily connected in series with the secondary. The voltage across the series combination will be less than the applied voltage if the two terminals that are interconnected have the same polarity. If the voltage is greater, the interconnected terminals have opposite polarities. Figure 7-7 illustrates both methods of determining transformer polarity.
Ex. 7-2 – Transformer Polarity Procedure
© Festo Didactic 584079 251
Figure 7-7. Methods for determining transformer polarity.
EQUIPMENT REQUIRED
Refer to the Equipment Utilization Chart in Appendix C to obtain the list of equipment required for this exercise.
High voltages are present in this laboratory exercise. Do not make or modify anybanana jack connections with the power on unless otherwise specified.
1. Install the Power Supply, data acquisition module, and Single-PhaseTransformer module in the EMS Workstation.
2. Make sure that the main switch of the Power Supply is set to the O (OFF)position, and the voltage control knob is turned fully counterclockwise. Setthe voltmeter select switch to the 4-N position, then make sure that thePower Supply is connected to a three-phase wall receptacle.
3. Make sure that the data acquisition module is connected to a USB port of thecomputer.
Connect the POWER INPUT of the data acquisition module to the24 V - AC output of the Power Supply. Set the 24 V - AC power switch tothe I (ON) position.
4. Start the Data Acquisition software (LVDAC or LVDAM). Open setupconfiguration file ES17-4.dai.
a If you are using LVSIM-EMS in LVVL, you must use the IMPORT option in theFile menu to open the configuration file.
Make sure that the continuous refresh mode is selected.
PROCEDURE
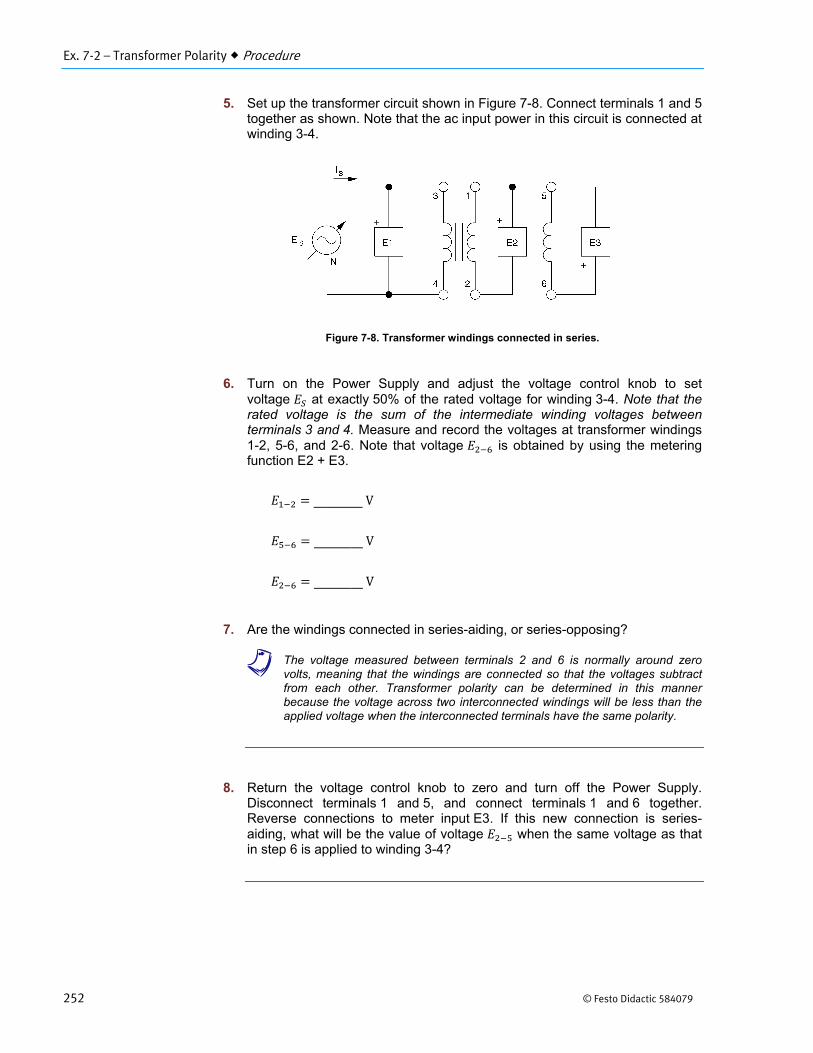
Ex. 7-2 – Transformer Polarity Procedure
252 © Festo Didactic 584079
5. Set up the transformer circuit shown in Figure 7-8. Connect terminals 1 and 5together as shown. Note that the ac input power in this circuit is connected atwinding 3-4.
Figure 7-8. Transformer windings connected in series.
6. Turn on the Power Supply and adjust the voltage control knob to setvoltage at exactly 50% of the rated voltage for winding 3-4. Note that therated voltage is the sum of the intermediate winding voltages betweenterminals 3 and 4. Measure and record the voltages at transformer windings1-2, 5-6, and 2-6. Note that voltage is obtained by using the meteringfunction E2 + E3.
V
V
V
7. Are the windings connected in series-aiding, or series-opposing?
a The voltage measured between terminals 2 and 6 is normally around zerovolts, meaning that the windings are connected so that the voltages subtractfrom each other. Transformer polarity can be determined in this mannerbecause the voltage across two interconnected windings will be less than theapplied voltage when the interconnected terminals have the same polarity.
8. Return the voltage control knob to zero and turn off the Power Supply.Disconnect terminals 1 and 5, and connect terminals 1 and 6 together.Reverse connections to meter input E3. If this new connection is series-aiding, what will be the value of voltage when the same voltage as thatin step 6 is applied to winding 3-4?
Ex. 7-2 – Transformer Polarity Procedure
© Festo Didactic 584079 253
9. Open configuration file ES17-5.dai. Turn on the Power Supply and onceagain set voltage at exactly 50% of the rated voltage for winding 3-4.Measure and record the voltages at transformer windings 1-2, 5-6, and 2-5indicated on the meters. Note that voltage is obtained by using themetering function E2 + E3.
V
V
V
10. Is the value obtained for voltage the same as predicted in step 8?
Yes No
11. Return the voltage control knob to zero, turn off the Power Supply andremove the connection between terminals 1 and 6. What are the twovoltages which can be obtained across the series combination ofwindings 3-4 and 1-2 when the same voltage as that in step 9 is applied towinding 3-4?
12. Connect terminals 1 and 4 together, turn on the Power Supply and setvoltage at exactly 50% of the rated voltage for winding 3-4. Openconfiguration file ES17-6.dai. Measure and record the voltages at transformerwindings 1-2, and 2-3, using the meters.
V
V
13. Return the voltage control knob to zero and turn off the Power Supply.Disconnect terminals 1 and 4, and connect terminals 1 and 3 together.
Interchange the connections at input E2 of the data acquisition module.
14. Turn on the Power Supply and set voltage at exactly 50% of the ratedvoltage for winding 3-4. Open configuration file ES17-7.dai. Measure andrecord the voltage at transformer winding 2-4.
V

Ex. 7-2 – Transformer Polarity Procedure
254 © Festo Didactic 584079
15. How do the results of steps 12 and 14 compare with the predictions instep 11?
16. Which sets of terminals have the same polarity, 1 and 3, 2 and 4, 1 and 4, or2 and 3?
17. Ensure that the Power Supply is turned off, and that the voltage control knobis turned fully counterclockwise. Remove all leads and cables.

Ex. 7-2 – Transformer Polarity Conclusion
© Festo Didactic 584079 255
In this exercise, you determined transformer polarity using the ac voltage method. When connecting transformer windings in series, you observed that the winding voltages subtract when winding terminals of the same polarity are connected together. Conversely, you observed that the winding voltages add when winding terminals of opposite polarities are connected together. This is similar to connecting batteries in series to obtain higher voltages.
1. Can different transformer windings be connected together for higher voltagesif the terminals are not marked?
a. Yes, but the polarity must be determined experimentallybeforehand.
b. No.c. Only if the windings are on the primary side of the
transformer.d. Only if the current is less than 1 A.
2. Two of four secondary terminals on a transformer are marked with a cross. Ifthese two terminals are connected together, the secondary windings are
a. connected in series-opposing.b. connected in series-aiding.c. connected to increase the resulting voltage.d. both b and c.
3. Is it possible for a voltmeter connected across the secondary windings of atransformer with three windings having nominal voltages of 50 V, 125 V, and75 V to measure zero volts, even though rated voltage is applied to theprimary winding?
a. No, there must be something wrong with the voltmeter.b. Yes, if the 50-V and 75-V windings are connected to
oppose the 125-V winding.c. Yes, if the 50-V and 75-V windings are connected to aid the
125-V winding.d. No, the transformer must be damaged.
4. Two methods of determining the polarity of transformer windings are
a. the resistive method and the inductive method.b. the series-opposing method and the series-aiding method.c. the dc method and the ac method.d. the experimental method and the theoretical method.
5. To properly connect transformer windings for higher voltage, it is necessary
a. to know their ratings.b. to know the maximum winding current.c. to know the type of core material.d. to know the polarity of the windings.
CONCLUSION
REVIEW QUESTIONS

© Festo Didactic 584079 257
When you have completed this exercise, you will be able to determine the voltage regulation of a transformer with varying loads, and discuss capacitive and inductive loading on transformer regulation. Voltage and current measurements will be used to produce load regulation curves.
The load on a large power transformer in a sub-station will vary from a very small value in the early hours of the morning to a very high value during the heavy peaks of maximum industrial and commercial activity. The transformer secondary voltage will vary somewhat with the load, and because motors, incandescent lamps, and heating devices are all quite sensitive to voltage changes, transformer regulation is of considerable importance. The secondary voltage also depends upon whether the power factor of the load is leading, lagging, or unity. Therefore, it should be known how the transformer will behave (its voltage regulation) when connected to a capacitive, an inductive, or a resistive load. Transformer voltage regulation in percent is determined with the following formula:
Voltage regulation % 100
where is the no-load secondary voltage.
is the full-load secondary voltage.
The result (a percentage value) obtained gives an indication of transformer behavior under load. The smaller the voltage regulation percentage, the smaller the secondary voltage variation with load, and the better the voltage regulation. Note that is measured with the secondary winding open while is measured when nominal current flows in the secondary winding.
Several factors affect a transformer's operation. The resistance and inductive reactance of its windings cause internal voltage drops that vary with the amount of current flowing in the windings. If the secondary is lightly loaded, current through the winding resistance and reactance is small and the internal voltage drops are not significant. As the load increases, current and internal voltage drops also increase. If a transformer were perfectly ideal, its windings would have neither resistance nor inductive reactance to cause voltage drops. Such a transformer would have perfect regulation under all load conditions and the secondary voltage would remain absolutely constant. But practical transformer coils are made of real wire, and thereby, have resistance and inductive reactance. Therefore, the primary and secondary windings have an overall resistance , and an overall reactance . The simplified equivalent circuit of a practical transformer with a 1:1 turns ratio can be approximated by the circuit shown in Figure 7-9. The actual transformer terminals are , on the primary side, and , on the secondary side.
Transformer Regulation
Exercise 7-3
EXERCISE OBJECTIVE
DISCUSSION
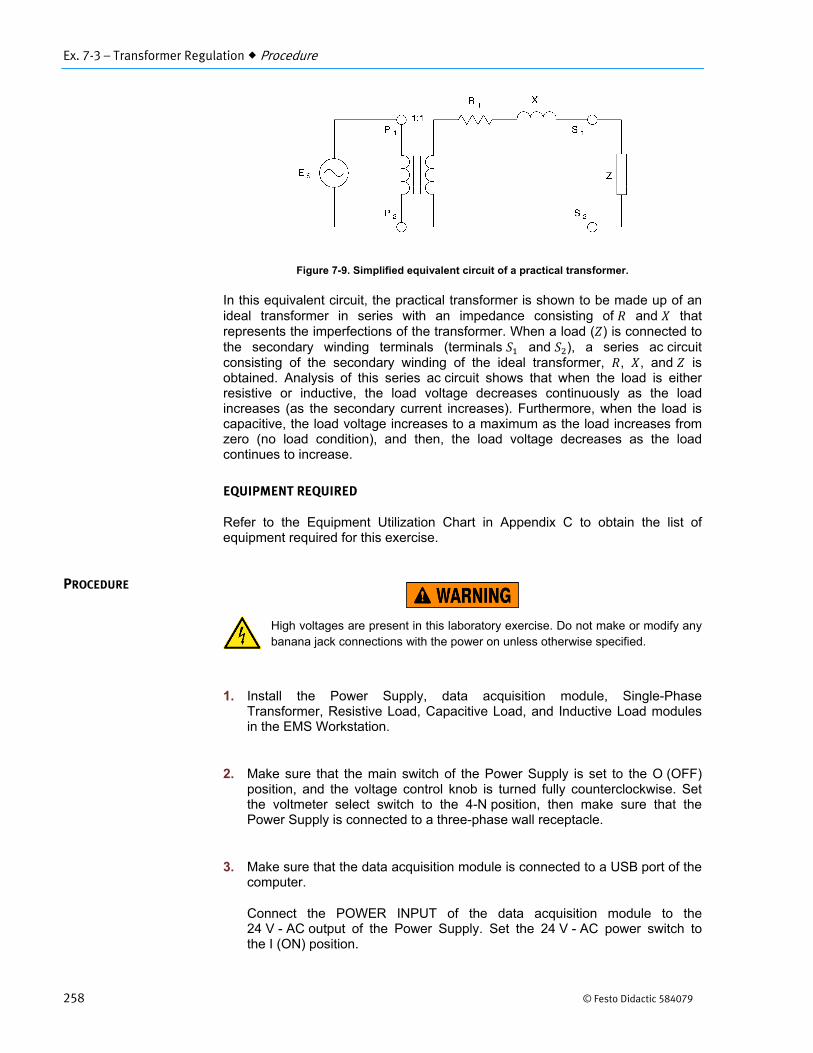
Ex. 7-3 – Transformer Regulation Procedure
258 © Festo Didactic 584079
Figure 7-9. Simplified equivalent circuit of a practical transformer.
In this equivalent circuit, the practical transformer is shown to be made up of an ideal transformer in series with an impedance consisting of and that represents the imperfections of the transformer. When a load ( ) is connected to the secondary winding terminals (terminals and ), a series ac circuit consisting of the secondary winding of the ideal transformer, , , and is obtained. Analysis of this series ac circuit shows that when the load is either resistive or inductive, the load voltage decreases continuously as the load increases (as the secondary current increases). Furthermore, when the load is capacitive, the load voltage increases to a maximum as the load increases from zero (no load condition), and then, the load voltage decreases as the load continues to increase.
EQUIPMENT REQUIRED
Refer to the Equipment Utilization Chart in Appendix C to obtain the list of equipment required for this exercise.
High voltages are present in this laboratory exercise. Do not make or modify anybanana jack connections with the power on unless otherwise specified.
1. Install the Power Supply, data acquisition module, Single-PhaseTransformer, Resistive Load, Capacitive Load, and Inductive Load modulesin the EMS Workstation.
2. Make sure that the main switch of the Power Supply is set to the O (OFF)position, and the voltage control knob is turned fully counterclockwise. Setthe voltmeter select switch to the 4-N position, then make sure that thePower Supply is connected to a three-phase wall receptacle.
3. Make sure that the data acquisition module is connected to a USB port of thecomputer.
Connect the POWER INPUT of the data acquisition module to the24 V - AC output of the Power Supply. Set the 24 V - AC power switch tothe I (ON) position.
PROCEDURE
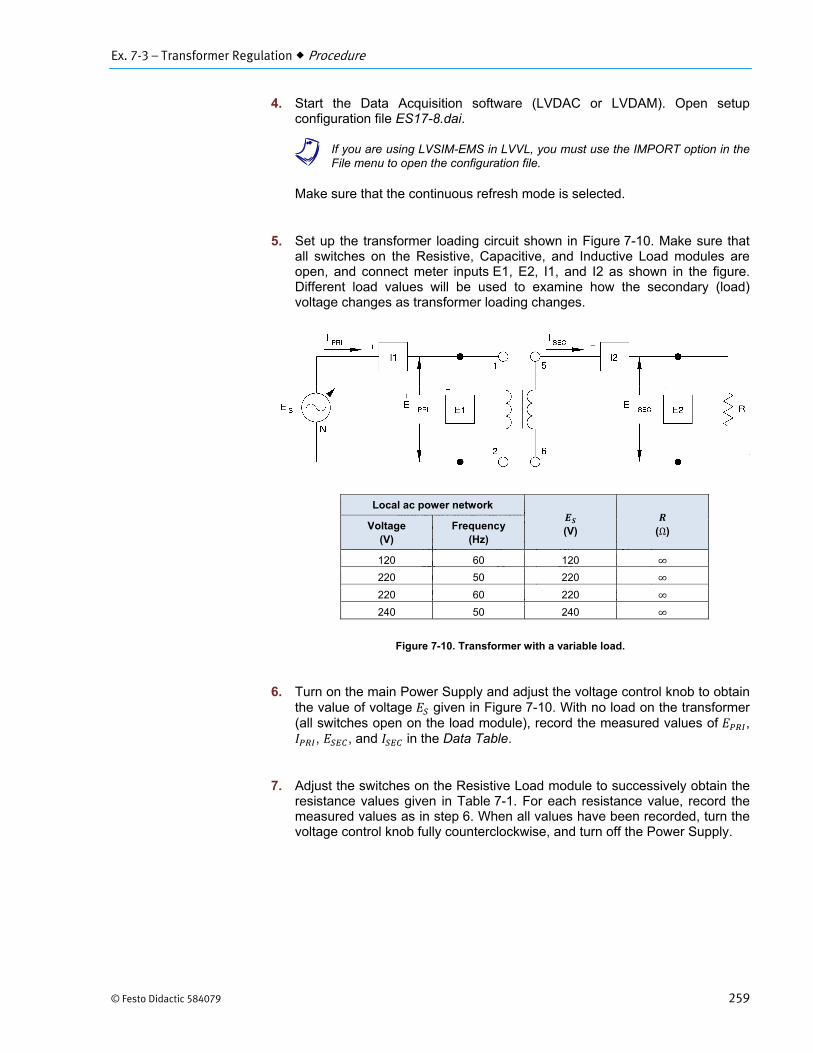
Ex. 7-3 – Transformer Regulation Procedure
© Festo Didactic 584079 259
4. Start the Data Acquisition software (LVDAC or LVDAM). Open setupconfiguration file ES17-8.dai.
a If you are using LVSIM-EMS in LVVL, you must use the IMPORT option in theFile menu to open the configuration file.
Make sure that the continuous refresh mode is selected.
5. Set up the transformer loading circuit shown in Figure 7-10. Make sure thatall switches on the Resistive, Capacitive, and Inductive Load modules areopen, and connect meter inputs E1, E2, I1, and I2 as shown in the figure.Different load values will be used to examine how the secondary (load)voltage changes as transformer loading changes.
Figure 7-10. Transformer with a variable load.
6. Turn on the main Power Supply and adjust the voltage control knob to obtainthe value of voltage given in Figure 7-10. With no load on the transformer(all switches open on the load module), record the measured values of ,
, , and in the Data Table.
7. Adjust the switches on the Resistive Load module to successively obtain theresistance values given in Table 7-1. For each resistance value, record themeasured values as in step 6. When all values have been recorded, turn thevoltage control knob fully counterclockwise, and turn off the Power Supply.
Local ac power network
(V)
(Ω) Voltage(V)
Frequency(Hz)
120 60 120 ∞
220 50 220 ∞
220 60 220 ∞
240 50 240 ∞
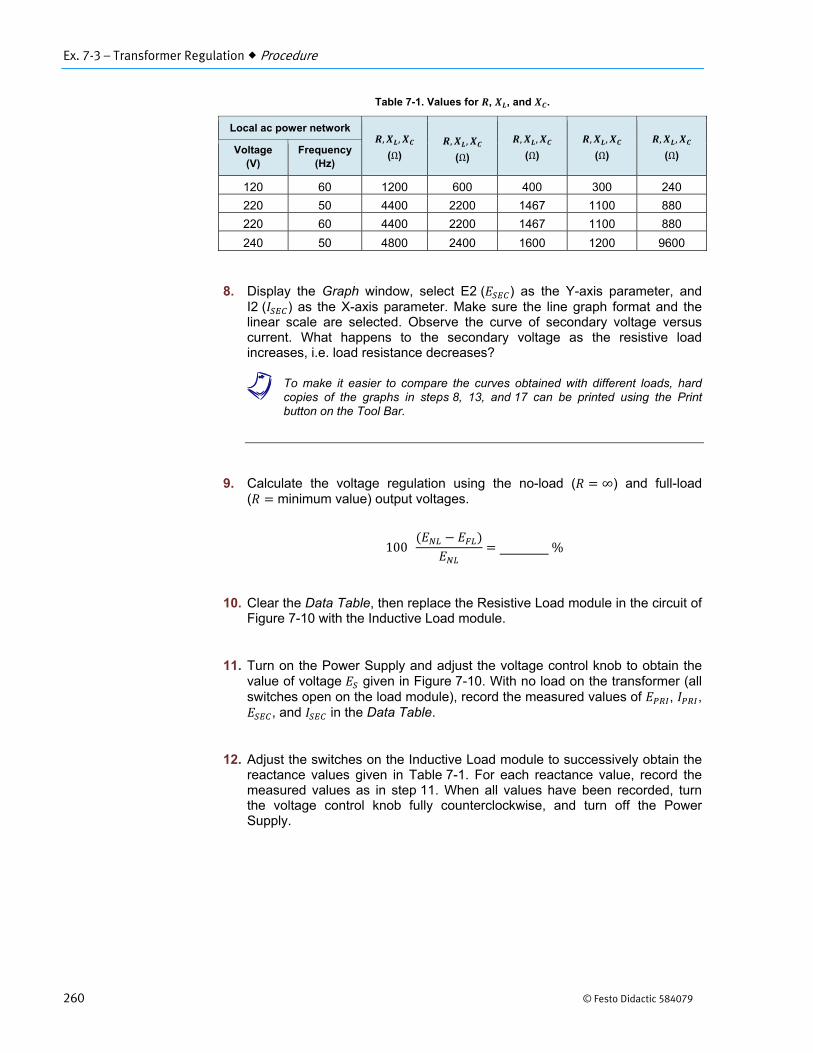
Ex. 7-3 – Transformer Regulation Procedure
260 © Festo Didactic 584079
Table 7-1. Values for , , and .
Local ac power network , ,
(Ω) , ,
(Ω)
, ,
(Ω)
, ,
(Ω)
, ,
(Ω) Voltage (V)
Frequency(Hz)
120 60 1200 600 400 300 240
220 50 4400 2200 1467 1100 880
220 60 4400 2200 1467 1100 880
240 50 4800 2400 1600 1200 9600
8. Display the Graph window, select E2 ( ) as the Y-axis parameter, andI2 ( ) as the X-axis parameter. Make sure the line graph format and thelinear scale are selected. Observe the curve of secondary voltage versuscurrent. What happens to the secondary voltage as the resistive loadincreases, i.e. load resistance decreases?
a To make it easier to compare the curves obtained with different loads, hardcopies of the graphs in steps 8, 13, and 17 can be printed using the Printbutton on the Tool Bar.
9. Calculate the voltage regulation using the no-load ( ∞) and full-load( minimum value) output voltages.
100 %
10. Clear the Data Table, then replace the Resistive Load module in the circuit ofFigure 7-10 with the Inductive Load module.
11. Turn on the Power Supply and adjust the voltage control knob to obtain thevalue of voltage given in Figure 7-10. With no load on the transformer (allswitches open on the load module), record the measured values of , ,
, and in the Data Table.
12. Adjust the switches on the Inductive Load module to successively obtain thereactance values given in Table 7-1. For each reactance value, record themeasured values as in step 11. When all values have been recorded, turnthe voltage control knob fully counterclockwise, and turn off the PowerSupply.

Ex. 7-3 – Transformer Regulation Procedure
© Festo Didactic 584079 261
13. Display the Graph window, select E2 ( ) as the Y-axis parameter, andI2 ( ) as the X-axis parameter. Make sure the line graph format and thelinear scale are selected. Observe the curve of secondary voltage versuscurrent. How does the secondary voltage vary as the inductive loadincreases?
14. Clear the Data Table, then replace the Inductive Load module in the circuitof Figure 7-10 with the Capacitive Load module.
15. Turn on the Power Supply and adjust the voltage control knob to obtain thevalue of voltage given in Figure 7-10. With no load on the transformer (allswitches open on the load module), record the measured values of , ,
, and in the Data Table.
16. Adjust the switches on the Capacitive Load module to successively obtainthe reactance values given in Table 7-1. For each reactance value, recordthe measured values as in step 15. When all values have been recorded,turn the voltage control knob fully counterclockwise, and turn off the PowerSupply.
17. Display the Graph window, select E2 ( ) as the Y-axis parameter,and I2 ( ) as the X-axis parameter. Make sure the line graph format andthe linear scale are selected. Observe the curve of secondary voltage versuscurrent. How does the secondary voltage vary as the capacitive loadincreases?
18. What differences do you observe between the three load curves?
19. Ensure that the Power Supply is turned off, and that the voltage control knobis turned fully counterclockwise. Remove all leads and cables.
Ex. 7-3 – Transformer Regulation Conclusion
262 © Festo Didactic 584079
In this exercise, you examined the voltage regulation of a transformer, and saw that the secondary voltage varied as the load placed on the transformer changed. Load variation curves for resistive, inductive, and capacitive loads were plotted. These curves showed that under resistive or inductive loading conditions, the secondary voltage decreases as the load increases, and that under capacitive loading conditions, the secondary voltage can rise above its nominal value. Also, inductive loading caused greater voltage drops than resistive loading, hence poorer regulation.
1. Transformer regulation can be determined with the formula
a. 100 ⁄b. 100 ⁄c. 100 ⁄d. 100 ⁄
2. What is the transformer regulation if the no-load and full-load voltages are100 V and 95 V respectively?
a. 105%b. 10.5%c. 95%d. 5%
3. The secondary voltage can rise above its rated value when the load is
a. resistive.b. capacitive.c. inductive.d. an RL series combination.
4. The voltage measured across the secondary winding of a transformer with noload connected is 150 V. This voltage drops to 147 V when the secondarycurrent is equal to the nominal full-load current. What is the transformerregulation?
a. 90%b. 3%c. 2%d. 6%
5. Transformer regulation
a. depends on the type of load connected at the secondary.b. is independent of the load connected at the secondary.c. can only be determined with no load on the secondary.d. depends on the voltage applied to the primary.
CONCLUSION
REVIEW QUESTIONS

Unit 7 – Single-Phase Transformers Unit Test
© Festo Didactic 584079 263
Unit Test
1. A transformer primary has 320 turns of wire and the secondary voltagemeasures 160 V when 40 V is applied to the primary. The voltage ratio istherefore
a. 1: 8b. 2: 1c. 1: 4d. 1: 2
2. The short-circuit secondary current in a transformer is 2 A. What is theprimary current if the transformer turns ratio is 2: 5?
a. 2 Ab. 5 Ac. 2.5 Ad. 0.8 A
3. When the primary voltage exceeds its rated value
a. transformer operation is enhanced.b. transformer operation suffers because of core saturation.c. by more than double, transformer operation improves.d. the primary current decreases.
4. To evaluate the current ratio of a transformer,
a. rated voltage must be applied to the primary.b. rated current must flow in the primary.c. a very low primary voltage must be applied.d. the primary must be short-circuited.
5. When unmarked transformer terminals are connected together, this usuallymeans that the windings are connected
a. in series-aiding.b. in series-opposing.c. to increase the resulting voltage.d. both a and c.
6. Voltage regulation of a transformer can be determined with the formula
a. 100 ⁄b. 100 ⁄c. 100 ⁄d. 100 ⁄

Unit 7 – Single-Phase Transformers Unit Test
264 © Festo Didactic 584079
7. What is the no-load voltage when the full-load secondary voltage is 108 Vand transformer regulation is 10%?
a. 98 Vb. 120 Vc. 12 Vd. 118.8 V
8. A capacitive load can cause the secondary voltage of a transformer to
a. rise above its rated value.b. steadily decrease with increasing load.c. steadily increase with decreasing load.d. none of the above.
9. What is the transformer regulation if the no-load and full-load voltages are2 kV and 1.95 kV, respectively?
a. 5%b. 2.5%c. 3.6%d. 0.25%
10. The type of load connected to the secondary of a transformer has
a. a small effect on transformer regulation.b. a significant effect on transformer regulation.c. no effect on transformer regulation.d. none of the above.
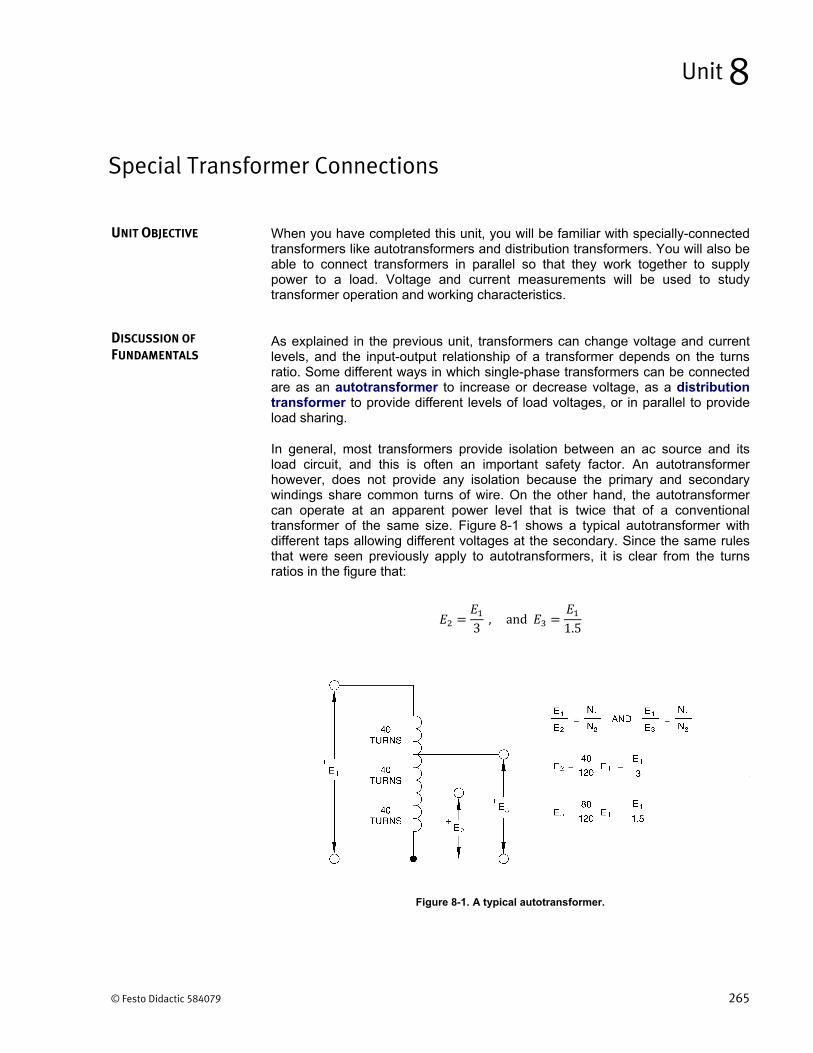
© Festo Didactic 584079 265
When you have completed this unit, you will be familiar with specially-connected transformers like autotransformers and distribution transformers. You will also be able to connect transformers in parallel so that they work together to supply power to a load. Voltage and current measurements will be used to study transformer operation and working characteristics.
As explained in the previous unit, transformers can change voltage and current levels, and the input-output relationship of a transformer depends on the turns ratio. Some different ways in which single-phase transformers can be connected are as an autotransformer to increase or decrease voltage, as a distribution transformer to provide different levels of load voltages, or in parallel to provide load sharing.
In general, most transformers provide isolation between an ac source and its load circuit, and this is often an important safety factor. An autotransformer however, does not provide any isolation because the primary and secondary windings share common turns of wire. On the other hand, the autotransformer can operate at an apparent power level that is twice that of a conventional transformer of the same size. Figure 8-1 shows a typical autotransformer with different taps allowing different voltages at the secondary. Since the same rules that were seen previously apply to autotransformers, it is clear from the turns ratios in the figure that:
3, and
1.5
Figure 8-1. A typical autotransformer.
Special Transformer Connections
Unit 8
UNIT OBJECTIVE
DISCUSSION OF
FUNDAMENTALS
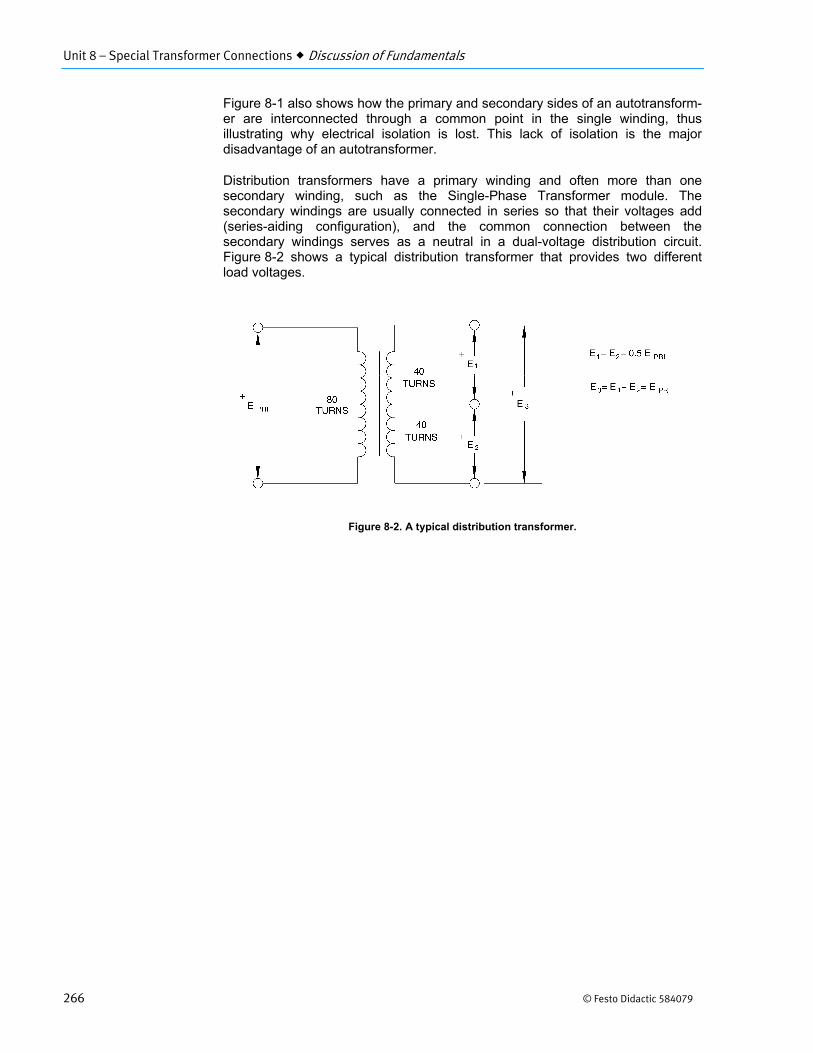
Unit 8 – Special Transformer Connections Discussion of Fundamentals
266 © Festo Didactic 584079
Figure 8-1 also shows how the primary and secondary sides of an autotransform-er are interconnected through a common point in the single winding, thus illustrating why electrical isolation is lost. This lack of isolation is the major disadvantage of an autotransformer.
Distribution transformers have a primary winding and often more than one secondary winding, such as the Single-Phase Transformer module. The secondary windings are usually connected in series so that their voltages add (series-aiding configuration), and the common connection between the secondary windings serves as a neutral in a dual-voltage distribution circuit. Figure 8-2 shows a typical distribution transformer that provides two different load voltages.
Figure 8-2. A typical distribution transformer.
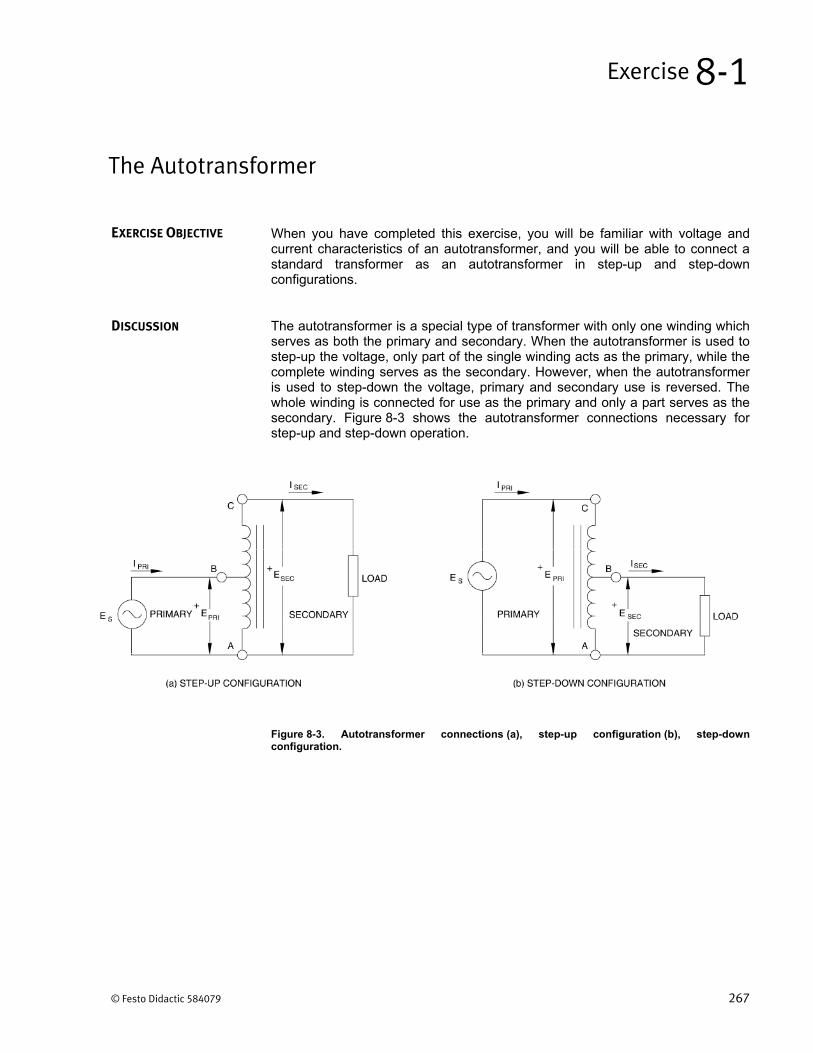
© Festo Didactic 584079 267
When you have completed this exercise, you will be familiar with voltage and current characteristics of an autotransformer, and you will be able to connect a standard transformer as an autotransformer in step-up and step-down configurations.
The autotransformer is a special type of transformer with only one winding which serves as both the primary and secondary. When the autotransformer is used to step-up the voltage, only part of the single winding acts as the primary, while the complete winding serves as the secondary. However, when the autotransformer is used to step-down the voltage, primary and secondary use is reversed. The whole winding is connected for use as the primary and only a part serves as the secondary. Figure 8-3 shows the autotransformer connections necessary for step-up and step-down operation.
Figure 8-3. Autotransformer connections (a), step-up configuration (b), step-down configuration.
The Autotransformer
Exercise 8-1
EXERCISE OBJECTIVE
DISCUSSION
Ex. 8-1 – The Autotransformer Discussion
268 © Festo Didactic 584079
Autotransformer operation is basically the same as a standard two-winding transformer. Power is transferred from the primary to the secondary by a changing magnetic flux. The amount of increase or decrease in the voltage depends on the turns ratio between the primary and the secondary. To determine the turns ratio of the autotransformer, each winding is considered as separate even though some turns are common to both the primary and the secondary. Voltages and currents can be found using two simple equations:
and
The first equation simply states that the apparent power on the primary side ( ) of the transformer equals the apparent power on the secondary side ( ). The second equation relates the primary and secondary voltages ( and ) with the turns ratio ( ⁄ ). Thus, from Figure 8-3 we obtain the following relationships:
for step up operation
and
for step down operation
These relationships are true when voltages and are in phase, and thus, add in the same direction.
The autotransformer has a great advantage over a conventional transformer: it can operate at an apparent power level that is twice that of a conventional transformer of the same size. Furthermore, the autotransformer is somewhat more efficient than transformers with separate windings because it has smaller copper and iron losses. It is used mainly when small increases or decreases are required in the secondary voltage. For example, to boost a power line voltage and compensate for losses caused by long transmission lines, or to reduce the starting voltage of a motor, thus holding down its starting current within reasonable values. One major disadvantage of an autotransformer is the lack of electrical isolation between the primary and secondary windings since the windings are not separate. Also, it is generally unadvisable to use an autotransformer as a large-ratio step-down device because the high-voltage primary voltage would be placed across the low-voltage load if the low-voltage section of the winding became defective and opened up.
Ex. 8-1 – The Autotransformer Procedure
© Festo Didactic 584079 269
EQUIPMENT REQUIRED
Refer to the Equipment Utilization Chart in Appendix C to obtain the list of equipment required for this exercise.
High voltages are present in this laboratory exercise. Do not make or modify anybanana jack connections with the power on unless otherwise specified.
1. Install the Power Supply, data acquisition module, Resistive Load, andSingle-Phase Transformer modules in the EMS Workstation.
2. Make sure that the main switch of the Power Supply is set to the O (OFF)position, and the voltage control knob is turned fully counterclockwise. Setthe voltmeter select switch to the 4-N position, then make sure that thePower Supply is connected to a three-phase wall receptacle.
3. Make sure that the data acquisition module is connected to a USB port of thecomputer.
Connect the POWER INPUT of the data acquisition module to the24 V - AC output of the Power Supply. Set the 24 V - AC power switch tothe I (ON) position.
4. Start the Data Acquisition software (LVDAC or LVDAM). Open setupconfiguration file ES18-1.dai.
a If you are using LVSIM-EMS in LVVL, you must use the IMPORT option in theFile menu to open the configuration file.
Make sure that the continuous refresh mode is selected.
5. Set up the autotransformer circuit shown in Figure 8-4. Connect meterinputs E1 and I1 as shown, and use meter inputs E2 and I2 to measure thesecondary voltage and current. Note that winding 5-6 is connected as theprimary, and that center-tap terminal 9 and terminal 6 act as the secondarywinding.
PROCEDURE
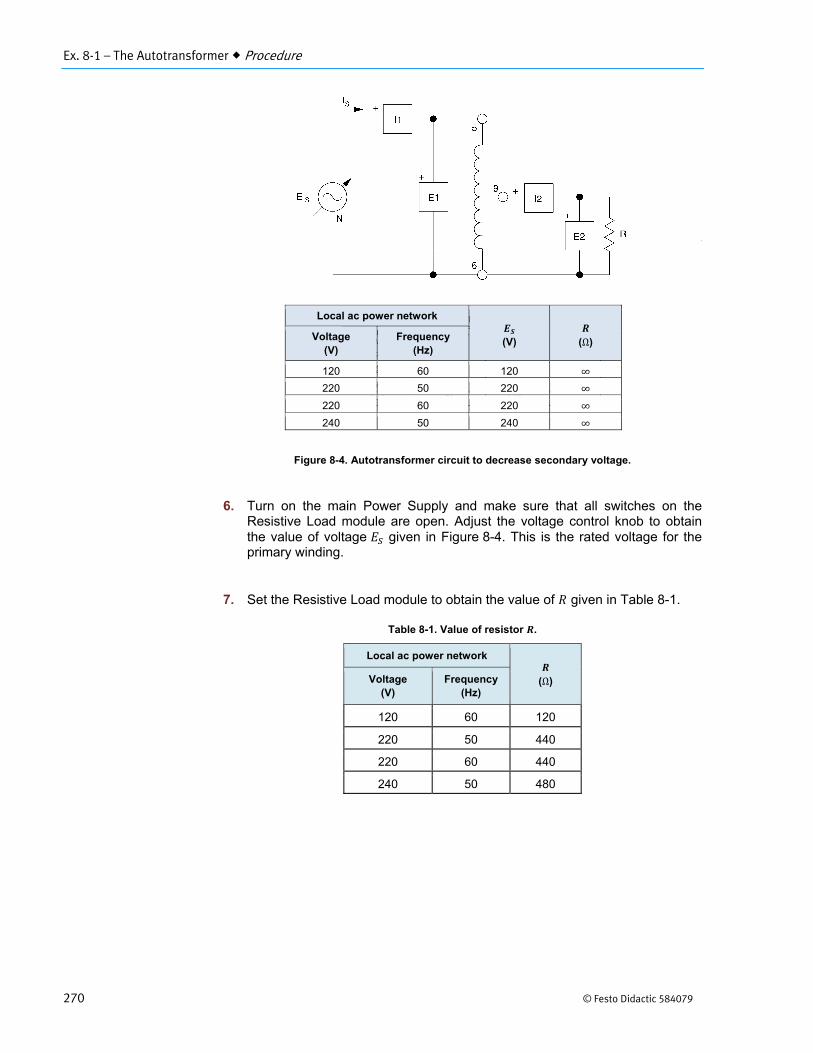
Ex. 8-1 – The Autotransformer Procedure
270 © Festo Didactic 584079
Figure 8-4. Autotransformer circuit to decrease secondary voltage.
6. Turn on the main Power Supply and make sure that all switches on theResistive Load module are open. Adjust the voltage control knob to obtainthe value of voltage given in Figure 8-4. This is the rated voltage for theprimary winding.
7. Set the Resistive Load module to obtain the value of given in Table 8-1.
Table 8-1. Value of resistor .
Local ac power network
(Ω) Voltage (V)
Frequency (Hz)
120 60 120
220 50 440
220 60 440
240 50 480
Local ac power network
(V)
(Ω) Voltage(V)
Frequency(Hz)
120 60 120 ∞
220 50 220 ∞
220 60 220 ∞
240 50 240 ∞
Ex. 8-1 – The Autotransformer Procedure
© Festo Didactic 584079 271
Measure and record the values of , , , , as well as the values of the primary and secondary apparent power and . After recording these values, turn the voltage control knob fully counterclockwise and turn off the Power Supply.
V
A
V
A
VA
VA
8. Compare the values of and . Are they approximately the same,except for a small difference caused by copper and core losses?
Yes No
9. Using the measured values in step 7, calculate the apparent power for boththe primary and secondary circuits.
VA
VA
10. Are the calculated results approximately the same as the measured valuesof and ?
Yes No
11. Is the autotransformer connected in a step-up, or a step-down configuration?
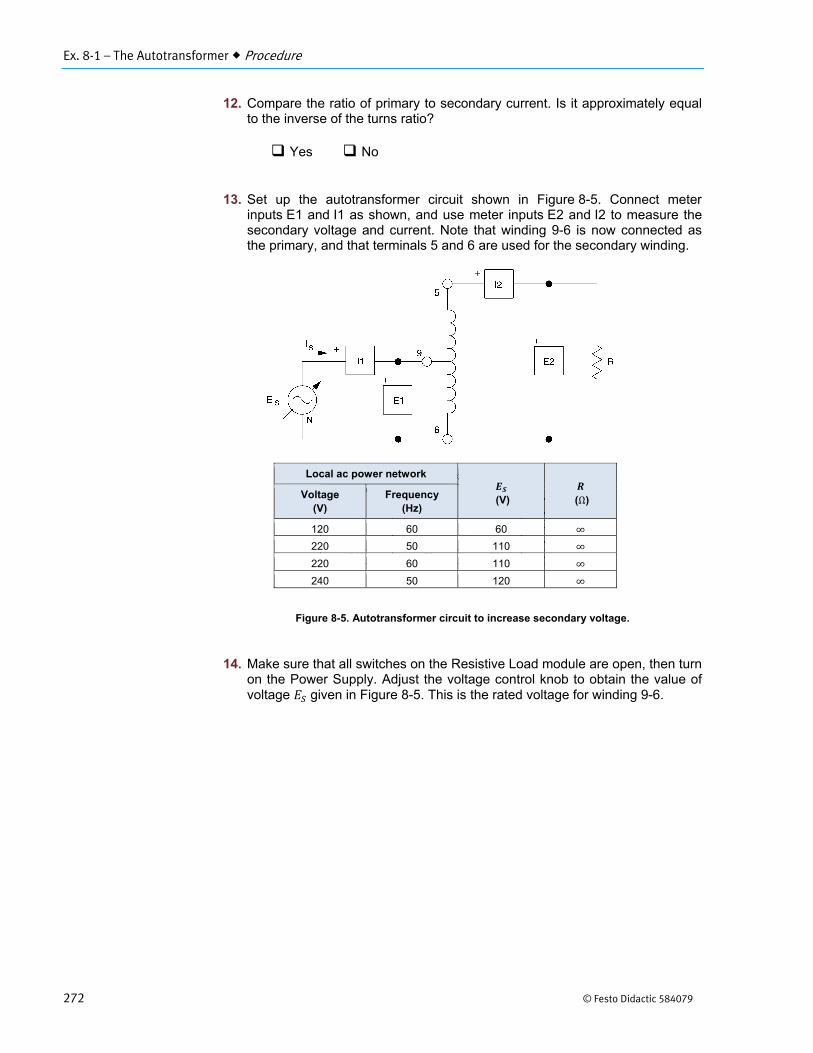
Ex. 8-1 – The Autotransformer Procedure
272 © Festo Didactic 584079
12. Compare the ratio of primary to secondary current. Is it approximately equalto the inverse of the turns ratio?
Yes No
13. Set up the autotransformer circuit shown in Figure 8-5. Connect meterinputs E1 and I1 as shown, and use meter inputs E2 and I2 to measure thesecondary voltage and current. Note that winding 9-6 is now connected asthe primary, and that terminals 5 and 6 are used for the secondary winding.
Figure 8-5. Autotransformer circuit to increase secondary voltage.
14. Make sure that all switches on the Resistive Load module are open, then turnon the Power Supply. Adjust the voltage control knob to obtain the value ofvoltage given in Figure 8-5. This is the rated voltage for winding 9-6.
Local ac power network
(V)
(Ω) Voltage(V)
Frequency(Hz)
120 60 60 ∞
220 50 110 ∞
220 60 110 ∞
240 50 120 ∞
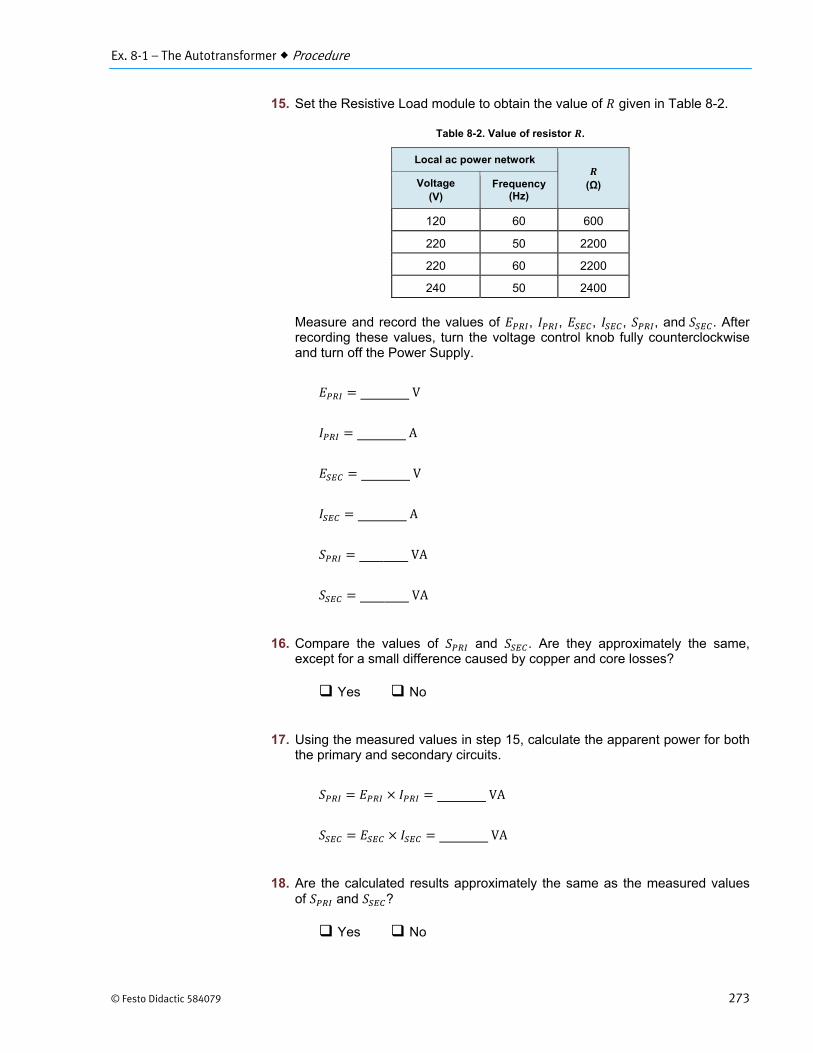
Ex. 8-1 – The Autotransformer Procedure
© Festo Didactic 584079 273
15. Set the Resistive Load module to obtain the value of given in Table 8-2.
Table 8-2. Value of resistor .
Local ac power network
(Ω) Voltage (V)
Frequency (Hz)
120 60 600
220 50 2200
220 60 2200
240 50 2400
Measure and record the values of , , , , , and . After recording these values, turn the voltage control knob fully counterclockwise and turn off the Power Supply.
V
A
V
A
VA
VA
16. Compare the values of and . Are they approximately the same,except for a small difference caused by copper and core losses?
Yes No
17. Using the measured values in step 15, calculate the apparent power for boththe primary and secondary circuits.
VA
VA
18. Are the calculated results approximately the same as the measured valuesof and ?
Yes No

Ex. 8-1 – The Autotransformer Procedure
274 © Festo Didactic 584079
19. Is the autotransformer connected in a step-up, or a step-down configuration?
20. Compare the ratio of primary to secondary current. Does it agree with theinverse of the turns ratio?
Yes No
21. Ensure that the Power Supply is turned off, and that the voltage control knobis turned fully counterclockwise. Remove all leads and cables.
Ex. 8-1 – The Autotransformer Conclusion
© Festo Didactic 584079 275
In this exercise, you connected a standard two-winding transformer to operate as an autotransformer in both step-up and step-down configurations. Measurements of apparent power on the primary and secondary sides of the circuit showed that they are approximately equal except for the small difference caused by transformer losses. You also saw that the voltage and current relationships for an autotransformer are based on the same rules as for standard transformers.
1. An autotransformer is a special type of transformer that has
a. a single winding which serves as both primary andsecondary.
b. a separate primary and secondary winding.c. more than one primary winding.d. two secondary windings connected in series.
2. The power on the primary side of an autotransformer is
a. less than the power on the secondary side.b. much greater than the power on the secondary side.c. exactly equal to the power on the secondary side.d. slightly greater than the power on the secondary side.
3. What is the secondary voltage when a source voltage of 150-V is appliedacross the complete winding of a center-tapped autotransformer?
a. 300 Vb. 150 Vc. 75 Vd. 225 V
4. The secondary current in a step-up autotransformer
a. equals the turns ratio.b. cannot exceed the winding current.c. is less than the primary current.d. is not limited.
5. The apparent power rating of a 10: 1 autotransformer is 450 VA. This meansthat the apparent power rating of the secondary is
a. 45 VAb. 4500 VAc. 450 VAd. none of the above.
CONCLUSION
REVIEW QUESTIONS

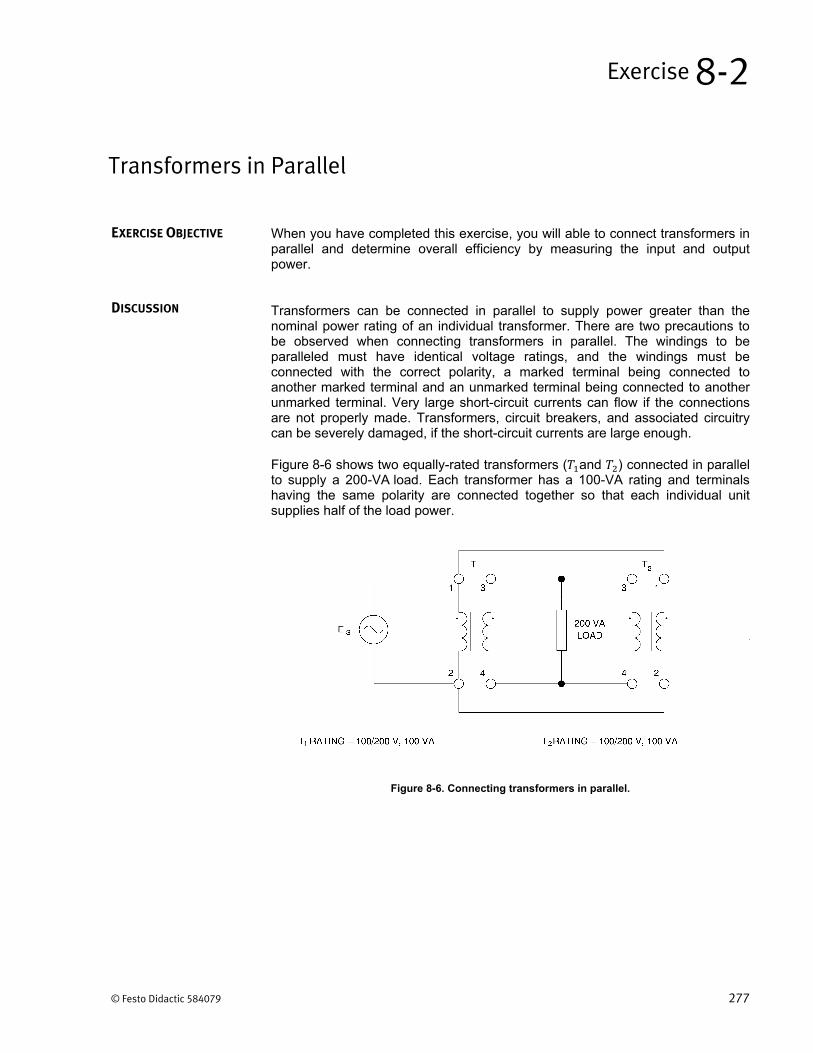
© Festo Didactic 584079 277
When you have completed this exercise, you will able to connect transformers in parallel and determine overall efficiency by measuring the input and output power.
Transformers can be connected in parallel to supply power greater than the nominal power rating of an individual transformer. There are two precautions to be observed when connecting transformers in parallel. The windings to be paralleled must have identical voltage ratings, and the windings must be connected with the correct polarity, a marked terminal being connected to another marked terminal and an unmarked terminal being connected to another unmarked terminal. Very large short-circuit currents can flow if the connections are not properly made. Transformers, circuit breakers, and associated circuitry can be severely damaged, if the short-circuit currents are large enough.
Figure 8-6 shows two equally-rated transformers ( and ) connected in parallel to supply a 200-VA load. Each transformer has a 100-VA rating and terminals having the same polarity are connected together so that each individual unit supplies half of the load power.
Figure 8-6. Connecting transformers in parallel.
Transformers in Parallel
Exercise 8-2
EXERCISE OBJECTIVE
DISCUSSION
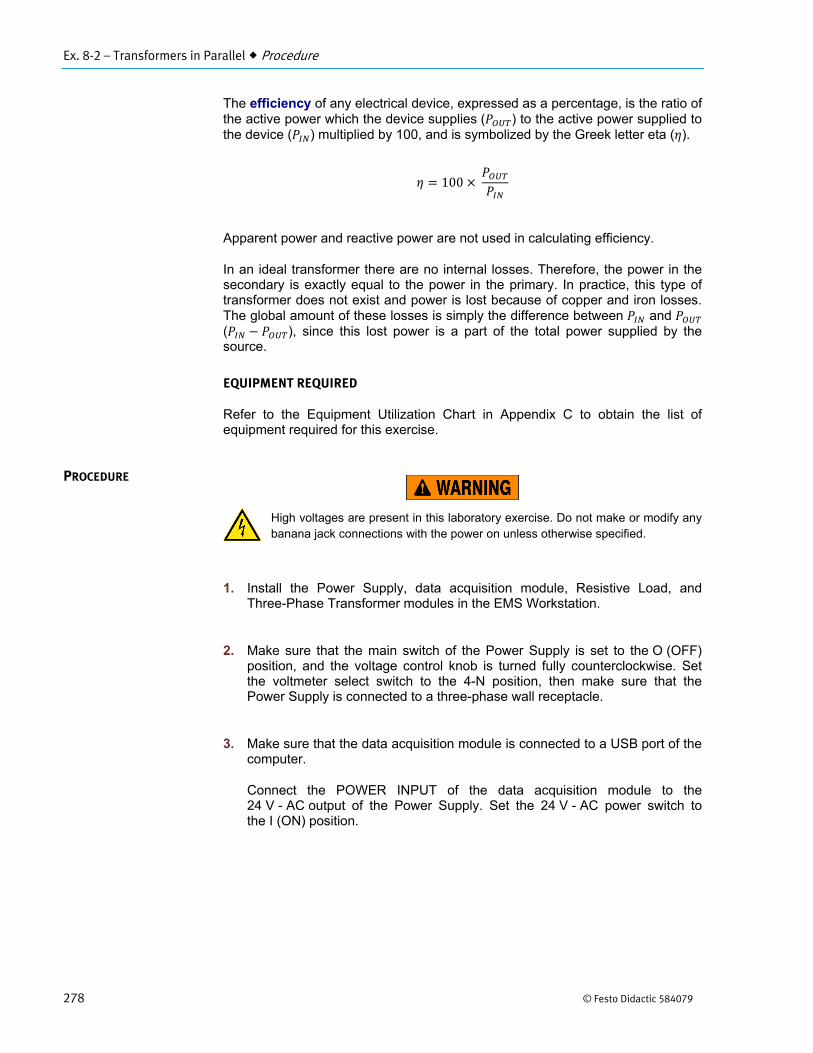
Ex. 8-2 – Transformers in Parallel Procedure
278 © Festo Didactic 584079
The efficiency of any electrical device, expressed as a percentage, is the ratio of the active power which the device supplies ( ) to the active power supplied to the device ( ) multiplied by 100, and is symbolized by the Greek letter eta ( ).
100
Apparent power and reactive power are not used in calculating efficiency.
In an ideal transformer there are no internal losses. Therefore, the power in the secondary is exactly equal to the power in the primary. In practice, this type of transformer does not exist and power is lost because of copper and iron losses. The global amount of these losses is simply the difference between and ( ), since this lost power is a part of the total power supplied by the source.
EQUIPMENT REQUIRED
Refer to the Equipment Utilization Chart in Appendix C to obtain the list of equipment required for this exercise.
High voltages are present in this laboratory exercise. Do not make or modify anybanana jack connections with the power on unless otherwise specified.
1. Install the Power Supply, data acquisition module, Resistive Load, andThree-Phase Transformer modules in the EMS Workstation.
2. Make sure that the main switch of the Power Supply is set to the O (OFF)position, and the voltage control knob is turned fully counterclockwise. Setthe voltmeter select switch to the 4-N position, then make sure that thePower Supply is connected to a three-phase wall receptacle.
3. Make sure that the data acquisition module is connected to a USB port of thecomputer.
Connect the POWER INPUT of the data acquisition module to the24 V - AC output of the Power Supply. Set the 24 V - AC power switch tothe I (ON) position.
PROCEDURE
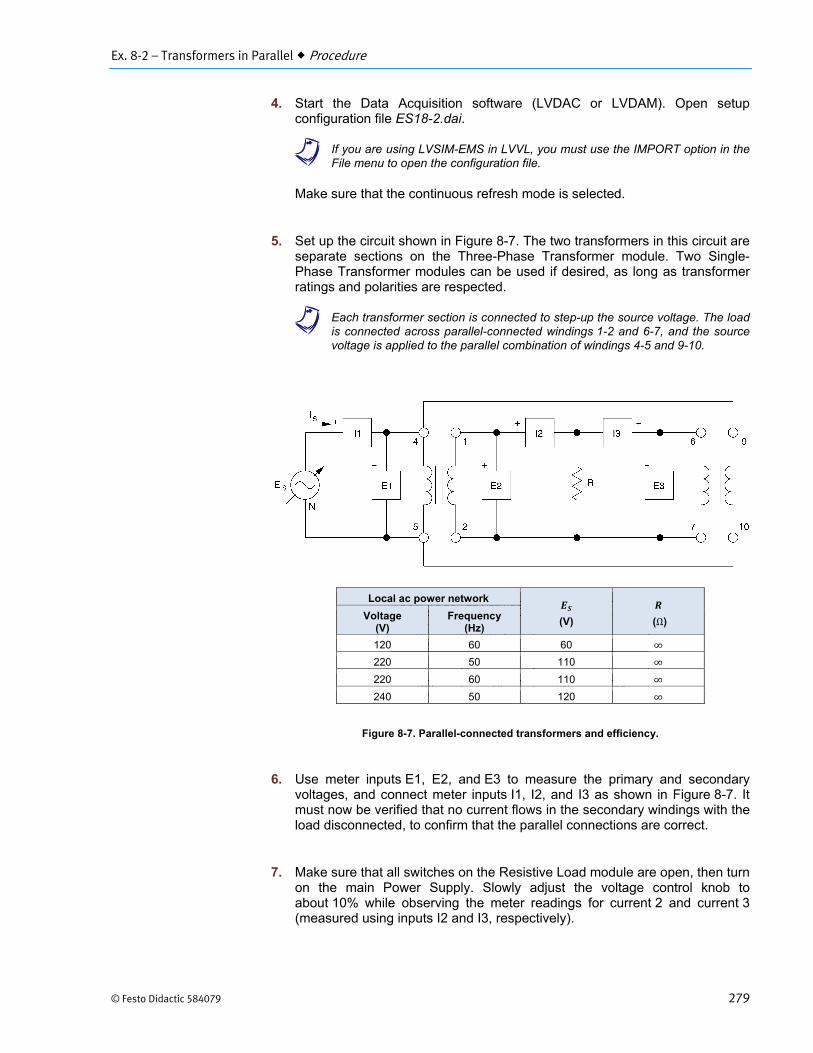
Ex. 8-2 – Transformers in Parallel Procedure
© Festo Didactic 584079 279
4. Start the Data Acquisition software (LVDAC or LVDAM). Open setupconfiguration file ES18-2.dai.
a If you are using LVSIM-EMS in LVVL, you must use the IMPORT option in theFile menu to open the configuration file.
Make sure that the continuous refresh mode is selected.
5. Set up the circuit shown in Figure 8-7. The two transformers in this circuit areseparate sections on the Three-Phase Transformer module. Two Single-Phase Transformer modules can be used if desired, as long as transformerratings and polarities are respected.
a Each transformer section is connected to step-up the source voltage. The loadis connected across parallel-connected windings 1-2 and 6-7, and the sourcevoltage is applied to the parallel combination of windings 4-5 and 9-10.
Figure 8-7. Parallel-connected transformers and efficiency.
6. Use meter inputs E1, E2, and E3 to measure the primary and secondaryvoltages, and connect meter inputs I1, I2, and I3 as shown in Figure 8-7. Itmust now be verified that no current flows in the secondary windings with theload disconnected, to confirm that the parallel connections are correct.
7. Make sure that all switches on the Resistive Load module are open, then turnon the main Power Supply. Slowly adjust the voltage control knob toabout 10% while observing the meter readings for current 2 and current 3(measured using inputs I2 and I3, respectively).
Local ac power network
(V)
(Ω) Voltage (V)
Frequency (Hz)
120 60 60 ∞
220 50 110 ∞
220 60 110 ∞
240 50 120 ∞
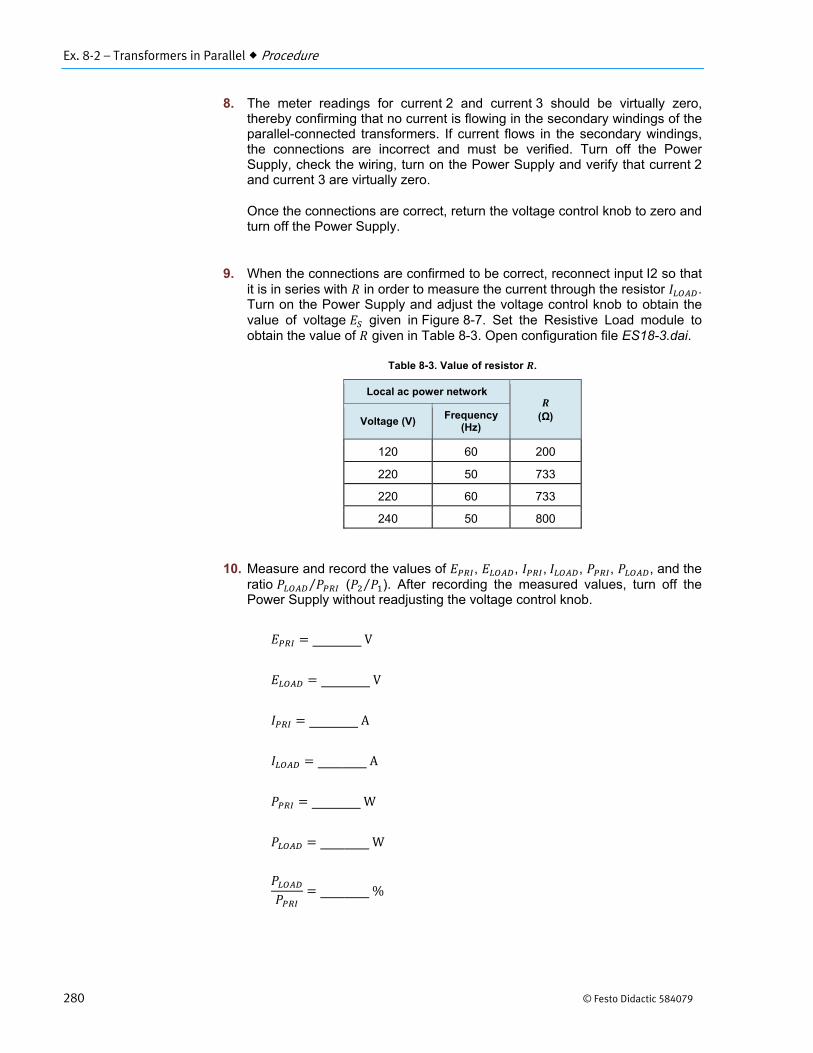
Ex. 8-2 – Transformers in Parallel Procedure
280 © Festo Didactic 584079
8. The meter readings for current 2 and current 3 should be virtually zero,thereby confirming that no current is flowing in the secondary windings of theparallel-connected transformers. If current flows in the secondary windings,the connections are incorrect and must be verified. Turn off the PowerSupply, check the wiring, turn on the Power Supply and verify that current 2and current 3 are virtually zero.
Once the connections are correct, return the voltage control knob to zero andturn off the Power Supply.
9. When the connections are confirmed to be correct, reconnect input I2 so thatit is in series with in order to measure the current through the resistor .Turn on the Power Supply and adjust the voltage control knob to obtain thevalue of voltage given in Figure 8-7. Set the Resistive Load module toobtain the value of given in Table 8-3. Open configuration file ES18-3.dai.
Table 8-3. Value of resistor .
Local ac power network
(Ω) Voltage (V) Frequency
(Hz)
120 60 200
220 50 733
220 60 733
240 50 800
10. Measure and record the values of , , , , , , and theratio ⁄ ( ⁄ ). After recording the measured values, turn off thePower Supply without readjusting the voltage control knob.
V
V
A
A
W
W
%
Ex. 8-2 – Transformers in Parallel Procedure
© Festo Didactic 584079 281
11. Calculate and .
W
W
Compare them with the measured values for and . Are they approximately the same?
Yes No
12. Calculate the efficiency of the circuit.
Efficiency 100 %
13. Compare your calculation of with the measured ratio ⁄ ⁄ .Are they approximately the same?
Yes No
14. Calculate the "lost power" in the transformer.
"Lost power" W
15. Reconnect meter input I2 as in step 6 to measure secondary current in thefirst transformer. Open configuration file ES18-4.dai. Turn on the PowerSupply and make sure that the value of is exactly the same as it was instep 9.
16. Measure and record the values of and given by the meters.
W
W
17. Calculate the sum of and and compare it with the value of measured in step 10. Are they approximately the same?
Yes No

Ex. 8-2 – Transformers in Parallel Procedure
282 © Festo Didactic 584079
18. Do the measured results confirm that the load power is evenly distributedbetween the two transformers?
Yes No
19. Ensure that the Power Supply is turned off, and that the voltage control knobis turned fully counterclockwise. Remove all leads and cables.
Ex. 8-2 – Transformers in Parallel Conclusion
© Festo Didactic 584079 283
In this exercise, you connected two transformers in parallel to supply more power to a load than was possible with a single transformer. You confirmed that transformer connections were correct by verifying that no current flowed in the secondary windings before the load was connected. You also determined the overall efficiency of the parallel-connected transformers, and saw that the load power was evenly distributed between the two transformers.
1. Connecting transformers in parallel is a way to
a. supply greater load power.b. save energy.c. increase load voltage.d. decrease load power.
2. Parallel-connected transformers must
a. have identical voltage ratings.b. be connected with the proper polarity.c. each have ratings equal to the load power required.d. both a and b.
3. A 500-VA load can be supplied with parallel-connected transformers
a. each rated at 500 VA.b. each rated at 200 VA.c. each rated at 300 VA.d. both a and c, but smaller-rated transformers may be more
economical.
4. When current flows in the secondary windings of parallel-connectedtransformers with no load connected,
a. the connections are correct.b. the windings are connected with the wrong polarity.c. the windings have identical ratings.d. the primary windings are short-circuited.
5. The power supplied to a load by two identical transformers connected inparallel is
a. shared equally by the transformers.b. shared in proportion to their turns ratio.c. shared in proportion to their ratings.d. shared in proportion to their current ratio.
CONCLUSION
REVIEW QUESTIONS

© Festo Didactic 584079 285
When you have completed this exercise, you will be familiar with the basic concepts of distribution transformers. You will measure line voltages and currents to observe how a distribution transformer behaves under various load conditions.
The majority of distribution transformers that supply homes and residential buildings with power in North America have one high-voltage primary winding. The secondary winding provides 120 V for lighting and small appliances, as well as 240 V for heating, electric stoves and other heavy-duty electrical loads. The secondary winding may be a 240-V center-tapped single winding or two 120-V single windings connected in series.
To obtain the advantage of a higher-voltage distribution circuit, while at the same time allowing the operation of lower-voltage equipment, the 120/240-V three-wire power distribution system was developed. For a given amount of power supplied to a load, the line loss in the 120/240-V three-wire power distribution system is less than that in a 120-V two-wire power distribution system. The three-wire system has the further advantage of setting the voltage between any line wire and ground to an acceptable level, thereby, limiting the risks for harmful electric shocks.
Distribution transformers are usually wound with the secondary or low-voltage winding in two sections, each section having a nominal voltage of 120 V. When the sections are connected in series, the transformer can be used to supply a two-wire 240-V load. The series connection can also supply a three-wire 120/240-V circuit by connecting the neutral or common wire of this circuit to the common terminal of the secondary (point of junction of the two winding sections). In this way, 120-V lamps and equipment can be connected between the neutral wire and either one of the two other wires (line wires), while 240-V loads like stoves and electric heaters can be connected across the two line wires.
When the loads on each side of the neutral wire are balanced, no current flows in this wire. However, when a heavy load is added between one line wire and the neutral wire, the neutral wire carries the unbalanced current from the transformer to the load. The neutral current is always the difference between the currents flowing in the two line wires. Therefore, the loads on each side of the neutral wire should be as balanced as possible to minimize the neutral current.
If a load is connected to only one side of a three-wire system, the neutral wire carries all the load current. For this reason the neutral wire is the same size as the two line wires. An accidental opening of the neutral wire when an unbalanced load is being supplied results in large imbalances in the voltages across the other loads, causing incandescent lamps, for example, to brighten or become dim. Therefore, the neutral wire is solidly connected from the transformer to the load, and no fuses or overcurrent devices are installed in series with the neutral wire.
Distribution Transformers
Exercise 8-3
EXERCISE OBJECTIVE
DISCUSSION
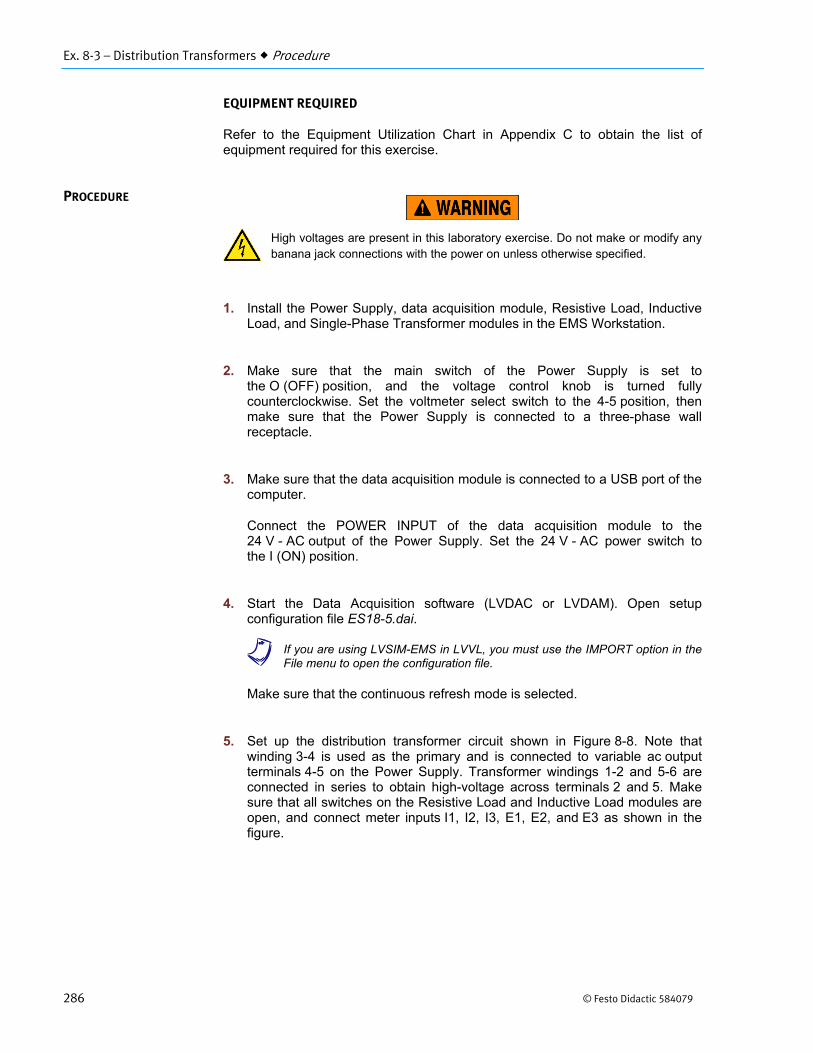
Ex. 8-3 – Distribution Transformers Procedure
286 © Festo Didactic 584079
EQUIPMENT REQUIRED
Refer to the Equipment Utilization Chart in Appendix C to obtain the list of equipment required for this exercise.
High voltages are present in this laboratory exercise. Do not make or modify anybanana jack connections with the power on unless otherwise specified.
1. Install the Power Supply, data acquisition module, Resistive Load, InductiveLoad, and Single-Phase Transformer modules in the EMS Workstation.
2. Make sure that the main switch of the Power Supply is set tothe O (OFF) position, and the voltage control knob is turned fullycounterclockwise. Set the voltmeter select switch to the 4-5 position, thenmake sure that the Power Supply is connected to a three-phase wallreceptacle.
3. Make sure that the data acquisition module is connected to a USB port of thecomputer.
Connect the POWER INPUT of the data acquisition module to the24 V - AC output of the Power Supply. Set the 24 V - AC power switch tothe I (ON) position.
4. Start the Data Acquisition software (LVDAC or LVDAM). Open setupconfiguration file ES18-5.dai.
a If you are using LVSIM-EMS in LVVL, you must use the IMPORT option in theFile menu to open the configuration file.
Make sure that the continuous refresh mode is selected.
5. Set up the distribution transformer circuit shown in Figure 8-8. Note thatwinding 3-4 is used as the primary and is connected to variable ac outputterminals 4-5 on the Power Supply. Transformer windings 1-2 and 5-6 areconnected in series to obtain high-voltage across terminals 2 and 5. Makesure that all switches on the Resistive Load and Inductive Load modules areopen, and connect meter inputs I1, I2, I3, E1, E2, and E3 as shown in thefigure.
PROCEDURE
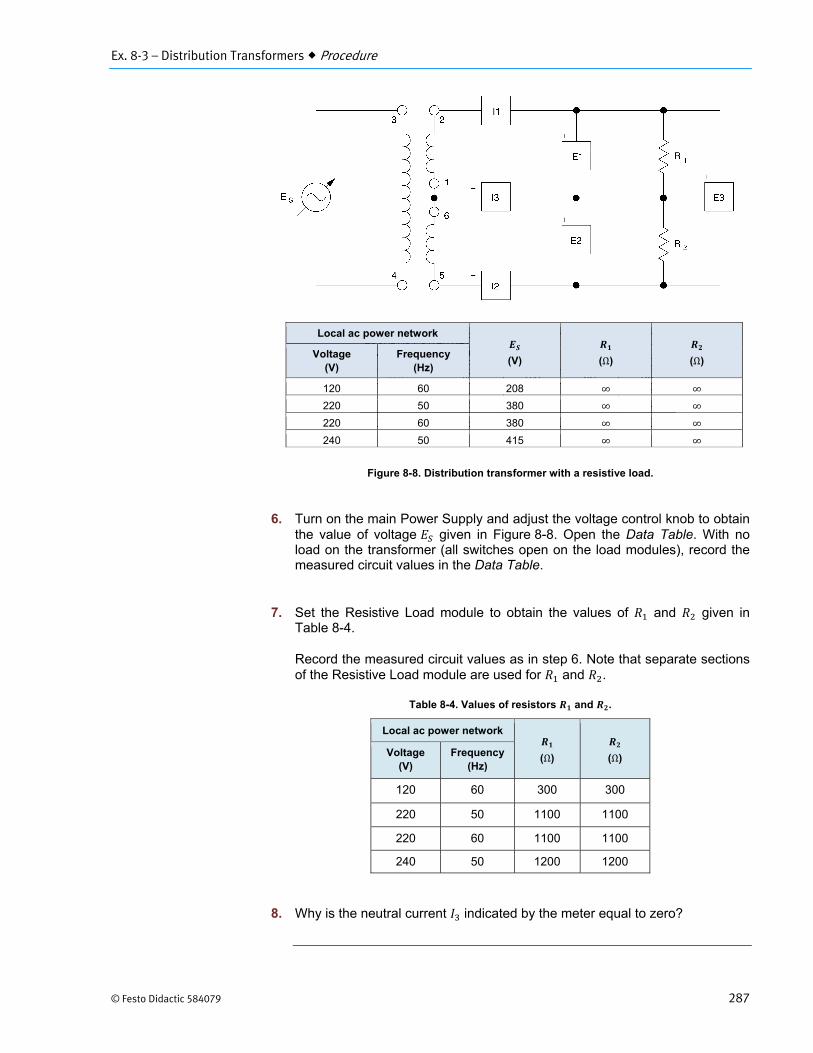
Ex. 8-3 – Distribution Transformers Procedure
© Festo Didactic 584079 287
Figure 8-8. Distribution transformer with a resistive load.
6. Turn on the main Power Supply and adjust the voltage control knob to obtainthe value of voltage given in Figure 8-8. Open the Data Table. With noload on the transformer (all switches open on the load modules), record themeasured circuit values in the Data Table.
7. Set the Resistive Load module to obtain the values of and given inTable 8-4.
Record the measured circuit values as in step 6. Note that separate sectionsof the Resistive Load module are used for and .
Table 8-4. Values of resistors and .
Local ac power network
(Ω)
(Ω) Voltage(V)
Frequency(Hz)
120 60 300 300
220 50 1100 1100
220 60 1100 1100
240 50 1200 1200
8. Why is the neutral current indicated by the meter equal to zero?
Local ac power network
(V)
(Ω)
(Ω) Voltage
(V) Frequency
(Hz)
120 60 208 ∞ ∞
220 50 380 ∞ ∞
220 60 380 ∞ ∞
240 50 415 ∞ ∞
Ex. 8-3 – Distribution Transformers Procedure
288 © Festo Didactic 584079
9. Set so that it is now double the value of . Once again record themeasured circuit values.
10. Is the neutral line current equal to the difference between the two linecurrents and ?
Yes No
11. Turn off the Power Supply and disconnect the neutral line between thetransformer and the load circuit (at input I3). Turn on the Power Supply andmake sure that is at the same value as in step 6. Record the measuredcircuit values in the Data Table.
12. What difference do you observe in the load voltages , , and ?
13. If the load resistors were incandescent lamps in a home, what would benoticeable with this imbalance?
14. Turn off the Power Supply. Disconnect resistor from the circuit ofFigure 8-8 and replace it with an inductive reactance . Reconnect theneutral line between the transformer and load circuit. Set and to thevalues given in Table 8-5.
Table 8-5. Values of resistors and inductive reactance .
Local ac power network
(Ω)
(Ω) Voltage(V)
Frequency(Hz)
120 60 400 400
220 50 1467 1467
220 60 1467 1467
240 50 1600 1600
15. Turn on the Power Supply. Make sure that is at the same value as before.Record the measured circuit values in the Data Table.
16. What difference do you observe in the load voltages , , and ?

Ex. 8-3 – Distribution Transformers Procedure
© Festo Didactic 584079 289
17. Is the neutral line current equal to the difference in the two line currents and ?
Yes No
18. Explain why your answer in step 17 is different than that in step 10.
19. Review the measured circuit values stored in the Data Table. Do they agreewith the theoretical information presented in the Discussion?
Yes No
a It should be clear from the measurements that the neutral line current is thevectorial difference between and . When the currents are in phase, such as the case for equal load resistors, this difference is the same as the arithmetical difference.
20. Ensure that the Power Supply is turned off, and that the voltage control knobis turned fully counterclockwise. Remove all leads and cables.

Ex. 8-3 – Distribution Transformers Conclusion
290 © Festo Didactic 584079
In this exercise, you set up the circuit for a typical distribution transformer, and observed its behavior under various load conditions. You saw that it was possible to supply both high- and low-voltage loads with a distribution transformer, and that the neutral current was equal to zero with a balanced load.
1. A 120/240-V distribution transformer can provide power for
a. loads at different voltage levels.b. loads at one voltage level only.c. resistive loads only.d. loads that are less than 1000 VA.
2. A typical 120/240-V distribution transformer requires
a. three wires for the primary circuit.b. two wires for the secondary circuit.c. two wires and a neutral wire for the secondary circuit.d. four wires for each 120-V secondary circuit.
3. Neutral current in a distribution transformer
a. is not important.b. equals zero when loads are properly balanced.c. equals the difference of the currents in the line wires.d. both b and c.
4. The neutral wire in a three-wire distribution system
a. is the same size as the line wires.b. is smaller in size than the line wires.c. is larger in size than the line wires.d. must be a larger size than the line wires.
5. Circuit breakers and fuses are
a. always connected to the neutral wire.b. never connected to the neutral wire.c. not useful for a three-wire system.d. can only protect against lightning.
CONCLUSION
REVIEW QUESTIONS
Unit 8 – Special Transformer Connections Unit Test
© Festo Didactic 584079 291
Unit Test
1. A transformer with a single winding serving as primary and secondary
a. is called a distribution transformer.b. is called an autotransformer.c. is called a double-winding transformer.d. is called a current transformer.
2. The apparent power rating of an autotransformer determines
a. the power on the secondary side.b. the minimum current that can flow in the winding.c. the maximum power available for a load.d. both a and c.
3. What is the primary voltage when the secondary voltage at the center-tap ofan autotransformer is 100 V?
a. 100 Vb. 200 Vc. 300 Vd. 50 V
4. Parallel-connected transformers can supply more power when
a. they are connected in series-opposing.b. they are connected in series-aiding.c. they are connected with the proper polarity.d. they are connected to a purely-capacitive load.
5. Two 300-VA parallel-connected transformers can supply a maximum load of
a. 150 VAb. 300 VAc. 450 VAd. 600 VA
6. To ensure connections are correct when two transformers are put in parallel
a. secondary current is measured at half load and reduced primary voltage.b. secondary current is measured at full load and reduced primary voltage.c. secondary current is measured at no load and reduced primary voltage.d. secondary current is measured at no load and full primary voltage.

Unit 8 – Special Transformer Connections Unit Test
292 © Festo Didactic 584079
7. Two transformers of different apparent power ratings connected in parallelcan supply
a. a maximum load equal to twice the larger rating.b. a maximum load equal to one-half the sum of both ratings.c. a maximum load equal to twice the smaller rating.d. a maximum load equal to the sum of both ratings.
8. A distribution transformer is used to supply
a. high-voltage loads only.b. low-voltage loads only.c. both low- and high-voltage loads.d. any type of four-wire load.
9. If the current in the neutral wire of a typical 120/240-V distribution systemequals zero,
a. something must be wrong.b. the loads connected to the system are balanced.c. the currents in the line wires are out of phase.d. the neutral wire is short-circuited to ground.
10. The neutral wire in a three-wire distribution system
a. is never connected to ground.b. is never connected through circuit breakers or fuses.c. is always connected through a protection device.d. never has any current flowing in it.
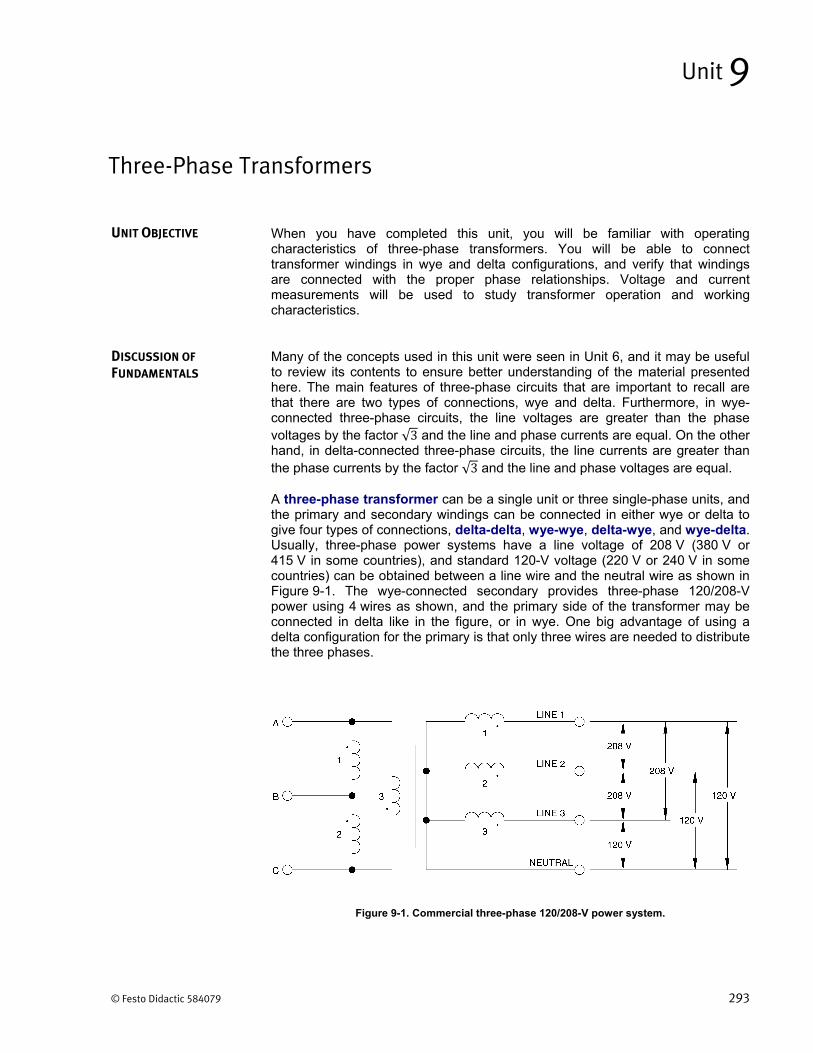
© Festo Didactic 584079 293
When you have completed this unit, you will be familiar with operating characteristics of three-phase transformers. You will be able to connect transformer windings in wye and delta configurations, and verify that windings are connected with the proper phase relationships. Voltage and current measurements will be used to study transformer operation and working characteristics.
Many of the concepts used in this unit were seen in Unit 6, and it may be useful to review its contents to ensure better understanding of the material presented here. The main features of three-phase circuits that are important to recall are that there are two types of connections, wye and delta. Furthermore, in wye-connected three-phase circuits, the line voltages are greater than the phase voltages by the factor √3 and the line and phase currents are equal. On the other hand, in delta-connected three-phase circuits, the line currents are greater than the phase currents by the factor √3 and the line and phase voltages are equal.
A three-phase transformer can be a single unit or three single-phase units, and the primary and secondary windings can be connected in either wye or delta to give four types of connections, delta-delta, wye-wye, delta-wye, and wye-delta. Usually, three-phase power systems have a line voltage of 208 V (380 V or 415 V in some countries), and standard 120-V voltage (220 V or 240 V in some countries) can be obtained between a line wire and the neutral wire as shown in Figure 9-1. The wye-connected secondary provides three-phase 120/208-V power using 4 wires as shown, and the primary side of the transformer may be connected in delta like in the figure, or in wye. One big advantage of using a delta configuration for the primary is that only three wires are needed to distribute the three phases.
Figure 9-1. Commercial three-phase 120/208-V power system.
Three-Phase Transformers
Unit 9
UNIT OBJECTIVE
DISCUSSION OF
FUNDAMENTALS
Unit 9 – Three-Phase Transformers Discussion of Fundamentals
294 © Festo Didactic 584079
An advantage of a delta-delta connection is that two single-phase transformers (instead of three) can be operated in what is known as the open-delta or "V" configuration if one of the three transformers becomes damaged or is removed from service. The open-delta transformer bank still delivers phase voltages and currents in the correct relationship, but the capacity of the bank is reduced to 57.7% (1 √3⁄ ) of the total nominal capacity available with three transformers in service.
In the delta-delta and wye-wye configurations, the line voltage at the secondary is equal to the line voltage at the primary times the inverse of the turns ratio. In the delta-wye configuration, the line voltage at the secondary is equal to the line voltage at the primary times the inverse of the turn ratio times √3. In the wye-delta configuration, the line voltage at the secondary is equal to the line voltage at the primary times the inverse of the turn ratio times 1 √3⁄ .
Regardless of how the windings in a three-phase transformer are connected, precautions must be taken to ensure that the secondaries are connected with the proper phase relationships. For a wye configuration, this means that the voltage measured across any two secondary windings (line voltage) must be √3 times greater than the voltage across either winding (phase voltage). If not, the connections must be reversed before continuing.
With a delta configuration, the voltage measured between the ends of two series-connected secondary windings must equal the voltage across either winding. If not, the connections must be reversed. When one end of the third winding is connected, the voltage measured across all three series-connected windings must equal zero before connecting them together to close the delta. It is extremely important to verify that the voltage within the delta equals zero before the delta is closed. If not, the resulting current will be very high and damage the windings.
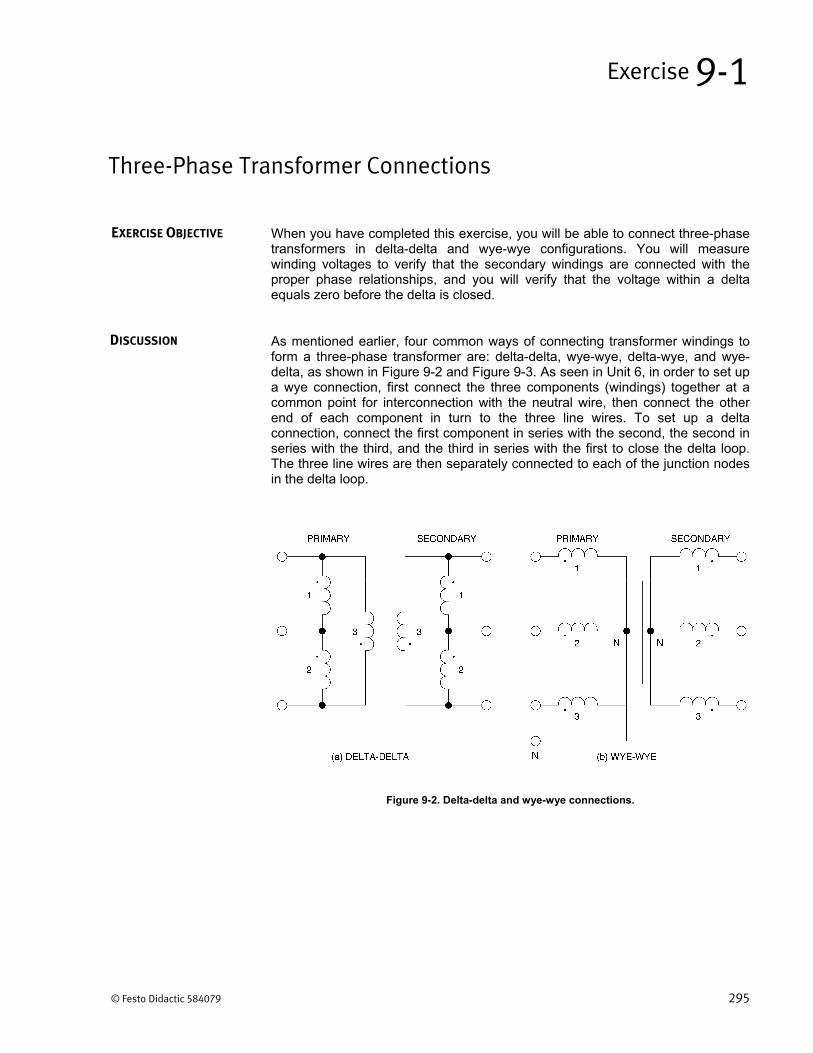
© Festo Didactic 584079 295
When you have completed this exercise, you will be able to connect three-phase transformers in delta-delta and wye-wye configurations. You will measure winding voltages to verify that the secondary windings are connected with the proper phase relationships, and you will verify that the voltage within a delta equals zero before the delta is closed.
As mentioned earlier, four common ways of connecting transformer windings to form a three-phase transformer are: delta-delta, wye-wye, delta-wye, and wye-delta, as shown in Figure 9-2 and Figure 9-3. As seen in Unit 6, in order to set up a wye connection, first connect the three components (windings) together at a common point for interconnection with the neutral wire, then connect the other end of each component in turn to the three line wires. To set up a delta connection, connect the first component in series with the second, the second in series with the third, and the third in series with the first to close the delta loop. The three line wires are then separately connected to each of the junction nodes in the delta loop.
Figure 9-2. Delta-delta and wye-wye connections.
Three-Phase Transformer Connections
Exercise 9-1
EXERCISE OBJECTIVE
DISCUSSION
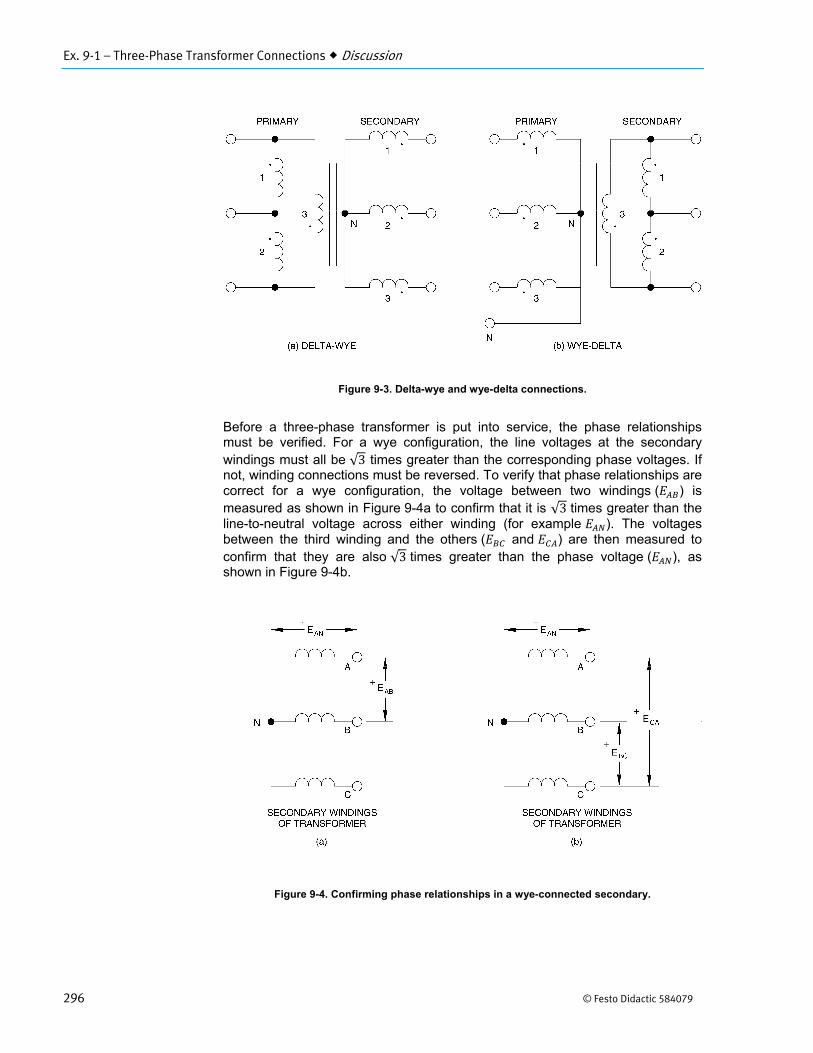
Ex. 9-1 – Three-Phase Transformer Connections Discussion
296 © Festo Didactic 584079
Figure 9-3. Delta-wye and wye-delta connections.
Before a three-phase transformer is put into service, the phase relationships must be verified. For a wye configuration, the line voltages at the secondary windings must all be √3 times greater than the corresponding phase voltages. If not, winding connections must be reversed. To verify that phase relationships are correct for a wye configuration, the voltage between two windings ( ) is measured as shown in Figure 9-4a to confirm that it is √3 times greater than the line-to-neutral voltage across either winding (for example ). The voltages between the third winding and the others ( and ) are then measured to confirm that they are also √3 times greater than the phase voltage ( ), as shown in Figure 9-4b.
Figure 9-4. Confirming phase relationships in a wye-connected secondary.
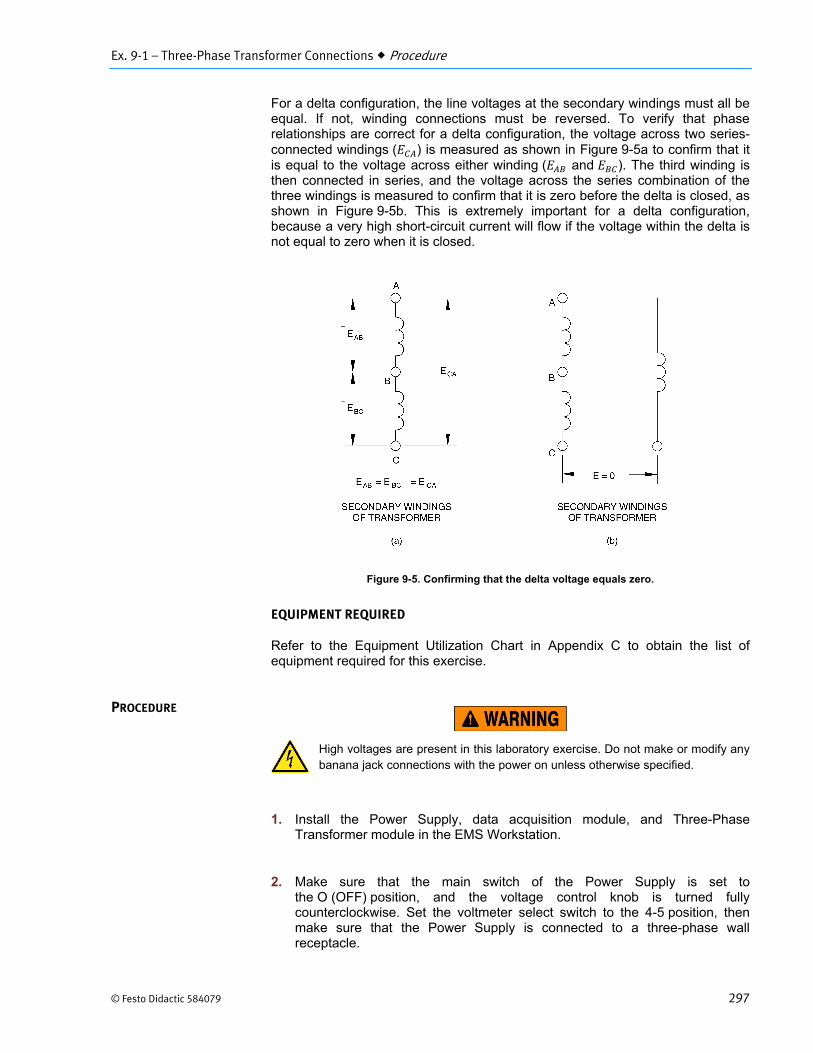
Ex. 9-1 – Three-Phase Transformer Connections Procedure
© Festo Didactic 584079 297
For a delta configuration, the line voltages at the secondary windings must all be equal. If not, winding connections must be reversed. To verify that phase relationships are correct for a delta configuration, the voltage across two series-connected windings ( ) is measured as shown in Figure 9-5a to confirm that it is equal to the voltage across either winding ( and ). The third winding is then connected in series, and the voltage across the series combination of the three windings is measured to confirm that it is zero before the delta is closed, as shown in Figure 9-5b. This is extremely important for a delta configuration, because a very high short-circuit current will flow if the voltage within the delta is not equal to zero when it is closed.
Figure 9-5. Confirming that the delta voltage equals zero.
EQUIPMENT REQUIRED
Refer to the Equipment Utilization Chart in Appendix C to obtain the list of equipment required for this exercise.
High voltages are present in this laboratory exercise. Do not make or modify anybanana jack connections with the power on unless otherwise specified.
1. Install the Power Supply, data acquisition module, and Three-PhaseTransformer module in the EMS Workstation.
2. Make sure that the main switch of the Power Supply is set tothe O (OFF) position, and the voltage control knob is turned fullycounterclockwise. Set the voltmeter select switch to the 4-5 position, thenmake sure that the Power Supply is connected to a three-phase wallreceptacle.
PROCEDURE
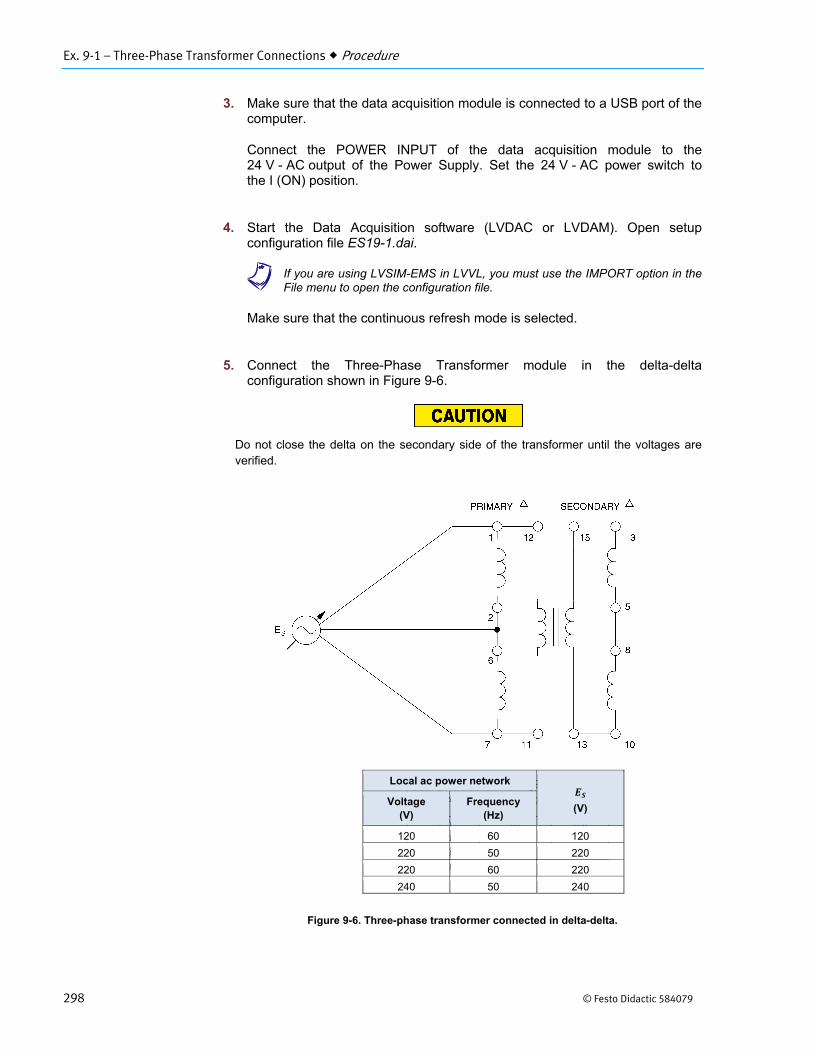
Ex. 9-1 – Three-Phase Transformer Connections Procedure
298 © Festo Didactic 584079
3. Make sure that the data acquisition module is connected to a USB port of thecomputer.
Connect the POWER INPUT of the data acquisition module to the24 V - AC output of the Power Supply. Set the 24 V - AC power switch tothe I (ON) position.
4. Start the Data Acquisition software (LVDAC or LVDAM). Open setupconfiguration file ES19-1.dai.
a If you are using LVSIM-EMS in LVVL, you must use the IMPORT option in theFile menu to open the configuration file.
Make sure that the continuous refresh mode is selected.
5. Connect the Three-Phase Transformer module in the delta-deltaconfiguration shown in Figure 9-6.
Do not close the delta on the secondary side of the transformer until the voltages are verified.
Figure 9-6. Three-phase transformer connected in delta-delta.
Local ac power network
(V) Voltage
(V) Frequency
(Hz)
120 60 120
220 50 220
220 60 220
240 50 240
Ex. 9-1 – Three-Phase Transformer Connections Procedure
© Festo Didactic 584079 299
6. Turn on the Power Supply and adjust the voltage control knob to obtain theline-to-line voltage given in Figure 9-6. Use meter input E1 to measure thewinding voltages and record the measured values. After recording thesevalues, turn the voltage control knob fully counterclockwise, then turn off thePower Supply.
a When measuring the various voltages, turn off the Power Supply beforemodifying the connections of the meter input E1 to the circuit.
V
V
V
V
V
V
7. Do the measurements confirm that the secondary windings are connectedwith the proper phase relationships?
Yes No
8. Are the voltages within the secondary delta equal to zero, thus confirmingthat it is safe to close the delta?
Yes No
a The value of voltage will not be exactly zero volts because of smallimbalances in the three-phase line voltages. If it is more than 5 V, the winding connections have to be checked carefully.
9. When the winding connections are confirmed to be correct, close the delta onthe secondary side of the transformer. Connect meter inputs E1, E2, and E3to measure the line voltages at the secondary. Open configurationfile ES19-2.dai. Turn on the Power Supply and adjust the voltage controlknob to obtain the same value of voltage used in step 6. Note that thetransformer is connected using the 1:1 ratio, so the primary and secondaryvoltages should be equal.
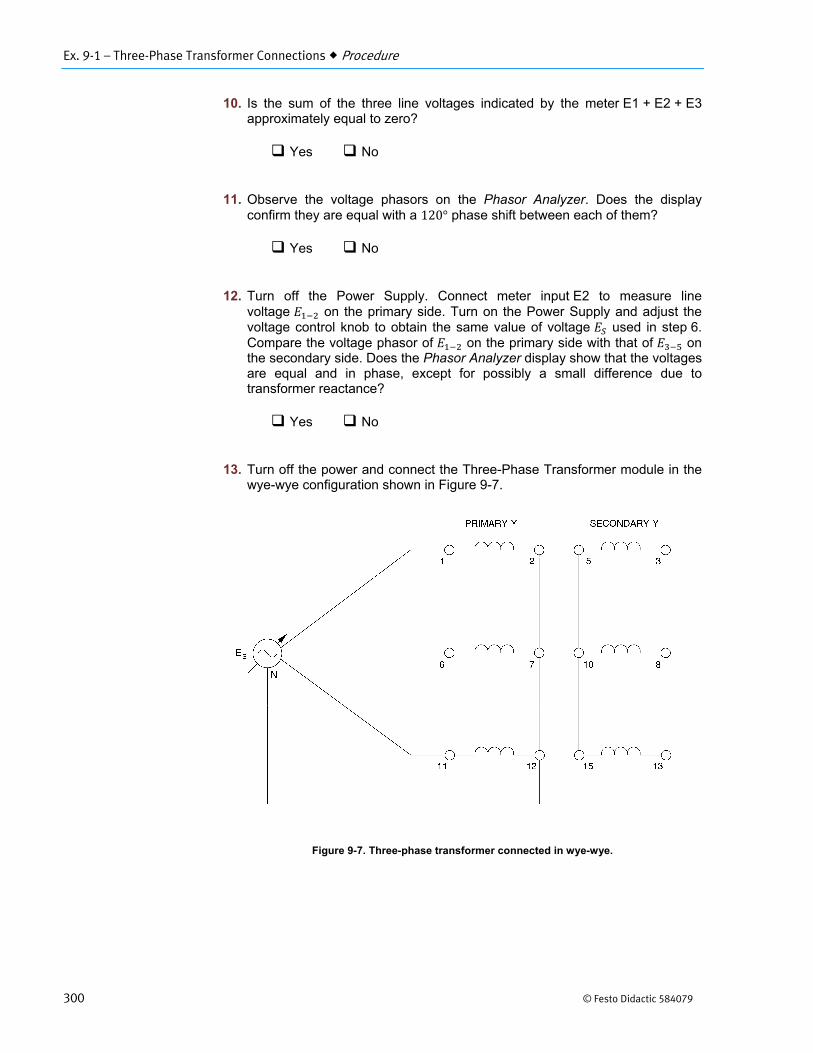
Ex. 9-1 – Three-Phase Transformer Connections Procedure
300 © Festo Didactic 584079
10. Is the sum of the three line voltages indicated by the meter E1 + E2 + E3approximately equal to zero?
Yes No
11. Observe the voltage phasors on the Phasor Analyzer. Does the displayconfirm they are equal with a 120° phase shift between each of them?
Yes No
12. Turn off the Power Supply. Connect meter input E2 to measure linevoltage on the primary side. Turn on the Power Supply and adjust thevoltage control knob to obtain the same value of voltage used in step 6.Compare the voltage phasor of on the primary side with that of onthe secondary side. Does the Phasor Analyzer display show that the voltagesare equal and in phase, except for possibly a small difference due totransformer reactance?
Yes No
13. Turn off the power and connect the Three-Phase Transformer module in thewye-wye configuration shown in Figure 9-7.
Figure 9-7. Three-phase transformer connected in wye-wye.
Ex. 9-1 – Three-Phase Transformer Connections Procedure
© Festo Didactic 584079 301
14. Turn on the Power Supply and adjust the voltage control knob to obtain thevalue of voltage used in step 6. Open configuration file ES19-3.dai. Usemeter input E1 to measure the winding voltages and record the results. Afterrecording the measurements, turn the voltage control knob fullycounterclockwise, then turn off the Power Supply.
a When measuring the various voltages, turn off the Power Supply beforemodifying the connections of meter input E1 to the circuit.
V
V
V
V
V
V
V
V
V
V
V
V
15. Do the measurements confirm that the secondary windings are connectedwith the proper phase relationships?
Yes No
16. Are the line-to-line voltages on the primary and secondary sides of thetransformer √3 times greater than the line-to-neutral values?
Yes No
Ex. 9-1 – Three-Phase Transformer Connections Procedure
302 © Festo Didactic 584079
17. Connect meter inputs E1, E2, and E3 to measure phase voltages , ,and at the secondary. Open configuration file ES19-4.dai. Turn on thePower Supply and adjust voltage at about the same value as usedpreviously.
18. Is the sum of the three phase voltages indicated by the meter E1 + E2 + E3approximately equal to zero?
Yes No
19. Observe the voltage phasors on the Phasor Analyzer. Does the displayconfirm they are equal with a 120° phase shift between each of them?
Yes No
20. Turn off the Power Supply without modifying the setting of the voltagecontrol. Connect meter input E2 to measure phase voltage on theprimary side. Turn on the power and compare the voltage phasor of onthe primary side with that of on the secondary side. Does the PhasorAnalyzer display show that the voltages are equal and in phase, except forpossibly a small difference due to transformer reactance?
Yes No
21. Ensure that the Power Supply is turned off, and that the voltage control knobis turned fully counterclockwise. Remove all leads and cables.

Ex. 9-1 – Three-Phase Transformer Connections Conclusion
© Festo Didactic 584079 303
In this exercise, you connected transformer windings in three-phase delta-delta and wye-wye configurations, and measured winding voltages to ensure that secondary windings were connected with the proper phase relationships. You confirmed that the voltage within a delta was zero before closing the delta, and that the delta-delta and wye-wye configurations produced no phase shift between the incoming primary voltages and the outgoing secondary voltages.
1. Why is it extremely important to confirm that the delta voltage equals zerobefore the delta is closed?
a. To ensure that the secondary voltage does not become toohigh.
b. To avoid possible damage because of high current.c. To avoid a short-circuit of the primary winding.d. To maintain the secondary voltage at a constant level.
2. In a delta-delta configuration, the line voltage on the secondary side is
a. equal to the primary voltage times the inverse of the turnsratio.
b. √3 times the primary voltagec. √3 times the primary voltage times the inverse of the turns
ratio.d. 1 √3⁄ times the primary voltage.
3. The voltage across two windings in a wye-wye configuration must be
a. equal to the voltage across each winding.b. √3 times the voltage across each winding.c. less than the voltage across each winding.d. √3 times less than the voltage across each winding.
4. The voltage across two windings in a delta-delta configuration must be
a. equal to the voltage across each winding.b. √3 times the voltage across each winding.c. less than the voltage across each winding.d. √3 times less than the voltage across each winding.
5. A three-phase transformer can be
a. a single unit with three separate sets of single-phasewindings.
b. three single-phase transformers connected together.c. a single unit with one primary and three secondary
windings.d. either a or b.
CONCLUSION
REVIEW QUESTIONS


© Festo Didactic 584079 305
When you have completed this exercise, you will be familiar with the voltage and current ratios of three-phase transformers connected in delta-wye and wye-delta configurations. Measurements of primary and secondary voltages will demonstrate that these configurations create a phase shift between the incoming and outgoing voltages.
As seen in the previous exercise, primary and secondary voltages in delta-delta and wye-wye connections are in phase and the voltage at the secondary is equal to the voltage at the primary times the inverse of the turns ratio. In delta-wye and wye-delta connections however, there will be a 30° phase difference between the primary and secondary voltages. Also, in the delta-wye configuration, the line voltage at the secondary is equal to the line voltage at the primary times the inverse of the turn ratio times √3. On the other hand, in the wye-delta configuration, the line voltage at the secondary is equal to the line voltage at the primary times the inverse of the turn ratio times 1 √3⁄ .
The 30° phase shift between the primary and secondary does not create any problems for isolated groups of loads connected to the outgoing lines from the secondary. However, if the outgoing lines from the secondary of a three-phase transformer have to be connected in parallel with another source, the phase shift might make such a parallel connection impossible, even if the line voltages are the same. Recall that in order for three-phase circuits and sources to be connected in parallel, line voltages must be equal, have the same phase sequence, and be in phase when the parallel connection is made.
Figure 9-8 shows a three-phase transformer, with a turns ratio equal to 1:1, connected in the delta-wye configuration and feeding a three-phase load. The voltage across each primary winding equals the incoming line voltage, but the outgoing line voltage is √3 times that voltage because the voltage across any two secondary windings is √3 times greater than the voltage across a single secondary winding. Note that if the three-phase transformer had a turns ratio of 1:10, the line voltage at the secondary would be 10 √3 times greater the line voltage at the primary, because the inverse of the turns ratio is multiplied by the √3 factor. The line current in the secondary is the same as the phase current, but the line current in the primary is √3 times greater than the corresponding phase current.
Voltage and Current Relationships
Exercise 9-2
EXERCISE OBJECTIVE
DISCUSSION
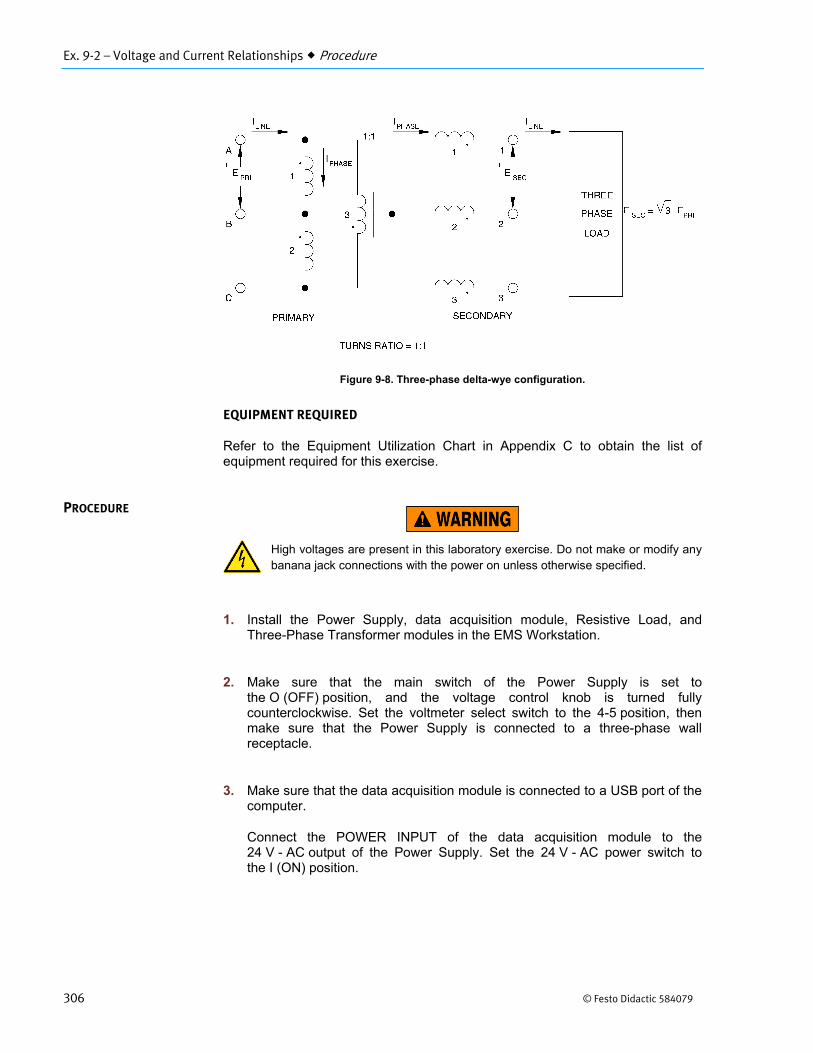
Ex. 9-2 – Voltage and Current Relationships Procedure
306 © Festo Didactic 584079
Figure 9-8. Three-phase delta-wye configuration.
EQUIPMENT REQUIRED
Refer to the Equipment Utilization Chart in Appendix C to obtain the list of equipment required for this exercise.
High voltages are present in this laboratory exercise. Do not make or modify anybanana jack connections with the power on unless otherwise specified.
1. Install the Power Supply, data acquisition module, Resistive Load, andThree-Phase Transformer modules in the EMS Workstation.
2. Make sure that the main switch of the Power Supply is set tothe O (OFF) position, and the voltage control knob is turned fullycounterclockwise. Set the voltmeter select switch to the 4-5 position, thenmake sure that the Power Supply is connected to a three-phase wallreceptacle.
3. Make sure that the data acquisition module is connected to a USB port of thecomputer.
Connect the POWER INPUT of the data acquisition module to the24 V - AC output of the Power Supply. Set the 24 V - AC power switch tothe I (ON) position.
PROCEDURE
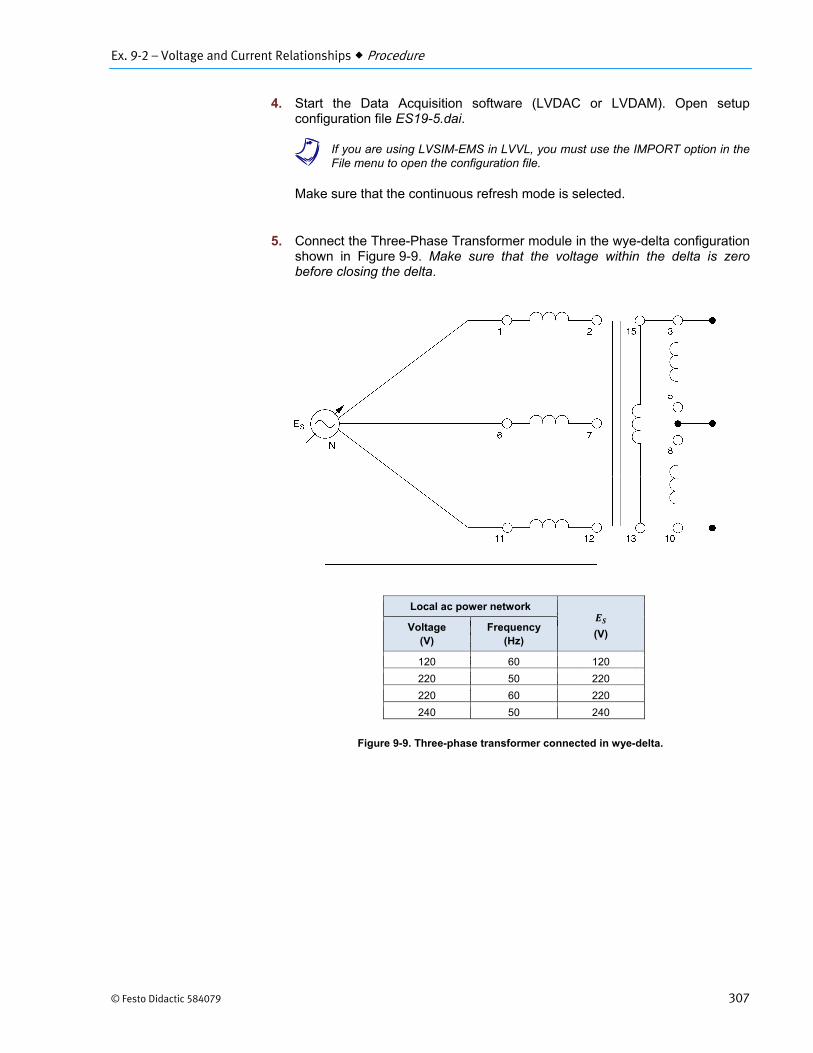
Ex. 9-2 – Voltage and Current Relationships Procedure
© Festo Didactic 584079 307
4. Start the Data Acquisition software (LVDAC or LVDAM). Open setupconfiguration file ES19-5.dai.
a If you are using LVSIM-EMS in LVVL, you must use the IMPORT option in theFile menu to open the configuration file.
Make sure that the continuous refresh mode is selected.
5. Connect the Three-Phase Transformer module in the wye-delta configurationshown in Figure 9-9. Make sure that the voltage within the delta is zerobefore closing the delta.
Figure 9-9. Three-phase transformer connected in wye-delta.
Local ac power network
(V) Voltage
(V) Frequency
(Hz)
120 60 120
220 50 220
220 60 220
240 50 240

Ex. 9-2 – Voltage and Current Relationships Procedure
308 © Festo Didactic 584079
6. Turn on the Power Supply and adjust the voltage control to obtain the line-to-line voltage given in Figure 9-9. Connect meter inputs E1, E2, and E3 tomeasure the line voltages at the primary and record the results. Record alsothe average value of the primary line voltage given by the meter (E1, E2, E3).
V
V
V
Average line voltage (primary) V
7. Observe the voltage phasors on the Phasor Analyzer. Are theyapproximately equal with a 120° phase shift between each of them?
Yes No
8. Turn off the Power Supply without modifying the setting of the voltagecontrol. Connect meter inputs E1, E2, and E3 to now measure the linevoltages at the secondary. Open configuration file ES19-6.dai. Turn on thePower Supply and record the line voltages as well as the average value ofthe secondary line voltage (meter E1, E2, E3).
V
V
V
Average line voltage (secondary) V
9. Observe the voltage phasors on the Phasor Analyzer. Does the displayconfirm they are equal with a 120° phase shift between each of them?
Yes No
10. Turn off the power without modifying the setting of the voltage control.Connect meter input E2 to measure line voltage on the primary side.Open configuration file ES19-7.dai. Turn on the power and compare thevoltage phasor of on the primary side with that of on the secondaryside. Does the Phasor Analyzer display confirm a phase shift of around 30°between the two?
Yes No
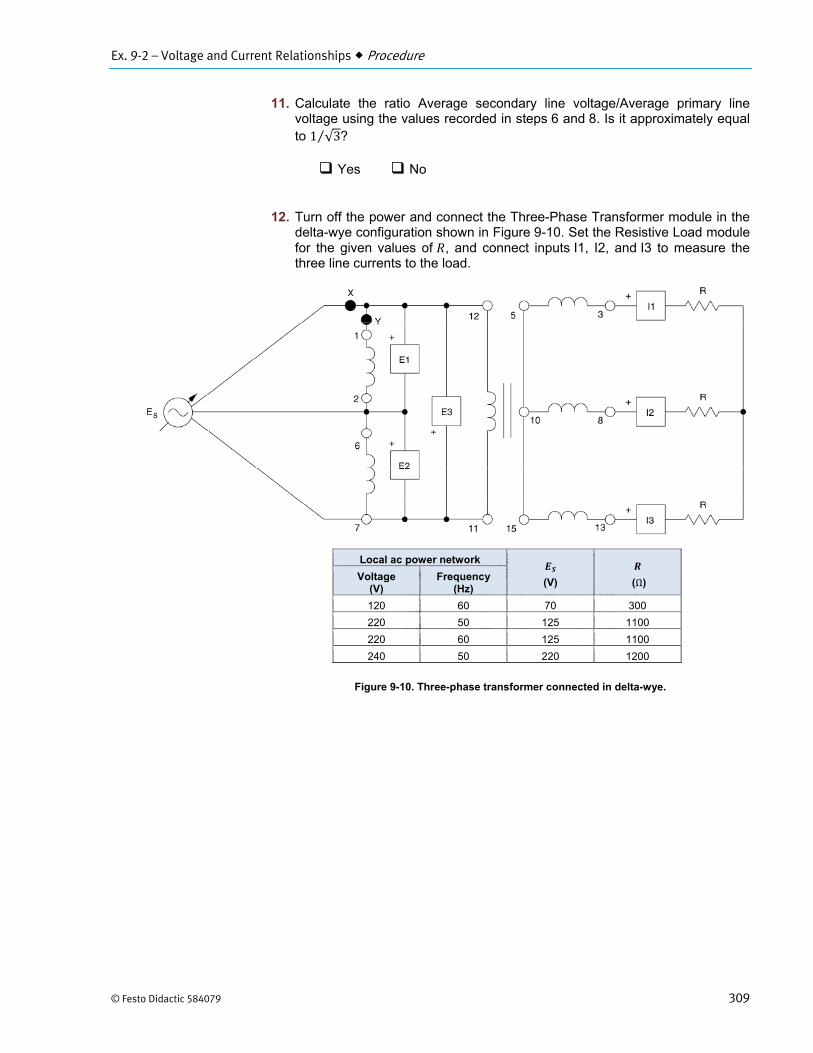
Ex. 9-2 – Voltage and Current Relationships Procedure
© Festo Didactic 584079 309
11. Calculate the ratio Average secondary line voltage/Average primary linevoltage using the values recorded in steps 6 and 8. Is it approximately equalto 1 √3⁄ ?
Yes No
12. Turn off the power and connect the Three-Phase Transformer module in thedelta-wye configuration shown in Figure 9-10. Set the Resistive Load modulefor the given values of , and connect inputs I1, I2, and I3 to measure thethree line currents to the load.
Figure 9-10. Three-phase transformer connected in delta-wye.
Local ac power network
(V)
(Ω) Voltage
(V) Frequency
(Hz)
120 60 70 300
220 50 125 1100
220 60 125 1100
240 50 220 1200
Ex. 9-2 – Voltage and Current Relationships Procedure
310 © Festo Didactic 584079
13. Connect inputs E1, E2, and E3 to measure the line voltages at the primary,turn on the Power Supply, and adjust the voltage control knob to obtain theline-to-line voltage of given in Figure 9-10. Open configurationfile ES19-8.dai. Record the value of the line voltages, as well as the averagevalue of the primary line voltage [meter Avg (E1, E2, E3)].
V
V
V
Average line voltage (primary) V
14. Observe the voltage and current phasors on the Phasor Analyzer. Does thedisplay confirm that the voltage and current phasors are virtually in phase?
Yes No
15. Turn off the power without modifying the setting of the voltage control.Connect meter inputs E1, E2, and E3 to now measure the line voltages ‐ ,
‐ , and ‐ on the secondary side. Open configuration file ES19-9.dai.Turn on the Power Supply. Does the Phasor Analyzer display show that thevoltage phasors lead the current phasors by 30°?
Yes No
a Since the currents in the secondary are in phase with the voltages in theprimary, the Phasor Analyzer display is equivalent to observing all voltage phasors at the same time, except for the difference in scale between the parameters.
16. Return to the Metering application and record the measured values for theline voltages at the secondary, and also the average value of the secondaryline voltage [meter Avg (E1, E2, E3)].
V
V
V
Average line voltage (secondary) V
Ex. 9-2 – Voltage and Current Relationships Procedure
© Festo Didactic 584079 311
17. Calculate the ratio Average secondary line voltage/Average primary linevoltage using the values recorded in steps 13 and 16. Is it approximatelyequal to √3?
Yes No
18. Turn off the power and connect meter inputs I1 and I2 to measure the lineand phase currents on the primary side of the delta-wye configuration byopening the circuit at points X and Y shown in Figure 9-10. Remember toreconnect the load resistors at the secondary when meter inputs I1 and I2are disconnected.
19. Open configuration file ES19-10.dai. Turn on the power and calculate theratio ⁄ for the primary circuit using the measured currents. Is theratio approximately equal to √3?
Yes No
20. Is the line current on the primary side approximately equal to the line currenton the secondary side?
Yes No
21. Ensure that the Power Supply is turned off, and that the voltage control knobis turned fully counterclockwise. Remove all leads and cables.
Ex. 9-2 – Voltage and Current Relationships Conclusion
312 © Festo Didactic 584079
In this exercise, you connected a 1:1 three-phase transformer in wye-delta and delta-wye configurations, and saw that the line voltage between primary and secondary either increased or decreased by a √3 factor. You also confirmed that the outgoing line voltages at the secondary were shifted 30° with respect to the incoming line voltages at the primary.
1. Delta-wye and wye-delta configurations both produce
a. increases in the secondary voltages and currents.b. decreases in the secondary voltages and currents.c. phase shifts between the incoming and outgoing line
voltages.d. additional √3 increases in the secondary voltages and
currents.
2. The line voltage at the secondary of a 10:1 wye-delta connected transformerwill be
a. equal to the line voltage at the primary times 1 √3⁄ .b. equal to the line voltage at the primary times √3.c. equal to the line voltage at the primary times
0.1 times 1 √3⁄ .d. equal to the line voltage at the primary times 0.1 times √3.
3. The line voltage at the secondary of a delta-wye connected transformer is
a. greater than it is with a wye-delta connection.b. less than it is with a wye-delta connection.c. the same as it is with a wye-delta connection.d. only dependent on the turns ratio.
4. The sum of the phase voltages in three-phase transformers
a. depends on the connection.b. equals zero when the transformers are properly connected.c. is √3 times the turns ratio.d. can only be determined when a load is connected to the
secondary.
5. Before three-phase transformers are put into service
a. the phase sequence of the incoming lines must be verified.b. the winding connections must be checked to ensure proper
phase relationship.c. the load must be balanced.d. the phase shift must be measured.
CONCLUSION
REVIEW QUESTIONS
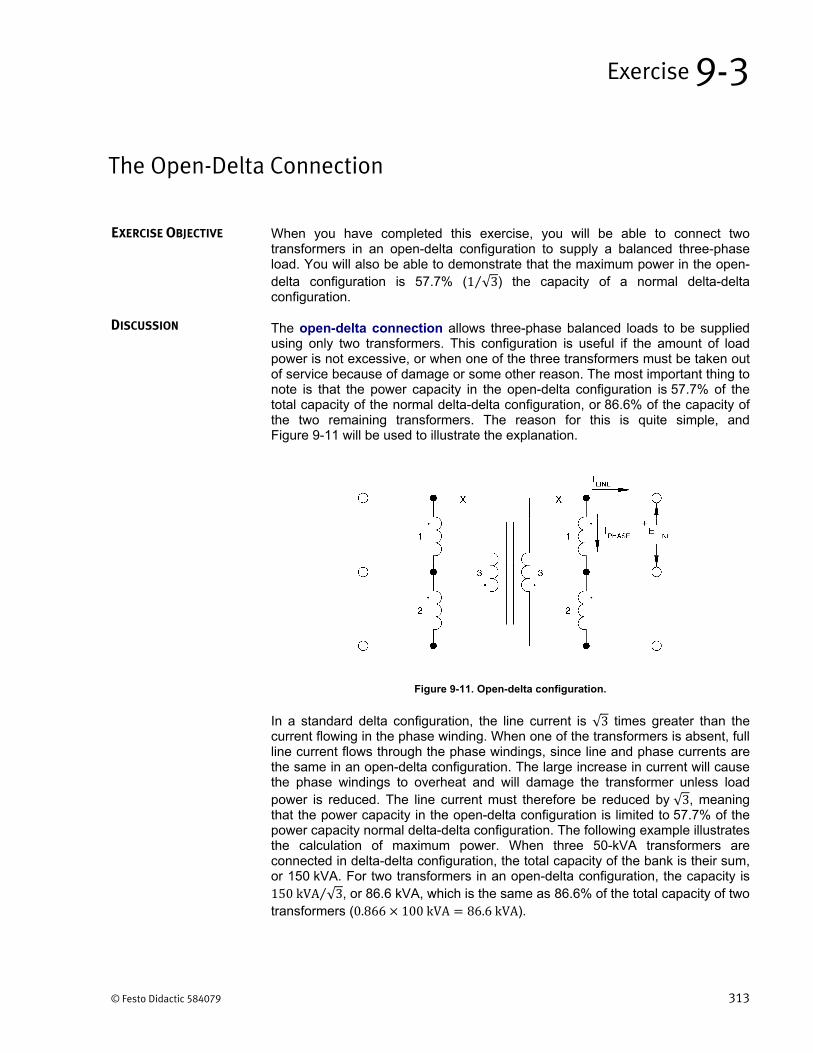
© Festo Didactic 584079 313
When you have completed this exercise, you will be able to connect two transformers in an open-delta configuration to supply a balanced three-phase load. You will also be able to demonstrate that the maximum power in the open-delta configuration is 57.7% (1 √3⁄ ) the capacity of a normal delta-delta configuration.
The open-delta connection allows three-phase balanced loads to be supplied using only two transformers. This configuration is useful if the amount of load power is not excessive, or when one of the three transformers must be taken out of service because of damage or some other reason. The most important thing to note is that the power capacity in the open-delta configuration is 57.7% of the total capacity of the normal delta-delta configuration, or 86.6% of the capacity of the two remaining transformers. The reason for this is quite simple, and Figure 9-11 will be used to illustrate the explanation.
Figure 9-11. Open-delta configuration.
In a standard delta configuration, the line current is √3 times greater than the current flowing in the phase winding. When one of the transformers is absent, full line current flows through the phase windings, since line and phase currents are the same in an open-delta configuration. The large increase in current will cause the phase windings to overheat and will damage the transformer unless load power is reduced. The line current must therefore be reduced by √3, meaning that the power capacity in the open-delta configuration is limited to 57.7% of the power capacity normal delta-delta configuration. The following example illustrates the calculation of maximum power. When three 50-kVA transformers are connected in delta-delta configuration, the total capacity of the bank is their sum, or 150 kVA. For two transformers in an open-delta configuration, the capacity is 150kVA √3⁄ , or 86.6 kVA, which is the same as 86.6% of the total capacity of two transformers (0.866 100kVA 86.6kVA).
The Open-Delta Connection
Exercise 9-3
EXERCISE OBJECTIVE
DISCUSSION
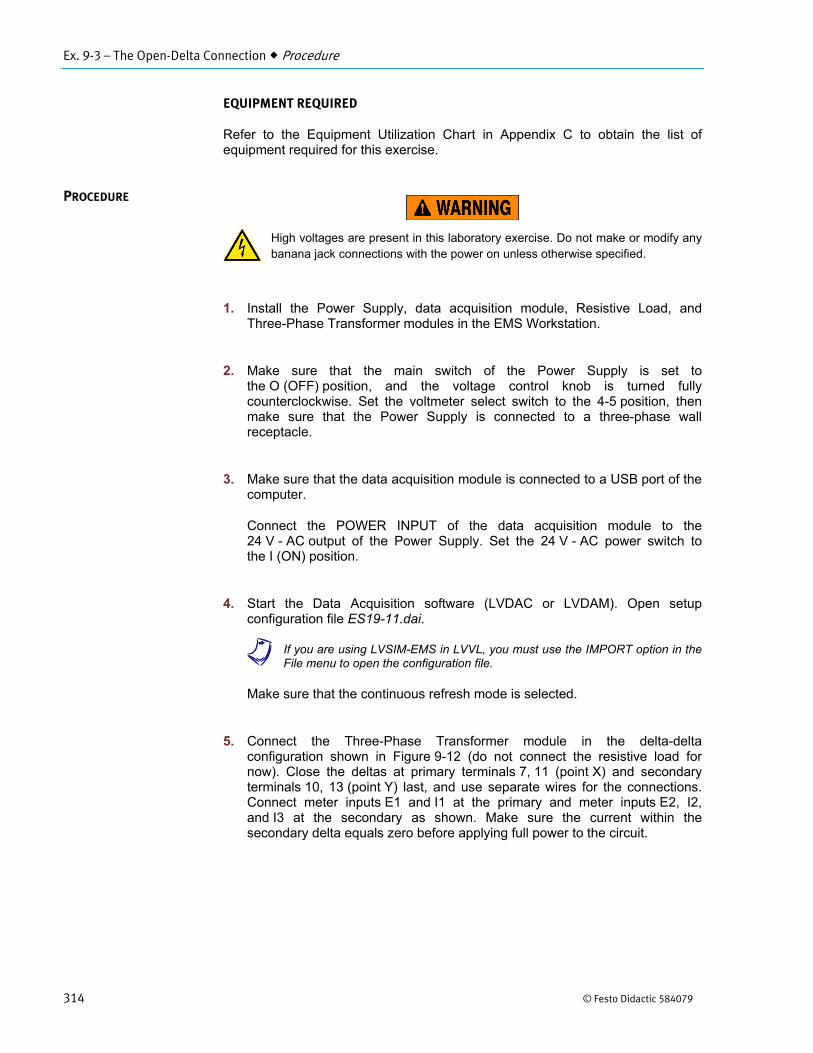
Ex. 9-3 – The Open-Delta Connection Procedure
314 © Festo Didactic 584079
EQUIPMENT REQUIRED
Refer to the Equipment Utilization Chart in Appendix C to obtain the list of equipment required for this exercise.
High voltages are present in this laboratory exercise. Do not make or modify anybanana jack connections with the power on unless otherwise specified.
1. Install the Power Supply, data acquisition module, Resistive Load, andThree-Phase Transformer modules in the EMS Workstation.
2. Make sure that the main switch of the Power Supply is set tothe O (OFF) position, and the voltage control knob is turned fullycounterclockwise. Set the voltmeter select switch to the 4-5 position, thenmake sure that the Power Supply is connected to a three-phase wallreceptacle.
3. Make sure that the data acquisition module is connected to a USB port of thecomputer.
Connect the POWER INPUT of the data acquisition module to the24 V - AC output of the Power Supply. Set the 24 V - AC power switch tothe I (ON) position.
4. Start the Data Acquisition software (LVDAC or LVDAM). Open setupconfiguration file ES19-11.dai.
a If you are using LVSIM-EMS in LVVL, you must use the IMPORT option in theFile menu to open the configuration file.
Make sure that the continuous refresh mode is selected.
5. Connect the Three-Phase Transformer module in the delta-deltaconfiguration shown in Figure 9-12 (do not connect the resistive load fornow). Close the deltas at primary terminals 7, 11 (point X) and secondaryterminals 10, 13 (point Y) last, and use separate wires for the connections.Connect meter inputs E1 and I1 at the primary and meter inputs E2, I2,and I3 at the secondary as shown. Make sure the current within thesecondary delta equals zero before applying full power to the circuit.
PROCEDURE
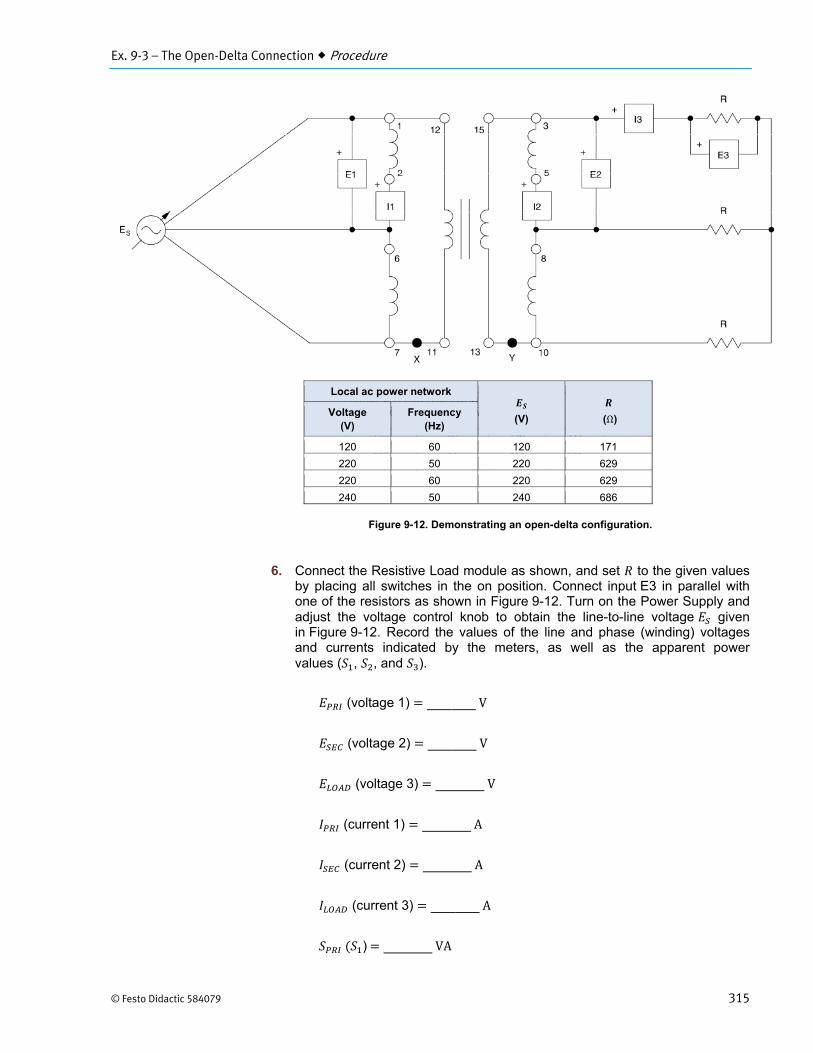
Ex. 9-3 – The Open-Delta Connection Procedure
© Festo Didactic 584079 315
Figure 9-12. Demonstrating an open-delta configuration.
6. Connect the Resistive Load module as shown, and set to the given valuesby placing all switches in the on position. Connect input E3 in parallel withone of the resistors as shown in Figure 9-12. Turn on the Power Supply andadjust the voltage control knob to obtain the line-to-line voltage givenin Figure 9-12. Record the values of the line and phase (winding) voltagesand currents indicated by the meters, as well as the apparent powervalues ( , , and ).
(voltage 1) V
(voltage 2) V
(voltage 3) V
(current 1) A
(current 2) A
(current 3) A
) VA
Local ac power network
(V)
(Ω) Voltage
(V) Frequency
(Hz)
120 60 120 171
220 50 220 629
220 60 220 629
240 50 240 686
Ex. 9-3 – The Open-Delta Connection Procedure
316 © Festo Didactic 584079
) VA
) VA
7. Do the meters show that the primary and secondary line voltages and are equal, and the current in the primary windings equals thatflowing in the secondary windings ( )?
Yes No
8. Is the line current to the load around √3 times greater than the phasecurrent in the secondary winding ?
Yes No
a Observe also that the load voltage is √3 times less than the line voltageat the secondary .
9. Carefully open the primary delta at point X by disconnecting the wire atprimary terminal 11, and observe the change in line and phase currents.
Exercise caution when you open the delta since high voltage is present on the wire.
10. Do the phase currents at the primary and secondary ( and ) increaseby a large amount, as well as the apparent power values and ?
Yes No
11. Is the increase approximately equal to √3?
Yes No
12. With the open-delta configuration, does the phase current in the secondarynow equal the line current to the load?
Yes No
Ex. 9-3 – The Open-Delta Connection Procedure
© Festo Didactic 584079 317
13. Close the delta at point X, and open the secondary at point Y bydisconnecting the wire at terminal 13.
Again, exercise caution with the open connection since high voltage is present on the wire.
Do you observe the same results as in the previous steps?
Yes No
14. Turn off the power without readjusting the voltage control. Remove theconnecting wires completely between primary terminals 7, 11 and secondaryterminals 10, 13.
15. Turn on the power. Since the load power requirement has not changed, arethe currents in the primary and secondary windings still at the same highlevel?
Yes No
16. By what amount should the load resistance be increased to lower thecurrents in the windings to the value measured in step 6? Note thatincreasing load resistance lowers the current flowing in the load, hence loadpower.
17. Adjust the value of the load resistors so that the same winding current is asclose as possible to the value measured in step 6. What value do youobtain?
a The Resistive Load module was initially set with all three resistors in parallel toobtain the value indicated in Figure 9-12. As you have observed, selecting thesingle smallest value on the module now gives a load resistance that isincreased by √3. Consequently, the winding current is reduced by the samefactor and should equal its previous value.
18. Record the apparent power values and indicated by the meters.
VA
VA
Ex. 9-3 – The Open-Delta Connection Procedure
318 © Festo Didactic 584079
19. Is the value of apparent power approximately 57.7% less than thatmeasured in step 6, thus confirming that load power must be reduced toavoid exceeding the current rating of the transformer windings?
Yes No
20. Turn off the power without readjusting the voltage control and reconnect thedeltas at terminals 7, 11, and terminals 10, 13. Connect meter inputs E1, E2,E3, I1, I2, and I3 to measure the line voltages and line currents at thesecondary.
21. Turn on the Power Supply and then use the Phasor Analyzer to observe thevoltage and current phasors. Once again, open the deltas at the primary, andthen the secondary in the same sequence as in steps 9 and 13.
22. Does the Phasor Analyzer display confirm that there is no change in thethree-phase load voltages and currents?
Yes No
23. Ensure that the Power Supply is turned off, and that the voltage control knobis turned fully counterclockwise. Remove all leads and cables.
Ex. 9-3 – The Open-Delta Connection Conclusion
© Festo Didactic 584079 319
In this exercise, you set up a three-phase transformer in the open-delta configuration and observed that it supplies a three-phase load with voltages and currents in the proper phase relationships. You also demonstrated that load power must be reduced by 57.7% (1 √3⁄ ) to avoid exceeding the current rating of the phase windings.
1. A three-phase transformer in the open-delta configuration can supply
a. the same load power as in the delta-delta configuration.b. only 57.7% of the power in the delta-delta configurationc. only 86.6% of the power in the delta-delta configuration.d. only 67% of the power of two transformers.
2. What will happen to the current in the windings of a three-phase transformerin delta-delta configuration if one of the transformers is disconnected fromthe line?
a. Nothing.b. They will decrease.c. They will increase by 33.3%.d. They will increase to about 1.73 times the previous value.
3. The main advantage of an open-delta configuration is that
a. three-phase balanced loads can still be supplied, but atreduced power.
b. only two transformers are needed to supply the samepower.
c. it is simpler to understand.d. the line voltages across the windings are reduced by √3.
4. A wye-connected load is supplied using an open-delta configuration. Thevoltages across the individual load branches are
a. √3 times greater than with a delta-delta configuration.b. √3 times smaller than with a delta-delta configuration.c. the same as with a delta-delta configuration.d. the same as with a wye-delta configuration.
5. Two 100 kVA, 7200 V : 1000 V single-phase transformers are connected inan open-delta configuration to supply a three-phase load. The maximum loadpower that can be supplied will be
a. 100 kVAb. 200 kVAc. 300 kVAd. 173 kVA
CONCLUSION
REVIEW QUESTIONS


Unit 9 – Three-Phase Transformers Unit Test
© Festo Didactic 584079 321
Unit Test
1. The line voltage at the secondary of a three-phase transformer connected inthe delta-wye configuration is 208 V. What is the line voltage at the primaryknowing that the turns ratio is 10:1?
a. 2080 Vb. 1200 Vc. 3600 Vd. 3280 V
2. What is the most important thing to check when connecting the secondarywindings of a three-phase transformer in delta?
a. That the secondary voltage equals zero with the primary disconnected.b. That the phase wires are well connected.c. That the voltage within the delta equals zero before it is closed.d. That the primary voltage is the proper value.
3. In a delta-wye configuration, the line voltage on the secondary side is
a. the same value as the line voltage at the primary.b. √3 times the line voltage at the primary multiplied by the inverse of the
turns ratio.c. equal to the line voltage at the primary times the inverse of the turns
ratio.d. 1 √3⁄ times the line voltage at the primary.
4. The voltage across two secondary windings in a wye-delta configurationmust be
a. equal to the voltage across each winding.b. √3 times greater than the voltage across each winding.c. less than the voltage across each winding.d. √3 times less than the voltage across each winding.
5. What will be the line voltage at the secondary if 1000 V is applied to theprimary of a delta-wye connected transformer with a turns ratio of 1:5?
a. 8660 Vb. 5000 Vc. 1000 Vd. 2887 V
6. Delta-delta, delta-wye, wye-wye, and wye-delta refer to
a. different types of single-phase circuits.b. different ways of connecting three-phase transformers.c. different types of phase measurement circuits.d. both a and b.
Unit 9 – Three-Phase Transformers Unit Test
322 © Festo Didactic 584079
7. A delta-delta connected transformer can supply
a. three times as much load power as an open-delta connectedtransformer.
b. √3 times more load power than an open-delta connected transformer.c. 86.6% more power than an open-delta connected transformer.d. 57.7% more power than an open-delta connected transformer.
8. A main advantage of a delta-connected primary is that
a. three-phase balanced loads can still be supplied, but at reduced power.b. only three line wires are needed to distribute the phases.c. the neutral current will be minimized.d. the line voltage across the windings is the same.
9. A delta-connected load is supplied using an open-delta configuration. Thevoltages across the individual load branches are
a. √3 times greater than with a delta-delta configuration.b. √3 times smaller than with a delta-delta configuration.c. the same as with a delta-delta configuration.d. the same as with a wye-delta configuration.
10. Two 50 kVA, 750 V:175 V single-phase transformers are connected in anopen-delta configuration to supply a three-phase load. The maximum loadpower that can be supplied will be
a. 57.7 kVAb. 86.6 kVAc. 100 kVAd. 173 kVA
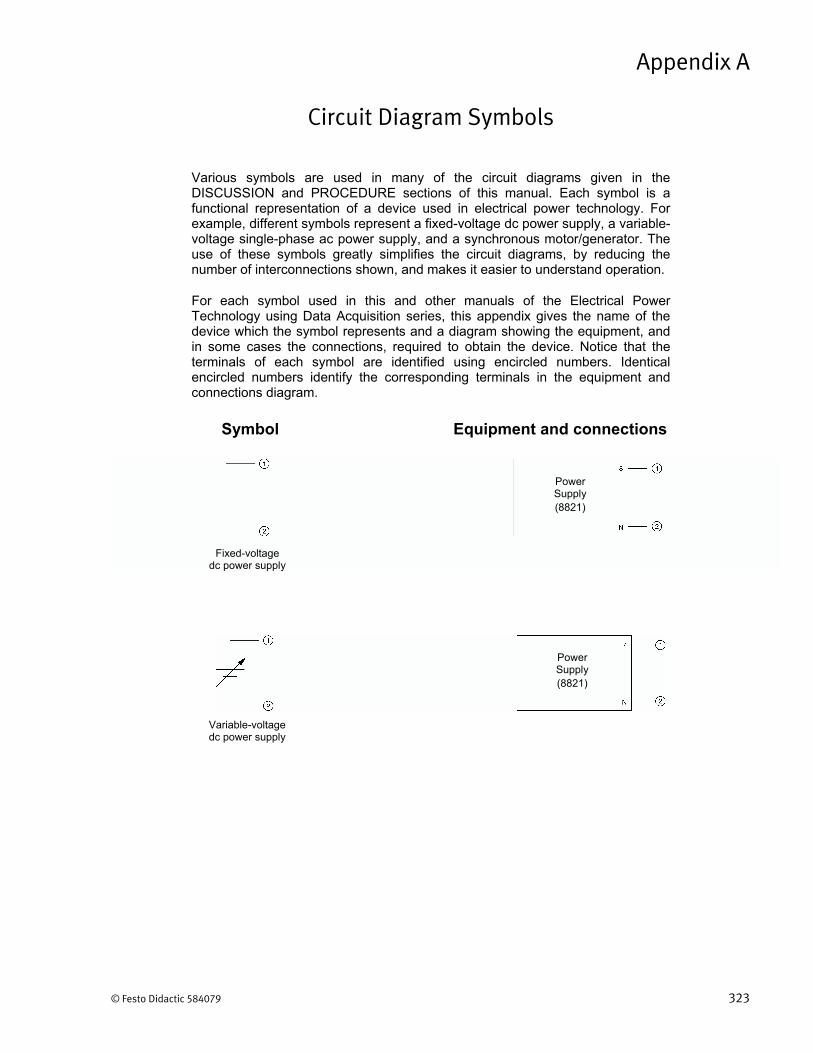
© Festo Didactic 584079 323
Various symbols are used in many of the circuit diagrams given in the DISCUSSION and PROCEDURE sections of this manual. Each symbol is a functional representation of a device used in electrical power technology. For example, different symbols represent a fixed-voltage dc power supply, a variable-voltage single-phase ac power supply, and a synchronous motor/generator. The use of these symbols greatly simplifies the circuit diagrams, by reducing the number of interconnections shown, and makes it easier to understand operation.
For each symbol used in this and other manuals of the Electrical Power Technology using Data Acquisition series, this appendix gives the name of the device which the symbol represents and a diagram showing the equipment, and in some cases the connections, required to obtain the device. Notice that the terminals of each symbol are identified using encircled numbers. Identical encircled numbers identify the corresponding terminals in the equipment and connections diagram.
Circuit Diagram Symbols
Appendix A
Equipment and connectionsSymbol
Fixed-voltage dc power supply
Power Supply (8821)
Variable-voltage dc power supply
Power Supply (8821)
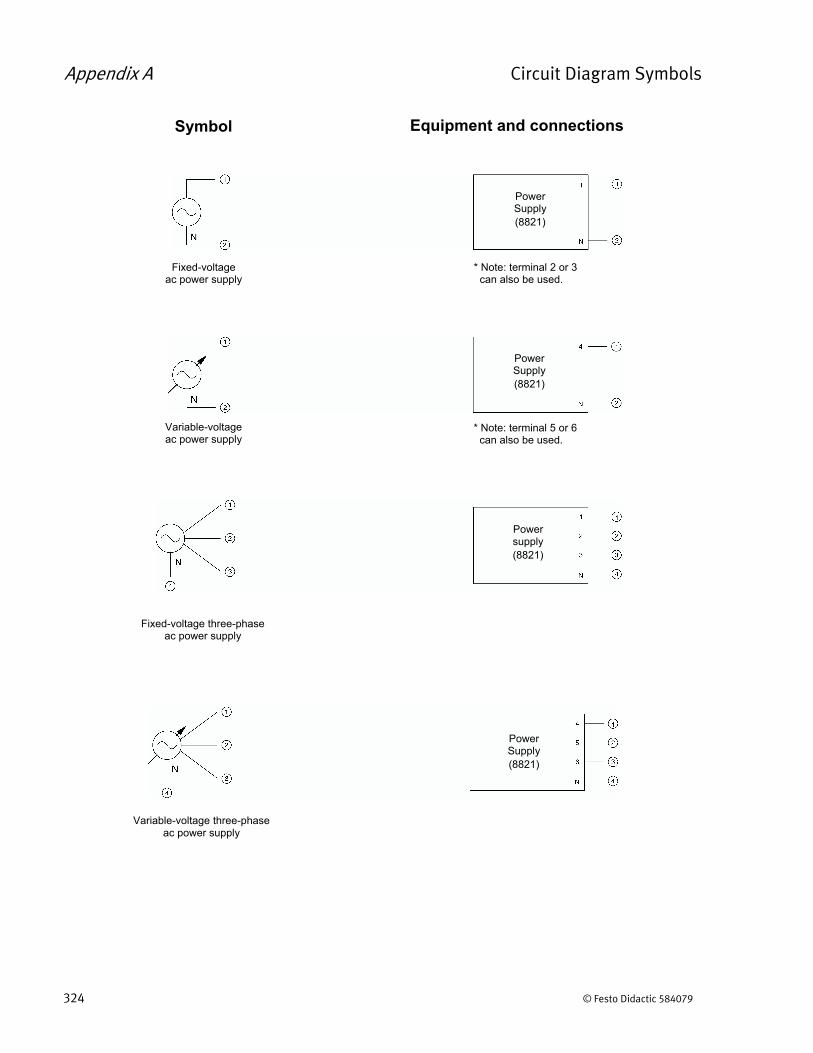
Appendix A Circuit Diagram Symbols
324 © Festo Didactic 584079
Equipment and connectionsSymbol
Fixed-voltage ac power supply
Power Supply (8821)
* Note: terminal 2 or 3can also be used.
Variable-voltage ac power supply
Power Supply (8821)
* Note: terminal 5 or 6can also be used.
Fixed-voltage three-phase ac power supply
Power supply (8821)
Power Supply (8821)
Variable-voltage three-phase ac power supply
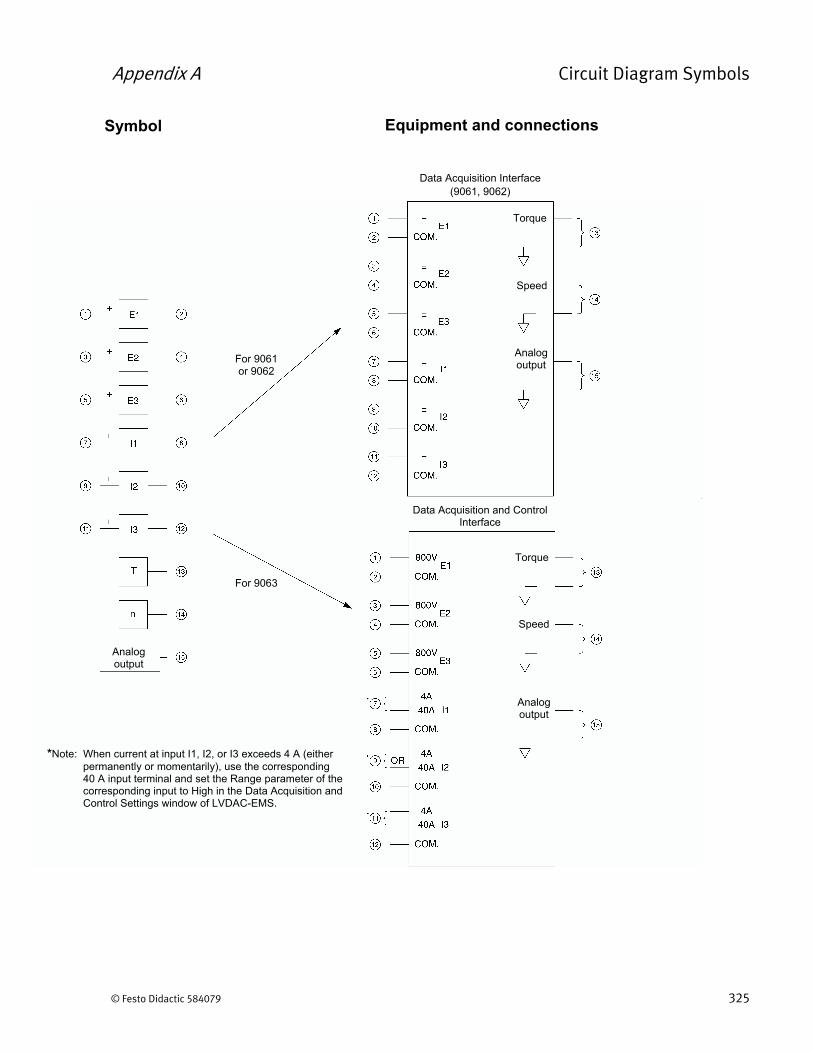
Appendix A Circuit Diagram Symbols
© Festo Didactic 584079 325
Equipment and connectionsSymbol
Data Acquisition Interface (9061, 9062)
*Note: When current at input I1, I2, or I3 exceeds 4 A (eitherpermanently or momentarily), use the corresponding 40 A input terminal and set the Range parameter of the corresponding input to High in the Data Acquisition and Control Settings window of LVDAC-EMS.
For 9061 or 9062
For 9063
Torque
Speed
Analog output
Torque
Speed
Analog output
Data Acquisition and Control Interface
Analog output
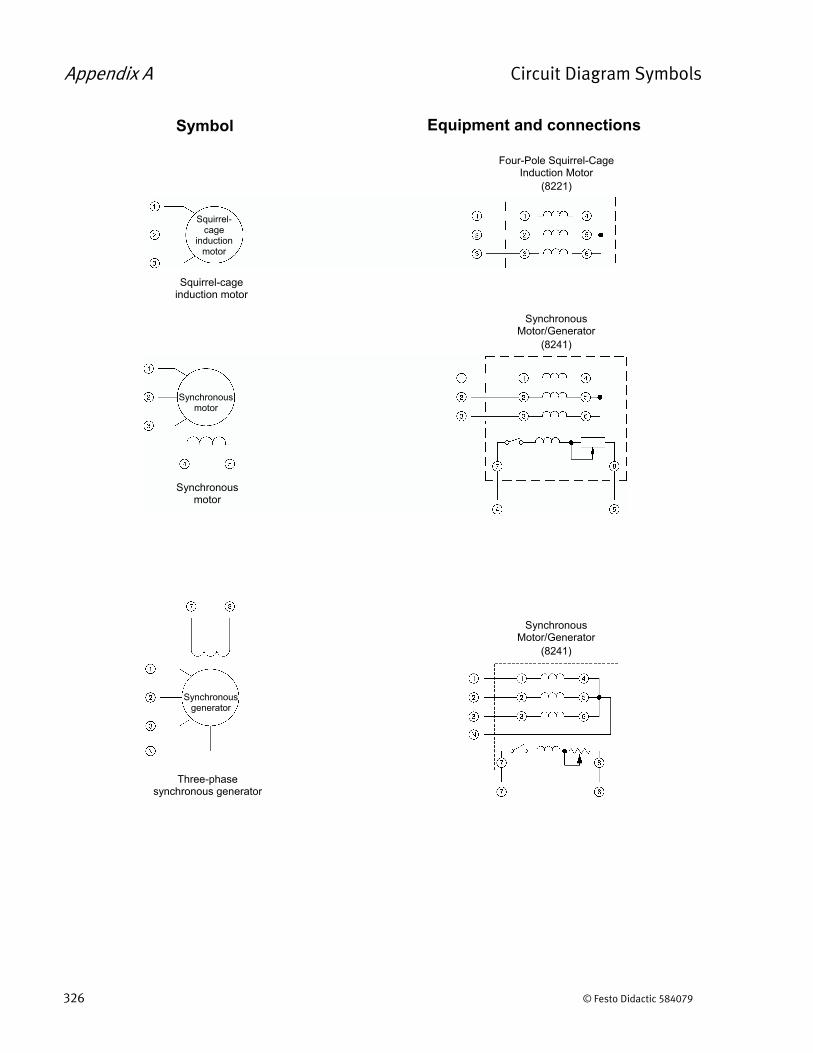
Appendix A Circuit Diagram Symbols
326 © Festo Didactic 584079
Equipment and connectionsSymbol
Four-Pole Squirrel-Cage Induction Motor
(8221)
Squirrel-cage induction motor
Squirrel- cage
induction motor
Synchronous Motor/Generator
(8241)
Synchronous motor
Synchronous motor
Synchronous Motor/Generator
(8241)
Synchronous generator
Three-phase synchronous generator
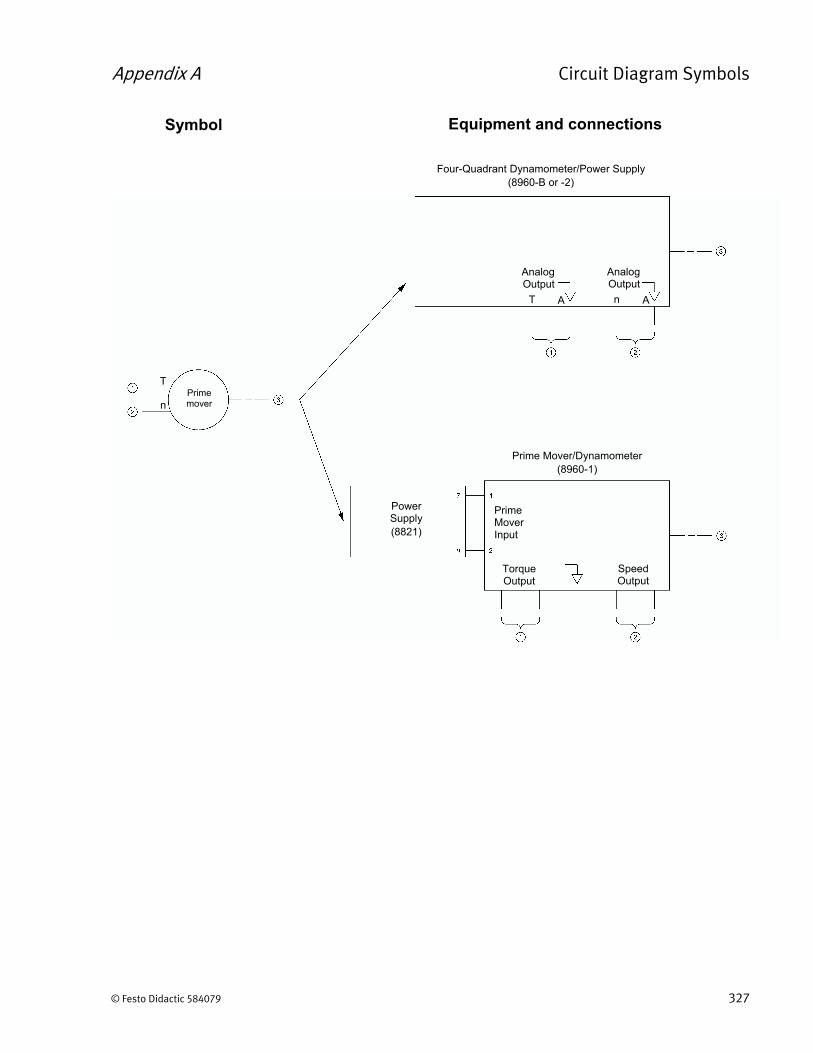
Appendix A Circuit Diagram Symbols
© Festo Didactic 584079 327
Four-Quadrant Dynamometer/Power Supply (8960-B or -2)
AnalogOutput
T A n A
AnalogOutput
Prime mover
Power Supply (8821)
Prime Mover/Dynamometer (8960-1)
Prime Mover Input
Torque Output
Speed Output
Equipment and connectionsSymbol
T
n
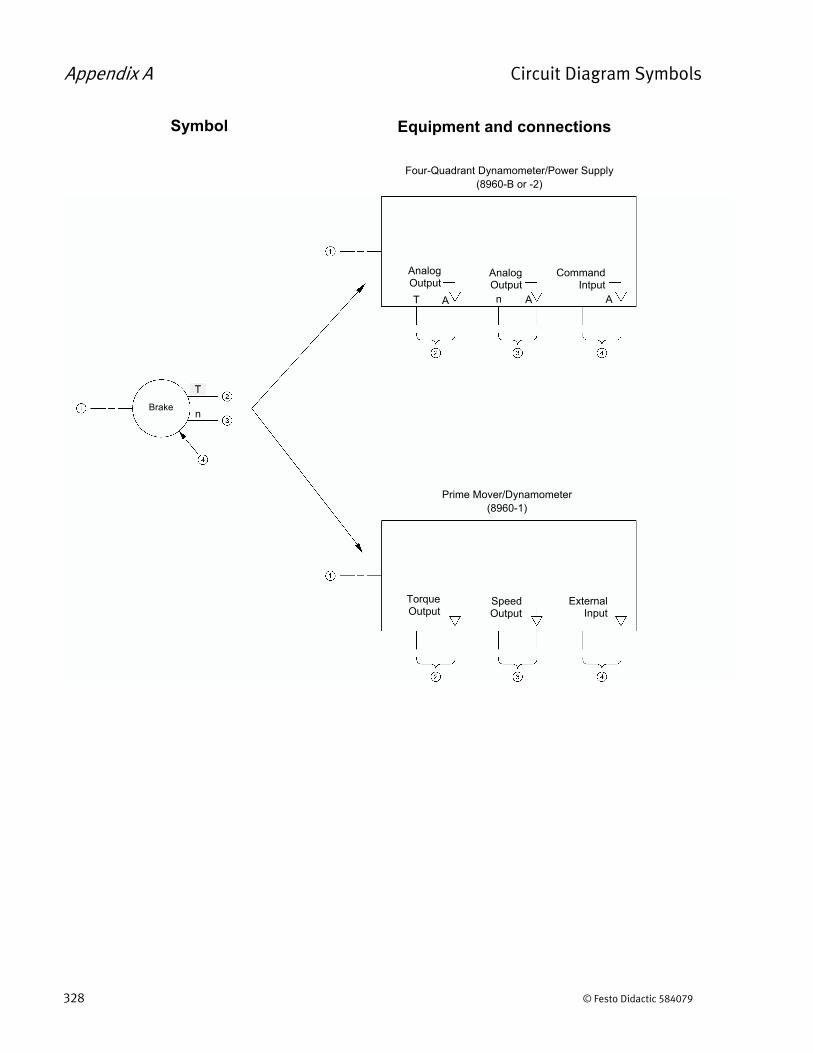
Appendix A Circuit Diagram Symbols
328 © Festo Didactic 584079
Four-Quadrant Dynamometer/Power Supply (8960-B or -2)
AnalogOutput
T A n A
AnalogOutput
CommandIntput
A
Prime Mover/Dynamometer (8960-1)
TorqueOutput
SpeedOutput
ExternalInput
Brake
Equipment and connectionsSymbol
T
n
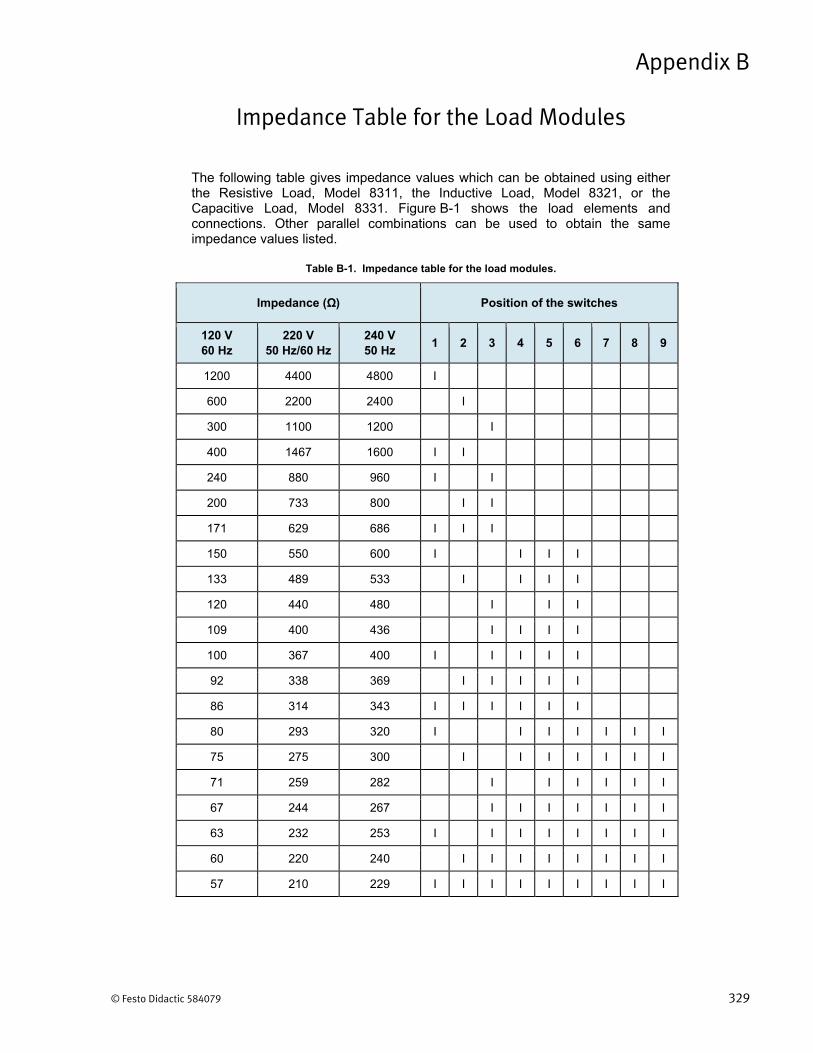
© Festo Didactic 584079 329
The following table gives impedance values which can be obtained using either the Resistive Load, Model 8311, the Inductive Load, Model 8321, or the Capacitive Load, Model 8331. Figure B-1 shows the load elements and connections. Other parallel combinations can be used to obtain the same impedance values listed.
Table B-1. Impedance table for the load modules.
Impedance (Ω) Position of the switches
120 V 60 Hz
220 V 50 Hz/60 Hz
240 V 50 Hz
1 2 3 4 5 6 7 8 9
1200 4400 4800 I
600 2200 2400 I
300 1100 1200 I
400 1467 1600 I I
240 880 960 I I
200 733 800 I I
171 629 686 I I I
150 550 600 I I I I
133 489 533 I I I I
120 440 480 I I I
109 400 436 I I I I
100 367 400 I I I I I
92 338 369 I I I I I
86 314 343 I I I I I I
80 293 320 I I I I I I I
75 275 300 I I I I I I I
71 259 282 I I I I I I
67 244 267 I I I I I I I
63 232 253 I I I I I I I I
60 220 240 I I I I I I I I
57 210 229 I I I I I I I I I
Impedance Table for the Load Modules
Appendix B
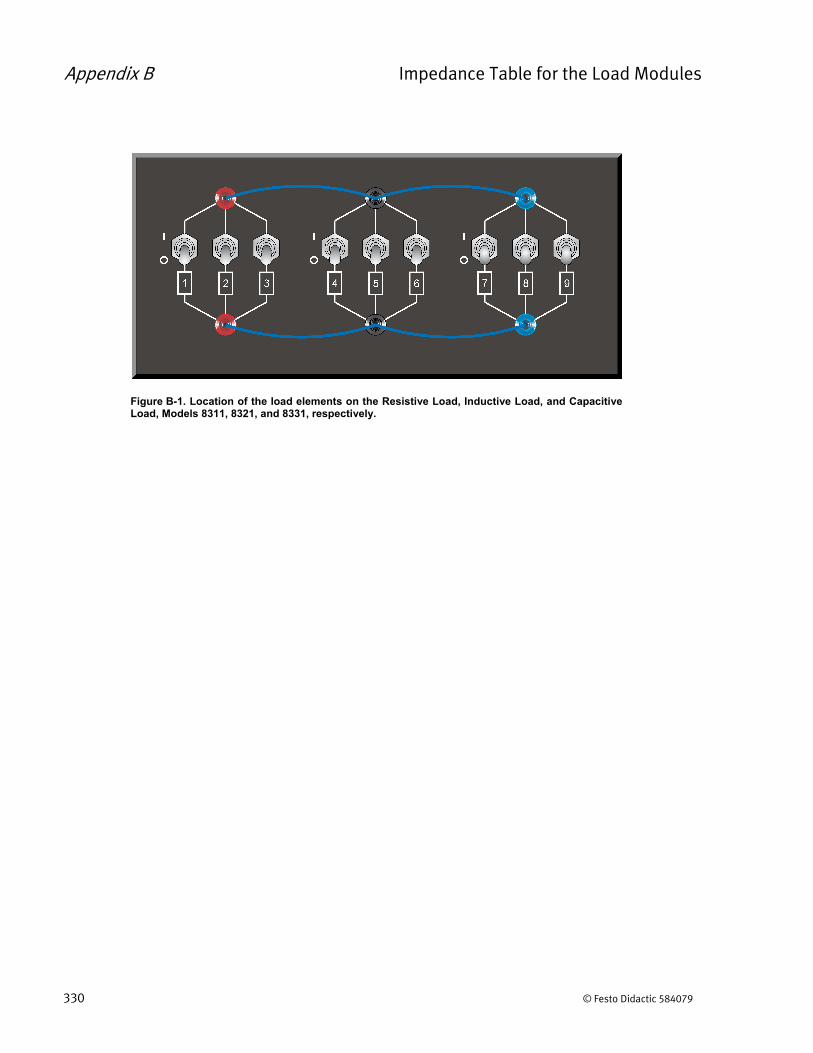
Appendix B Impedance Table for the Load Modules
330 © Festo Didactic 584079
Figure B-1. Location of the load elements on the Resistive Load, Inductive Load, and Capacitive Load, Models 8311, 8321, and 8331, respectively.
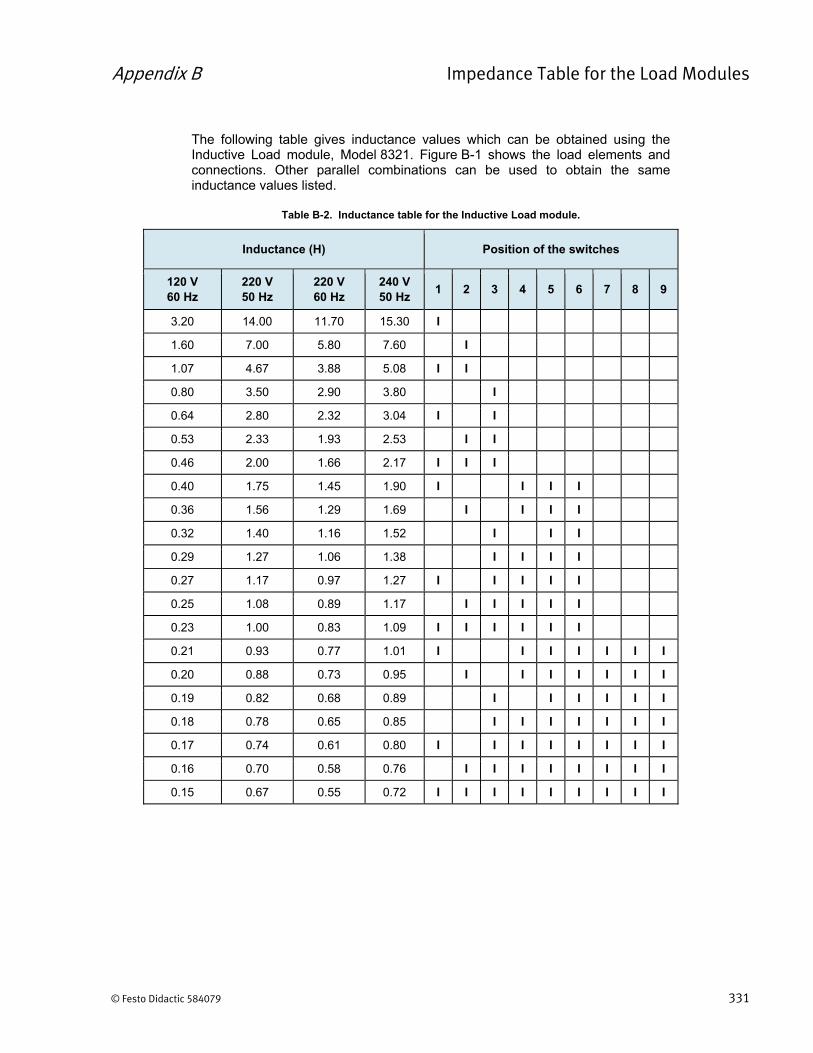
Appendix B Impedance Table for the Load Modules
© Festo Didactic 584079 331
The following table gives inductance values which can be obtained using the Inductive Load module, Model 8321. Figure B-1 shows the load elements and connections. Other parallel combinations can be used to obtain the same inductance values listed.
Table B-2. Inductance table for the Inductive Load module.
Inductance (H) Position of the switches
120 V 60 Hz
220 V 50 Hz
220 V 60 Hz
240 V 50 Hz
1 2 3 4 5 6 7 8 9
3.20 14.00 11.70 15.30 I
1.60 7.00 5.80 7.60 I
1.07 4.67 3.88 5.08 I I
0.80 3.50 2.90 3.80 I
0.64 2.80 2.32 3.04 I I
0.53 2.33 1.93 2.53 I I
0.46 2.00 1.66 2.17 I I I
0.40 1.75 1.45 1.90 I I I I
0.36 1.56 1.29 1.69 I I I I
0.32 1.40 1.16 1.52 I I I
0.29 1.27 1.06 1.38 I I I I
0.27 1.17 0.97 1.27 I I I I I
0.25 1.08 0.89 1.17 I I I I I
0.23 1.00 0.83 1.09 I I I I I I
0.21 0.93 0.77 1.01 I I I I I I I
0.20 0.88 0.73 0.95 I I I I I I I
0.19 0.82 0.68 0.89 I I I I I I
0.18 0.78 0.65 0.85 I I I I I I I
0.17 0.74 0.61 0.80 I I I I I I I I
0.16 0.70 0.58 0.76 I I I I I I I I
0.15 0.67 0.55 0.72 I I I I I I I I I

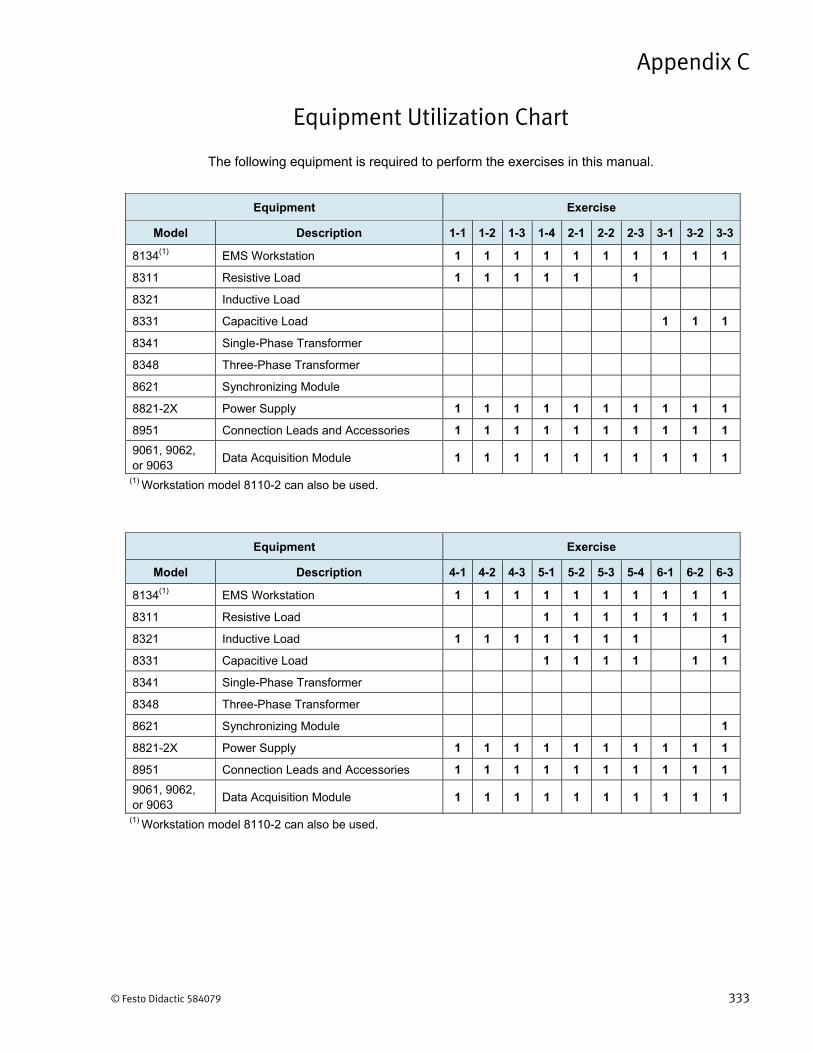
© Festo Didactic 584079 333
The following equipment is required to perform the exercises in this manual.
Equipment Exercise
Model Description 1-1 1-2 1-3 1-4 2-1 2-2 2-3 3-1 3-2 3-3
8134(1) EMS Workstation 1 1 1 1 1 1 1 1 1 1
8311 Resistive Load 1 1 1 1 1 1
8321 Inductive Load
8331 Capacitive Load 1 1 1
8341 Single-Phase Transformer
8348 Three-Phase Transformer
8621 Synchronizing Module
8821-2X Power Supply 1 1 1 1 1 1 1 1 1 1
8951 Connection Leads and Accessories 1 1 1 1 1 1 1 1 1 1
9061, 9062, or 9063
Data Acquisition Module 1 1 1 1 1 1 1 1 1 1
(1) Workstation model 8110-2 can also be used.
Equipment Exercise
Model Description 4-1 4-2 4-3 5-1 5-2 5-3 5-4 6-1 6-2 6-3
8134(1) EMS Workstation 1 1 1 1 1 1 1 1 1 1
8311 Resistive Load 1 1 1 1 1 1 1
8321 Inductive Load 1 1 1 1 1 1 1 1
8331 Capacitive Load 1 1 1 1 1 1
8341 Single-Phase Transformer
8348 Three-Phase Transformer
8621 Synchronizing Module 1
8821-2X Power Supply 1 1 1 1 1 1 1 1 1 1
8951 Connection Leads and Accessories 1 1 1 1 1 1 1 1 1 1
9061, 9062, or 9063
Data Acquisition Module 1 1 1 1 1 1 1 1 1 1
(1) Workstation model 8110-2 can also be used.
Equipment Utilization Chart
Appendix C
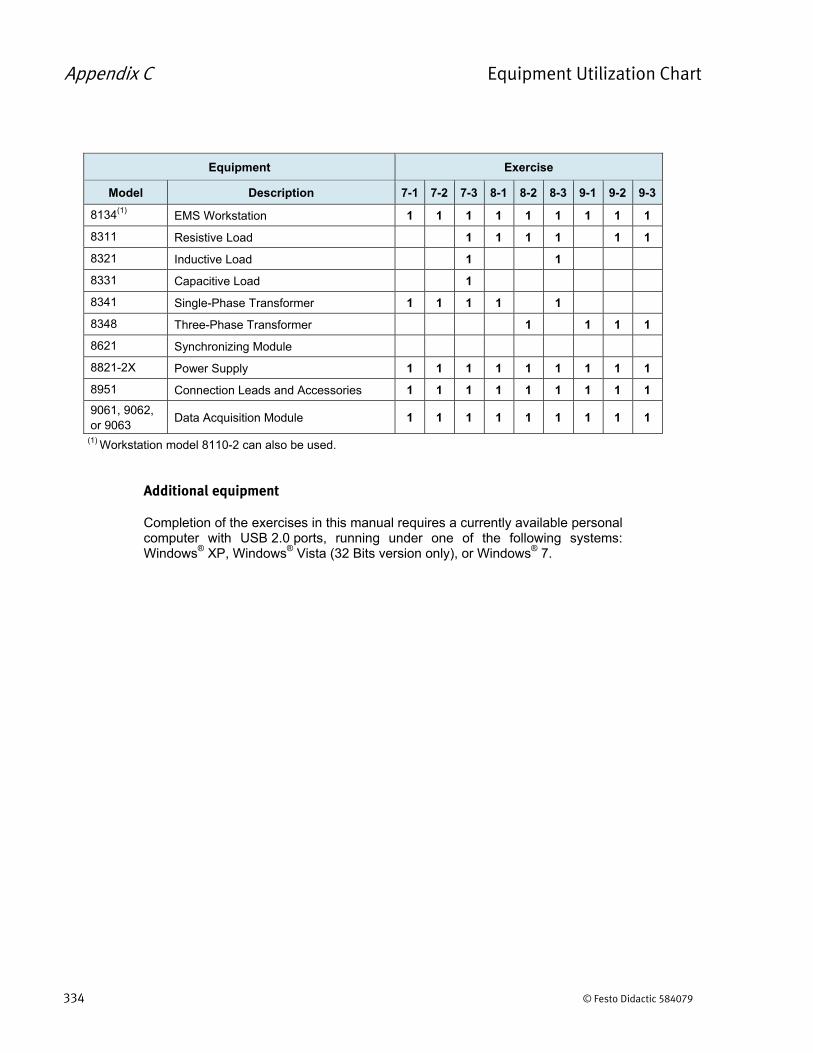
Appendix C Equipment Utilization Chart
334 © Festo Didactic 584079
Equipment Exercise
Model Description 7-1 7-2 7-3 8-1 8-2 8-3 9-1 9-2 9-3
8134(1) EMS Workstation 1 1 1 1 1 1 1 1 1
8311 Resistive Load 1 1 1 1 1 1
8321 Inductive Load 1 1
8331 Capacitive Load 1
8341 Single-Phase Transformer 1 1 1 1 1
8348 Three-Phase Transformer 1 1 1 1
8621 Synchronizing Module
8821-2X Power Supply 1 1 1 1 1 1 1 1 1
8951 Connection Leads and Accessories 1 1 1 1 1 1 1 1 1
9061, 9062, or 9063
Data Acquisition Module 1 1 1 1 1 1 1 1 1
(1) Workstation model 8110-2 can also be used.
Additional equipment
Completion of the exercises in this manual requires a currently available personal computer with USB 2.0 ports, running under one of the following systems: Windows® XP, Windows® Vista (32 Bits version only), or Windows® 7.

© Festo Didactic 584079 335
active power The real power consumed by a load in an electric circuit. It is equal to the product of the circuit rms voltage and current multiplied by the cosine of the phase angle between the circuit voltage and current waveforms. It is expressed in units of watt (W) and is equal to the apparent power when there is only resistors in the circuit.
alternating current (ac) A current which periodically reverses its direction of flow and alternately goes from a maximum positive value ( ) to a maximum negative value ( ).
apparent power The product of the circuit rms voltage and current is called apparent power and is expressed in units of volt-amperes (VA). It equals the active power only when there is no phase shift between voltage and current.
autotransformer A single-winding transformer in which the primary coil is a fraction of the entire winding for voltage step up, or the secondary coil is a fraction of the entire winding for voltage step down. Because there is only one winding, the autotransformer does not provide any isolation between the primary and secondary circuits.
balanced three-phase circuit
A three-phase ac circuit with equal impedances in each of the three load branches. The three phase voltages that energize the circuit are equal in amplitude but phase-shifted from each other by 120 .
capacitance (C) The property of a capacitor allowing it to store energy in the electric field created between its plates when a voltage is applied across them. Capacitance causes opposition to voltage changes in an electric circuit. The measurement unit for the capacitance is the farad (F).
capacitive phase shift The phase shift between the voltage and current caused by a capacitor. With an ideal capacitor, the current leads the voltage by 90.
capacitive reactance ( ) The opposition to alternating current flow created by capacitance. It is equal to ⁄ and, like resistance, is measured in ohms. However, it is dependent on the frequency of the source and the capacitance of the capacitor, as shown by the formula: 1 2⁄ .
capacitive reactive power The reactive power, expressed in var, in a capacitive ac circuit. The sign associated with capacitive var is negative to distinguish it from inductive reactive power.
copper loss Active power ( ) loss in copper-wire lines or coils.
coulomb Measurement unit of electric charge.
current The flow of electricity, i.e., the movement of electrons in matter. It is symbolized by letter " " and measured in amperes (A)
Glossary of New Terms
Appendix D

Appendix D Glossary of New Terms
336 © Festo Didactic 584079
delta connection A method of connecting a three-phase circuit in which the three branches of the source or load are connected end-to-end to form a continuous circuit loop. The three line wires are connected to the three junction nodes of the circuit. There is no circuit node to which a neutral wire can be connected in a three-phase delta-connected circuit.
delta-delta Refers to a method of connecting the primary and secondary windings in a three-phase transformer. In the delta-delta connection, the primary windings are connected in delta, and the secondary windings are also connected in delta.
delta-wye Refers to a method of connecting the primary and secondary windings in a three-phase transformer. In the delta-wye connection, the primary windings are connected in delta, and the secondary windings are connected in wye.
distribution transformer A type of transformer in which secondary windings are connected in series to obtain different load voltages.
eddy currents A circulating current induced in a conducting material by a varying magnetic field, often parasitic in nature. Such a current may, for example, flow in the iron core of a transformer.
effective value See "rms (root-mean-square) value".
efficiency The efficiency of any electrical device, expressed as a percentage, is the ratio of the active power which the device supplies ( ) to the active power supplied to the device ( ) multiplied by 100, and is symbolized by the Greek letter eta ( ). Notice that apparent power and reactive power are not used in calculating efficiency.
electric field The space surrounding an electric charge or electrically-charged body, in which electric energy acts (electric lines of force fill this space). Refer to Figure 1-1 of this manual.
electrolytic capacitor A type of polarized capacitor having a chemical electrolyte between its plates.
equivalent resistance When an electric circuit is made up of a combination of series and/or parallel resistors, the equivalent resistance is the total (resulting) resistance of the complete circuit.
electric lines of force Invisible lines associated with one or many electric charge(s) and constituting an electric field. Electric lines of force cannot intersect one another. Refer to Figure 1-1 of this manual.
exciting current The alternating current flowing in the primary winding that is necessary to create the magnetic flux in the transformer core. It is usually very small, about 2 to 5% of the nominal primary current, and can be determined by measuring the current flow in the primary winding of an unloaded transformer when nominal voltage is applied to the primary winding.
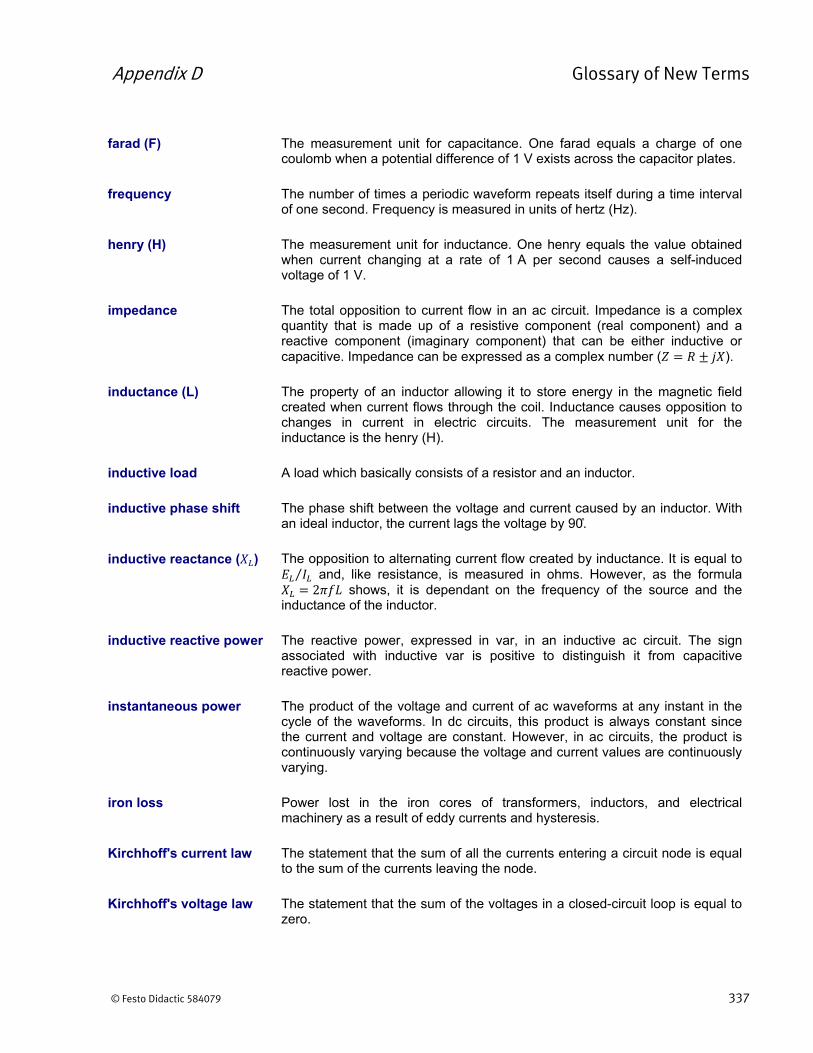
Appendix D Glossary of New Terms
© Festo Didactic 584079 337
farad (F) The measurement unit for capacitance. One farad equals a charge of one coulomb when a potential difference of 1 V exists across the capacitor plates.
frequency The number of times a periodic waveform repeats itself during a time interval of one second. Frequency is measured in units of hertz (Hz).
henry (H) The measurement unit for inductance. One henry equals the value obtained when current changing at a rate of 1 A per second causes a self-induced voltage of 1 V.
impedance The total opposition to current flow in an ac circuit. Impedance is a complex quantity that is made up of a resistive component (real component) and a reactive component (imaginary component) that can be either inductive or capacitive. Impedance can be expressed as a complex number ( ).
inductance (L) The property of an inductor allowing it to store energy in the magnetic field created when current flows through the coil. Inductance causes opposition to changes in current in electric circuits. The measurement unit for the inductance is the henry (H).
inductive load A load which basically consists of a resistor and an inductor.
inductive phase shift The phase shift between the voltage and current caused by an inductor. With an ideal inductor, the current lags the voltage by 90 .
inductive reactance ( ) The opposition to alternating current flow created by inductance. It is equal to ⁄ and, like resistance, is measured in ohms. However, as the formula
2 shows, it is dependant on the frequency of the source and the inductance of the inductor.
inductive reactive power The reactive power, expressed in var, in an inductive ac circuit. The sign associated with inductive var is positive to distinguish it from capacitive reactive power.
instantaneous power The product of the voltage and current of ac waveforms at any instant in the cycle of the waveforms. In dc circuits, this product is always constant since the current and voltage are constant. However, in ac circuits, the product is continuously varying because the voltage and current values are continuously varying.
iron loss Power lost in the iron cores of transformers, inductors, and electrical machinery as a result of eddy currents and hysteresis.
Kirchhoff's current law The statement that the sum of all the currents entering a circuit node is equal to the sum of the currents leaving the node.
Kirchhoff's voltage law The statement that the sum of the voltages in a closed-circuit loop is equal to zero.

Appendix D Glossary of New Terms
338 © Festo Didactic 584079
line current The line current in a three-phase circuit is the current measured in any line wire of the circuit. In balanced, delta-connected, three-phase circuits, the line current is √3 times higher than the phase current.
line voltage The line voltage in a three-phase circuit is the voltage measured between any two line wires of the circuit. In balanced, wye-connected, three-phase circuits, the line voltage is √3 times higher than the phase voltage.
magnetic coupling The process by which physically separate circuits are connected through magnetic lines of force. Magnetic coupling allows energy to be transferred from the primary to the secondary of a transformer.
magnetic field The region around a magnetic object in which magnetic lines of force are present.
magnetic flux The number of magnetic lines of force present in a given region.
magnetic lines of force The invisible lines representing closed magnetic paths. Magnetic lines of force cannot intersect one another, and they form closed loop that exit one pole of a magnet to enter at the other.
mutual inductance The common property of two electric circuits whereby an electromotive force (a voltage) is induced in one circuit by a change of current in the other circuit.
Ohm's law The statement of the relationship between voltage, current, and resistance. It is expressed by the formula .
open-delta Refers to a method of supplying power to a three-phase balanced load by using only two of the transformers normally used in a complete delta-delta configuration. The power demand in the open-delta configuration must be reduced to 57.7% of the normal three-transformer power capacity to prevent exceeding the nominal ratings of the two remaining transformers.
parallel circuit An electric circuit in which the current flows through more than one circuit path.
peak-to-peak amplitude The amplitude between the maximum value (positive peak) and the minimum value (negative peak) of an ac waveform. If the peak amplitude of a sine wave is , then the peak-to-peak amplitude is 2 .
periodic waveform A waveform which repeats itself in a cyclical manner over a fixed time interval called period. The frequency of a periodic waveform equals the reciprocal of the period.
phase angle A measurement of the progression in time of an ac waveform from a chosen instant. Phase angle is often used to express the amount of separation between two ac waveforms having the same frequency. Phase angles are usually expressed in angular degrees.

Appendix D Glossary of New Terms
© Festo Didactic 584079 339
phase current The phase current in a three-phase circuit is the current measured in any phase of the circuit (i.e., the current flowing in each element of a three-phase load). In balanced, delta-connected, three-phase circuits, the phase current is √3 times lower than the line current.
phase sequence The sequence in which the phase voltages attain their maximum values in a three-phase circuit. The usual shorthand form of indicating phase sequence is A-B-C, which is the same as the sequences B-C-A and C-A-B. The oppositephase sequence to A-B-C is A-C-B (C-B-A, B-A-C).
phase shift The separation in time between two ac waveforms. Phase shifts are often measured using phase angles.
phase voltage The phase voltage in a three-phase circuit is the voltage measured between any line wire and the neutral wire of the circuit. In balanced, wye-connected, three phase circuits, the phase voltage is √3 times lower than the line voltage.
phasor A complex number, that is, a quantity containing both real ( ) and imaginary ( ) components. In rectangular coordinates, a complex number is written as . A complex number can also be written using polar coordinates, i.e. , where is the magnitude and is the phase angle. Complex numbers
under the polar form can be used to represent the amplitude and phase angle of voltage and current sine waves.
power Energy produced, or dissipated, per unit of time. It is symbolized by letter " " and measured in watts (W).
power factor (cos ) The ratio between the active power and the apparent power supplied to an ac circuit load. In ac circuits where the voltage and current are sine waves, the power factor is equal to the cosine of the phase angle between voltage and current (cos ). In symbolic form: cos ⁄ .
power factor correction The addition of reactance to an ac circuit in a way that reduces the apparent power draw on the ac source. This causes the ratio of active power to apparent power to be increased or improved.
primary winding The side of a transformer to which an ac power source is usually connected.
reactive power In an ac circuit, power that swings back and forth between the source of power and the load. It is equal to the product of the circuit rms voltage and current multiplied by the sine of the phase angle between the circuit voltage and current waveforms. It is expressed in units of var (volt-amperes reactive) and equals the apparent power when there is no circuit resistance.
resistance The opposition to current flow in an electric circuit. It is symbolized by letter " " and measured in ohms (Ω).
Appendix D Glossary of New Terms
340 © Festo Didactic 584079
rms (root-mean-square) value or effective value
The equivalent dc voltage or current that produces the same heating effect in a resistor as a given ac voltage or current. For sine waves, the rms value corresponds to 0.707 (1 √2⁄ ) times the peak value.
secondary winding The side of a transformer to which a load is usually connected.
series circuit An electric circuit in which the current flows through only one circuit path.
series-aiding Refers to the method of connecting transformer windings so that the winding voltages add together because they are in phase. In this method of connection, a marked transformer terminal is connected in series with an unmarked terminal. This is similar to connecting two dc batteries in series, with the positive terminal of one battery connected to the negative terminal of the other. The resulting voltage across the two batteries will be the sum of the two battery voltages.
series-opposing Refers to the method of connecting transformer windings so that the winding voltages subtract because they are 180 out of phase with each other. In this method of connection, a marked transformer terminal is connected in series with another marked terminal. This is similar to connecting two dc batteries in series, with the negative terminal of one battery connected to the negative terminal of the other. The resulting voltage across the two batteries will be the difference of the two battery voltages.
sine wave A periodic waveform that alternates between maximum positive and negative values over one complete cycle. The instantaneous amplitude of a sine wave over a cycle changes in accordance with the mathematical sine function and its average value over a complete cycle is zero.
three-phase power system
A polyphase system in which three voltages , , and have an equal magnitude and are displaced 120° from each other.
three-phase transformer A transformer with three separate sets of primary and secondary windings that allows three-phase circuits to be operated from a three-phase power source. Three individual single-phase transformers with identical ratings can be connected together to form a three-phase transformer bank.
transformer regulation Refers to the variation in the transformer secondary voltage as the load changes from no load to full load. Percentage transformer regulation equals 100 , where is the no-load voltage and is the full-load voltage.
turns ratio The turns ratio of a transformer is the ratio of the number of turns of wire in the primary winding ( or ) to the number of turns of wire in the secondary winding ( or ). The ratio determines the input-output relationship of a transformer and is expressed ⁄ , or ⁄ .

Appendix D Glossary of New Terms
© Festo Didactic 584079 341
two-wattmeter method A method of measuring power in three-phase circuits, in which two-single phase wattmeters are connected across the three line wires so that the total power is the algebraic sum of the two wattmeter readings. In this method, the two current coils are connected to measure the current in two of the line wires while the two voltage coils measure the voltage between these two line wires and the remaining line wire. The neutral wire is not connected to the wattmeters.
var A graphical representation of a quantity that has magnitude and direction. Generally, vectors are drawn as a straight-line arrow in the x-y plane. The length of the arrow corresponds to the magnitude of the quantity represented by the vector. The angle between the arrow and the positive-value x-axis corresponds to the direction of the quantity represented by the vector.
vector A graphical representation of a quantity that has magnitude and direction. Generally, vectors are drawn as a straight-line arrow in the x-y plane. The length of the arrow corresponds to the magnitude of the quantity represented by the vector. The angle between the arrow and the positive-value x-axis corresponds to the direction of the quantity represented by the vector.
voltage The potential difference between two points in an electric circuit. It is usually symbolized by letter " " and measured in volts (V).
wattmeter Instrument which allows electrical power to be measured directly in circuits. A positive reading indicates that power flows from the input to the output of the wattmeter and vice versa.
wye connection A method of connecting a three-phase circuit in which the three branches of the source or load are connected together at a common junction point called the neutral. The three line wires are each connected to an individual circuit branch, and a neutral wire can be connected to the neutral of the circuit. However, with a balanced three-phase circuit no current flows in the neutral wire.
wye-delta Refers to a method of connecting the primary and secondary windings in a three-phase transformer. In the wye-delta connection, the primary windings are connected in wye, and the secondary windings are connected in delta.
wye-wye Refers to a method of connecting the primary and secondary windings in a three-phase transformer. In the wye-wye connection, the primary windings are connected in wye, and the secondary windings are also connected in wye.

© Festo Didactic 584079 343
Index of New Terms
a The bold page number indicates the main entry. Refer to Appendix D fordefinitions of new terms.
active power ................................................... 78, 95, 123, 133, 137, 186, 199, 238 alternating current (ac) ......................................................................................... 47 apparent power ...................................................... 78, 96, 133, 137, 200, 238, 265 autotransformer .......................................................................................... 265, 267
balanced three-phase circuit ...................................................................... 183, 200
capacitance ................................................................................ 77, 79, 87, 95, 138 capacitive phase shift ..................................................................................... 78, 95 capacitive reactance ................................................ 77, 79, 88, 138, 147, 157, 165 capacitive reactive power ................................................................... 106, 133, 138 copper loss ......................................................................................................... 238 current .................................................................................... 1, 5, 23, 51, 107, 134
delta connection ................................................................................................. 186 delta-delta .................................................................................. 293, 295, 305, 313 delta-wye ............................................................................................ 293, 295, 305 distribution transformer .............................................................................. 265, 266
eddy currents ..................................................................................................... 238 effective value ...................................................................................................... 53 efficiency .................................................................................................... 278, 336 electric field .......................................................................................... 1, 77, 79, 87 electrolytic capacitor............................................................................................. 87 equivalent resistance ............................................................................. 13, 33, 115 exciting current ................................................................................................... 240
farad ............................................................................................................... 77, 87 frequency ............................................................... 47, 51, 53, 68, 79, 96, 124, 145
henry .......................................................................................................... 105, 115
impedance .................................................................................................. 134, 165 inductance .................................................................................. 105, 115, 123, 137 inductive load ..................................................................................................... 137 inductive phase shift................................................................................... 105, 123 inductive reactance ............................................ 105, 107, 116, 133, 147, 157, 165 inductive reactive power .................................................................... 106, 133, 138 instantaneous power ........................................................................ 67, 78, 96, 124 iron loss .............................................................................................................. 238
Kirchhoff's voltage and current laws ................................................................ 3, 33
line current ......................................................................................... 133, 186, 313 line voltage ......................................................................................... 185, 293, 305
magnetic coupling .............................................................................................. 238 magnetic field ............................................................................. 105, 115, 138, 183 magnetic flux ...................................................................................... 238, 240, 268 mutual inductance .............................................................................................. 238
Index of New Terms
344 © Festo Didactic 584079
Ohm's law ............................................................................... 3, 5, 33, 80, 107, 165 open-delta connection ........................................................................................ 313
parallel circuits ......................................................................... 3, 33, 135, 157, 165 peak-to-peak amplitude........................................................................................ 53 periodic waveform ................................................................................................ 47 phase angle .......................................................................................................... 49 phase current ..................................................................................................... 186 phase sequence ................................................................................. 184, 223, 305 phase shift ............................................................................................................ 49 phase voltage ............................................................................................. 185, 186 phasors .............................................................................................. 134, 145, 157 power..................................... 1, 23, 53, 67, 78, 207, 212, 214, 218, 241, 278, 336 power factor ............................................................................... 133, 137, 200, 257 power factor correction ....................................................................................... 138 primary winding .......................................................................................... 237, 239
reactive power ................................................................ 78, 96, 133, 137, 278, 336 resistance ............................................................... 1, 3, 5, 23, 77, 87, 95, 124, 238 rms (root-mean-square) value ............................................................................. 53
secondary winding ..................................................................................... 237, 239 series circuits ........................................................................... 3, 33, 135, 146, 165 series-aiding ............................................................................................... 237, 266 series-opposing .................................................................................................. 237 sine wave ................................................................................................. 47, 51, 67
three-phase power system ................................................................. 186, 223, 293 three-phase transformer..................................................................... 293, 295, 305 transformer regulation ................................................................................ 238, 257 turns ratio ........................................................................... 237, 239, 257, 268, 305 two-wattmeter method ........................................................................................ 204
vector.................................................................................. 134, 138, 145, 157, 166 voltage .................................................................................................. 1, 5, 23, 107
wattmeter ....................................................................................................... 67, 78 wye connection .................................................................................................. 186 wye-delta ............................................................................................ 293, 295, 305 wye-wye ............................................................................................. 293, 295, 305

© Festo Didactic 584079 345
Bibliography
Jackson, Herbert W. Introduction to Electric Circuits, 5th edition, New Jersey: Prentice Hall, 1981. ISBN 0-13-481432-0
Wildi, Theodore. Electrical Machines, Drives, and Power Systems, 2nd edition, New Jersey: Prentice Hall, 1991. ISBN 0-13-251547-4.