Embed Size (px)
Citation preview
UPTEC-F12027
Examensarbete 30 hpAugusti 2012
Empirical evaluation of a stochastic model for order book dynamics
Simon Hagerlind
Teknisk- naturvetenskaplig fakultet UTH-enheten Besöksadress: Ångströmlaboratoriet Lägerhyddsvägen 1 Hus 4, Plan 0 Postadress: Box 536 751 21 Uppsala Telefon: 018 – 471 30 03 Telefax: 018 – 471 30 00 Hemsida: http://www.teknat.uu.se/student
Abstract
Empirical evaluation of a stochastic model for orderbook dynamics
Simon Hagerlind
Abstract A stochastic model for order book dynamics is proposed in Cont et al. (2010) and empirically evaluated in this thesis. Arrival rates of limit, market and cancellation orders are described in terms of a Markov chain where the arrival rates are exponentially distributed. The model not only considers the best bid and ask queues but also additional price levels of the order book. Methods for computing several quantities important to high frequency trading are proposed using Laplace transforms and continued fractions. These quantities include conditional probabilities such as the probability of a price increase depending on the profile of the order book. Computing these probabilities are supposed to be easy enough to compute analytically. However this was not the case. We failed in the inversion of the Laplace transform methods and the main reason is that the instructions in Cont et al. (2010) are not adequate when it comes to perform the inversion. Hence we draw the conclusion that the method is no good for predicting short term behavior of limit order books. For long term applications the model can be used to simulate the order book with good results.
ISSN: 1401-5757, UPTEC-F12027Examinator: Tomas NybergÄmnesgranskare: Erik EkströmHandledare: Kaj Nyström

Chapter 1
Summary in Swedish
En stokastisk modell för orderboksdynamik framställs i Cont et al. [2010]. Syftet med detta exam-
ensarbete var att implementera modellen för att evaluera dess användbarhet samt prestanda. Nästa
steg var att eventuellt förbättra modellen och till sist konstruera en strategi för högfrekvenshandel
baserat på modellen. Ankomstfrekvensen hos limiterade-, marknads- och annuleringsordrar beskrivs
med hjälp av en Markov kedja där ankomstfrekvenserna är expopnentiellt fördelade. Modellen tar
inte bara hänsyn till bästa köp och sälj ordrarna men även ytterligare prisnivåer i orderboken. Fler-
talet viktiga kvantiteter ur högfrekvenshandelssynpunkt kan beräknas med metoder som tillämpar
Laplacetransformering kombinerat med så kallade “continued fractions” eller fortsatta fraktioner.
Bland dessa kvantiteter utmärker sig sannolikheter baserade på orderbokens nuvarande tillstånd,
dessa kallas “conditional probabilities”, som kan användas för att förutspå prisändringar hos den
underliggande värdehandlingen. Enligt källan ska dessa sannolikheter vara lätta att räkna ut an-
alytiskt, tyvärr var det inte möjligt att genomföra. Detta på grund av bristande instruktioner i
källan men även brist på tid. En följd av detta är att inga förbättringar kunde göras av modellen,
möjligheter att skapa en handelsstrategi fanns inte heller. Slutsatsen blir på grund av detta att
metoden inte är så bra som det påstås i Cont et al. [2010] eftersom huvudsyftet, vilket är att man
kortsiktigt ska kunna prediktera priset, inte uppfylls. För applikationer där ett längre tidsperspektiv
är intressant kan dock modellen användas för att simulera orderboken.
v

Table of Contents
Chapter 1 Summary in Swedish . . . . . . . . . . . . . . . . . . . . . . . v
List of Tables . . . . . . . . . . . . . . . . . . . . . . . . . . . . . . . . viii
List of Figures . . . . . . . . . . . . . . . . . . . . . . . . . . . . . . . . ix
Chapter 2 Introduction . . . . . . . . . . . . . . . . . . . . . . . . . . . 1
Chapter 3 A Continuous-Time Model for a Stylized Limit Order Book . . . . 3
3.1 Limit Order Books . . . . . . . . . . . . . . . . . . . . . . . . . . . . . . . . . . . . . 3
3.2 Dynamics of the Order Book . . . . . . . . . . . . . . . . . . . . . . . . . . . . . . . 5
Chapter 4 Parameter Estimation and Order Book creation . . . . . . . . . . 9
4.1 Description of the Data Set . . . . . . . . . . . . . . . . . . . . . . . . . . . . . . . . 9
4.2 Creation of the Order Book . . . . . . . . . . . . . . . . . . . . . . . . . . . . . . . . 12
4.3 Estimation Procedure . . . . . . . . . . . . . . . . . . . . . . . . . . . . . . . . . . . 13
Chapter 5 Laplace Transform methods for Computing Conditional Probabilities 17
5.1 Laplace Transforms and First-Passage Times of Birth-Death Processes . . . . . . . . 17
5.1.1 Continued Fractions . . . . . . . . . . . . . . . . . . . . . . . . . . . . . . . . 18
5.1.2 First-Passage Times in Birth-Death Processes . . . . . . . . . . . . . . . . . . 19
5.2 Direction of Price Moves . . . . . . . . . . . . . . . . . . . . . . . . . . . . . . . . . . 20
5.3 Executing an Order Before the Midprice Moves . . . . . . . . . . . . . . . . . . . . . 25
5.4 Making the Spread . . . . . . . . . . . . . . . . . . . . . . . . . . . . . . . . . . . . . 27
vi

Chapter 6 Inverse Laplace Transform . . . . . . . . . . . . . . . . . . . . 31
6.1 Euler Method . . . . . . . . . . . . . . . . . . . . . . . . . . . . . . . . . . . . . . . . 31
6.2 Post-Widder Method . . . . . . . . . . . . . . . . . . . . . . . . . . . . . . . . . . . . 35
Chapter 7 Numerical Results . . . . . . . . . . . . . . . . . . . . . . . . 39
7.1 Long-Term Behavior . . . . . . . . . . . . . . . . . . . . . . . . . . . . . . . . . . . . 39
7.1.1 Steady-State Shape of the Order Book. . . . . . . . . . . . . . . . . . . . . . 41
7.1.2 Volatility. . . . . . . . . . . . . . . . . . . . . . . . . . . . . . . . . . . . . . . 42
7.2 Conditional Distributions . . . . . . . . . . . . . . . . . . . . . . . . . . . . . . . . . 42
7.2.1 One-Step Transition Probabilities. . . . . . . . . . . . . . . . . . . . . . . . . 42
7.2.2 Direction of Price Moves . . . . . . . . . . . . . . . . . . . . . . . . . . . . . . 43
Chapter 8 Conclusions . . . . . . . . . . . . . . . . . . . . . . . . . . . 46
vii

List of Tables
Table 4.1 Extraction from the incoming order file for Ericsson B. . . . . . . . . . . . . 11
Table 4.2 Extraction from the cancellation file for Ericsson B. . . . . . . . . . . . . . . 11
Table 4.3 Extraction from the execution file of Ericsson B. . . . . . . . . . . . . . . . . 11
Table 4.4 Extraction from the complete order book. . . . . . . . . . . . . . . . . . . . 13
Table 4.5 Estimated Parameters: Ericsson B. . . . . . . . . . . . . . . . . . . . . . . . 16
Table 7.1 Probability of an increase in midprice: empirical frequencies (i), simulation
results (ii). The numbers in the edge of the table is the size of the bid/ask
queue, i.e. position 1-1 means there was one bid order and one ask order. . . 45
viii

List of Figures
Figure 4.1 The limit order arrival rate estimated by a power law. . . . . . . . . . . . . 15
Figure 4.2 The limit order arrival rate as a function of the distance from the opposite
best quote. . . . . . . . . . . . . . . . . . . . . . . . . . . . . . . . . . . . . . 15
Figure 4.3 The cancel order arrival rate as a function of the distance from the opposite
best quote. . . . . . . . . . . . . . . . . . . . . . . . . . . . . . . . . . . . . . 16
Figure 7.1 Empirical and simulated midprice for Ericsson B. . . . . . . . . . . . . . . . 40
Figure 7.2 Steady state profile of the order book. . . . . . . . . . . . . . . . . . . . . . 41
Figure 7.3 Probability of an increase in the number of orders at a distance i from the
opposite best quote in the next change, for i = 1, ..., 5. . . . . . . . . . . . . 44
ix

Chapter 2
Introduction
In general High Frequency Trading (HFT) refers to the buying and selling of stocks, or other
securities, where the speed is crucial for success. A delay of a few milliseconds could be the difference
between a profit or a loss. Obviously even the fastest human can’t keep up with these kind of
speeds, hence automated trading is needed. The high frequency trader has developed from the more
traditional market maker whose essential profit is the spread between the prices at which he bought
and then sold. These spreads have gone from a size of a fraction of a dollar to just a penny or less.
This, combined with the fact that technology has improved over the last 10 years, has lead to that
HFT-firms have to settle for much smaller spreads. To compensate they operate in massive scale.
In 2005 the average daily trading volume of New York Stock Exchange (NYSE)-listed stocks were
2.1 billion shares and four years later the same quantity had almost tripled to 5.9 billion shares. In
the same period the average number of daily trades went up from 2.9 to 22.1 million trades which
implies the decrease of the average trade size from 724 shares per trade to 268 trades per share.
These increases can be explained by the fact that HFT is becoming increasingly common. However
the main indicator that more automated trading is taking place is the average speed of execution
which has dropped from 10.1 seconds in 2005 to just 0.7 seconds in 2009. All of the previously
named facts can be found in Durbin [2010].
Studies of financial assets in the past have mainly focused on quote-driven markets, where a
1
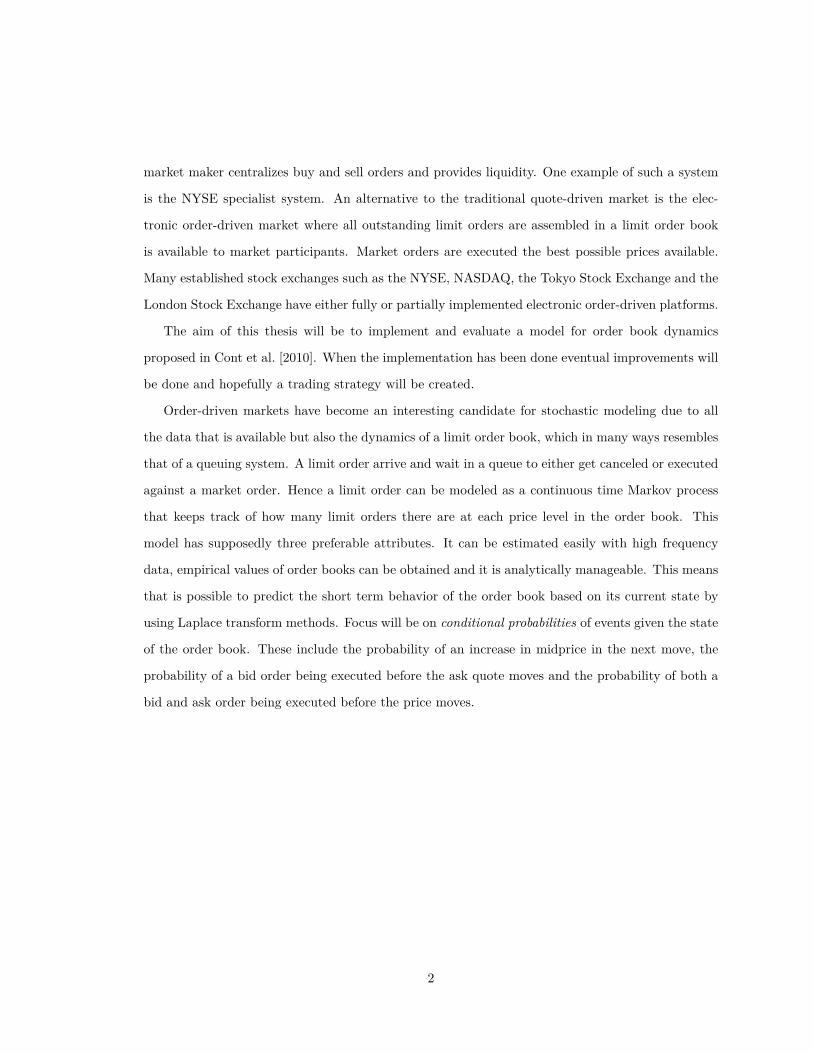
market maker centralizes buy and sell orders and provides liquidity. One example of such a system
is the NYSE specialist system. An alternative to the traditional quote-driven market is the elec-
tronic order-driven market where all outstanding limit orders are assembled in a limit order book
is available to market participants. Market orders are executed the best possible prices available.
Many established stock exchanges such as the NYSE, NASDAQ, the Tokyo Stock Exchange and the
London Stock Exchange have either fully or partially implemented electronic order-driven platforms.
The aim of this thesis will be to implement and evaluate a model for order book dynamics
proposed in Cont et al. [2010]. When the implementation has been done eventual improvements will
be done and hopefully a trading strategy will be created.
Order-driven markets have become an interesting candidate for stochastic modeling due to all
the data that is available but also the dynamics of a limit order book, which in many ways resembles
that of a queuing system. A limit order arrive and wait in a queue to either get canceled or executed
against a market order. Hence a limit order can be modeled as a continuous time Markov process
that keeps track of how many limit orders there are at each price level in the order book. This
model has supposedly three preferable attributes. It can be estimated easily with high frequency
data, empirical values of order books can be obtained and it is analytically manageable. This means
that is possible to predict the short term behavior of the order book based on its current state by
using Laplace transform methods. Focus will be on conditional probabilities of events given the state
of the order book. These include the probability of an increase in midprice in the next move, the
probability of a bid order being executed before the ask quote moves and the probability of both a
bid and ask order being executed before the price moves.
2

Chapter 3
A Continuous-Time Model for a
Stylized Limit Order Book
3.1 Limit Order Books
Consider a stock in an order-driven market. Market participants have the possibility to make
four types of orders:
1. A limit buy order
2. A limit sell order
3. A market buy order
4. A market sell order
A limit order is an order to buy or sell a particular amount of a stock at a given price. It is posted
to an electrical trading system where the state of the outstanding limit orders can be obtained by
summing up the quantities at each price level. This is called the limit order book. The highest price
associated with an outstanding limit buy order is called the bid price and the lowest sell price is
called the ask price.
3

A market order is an order to buy or sell a particular amount of the stock at the best available
price in the limit order book. An incoming market order is matched with the best available price in
the limit order book and the trade takes place. The quantity at that price level decreases and if it
is depleted the next price level will become the new bid/ask price.
A limit order stays in the order book until it is either canceled or executed against a market
order. The chance of a limit order being executed is larger if it corresponds to a price close to the
bid and the ask, in that case it will most likely be executed very quickly. On the other hand it may
take quite some time before a limit order gets executed if the requested price is too far from the
ask/bid or if the requested price moves away from the requested price. A limit order can also be
canceled at any time.
In theory a limit order can be placed as far away from the ask/bid price as one could want,
although this would probably mean that it would not get executed. To prevent this the model only
considers market where limit orders can be placed on a price grid {1, ..., n} representing multiples of
a price tick. The upper boundary n is chosen so that it is highly unlikely that any incoming order
will be larger than n within the time frame being studied. Introducing a continuous time process
X(t) ≡ (X1(t), ..., Xn(t))t≥0, where |Xp(t)| is the number of limit orders at price p, 1 ≤ p ≤ n. If
Xp(t) < 0, then there are −Xp(t) bid orders at price p. If Xp(t) > 0 then there are Xp(t) ask orders
at price p.
The ask price pA(t) is the lowest sell price in the order book. If there are no ask orders in the
order book an ask price of n+ 1 is forced. The ask price pA(t) is defined by
pA(t) = min (inf{p = 1, ..., n, Xp(t) > 0}, (n+ 1)) .
As for the ask price a bid price has to be forced when there are no bid orders in the order book.
Hence the bid price pB(t) is defined by
pB(t) = max (sup{p = 1, ..., n, Xp(t) < 0}, 0) .
4

The bid-ask spread pS(t) and the midprice pM (t) are defined by
pS(t) = pA(t)− pB(t)
and
pM (t) = pB(t) + pA(t)2 .
To highlight the depth of the order book relative to the best quotes it can be useful to use a different
notation, thus the number of buy orders at a distance i from the ask price is defined by
QBi (t) =
XpA(t)−i(t) 0 < i < pA(t)
0 pA(t) ≤ i < n
and the number of sell orders at a distance i from the bid price is defined by
QAi (t) =
XpB(t)+i(t) 0 < i < n− pB(t)
0 n− pB(t) ≤ i < n
.
3.2 Dynamics of the Order Book
Let us take a look at how incoming orders changes the order book. For a state x ∈ Znand
1 ≤ p ≤ n, define
xp±1 ≡ x± (0, ..., 1, ..., 0),
where the 1 in the vector is in the pth component. Assuming that all orders are of unit size
• a limit sell order at level p > pB(t) increases the quantity at level p : x→ xp+1
• a limit buy order at level p < pA(t) increases the quantity at level p : x→ xp−1
• a market sell order decreases the quantity at the bid price: x→ xpB(t)+1
• a market buy order decreases the quantity at the ask price: x→ xpA(t)−1
5

• a cancellation of a limit sell order at level p > pB(t) decreases the quantity at level p : x→ xp−1
• a cancellation of a limit buy order at level p < pA(t) decreases the quantity at level p : x →
xp+1
Hence the development of the order book is driven by the flow of incoming limit orders, market
orders and cancellations at each price level. The limit orders can be represented as a counting
process, the same is true for both the market orders and the cancellations. Incoming orders arrive
more frequently closer to the current ask/bid price and the rate of arrivals depend on the distance
from the ask/bid. This has been observed empirically in Bouchaud et al. [2002].
To acquire these empirical attributes in a model that is analytically manageable and allows
computations of interesting quantities a stochastic model is proposed. Modeling the events above
with independent Poisson processes gives, for i ≥ 1,
• Limit sell (respectively buy) orders arrive at a distance of i ticks from the opposite best quote
at independent, exponential times with rate λ(i),
• Market sell (respectively buy) orders arrive at independent, exponential times with rate µ,
• Cancellations of limit orders at a distance i ticks from the opposite best quote occur at a rate
proportional to the number of orders at that level. If the number of orders are x, then the
cancellation rate is θ(i)x. This can be interpreted as follows: if we have a batch of x orders,
each of which can be canceled at an exponential time with rate θ(i), then the total cancellation
rate for the entire batch is θ(i)x.
All of the events above are mutually independent.
Given the assumptions above, X is a continuous-time Markov chain with state space Zn with
transition rates given by:
x→ xp+1 with rate λ(p− pB(t)) for p > pB(t),
x→ xp−1 with rate λ(pA(t)− p) for p < pA(t),
x→ xpA(t)−1 with rate µ,
6

x→ xpB(t)+1 with rate µ,
x→ xp−1 with rate θ(p− pB(t))|xp| for p > pB(t),
x→ xp+1 with rate θ(pA(t)− p)|xp| for p < pA(t).
In the real world the ask price is always greater than the bid price, thus a state is admissible if it
fulfills
A ≡ {x ∈ Zn|∃k, l ∈ Z s.t. 1 ≤ k ≤ l ≤ n, xp ≥ 0 for p ≥ l, xp = 0 for k ≤ p ≤ l, xp ≤ 0 for p ≤ k} .
If the order books initial state is admissible, then it remains admissible with probability one. This
is shown in Cont et al. [2010]. The following proposition and proof are also from Cont et al. [2010].
Proposition 1. If θ ≡ min1≤i≤n θ(i) > 0, then X is an ergodic Markov process. In particular, X
has a proper stationary distribution.
Proof. Let N ≡ (N(t), t ≥ 0), where N(t) ≡∑np=1 |Xp(t)|, and let N be a birth-death process
with birth rate given by λ ≡ 2∑np=1 λ(p) and death rate in state i, µi ≡ 2µ + iθ. Notice that N
increases by one at a rate bounded from above by λ and decreases by one at a rate bounded from
below by µi ≡ 2µ + iθ when in state i. Thus, for all t ≥ 0, N is stochastically bounded by N .
For k ≥ 1, let T k0 and T k−0 denote the duration of the kth visit to 0 and the duration between the
(k − 1)th and kth visit to 0 of the process N , respectively. Define random variables T ko and ˜T k−0,
k ≥ 1, for process N similarly. Then the point process with interarrival times T 1−0, T
10 , T
2−0, T
20 , ...
and the point process with interarrival times ˜T 1−0, T
10 ,
˜T 2−0, T
20 , ... are alternating renewal processes.
By theorem VI.1.2 of Asmussen [2003] and the fact that N is stochastically dominated by N , we
then have for each k ≥ 1,
E[T k0]
E[T k0]
+ E[T k−0
] = limt→∞
P [N(t) = 0] ≥ limt→∞
P[N(t) = 0
]=
E[T k0
]E[T k0
]+ E
[˜T k−0
] . (3.1)
7

Notice that in state 0 both N and N have birth rate λ. Thus,
E[T k0]
= E[T k0
]= 1λ. (3.2)
Combining 3.1 and 3.2 gives us
E[T k−0
]≤ E
[˜T k−0
]. (3.3)
To show N is ergodic, notice the inequalities
∞∑i=1
λi
µ1 · · ·µi<
∞∑i=1
1i!
(λ
θ
)i= eλ/θ − 1 <∞, (3.4)
and∞∑i=1
µ1 · · ·µiλi
>
M∑i=1
µ1 · · ·µiλi
+∞∑
i=M+1
(2µ+Mθ
λ
)i=∞, (3.5)
forM > 0 chosen large enough so that 2µ+Mθ > λ.Therefore, by Corollary 2.5 of Asmussen [2003],
N is ergodic so that E[ ˜T k−0] < ∞. Combining this with the bound 3.3 and the fact that for each
t ≥ 0 X(t) = (0, ..., 0) if and only if N(t) = 0 shows that X is positive recurrent. Because X is
clearly irreducible, it follows that X is ergodic. �
In a theoretical point of view the ergodicity of X is a favorable feature since it allow us to
compare time averages of different quantities in simulations to unconditional expectations of the
same quantities computed in the model. A couple of examples of these quantities are the average
shape of the order book and the average price impact.
8

Chapter 4
Parameter Estimation and Order
Book creation
4.1 Description of the Data Set
The data contains detailed information about the Ericsson B stock on October 7th, 2011 and was
provided by NASDAQ OMX Group. There is three separate files for the different types of events.
One for incoming orders, one for cancellations and one for executions. Small extractions from these
files can be seen in tables 4.1, 4.2 and 4.3. Note that not all information are presented in these
tables, some of the omitted information are trader ID, stock ID-number, etc. The most important
columns are described here,
• refdate - the date of the trade,
• mykey - a unique key to keep track of events in case of timestamp being the same, used for
sorting,
• mstime - time after midnight in nanoseconds,
• ordersequence - an identifier, used to match inserted orders with cancellations or executions,
9

• side - Bid or Sell order (B/S),
• quantity - number of shares,
• price - divide with 10000 to acquire the price in SEK i.e. 684000 represent 68.40 SEK,
• liquidity - this column show if the entire order was depleted or not. “R” means that it did
and “A” means that it did not. The executions with “R” are called market orders, the other
ones are just called executions.
10

Table 4.1: Extraction from the incoming order file for Ericsson B.
refdate mykey mstime ordersequence side quantity price2011-10-07 11610797 4,38178E+13 5247323 B 1000 6840002011-10-07 11615151 4,38223E+13 5249299 S 540 6855002011-10-07 11666693 4,39044E+13 5272636 B 600 6845002011-10-07 11647306 4,38622E+13 5263819 S 630 6850002011-10-07 11647393 4,38622E+13 5263851 S 1000 685500
Table 4.2: Extraction from the cancellation file for Ericsson B.
refdate mykey mstime ordersequence quantity2011-10-07 11574939 4,37933E+13 5231295 9002011-10-07 11575436 4,37952E+13 5197162 10002011-10-07 11575488 4,37952E+13 5197744 7022011-10-07 11594617 4,38075E+13 5197130 2002011-10-07 11595651 4,38078E+13 5240013 1
Table 4.3: Extraction from the execution file of Ericsson B.
refdate mykey mstime ordersequence quantity price liquidity2011-10-07 18143670 5,24786E+13 8211285 1000 700000 R2011-10-07 26255781 5,76369E+13 11904308 175 692500 A2011-10-07 26255784 5,76369E+13 11905733 25 692500 A2011-10-07 26255796 5,76369E+13 11905733 200 692500 A2011-10-07 26255811 5,76369E+13 11922133 250 692500 R
11

4.2 Creation of the Order Book
As mentioned in Limit Order Books the data is divided in to three separate files. To create the
order book these files have to be combined in to a single file with all the information needed. This
can be done in several different manners, where the primary difference is the time between updates.
Updating the order book every second saves a lot of computational time compared to update say
every tenth of a second. However since several orders can come in during a very small time interval
one could lose valuable information. The only way to prevent this is to update every time a new
event occurs, i.e. for every new incoming order, cancellation and execution. As mentioned previously
this is the most computational heavy alternative but the accuracy benefits makes the additional
computational time tolerable.
Note that not all of the trades in the original data are added to the order book. Some of the
trades are not visible to traders, thus called non−displayed orders. These orders were deleted from
the data set before the order book creation began. In the incoming order file this was an easy task
since there was a label telling you whether or not they were visible. In the files for cancellations and
executions however, this information did not exist. This problem can be solved by matching the
order sequence number of the non-displayed order with the corresponding cancellation or execution.
When a match is found the trades are removed from the files they belong to.
After all non-displayed orders have been removed it is time to begin creating the order book.
All of the events from the three files are combined and sorted on mykey, that is unique. Then the
following algorithm is applied to all of the sorted data:
1. Choose the first event.
2. Determine the type of the event, if it is
(a) an incoming order. Determine if it is
i. an ask order. After that compare the price with the ask price levels in the order
book. If a match is found increase the quantity at that level with the amount of the
incoming order. Otherwise place the new order so that the ask queue is sorted from
the smallest to the largest price.
12

Table 4.4: Extraction from the complete order book.
Bid price 2 Bid queue 2 Bid price 1 Bid queue 1 Ask price 1 Ask queue 1 Ask price 2 Ask queue 2
689000 20757 689500 12009 690500 1579 691000 22179689500 12009 690000 130 690500 1579 691000 22179689000 20757 689500 12009 690000 500 690500 1579
ii. a bid order. Compare the price with the bid price levels in the order book. If a match
is found increase the quantity at that level with the amount of the incoming order.
Otherwise place the new order so that the bid queue is sorted from the largest to the
smallest price.
(b) a cancellation order. Check the order sequence number and locate the corresponding
order in the order book. Use the cancellations quantity to reduce the queue size at the
correct price level. If the entire queue was depleted resort the price levels to close the gap
that has been created in the order book.
(c) an execution order. Check the sequence number and locate the corresponding order in
the order book. Reduce the queue size at that price level by the execution quantity. As
for the cancellations the price levels need to be resorted if the entire queue was depleted
and created a hole.
3. Choose the next event and go to 2.
This proceedings repeated until the total order book has been created.
4.3 Estimation Procedure
In this section the estimations used for modeling the order book will be presented. They can also
be found in Cont et al. [2010] with the exception that they only consider a maximum distance of 5
ticks from the opposite best quote whereas here a maximum distance of 20 ticks will be considered.
Recall that in Dynamics of the Order Book all orders were assumed to be of unit size. The average
size of market orders Sm, limit orders Sl, and canceled orders Sc can be computed from the data
set. The unit size is chosen to be the average size of limit orders Sl. The arrival rate of the limit
13

orders can be estimated by the function
λ(i) = Nl(i)T∗
,
for 1 ≤ i ≤ 20, where Nl(i) is the total number of limit orders that arrived at distance i from the
opposite best quote, and T∗is the total trading time in the sample. The total number of limit orders
that arrived is obtained by enumerating the number of times a quote increases in size at a distance
1 ≤ i ≤ 20 ticks from the opposite best quote. In Cont et al. [2010] a power law function is used
to obtain the limit order arrival rate for distances larger than 5 ticks from the opposite best quote.
The power law function
λ(i) = k
iα
was suggested by Bouchaud et al. [2002] and Zovko and Farmer [2002]. The parameters k and α are
acquired by solving the least-square fit problem
mink,α
5∑i=1
(λ(i)− k
iα
)2.
Since we already have the arrival rates for distances up to 20 ticks from the opposite best quote
this power law is redundant. Nonetheless the estimated arrival rates from the power law function
are displayed in figure 4.1 together with the first five observed arrival rates from the data. All the
limit order arrival rates observed from the data are displayed in figure 4.2.
We estimate the arrival rate of market orders, µ, by simply counting the number of incoming
market order and then divide with the total trading time. Market orders matched with hidden
orders are ignored.
The cancellation rate is given by
θ(i) = Nc(i)ScT∗QiSl
for i ≤ 20, where Qi is the the steady state shape of the order book i.e. the average number of
orders at distance i from the opposite best quote. Nc is the number of cancellations and is obtained
by enumerating the number of times that a quote decreases in size, except the decreases caused by
14

Figure 4.1: The limit order arrival rate estimated by a power law.
Figure 4.2: The limit order arrival rate as a function of the distance from the opposite best quote.
15

Figure 4.3: The cancel order arrival rate as a function of the distance from the opposite best quote.
Table 4.5: Estimated Parameters: Ericsson B.
i 1 2 3 4 5λ(i) 1.6029 0.8296 0.7167 0.6991 0.5674θ(i) 0.1959 0.0431 0.0371 0.0460 0.0533µ 0.2783k 1.5537α 0.6765
market orders. Sc is the average size of cancellation orders and similarly Sl is the average size of
limit orders. As before T∗ is the total trading time. The cancellation arrival rates can be seen in
figure 4.3.
All of the estimated parameters are shown in table 4.5.
16

Chapter 5
Laplace Transform methods for
Computing Conditional
Probabilities
A motivation for modeling high frequency dynamics of order books is to use the information
provided for predicting short-term behavior of different quantities useful in trade executions and
algorithmic trading. These quantities can be expressed as conditional probabilities given the current
state of the order book and include, among others the probability of an increase in midprice. In this
section we will show that our model allows conditional probabilities to be computed analytically
using Laplace methods.
5.1 Laplace Transforms and First-Passage Times of Birth-
Death Processes
Before we start we need to go through some basic facts about Laplace transforms and Laplace
transforms for first-passage times of birth-death processes (Abate and Whitt [1999], Cont et al.
17

[2010]). Given a function f : R→ R, its two-sided Laplace transform is given by
f(s) =∞
−∞
e−stf(t)dt,
where s is a complex number. If f is probability density function (pdf) of a random variable X, f is
the two-sided Laplace transform of the random variable X. The reason for using two-sided Laplace
transforms is that our function f will normally correspond to the pdf of a random variable with
both negative and positive support. For convenience the two-sided Laplace transform will simply
be denoted Laplace transform from now on. If X and Y are independent random variables with
well-defined Laplace transforms, then
fX+Y (s) = E[s−s(X+Y )] = E[e−sX ]E[e−sY ] = fX(s)fY (s). (5.1)
If for some γ ∈ R we have´∞−∞ |f(γ + iω)|dω < ∞ and f(t) is continuous at t, then the inverse
transform is given by the Bromwich contour integral
f(t) = 12πi
γ+i∞ˆ
γ−i∞
etsf(s)ds. (5.2)
5.1.1 Continued Fractions
A continued fraction is an expression obtained through an iterative process and is well described
in Abate and Whitt [1999]. Here we will make a short summary of what a continued fraction is and
how it can be used.
An (infinite) continued fraction (CF) associated with a sequence {an : n ≥ 1} of partial numer-
ators and a sequence {bn : n ≥ 1} of partial denominators, which are complex numbers with an 6= 0
for all n, is the sequence {wn : n ≥ 1}, where
wn = t1 ◦ t2 ◦ ... ◦ tn(0), n ≥ 1,
18
and
tk(u) = akbk + u
, k ≥ 1,
i.e. wn is the n-fold composition the mappings tk(u) applied to 0. If w ≡ limn→∞ wn, the CF is
convergent and the limit w is said to be the value of the CF. We write
w = Φ∞n=1anbn
or
w = a1 a2 a3
b1 + b2 + b3+· · · .
5.1.2 First-Passage Times in Birth-Death Processes
Now we will show that CFs can be used to compute the Laplace transform of a first-passage
time pdf in a birth-death (BD) process (Abate and Whitt [1999]). Let Tb be a random variable
representing the first-passage time from state b to state 0. Such first-passage times can be expressed
in terms of first-passage times to neighboring states,
Tb = Tb,b−1 + Tb−1,b−2 + · · ·+ T1,0, (5.3)
where the random variables on the right hand side are mutually independent and Ti,i−1 denotes the
first-passage time of the BD from state i to state i− 1. Let fi,i−1 be the pdf of Ti,i−1 and let fi,i−1
be its Laplace transform, i.e.,
fi,i−1(s) =∞
0
e−stfi,i−1(t)dt ≡ Ee−sTi,i−1 . (5.4)
From 5.1 and 5.3, we have
fb(s) =b∏i=1
fi,i−1(s). (5.5)
Hence, in order to compute the Laplace transform fb, it suffices to be able to compute the Laplace
transform of the first-passage time to a neighboring state.
19

It is also possible to construct CFs representing the Laplace transforms of first-passage times
with an infinite time space. Consider a BD with constant birth rate λ and death rates µi in state
i ≥ 1. By considering the first transition from state i, we obtain the recursion
fi,i−1(s) = µiλ+ µi + s
+ λfi+1,i(s)fi,i−1(s)λ+ µi + s
(5.6)
from which we obtain
fi,i−1 = µi
λ+ µi + s− λfi+1,i(s). (5.7)
A CF is acquired by iterating on 5.7 and is displayed here
fi,i−1(s) = − 1λ
Φ∞k=i−λµk
λ+ µk + s. (5.8)
Combining 5.5 and 5.8 yields
fb(s) =(− 1λ
)b( b∏i=1
Φ∞k=1−λµk
λ+ µk + s
). (5.9)
5.2 Direction of Price Moves
This section will be dedicated to computing the probability of an increase in the midprice when
it changes. This occurs either at the first-passage time of the bid or ask queue to zero or, assuming
that the spread between the bid and ask is greater than one tick, the first time a limit order arrives
inside the spread. Let XA ≡ XpA(·)(·) and XB ≡ |XpB(·)(·)|. Moreover, let WB ≡ {WB(t), t ≥ 0},
where WB is the number of orders remaining at the bid queue at time t of the initial XB(0) orders,
similarly WA is the number of orders remaining at the ask queue. Let εB and εA be the first-passage
time of WB and WA to 0 respectively, and let T be the time of the first change in midprice:
T ≡ inf {t ≥ 0, pM (t) 6= pM (0)} .
20

Given the assumptions made and the configuration of the order book, the probability of an increase
in midprice at the next price change can be written as
P [pM (T ) > pM (0) |XA(0) = a, XB(0) = b, pS(0) = S] , (5.10)
where S > 0 (Cont et al. [2010]).
The expression (5.10) can be computed by using a coupling argument (Cont et al. [2010]).
Lemma 3. Let pS(0) = S. Then
1. There exist independent birth-death processes XA and XB with constant birth rates λ(S) and
death rates µ+ iθ(S), i ≥ 1, such that for all 0 ≤ t ≤ T , XA(t) = XA(t), and XB(t) = XB(t).
2. There exist independent pure death processes WA and WB with death rate µ+ iθ(S) in state
i ≥ 1, such that for all 0 ≤ t ≤ T , WA(t) = WA(t) and WB(t) = WB(t). Furthermore, WA is
independent of XB , WB is independent of XA, WA ≤ XA, and WB ≤ XB .
Proof. We prove Part 1. Part 2 can be proven analogously. X is a continuous-time Markov
chain, with transition rates given by Section 3.2. For 0 ≤ t ≤ T , pA(t) = pA(0) and pB(t) = pB(0),
so substituting in Section 3.2 yields that XA(t) and XB(t) have the following (identical) transition
rates for 0 ≤ t ≤ T n→ n+ 1 with rate λ(S)
n→ n− 1 with rate µ+ nθ(S).(5.11)
Define XA and XB such that
• XA(t) = XA(t) and XB(t) = XB(t) for t ≤ T and
• XA(t), XB(t), t ≥ T follow independent birth-death processes with rates given by (5.11).
The above remarks show that in fact(XA(t)
)t≥0 (respectively
(XB(t)
)t≥0) has the same law as a
birth-death process with rates (5.11). To show that XA and XB are independent, we note that
21
because the transition rates of XA (respectively XB) do not depend on (Xp(t), p 6= pA(0)) (respec-
tively (Xp(t), p 6= pB(0))) for 0 ≤ t ≤ T , we have, in particular, conditional independence of XA(t)
and XB(t) given X(0) and {t ≤ T}. �
From here onward we let σA and σB denote the first-passage time of XA and XB to 0, respectively.
Before we can compute the conditional probability (5.10) we need the following result (Cont et al.
[2010]).
Lemma 5. Let Z be an exponentially distributed random variable with parameter Λ. Then the
Laplace transform of the random variable σB ∧ Z is given by
f1b (Λ + s) + Λ
Λ + s
(1− f1
b (Λ + s)),
where f1b is given in (5.12).
Proof. We first compute the density fσB∧Z of the random variable σB ∧ Z in terms of the
density fb of the random variable σB . Because Z is exponential with rate Λ, we have for all t ≥ 0,
P [σB ∧ Z < t] = 1− P [σB > t]P [Z > t]
= 1− (1− FσB(t)) e−Λt.
Taking derivatives with respect to t gives
fσB∧Z(t) = f1b (t)e−Λt + Λ
(1− F 1
b (t))e−Λt,
22
for t ≥ 0, where F 1b (t) (f1
b (t)) is the cdf (pdf) of σB . Also, fσB∧Z(t) = 0 for t < 0. The Laplace
transform of σB ∧ Z is thus given by
fσB∧Z(s) =∞
−∞
e−stfσB∧σΣB
(t)dt
=∞
0
e−st(f1b (t)e−Λt + Λ
(1− F 1
b (t))e−Λt) ds
=∞
0
e−t(s+Λ)f1b (t)dt+ Λ
∞
0
(1− F 1
b (t))e−t(s+Λ)dt
= f1b (s+ Λ) + Λ
Λ + s
(a− f1
b (s+ Λ)),
where the last equality follows from integration by parts. �
Now we can take a look at proposition 4 from Cont et al. [2010] which are used to compute
(5.10).
Proposition 4 (Probability of Increase in Midprice). Let fSj be given by
fSj (s) =(− 1λ(S)
)j ( j∏i=1
Φ∞k=i−λ(S) (µ+ kθ(S))λ(S) + µ+ kθ(S) + s
), (5.12)
for j ≥ 1, and let ΛS ≡∑S−1i=1 λ(i). Then (5.10) is given by the inverse Laplace transform of
FSa,b(s) = 1s
(fSa (ΛS + s) + ΛS
ΛS + s
(1− fSa (ΛS + s)
))(5.13)
·(fSb (ΛS + s) + ΛS
ΛS + s
(1− fSb (ΛS − s)
)),
evaluated at 0. When S = 1, (5.13) reduces to
F 1a,b(s) = 1
sf1a (s)f1
b (−s). (5.14)
23

Proof. We will start with the special case when S = 1 and then extend the analysis to the case
when S > 1, using Lemma 5 above. Construct the independent birth-death processes XA and XB as
in Lemma 3. When S = 1, the price changes for the first time exactly when one of the two processes
XA and XB reaches the state 0 for the first time. Thus, given our initial conditions, the distribution
of T is given by the minimum of the independent first-passage times σA and σB . Furthermore, the
quantity (5.10) is given by P [σA < σB ]. By (5.9), the conditional Laplace transform of σA − σB
given the initial conditions is given by f1a (s)f1
b (−s) so that the conditional Laplace transform of the
cumulative distribution function (cdf) of σA − σB is given by (5.14). Thus, our desired probability
is given by the inverse Laplace transform of (5.14) evaluated at 0.
We now move on to the case where S > 1. Let σiA denote the first time an ask order arrives at
distance i ticks from the bid and σiB denote the first time a bid order arrives at distance i from the
ask, for i = 1, . . . , S − 1. The time of the first change in midprice is now given by
T = σA ∧ σB ∧min{σiA, σ
iB , i = 1, . . . , S − 1
}.
Notice that XA and XB are independent of the mutually independent arrival times σiA, σiB , for
i = 1, . . . , S − 1. Also notice that σiA and σiB are exponentially distributed with rates λ(i) for
i = 1, . . . , S− 1. The first change in midprice is an increase if there is an arrival of a limit bid order
within S − 1 ticks of the best ask or XA hits zero, before there is an arrival of a limit ask order
within S − 1 ticks of the best bid or XB hits zero. Thus, the quantity (5.10) can be written as
P[σA ∧ σ1
B ∧ · · · ∧ σS−1B < σB ∧ σ1
A ∧ · · · ∧ σS−1A
]= P
[σA ∧ σΣ
B < σB ∧ σΣA
], (5.15)
where σΣA and σΣ
B are independent exponential random variables, both with rate ΛS . To compute
(5.15), we first need to compute the conditional Laplace transform of the minimum σB ∧σΣA. This is
given in Lemma 5, substituting σΣA for Z. The conditional Laplace transform of the random variable
σB ∧ σΣA − σA ∧ σΣ
B can then be computed using (5.1), and the probability (5.10) can be computed
by inverting the conditional Laplace transform of the cdf of this random variable and evaluating at
0 as in the case S = 1. �
24

To sum up this section proposition 4 can be used to compute the probability of a price increase
given that the price changes. However, in order to obtain the probability an inversion of the Laplace
transform has to be made. More on this implementation is discussed in Inverse Laplace Transform.
5.3 Executing an Order Before the Midprice Moves
When placing an order the trader has two choices, either he can place a market order or a limit
order. At a given time placing a limit order gives a better price than placing a market order at the
same time, this is due to the fact that a limit order faces a risk of never being executed. A market
order is executed almost instantaneously but a limit order stays in the order book until either the
order is canceled or a matching order is inserted. This means that the midprice could move away
rendering the limit order useless. Hence it makes sense talking about the probability of a limit order
being executed before the price moves since it is a quantity that is useful when choosing between a
limit order and a market order. We will now shoe how to compute the probability of an order placed
at the bid price is executed before the midprice moves in any direction, given that it is not canceled.
The results holds for S ≡ pS(0) ≥ 1, however note that in the case when S = 1 the probability
we are looking at is equal to the probability of the order being executed before the midprice moves
away from the desired price, given that the order is not canceled. The model is symmetric in bids
and asks which means that the results holds for orders placed at both the ask and bid price.
Some new notations are introduced. Let NCb (NCa) denote the event that an order that never
is canceled is placed at the bid (ask) at time 0. The probability that an order placed at the bid price
is executed before the midprice moves is given by
P [εB < T |XB(0) = b, XA(0) = a, pS(0) = S, NCb] , (5.16)
and can be computed with proposition 6 from Cont et al. [2010].
25

Proposition 6 (Probability of Order Execution Before Midprice Moves). Define fSa (s)
as in (5.9), let gSJ be given by
gSj (s) =j∏i=1
µ+ θ(S)(i− 1)µ+ θ(S)(i− 1) + s
, (5.17)
for j ≥ 1, and let ΛS ≡∑S−1i=1 λ(i). Then the quantity (5.16) is given by the inverse Laplace
transform of
FSa,b(s) = 1sgSb (s)
(fSa (2ΛS − s) + 2ΛS
2ΛS − s
(1− fSa (2ΛS − s
)), (5.18)
evaluated at 0. When S = 1, (5.18) reduces to
F 1a,b(s) = 1
sg1b (s)f1
a (−s). (5.19)
Proof. Construct XA and WB using Lemma 3. Let us first consider the case S = 1. Let
T′ ≡ εB ∧ T denote the first time when either the process WB hits 0 or the midprice changes.
Conditional on an infinitely patient order being placed at the bid price at time 0, T ’ is the first
time when either that order gets executed or the midprice changes. Notice that conditional on our
initial conditions, εB is given by a sum of b independent exponentially distributed random variables
with parameters µ + (i − 1)θ(1), for i = 1, . . . , b, and independent of XA. Thus, the conditional
Laplace transform of εB given our initial conditions is given by (5.17). Because in the case S = 1
the midprice can change before time εB if and only if σA < εB , the quantity (5.16) can be written
simply as P [εB < σA]. Using (5.1) with the conditional Laplace transforms of εB and σA, given in
(5.17) and (5.9), respectively, we obtain (5.19).
This analysis can be extended to the case where S > 1 just as in the proof of Proposition 4.
When S > 1, our desired quantity can be written as P [εB < σA ∧σΣB ∧σΣ
A]. Because the conditional
distribution of σΣB ∧ σΣ
A is exponential with parameter 2ΛS , Lemma 5 then yields the result. �
26

5.4 Making the Spread
Arbitrage is explained in Durbin [2010] as: “The simultaneous buying of a security at one price
and selling it (or an equivalent security or portfolio) at another, higher price in order to earn risk-free
profit”. In other words free money without any risk. This can be achieved by placing two orders,
one at the ask price and one at the bid price, and hoping that the orders will be executed before
the midprice moves given that the orders are not canceled. If both orders execute before the price
move the strategy has paid off, we refer to this as “making the spread”. Otherwise, losses may be
reduced by placing a market order and losing the bid-ask spread. In this section we will show how to
compute the probability that two orders, placed at the ask and bid price respectively, are executed
before the midprice moves. We will only consider the case where the initial spread is one tick: S = 1.
The probability of making the spread can be expressed as
P [max {εA, εB} < T |XB(0) = b, XA(0) = a, pS(0) = 1, NCa, NCb] . (5.20)
The following result, which can be found in Cont et al. [2010], can be used to compute this proba-
bility:
Proposition 7. The probability (5.20) of making the spread is given by ha,b + hb,a, where
ha,b =∞∑i=0
a∑j=1
P [εj < σi]∞
0
PX0,i(t)PWa,j(t)g1b (t)dt, (5.21)
where
PX0,i(t) ≡e−λ
X(t)λX(t)i
i! , λX(t) ≡ λ
θ(1− e−θt), (5.22)
PXa,j(t) ≡(eQ
Wa t)a,j≡
( ∞∑k=0
tk
k!(QWa
)k)a,j
, (5.23)
27

QWa ≡
0 0 0 · · · 0
µ −µ 0 · · · 0
0 µ+ θ −µ− θ · · · 0...
.... . . . . .
...
0 0 · · · µ+ (a− 1)θ −µ− (a− 1)θ
, (5.24)
and g1b is the inverse Laplace transform of g1
b , which is given in (5.17).
Proof. Because S = 1, T = min {σA, σB}, and the quantity (5.20) can be written as
P [max {εB , εA} < min {σB , σA}] . (5.25)
Construct XA, XB , WA and WB using Lemma 3. Let T ′ = max {εA, εB} ∧ T denote the first time
when either both of the processes WA and WB have hot 0, or the midprice has changed. Conditional
on infinitely patient orders being placed at the best bid and ask prices at time 0, T ′ is the first
time when either both the orders get executed or the midprice changes. Furthermore, by Lemma
3, WA and WB are independent pure death processes with death rate µ+ iθ(1) in state i ≥ 1, and
WA(t) ≤ XA(t) and WB(t) ≤ XB(t). This implies that εA and εB are independent of each other
and σA and σB are independent of each other with εA ≤ σA and εB ≤ σB . Using these properties,
we obtain
P [max {εB , εA} < min {σB , σA}] = P [εB < σA, εA < σB , εB < εA]
+P [εB < σA, εA < σB , εA < εB ]
= P [εA < σB , εB < εA]
+P [εB < σA, εA < εB ]
= ha,b + hb,a, (5.26)
28

where we define ha,b ≡ P [εB < εA < σB ], the probability that the order placed at the bid is executed
before the order placed at the ask, and the order at the ask is executed before the bid quote
disappears. Focus will now be on computing ha,b. Conditioning on the value of εB gives
ha,b =∞
0
P [εB < εA < σB | εB = t] g1b (t)dt. (5.27)
Focusing on the first factor in the integrand in (5.27) and conditioning on the values of XB(t) and
WA(t) gives us
P [εB < εA < σB | εB = t] =∞∑i=0
a∑j=0
P[εB < εA < σB | εB = t, XB(t) = i, WA(t) = j
]·P[XB(t) = i, WA(t) = j | εB = t
]. (5.28)
The first conditional probability on the right hand side of (5.28) can now be simplified. For i = 0
or j = 0 it is simply 0. For i, j ≥ 1, under the condition of the probability, at time t there are j
orders in the ask queue that have been placed before time 0 that have yet to be executed, and there
are a total of i orders in the bid queue. Thus, the probability of interest is simply the probability
that the j ask orders get executed before the number of orders in the bid queue hits 0. Thus,
P[εB < εA < σB | εB = t, XB(t) = i, WA(t) = j
]= P [εj < σi] . (5.29)
Moreover, the second probability on the right hand side of (5.28) can be written as
P[XB(t) = i, WA(t) = j | εB = t
]= P
[XB(t) = i | εB = t
]P[WA(t) = j | εB = t
]= P
[XB(t) = i | εB = t
]P[WA(t) = j
]. (5.30)
29

Combining (5.26)-(5.28) and using Tonelli’s theorem to interchange the integral and the summation
gives us
ha,b =∞∑i=0
a∑j=1
P [εj < σi]∞
0
P[XB(t) = i | εB = t
]· P[WA(t) = j
]g1b (t)dt.
The quantity P[XB(t) = i | εB = t
]can be computed using an analogy with theM/M/∞ queue.
The number of orders in the bid queue at the time when the bid order placed at time 0 has executed
is simply the number of customers at time t in an initially empty M/M/∞ queue with arrival rate
λ and service rate θ, which has a Poisson distribution with mean given by λX(t) in (5.22).
The quantity P[WA(t) = j
]is the probability that a pure death process with death rate µ +
(k − 1)θ(1) in state k ≥ 1 is in state j at time t, given that it begins in state a. The infinitesimal
generator of this pure death process is given by (5.24). Hence, by Corollary II.3.5 of Asmussen
[2003], P[WA(t) = j
]is given by (5.23). �
We now have all the necessary results to compute the conditional probabilities we are interested
in, all that remains are to do some inversion on the Laplace transform to acquire the probabilities.
However this this turned out to be easier said than done, which you will see later.
30

Chapter 6
Inverse Laplace Transform
Numerically inverting Laplace transforms can be done by using the Fourier-series method which
has many different variants. Here we will mainly look at two of these, i.e. the EULER method,
based on Euler summation, and POST-WIDDER. Both methods are found in Abate and Whitt
[1995].
6.1 Euler Method
The first method is called Euler simply because we use Euler summation, based on the Bromwich
contour inversion integral (5.2), which can be written as the integral of a real-valued function of
a real variable by choosing a specific contour. If the contour is a vertical line s = a with a large
31

enough such that f(s) has no singularities on the line or to the right of it, we obtain
f(t) = 12πi
a+i∞ˆ
a−i∞
estf(s)ds = 12πi
∞
−∞
e(a+iu)tf(a+ iu)du
= eat
2π
∞
−∞
(cos(ut) + i sin(ut))f(a+ iu)du
= eat
2π
∞
−∞
[Re(f(a+ iu)
)cos(ut)− Im
(f(a+ iu)
)sin(ut)
]du
= 2eat
π
∞
0
Re(f(a+ iu)
)cos(ut)du, (6.1)
where Re(s) and Im(s) are the real and imaginary parts of s. The integral (6.1) is then calculated
approximately by using the Fourier- series method to replace the integral by a series, corresponding
to the trapezoidal rule, with specified discretization error. Instead of calculating an infinite sum
we apply Euler summation, thus accelerating the convergence. Another motivation for the need of
faster convergence is that the series is nearly alternating which makes the convergence rate a lot
slower.
As mentioned above (6.1) is evaluated with the trapezoidal rule. A step size h gives
f(t) ≈ fh(t) ≡ heat
πRe(f(a)
)+ 2heat
π
∞∑k=1
Re(f(a+ ikh)
)cos(kht). (6.2)
By letting h = π/2t and a = A/2t we obtain the nearly alternating series
fh(t) = eA/2
2t Re
(f(A2t )
)+ eA/2
t
∞∑k=1
(−1)kRe(f(A+ 2kπi
2t )). (6.3)
We shall now take a look at the discretization error related with (6.3). We begin by replacing
the damped function g(t) ≡ e−btf(t) for b > 0 by the periodic function
gp(t) =∞∑
k=−∞g
(t+ 2πk
h
)(6.4)
32

with period 2π/h. We then representing (6.4) by its complex Fourier series
gp(t) =∞∑
k=−∞cke
ikht, (6.5)
where ck is the kth Fourier coefficient of gp, i.e.,
ck = h
2π
π/hˆ
−π/h
gp(t)e−ikhtdt = h
2π
π/hˆ
−π/h
∞∑k=−∞
g
(t+ 2kπ
h
)e−khtdt
= h
2π
∞
−∞
g(t)e−ikhtdt
= h
2π
∞
0
e−btf(t)e−ikhtdt
= h
2π f(b+ ikh). (6.6)
Combining (6.4)-(6.6) yields a version of the Poisson summation formula
gp(t) =∞∑
k=−∞g
(t+ 2kπ
h
)=
∞∑k=−∞
f
(t+ 2kπ
h
)e−b(t+2πk/h)
= h
2π
∞∑k=−∞
f(b+ ikh)eikht. (6.7)
Letting h = π/t and b = A/2t in (6.7) gives
f(t) = eA/2
2t
∞∑k=−∞
(−1)kRe(f
(A+ 2kπi
2t
))−∞∑k=1
e−kAf((2k + 1)t). (6.8)
Note that the first term on the right in (6.8) coincides with the trapezoidal approximation in (6.3),
hence the second term on the right in (6.8) gives the discretization error for the trapezoidal rule,
i.e.,
ed =∞∑k=1
e−kAf((2k + 1)t). (6.9)
33

In probability applications |f(t)| ≤ 1 for all t which means that the error is bounded by
|ed| ≤e−A
1− e−A
and is approximately equal to e−A when e−A is small enough. Hence if A = γ log 10 we have at
most a discretization error of 10−γ .
So now we know how large the discretization error will be, however we still need to calcu-
late (6.3) numerically. Since it contains an infinite sum, which also is an alternating series when
Re (f((A+ 2kπi)/2t)) has constant sign for all k, it makes sense to consider acceleration methods for
alternating series. One of the more elementary techniques, Euler summation, are suggested due to its
simplicity. According to Abate and Whitt [1995] Euler summation provides adequate computational
efficiency for practical purposes.
The method can be described as the weighted average of the last m partial sums by a binomial
probability distribution with parameters m and p = 1/2. More precisely, let
sn(t) = eA/2
2t Re
(f
(A
2t
))+ eA/2
t
n∑k=1
(−1)kak(t), (6.10)
where
ak(t) = Re
(f
(A+ 2kπi
2t
)). (6.11)
Euler summation is applied to m terms after an initial n so the Euler sum (approximation to (6.3))
is given by
E(m,n, t) =m∑k=0
(m
k
)2−msn+k(t), (6.12)
for sn(t) in (6.10). Thus (6.12) is the binomial average of sn, sn+1, . . . , sn+m and the overall
computation is specified by (6.10)-(6.12).
If you are interested in estimating the error associated with Euler summation you can simply
check the difference between successive terms, i.e. E(m,n+1, t)−E(m,n, t), since it is often a good
error estimate.
Note that in order for the Euler summation to be effective the coefficients ak in (6.11) should
34

preferably be of constant sign for sufficiently large k. However this condition is not necessary for
the method to work but is significantly speeds up the convergence rate.
6.2 Post-Widder Method
This method is based on the Post-Widder Theorem, which refers to f(t) as the pointwise limit
as n→∞ of
fn(t) = (−1)n
n!
(n+ 1t
)n+1ˆf (n)((n+ 1)/t), (6.13)
where ˆf (n) is the nth derivative of the Laplace transform f at s. By differentiating the transform
it is clear that fn(t) = E [f(Xn,t], where Xn,t is a random variable with a gamma distribution on
(0,∞) with mean t and variance t/(n+1). Thus Xn,t converges in probability to Xt, as n→∞, with
P (Xt = t) = 1. This means that fn(t) → f(t) as n → ∞ for all bounded real-valued f continuous
at t.
We calculate fn(t) numerically via a generating function
G(z) ≡∞∑n=0
an(t)zn = n+ 1t
f
((n+ 1)
t(1− z)
), (6.14)
whose nth coefficient is fn(t), i.e., an(t) = fn(t). By using the Cauchy contour integral we get
fn(t) = 12πi
ˆ
C
G(z)zn+1 dz, (6.15)
where C is a circle with radius r. Substituting variables (z = reiu) yields the inversion integral
fn(t) = 12πrn
2πˆ
0
G(reiu)e−inudu
= n+ 1t
12πrn
2πˆ
0
f
(n+ 1t
(1− reiu))e−inudu. (6.16)
As for the Euler method we apply the Fourier-series method to acquire the trapezoidal-rule approx-
35

imation to (6.16) with an explicit error bound. Unlike the Euler method the integral in (6.16) has
a finite interval, hence the resulting sum will also be finite and no truncation is necessary.
We apply the discrete Poisson summation formula to (6.16) for any n and obtain the trapezoidal-
rule approximation with step size π/n
fn(t) = n+ 12tnrn
2n∑k=1
(−1)kRe(f
(n+ 1t
(1− reπik/n)))− ed
= n+ 12tnrn {f ((n+ 1)(1− r)/t) + (−1)nf ((n+ 1)(1 + r)/t)
+2n−1∑k=1
(−1)kRe(f
(n+ 1t
(1− reπik/n)))} − ed, (6.17)
where the associated error bound ed can be written as
ed =∞∑j=1
fn+jm
(t+ tj2m
n+ 1
)r2jm. (6.18)
Assuming that |f(t)| ≤ 1 for all t, which is a valid assumption for probability applications, we also
have |fn(t)| ≤ 1 for all n and t so that
|ed| ≤r2n
1− r2n ≈ r2n. (6.19)
Given that
φ(u) =∞∑−∞
akeiku and an = 1
2π
∞
0
φ(u)e−inudu, (6.20)
as in this case where an = fn(t)rn and φ(u) = G(reiu), we can assemble the periodic sequence
apk =∞∑
j=−∞ak+jm (6.21)
with period m. If |f(t)| ≤ 1 for all t, then |fn(t)| ≤ 1 for all n and t, so that∑∞k=−∞ |ak| <∞. The
36
next step is to create the discrete Fourier transform of {apk} to acquire
apk = 1m
m−1∑j=0
apjei2πkj/m
= 1m
m−1∑j=0
∞∑l=−∞
aj+lmei2πjk/m
= 1m
∞∑j=−∞
ajei2πjk/m = 1
mφ
(2πkm
)(6.22)
and then apply the inversion formula for discrete Fourier transforms. This yields
apk =m−1∑j=0
apje−i2πjk/m
= 1m
m−1∑j=0
φ
(2πjm
)e−2πjk/m. (6.23)
The discrete Poisson summation formula is acquired by combining (6.21) and (6.23)
m∑k=1
g
(2πkm
)e−ik2πn/m = m
∞∑k=−∞
an+km, (6.24)
which together with (6.16) implies that
fn(t) = n+ 1tmrn
m∑k=1
f
(n+ 1t
(1− reikh))e−inkh − ed, (6.25)
with h = 2π/m and
ed =∞∑j=1
fn+jm
(t+ tjm
n+ 1
)rjm. (6.26)
Let m = 2n in (6.25) and you will get (6.17).
When calculating (6.17) we can make the error suitably small by choosing r small enough. To
obtain an accuracy of 10−γ simply let r ≈ 10−γ/2, however be careful since round off problems
increases as r decreases.
We have now indicated how to calculate the approximate function fn(t) in (6.13), still it is the
37

function f(t) we arr interested in. Moreover, fn(t) is known to converge slowly towards f(t) as
n→∞ and the computations gets more complicated for larger n. To enhance the accuracy we use
a linear combination of terms
fj,m(t) =m∑k=1
w(k, m)fjk(t), (6.27)
e.g., with m = 6 and j = 10.
It can be shown that the error in (6.13) has the asymptotic form
fn(t)− f(t) ∼∞∑j=1
cj(t)n−j . (6.28)
Thus one can easily motivate using (6.27) where the weights are chosen to cancel out the leading
coefficients cj(t) in (6.28). General weights for knocking out these coefficients can be written as
w(k,m) = (−1)m−k km
k!(m− k)! , (6.29)
which can be derived from the combinatorial identity
m∑k=1
(−1)m−k(m
k
)kj
m! =
0, j = 1, 2, . . . , m− 1
1, j = 0 and m.
(6.30)
Thus the final approximation is (6.27).
38
Chapter 7
Numerical Results
7.1 Long-Term Behavior
The long-term behavior of the order book may not be very important to traders interested in a
short time period. However quantities like volatility of the midprice and steady-state shape of the
order book are indications on how good the model reproduces the actual data. Some of the previous
work done has focused on average properties of the order book (Bouchaud et al. [2002]). The fact
that the Markov chain X is ergodic, shown in proposition 1 in section 3.2, implies that expectations
such as E[f(X∞)] can be computed by simulating over a large horizon and averaging f(X(t)) over
the simulated path:
1T
T
0
f(X(t))dt→ E[f(X∞)] as T →∞.
To investigate further how the model reproduces the data we chose to consider how the price
changes during the day. The empirical data is taken from a time window between 11:00 to 15:00.
The model is the simulated for a large number of time steps that will correspond to the same amount
of time as in the empirical data.
39

Figure 7.1: Empirical and simulated midprice for Ericsson B.
40

Figure 7.2: Steady state profile of the order book.
7.1.1 Steady-State Shape of the Order Book.
The order book is simulated over a long period of time, i.e. n = 106 events. The average number
of ask (and bid) orders QAi (QBi ) at distance i ticks from the opposite best quote is observed and
displayed in Figure 7.2 on page 41. Note that figure shows a hump at two ticks from the opposite
best quote, the same hump have been observed in other empirical studies (Cont et al. [2010]). This
hump is not a result of tuned parameters or additional features such as correlation between order
flow or past price fluctuations. Figure 7.2 on page 41 shows both the empirical value as well as the
simulated value from the model and they are very similar which indicates that the model is a good
approximation for long term behavior.
41

7.1.2 Volatility.
We define the realized volatility as in Cont et al. [2010]:
RVn =
√√√√ n∑i=1
(log(Pi+1
Pi))2, (7.1)
where n is the number quotes in the time window and Pi represents the midprice of the stock for
i = 1, ..., n.
A volatility of approximately 5 % was acquired when applying (7.1) to the empirical data, however
for the simulated data the same quantity only was 1 %. This can be seen in Figure 7.1 on page 40
where the empirical data shows a lot more fluctuations than the simulated data.
7.2 Conditional Distributions
Conditional distributions are the primary quantities of concern for applications regarding high
frequency trading. If you have conditional distributions for the variables characterizing the order
book you are able to predict these variables in the short term, thus giving you the opportunity to
create trading strategies and optimize trade executions.
7.2.1 One-Step Transition Probabilities.
In order to estimate how well our model predicts the order books short term behavior we will take
a look at one-step transition probabilities. Empirical data is compared with transition probabilities.
When the number of orders at a given price level changes, the probability of the change being an
increase will be inspected.
The probability that the number of orders at distance i from the best ask/bid quote changes
from n to n+ 1 when it changes can be found in Cont et al. [2010] and is given by
Pi(n) ≡ P [QA
i (Tm+1) = n+ 1 |QAi (Tm) = n, QAi (Tm+1) 6= n] =
λ(1)
λ(1)+µ+nθ(1) , i = 1,
λ(i)λ(i)+nθ(i) , i > 1,
42

where Tm is the time of the mth event of the order book. This expression can be motivated by
considering the case i = 1. An increase in QA1 occurs if a limit order arrives before any of the
existing limit orders get canceled or a market order occurs. The arrival rate of a limit order is given
by λ(1) and the arrival rate of a cancellation or a market order is given by µ + nθ(1). Hence the
probability of an increase is given by λ(1)/(λ(1) + µ+ nθ(1)).
The corresponding empirical probability, denoted with a hat to indicate that it is empirical, is
given by
Pi(n) ≡ Bup + Aup
Bchange + Achange,
where Bup is the number of times the bid orders increased from one event to the next. Bchange
represents the number of times the bid orders changes from one event to the next. Similarly Aup
and Achange represents the same quantities but for the ask orders.
Pi(n) and Pi(n) for 1 ≤ i ≤ 5 for Ericsson B are displayed in Figure 7.3 on page 44.
7.2.2 Direction of Price Moves
This subsection was supposed to display the results from using the Laplace transform methods
described earlier. Unfortunately, due to lack of time and perhaps knowledge, we were unable to
implement the required inversion of the Laplace transforms. According to Cont et al. [2010] the
inversion are performed by shifting the random variable X under study by a constant c such that
P [X + c ≥ 0] ≈ 1, then inverting the corresponding one-sided Laplace transform by using the meth-
ods from Abate and Whitt [1992, 1995]. To find a good shift c use the fact that when the number
of orders at the ask is equal to the number of orders at the bid the probability of an increase in
midprice is 0.5. The same shift used will then be used for cases when this condition is not satisfied.
However, the inversion of the Laplace transform was not conceivable. The results of the simulations
can be seen in 7.1 along with the empirically computed probabilities.
43

Figure 7.3: Probability of an increase in the number of orders at a distance i from the opposite bestquote in the next change, for i = 1, ..., 5.
44

Table 7.1: Probability of an increase in midprice: empirical frequencies (i), simulation results (ii).The numbers in the edge of the table is the size of the bid/ask queue, i.e. position 1-1 means therewas one bid order and one ask order.
i).a
1 2 3 4 5 6 7 8 9 101 0.5185 0.4003 0.4732 0.4812 0.5963 0.5411 0.6064 0.6952 0.6100 0.58782 0.5292 0.3878 0.6241 0.6561 0.7366 0.6290 0.5758 0.5238 0.5881 0.57013 0.4615 0.4847 0.5548 0.5789 0.6281 0.5164 0.5142 0.5782 0.5545 0.64554 0.4591 0.4342 0.3986 0.5368 0.5714 0.5650 0.5882 0.5488 0.5355 0.66875 0.4671 0.3352 0.3309 0.4886 0.4804 0.4623 0.4384 0.5561 0.5840 0.6376
b 6 0.4338 0.3261 0.3022 0.4675 0.4826 0.4444 0.4957 0.5615 0.5251 0.62617 0.4858 0.3921 0.3515 0.4302 0.3626 0.4737 0.5670 0.5495 0.5169 0.48718 0.3763 0.4030 0.4293 0.4852 0.4637 0.4412 0.6039 0.4920 0.7050 0.52899 0.4137 0.3875 0.3710 0.4670 0.4545 0.5388 0.5223 0.6138 0.6257 0.526310 0.3333 0.4185 0.4934 0.4592 0.6170 0.5503 0.4654 0.5000 0.5255 0.4876
ii).
a1 2 3 4 5 6 7 8 9 10
1 0.6897 0.6943 0.6136 0.5218 0.5971 0.6737 0.7115 0.7349 0.7111 0.66522 0.2818 0.4481 0.5227 0.4666 0.5479 0.6284 0.5293 0.5751 0.5762 0.60873 0.2203 0.3067 0.4286 0.4866 0.4753 0.4862 0.5410 0.5020 0.5368 0.49054 0.1515 0.2922 0.3804 0.4477 0.4393 0.5085 0.5142 0.4598 0.4848 0.49745 0.1542 0.3415 0.4105 0.4041 0.4042 0.4341 0.4652 0.4127 0.4949 0.4276
b 6 0.2485 0.3451 0.3795 0.3970 0.4384 0.4703 0.4646 0.4808 0.4630 0.43357 0.2606 0.3405 0.3503 0.4013 0.4512 0.4510 0.4461 0.4172 0.5251 0.57318 0.1818 0.2821 0.2936 0.3695 0.4702 0.4001 0.4722 0.4635 0.4588 0.62989 0.1408 0.2532 0.2304 0.3955 0.4361 0.4655 0.4934 0.4384 0.5053 0.474810 0.1270 0.3256 0.2929 0.4448 0.4523 0.4526 0.4690 0.4150 0.6143 0.6418
45

Chapter 8
Conclusions
Since we were unable to implement the Laplace transform methods described in Cont et al.
[2010] our general conclusion must be that the method is no good. One of the reasons for using this
specific model is that it is easy to calculate the conditional probabilities analytically and that was
not possible. It is not obvious how the inversion of the Laplace transforms should be done. Two
methods for the inversion are considered in Chapter 6 but it is not clear how they are to be combined
with the continued fractions. However, the long term behavior of the order book the model recreates
some major properties from the empirical data, namely the steady state shape of the order book
but also the midprice follows the same basic upward movement. This means that the model is not
all bad although it does not fulfill the most important requirements. In order to predict the short
term behavior of the order book, hence being able to earn money on high frequency trading, you
have to calculate conditional probabilities, e.g. the probability of an increase in midprice. This can
be done by simulating the order book but means a lot of extra computational time compared to
analytical Laplace transforms. The main reason for the failure in implementing the model is the
lack of instructions on how to do the previously named inversion of the Laplace transformation.
Cont et al. [2010] just states that the inversion is performed using the methods presented here in 6.
However the methods don’t take in to consideration the existence of the continued fractions which
is not at all trivial.
46

To sum up one could claim that this is a fairly good model since it shows the same steady
state shape as the empirical data and the short term behavior can be predicted fairly well by
simulation. However the aim with this model is to analytically compute conditional probabilities,
hence predicting the short term behavior. Since this was not possible the model, or perhaps more
precisely the method should be considered unfavorable.
47

Bibliography
Joseph Abate and Ward Whitt. The fourier-series method for inverting transforms of probability
distributions. 1992.
Joseph Abate and Ward Whitt. Numerical inversion of laplace transforms of probability distribu-
tions. 1995.
Joseph Abate and Ward Whitt. Computing laplace transforms for numerical inversion via continued
fractions. 1999.
S. Asmussen. Applied Probability and Queues. Springer Verlag, 2003.
Bouchaud, J.-P., M. Mézard, and M. Potters. Statistical properties of stock order books: Empirical
results and models. 2002.
Bouchaud, J.-P., D. Farmer, and F. Lillo. How markets slowly digest changes in supply and demand.
2008.
Rama Cont, Sasha Stoikov, and Rishi Talreja. A stochastic model for order book dynamics. 2010.
Michael Durbin. All About High-Frequency Trading. McGraw-Hill, 2010.
I. Zovko and J. D. Farmer. The power of patience; a behavioral regularity in limit order placement.
2002.
48