Embed Size (px)
Citation preview
Energy Systems in Norway
Kjersti ØyenSkjalg Holther
VL Energiesysteme und Energiewirtschaft
SS 2005TU Berlin
Outline
• Norway in general
• Energy usage and production trends in Norway
• Hydropower
• International trade
• Case study: Power Crisis of 2002
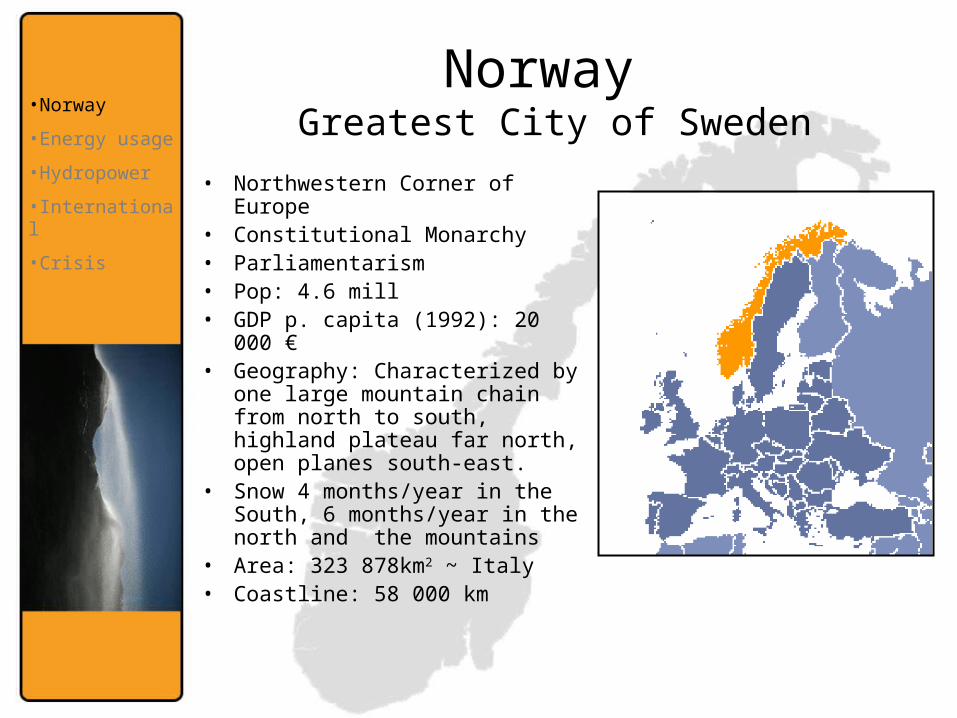
Norway Greatest City of Sweden
• Northwestern Corner of Europe• Constitutional Monarchy• Parliamentarism• Pop: 4.6 mill• GDP p. capita (1992): 20 000 €• Geography: Characterized by
one large mountain chain from north to south, highland plateau far north, open planes south-east.
• Snow 4 months/year in the South, 6 months/year in the north and the mountains
• Area: 323 878km2 ~ Italy• Coastline: 58 000 km
•Norway
•Energy usage
•Hydropower
•International
•Crisis
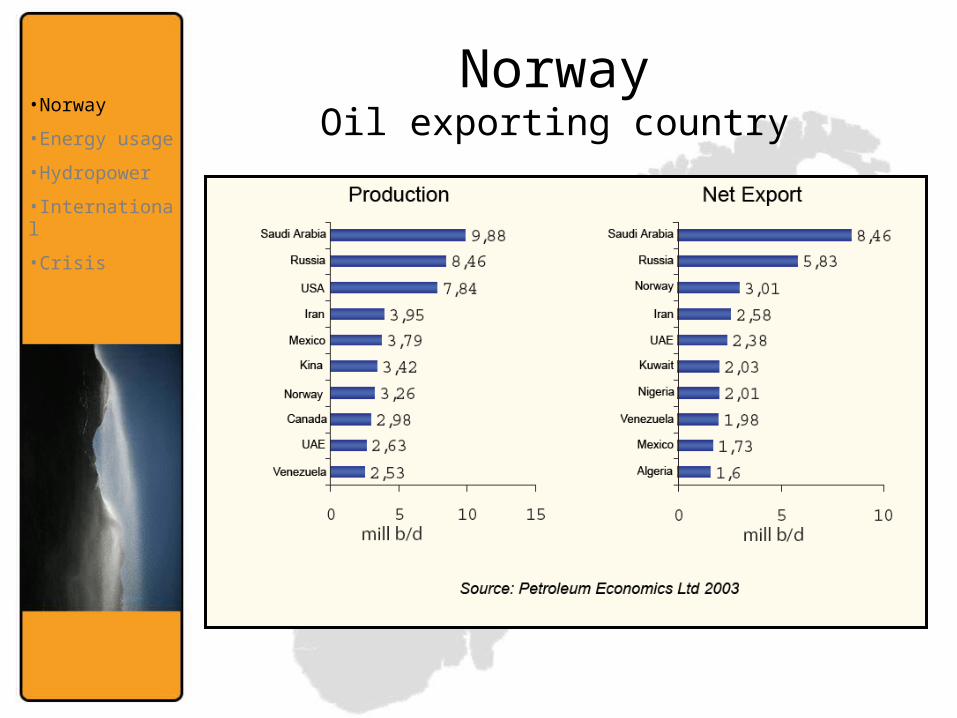
NorwayOil exporting country
•Norway
•Energy usage
•Hydropower
•International
•Crisis
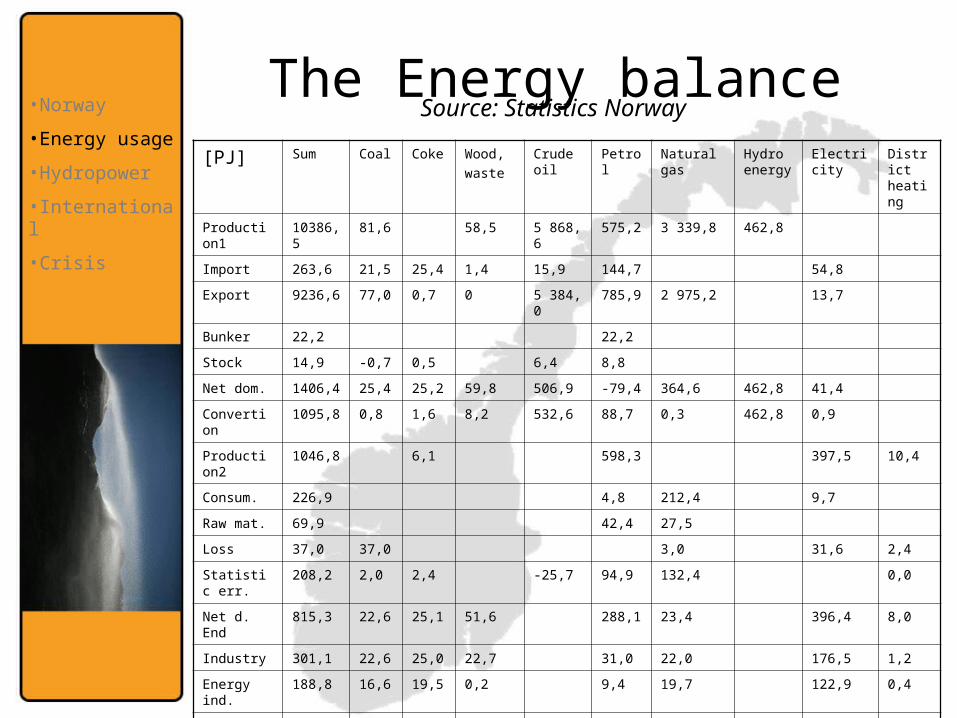
The Energy balance[PJ] Sum Coal Coke Wood,
waste
Crude oil
Petrol Natural gas
Hydro energy
Electricity District heating
Production1 10386,5 81,6 58,5 5 868,6 575,2 3 339,8 462,8
Import 263,6 21,5 25,4 1,4 15,9 144,7 54,8
Export 9236,6 77,0 0,7 0 5 384,0 785,9 2 975,2 13,7
Bunker 22,2 22,2
Stock 14,9 -0,7 0,5 6,4 8,8
Net dom. 1406,4 25,4 25,2 59,8 506,9 -79,4 364,6 462,8 41,4
Convertion 1095,8 0,8 1,6 8,2 532,6 88,7 0,3 462,8 0,9
Production2 1046,8 6,1 598,3 397,5 10,4
Consum. 226,9 4,8 212,4 9,7
Raw mat. 69,9 42,4 27,5
Loss 37,0 37,0 3,0 31,6 2,4
Statistic err. 208,2 2,0 2,4 -25,7 94,9 132,4 0,0
Net d. End 815,3 22,6 25,1 51,6 288,1 23,4 396,4 8,0
Industry 301,1 22,6 25,0 22,7 31,0 22,0 176,5 1,2
Energy ind. 188,8 16,6 19,5 0,2 9,4 19,7 122,9 0,4
Wood 48,8 0,0 0,0 17,4 7,2 0,4 23,6 0,2
Mining 63,5 6,0 5,5 5,0 14,4 1.9 30,0 0,7
Transport 209,3 206,8 0,4 2,1
Transport 305,0 0,1 28,9 50,4 1,0 217,8 6,8
Source: Statistics Norway•Norway
•Energy usage
•Hydropower
•International
•Crisis
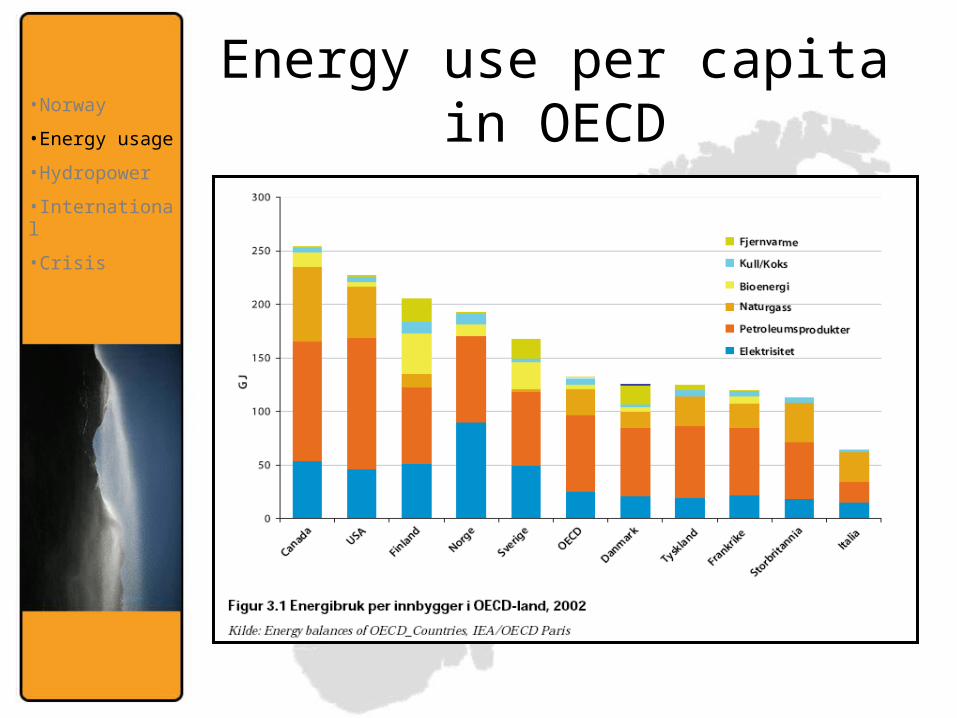
Energy use per capita in OECD
•Norway
•Energy usage
•Hydropower
•International
•Crisis
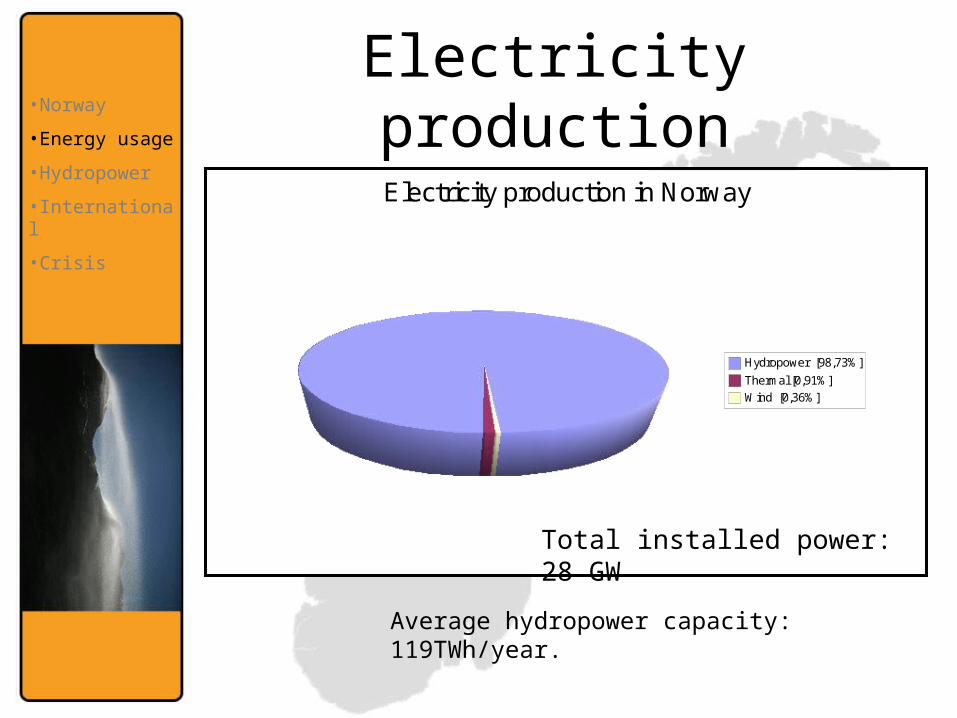
Electricity production
Electricity production in Norway
Hydropower [98,73%]
Thermal [0,91%]
Wind [0,36%]
Total installed power: 28 GW
Average hydropower capacity: 119TWh/year.
•Norway
•Energy usage
•Hydropower
•International
•Crisis
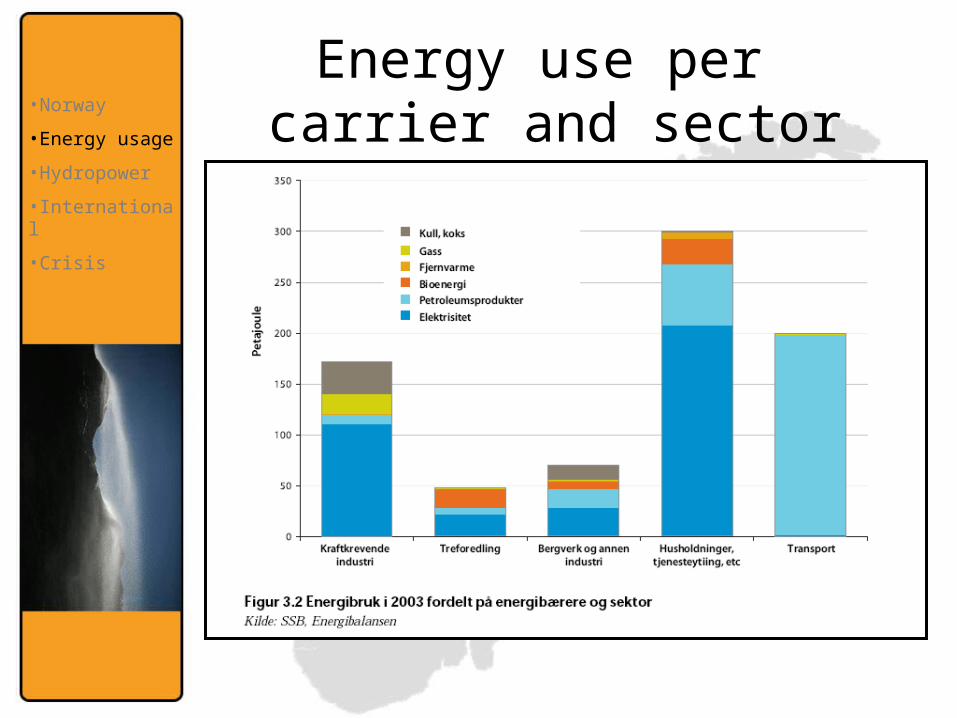
Energy use per carrier and sector
•Norway
•Energy usage
•Hydropower
•International
•Crisis
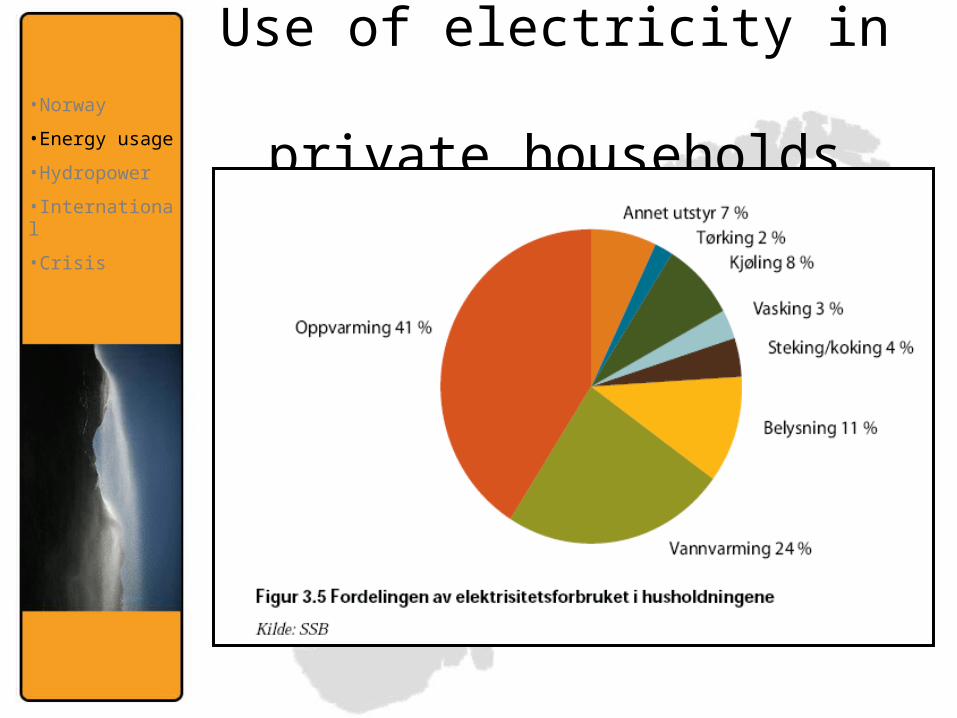
Use of electricity in private households
•Norway
•Energy usage
•Hydropower
•International
•Crisis
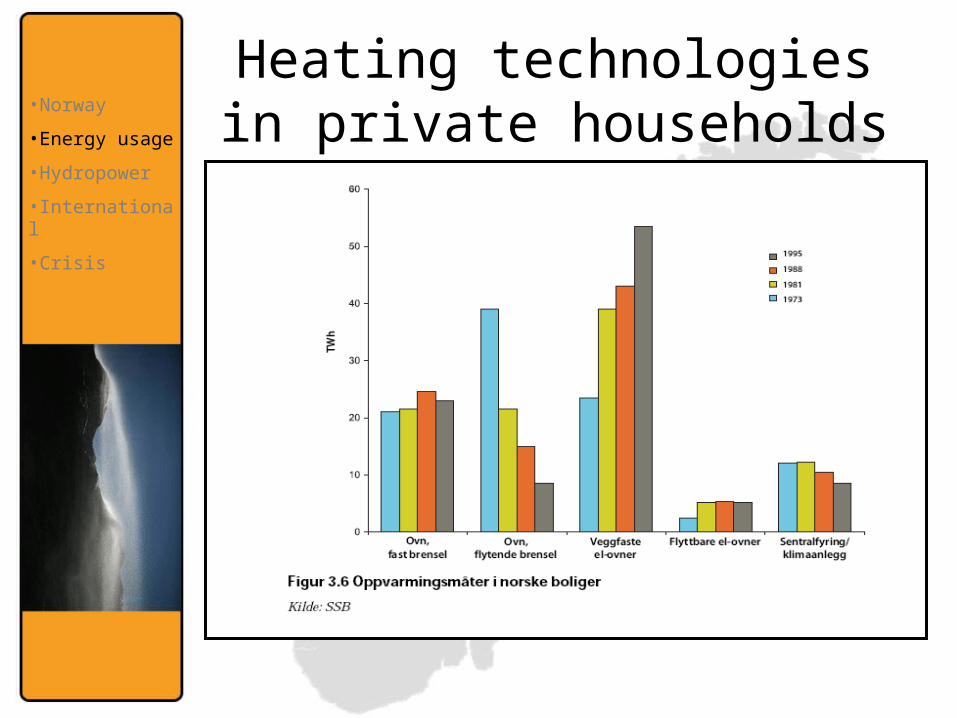
Heating technologies in private households
•Norway
•Energy usage
•Hydropower
•International
•Crisis
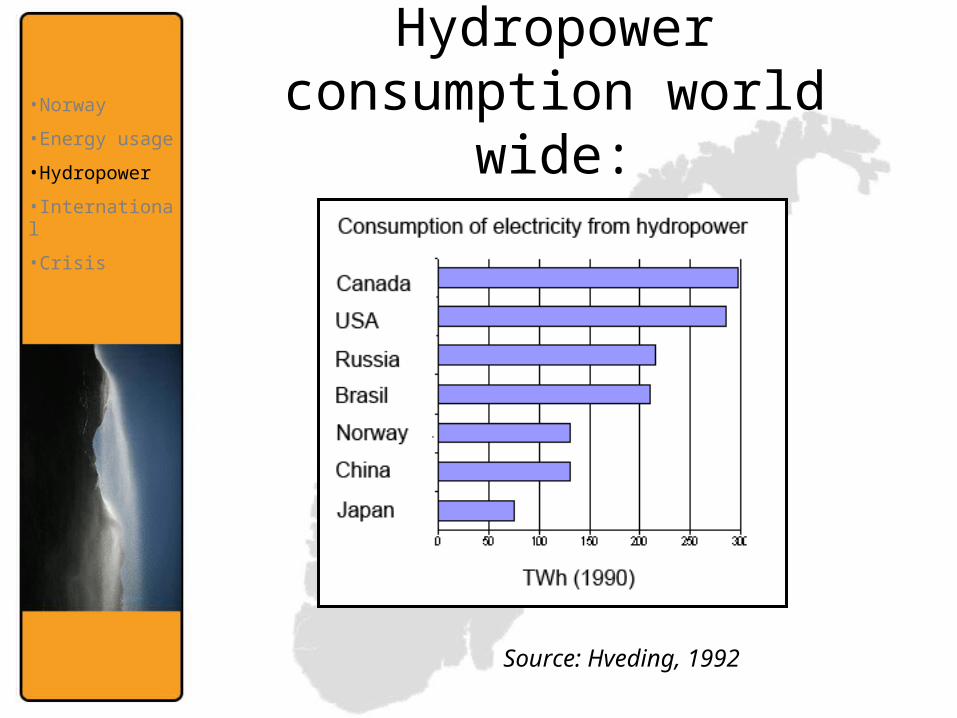
Hydropower consumption world wide:
Source: Hveding, 1992
•Norway
•Energy usage
•Hydropower
•International
•Crisis
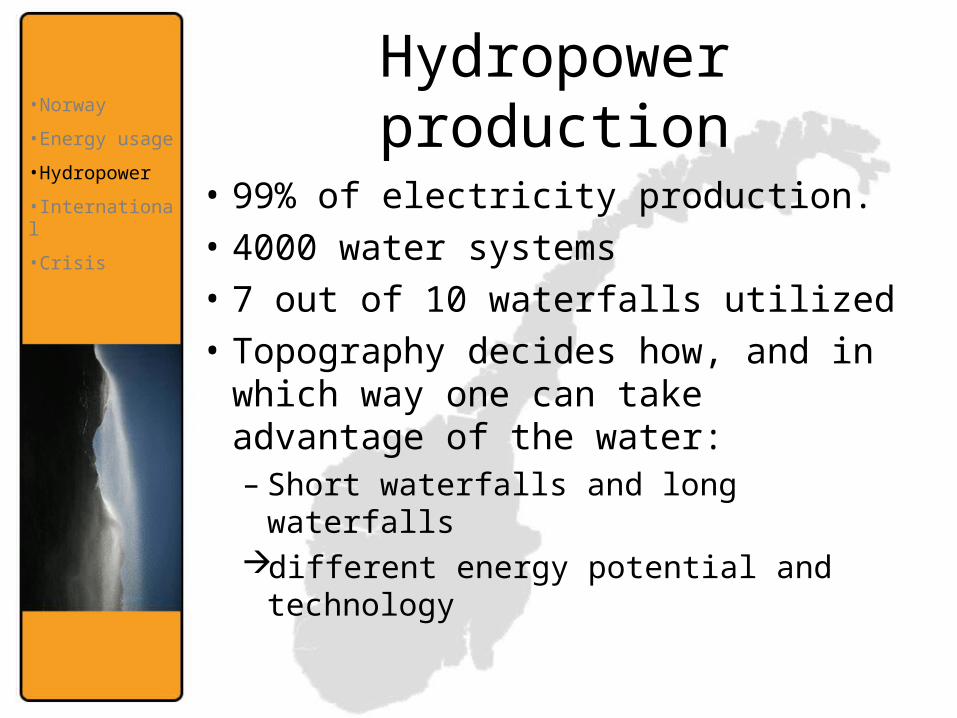
Hydropower production
• 99% of electricity production.
• 4000 water systems
• 7 out of 10 waterfalls utilized
• Topography decides how, and in which way one can take advantage of the water:– Short waterfalls and long waterfallsdifferent energy potential and
technology
•Norway
•Energy usage
•Hydropower
•International
•Crisis
Regulating reservoir
• Energy potential stored in lakes, or artificial reservoirs (pools) dimmed up.
• Season regulation
• Short-term regulation, days, weeks
• Reservoir capacity
• Economic profit
•Norway
•Energy usage
•Hydropower
•International
•Crisis
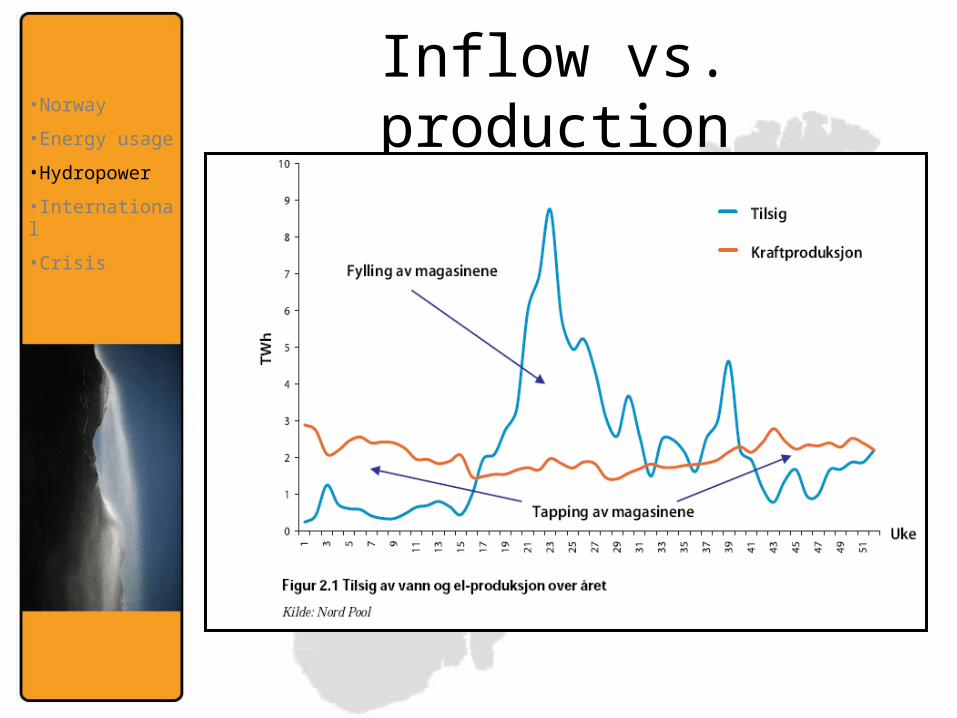
Inflow vs. production•Norway
•Energy usage
•Hydropower
•International
•Crisis
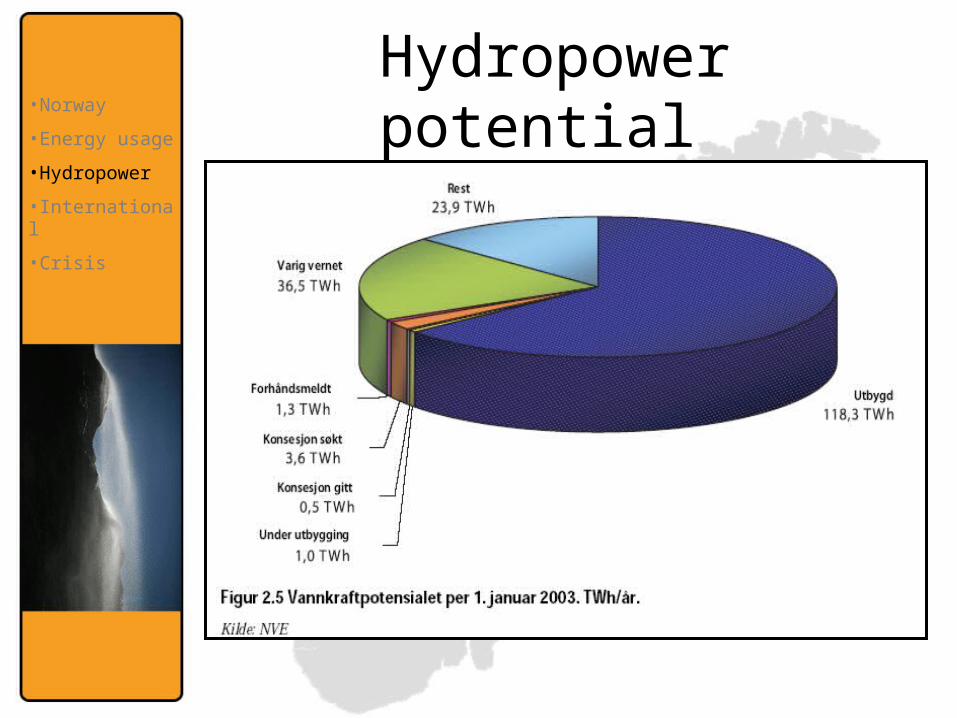
Hydropower potential •Norway
•Energy usage
•Hydropower
•International
•Crisis
Environmental impacts of hydropower.
• Pure electricity production
• BUT; building water systems involves change or destruction of nature. – Area
• Roads• Removing mass, and so on.• Immense alteration of mountain scenery
– Fish population and vegetation
•Norway
•Energy usage
•Hydropower
•International
•Crisis
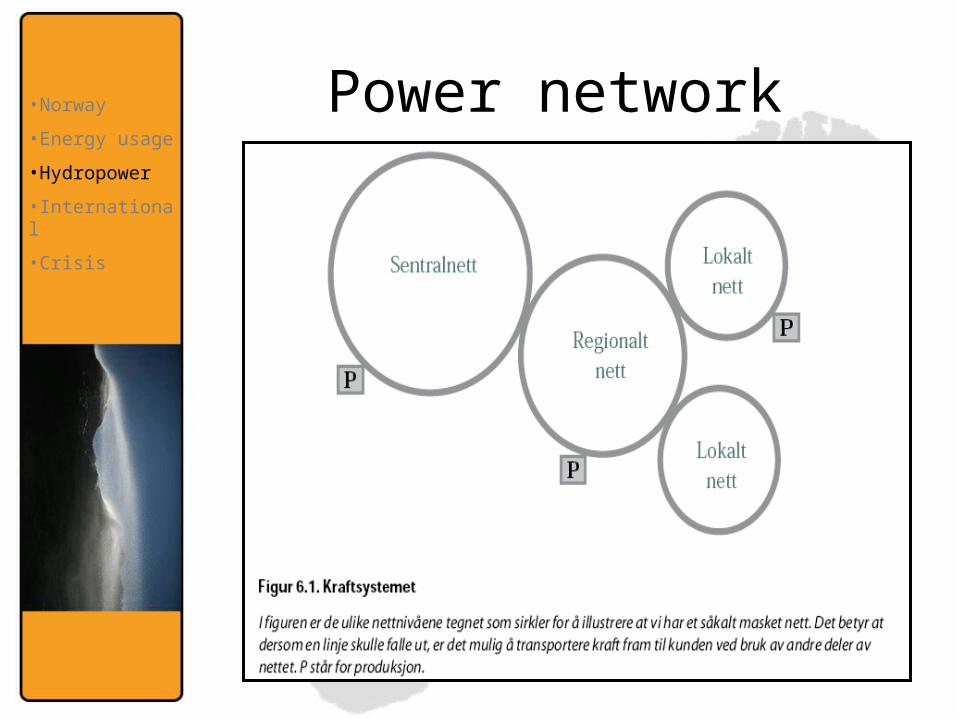
Power network•Norway
•Energy usage
•Hydropower
•International
•Crisis
International Cooperation
• EFTA and EEA• The Baltic see cooperation
(BASREC)• Scandinavian cooperation.• The European energy charter• IEA• EUs water directive• Other EU energy programs.
•Norway
•Energy usage
•Hydropower
•International
•Crisis
•Norway
•Energy usage
•Hydropower
•International
•Crisis
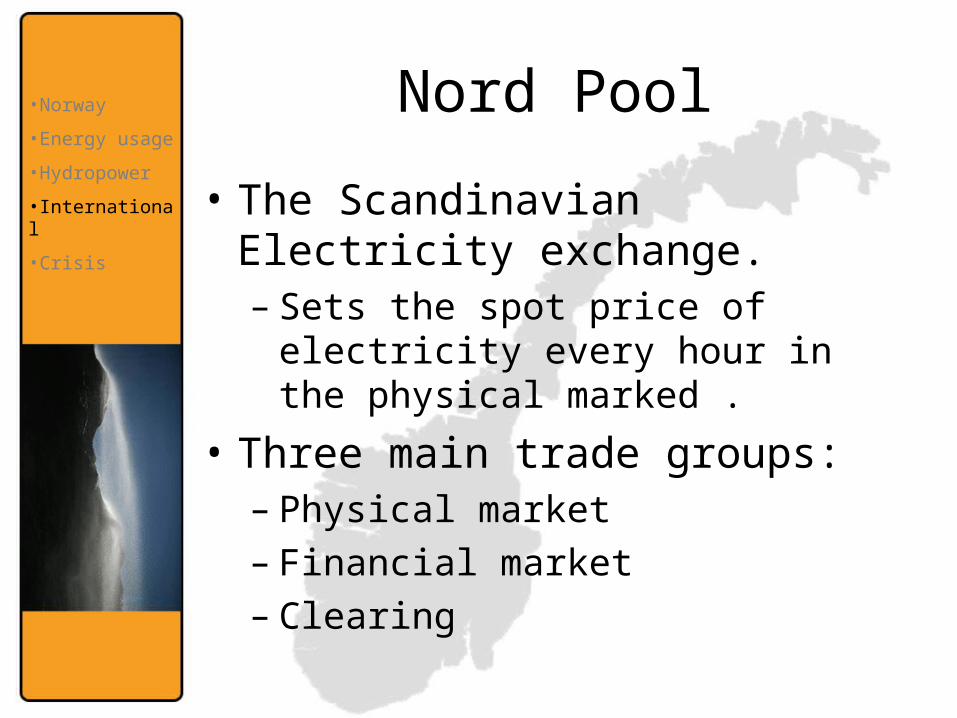
Nord Pool
• The Scandinavian Electricity exchange. – Sets the spot price of electricity every
hour in the physical marked .
• Three main trade groups:– Physical market– Financial market– Clearing
•Norway
•Energy usage
•Hydropower
•International
•Crisis
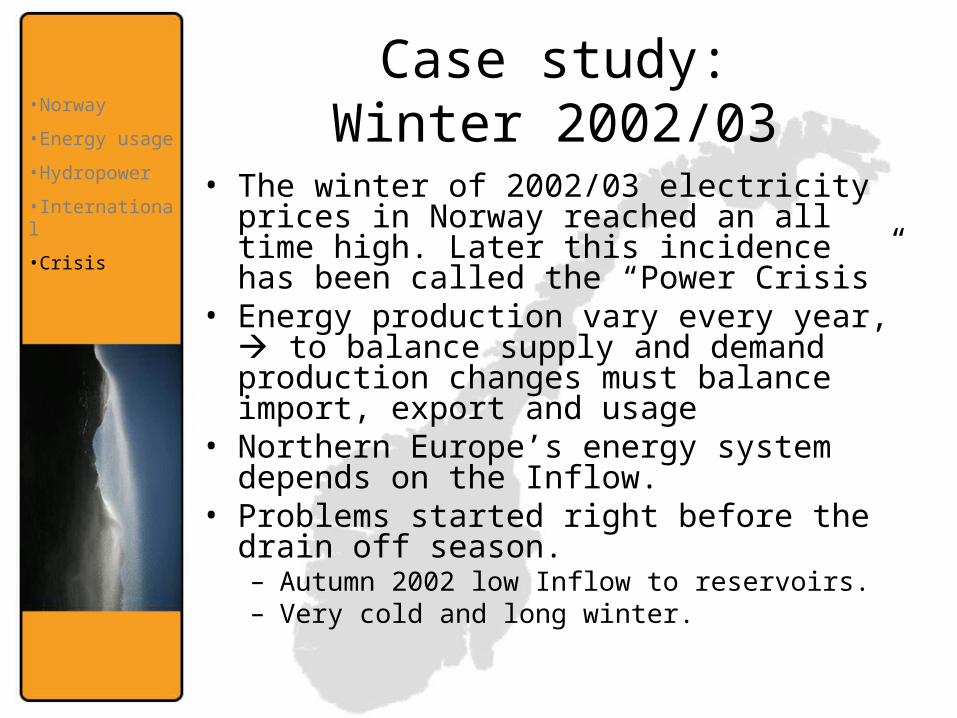
Case study:Winter 2002/03
• The winter of 2002/03 electricity prices in Norway reached an all time high. Later this incidence has been called the “Power Crisis”
• Energy production vary every year, to balance supply and demand production changes must balance import, export and usage
• Northern Europe’s energy system depends on the Inflow.
• Problems started right before the drain off season.– Autumn 2002 low Inflow to reservoirs. – Very cold and long winter.
•Norway
•Energy usage
•Hydropower
•International
•Crisis
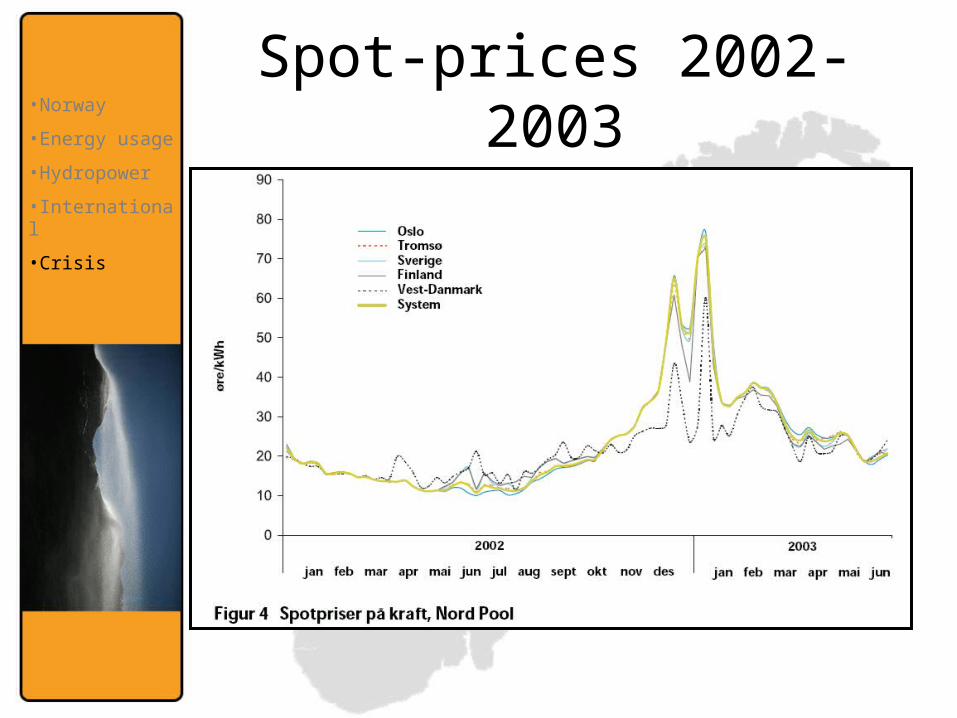
Spot-prices 2002-2003•Norway
•Energy usage
•Hydropower
•International
•Crisis
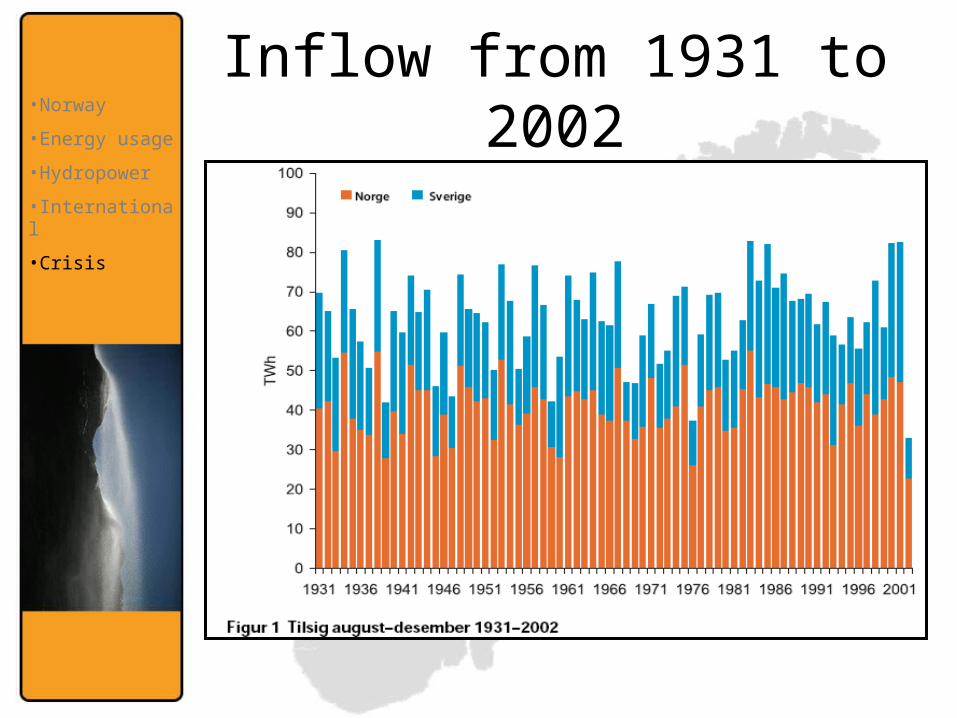
Inflow from 1931 to 2002•Norway
•Energy usage
•Hydropower
•International
•Crisis
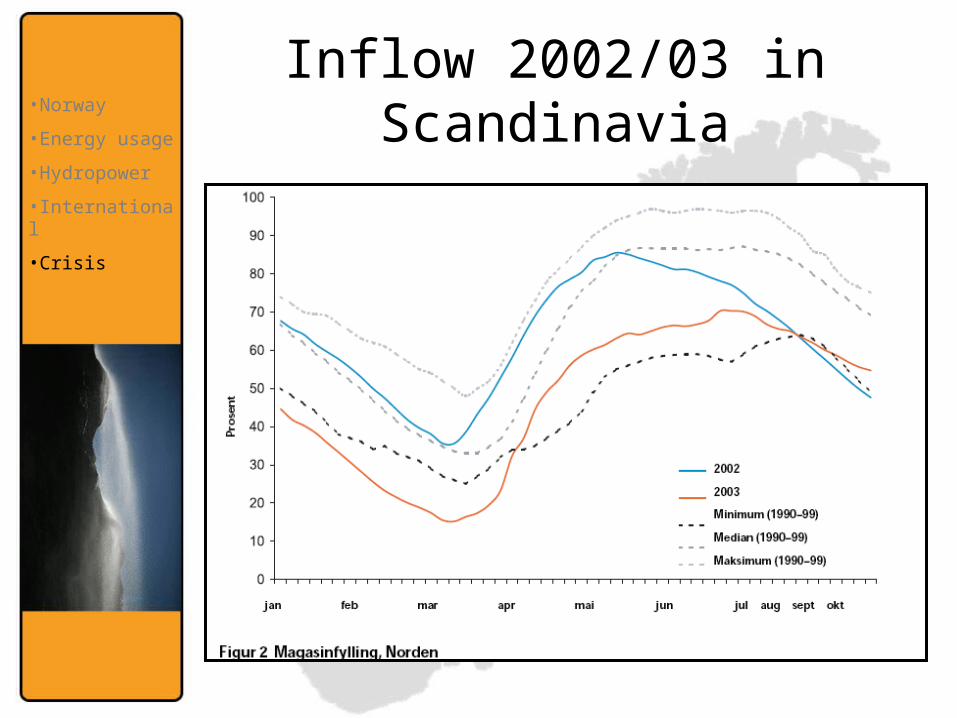
Inflow 2002/03 in Scandinavia
•Norway
•Energy usage
•Hydropower
•International
•Crisis
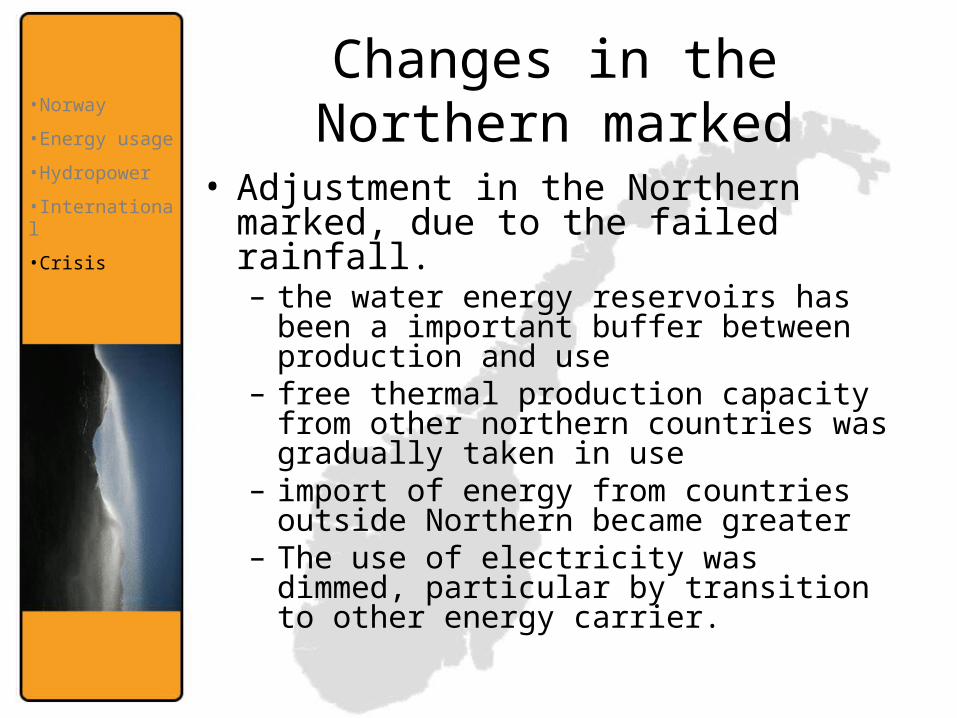
Changes in the Northern marked
• Adjustment in the Northern marked, due to the failed rainfall.– the water energy reservoirs has been a
important buffer between production and use
– free thermal production capacity from other northern countries was gradually taken in use
– import of energy from countries outside Northern became greater
– The use of electricity was dimmed, particular by transition to other energy carrier.
•Norway
•Energy usage
•Hydropower
•International
•Crisis
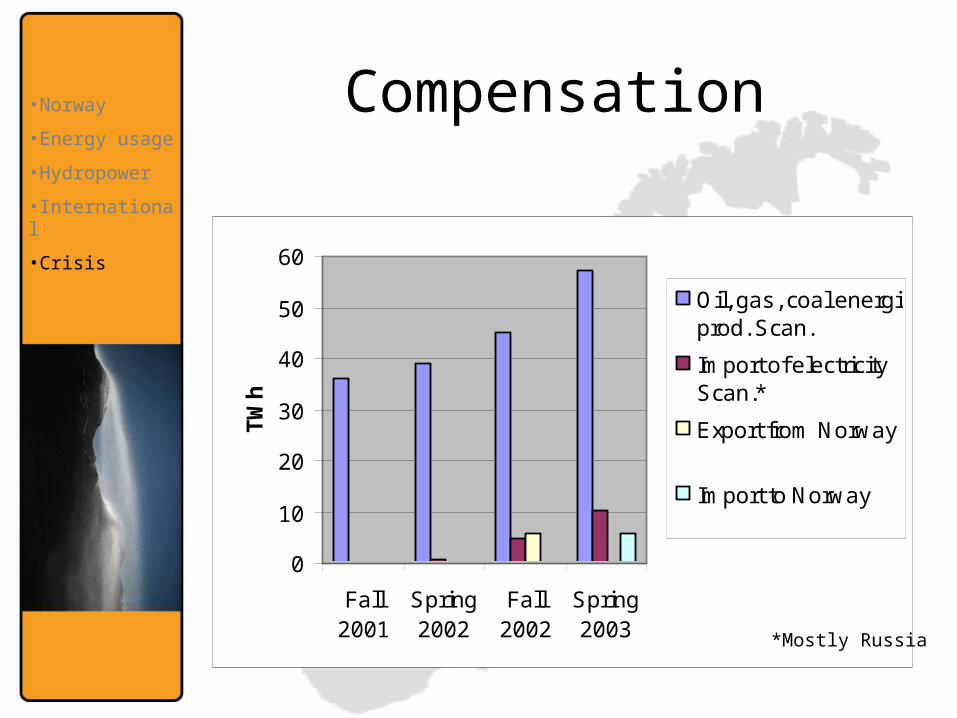
Compensation
0
10
20
30
40
50
60
Fall2001
Spring2002
Fall2002
Spring2003
TWh
Oil, gas, coal energiprod. Scan.
Import of electricityScan.*
Export from Norway
Import to Norway
*Mostly Russia
•Norway
•Energy usage
•Hydropower
•International
•Crisis
Price changes.
• The Prices varied a lot during the whole of 2002, low in the spring, high in the fall
• During the winter 2002/2 the spot price varied from 50-80 øre/kWh (=6,25-10 cent/kWh)
• It remained higher than normal during the whole spring season.
•Norway
•Energy usage
•Hydropower
•International
•Crisis
Change in electricity use.
• Fall 2002; 2% Higher energy use in Scandinavia
• First half of 2003; 0,5 Lower energy use in Scandinavia.– Norway decreased their Energy
usage, with 4TWh
• Crises like this happens every 100-200 years. (Source: Norwegian Ministry of Petroleum and
Energy)
•Norway
•Energy usage
•Hydropower
•International
•Crisis
References
• Norwegian ministry of Petroleum and Energy 2004: Energi og vassdragsvirksomheten i Norge 2004. OED, Oslo.
• Statistics Norway: Energy statistics 2005 www.ssb.no
• V. Hveding, 1992: Vannkraft i Norge, NTH Institutt for vassbygging, Trondheim.