Embed Size (px)
Citation preview
EPA Region 5 Records Ctr.
Timothy Drexler/R5/USEP/VUS
02/08/2008 01:49 PM
290480
cc Joan Tanaka/R5/USEPA/US@EPA, Wendy Carney/R5/USEP/VUS@EPA, [email protected], [email protected], Mark Johnson/R5/USEPA/US@EPA, [email protected], Clayton Koher/r5/usepa/us@EPA, [email protected], [email protected], [email protected], [email protected], [email protected], [email protected], [email protected], [email protected], [email protected], [email protected], David Brauner/R5/USEPA/US@EPA, [email protected], [email protected], [email protected], Jane Neumann/R5/USEP/VUS@EPA, Barbara Wester/R5/USEPA/US@EPA, Thomas Turner/R5/USEPA/US@EPA, Monesh Chabria/R5/USEPA/US@EPA, Ed Fairbanks/R5/USEP/\/US@EPA, Don Debiasio/R5/USEP/\/US@EPA
bcc
Subject U.S. EPA on HH and Eco Risk Assessment: St. Regis Paper Co., Superfund Site
Hi Tom:
Attached are our comments on the Sept. 28, 2007 revised St. Regis Risk Assessment. A cover letter is also attached. Hard copies will follow. Please call me if you have any questions.
Tim Drexler Remedial Project IVIanager Superfund Division United States Environmental Protection Agency 77 W. Jackson Blvd., SR-6J Chicago, Illinois 60604-3590
phone: 312.353.4367 fax: 312.886.4071
EPA_wPartnerCommentsJinal.doc EPA com final cover.doc
February 8, 2008 SR-6J Mr. Thomas C. Richardson Project Manager Environment, Health, & Safety Services Intemational Paper 6400 Poplar Avenue Memphis, Tennessee 38197
Re: U.S. EPA Comments on Revised Human Health and Ecological Risk Assessment for the St. Regis Paper Company Site, Cass Lake, MN: UAO Docket No. V-W-04-C-796
Dear Mr. Richardson:
Attached please find the U.S. EPA and agency partner comments on the revised version of the Human Health and Ecological Risk Assessment submitted on September 28, 2007. A complete revision of the document is not necessary. U.S. EPA will consider that an addendum which adequately responds to these comments is sufficient to satisfy the requirements of the Order for the Risk Assessment.
U.S. EPA will expect the addendum 30-days from the receipt of this letter. After you have had an opportunity to review these comments, please contact me at (312) 353-4367 or at drexler;[email protected] if you have any questions.
Thank you for your attention. 1 look forward to the successful close-out of this Order in the near future.
Sincerely,
Tim Drexler Remedial Project Manager
cc: S. Nordrum, LLBO S. Johnson, MPCA R. Messing, MDH M. Johnson, ATSDR K. Peters, City of Cass Lake T. Ross. IP
U.S. ENVIRONMENTAL PROTECTION AGENCY REVIEW OF THE "HUMAN HEALTH AND ECOLOGICAL RISK ASSESSMENT,
ST. REGIS PAPER COMPANY SITE, CASS LAKE, MN" FEBRUARY 8, 2008
The U.S. Environmental Protection Agency (EPA) and its agency partners reviewed the "Human
Health and Ecological Risk Assessment, St. Regis Paper Company Site, Cass Lake, MN" (the risk
assessment) dated September 28, 2007. The risk assessment was prepared by Integral Consulting,
Inc., for Intemational Paper (IP). The risk assessment was reviewed to assess (1) its technical
adequacy; (2) whether comments submitted on the previous version of the risk assessment, dated
November 16, 2005, had been adequately addressed; and (3) whether EPA directives regarding
resolution of specific issues had been adequately incorporated. Based on its review, EPA
observed that most comments and directives regarding the previously submitted version of the
risk assessment had been adequately addressed and incorporated. Nonetheless, EPA identified
concems regarding a variety of issues that require revision, clarification, or additional
justification or explanation. EPA's concems appear in the following general and specific
technical review comments. References cited in the comments are listed immediately following
the specific comments.
GENERAL COMMENTS
1. Section 4.4.2 presents citations that are extremely selective. This section must be rewritten
such that the tone, planting doubt as to the scientific consensus which surrounds the toxicity
of dioxins and the use of TEFs, is removed. See specific comment #40 for additional details.
2. Sections 4.5.1.3 and 4.5.2.3 indicate that noncancer health hazards and cancer risk estimates,
respectively, for Area B do not include ingestion of fish. Potential exposure through
ingestion offish tissue is evaluated separately from other pathways and not included in totals
because "concentrations of dioxins/fiirans (as TCDD TEQdf) and polynuclear aromatic
hydrocarbons (PAH) (as BaPE) in fish . . . from Cass Lake and Pike Bay are not higher than
concentrations of these chemicals in fish
. . . from background reference lakes." This conclusion is problematic for the several reasons
discussed below.
First, the conclusion is based on consideration of only TEQdf and BaPE, without apparent
consideration of other chemicals that contribute significantly to total hazards and risks.
Specifically, as discussed in Section 4.5.3.1 and Appendix C, some evidence exists that
"concentrations of coplanar, dioxin-like polychlorinated biphenyl (PCB) congeners
(expressed as TEQp) are higher in Cass Lake and Pike Bay fish than in reference lakes.
Concentrations of Ai-oclor 1260 are higher in some fish tissue types in Cass Lake and Pike
Bay than in reference lakes." TEQp contributes about 60 percent of the cancer risks
associated with ingestion of fish.
Second, the conclusion that concentrations of dioxins/furans (as TEQdf) in fish from Cass
Lake and Pike Bay are not higher than concentrations of these chemicals from background
reference lakes is not as evident as suggested in the text and Appendix C. Contrary to the
conclusion presented in the risk assessment, the weight of evidence based on statistical results
and qualitative comparisons supports the conclusion that concentrations of dioxins/furans (as
TEQdf) in fish from Cass Lake and Pike Bay may be higher than concentrations of these
chemicals in fish from background lakes for some tissues (for example, perch fillet with y2
detection limit [DL]; whitefish & tulibee fillet with Vi DL; whitefish & tulibee whole with V2
DL). The combination of low sample size and low frequency of detection render many of the
statistical results equivocal, such that one cannot conclude with high confidence either that
(1) concentrations are greater in Cass Lake and Pike Bay fish or (2) concentrations in Cass
Lake and Pike Bay fish cannot be distinguished from concentrations in fish from background
reference lakes.
Based on the equivocal statistical results and qualitative evidence that site concentrations
exceed background for some reference area-tissue combinations, it is appropriate and
consistent with regulatory mandates concerning protection of human health and the
environment to adopt the more conservative position that exposure to dioxins/fiirans and
coplanar, dioxin-like PCB congeners (as TEQdfp) and Aroclor 1260 may be higher for fish
from Cass Lake and Pike Bay than for fish in reference lakes. Therefore, exposure, risk, and
hazard results associated with potential ingestion of fish should be included in the body of the
text and considered as part of total exposures, risks, and hazards.

For illustrative purposes several example total risks and hazards for some of the most highly
exposed receptors are presented in the following table. These results may be used as a guide
for the fiill set of receptor-specific total risks and hazards.
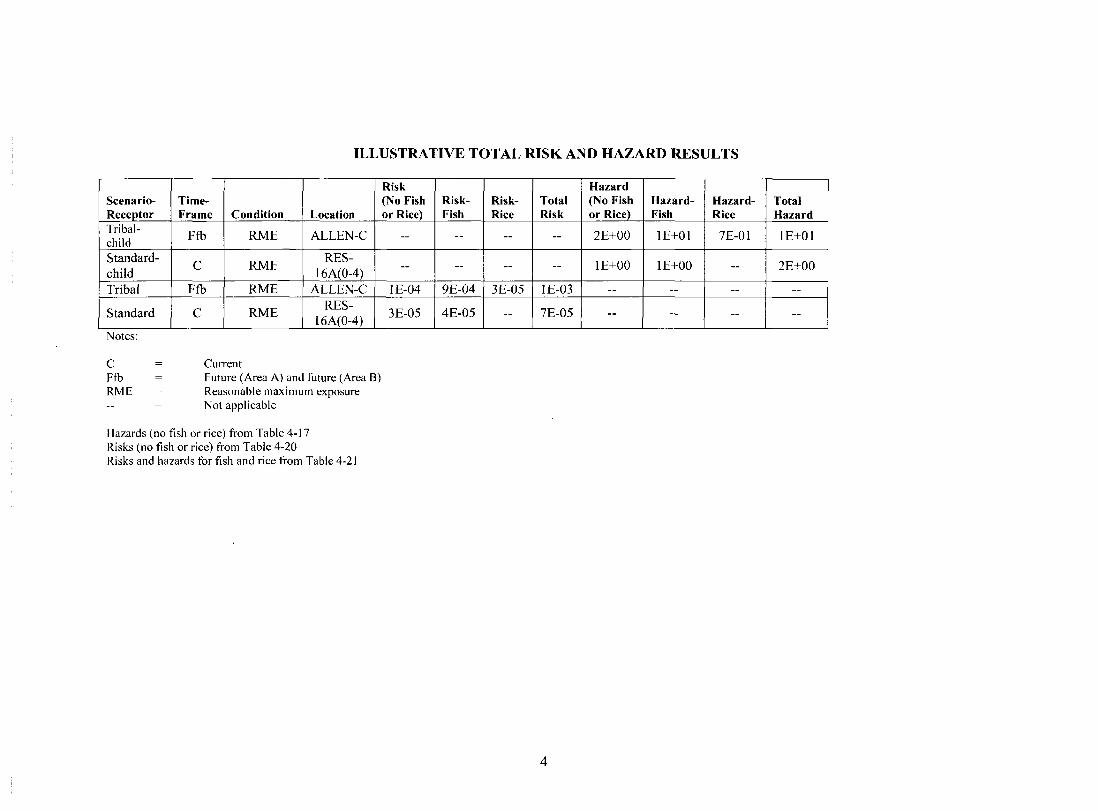
ILLUSTRATIVE TOTAL RISK AND HAZARD RESULTS
Scenario-Receptor Tribal-child Standard-child Tribal
Standard
Time-Frame
Ffb
C
Ffb
C
Condition
RME
RME
RME
RME
Location
ALLEN-C
RES-16A(0-4)
ALLEN-C RES-
16A(0-4)
Risk (No Fish or Rice)
~
-
lE-04
3E-05
Rislt-Fish
-
-
9E-04
4E-05
Risk-Rice
~
3E-05
-
Total Risk
~
-
lE-03
7E-05
Hazard (No Fish or Rice)
2E+00
lE+00
—
Hazard-Fish
lE+01
lE+00
—
-
Hazard-Rice
7E-01
-
—
-
Total Hazard
lE+01
2E+00
—
-
Notes:
C Ftb RME
CuiTent Future (Area A) and future (Area B) Reasonable maximum exposure Not applicable
Hazards (no fish or rice) from Table 4-17 Risks (no fish or rice) fi-om Table 4-20 Risks and hazards for fish and rice from Table 4-21
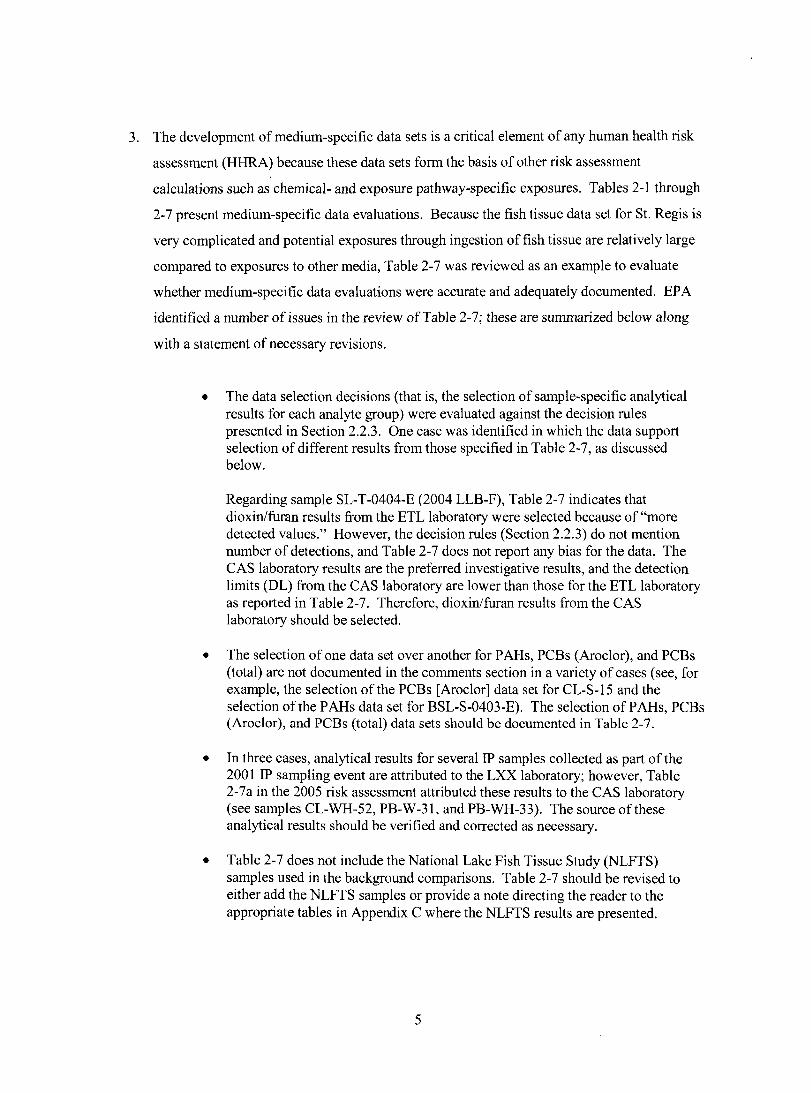
The development of medium-specific data sets is a critical element of any human health risk
assessment (HHRA) because these data sets form the basis of other risk assessment
calculations such as chemical- and exposure pathway-specific exposures. Tables 2-1 through
2-7 present medium-specific data evaluations. Because the fish tissue data set for St. Regis is
very complicated and potential exposures through ingestion offish tissue are relatively large
compared to exposures to other media, Table 2-7 was reviewed as an example to evaluate
whether medium-specific data evaluations were accurate and adequately documented. EPA
identified a number of issues in the review of Table 2-7; these are summarized below along
with a statement of necessary revisions.
The data selection decisions (that is, the selection of sample-specific analytical results for each analyte group) were evaluated against the decision mles presented in Section 2.2.3. One case was identified in which the data support selection of different results from those specified in Table 2-7, as discussed below.
Regarding sample SL-T-0404-E (2004 LLB-F), Table 2-7 indicates that dioxin/furan results from the ETL laboratory were selected because of "more detected values." However, the decision mles (Section 2.2.3) do not mention number of detections, and Table 2-7 does not report any bias for the data. The CAS laboratory results are the preferred investigative results, and the detection limits (DL) from the CAS laboratory are lower than those for the ETL laboratory as reported in Table 2-7. Therefore, dioxin/furan results from the CAS laboratory should be selected.
The selection of one data set over another for PAHs, PCBs (Aroclor), and PCBs (total) are not documented in the comments section in a variety of cases (see, for example, the selection of the PCBs [Aroclor] data set for CL-S-15 and the selection of the PAHs data set for BSL-S-0403-E). The selection of PAHs, PCBs (Aroclor), and PCBs (total) data sets should be documented in Table 2-7.
In three cases, analytical results for several IP samples collected as part of the 2001 IP sampling event are attributed to the LXX laboratory; however. Table 2-7a in the 2005 risk assessment attributed these results to the CAS laboratory (see samples CL-WH-52, PB-W-31, and PB-WH-33). The source of these analytical results should be verified and corrected as necessary.
Table 2-7 does not include the National Lake Fish Tissue Study (NLFTS) samples used in the background comparisons. Table 2-7 should be revised to either add the NLFTS samples or provide a note directing the reader to the appropriate tables in Appendix C where the NLFTS results are presented.
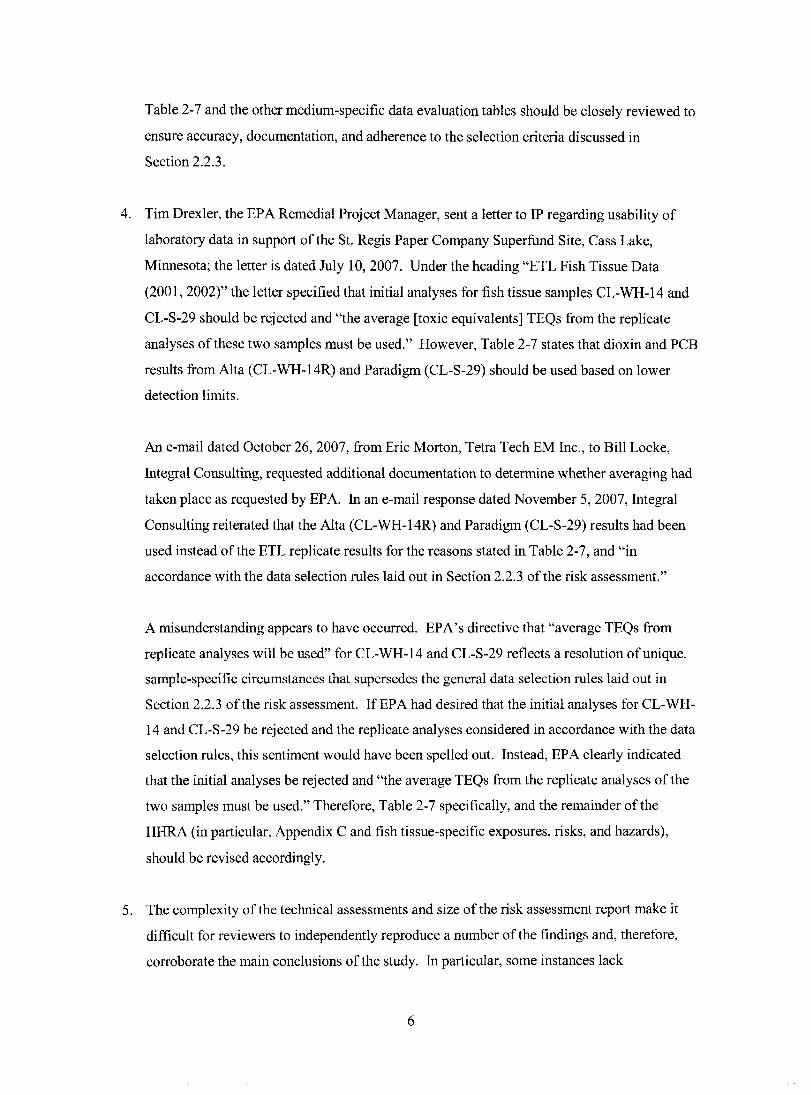
Table 2-7 and the other medium-specific data evaluation tables should be closely reviewed to
ensure accuracy, documentation, and adherence to the selection criteria discussed in
Section 2.2.3.
4. Tim Drexler, the EPA Remedial Project Manager, sent a letter to IP regarding usability of
laboratory data in support of the St. Regis Paper Company Superfimd Site, Cass Lake,
Minnesota; the letter is dated July 10, 2007. Under the heading "ETL Fish Tissue Data
(2001, 2002)" the letter specified that initial analyses for fish tissue samples CL-WH-14 and
CL-S-29 should be rejected and "the average [toxic equivalents] TEQs from the replicate
analyses of these two samples must be used." However, Table 2-7 states that dioxin and PCB
resuhs from Alta (CL-WH-14R) and Paradigm (CL-S-29) should be used based on lower
detection limits.
An e-mail dated October 26, 2007, from Eric Morton, Tetra Tech EM Inc., to Bill Locke,
Integral Consulting, requested additional documentation to determine whether averaging had
taken place as requested by EPA. In an e-mail response dated November 5, 2007, Integral
Consulting reiterated that the Alta (CL-WH-14R) and Paradigm (CL-S-29) results had been
used instead of the ETL replicate results for the reasons stated in Table 2-7, and "in
accordance with the data selection mles laid out in Section 2.2.3 of the risk assessment."
A misunderstanding appears to have occurred. EPA's directive that "average TEQs from
replicate analyses will be used" for CL-WH-14 and CL-S-29 reflects a resolution of unique,
sample-specific circumstances that supersedes the general data selection rules laid out in
Section 2.2.3 of the risk assessment. If EPA had desired that the initial analyses for CL-WH-
14 and CL-S-29 be rejected and the replicate analyses considered in accordance with the data
selection mles, this sentiment would have been spelled out. Instead, EPA clearly indicated
that the initial analyses be rejected and "the average TEQs from the replicate analyses of the
two samples must be used." Therefore, Table 2-7 specifically, and the remainder of the
HHRA (in particular, Appendix C and fish tissue-specific exposures, risks, and hazards),
should be revised accordingly.
5. The complexity of the technical assessments and size of the risk assessment report make it
difficult for reviewers to independently reproduce a number of the findings and, therefore,
corroborate the main conclusions of the study. In particular, some instances lack
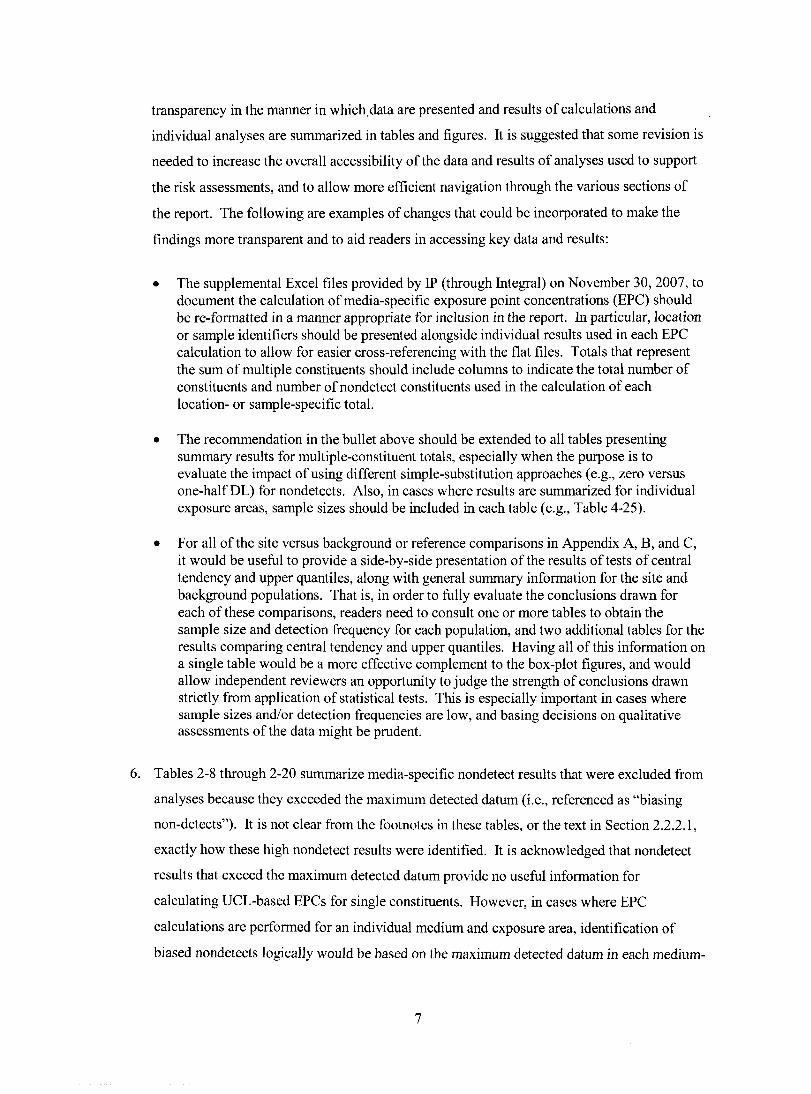
transparency in the manner in which data are presented and results of calculations and
individual analyses are summarized in tables and figures. It is suggested that some revision is
needed to increase the overall accessibility of the data and results of analyses used to support
the risk assessments, and to allow more efficient navigation through the various sections of
the report. The following are examples of changes that could be incorporated to make the
findings more transparent and to aid readers in accessing key data and results:
• The supplemental Excel files provided by IP (through Integral) on November 30, 2007, to document the calculation of media-specific exposure point concentrations (EPC) should be re-formatted in a manner appropriate for inclusion in the report. In particular, location or sample identifiers should be presented alongside individual results used in each EPC calculation to allow for easier cross-referencing with the flat files. Totals that represent the sum of multiple constituents should include columns to indicate the total number of constituents and number of nondetect constituents used in the calculation of each location- or sample-specific total.
• The recommendation in the bullet above should be extended to all tables presenting summary results for multiple-constituent totals, especially when the purpose is to evaluate the impact of using different simple-substitution approaches (e.g., zero versus one-half DL) for nondetects. Also, in cases where results are summarized for individual exposure areas, sample sizes should be included in each table (e.g.. Table 4-25).
• For all of the site versus background or reference comparisons in Appendix A, B, and C, it would be usefiil to provide a side-by-side presentation of the results of tests of central tendency and upper quantiles, along with general summary information for the site and background populations. That is, in order to fiilly evaluate the conclusions drawn for each of these comparisons, readers need to consult one or more tables to obtain the sample size and detection frequency for each population, and two additional tables for the results comparing central tendency and upper quantiles. Having all of this information on a single table would be a more effective complement to the box-plot figures, and would allow independent reviewers an opportunity to judge the strength of conclusions drawn strictly from application of statistical tests. This is especially important in cases where sample sizes and/or detection frequencies are low, and basing decisions on qualitative assessments of the data might be pmdent.
6. Tables 2-8 through 2-20 summarize media-specific nondetect results that were excluded from
analyses because they exceeded the maximum detected datum (i.e., referenced as "biasing
non-detects"). It is not clear from the footnotes in these tables, or the text in Section 2.2.2.1,
exactly how these high nondetect results were identified. It is acknowledged that nondetect
results that exceed the maximum detected datum provide no useful information for
calculating UCL-based EPCs for single constituents. However, in cases where EPC
calculations are performed for an individual medium and exposure area, identification of
biased nondetects logically would be based on the maximum detected datum in each medium-
specific exposure area. This appears to be what the authors have done, at least in selected
cases (e.g., Appendix A, page A-4, last paragraph and Appendix B, page B-4, third
paragraph). In these cases, please include a colunm in each table that summarizes excluded
non-detects, and to list the maximum detected datum in each exposure area that was used to
screen out biasing nondetects. A short statement should also be inserted in Section 2.2.2.1 of
the main text in order to more clearly explain exceptions to how biasing non-detects were
handled in different analyses.
Less straightforward are identification and removal of these high nondetects in cases where
multiple constituents are summed at individual locations to calculate a total. In this context,
individual constituents are no longer evaluated as a population of results (i.e., all media-
specific results are not being pooled to calculate an EPC for each constituent), so comparison
to the maximum media-specific detected concentration does not seem appropriate. In these
cases, it seems more appropriate to include all nondetect constituents in the calculation of
each total, using each of the simple-substitution options. It is not clear if biasing non-detects
were treated any differently for estimates of totals,please provide additional text to the main
report and appendices, where appropriate, to explain how nondetects were treated under this
scenario.
Again, please provide additional text and/or footnotes to clarify how biasing nondetects were
treated in both the single- and multiple-constituent cases described above.
7. The primary cumulative exposures considered in the risk assessment reflect potential
residential and recreational exposures by the same receptor. Additional cumulative
exposures, unique to or more likely to occur in a small community such as Cass Lake
(including the Leech Lake Indian Reservation), also occur and should be considered in the
risk assessment. EPA recently became aware that a public works employee (site worker)
lives near the site. It is not unreasonable that a similar individual may also perform
constmction/utility work at the site. Therefore, the risk assessment should be revised to
identify and discuss such additional cumulative exposures; evaluate potential cumulative
exposures, risks, and hazards (based on potential residential, recreational, site work, and site
construction/utility work); and discuss any potential uncertainties associated with estimating
such a cumulative exposure (for example, potential double-counting).
8. Several potential exposure pathways are only briefly identified and dismissed in the risk
assessment. Exposures, risks, and hazards are not quantified for these exposure pathways.
However, these exposure pathways (ingestion of aboveground produce and fish eggs) are
well known to the local community and, in the case of the ingestion of aboveground produce,
have been evaluated as part of other risk assessments in Minnesota and throughout Region 5.
The risk assessment discusses the potential for contamination of aboveground produce
through root uptake of chemicals. However, aboveground produce may also become
contaminated through the deposition of fugitive dusts. The risk assessment (including the
uncertainty analysis [Section 4.6]) should be revised to discuss the potential for aboveground
produce to become contaminated through deposition of fugitive dust and the potential for
receptors to become exposed to chemicals through ingestion of aboveground produce
contaminated in such a manner.
Also, the risk assessment briefly discusses the potential for exposure through ingestion of fish
eggs, and dismisses this exposure pathway because the contribution to total exposure via
ingestion offish eggs is very small as compared to the contribution assumed through
ingestion of fish tissue. However, the risk assessment does not discuss the fact that chemical
concentrations (particularly for lipophilic compounds) are often higher in fish eggs than in
fish tissue. The risk assessment (including the uncertainty analyses [Sections 4.6 and 5.5])
should be revised to discuss the impacts of not considering potential ingestion of fish eggs.
The discussion should consider not only the relative mass of fish eggs ingested as compared
to other fish tissue, but also the relative chemical concentrations in fish eggs as compared to
those other tissues, especially with regard to bolus dosing of fish eggs by residents during fish
spawning season.
9. It is recognized that the calculations involved in a HHRA of this magnitude are necessarily
complex. However, many of the Excel files and worksheets within the files were difficult to
navigate and hard for the user to follow. It would be helpful if the calculations and individual
Excel worksheets were more transparent for the user.
For example, with all 14 of the Risk Calculation spreadsheets open at one time, some of the
actual links are to files not included on the compact discs (CD), but located elsewhere. For
example, one link apparently is not to the actual Parameter_Risk.xls file that is grouped on
the CD. Instead, the spreadsheet references this same file as part ofa series of files under the
header "Sarah Scott." However, the calculations were determined mathematically correct
when the information presented in the "Parameter_Risk.xls" file on the CD was used in the
equations even though the "Parameter_Risk.xls" file wasn't directly referenced. Please limit
references to files on the CDs submitted with the HHRA.
10. The risk characterization discussion in Section 4.5 periodically refers to Appendix D4 as the
general location of receptor-, exposure pathway-, and chemical of potential concem (COPC)-
specific exposure, risks, and hazard results. However, Appendix D4 contains a large number
of tables (over 500 pages). Please include references to specific tables when calling out
particular results such as maximum hazards and risks. For example, in Section 4.5.1.1, the
text states "Future CTE and RME hazard indices for a child resident at the second highest
location (RES-8) with soil mixing are 0.4 and 0.8, respectively (Appendix D4). It is very
difficult to go to Appendix D4 as a whole and verify that (1) RES-8 is the second highest
location and (2) the identified CTE and RME hazard indices are correct. Section 4.5 should
be revised to include references to specific tables in Appendix D4 to support the
identification and discussion of particular risk and hazard results in the text.
11. The results of the ongoing non-aqueous phase liquid (NAPL) investigation could affect
conclusions about ecological risks at the site. Therefore, the text should (1) mention the
ongoing NAPL investigation, (2) indicate that the ecological risk assessment (ERA) did not
evaluate the groundwater-to-surface water pathway, (3) explain that conclusions about
ecological risk are independent of possible risks associated with NAPL releases to habitats at
the site, and (4) state that the ecological risk assessment may be updated after evaluation of
the results of the NAPL investigation.
12. A variety of editorial inconsistencies, omissions, and errors regarding referencing, acronyms,
and abbreviations throughout the text are suinmarized as follows:
• Referencing - incorrect references are cited in text (e.g., USEPA 2002e for National Functional Guidelines [pg 2-2] and USEPA 1992c for EPC guidance). Also, references cited in text are not listed in Section 6 (References) (e.g., Van Wijnen et al. 1990 [pg 4-60]). Finally, duplicate references are in Section 6 (e.g.. Sample and Arenal 1999; Wild and Jones 1992).
• Acronyms and abbreviations ~ acronyms and abbreviations used in the text are missing from the acronyms and abbreviations list (for example, NPDES [pp 1 -
10
12] and numerous others including many units of measure). Various acronyms and abbreviations in the text are not defined on first use (for example, 2,4-D, DDx, and TEQ). At least one acronym is defined in two different ways (RAL is defined as "response action level" in the acronym and abbreviation list and in the text [see page 3-9], but also as "removal action level" in the text [see page 1-10].
The entire risk assessment should be closely reviewed and revised as necessary to eliminate
editorial inconsistencies, omissions, and errors regarding referencing and acronyms and
abbreviations. The specific instances identified in the two bulleted items above are examples
only, and do not encompass all editorial inconsistencies, omissions, and errors that require
correction or clarification.
11
HUMAN HEALTH RISK ASSESSMENT SPECIFIC COMMENTS
1. Section 1.1. Pages 1-1 and 1-2. Section 1.1 presents a summary of the human health risk
assessment. This section states that there are no site-related noncancer risks to current
residents. As noted in Specific Comment 6, the interim remedial measures consisting of the
placement of clean topsoil at residences cannot be considered final and cannot be assumed to
provide long-term effectiveness without additional efforts to eliminate further transport of
contaminated site soils onto nearby residences and to continue maintenance of clean topsoil at
nearby residences. Therefore, Section 1.1 should be revised as specified in Specific
Comments 7 and 8, and to indicate that adverse noncarcinogenic risks may exist at specific
residences under current conditions.
Also, as stated in General Comment 1, the HHRA should be revised to incorporate risks and
hazards associated with ingestion offish into receptor-specific total risks and hazards.
Receptor-specific risks and hazards based on fish ingestion alone, and total risks and hazards
including fish ingestion results, exceed EPA's risk range (see the tribal receptor) and a hazard
index of 1 for both general population and tribal child receptors. Section 1.1 should be
revised to incorporate risks and hazards based on fish ingestion.
2. Section 1.4, Pages 1-4 through 1-6. Section 1.4 discusses the site setting and history. There
is no mention that the site, as currently defined, lies entirely within the Leech Lake Indian
Reservation. Section 1.4 and associated figures (for example, Figures 1-1 and 1-2) should be
revised to clearly state and show that the site lies within the Leech Lake Indian Reservation.
3. Section 1.4.1. Page 1-7. Paragraph 1 and Section 1.4.2. Page 1-7, Paragraph 5. The text
states that at both locations, sludge from the wood-treating operations was reportedly
transported "to a pit at the city dump and periodically bumed by the City." The only
reference for these statements is a personal communication with a former St. Regis Company
employee. No further documentation of direct involvement by the City of Cass Lake in the
buming of sludge from wood-treating operations is provided. The City of Cass Lake has
denied directing or participating in the buming of such sludge at the city dump. Both sections
should be revised to tmncate the statements at the phrase "periodically bumed," provide more
direct evidence of the City's involvement, or clarify that the City denies any direct
participation in the buming of wood-treatment sludge at the city dump.
12
4. Section 1.4.4. Pages 1-9 through 1-11. Section 1.4.4 discusses the site regulatory history.
Nowhere in the discussion is the Leech Lake Tribal Govemment mentioned, despite the
Band's important role in the Site's regulatory process. Section 1.4.4 should be revised to
summarize the Band's role in the Site's regulatory process.
5. Section 1.4.4. Page 1-11. Paragraph 1. This paragraph refers to a removal action on city
property. WTdle soil was removed from City property, clean fill was not placed over the
excavated area. The placement of clean fill over any excavated area will help to minimize
dust issues for neighboring residences. Therefore, Paragraph 1 should be revised to add the
following clause after the first sentence of Paragraph 1: "Soil was removed, but clean soil
was not placed on top of the excavation site."
6. Section 1.4.5. Page 1-14, Paragraph 1. In part, the text states "fieldwork was performed
from June to October 2004, with final restoration being completed in June 2005." It should
be stated that IP's planting of vegetation and grading to address the slope and mnoff issues
that had been created during the initial excavation is considered a final restoration only for
the purposes of the time-critical removal action ordered by U.S. EPA and does not preclude
additional remediation.
7. Section 1.4.5. Page 1-14. Paragraph 3. Section 1.4.5 discusses remedial action and removal
action history at the site. The indicated text addresses "interim remedial action to address
house dust." Elsewhere in the risk assessment, the presence of clean topsoil is considered in
calculating soil EPCs under current and fiiture scenarios. Clean topsoil is likely to become
recontaminated via wind-blown dust and mnoff onto nearby residences. The potential for
recontamination is higher for residences located immediately across from areas of
contaminated, on-site soils. Moreover, the summary does not discuss the basis for the interim
remedial action to address house dust.
Therefore, the text should be revised to clearly explain that (1) the measures described are
interim, and uncertainty exists regarding the nature and effectiveness of future remedial
actions until such measures are identified, evaluated, and implemented (including ongoing
maintenance as needed); (2) the clean topsoil placed at residences as part of interim measures
is likely to become recontaminated by release and transport of contaminated on-site soils via
13
fiigitive dust and mnoff unless steps are taken to eliminate these release and transport
mechanisms; and (3) to the extent that clean topsoil is recontaminated, estimated current and
future EPCs will be underestimated.
Finally, the summary should also be revised to note that the decision to address house dust
was based primarily on the presence of contamination (in particular dioxins/furans) in house
dust at concentrations that exceeded risk-based benchmarks for settled dust developed for the
World Trade Center Indoor Environment Assessment (EPA 2003).
8. Section 1.6. Page 1-17. Paragraph 2. Section 1.6 defines the division of the site into
Areas A and B. The text refers to Figure 1-6 with regard to the definition of these two areas.
It should be noted that Figure 1 -6 does not accurately display the fact that "for the purpose of
evaluating chemical concentrations in fish tissue, fish samples collected from wider areas of
Cass Lake and Pike Bay are also included in the Area B evaluation." Figure 1-6 should be
revised to more clearly display the inclusion of Cass Lake and Pike Bay in Area B.
9. Section 1.8. Page 1-19. Footnote 4. Footnote 4 states that higher than background level
concentrations of copper and zinc in the city dump area "are attributed to sources other than
releases from former operations at the St. Regis Paper Company facility." Based on the
evidence provided in the risk assessment, the St. Regis Paper Company site cannot be mled
out as a source of these concentrations. The sludge ponds for wood treatment sludge waste
were at the city dump site, and St. Regis employees may also have had to go across parts of
the city dump to get to these ponds with additions of sludge. Either of these factors may have
led to hot spots that can, at least in part, be attributed to the St. Regis Paper Company facility,
particularly in light of (1) the fact that only visibly contaminated soil and sludge was removed
as part of the initial response action and (2) the soil mixing performed at the time. It is not
reasonable at this time to mle out the St. Regis Paper company facility operations as a source
of these concentrations of copper and zinc in the city dump area. The sentence before the text
accompanying this footnote admits that copper was a constituent of the soluble metal salt
ACA, and that this was used at the St. Regis site. Therefore, footnote 4 should be rewritten to
remove the second sentence and/or to indicate that St. Regis may be a source of these
concentrations.
14
10. Section 2.1. Page 2-2. Paragraph 3. Section 2.1 presents data evaluation and selection
criteria considered in the risk assessment. The text indicates that all analytical data collected
by IP and considered in the risk assessment were validated in accordance with EPA
guidelines. However, neither of the cited references appears to be correct. The text should be
revised to cite the correct references.
11. Section 2.2.2. Page 2-4, Footnote 5. Section 2.2.2 discusses nondetected analytical results.
Footnote 5 discusses procedures for calculating EPCs; the cited reference is for EPA's
Hazard Ranking System (HRS) and is incorrect in the context in which it is used. The
footnote should be revised to cite the correct reference.
12. Section 2.2.2. Page 2-5. Paragraph 0. This paragraph states "For analyses of correlations
between or among multiple variables, altemative statistical methods that are robust to
censored data were applied where they were available." Use of these methods is discussed in
Appendix E. In order to make the use of these statistically robust methods more transparent
to the reader. Section 2.2.2 should be revised to include a reference to Appendix E.
13. Section 2.2.2.1. Page 2-5, Paragraph 1. Section 2.2.2.1 discusses biasing nondetected
results. The text states "For analytes detected at least once in a given medium, nondetected
results that exceeded the highest detected concentration were excluded from the final risk
assessment data set, because their inclusion would have introduced bias into the calculation
of EPCs." However, in the cases of dioxin/furan (df) and dioxin-like PCB (p) congeners,
"excluded" congener-specific analytical results were considered in calculating sample-
specific TEQ results. For example, TEQDF-WH098 (ND = Vi DL; mammalian TEFs)
results for samples CL-WH-10 [RA Fish Site Flat.xls] and BCL-S-2 [Fish Background
Flat.xls] could be replicated only when "excluded" 2,3,7,8-TCDD results were included in
the TEQ calculations. Similariy, the TEQP-WH098 (ND = Vi DL; mammalian TEFs) result
for sample PB-W-20 [HH Fish Site.xls] could be replicated only when the "excluded" PCB
169 result was included in the TEQ calculations. Section 2.2.2.1 should be expanded and
revised as necessary to clearly and completely explain the identification and treatment of
"excluded" analytical results. Analytical results used in risk assessment calculations
(including exposure and background calculations) should not be identified as "excluded"
results.
15
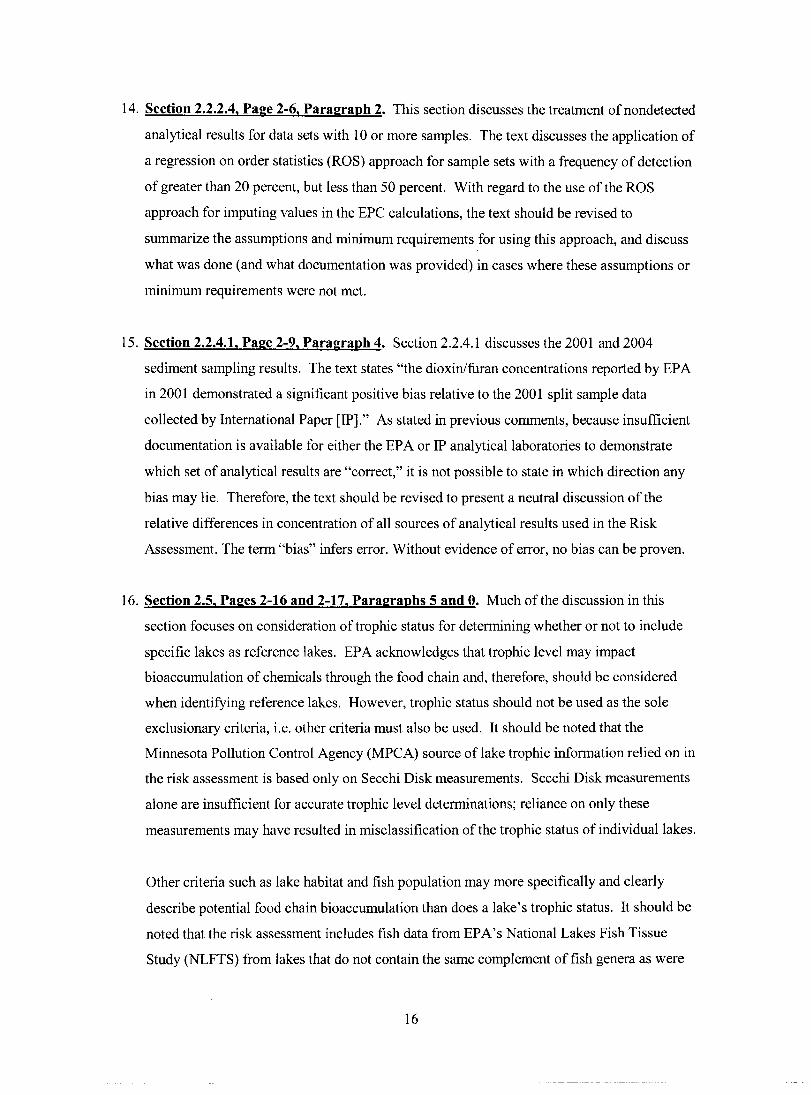
14. Section 2.2.2.4. Page 2-6. Paragraph 2. This section discusses the treatment of nondetected
analytical results for data sets with 10 or more samples. The text discusses the application of
a regression on order statistics (ROS) approach for sample sets with a frequency of detection
of greater than 20 percent, but less than 50 percent. With regard to the use of the ROS
approach for imputing values in the EPC calculations, the text should be revised to
summarize the assumptions and minimum requirements for using this approach, and discuss
what was done (and what documentation was provided) in cases where these assumptions or
ininimum requirements were not met.
15. Section 2.2.4.1. Page 2-9. Paragraph 4. Section 2.2.4.1 discusses the 2001 and 2004
sediment sampling results. The text states "the dioxin/fliran concentrations reported by EPA
in 2001 demonstrated a significant posifive bias relative to the 2001 split sample data
collected by Intemational Paper [IP]." As stated in previous comments, because insufficient
documentation is available for either the EPA or IP analytical laboratories to demonstrate
which set of analytical results are "correct," it is not possible to state in which direction any
bias may lie. Therefore, the text should be revised to present a neutral discussion of the
relative differences in concentration of all sources of analytical results used in the Risk
Assessment. The term "bias" infers error. Without evidence of error, no bias can be proven.
16. Section 2.5. Pages 2-16 and 2-17. Paragraphs 5 and 0. Much of the discussion in this
section focuses on consideration of trophic status for determining whether or not to include
specific lakes as reference lakes. EPA acknowledges that trophic level may impact
bioaccumulation of chemicals through the food chain and, therefore, should be considered
when identifying reference lakes. However, trophic status should not be used as the sole
exclusionary criteria, i.e. other criteria must also be used. It should be noted that the
Minnesota Pollution Control Agency (MPCA) source of lake trophic information relied on in
the risk assessment is based only on Secchi Disk measurements. Secchi Disk measurements
alone are insufficient for accurate trophic level determinations; reliance on only these
measurements may have resulted in misclassification of the trophic status of individual lakes.
Other criteria such as lake habitat and fish population may more specifically and clearly
describe potential food chain bioaccumulation than does a lake's trophic status. It should be
noted that the risk assessment includes fish data from EPA's National Lakes Fish Tissue
Study (NLFTS) from lakes that do not contain the same complement offish genera as were
16
sampled from potential Site-impacted lakes. For example, no whitefish or tulibee were
sampled, and may not exist, in the NLFTS lakes chosen for inclusion as background
reference lakes. NLFTS lakes that do not contain habitat conducive to naturally reproducing
tulibee and whitefish populations may have bioaccumulation factors that differ from Site
lakes.
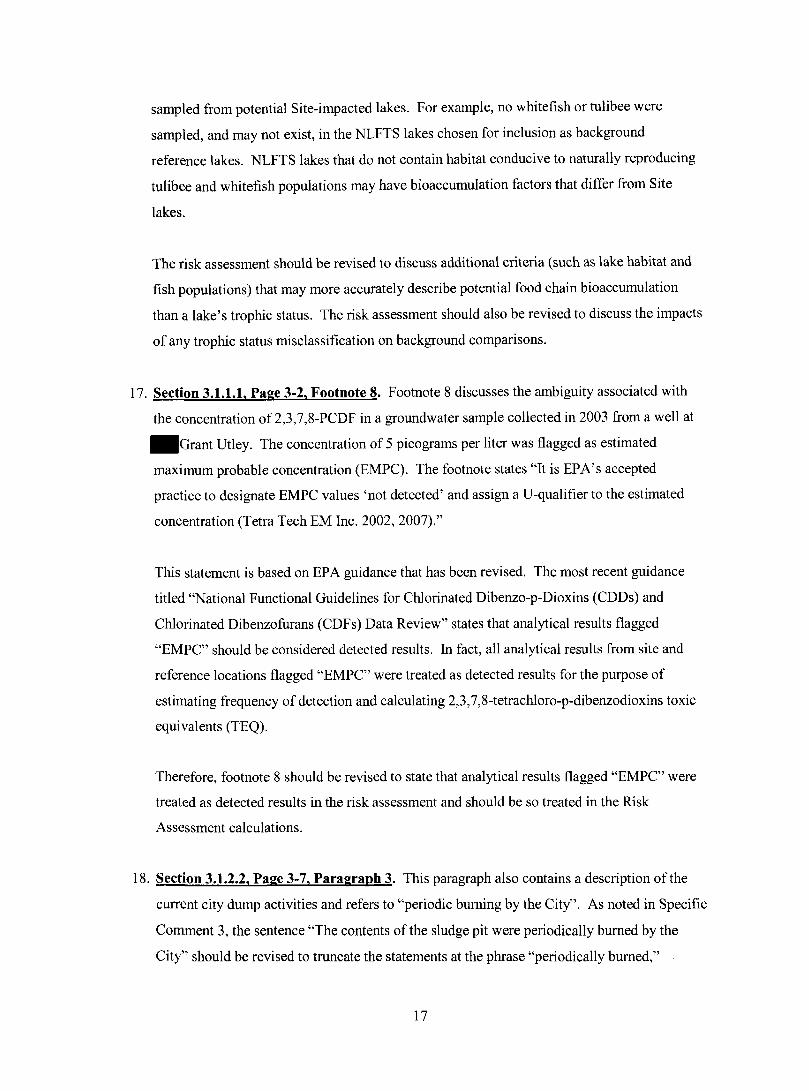
The risk assessment should be revised to discuss additional criteria (such as lake habitat and
fish populations) that may more accurately describe potential food chain bioaccumulation
than a lake's trophic status. The risk assessment should also be revised to discuss the impacts
of any trophic status misclassification on background comparisons.
17. Section 3.1.1.1. Page 3-2, Footnote 8. Footnote 8 discusses the ambiguity associated with
the concentration of 2,3,7,8-PCDF in a groundwater sample collected in 2003 from a well at
Grant Utley. The concentration of 5 picograms per liter was flagged as estimated
maximum probable concentration (EMPC). The footnote states "It is EPA's accepted
practice to designate EMPC values 'not detected' and assign a U-qualifier to the estimated
concentration (Tetra Tech EM hic. 2002, 2007)."
This statement is based on EPA guidance that has been revised. The most recent guidance
titled "National Functional Guidelines for Chlorinated Dibenzo-p-Dioxins (CDDs) and
Chlorinated Dibenzofiirans (CDFs) Data Review" states that analytical results flagged
"EMPC" should be considered detected results. In fact, all analytical results from site and
reference locations flagged "EMPC" were treated as detected results for the purpose of
estimating frequency of detection and calculating 2,3,7,8-tetrachloro-p-dibenzodioxins toxic
equivalents (TEQ).
Therefore, footnote 8 should be revised to state that analytical results flagged "EMPC" were
treated as detected results in the risk assessment and should be so treated in the Risk
Assessment calculations.
18. Section 3.1.2.2. Page 3-7. Paragraph 3. This paragraph also contains a description of the
current city dump activities and refers to "periodic buming by the City". As noted in Specific
Comment 3, the sentence "The contents of the sludge pit were periodically bumed by the
City" should be revised to tmncate the statements at the phrase "periodically bumed,"
17
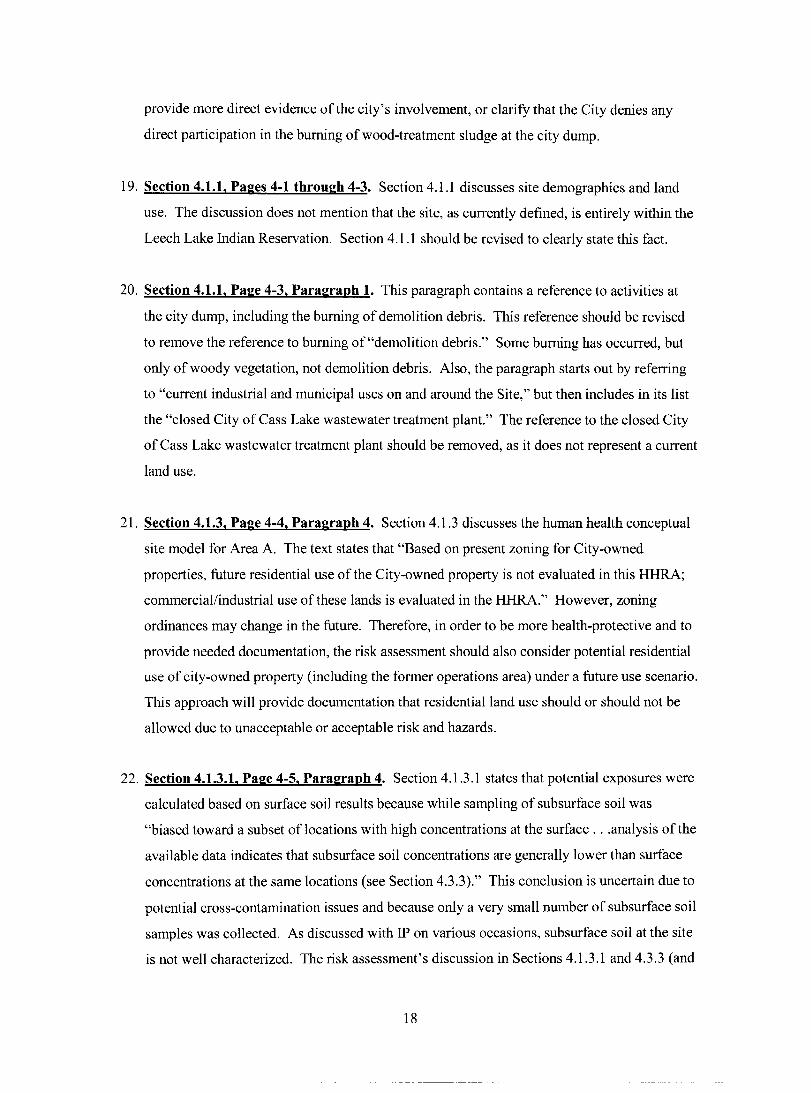
provide more direct evidence of the city's involvement, or clarify that the City denies any
direct participation in the buming of wood-treatment sludge at the city dump.
19. Section 4.1.1. Pages 4-1 through 4-3. Secfion 4.1.1 discusses site demographics and land
use. The discussion does not mention that the site, as currently defined, is entirely within the
Leech Lake Indian Reservation. Section 4.1.1 should be revised to clearly state this fact.
20. Section 4.1.1. Page 4-3. Paragraph 1. This paragraph contains a reference to activities at
the city dump, including the buming of demolition debris. This reference should be revised
to remove the reference to buming of "demolition debris." Some buming has occurred, but
only of woody vegetation, not demolition debris. Also, the paragraph starts out by referring
to "current industrial and municipal uses on and around the Site," but then includes in its list
the "closed City of Cass Lake wastewater treatment plant." The reference to the closed City
of Cass Lake wastewater treatment plant should be removed, as it does not represent a current
land use.
21. Section 4.1.3. Page 4-4. Paragraph 4. Section 4.1.3 discusses the human health conceptual
site model for Area A. The text states that "Based on present zoning for City-owned
properties, fiiture residential use of the City-owned property is not evaluated in this HHRA;
commercial/industrial use of these lands is evaluated in the HHRA." However, zoning
ordinances may change in the fiiture. Therefore, in order to be more health-protective and to
provide needed documentation, the risk assessment should also consider potential residential
use of city-owned property (including the former operations area) under a fiiture use scenario.
Tliis approach will provide documentation that residential land use should or should not be
allowed due to unacceptable or acceptable risk and hazards.
22. Section 4.1.3.1. Page 4-5. Paragraph 4. Section 4.1.3.1 states that potential exposures were
calculated based on surface soil results because while sampling of subsurface soil was
"biased toward a subset of locations with high concentrations at the surface . . .analysis of the
available data indicates that subsurface soil concentrations are generally lower than surface
concentrations at the same locations (see Section 4.3.3)." This conclusion is uncertain due to
potential cross-contamination issues and because only a very small number of subsurface soil
samples was collected. As discussed with IP on various occasions, subsurface soil at the site
is not well characterized. The risk assessment's discussion in Sections 4.1.3.1 and 4.3.3 (and
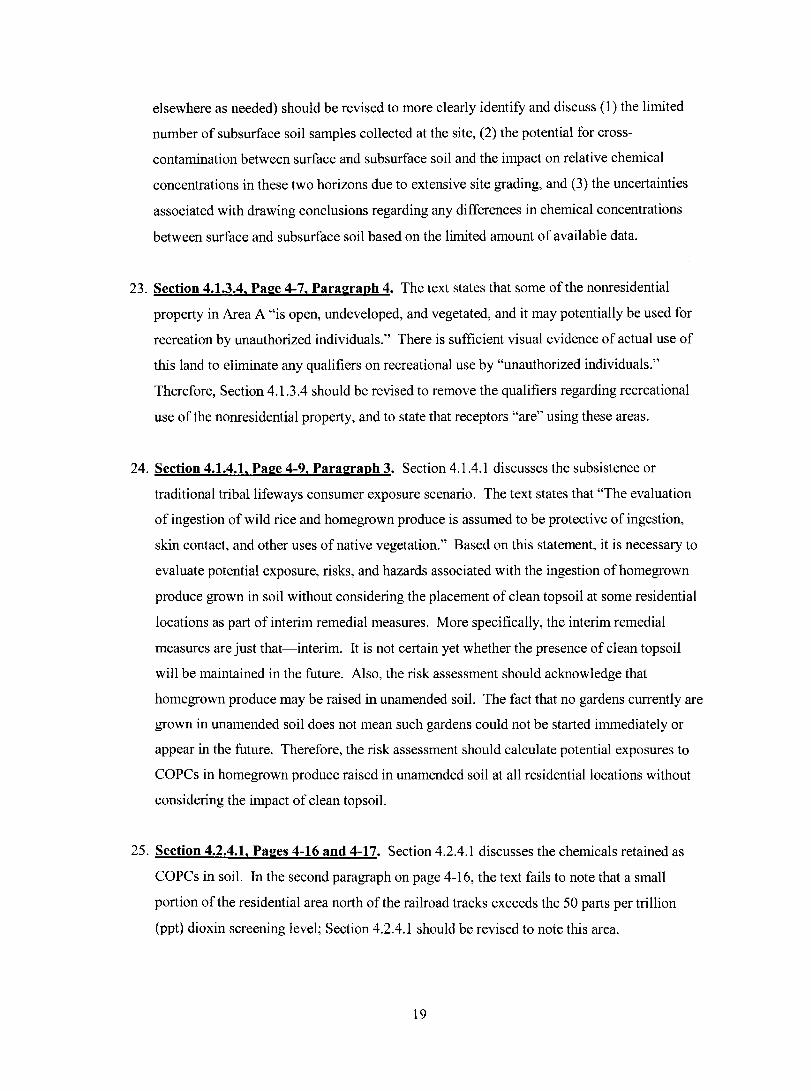
elsewhere as needed) should be revised to more clearly identify and discuss (1) the limited
number of subsurface soil samples collected at the site, (2) the potential for cross-
contamination between surface and subsurface soil and the impact on relative chemical
concentrations in these two horizons due to extensive site grading, and (3) the uncertainties
associated with drawing conclusions regarding any differences in chemical concentrations
between surface and subsurface soil based on the limited amount of available data.
23. Section 4.1.3.4. Page 4-7. Paragraph 4. The text states that some of the nonresidential
property in Area A "is open, undeveloped, and vegetated, and it may potentially be used for
recreation by unauthorized individuals." There is sufficient visual evidence of actual use of
this land to eliminate any qualifiers on recreational use by "unauthorized individuals."
Therefore, Section 4.1.3.4 should be revised to remove the qualifiers regarding recreational
use of the nonresidential property, and to state that receptors "are" using these areas.
24. Section 4.1.4.1. Page 4-9. Paragraph 3. Section 4.1.4.1 discusses the subsistence or
traditional tribal lifeways consumer exposure scenario. The text states that "The evaluation
of ingestion of wild rice and homegrown produce is assumed to be protective of ingestion,
skin contact, and other uses of native vegetation." Based on this statement, it is necessary to
evaluate potential exposure, risks, and hazards associated with the ingestion of homegrown
produce grown in soil without considering the placement of clean topsoil at some residential
locations as part of interim remedial measures. More specifically, the interim remedial
measures are just that—interim. It is not certain yet whether the presence of clean topsoil
will be maintained in the future. Also, the risk assessment should acknowledge that
homegrown produce may be raised in unamended soil. The fact that no gardens currently are
grown in unamended soil does not mean such gardens could not be started immediately or
appear in the future. Therefore, the risk assessment should calculate potential exposures to
COPCs in homegrown produce raised in unamended soil at all residential locations without
considering the impact of clean topsoil.
25. Section 4.2.4.1. Pages 4-16 and 4-17. Section 4.2.4.1 discusses the chemicals retained as
COPCs in soil. In the second paragraph on page 4-16, the text fails to note that a small
portion of the residential area north of the railroad tracks exceeds the 50 parts per trillion
(ppt) dioxin screening level; Section 4.2.4.1 should be revised to note this area.
19
26. Section 4.2.4.1. Page 4-17. Paragraph 2. Section 4.2.4.1 discusses the chemicals retained as
COPCs in soil. The text states that arsenic was not retained as a soil COPC based on
(1) statistical comparison to reference area results and (2) "the USEPA (1992c) criteria for
establishing an observed release." EPA's HRS "observed release" guidelines are not typically
considered in selecting medium-specific COPCs (EPA 1989) and were not a part of the draft
HHRA. Therefore, use of EPA's "observed release" guidelines (as part of EPA's HRS
guidance) likely is inappropriate for use in the Risk Assessment. Section 4.2.4.1 should be
revised to (1) fully explain and justify consideration of EPA's HRS "observed release"
guidelines in the selection of soil COPCs or (2) drop the consideration of the "observed
release" guidelines in the selection of soil COPCs.
27. Section 4.2.4.3. Page 4-19. Paragraph 1. Section 4.2.4.3 discusses the identification of
COPCs in surface water. The text states that iron is an essential nutrient. However, in a
previous section (4.2.2), iron is not identified as an essential nutrient. Sections 4.2.2 and
4.2.4.3 should be revised as necessary to eliminate this contradiction.
28. Section 4.2.4.4. Pages 4-19 and 4-20. This section notes that dioxins/fiirans and other
chemicals detected in a single 1988 sampling event may be associated with "the presence of
free product." W^ile this may be the case, the risk assessment should discuss (1) the
potential for exposure to chemicals (including dioxins/ftirans) in free product (or NAPL) and
light nonaqueous-phase liquid [LNAPL]) and (2) the potential for underestimating total utility
worker exposures to the extent that potential exposure to chemicals in NAPL or LNAPL is
not evaluated in the risk assessment.
29. Section 4.3.1.1, Page 4-23. Paragraph 3. This paragraph states "While inhalation of and
skin contact with house dust are complete exposure pathways, they are considered minor
relative to ingestion of house dust and exposure to soil, so they are not evaluated
quantitatively in this HHRA". However, the dermal soil pathway is evaluated only for a
fraction of the amount of time during which indoor exposure occurs. Also, dermal contact
with dust on indoor surfaces was considered as part of setting health-based benchmarks in the
World Trade Center assessment (EPA 2003). Without consideration of potential exposure
through dermal contact with house dust, total residential exposures may have been
underestimated. Therefore, the risk assessment should be revised to (1) provide adequate
information to support the assumption that dermal exposure to house dust is a "minor"
20
exposure pathway or (2) discuss and evaluate the extent to which total residential exposures
are underestimated by not quantifying potential exposure through dermal contact with house
dust.
30. Section 4.2.3.1. Page 4-29. Paragraph 1. The text states "all [BaPE] data are consistent
with reported BaP concentrations ranging from nondetected to 0.02 mg/kg (wet or dry weight
not specified in original source) in vegetables (ATSDR 1995b)." If wet or dry weight is not
specified, the range of BaP concentrations to which site-specific data are compared is not
useftal and should be removed from the risk assessment.
31. Section 4.3.3.2. Page 4-36. Paragraph 2. The text references "Barr (2006, Table 3)" as the
source for PAH concentrations in three samples of topsoil. However, the Barr (2006)
reference is a groundwater monitoring report. This apparent inconsistency should be
resolved.
32. Section 4.3.3.2, Page 4-37, Paragraph 4. The text states "Data for multiple species were
combined into one data set because there were no significant differences in concentrations of
COPCs among species." No statistical evaluation of species differences was found in the risk
assessment, including Appendix C. It is well established that contaminant concentrations can
vary between species, especially for chemicals like dioxins/furans that accumulate in fatty
deposits. Data presented in Appendix C (including Table C-1) appear to indicate the
possibility that TEQs may vary among species in site and reference lakes.
Section 4.3.3.2 (and other relevant portions of the risk assessment, including Appendix C)
should be revised to more precisely report the extent and type of any evaluation (statistical or
otherwise) conducted to evaluate differences in chemical concentrations among species. Any
statements either for or against any differences between species must be supported by
appropriate, well documented analyses. Also, if it is determined that significant differences
in chemical concentrations exist between fish species, the risk assessment should be revised
to discuss the direction and magnitude of uncertainty introduced in receptor-specific
exposures, risks, and hazards by combining all fish data into a single data set.
33. Section 4.3.3.2. Page 4-40. Paragraph 2. Section 4.3.3.2 discusses statistical methods used
to calculate medium-specific EPCs. The text states "EPCs for each medium in each exposure
21
unit and descriptive statistics are presented in Appendix D-2. The data points included in the
EPC calculations are also shown in Appendix D-2." Several elements of this statement are
incorrect and should be corrected, as discussed below.
Appendix D2 does present medium-specific EPCs. However, the results are presented
without any documentation. Specifically, contrary to the statement in the text, Appendix D-2
does not present (1) descriptive statistics or (2) the data points used in the EPC calculations.
Without this information, it is not possible to verify the medium-specific EPCs presented in
Appendix D-2 and used in the exposure calculations. Appendix D-2 should be revised to
include descriptive statistics and the data points used for each medium-specific EPC
calculation. Because EPA's ProUCL software was used to calculate many (if not the
majority) of the medium-specific EPCs, Appendix A-2 should also be revised to include the
outputs from each ProUCL calculation. (Note: the requested information was provided to
EPA as part of an electronic mail message from Bill Locke of Integral to Eric Morton of
Tetra Tech, dated November 30, 2007. Based on review of the information provided, EPA
feels that this information, along with additional documentation, is required to increase the
transparency and verifiability of the EPC calculations as discussed in General Comment 4).
34. Section 4.3.3.3. Page 4-44. Paragraph 2. This paragraph states that a trench depth of 4 and
6 feet below ground surface (bgs) was assumed for Areas A and B, respectively, based on
depth to groundwater. Given the depth of frost in northem Minnesota, many utilities are
buried 6 feet deep. Presumably, pumping could be performed to allow excavation below the
water table. Section 4.3.3.3 and other relevant portions of the risk assessment should be
revised to evaluate the impact on trench modeling results if the trench depth in both Areas A
and B is increased to 6 feet or more (a trench would likely need to be excavated deeper than 6
feet to repair a utility installed at a depth of 6 feet). For example, a lower air changes (ACH)
value would be appropriate if worker's heads would not extend out of the trench.
35. Section 4.3.4.2, Page 4-53. Paragraph 4. This paragraph presents the assumption that
exposure to outdoor soil occurs only during "the seven warmer months when snow is not
covering the ground." This assumption is valid only if there is snow cover, however. Over
the past four years, snow cover in the site area has not been complete during the assumed
five-month period. Therefore, the risk assessment should be revised to indicate that this
22
assumption may lead to an underestimation of potential exposure to outdoor soil to the extent
that snow cover is absent during the assumed five-month period.
36. Section 4.3.5.2. Pages 4-63 through 4-65. This paragraph discusses the use of a relative
bioavailability (RBA) factor in exposure estimates related to exposure to soil and house dust.
The same RBA factors were used for both soil and house dust. However, the smaller dust
particle size and increased digestible organic content found in dust may result in an increased
bioavailability. Section 4.3.5.2 and the uncertainty analysis (Section 4.6) should be revised to
discuss the uncertainty introduced by assuming the same RBA factors for both soil and house
dust.
37. Section 4.3.5.2. Page 4-65. Paragraph 1. The text indicates a RBA value of 0.9 was used
for pentachlorophenol (PCP). However, Table 4-11 indicates that a value of 1 was used.
This discrepancy should be resolved.
38. Section 4.3.6.3. Page 4-74. Paragraph 1. The text states "It is unlikely that loadings of Fox
Creek and channel area sediments on skin would reach the monolayer coverage required to
attain the adherence factors found in the Shaof et.al. studies." No explanation or
documentation is provided for this statement. Section 4.3.6.3 should be revised to include
adequate explanation and documentation to support the statement regarding reaching
monolayer coverage.
39. Section 4.3.8.2. Page 4-87. Paragraph 4. The risk assessment narrowly defines the utility
worker, limiting possible groundwater exposure to utility/constmction workers excavating
trenches. However, the groundwater is very shallow at the site, especially at the former
operational area where high levels of contamination are present. There could be potential
exposure to workers engaged with any type of constmction that involves grading or
disturbing soil in this area. Also, any type of general constmction work in this area might
require groundwater dewatering because of the shallow water table, which is about 5 feet bgs.
Therefore, the risk assessment should be revised to indicate that potential exposure to
groundwater may not be limited to only utility/constmction workers digging trenches, and
that any type of general constmction work at the site may require dewatering because of the
shallow groundwater table.
23
40. Sections 4.4.1.3 and 4.4.2, Pages 4-105 through 4-120. These secfions discuss the toxicity
assessment of mixtures and present a dose response assessment for mixtures of dioxins,
furans, and dioxin-like coplanar PCBs. Section 4.4.2 presents citations that are extremely
selective and, in many instances, lack references. In particular, use actual references rather
than referencing communications with Tim Drexler of EPA. Also, when stating that "EPA's
cancer-based approach ., .is counter to the risk assessment approach conducted by several
other health agencies..." state what your references are and what agencies you are discussing.
This section must be rewritten to include references for cited information and must present a
more balanced discussion that incorporates and evaluates the following additional
information.
• Toxicity assessment of mixtures - EPA has its own guidance. One important thing to understand about mixtures is that interactions are usually a high dose phenomenon.
• For mixtures of PCDDs/Fs/Bs - the reader should immediately be referred to the WnO results. These are NOT drafts. The fiill publications from the 1993, 1997, and 2005 meetings are all published (Ahlborg, 1994; Vandenberg, 1998, 2006) and are used internationally. These were essentially updates from the original 1987 and 1989 EPA TEFs for PCCDs/Fs and the 1988 NATO values. For inclusion in the TEQ approach, compounds must be stmcturally related, have a common mechanism of action, cause a common spectmm of responses, and be biologically persistent. Persistence is a KEY requirement.
• This document focuses ONLY on the negative comments made in the SAB and NAS reviews, which overall were extremely complimentary and positive. In fact, the 2000 SAB stressed that they did NOT need to see a revised document and wanted EPA to just "get it out". The NAS also asked for some clarification and transparency, but said that the document should also be rapidly finalized and released, with several of the issues they raised really research projects.
• While cancer is often the focus of the discussion of dioxins, there has been growing concem for the non-cancer effects. If the EPA's analyses are correct, and the upper bound for cancer could result in 1/1000 excess risk, this would not be seen in the general population where 1/3 get cancer anyway. The effects can only be seen in large population-based studies. The entire issue of dioxin being a "known human carcinogen" was extensively debated at the 1997 lARC meeting as well as by DHHS - all concluding that dioxin is a known human carcinogen. The general consensus in the scientific community is that dioxin is a human carcinogen - where most of the discussion centers is the dose issue. lAR fully discussed the issue of increase in all cancers and concluded that while unusual, it was possible for dioxin, because of its ability to promote tumors in multiple tissues. There is also evidence for respiratory-tract cancers and breast cancer in humans, among other sites. Some of the data from Seveso, where peak dioxin concentrations were measured - not extrapolated - support the human carcinogenicity.
24
•
While the traditional approach for non-cancer risk assessment assumes a threshold, the extensive modeling done in the dioxin reassessment (see Chapter 8 of the dioxin reassessment) clearly showed that while many responses were best fit by a non-linear model, a nearly equivalent number were best fit by a linear model. These results are also part of the 1998 WTIO assessment of the TDI for dioxins.
EPA made a policy decision not to develop an RfD for dioxin. The SAB asked EPA to do so both in 1994 and 2000. EPA preferred to use a MOE approach.
The underlying data for both cancer and non-cancer risk assessments used by many intemational organizations were all based on the 1998 WHO analysis. The same data were used by EPA in the document reviewed by the SAB in 2000. It is important to remember that the NAS did NOT review the entire dioxin reassessment, but only the executive summary, with some attention to the dose/response modeling chapter (8) and the TEF chapter (9). The vast amount of supporting information was in all of the background chapters. In fact, in the dose-response modeling chapter, the results for both linear and non-linear models for both cancer and non-cancer responses were given. In fact, essentially all of the animal cancer responses were modeled. One reason that the Kociba data was carried forward into the executive summary and the linear model used was that the CSF from this model was almost identical to that determined from several human occupational cohorts. And the fact that a linear model best fit the human data was published by Kenny Cmmp in 2003, as well as work by Kyle Steenland.
The TDI established by WHO in 1998 was 1-4 pg TEQ/kg/d. This was a tolerable - not a "safe" - level. The group did NOT want to declare much of the world's food supply at the time "contaminated."
There are multiple problems with the ATSDR MRLs for dioxin. They did NOT account for pharmacokinetic differences between animals and humans. If they had done so, their MRL would be 10 to 100-fold lower.
The "history" is selective. For example, the charge to the NAS was quoted selectively (as are the recommendations). The 1984 dioxin risk assessment CSF is still used throughout EPA. In addition, the comments of the SAB and NAS are selectively cited.
The pharmacokinetic issues are not as simple as stated. There is growing consensus that the elimination of dioxins is dependent upon dose and body composition: at high doses, elimination is more rapid; at low doses, body fat content increases the half-life. This has been elegantly described, with the consequences, by the PBPK modeling work of Emond et al (2005, 2006). Aylward has used a classical modeling approach and come to similar conclusions (note: citing Aylward, 1996 is NOT the right citation - her work is in 2005 and 2006). EPA would agree that we may be underestimating the peak exposure concentration by simple back extrapolation. But we do not know if the key issue, especially for cancer, is peak or lifetime exposure.
Both the 2000 SAB and the 2006 NAS panel members were split on some of the conclusions. All members wanted more transparency and clarity.
Smoking was accounted for in most of the cancer studies. For many of the occupational studies, the exposure was predominately to TCDD. For those in which there was
25
•
•
•
substantial TEQ< that was modeled too. There is more data today, supporting the carcinogenicity of dioxins, from Seveso and from the Vietnam experience - Ranch Hand, Korean, and New Zealand vet studies.
In environmental epidemiology, small increases in relative risk or odds ratio is the best that can be expected. Also, the NRC's criticism that EPA should have modeled all of the animal tumor data indicates that they missed what was done in chapter 8.
We know of no credible scientists who do not believe that the mechanism of actions involves persistent activation of the Ah receptor. This is no different than the acceptance of the mechanism of action of estrogens involving activation of the estrogen receptor. It is the necessary step to initiate the process. The AhR has been shown to function siinilarly throughout the vertebrates. Dioxin causes multiple effects in multiple species at multiple developmental stages in both sexes. A given species can be an outlier for a given response - but we have no evidence that any species studied is an outlier for everything. Even the "resistant to die" adult hamster readily succombs to developmental toxicity. The issue of sublinear responses at low doses is also not tme when dealing with additivity to background issues. The AhR is a key regulatory protein; dioxin interferes with essential pathways. There is a growing body of evidence that the AhR is a tumor suppressor - dioxin treatment thus allows tumors to be expressed. The data coming from studies with both constitutively expressed AhR mice (paralleling dioxin treatment) and AliR-knockout mice is extremely infonnative.
Tumor promotion is often thought to be reversible - up to a point. The reversibility of dioxin tumors was examined in a stop-study conducted by the NTP (work by Nigel Walker and others). They found that when they stopped dosing, some of the tumors regressed but others grew even bigger. Bottom line - the animals still had malignant tumors.
The liver tumors in the Kociba study were NOT all associated with hepatotoxicity. In several cases, there were tumors in animals with no liver toxicity at all.
This document cites criticisms of EPA's 2000 SAB version when it suits the author, even though some of these issues were addressed in the revised 2003 draft. For example, modeling of the human cancer epi data was included in the 2003 version - and matched the Kociba liver tumor models. Citing repeatedly the Pohl, 2002 criticisms is inappropriate.
Despite the NAS comments, in the 2003 draft, EPA did use both linear and non-linear models for cancer and non-cancer. They are all in chapter 8.
A misunderstanding (?) of linearity is that it has to go through "zero". That is not what linear means. If there is a background level of response, which there is for most biological processes, extrapolation should NOT go through zero.
The wide range in ED levels is a function of differentially susceptibility for different responses. That is NOT an uncertainty, but a biological reality.
The discussion of TEFs is poor. There is intemafional consensus to use the "new" 2005 WHO TEFs. The re-evaluation was planned by WTIO from its 1997 meeting, it was
26
NOT driven by issues with the data base. Improvements in the quality of the data base were always wanted. In fact, the TEF values are only slightly different from the 1997 TEF values: in part the changes were driven by the decision to go to a logarithmic scale (1, .3, .1, .03....) from the ordinal scale (1, .5, .1, .05...). Other changes were based on new data. It is a mistake to over-value the new excellent NTP data - it is still one study in one sex of one strain of one species. In general, however, for the congeners examined, the NTP comparative potency values are very close to the WHO TEFs. Among issues stressed by the 2005 WHO committee was that the TEFs are based on intake - not intemal doses; and certainly not soil/sediment/air values for which an approach using fate and transport modeling should be developed in the fiiture. Also, the group pointed out the need for development of TEFs for other classes of compounds which meet the criteria of the TEQ approach - especially the brominated dioxins and fiirans.
• The issue of non-additive effects when dealing with the TEFs is incorrect. There is NO evidence for anything other than additivity when dealing with the 29 dioxin-like PCDDs/Fs/Bs. The non-additivity can occur in the presence of NON-dioxinlike compounds, such as some of the PCBs. But such interactions can be either synergistic or antagonistic, depending on the dose and the response. In fact, at low doses, there is little evidence for anything other than simple additivity.
• A limited number of the 29 congeners which have TEF values drive the total TEQ in people: TCDD, 1,2,3,7,8-PeCDD; 2,3,4,7,8-PeCDF, and PCB 126 account for over 70 percent or more of the TEQ in people. There is extensive experimental data to derive TEFs for these congeners.
• The WnO committee, as well as the SAB and the NAS, all concluded that while the TEFs are not perfect, they are a reasonable approach and work. The revisions of the TEF values result in a 10 to 25 percent decrease in the total TEQ in several data sets - depends on the "Matrix" and the exposure sources.
41. Sections 4.5.1.1 and 4.5.1.3. Sections 4.5.1.1 and 4.5.1.3 discuss noncancer health hazards
for Areas A and B, respectively. The text discusses hazards that exceed 1. However, the
COPCs driving hazards greater than or equal to 1 are not identified. Sections 4.5.1.1 and
4.5.1.3 should be revised to identify hazard drivers.
42. Section 4.5.1.2. Page 4-130. Paragraph 2. The results presented in this paragraph are very
difficult to follow and are not at all transparent. For example, the text states "For both
children and adults, the current hazard index at the location with minimum pre-IRM soil
concentrations (RES-05) is 30 percent of the pre-IRM value (Table 4-16)." However,
Table 4-16 does not clearly support this statement; ratios of current HI to past HI range from
0.1 to 4.1 for potential exposures to soil and indoor dust. Section 4.5.1.2 (and Table 4-16)
should be revised to provide clear documentation and explanation for all results presented so
that these results may be more easily understood and verified. As discussed in General
Comments 4 and 5, the overall transparency of the risk assessment must be improved
27
(consistent with EPA guidance and policy) to allow risk managers and the general public to
better follow, understand, and verify the exposure, risk, and hazard results presented and
discussed in the risk assessment.
43. Section 4.5.1.3. Page 4-131. Paragraph 2. Section 4.5.1.3 discusses noncancer health
hazards for Area B. The text indicates that noncancer health hazards do not include ingestion
of fish. Potential exposure through ingestion offish tissue is evaluated separately from other
pathways and not included in totals because "concentrations of dioxins/fiirans (as TCDD
TEQdf) and PAHs (as BaPE) in fish . . . from Cass Lake and Pike Bay are not higher than
concentrations of these chemicals in fish . . . from background reference lakes." As discussed
in General Comment 1, based on the overall equivocal statistical results, it is appropriate and
consistent with a health-protective mandate to conservatively conclude that concentrations of
dioxins/furans and coplanar, dioxin-like PCB congeners (as TEQdfp) and Aroclor 1260 may
be higher in fish from Cass Lake and Pike Bay than in fish from background reference lakes.
Therefore, exposure and hazard results associated with potential ingestion of fish should be
included in the body of the text and considered as part of total exposures and hazards (see
illustrative examples in General Comment 1).
44. Section 4.5.2. Pages 4-133 and 4-134. Paragraphs 4 and 0. This portion of Section 4.5.2
discusses EPA's risk range. The text refers to an Office of Solid Waste and Emergency
Response (OSWER) direcfive "USEPA (1991b)" and states that this directive "fiirther
clarifies that where a cumulative incremental increase[d] cancer risk based on a RME
scenario is less than 1x10"* and the hazard index is less than 1, action is generally not
warranted unless an adverse enviromiiental impact (i.e., risk to ecological receptors) warrants
action." First, the reference appears to be incorrect - Section 6 presents the fiall reference for
this citation as EPA's "Risk Assessment Guidance for Superfund (RAGS): Volume 1 -
Human Health Evaluation Manual (Part B, Development of Risk-Based Preliminary
Remediation Goals), hiterim Final. EPA/540/R-92/003." The correct OSWER directive is
OSWER Directive 9355.0-30, "Role of the Baseline Risk Assessment in Superfund Remedy
Selection Decisions". Section 4.5.2 must be revised to refer to the correct directive (Section
6 should be revised accordingly.
Second, while OSWER Directive 9355.0-30 does include a statement similar to the one
presented in the text, regarding risks less than 1 x IO""*, the directive also states "A risk
28
manager may also decide that a baseline risk level less than [1 x 10" ] is unacceptable due to
site specific reasons and that remedial action is warranted." Section 4.5.2 must be revised to
present a more balanced and complete discussion regarding the recommendations presented
in OSWER Direcfive 9355.0-30.
45. Sections 4.5.2.1 and 4.5.2.3. Sections 4.5.2.1 and 4.5.2.3 discuss cancer risk estimates for
Areas A and B, respectively. The text discusses risks that exceed lE-06. However, the
COPCs driving risks greater than or equal to lE-06 are not identified. Sections 4.5.2.1 and
4.5.2.3 should be revised to identify risk drivers.
46. Section 4.5.2.1. Page 4-135. Paragraph 3. The text states "Consumption of homegrown
produce was not considered for current conditions because there are no gardens grown in
unamended soil." EPA acknowledges that this may be the case at the present time. However,
as defined in the risk assessment, "current conditions" refers to the presence or absence of
soil cover at particular residences. The fact that no gardens are currently grown in
unamended soil does not mean such gardens could not be started immediately or appear in the
fiiture. Therefore, the risk assessment should be revised to evaluate potential exposure
through ingestion of homegrown produce under current conditions.
47. Section 4.5.2.2. Page 4-137. Paragraph 2. The results presented in this paragraph are very
difficult to follow and are not at all transparent. For example, the text states "For both tribal
and standard residents, the current cancer risk at the location with the minimum pre-IRM soil
concentrations (RES-05) is 8 percent of the pre-IRM value (Table 4-16)." However, Table 4-
16 does not clearly support this statement; ratios of current HI to past HI range from 0 to 0.07
for potential exposures to soil, indoor dust, and outdoor particulates. Section 4.5.2.2 (and
Table 4-16) should be revised to provide clear documentation and explanation for all results
presented so that these results may be more easily understood and verified. As discussed in
General Comments 4 and 5, the overall transparency of the risk assessment must be improved
(consistent with EPA guidance and policy) to allow risk managers and the general public to
better follow, understand, and verify the exposure, risk, and hazard results presented and
discussed in the risk assessment.
48. Section 4.5.2.3. Page 4-138, Paragraph 2. Section 4.5.2.3 discusses cancer risk estimates
for Area B. The text indicates that cancer risk estimates do not include ingestion offish.
29
Potential exposure through ingestion of fish tissue is evaluated separately from other
pathways and not included in totals because "concentrations of dioxins/furans (as TCDD
TEQdf) and PAHs (as BaPE) in fish . . . from Cass Lake and Pike Bay are not higher than
concentrations of these chemicals in fish . . . from background reference lakes." As discussed
in General Comment 1, based on the overall equivocal statistical results, it is appropriate and
consistent with a health-protective mandate to conservatively conclude that concentrations of
dioxins/furans and coplanar, dioxin-like PCB congeners (as TEQdfp), and Aroclor 1260 may
be higher in fish from Cass Lake and Pike Bay than in fish from background reference lakes.
Therefore, exposure and risk results associated with potential ingestion offish should be
included in the body of the text and considered as part of total exposures and risks (see
illustrative examples in General Comment 1).
49. Section 4.6.2.5. Page 4-164. Paragraph 3. Section 4.6.2.5 discusses the sensitivity of the
risk and hazard results to changes in the dermal absorption factor. The text discusses the
impact of decreasing the dermal absorption factor for all chemicals by a factor of 10. No
basis is provided for selecting a factor of 10. Section 4.6.2.5 should be revised to provide a
basis for the selection ofa factor of 10 in the dermal absorption factor.
50. Section 6. Section 6 presents the references cited in the HHRA. Most listed references were
cited in the text. However, the following errors or omissions were identified and should be
corrected:
• The reference Bomschein (1994) is apparently not cited in the text.
• The reference identified as "FWP" should be revised to add the year of publication to the reference immediately after the source of the reference.
• The reference identified by the acronym "OEHHA" should be revised to spell out this acronym.
• The reference identified as "Sample and Arenal. 1999a" is presented twice; the duplicate reference should be removed and the date changed from 1999a to 1999 on the remaining reference.
• The references "St. Regis Paper Company. 2007" and "USEPA. 2004a" were apparently not cited in the text.
• The reference identified as "Wild and Jones. 1992a" is included twice; the duplicate reference should be removed and the date changed from 1992a to 1992 on the remaining reference.
30
51. Table 2-1. Table 2-1 presents the soil data evaluated for use in the risk assessment. In
several cases, data were excluded for unacceptable reasons. These reasons are summarized
below:
• "Samples of stained material in roadway collected at unknown depth." It is acknowledged that roadways do not fall into any of the exposure areas considered quantitatively in the risk assessment. Nonetheless, various receptors may be exposed directly or indirectly (for example, generation of fugitive dusts) to soils from roadways.
• "Excluded: Topsoil used to backfill excavated areas on the Allen property during the removal." Receptors may still be exposed to contaminants present in the topsoil. For example, the concentrations of contaminants in the 4 inches of soil placed over residential properties as part of the interim remedial measure were quantitatively considered in calculating EPCs under the future scenario.
• "Covered by a geotextile fabric and a minimum of 4-inches of gravel per the work plan. . . ." Four inches of gravel is insufficient to permanently exclude potential exposure to underlying soil. Also, the geotextile membrane may become compromised over time resulting in potential exposure to underlying soil.
• "Excluded: property bumed down." This is not an acceptable reason for excluding a sample. Even though the property bumed down, receptors may rebuild or use the property for different purposes under both current and fiiture conditions.
Therefore, Table 2-1 should be revised to indicate that these samples were inappropriately
excluded from the risk assessment, and the uncertainties associated with excluding samples
for the reasons listed above should be discussed in the uncertainty analysis (Section 4.6).
52. Table 4-22. Table 4-22 presents uncertainties associated with the human health risk
assessment. EPA does not agree with statements in the risk assessment that contaminant
concentrations in groundwater are decreasing. Contaminant concentrations have decreased
from historic highs in some of the outer monitoring wells, but continued decreasing trends are
not evident at all monitoring wells. Of more importance are the contaminant concentrations
at the source areas, as reflected by treatment system influent concentrations. Contaminant
concentrations dropped in some of these wells in the first several years after the system began
operating; however, over the last 10 years, relatively high concentrations have remained in
most of these wells with no continued downward trend. This is especially evident for
recovery well W405, which is being used as the worst-case or default reference point. Since
the recovery system began operating in 1987, PCP values measured in influent from this well
have ranged from 840 parts per billion (ppb) to 9900 ppb, with 8000 ppb detected in 1987,
31
and 9900 ppb and 7700 ppb detected during 2005 and 2006, respectively, as shown in Table
23 of the 2006 Annual Report. These monitoring data suggest significant mass of PCP
contamination remains in the ground beneath this area. Also, near Fox Creek, an area of
NAPL was found in the area of the new wells.
Therefore, Table 4-22 in particular, and the risk assessment in general, should be revised to
discuss the fact that groundwater concentrations in recovery wells and at the treatment system
influent have leveled off after initial decreases and are not continuing to decline.
Specifically, Table 4-22 should revise the "potential magnitude of effect" to indicate that
groundwater concentrations have not continued to decrease, but rather have plateaued.
53. Appendix D. Appendix D presents supporting information and calculations for the HHRA.
Various problems identified with portions of Appendix D are as follows:
• Appendix D2 - A portion of page 4 is cut off; this should be corrected.
• Appendix D3 - The print area in the table in this sub-appendix needs to be fixed—the right side of the table has been cut off; this should be corrected.
• Appendix D4 - The following editorial issues were identified in this sub-appendix and should be corrected:
i. Several cells indicate a #DrV/0! error message (see pages 286 and 300 of 508).
ii. Where cancer risks or noncancer hazards are not available or not applicable for certain COPCs, it seems "—" should be entered instead of a risk or hazard of "O.OOE+00." Some COPCs have "O.OOE+00" entered for risk or hazard and some have "—"; no explanation is provided for the difference.
iii. Several pages are blank except for the header (see pages 14, 16, and 20 of 508).
iv. In several places throughout this sub-appendix, print areas need to be adjusted—columns are cut off etc.
V. The last column on the right is cut off on several pages (for example, pages 197, 210, 278, 291, 351, and 387 of 508), and appears by itself on subsequent pages (for example, pages 211, 224, 292, 305, and 388 of 508). Print areas tliroughout the sub-appendix should be reviewed and fixed where necessary.
32
vi. Page breaks need to be fixed so rows/headers are displayed correctly (for example, see pages 225 and 230 of 508).
• Parameter_Risk.xls file (Oral Tox Criteria worksheet): The dermal subchronic RfDo for manganese is hard-wired as "NA." Because there is an oral subchronic RfDo for manganese, it seems there should be a value for the dermal subchronic RfDo as well (calculated as Rfl)o * ABSGI).
• App_D4-14 to D4-16_Stnd_Child_Risk.xls file (A+B - Future - Area B Worksheet), beginning with cell J226 and going to the cells to the right (Area B): Considering this is a Future scenario worksheet, it is unclear why values from the Sum B -Current worksheet are being used instead of values from the Sum B - Future worksheet. Similar locations of the A+B Future - CDA worksheet pull in values from the Sum B Future worksheet. It is unclear why these values are handled differently at this particular location. This should be corrected.
• App_D4-14 to D4-16_Stnd_Child Risk.xls file: In the produce calculations used to determine the final hazards for the Allen-C exposure area, the Original Concentrations Pre-interim Remedial Measures (Pre-IRM) concentrations from the Soil A worksheet in the EPCs.xls file were used as inputs. This seems to contradict the statements made in the HHRA that produce is not currently grown in unamended soil.
• App_D4-21 to D4-24_Utility_AltSF.xls file: hi the hih Out Part A worksheet, a column labeled "Subchronic Inhalation RfD" lists values for manganese and naphthalene only. It appears that these values are linked to the Parameter_Risk.xls file. Inhalation Tox Criteria worksheet, and "Chronic RfD" column. There is a "Subchronic RfC" column in the Parameter_Risk.xls file. Inhalation Tox Criteria worksheet, but it has a RfC for dieldrin only. It seems that these subchronic RfDs/RfCs should be consistent—not in containing the same values but in listing values for the same chemicals.
ECOLOGICAL RISK ASSESSMENT SPECIFIC COMMENTS
1. Section 5.1.1.2. Page 5-6. Footnote 29 and Page 5-8. Paragraph 2. Section 5.1.1.2
presents and discusses the results of comparisons of soil concentrations to soil benchmarks.
Footnote 29 and the text on page 5-8 refer to lead. The third sentence in Paragraph 2 on
Page 5-8 should be revised to read "EPA required that Intemational Paper include lead as a
COPEC in Area A and Area B soils due to the preponderance of sample concentrations
exceeding the screening level and the potential for direct toxicity due to elevated
concentrations. Footnote 29 on Page 5-6 should be revised in a similar manner.
2. Section 5.1.1.3. Page 5-10 and 5-11. The text on page 5-10 states that sediment screening
values are not available for dioxins and fiirans. This statement is not tme. The Canadian
33
sediment quality guideline value of 0.85 nanograms per kilogram toxicity equivalent (TEQ),
the screening value that was used in EPA's 2002 screening-level ecological risk assessment,
is available. Dioxins and fiiran concentrations in sediments at the site, including those from
deep holes need to be screened. Also, the text on page 5-11 states that D/F concentrations
exceeded screening levels in four background stations, but if no screening values were
available, what are the screening levels referred to here?
3. Section 5.1.1.4. Page 5-15. Paragraph 2. Section 5.1.1.4 presents and discusses the results
of comparisons of surface water concentrations to surface water benchmarks. Because this
section discusses both total and dissolved metal concentrations, it should be clarified whether
or not a sample concentration exceeding screening levels is based on total or dissolved
concentrations.
4. Section 5.1.3.4. Page 5-19. The description of Fox Creek overlooks the fact that the
constmction of dams by beavers has essentially changed a flowing water system into one
with physical, chemical, and biological properties that more closely resemble those of a lentic
system. Discussion about this aspect should be added to the text.
5. Section 5.2.5.1, Page 5-33. The text indicates that hazard quotients based on no-effect
toxicity reference values (TRV) such as no observed adverse effect levels (NOAEL) are the
primary means for estimating risk. However, the summary of the ERA focuses on lowest
observed adverse effect levels (LOAEL)-based hazard quotients. This discrepancy should be
resolved.
6. Section 5.3. Page 5-36. Third bullet. The text states that selected receptors represent an
upper bound exposure scenario because the home range is assumed smaller than or equal to
the size of the site. The meaning of this statement is not clear. By practice, the upper bound
exposure is tied to the EPC, which is derived from data collected over any specified area,
regardless if the area is smaller than, larger than, or equal to a receptor's home range. The
affected statement should be replaced with a summary of why the selected species are
representative of the wildlife expected to inhabit the site. Discussion about uncertainties
stemming from the sizes of habitats in relation to assumptions about the sizes of home ranges
of the receptors can be presented in the uncertainty section.
34
7. Section 5.3.3.1. Page 5-46. PAH concentrations in fish tissue in Fox Creek were not
estimated from Fox Creek sediment data, but from measured concentrations in suckers from
Cass Lake and Pike Bay. Because the sediment PAH concentrations were higher in Fox
Creek, fish tissue concentrations may be underestimated. PAH concentrations in fish tissue
for the Fox Creek exposure area need to be estimated based on concentrations in Fox Creek
sediment.
8. Section 5.3.3.1. Page 5-46. Only whole body sucker data were used for exposure point
calculations for the ERA. Since only a few species and sizes of fish were collected, the risk
assessment should include calculations using the species/tissues with the highest
concentrations for each COPEC so that the uncertainty associated with using only sucker data
can be evaluated. This analysis should be discussed in the uncertainty section.
9. Section 5.3.6.2. Page 5-52. The partitioning of invertebrate species to particular aquatic
receptors introduces uncertainty. Because the selected receptors are surrogates for multiple
species, and few types of invertebrate prey were sampled, invertebrate predators should be
assumed to feed on all of the sampled invertebrates. At a minimum, the effects of the stated
assumptions on the risk estimates should be evaluated and discussed as an uncertainty.
10. Sections 5.3.7.1 and 5.3.7.2. Pages 5-53 through 5-59. The generic exposure algorithm is
presented in Section 5.3.7.1. Details on the calculations of exposure areas for ecological
receptors, including the calculations themselves, were required to be included in the second
version of the risk assessment report. The exposure areas for each receptor are listed in Table
5-22 in the current report; however, the text does not describe how the values were derived or
how the exposure area values were used in the exposure assessment. Descriptions of how the
exposure areas were determined for each receptor need to be added to Section 5.3.7.2.
11. Section 5.3.7.2. Pages 5-53 through 5-59. Section 5.3.7.2 presents the exposure
assumptions for birds and mammals. For most receptors details on the basis for body weights
are provided. However, these details are omitted for the robin, kingfisher, and great blue
heron. Section 5.3.7.2 should be revised to include this information for these three receptors.
12. Section 5.3.7.2, Page 5-55, Paragraph 3 and Figure 5-8. This portion of Section 5.3.7.2
presents exposure parameters for the kingfisher. EPA's Wildlife Exposure Factors Handbook
35
describes the habitat of kingfishers as largely wetlands and along the edge of aquatic areas.
Figure 5-8 appears to indicate that kingfishers forage over most of the site. The legend for
Figure 5-8 should be revised to be clearer and explicitly state which site areas/habitats are
considered kingfisher habitats. (Note: this comment also applies to all of the figures which
portray exposure areas/habitats for each receptor - Figures 5-7 through 5-10).
13. Section 5.3.7.2, Page 5-57. The assessment assumes that fish constitute 57 percent of the
raccoon's diet (based on a 30-year old study), a value which seems very high based on
information in EPA's Wildlife Exposure Factors Handbook. The raccoon is an opportunistic
feeder and a poor hunter, and tends to consume food that is easily available, such as garbage,
fmits, seeds, nuts, insects like gmbs and crickets, and bird eggs and nestlings. The raccoon
will also take snakes and small rodents if available. Similarly, the literature indicates that
aquatic animals, including fish, are minor components of the raccoon's diet. The Wildlife
Exposure Factors Handbook shows a value of around 3 percent. The text should clearly
describe the basis for the diet of the raccoon. Please note that the report lists Alexander
(1977) as the basis for the raccoon diet; this study evaluated the habits of vertebrate
predators. The Wildlife Exposure Factors Handbook lists Alexander (1977) as the basis for
the diet of the mink. Perhaps the diet of the raccoon was inadvertently confused with the diet
of the mink. The diet composition assumed for each mammal and bird evaluated in the
assessment needs to be verified and corrected, as necessary.
14. Section 5.3.7.2, Page 5-57. While rooted aquatic vegetation dominates the diet of muskrats,
they will also eat animal matter such as mussels, frogs, and small turtles. The assumption of
zero animal matter may result in an underestimation of exposures associated with COPCs that
accumulate at a higher rate in animal tissue than in plant tissue. The diet of the muskrat
should be revised to include animal matter such as mussels (particularly because site-specific
mussel data are available).
15. Section 5.4.2, Pages 5-61 and 5-62. Statements about station SDFC-0412 meeting the
criteria of a reference station and EPA requiring its removal from the analysis should be
stricken from the text. As Bill Locke stated in his Febmary 6, 2007 memo to Tim Drexler,
Location SDFC-0412 was to be removed as a reference station and included in the statistical
analyses of midge growth as a sample station; "Location SDFC-0412 will be used in the
analysis of the relationship between sediment chemistry and physical properties and
36
Chironomus tentans growth." EPA agreed to Mr. Locke's proposal in a letter from Tim
Drexler on Febmary 27, 2007. EPA never proposed or agreed to the total removal of station
SDFC-0412 from the analysis.
16. Section 5.4.2.2, Pages 5-62 and 5-63. This section references Tables 5-30 and 5-31. In
addition to reporting the mean and standard deviation, the standard error—which provides a
snapshot of variability with respect to the mean—should be listed. Comparison of standard
error across samples is another useful way to determine how well the test was performed.
17. Section 5.4.3, Page 5-63. The text states that some TRVs from the previous draft were
replaced by values from more relevant or higher quality studies. However, these changes
were not clearly highlighted and documented in the report, and they did not receive prior
EPA approval. The text needs to identify the new TRVs and discuss why these values are
more relevant than the currently-approved TRVs.
18. Section 5.4.3, Page 5-65. The value for the dichlorodiphenyldichloroethane (DDD) TRV in
the text (1.22 milligrams per kilogram [mg/kg]) does not match the value in Table 5-34
(0.122 mg/kg). This inconsistency needs to be reconciled.
19. Section 5.4.3.2, Pages 5-65 through 5-67, and Tables 5-35 and 5-36. The text in this
section focuses on apparent limitations and uncertainties associated with critical tissue
residue (CTR) values. This portion of the text should be moved to Section 5.5.2.2 and
included in the discussion about the uncertainties associated with risk predictions based on
CTRs. Tables 5-35 and 5-36 list the references for the aquatic invertebrate and fish tissue
TRVs, respectively, but the full citations for them are not in the report. Jarvinen and Ankley
(1999) is cited as the reference for the mercury TRVs listed in each table; however, Jarvinen
and Ankley (1999) is a database. The correct references need to be listed. In addition,
mercury values in the database include no observed adverse effect concentration (NOAEC)
and lowest effect adverse effect concentration (LOAEC) values for the fathead minnow
considerably lower than the NOAEC (3.4 mg/kg) and LOAEC (9.4 mg/kg) listed in Table 5-
36. This indicates uncertainty as to whether the selected tissue TRVs for mercury are
protective of aquafic invertebrates and fish. Text should be added to Section 5.4.3.2 to
explain the basis and logic used to select the invertebrate and fish CTRs used as tissue TRVs.
37
20. Section 5.4.3.3, Page 5-67. TRVs developed by Oak Ridge National Laboratory (ORNL)
(Sample et al. 1999b) are proposed for many COPECs, but bases for these values (e.g., test
species, test duration, form of toxicant, endpoints) should be presented as well. Moreover, an
uncertainty factor of 0.1 was used to convert acute and subchronic values to a chronic TRV
without presentation of the basis for that uncertainty factor. Because the magnitude of an
uncertainty factor can depend on several aspects, and the literature indicates it is often lower
than 0.1, the text should discuss the technical basis for the uncertainty factor.
21. Section 5.5.1.1, Page 5-71, Paragraph 4. This paragraph presents the assumptions that
support the risk assessment for plants. The third bullet should be revised to read "COPECs in
soils are no more or less bioavailable to plants at the Site than they are to test organisms in
toxicity tests."
22. Section 5.5.1.1, Page 5-72, Paragraphs 1 and 2. Thisportionofthetext presents the risks
to the assessment endpoint - plant communities. WTiile the conclusion that plant
communities as a whole are not likely to be at risk from the COPECs present at the site is
probably correct, it should be noted that the presence of clustered samples with exceedences
of TRVs might suggest hot spots which could present localized areas of potential hazard that
need to be addressed. The text should be revised accordingly. (Note: the possible presence
of hot spots representing localized areas of potential hazards that need to be addressed should
also be addressed in Section 5.6.2.1 "Terrestrial Plant Communities" and Section 5.6.2.2
"Soil Invertebrate Communities."
23. Section 5.5.1.2, Pages 5-72 through 5-76. The paragraph at the bottom of page 5-74 and top
of page 5-75 erroneously indicates that the soil invertebrate TRV value for DDx is near the
low end of the range of the NOAEC values identified by EPA in its attempt to derive an
ecological soil screening level (EcoSSL) value for soil invertebrates. The toxicity studies
identified by EPA examined acute mortality and calculated LC50s, not NOAECs, to express
the magnitude of this effect. The statement needs to be corrected. In addition, the LC50s are
calculated for a cricket, which does not live in the soil but is expected to be found in the litter
layer. Therefore, that paragraph should be removed from the text.
The acute earthworm toxicity, visibly stained soil, and high concentrations of PAHs and PCP
at location EC07 indicate possible deposifion of wastes in this area. This sampling location is
38

near an old dump that contains a variety of solid wastes, and whether hazardous wastes were
disposed of there is uncertain. The extent of contamination in this area should be determined
in the future.
The paragraph spanning pages 5-75 and 5-76 indicates that chemicals are more available in
laboratory studies than in the field. WTiile this statement may be tme in general, it may not
hold for this site because the soils are very sandy and have low levels of organic matter—
conditions similar to many soils used in laboratory tests. Therefore, the text should be
revised to indicate that bioavailability is uncertain, but that the sand and organic matter
content of site soils is similar to soils used in laboratory tests, thus suggesting that
bioavailability at the site is probably not lower than that in the laboratory.
24. Section 5.5.1.4, Page 5-84, Paragraph 2. This section discusses risks to terrestrial birds.
The statement "Exposures of robins to zinc in Area B may exceed the NOAEL, but are not
expected to exceed the LOAEL, even at the RME," seems equivocal. If the analysis was
done, then the exposures either do or do not exceed the LOAEL. This statement should be
revised to be less ambiguous.
25. Section 5.5.2.1, Pages 5-97 and 5-98. The text indicates that risks to benthic invertebrates
are low. However, the text does not discuss the line of evidence presented by the amphipod
toxicity tests, as well as the fact that the amphipod growth endpoint could not be evaluated.
In addition, the text does not evaluate the risk with respect to the benthic invertebrate
assessment endpoint (as prey for wildlife consumers). The text in this section needs to be
revised to include discussion about (1) risks to this assessment endpoint and (2) the amphipod
line of evidence, and the omission of the amphipod growth endpoint needs to be
acknowledged and discussed as an uncertainty.
26. Section 5.5.2.3, Pages 5-101 through 5-104. In the third paragraph of page 5-101, the text
states that no whole body tissue concentrations for fish in Fox Creek exceed CTRs.
However, comparisons of the estimated concentrations listed in Table 5-56 show that both the
mean and RME tissue concentrations of copper exceed both the NOAEC and LOAEC,
indicating that copper may pose a risk to fish inhabiting Fox Creek. The text in this section
should be corrected accordingly. In addition, measured concentrations of copper in various
sucker samples from Cass Lake also exceed the NOAEC and LOAEC CTRs.
39
Text on page 5-103 discounts the significance of the high copper levels in fish by pointing
out that the selected CTR is the lowest among available CTRs, and the other CTRs listed in
Jarvinen and Ankley (1999) are not exceeded. The selected CTR was taken from Warr et al.
1996, listed in Table 5-36; the flill citation is not listed in the reference section of the report
and is not found in the Jarvinen and Ankley (1999) database. Table 5-36 indicates that the
Warr et al. (1996) study evaluated rainbow trout growth. The other CTRs are from a short-
temi (3 to 4 days) study by Stouthart et al. (1996) that examined the effect of pH on the
toxicity of copper to eggs and larvae of carp. These other CTRs are less relevant because of
the shorter exposure duration and, in the case of the eggs, the life stage evaluated. The text
needs to be clarified or the reference to the other CTRs needs to be removed.
Text on page 5-104 indicates that the fish tissue estimates for copper are "conservative or
realistic," which indicates that the estimated concentrations are reasonably accurate.
Therefore, text should be added that discusses the significance of the fact that the tissue
concentrations of copper exceed both the NOAEC and LOAEC.
27. Section 5.5.2.3. Page 5-104. The text does not present an overall conclusion regarding risks
to fish. In addition, the text states that copper levels in fish from "reference areas" exceeded
the tissue TRV; however, examination of Table 5-53 shows that only fish samples from Ball
Club Lake exceeded the tissue TRV for copper. These issues should be corrected.
28. Section 5.5.2.5. Page 5-107. The second paragraph in this section states that most of the
aquatic receptors are piscivorous. The raccoon and muskrat are not piscivorous. This
misstatement needs to be corrected.
29. Section 5.5.2.5. Page 5-108. The text in the second bullet on page 5-108 indicates that
underestimated dioxin/fiiran concentrations in fish do not change the conclusions of the risk
assessment for piscivores. Revised HQs for piscivores based on the estimated dioxin/furan
concentrations need to be presented to support this statement.
30. Figures 5-11 and 5-12. It is not clear from the figure that there are HQs > 1 for multiple
COPECs at some locations. These figures need to be revised.
40
31. Table 5-1. The following analytes have screening values (Table 5-1 incorrectly states that
they do not). Table 5-1 should be revised accordingly.
2-Methylnaphthalene - sediment: 70 ^g/kg (Long and others 1995)
Endosulfan I - sediment: 2.9 |ig/kg (see endosulfan alpha, EPA 1996)
Benzo(k)fluoranthene - surface water: 0.049 ig/L (GDNR 2005)
Dibenzo(a,h)anthracene - surface water: 0.049 ug/L (GDNR 2005)
hideno(l ,2,3-cd)pyrene - surface water: 0.049 |ag/L (GDNR 2005)
fron - surface water: 1000 |ig/L (EPA 2006)
Magnesium - surface water: 82,000 )ag/L (Suter and Tsao 1996)
Potassium - surface water: 53,000 [ig/L (Suter and Tsao 1996)
32. Tables 5-30 through 5-32. The total organic carbon (TOC) values for the control sediments
should be included in the table.
33. Table 5-43. The title of this table should be revised from 4-43 to 5-43.
34. Appendix E6. Section 7.1.2. Page E6-17. A reference for the fifth main bullet regarding the
proportion of all organic matter is missing and should be added.
41
REFERENCES
Barr Engineering Company (Barr). 2005. Validated Analytical Data - House Dust, Laboratory Batch Numbers: K2408652, St. Regis Paper Company Site - Cass Lake, Minnesota. Febmary 8.
Georgia Department of Natural Resources (GDNR). 2005. Rules and Regulations for Water Quality Control. Chapter 391-3-6. On-line Address: http://www.epa.gov/waterscience/standards/wqslibrary/ga/ga_4_wqs.pdf
Long, E.R., and others. 1995. "Incidence of Adverse Biological Effects with Ranges of Chemical Concentratons in Marine and Estuarine Sediments." Environmental Management. Volume 19, Pages 81 through 97.
Suter, G.W. II and Tsao, C.L. 1996. "Toxicological Benclimarks for Screening Potential Contaminants of Concem for Effects on Aquatic Biota: 1996 Revision. ES/ER/TM-96/R2.
U.S. Environmental Protection Agency (EPA). 1989. Risk Assessment Guidance for Superfund, Volume I: Human Health Evaluation Manual (Part A) (RAGS). Interim Final. Office of Emergency and Remedial Response. Washington, D.C. EPA/540/1-89/002. December.
EPA. 1996. ECO Update: Ecotox Thresholds. EPA/540/F-95/038. January.
EPA. 2003. "World Trade Center Indoor Environment Assessment: Selecting Contaminants of Potential Concem and Setting Health-Based Benchmarks." Prepared by the Contaminants of Potential Concem (COPC) Committee of the World Trade Center Indoor Air Task Force Working Group. Available at: http: //www. epa. go v/wtc/copc_benchmark.pdf
42