Embed Size (px)
Citation preview
2010 ANNUAL REPORTConnecting the World
FREEPORT-McMoRan COPPER & GOLD INC.
Freeport-McMoRan Copper & Gold Inc. (FCX) is a leading international mining company with headquarters in Phoenix,
Arizona. FCX operates large, long-lived, geographically diverse assets with significant proven and probable reserves of
copper, gold and molybdenum. FCX has a dynamic portfolio of operating, expansion and growth projects in the copper
industry and is the world’s largest producer of molybdenum.
FCX’s portfolio of assets includes the Grasberg minerals district, the world’s largest copper and gold mine in terms
of recoverable reserves; significant mining operations in the Americas, including the large-scale Morenci and Safford
minerals districts in North America and the Cerro Verde and El Abra operations in South America; and the Tenke
Fungurume minerals district in the Democratic Republic of Congo. Additional information about FCX is available on
FCX’s website at www.fcx.com.
Years Ended December 31, 2010 2009 2008 2007 2006
(In Millions, Except Per Share Amounts)
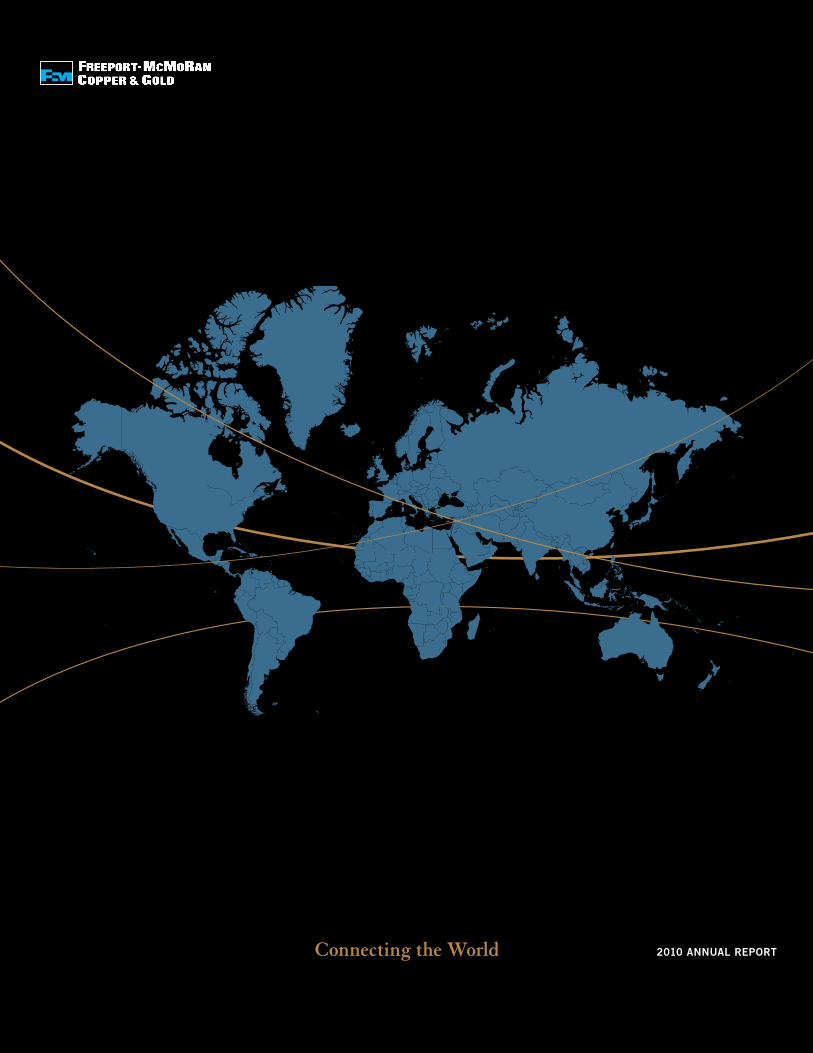
Revenues $ 18,982 $ 15,040 $ 17,796 $ 16,939 $ 5,791
Operating income (loss) 9,068 6,503 (12,710) + 6,555 2,869
Operating cash flows 6,273 4,397 3,370 6,225 1,866
Capital expenditures 1,412 1,587 2,708 1,755 251
Net income (loss) attributable to FCX common stockholders 4,273 2,527 (11,341) + 2,769 1,396
Diluted net income (loss) per common share* 4.57 2.93 (14.86) + 3.75 3.32
Dividends paid per common share* 0.95 — 0.91 0.63 2.38
At December 31:
Cash and cash equivalents 3,738 2,656 872 1,626 907
Total assets 29,386 25,996 23,353 40,661 5,390
Total debt, including current portion 4,755 6,346 7,351 7,211 680
Total FCX stockholders’ equity 12,504 9,119 5,773 18,234 2,445
+ Includes charges totaling $17.7 billion ($13.2 billion to net loss attributable to FCX common stockholders or $17.23 per share) associated with asset impairment, lower of cost or market inventory adjustments, restructuring and other charges.
* Adjusted to reflect the February 1, 2011, two-for-one stock split.
Summary Financial Highlights
Revenue $ in billions
10.03.0
4.0 2.0
20.0 5.0 8.0 4.0
15.04.0
6.0 3.0
5.0
2.0
1.02.0 1.0
20102009
Net Income $ in billions
20102009
Operating Cash Flow $ in billions
20102009
Year End Cash Balance $ in billions
20102009
Freeport-McMoRan Copper & Gold plays a significant
role in “Connecting the World” by producing metals that
are vital to the world’s economies. We are a global leader
in the production of copper, gold and molybdenum
and have a long and successful history of conducting
our business in a safe, highly efficient and socially
responsible manner for the benefit of our stakeholders.
Table of Contents
2 Major Mine Operations and Development Projects
3 Letter to Our Shareholders
6 Operational Overview
16 Reserves and Mineralized Material
17 Sustainable Development
18 Board of Directors and Management
19 Financial and Operating Information
110 Stockholder Information
111 Stockholder Information
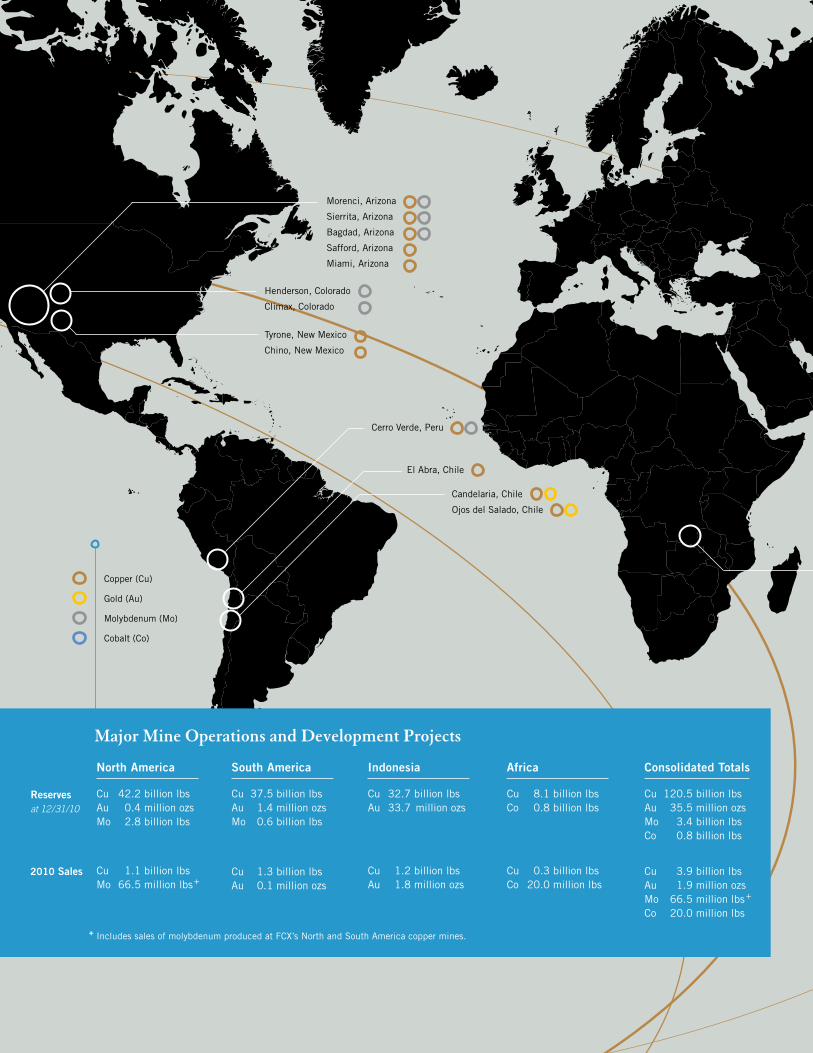
Morenci, Arizona
Sierrita, Arizona
Bagdad, Arizona
Safford, Arizona
Miami, Arizona
Henderson, Colorado
Climax, Colorado
Tyrone, New Mexico
Chino, New Mexico
Cerro Verde, Peru
El Abra, Chile
Candelaria, Chile
Ojos del Salado, Chile
Copper (Cu)
Cobalt (Co)
Molybdenum (Mo)
Gold (Au)
North America
Cu 42.2 billion lbs Au 0.4 million ozs Mo 2.8 billion lbs
Cu 1.1 billion lbs Mo 66.5 million lbs +
South America
Cu 37.5 billion lbs Au 1.4 million ozs Mo 0.6 billion lbs
Cu 1.3 billion lbs Au 0.1 million ozs
+ Includes sales of molybdenum produced at FCX’s North and South America copper mines.
Africa
Cu 8.1 billion lbs Co 0.8 billion lbs
Cu 0.3 billion lbs Co 20.0 million lbs
Indonesia
Cu 32.7 billion lbs Au 33.7 million ozs
Cu 1.2 billion lbs Au 1.8 million ozs
Consolidated Totals
Cu 120.5 billion lbs Au 35.5 million ozs Mo 3.4 billion lbs Co 0.8 billion lbs
Cu 3.9 billion lbs Au 1.9 million ozs Mo 66.5 million lbs + Co 20.0 million lbs
Major Mine Operations and Development Projects
Reserves at 12/31/10
2010 Sales
Tenke Fungurume,
Democratic Republic of Congo
Grasberg, Indonesia
FRE
EP
OR
T-McM
oRan C
OP
PE
R &
GO
LD IN
C. 2
010 A
nnual Rep
ort3
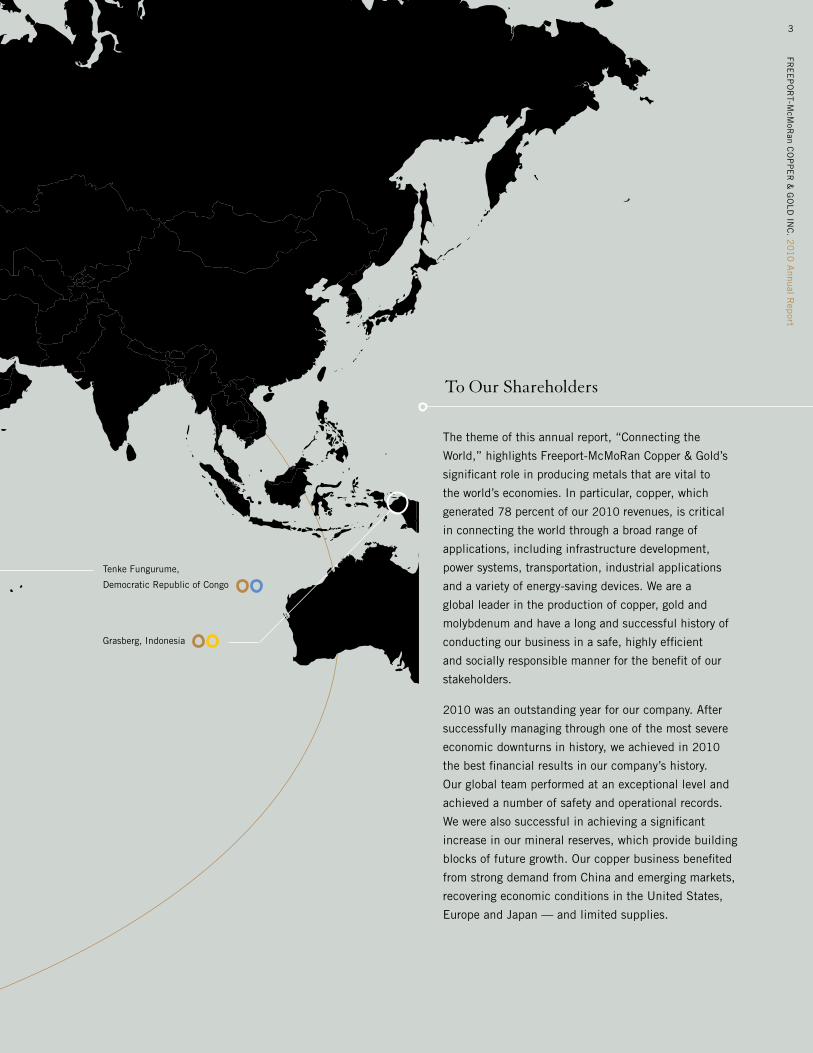
To Our Shareholders
The theme of this annual report, “Connecting the
World,” highlights Freeport-McMoRan Copper & Gold’s
significant role in producing metals that are vital to
the world’s economies. In particular, copper, which
generated 78 percent of our 2010 revenues, is critical
in connecting the world through a broad range of
applications, including infrastructure development,
power systems, transportation, industrial applications
and a variety of energy-saving devices. We are a
global leader in the production of copper, gold and
molybdenum and have a long and successful history of
conducting our business in a safe, highly efficient
and socially responsible manner for the benefit of our
stakeholders.
2010 was an outstanding year for our company. After
successfully managing through one of the most severe
economic downturns in history, we achieved in 2010
the best financial results in our company’s history.
Our global team performed at an exceptional level and
achieved a number of safety and operational records.
We were also successful in achieving a significant
increase in our mineral reserves, which provide building
blocks of future growth. Our copper business benefited
from strong demand from China and emerging markets,
recovering economic conditions in the United States,
Europe and Japan — and limited supplies.
FRE
EP
OR
T-M
cMoR
an C
OP
PE
R &
GO
LD I
NC
. 2
010
Ann
ual
Rep
ort
4
In 2011, we will focus on executing our plans for
future growth in response to the global market demand
for metals while continuing to emphasize safety,
aggressive cost management and social responsibility.
These commitments are central to our core values
and a primary driver of our corporate social
responsibility programs.
We express our appreciation to our entire organization
for their hard work and accomplishments during 2010.
The positive contributions by our global team have
positioned us for continued success. We also want to
express our gratitude to our Board of Directors, whose
wisdom and counsel have shaped our past success and
promising future. Together we will continue “Connecting
the World” for the 21st century.
Respectfully yours,
March 15, 2011
These market dynamics resulted in tight physical market
conditions, declining exchange inventories and higher
commodity prices. Our realized price for copper averaged
$3.59 per pound in 2010, 38 percent higher than in
2009. The copper price ended the year at an all-time
high of $4.42 per pound and reached new highs in
early 2011.
Most market experts expect copper prices to continue to
be favorable during 2011, driven by rising demand and
constrained supplies. As a leading producer of copper
with long-lived reserves and attractive development
projects, we are well positioned to benefit from these
favorable conditions. In our molybdenum business, we are
advancing efforts to maintain our position as the world’s
largest molybdenum producer. Our large-scale operations
and the robust markets for our products should enable
us to generate solid financial results as we go forward.
We have a highly focused financial strategy designed to
build value for shareholders. Our first priority for using
cash is to invest in economically attractive development
projects. We are actively pursuing large investments
in mine expansions at several of our operating sites
around the world to grow our production profile, improve
efficiencies, and generate increased cash flows and
profits. We will also continue to maintain a strong balance
sheet and liquidity position, which will enable us to
effectively manage inherent volatility in our business and
pursue large-scale development opportunities. We also
expect to continue our longstanding tradition of providing
attractive cash returns to shareholders as market
conditions warrant.
Our outstanding financial results during 2010 allowed
us to further strengthen our financial position, enhance
our liquidity position, advance our attractive development
projects and provide increased cash returns to
shareholders. We repaid $1.6 billion in debt in 2010, and
our Board of Directors increased our quarterly common
stock dividend over 200 percent during the year. We also
paid a supplemental common stock dividend of $1.00
per share (pre-split) in December 2010, and our positive
share price performance and outlook for our business
enabled our Board to authorize a two-for-one stock split,
which took effect on February 1, 2011.
James R. MoffettChairman of the Board
Richard C. AdkersonPresident andChief Executive Officer
FRE
EP
OR
T-McM
oRan C
OP
PE
R &
GO
LD IN
C. 2
010 A
nnual Rep
ort5
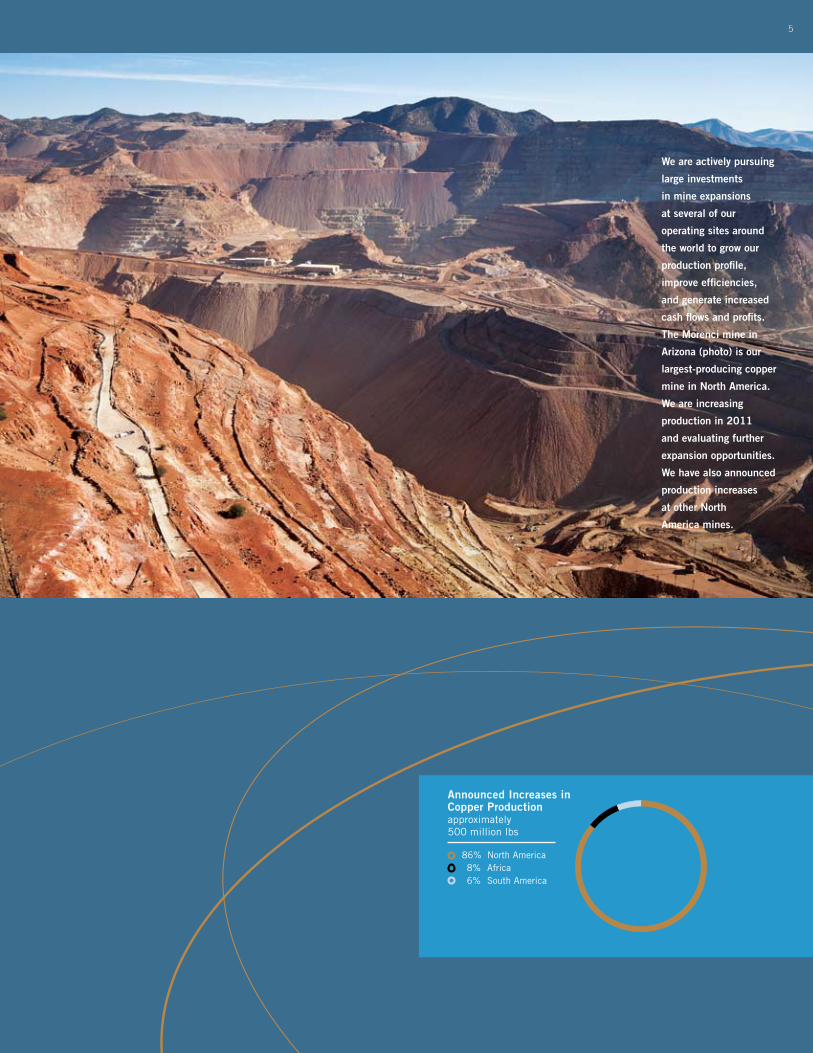
We are actively pursuing
large investments
in mine expansions
at several of our
operating sites around
the world to grow our
production profile,
improve efficiencies,
and generate increased
cash flows and profits.
The Morenci mine in
Arizona (photo) is our
largest-producing copper
mine in North America.
We are increasing
production in 2011
and evaluating further
expansion opportunities.
We have also announced
production increases
at other North
America mines.
5
Announced Increases in Copper Production approximately 500 million lbs
86% North America 8% Africa 6% South America
6
2010 2011e
Cash Unit Costs (1)
Site Production & Delivery $ 1.40 $ 1.66
By-product Credits (0.81) (0.75)
Treatment Charges 0.15 0.14
Royalties 0.05 0.05
Unit Net Cash Costs $ 0.79 $ 1.10
(1) Estimates assume average prices of $4.25/lb for copper, $1,350/oz for gold, $15/lb for molybdenum and $14/lb for cobalt for 2011.Quarterly unit costs will vary significantly with quarterly metal sales volumes.Unit net cash costs for 2011 would change by approximately $0.02/lb for each $50/oz change in gold and for each $2/lb change in molybdenum.
Note: e=estimate.
Consolidated Unit Production Costs per lb of copper
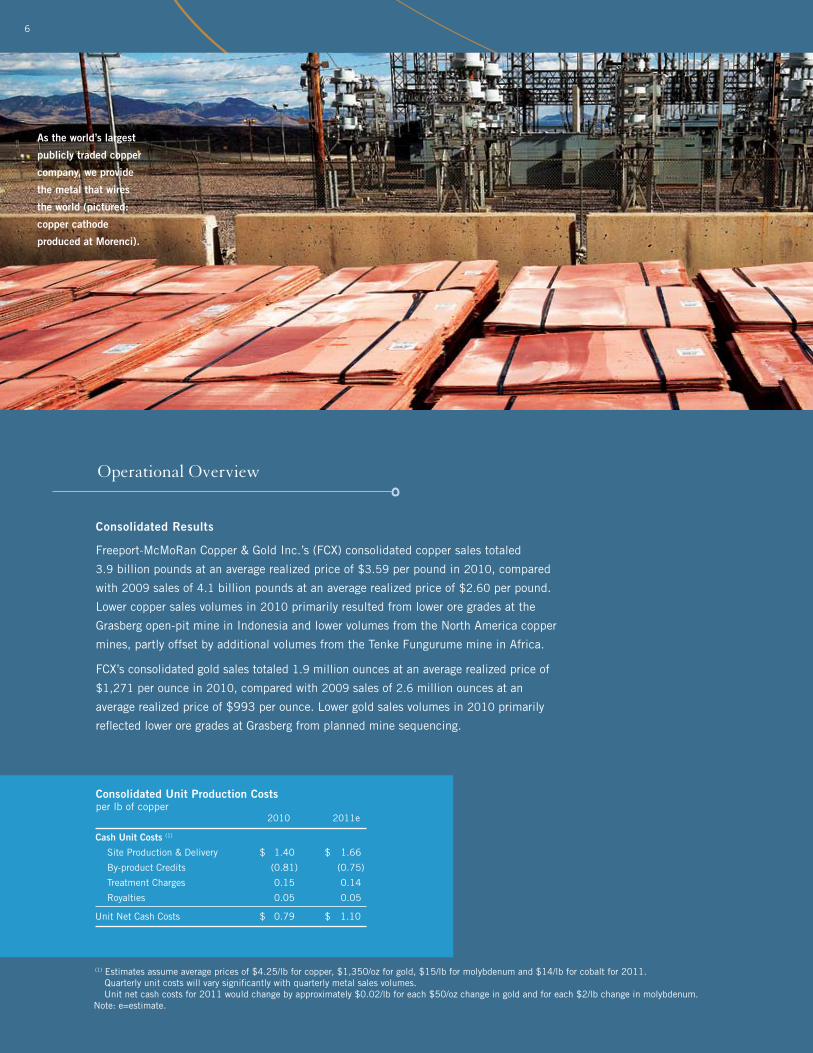
As the world’s largest
publicly traded copper
company, we provide
the metal that wires
the world (pictured:
copper cathode
produced at Morenci).
Consolidated Results
Freeport-McMoRan Copper & Gold Inc.’s (FCX) consolidated copper sales totaled
3.9 billion pounds at an average realized price of $3.59 per pound in 2010, compared
with 2009 sales of 4.1 billion pounds at an average realized price of $2.60 per pound.
Lower copper sales volumes in 2010 primarily resulted from lower ore grades at the
Grasberg open-pit mine in Indonesia and lower volumes from the North America copper
mines, partly offset by additional volumes from the Tenke Fungurume mine in Africa.
FCX’s consolidated gold sales totaled 1.9 million ounces at an average realized price of
$1,271 per ounce in 2010, compared with 2009 sales of 2.6 million ounces at an
average realized price of $993 per ounce. Lower gold sales volumes in 2010 primarily
reflected lower ore grades at Grasberg from planned mine sequencing.
Operational Overview
FRE
EP
OR
T-McM
oRan C
OP
PE
R &
GO
LD IN
C. 2
010 A
nnual Rep
ort7
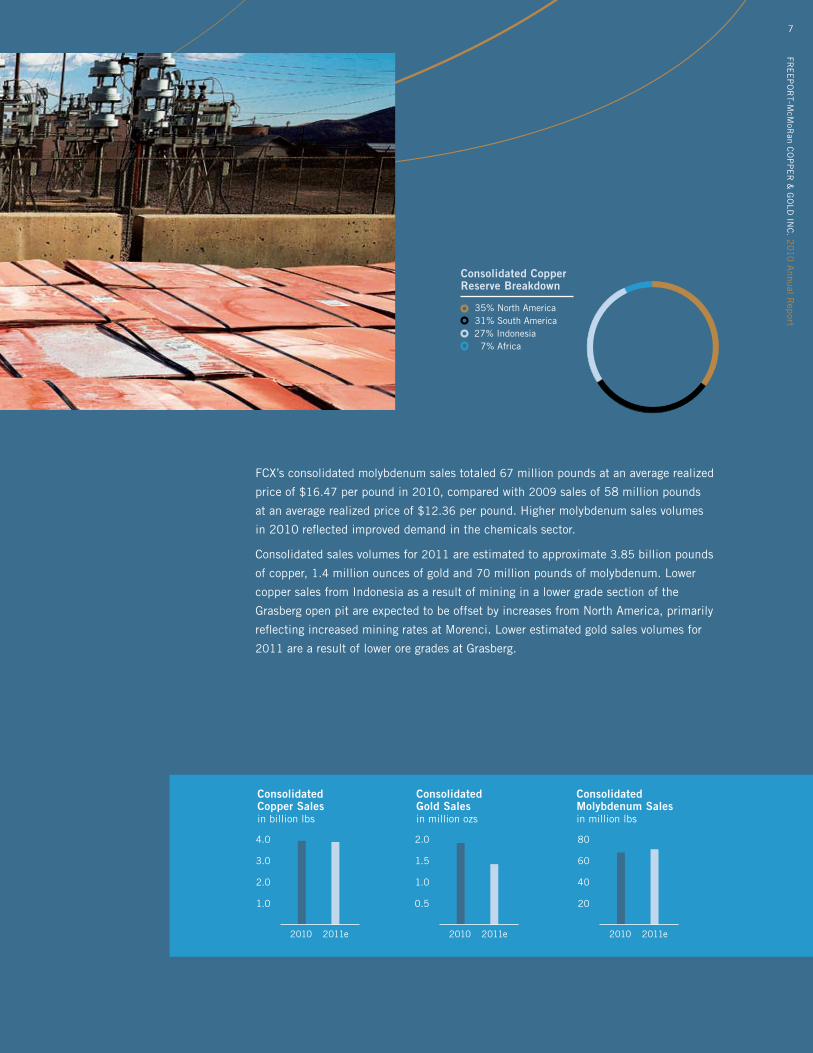
FCX’s consolidated molybdenum sales totaled 67 million pounds at an average realized
price of $16.47 per pound in 2010, compared with 2009 sales of 58 million pounds
at an average realized price of $12.36 per pound. Higher molybdenum sales volumes
in 2010 reflected improved demand in the chemicals sector.
Consolidated sales volumes for 2011 are estimated to approximate 3.85 billion pounds
of copper, 1.4 million ounces of gold and 70 million pounds of molybdenum. Lower
copper sales from Indonesia as a result of mining in a lower grade section of the
Grasberg open pit are expected to be offset by increases from North America, primarily
reflecting increased mining rates at Morenci. Lower estimated gold sales volumes for
2011 are a result of lower ore grades at Grasberg.
Consolidated Copper Reserve Breakdown
35% North America 31% South America 27% Indonesia 7% Africa
Consolidated Copper Sales in billion lbs
2011e2010
2.0
4.0
3.0
1.0
Consolidated Gold Sales in million ozs
2011e2010
1.0
2.0
1.5
0.5
Consolidated Molybdenum Sales in million lbs
2011e2010
40
80
60
20
88
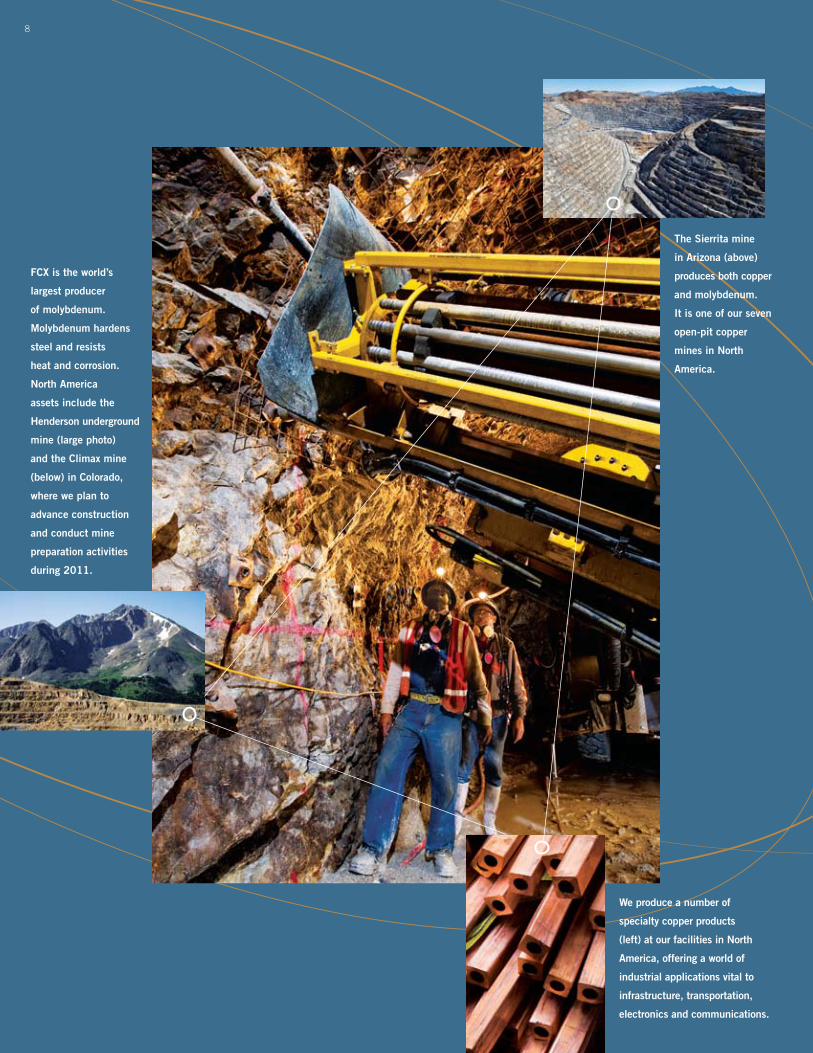
The Sierrita mine
in Arizona (above)
produces both copper
and molybdenum.
It is one of our seven
open-pit copper
mines in North
America.
We produce a number of
specialty copper products
(left) at our facilities in North
America, offering a world of
industrial applications vital to
infrastructure, transportation,
electronics and communications.
FCX is the world’s
largest producer
of molybdenum.
Molybdenum hardens
steel and resists
heat and corrosion.
North America
assets include the
Henderson underground
mine (large photo)
and the Climax mine
(below) in Colorado,
where we plan to
advance construction
and conduct mine
preparation activities
during 2011.
FRE
EP
OR
T-McM
oRan C
OP
PE
R &
GO
LD IN
C. 2
010 A
nnual Rep
ort9
North America
FCX leads the metals industry in North America in the production of copper and
molybdenum. FCX operates seven open-pit copper mines in the United States
(Morenci, Sierrita, Bagdad, Safford and Miami in Arizona, and Tyrone and Chino
in New Mexico). FCX conducts molybdenum mining operations at the Henderson
underground mine in Colorado. Molybdenum is also produced by FCX’s Sierrita and
Bagdad mines.
FCX has restarted the Morenci mill to process available sulfide material currently
being mined and has commenced a staged ramp-up of the mining rate at the Morenci
mine. These activities at Morenci are expected to enable copper production to
increase by approximately 125 million pounds per year. Additionally, FCX is evaluating
further increases to Morenci’s mining rate and the potential of a new mill at Morenci.
FCX has also initiated limited mining activities at the Miami mine and has initiated
a restart of mining and milling activities at the Chino mine.
Construction activities at the Climax molybdenum mine are ongoing; FCX plans to
advance construction and conduct mine preparation activities during 2011. The
timing for start-up of mining and milling activities is dependent on market conditions.
FCX believes that this project is one of the most attractive primary molybdenum
development projects in the world, with large-scale production capacity, attractive
cash costs and future growth options.
Consolidated copper sales in North America totaled 1.1 billion pounds in 2010,
compared to 1.2 billion pounds in 2009. Consolidated molybdenum sales totaled
67 million pounds in 2010, compared to 58 million pounds in 2009. FCX expects
2011 sales from North America copper mines to approximate 1.2 billion pounds of
copper, which reflects increased mining and milling rates at the Morenci mine, and
molybdenum sales to approximate 70 million pounds.
Operational Overview
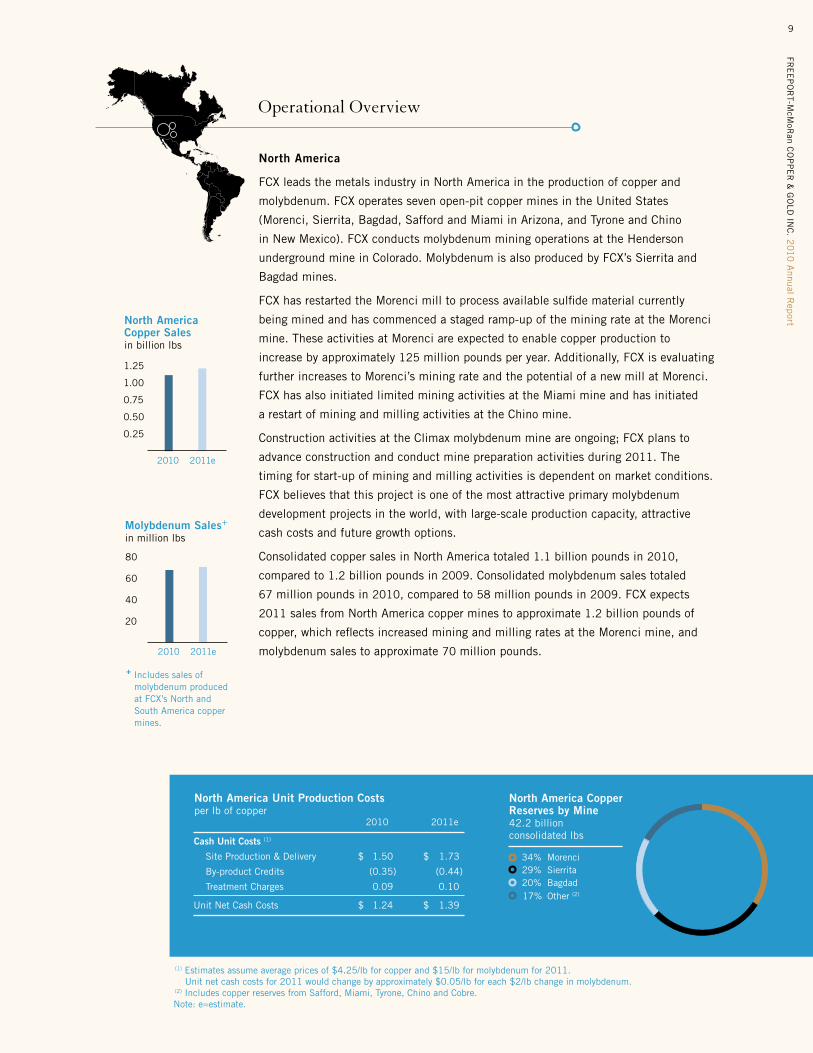
2010 2011e
Cash Unit Costs (1)
Site Production & Delivery $ 1.50 $ 1.73
By-product Credits (0.35) (0.44)
Treatment Charges 0.09 0.10
Unit Net Cash Costs $ 1.24 $ 1.39
(1) Estimates assume average prices of $4.25/lb for copper and $15/lb for molybdenum for 2011. Unit net cash costs for 2011 would change by approximately $0.05/lb for each $2/lb change in molybdenum. (2) Includes copper reserves from Safford, Miami, Tyrone, Chino and Cobre.Note: e=estimate.
North America Unit Production Costs per lb of copper
North America Copper Reserves by Mine 42.2 billion consolidated lbs
34% Morenci 29% Sierrita 20% Bagdad 17% Other (2)
North America Copper Sales in billion lbs
2011e2010
0.75
1.25
1.00
0.50
0.25
Molybdenum Sales+ in million lbs
2011e2010
40
80
60
20
+ Includes sales of molybdenum produced at FCX’s North and South America copper mines.
FRE
EP
OR
T-M
cMoR
an C
OP
PE
R &
GO
LD I
NC
. 2
010
Ann
ual
Rep
ort
10
Operational Overview
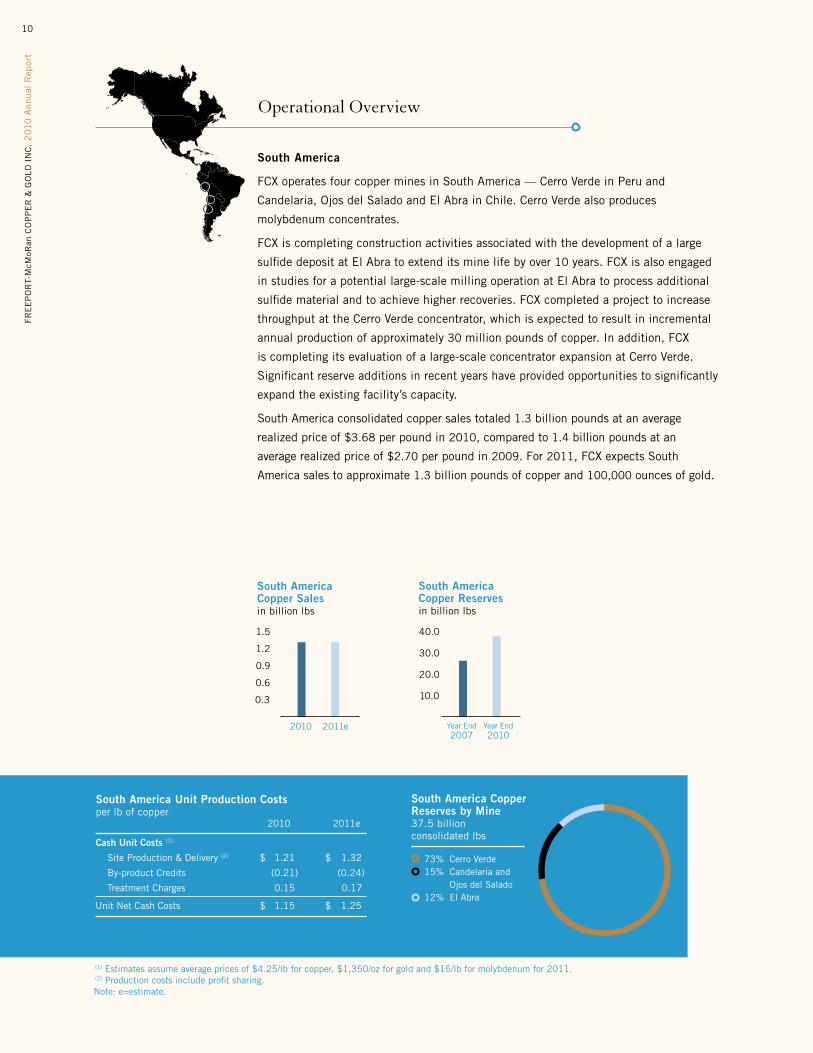
South America
FCX operates four copper mines in South America — Cerro Verde in Peru and
Candelaria, Ojos del Salado and El Abra in Chile. Cerro Verde also produces
molybdenum concentrates.
FCX is completing construction activities associated with the development of a large
sulfide deposit at El Abra to extend its mine life by over 10 years. FCX is also engaged
in studies for a potential large-scale milling operation at El Abra to process additional
sulfide material and to achieve higher recoveries. FCX completed a project to increase
throughput at the Cerro Verde concentrator, which is expected to result in incremental
annual production of approximately 30 million pounds of copper. In addition, FCX
is completing its evaluation of a large-scale concentrator expansion at Cerro Verde.
Significant reserve additions in recent years have provided opportunities to significantly
expand the existing facility’s capacity.
South America consolidated copper sales totaled 1.3 billion pounds at an average
realized price of $3.68 per pound in 2010, compared to 1.4 billion pounds at an
average realized price of $2.70 per pound in 2009. For 2011, FCX expects South
America sales to approximate 1.3 billion pounds of copper and 100,000 ounces of gold.
2010 2011e
Cash Unit Costs (1)
Site Production & Delivery (2) $ 1.21 $ 1.32
By-product Credits (0.21) (0.24)
Treatment Charges 0.15 0.17
Unit Net Cash Costs $ 1.15 $ 1.25
(1) Estimates assume average prices of $4.25/lb for copper, $1,350/oz for gold and $15/lb for molybdenum for 2011. (2) Production costs include profit sharing.Note: e=estimate.
South America Unit Production Costs per lb of copper
South America Copper Reserves by Mine 37.5 billion consolidated lbs
73% Cerro Verde 15% Candelaria and Ojos del Salado 12% El Abra
South America Copper Sales in billion lbs
2011e2010
0.9
1.5
1.2
0.6
0.3
South America Copper Reserves in billion lbs
Year End 2010
Year End 2007
20.0
40.0
30.0
10.0
11
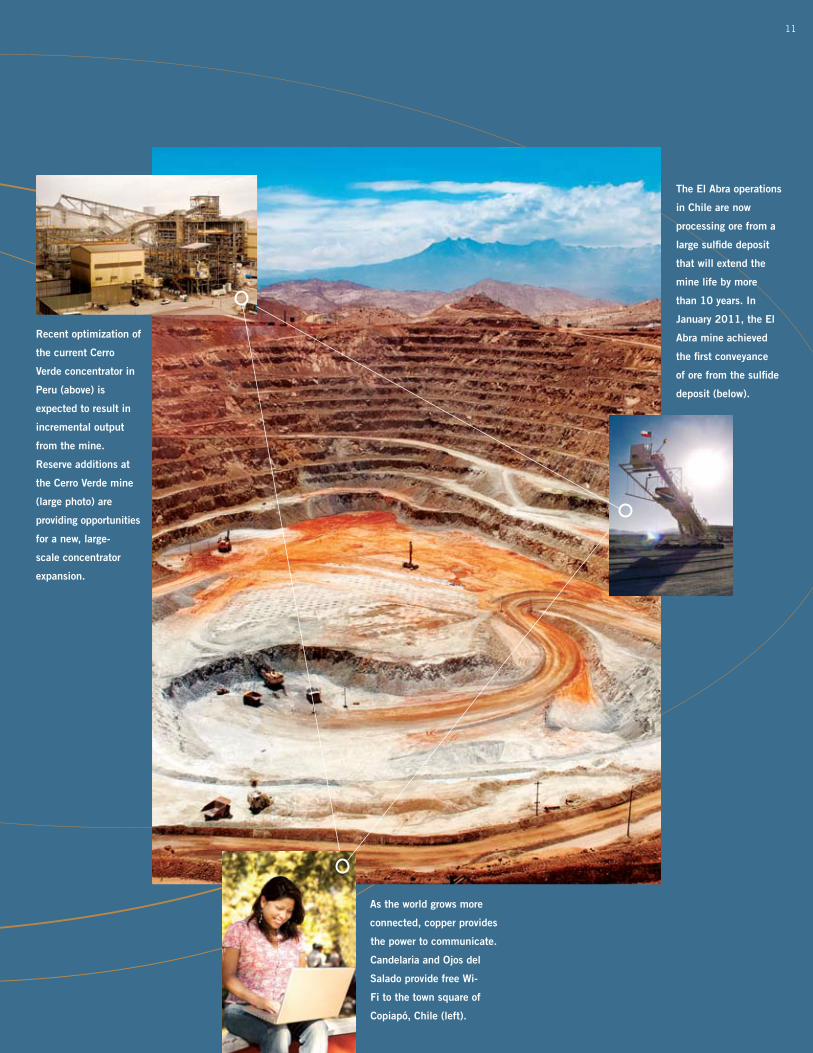
The El Abra operations
in Chile are now
processing ore from a
large sulfide deposit
that will extend the
mine life by more
than 10 years. In
January 2011, the El
Abra mine achieved
the first conveyance
of ore from the sulfide
deposit (below).
As the world grows more
connected, copper provides
the power to communicate.
Candelaria and Ojos del
Salado provide free Wi-
Fi to the town square of
Copiapó, Chile (left).
Recent optimization of
the current Cerro
Verde concentrator in
Peru (above) is
expected to result in
incremental output
from the mine.
Reserve additions at
the Cerro Verde mine
(large photo) are
providing opportunities
for a new, large-
scale concentrator
expansion.
12
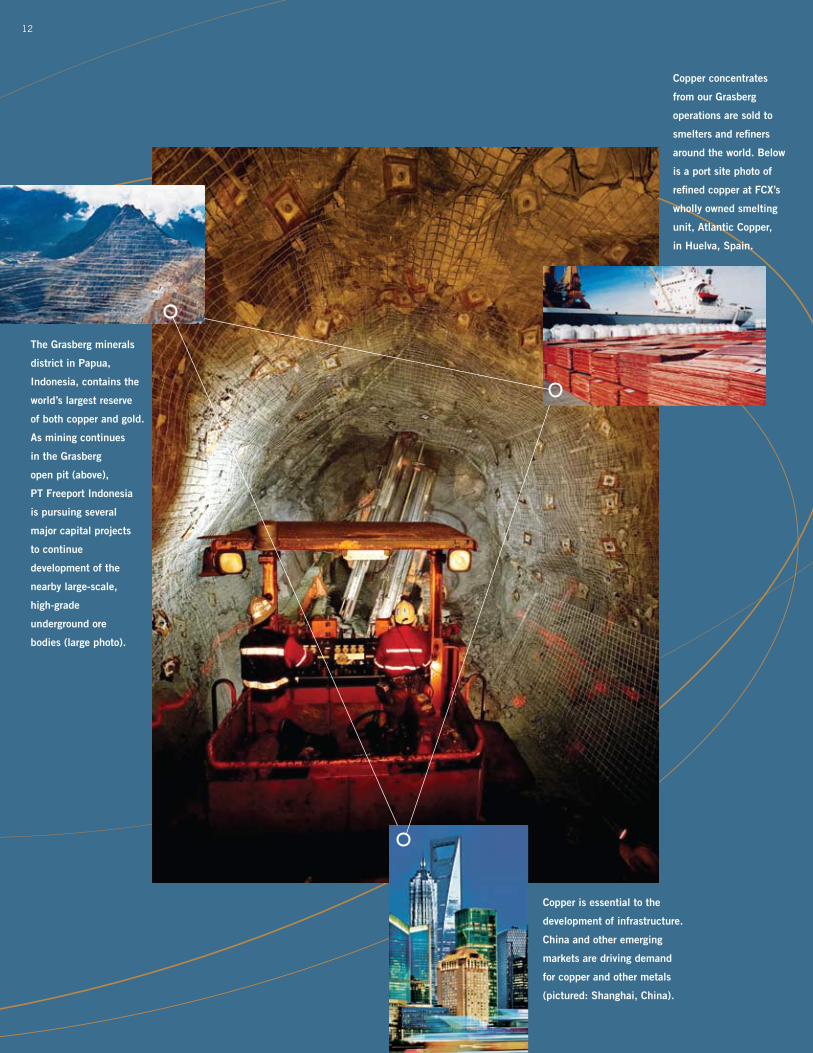
Copper concentrates
from our Grasberg
operations are sold to
smelters and refiners
around the world. Below
is a port site photo of
refined copper at FCX’s
wholly owned smelting
unit, Atlantic Copper,
in Huelva, Spain.
Copper is essential to the
development of infrastructure.
China and other emerging
markets are driving demand
for copper and other metals
(pictured: Shanghai, China).
The Grasberg minerals
district in Papua,
Indonesia, contains the
world’s largest reserve
of both copper and gold.
As mining continues
in the Grasberg
open pit (above),
PT Freeport Indonesia
is pursuing several
major capital projects
to continue
development of the
nearby large-scale,
high-grade
underground ore
bodies (large photo).
FRE
EP
OR
T-McM
oRan C
OP
PE
R &
GO
LD IN
C. 2
010 A
nnual Rep
ort13
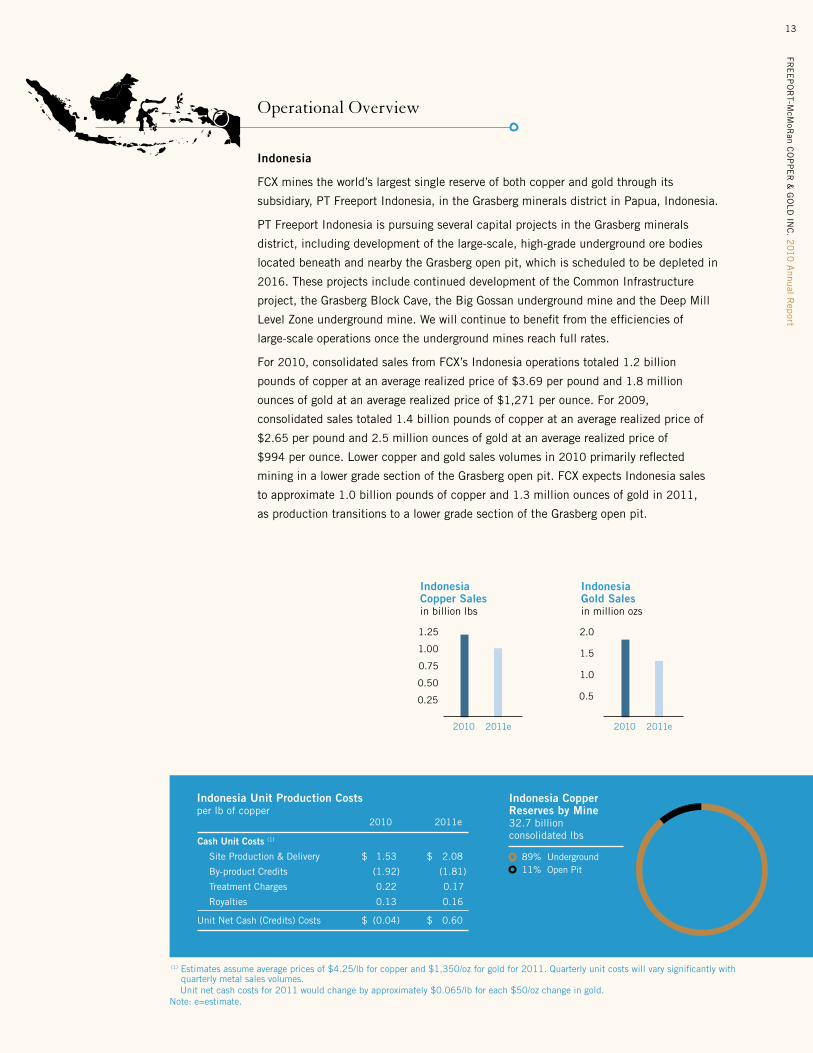
Indonesia
FCX mines the world’s largest single reserve of both copper and gold through its
subsidiary, PT Freeport Indonesia, in the Grasberg minerals district in Papua, Indonesia.
PT Freeport Indonesia is pursuing several capital projects in the Grasberg minerals
district, including development of the large-scale, high-grade underground ore bodies
located beneath and nearby the Grasberg open pit, which is scheduled to be depleted in
2016. These projects include continued development of the Common Infrastructure
project, the Grasberg Block Cave, the Big Gossan underground mine and the Deep Mill
Level Zone underground mine. We will continue to benefit from the efficiencies of
large-scale operations once the underground mines reach full rates.
For 2010, consolidated sales from FCX’s Indonesia operations totaled 1.2 billion
pounds of copper at an average realized price of $3.69 per pound and 1.8 million
ounces of gold at an average realized price of $1,271 per ounce. For 2009,
consolidated sales totaled 1.4 billion pounds of copper at an average realized price of
$2.65 per pound and 2.5 million ounces of gold at an average realized price of
$994 per ounce. Lower copper and gold sales volumes in 2010 primarily reflected
mining in a lower grade section of the Grasberg open pit. FCX expects Indonesia sales
to approximate 1.0 billion pounds of copper and 1.3 million ounces of gold in 2011,
as production transitions to a lower grade section of the Grasberg open pit.
Operational Overview
2010 2011e
Cash Unit Costs (1)
Site Production & Delivery $ 1.53 $ 2.08
By-product Credits (1.92) (1.81)
Treatment Charges 0.22 0.17
Royalties 0.13 0.16
Unit Net Cash (Credits) Costs $ (0.04) $ 0.60
(1) Estimates assume average prices of $4.25/lb for copper and $1,350/oz for gold for 2011. Quarterly unit costs will vary significantly with quarterly metal sales volumes.
Unit net cash costs for 2011 would change by approximately $0.065/lb for each $50/oz change in gold.Note: e=estimate.
Indonesia Unit Production Costs per lb of copper
Indonesia Copper Reserves by Mine 32.7 billion consolidated lbs
89% Underground 11% Open Pit
Indonesia Copper Sales in billion lbs
2011e2010
0.75
1.25
1.00
0.50
0.25
Indonesia Gold Sales in million ozs
2011e2010
1.0
2.0
1.5
0.5
FRE
EP
OR
T-M
cMoR
an C
OP
PE
R &
GO
LD I
NC
. 2
010
Ann
ual
Rep
ort
14
Africa
FCX operates the Tenke Fungurume copper and cobalt mine in the Katanga province of
the Democratic Republic of Congo (DRC).
FCX is engaged in drilling activities, exploration analyses and metallurgical testing to
evaluate the potential of the highly prospective minerals district at Tenke Fungurume.
These analyses are being incorporated in future plans to evaluate opportunities for
expansion. FCX is planning a second phase of the project, which would include
optimizing the current plant and increasing capacity. Future expansions are subject to
a number of factors, including economic and market conditions and the business and
investment climate in the DRC.
Consolidated sales from Tenke Fungurume increased to 262 million pounds of copper
in 2010, compared with 130 million pounds of copper in 2009, reflecting higher
operating rates and a full year of production in 2010. Consolidated cobalt sales totaled
20 million pounds in 2010. FCX expects Tenke Fungurume sales of approximately
285 million pounds of copper and over 20 million pounds of cobalt in 2011.
In October 2010, the government of the DRC announced the conclusion of the review
of Tenke Fungurume Mining’s (TFM) contracts, and confirmed that TFM’s existing
mining contracts are in good standing and acknowledged the rights and benefits
granted under those contracts. In connection with the review, TFM made several
commitments that have been reflected in amendments to its mining contracts.
Operational Overview
2010 2011e
Cash Unit Costs (1)
Site Production & Delivery $ 1.40 $ 1.41
By-product Credits (0.58) (0.65)
Royalties 0.08 0.09
Unit Net Cash Costs $ 0.90 $ 0.85
(1) Estimates assume average prices of $4.25/lb for copper and $14/lb for cobalt for 2011. Quarterly unit costs will vary significantly with quarterly metal sales volumes.
Unit net cash costs for 2011 would change by approximately $0.09/lb for each $2/lb change in cobalt.Note: e=estimate.
Africa Unit Production Costs per lb of copper
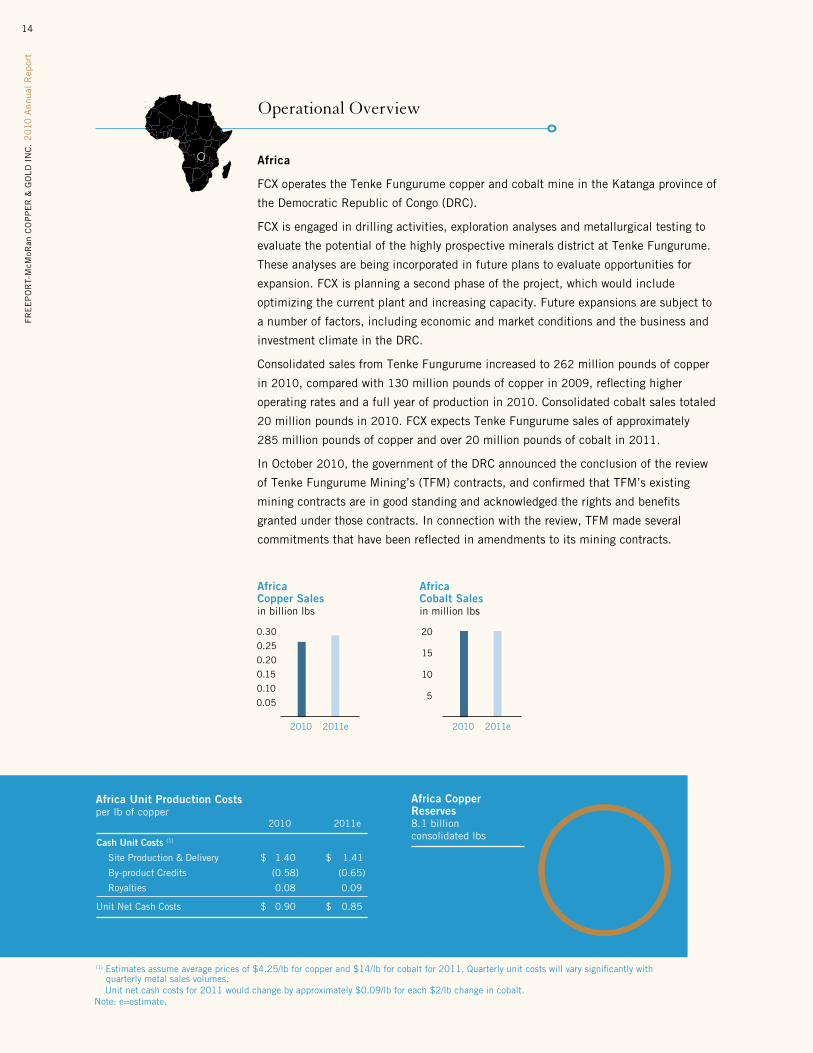
Africa Copper Reserves 8.1 billion consolidated lbs
Africa Copper Sales in billion lbs
2011e2010
0.15
0.30
0.20
0.25
0.10
0.05
Africa Cobalt Sales in million lbs
2011e2010
10
20
15
5
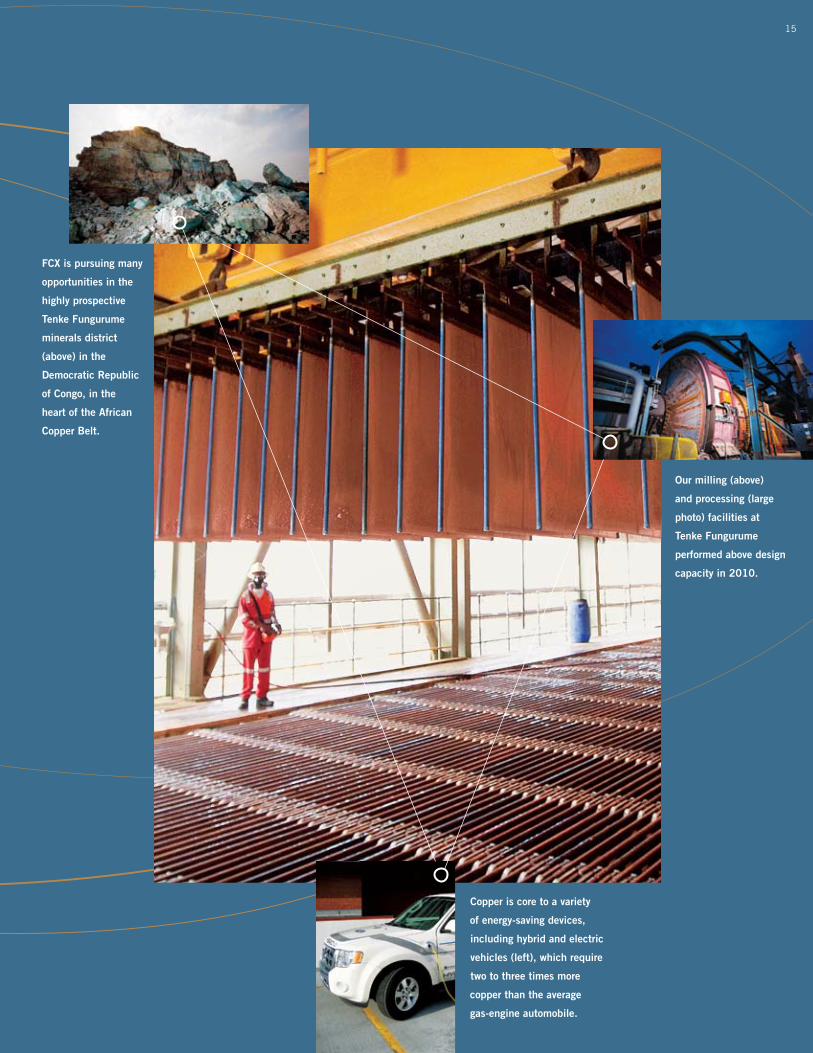
15
Our milling (above)
and processing (large
photo) facilities at
Tenke Fungurume
performed above design
capacity in 2010.
Copper is core to a variety
of energy-saving devices,
including hybrid and electric
vehicles (left), which require
two to three times more
copper than the average
gas-engine automobile.
FCX is pursuing many
opportunities in the
highly prospective
Tenke Fungurume
minerals district
(above) in the
Democratic Republic
of Congo, in the
heart of the African
Copper Belt.
16
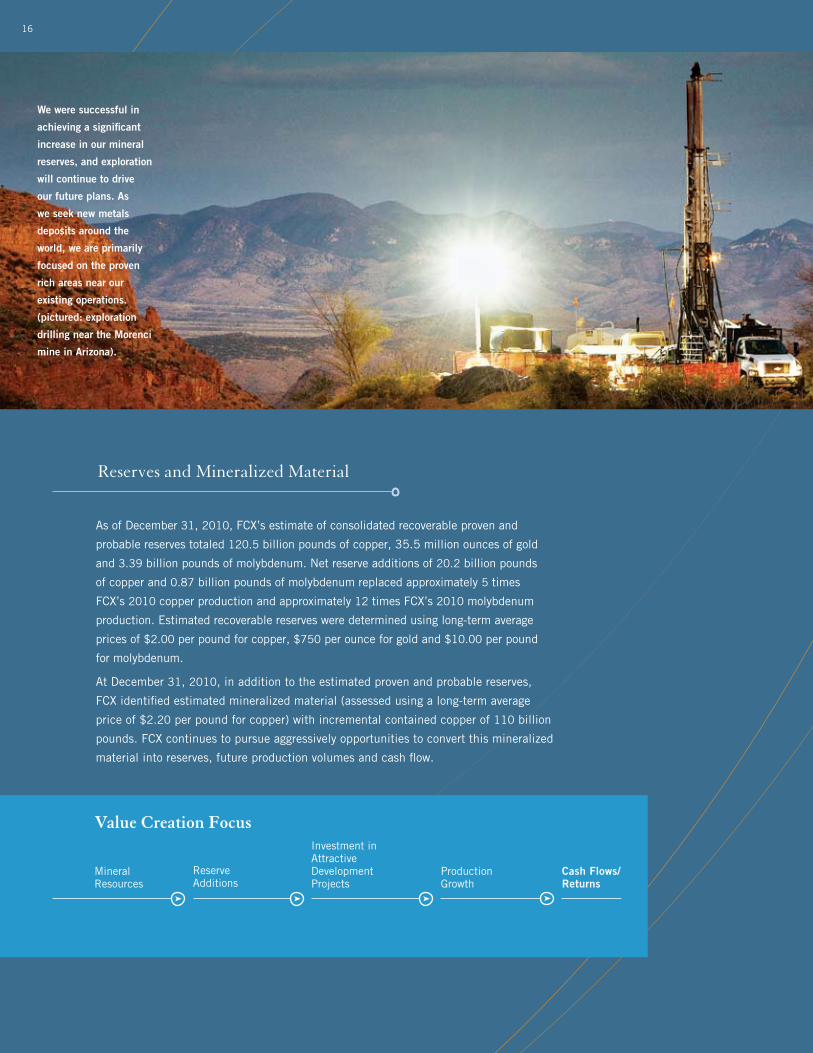
As of December 31, 2010, FCX’s estimate of consolidated recoverable proven and
probable reserves totaled 120.5 billion pounds of copper, 35.5 million ounces of gold
and 3.39 billion pounds of molybdenum. Net reserve additions of 20.2 billion pounds
of copper and 0.87 billion pounds of molybdenum replaced approximately 5 times
FCX’s 2010 copper production and approximately 12 times FCX’s 2010 molybdenum
production. Estimated recoverable reserves were determined using long-term average
prices of $2.00 per pound for copper, $750 per ounce for gold and $10.00 per pound
for molybdenum.
At December 31, 2010, in addition to the estimated proven and probable reserves,
FCX identified estimated mineralized material (assessed using a long-term average
price of $2.20 per pound for copper) with incremental contained copper of 110 billion
pounds. FCX continues to pursue aggressively opportunities to convert this mineralized
material into reserves, future production volumes and cash flow.
Reserves and Mineralized Material
Investment in Attractive Development Projects
Cash Flows/Returns
Mineral Resources
Reserve Additions
Production Growth
Value Creation Focus
We were successful in
achieving a significant
increase in our mineral
reserves, and exploration
will continue to drive
our future plans. As
we seek new metals
deposits around the
world, we are primarily
focused on the proven
rich areas near our
existing operations.
(pictured: exploration
drilling near the Morenci
mine in Arizona).
FRE
EP
OR
T-McM
oRan C
OP
PE
R &
GO
LD IN
C. 2
010 A
nnual Rep
ort17
FCX directly contributes to a sustainable future by providing metals that literally connect
the world’s infrastructure. As a leading international mining company, FCX understands the
importance of producing these metals in a safe and socially responsible manner. As the
earth’s population continues to grow along with the global standard of living, FCX expects
the demand for its metals to similarly increase. This will challenge our ability to reduce or
mitigate certain impacts, such as greenhouse gas emissions and water consumption, as
production expands.
FCX evaluates opportunities to minimize environmental impacts and to be a catalyst for
sustainability in communities where it operates. Guiding FCX in meeting this challenge
is the International Council on Mining and Metals (ICMM). As a founding member, FCX
endorses the ICMM’s Sustainable Development Framework, including its 10 Sustainable
Development Principles. In addition, FCX has established and reports against its progress
on company-wide sustainable development performance targets that address issues
identified by internal and external stakeholders. FCX reports its sustainability performance
according to the Global Reporting Initiative and FCX’s 2010 Working Toward Sustainable
Development report will be available on FCX’s website at www.fcx.com upon completion of
third-party assurance.
Sustainable Development
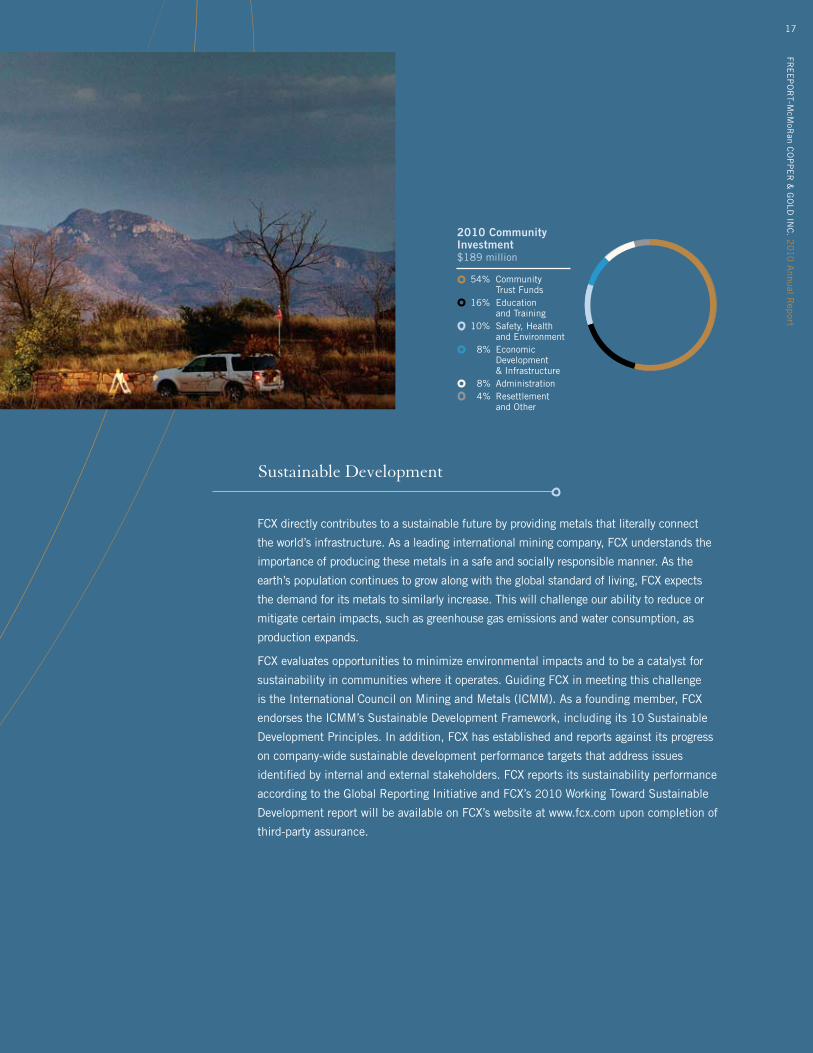
2010 Community Investment $189 million
54% Community Trust Funds 16% Education and Training 10% Safety, Health and Environment 8% Economic Development & Infrastructure 8% Administration 4% Resettlement and Other
FRE
EP
OR
T-M
cMoR
an C
OP
PE
R &
GO
LD I
NC
. 2
010
Ann
ual
Rep
ort
18
BOARD COMMITTEES:
1) Audit Committee 2) Corporate Personnel Committee3) Nominating and Corporate Governance Committee4) Public Policy Committee
MANAGEMENT
James R. Moffett Chairman of the Board
Richard C. Adkerson President and Chief Executive Officer
Michael J. Arnold Executive Vice President and Chief Administrative Officer
Kathleen L. Quirk Executive Vice President, Chief Financial Officer and Treasurer
OPERATIONS
Harry M. “Red” Conger President – Freeport-McMoRan Americas
Mark J. Johnson President – Freeport-McMoRan Indonesia
Armando Mahler President Director – PT Freeport Indonesia
Richard E. Coleman President – Freeport-McMoRan Mining Company
Phillip S. Brumit President – Freeport-McMoRan Africa
David H. Thornton President – Climax Molybdenum Co.
MARKETING
Javier Targhetta President – Atlantic Copper, S.A. Senior Vice President – FCX (Concentrates)
Stephen T. Higgins President – Freeport-McMoRan Sales Company Inc. Vice President – FCX (Cathode and Rod)
FINANCE AND ADMINISTRATION
L. Richards McMillan, II Senior Vice President and General Counsel
W. Russell King Senior Vice President – International Relations and Federal Government Affairs
C. Donald Whitmire, Jr. Vice President and Controller – Financial Reporting
Internal Auditors Deloitte & Touche LLP
BOARD OF DIRECTORS
James R. Moffett Chairman of the Board Freeport-McMoRan Copper & Gold Inc.
Richard C. Adkerson President and Chief Executive Officer Freeport-McMoRan Copper & Gold Inc.
Robert J. Allison, Jr. (2, 3, 4) Director and Chairman Emeritus Anadarko Petroleum Corporation
Robert A. Day (1, 3) Chairman of the Board and Chief Executive Officer Trust Company of the West
Gerald J. Ford (1, 3) Chairman of the Board Diamond-A Ford Corp.
H. Devon Graham, Jr. (1, 2) President R.E. Smith Interests
General Charles C. Krulak (2, 4) Former Commandant United States Marine Corps Retired Executive Vice Chairman and Chief Administration Officer, MBNA Corp.
Bobby Lee Lackey (2, 4) Consultant
Jon C. Madonna (1) Retired Chairman and Chief Executive Officer, KPMG LLP
Dustan E. McCoy (4) Chairman and Chief Executive Officer Brunswick Corporation
B. M. Rankin, Jr. (4) Vice Chairman of the Board Freeport-McMoRan Copper & Gold Inc. Private Investor
Stephen H. Siegele (1, 4) Private Investor
Director Emeritus Dr. Henry A. Kissinger Chairman Kissinger Associates, Inc.
ADVISORY DIRECTORS
J. Bennett Johnston Chairman Johnston & Associates, LLC and Johnston Development Co. LLC Former United States Senator
Gabrielle K. McDonald Judge, Iran-United States Claims Tribunal Special Counsel on Human Rights to Freeport-McMoRan Copper & Gold Inc.
J. Stapleton Roy Director Kissinger Institute on China and the United States Former United States Ambassador to Indonesia
Dr. J. Taylor Wharton Retired Special Assistant to the President for Patient Affairs Retired Professor, Gynecologic Oncology The University of Texas M.D. Anderson Cancer Center
Board of Directors and Management
FINANCIAL AND OPERATING INFORMATION
TABLE OF CONTENTS
20 Selected Financial and Operating Data
23 Management’s Discussion and Analysis
63 Report of Independent Registered Public Accounting Firm
64 Management’s Report on Internal Control Over Financial Reporting
65 Report of Independent Registered Public Accounting Firm
66 Consolidated Statements of Operations
67 Consolidated Statements of Cash Flows
68 Consolidated Balance Sheets
69 Consolidated Statements of Equity
70 Notes to Consolidated Financial Statements
19
SELECTED FINANCIAL AND OPERATING DATA
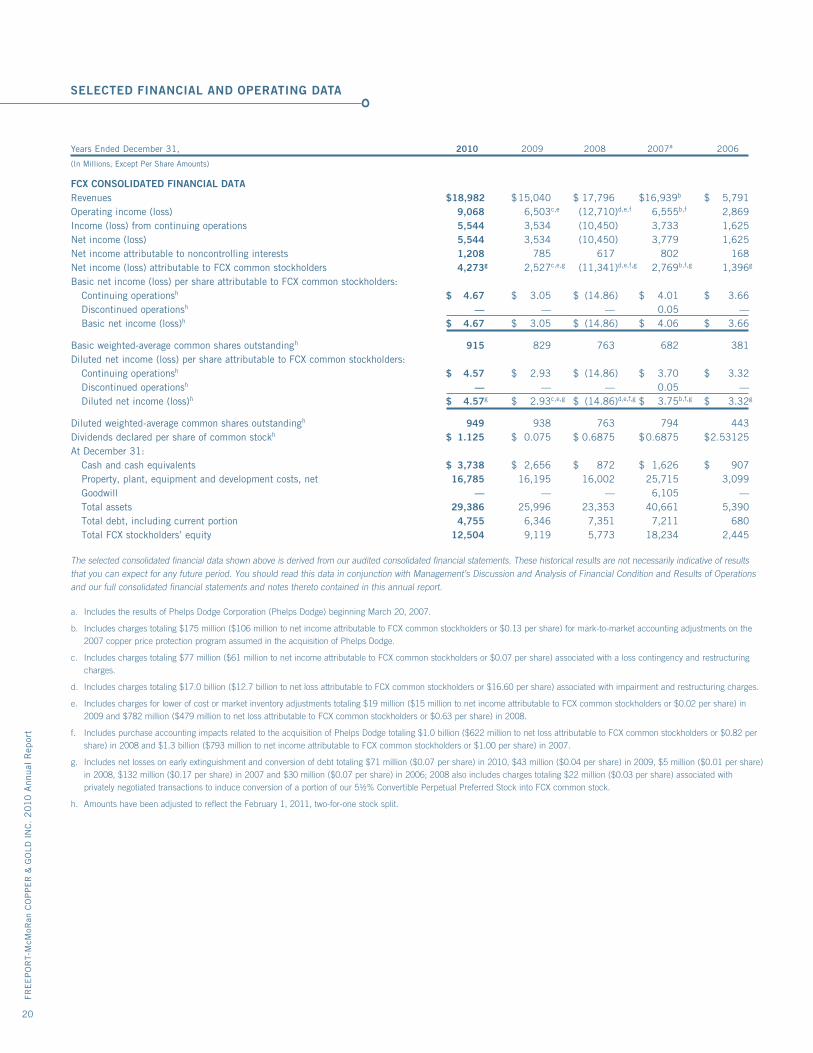
Years Ended December 31, 2010 2009 2008 2007a 2006
(In Millions, Except Per Share Amounts)
FCX CONSOLIDATED FINANCIAL DATA Revenues $ 18,982 $ 15,040 $ 17,796 $ 16,939b $ 5,791Operating income (loss) 9,068 6,503c,e (12,710)d,e,f 6,555b,f 2,869Income (loss) from continuing operations 5,544 3,534 (10,450) 3,733 1,625Net income (loss) 5,544 3,534 (10,450) 3,779 1,625Net income attributable to noncontrolling interests 1,208 785 617 802 168Net income (loss) attributable to FCX common stockholders 4,273g 2,527c,e,g (11,341)d,e,f,g 2,769b,f,g 1,396g
Basic net income (loss) per share attributable to FCX common stockholders: Continuing operationsh $ 4.67 $ 3.05 $ (14.86) $ 4.01 $ 3.66 Discontinued operationsh — — — 0.05 — Basic net income (loss)h $ 4.67 $ 3.05 $ (14.86) $ 4.06 $ 3.66
Basic weighted-average common shares outstandingh 915 829 763 682 381Diluted net income (loss) per share attributable to FCX common stockholders: Continuing operationsh $ 4.57 $ 2.93 $ (14.86) $ 3.70 $ 3.32 Discontinued operationsh — — — 0.05 — Diluted net income (loss)h $ 4.57g $ 2.93c,e,g $ (14.86)d,e,f,g $ 3.75b,f,g $ 3.32g
Diluted weighted-average common shares outstandingh 949 938 763 794 443Dividends declared per share of common stockh $ 1.125 $ 0.075 $ 0.6875 $ 0.6875 $ 2.53125At December 31: Cash and cash equivalents $ 3,738 $ 2,656 $ 872 $ 1,626 $ 907 Property, plant, equipment and development costs, net 16,785 16,195 16,002 25,715 3,099 Goodwill — — — 6,105 — Total assets 29,386 25,996 23,353 40,661 5,390 Total debt, including current portion 4,755 6,346 7,351 7,211 680 Total FCX stockholders’ equity 12,504 9,119 5,773 18,234 2,445
The selected consolidated financial data shown above is derived from our audited consolidated financial statements. These historical results are not necessarily indicative of results that you can expect for any future period. You should read this data in conjunction with Management’s Discussion and Analysis of Financial Condition and Results of Operations and our full consolidated financial statements and notes thereto contained in this annual report.
a. Includes the results of Phelps Dodge Corporation (Phelps Dodge) beginning March 20, 2007.
b. Includes charges totaling $175 million ($106 million to net income attributable to FCX common stockholders or $0.13 per share) for mark-to-market accounting adjustments on the 2007 copper price protection program assumed in the acquisition of Phelps Dodge.
c. Includes charges totaling $77 million ($61 million to net income attributable to FCX common stockholders or $0.07 per share) associated with a loss contingency and restructuring charges.
d. Includes charges totaling $17.0 billion ($12.7 billion to net loss attributable to FCX common stockholders or $16.60 per share) associated with impairment and restructuring charges.
e. Includes charges for lower of cost or market inventory adjustments totaling $19 million ($15 million to net income attributable to FCX common stockholders or $0.02 per share) in 2009 and $782 million ($479 million to net loss attributable to FCX common stockholders or $0.63 per share) in 2008.
f. Includes purchase accounting impacts related to the acquisition of Phelps Dodge totaling $1.0 billion ($622 million to net loss attributable to FCX common stockholders or $0.82 per share) in 2008 and $1.3 billion ($793 million to net income attributable to FCX common stockholders or $1.00 per share) in 2007.
g. Includes net losses on early extinguishment and conversion of debt totaling $71 million ($0.07 per share) in 2010, $43 million ($0.04 per share) in 2009, $5 million ($0.01 per share) in 2008, $132 million ($0.17 per share) in 2007 and $30 million ($0.07 per share) in 2006; 2008 also includes charges totaling $22 million ($0.03 per share) associated with privately negotiated transactions to induce conversion of a portion of our 5½% Convertible Perpetual Preferred Stock into FCX common stock.
h. Amounts have been adjusted to reflect the February 1, 2011, two-for-one stock split.
FRE
EP
OR
T-M
cMoR
an C
OP
PE
R &
GO
LD I
NC
. 2
010
Ann
ual
Rep
ort
20
SELECTED FINANCIAL AND OPERATING DATA
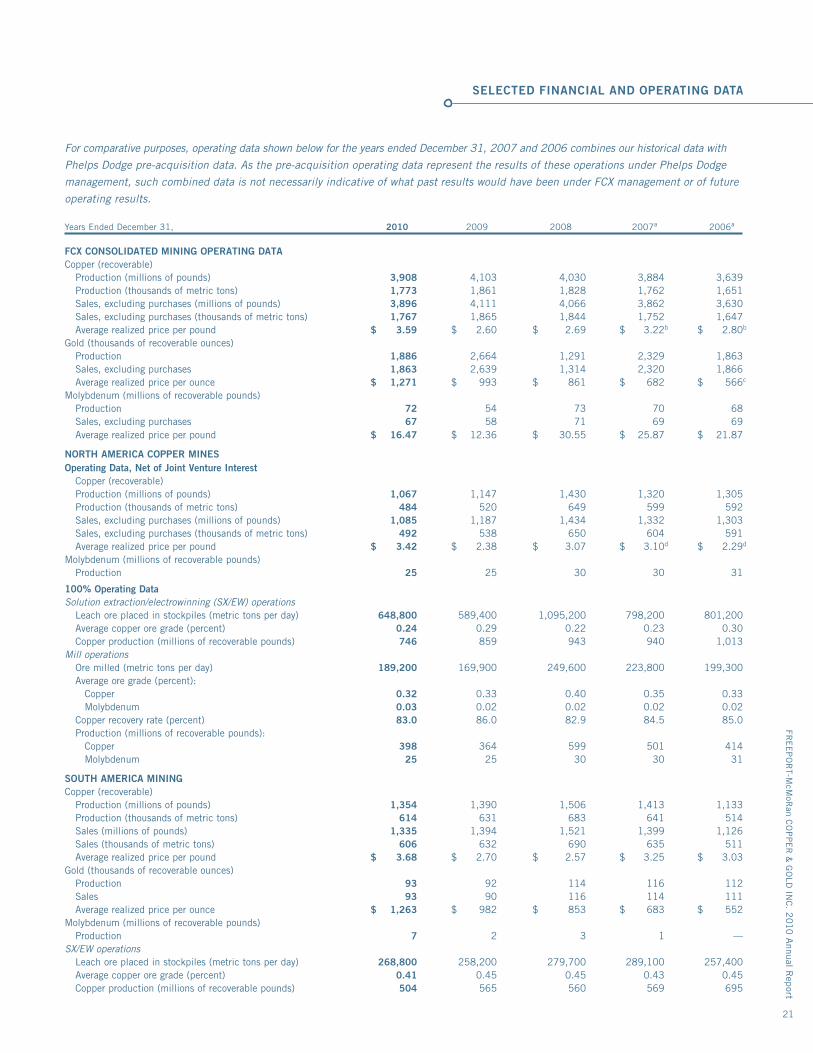
For comparative purposes, operating data shown below for the years ended December 31, 2007 and 2006 combines our historical data with
Phelps Dodge pre-acquisition data. As the pre-acquisition operating data represent the results of these operations under Phelps Dodge
management, such combined data is not necessarily indicative of what past results would have been under FCX management or of future
operating results.
Years Ended December 31, 2010 2009 2008 2007a 2006a
FCX CONSOLIDATED MINING OPERATING DATACopper (recoverable) Production (millions of pounds) 3,908 4,103 4,030 3,884 3,639 Production (thousands of metric tons) 1,773 1,861 1,828 1,762 1,651 Sales, excluding purchases (millions of pounds) 3,896 4,111 4,066 3,862 3,630 Sales, excluding purchases (thousands of metric tons) 1,767 1,865 1,844 1,752 1,647 Average realized price per pound $ 3.59 $ 2.60 $ 2.69 $ 3.22b $ 2.80b
Gold (thousands of recoverable ounces) Production 1,886 2,664 1,291 2,329 1,863 Sales, excluding purchases 1,863 2,639 1,314 2,320 1,866 Average realized price per ounce $ 1,271 $ 993 $ 861 $ 682 $ 566c
Molybdenum (millions of recoverable pounds) Production 72 54 73 70 68 Sales, excluding purchases 67 58 71 69 69 Average realized price per pound $ 16.47 $ 12.36 $ 30.55 $ 25.87 $ 21.87
NORTH AMERICA COPPER MINESOperating Data, Net of Joint Venture Interest Copper (recoverable) Production (millions of pounds) 1,067 1,147 1,430 1,320 1,305 Production (thousands of metric tons) 484 520 649 599 592 Sales, excluding purchases (millions of pounds) 1,085 1,187 1,434 1,332 1,303 Sales, excluding purchases (thousands of metric tons) 492 538 650 604 591 Average realized price per pound $ 3.42 $ 2.38 $ 3.07 $ 3.10d $ 2.29d
Molybdenum (millions of recoverable pounds) Production 25 25 30 30 31
100% Operating DataSolution extraction/electrowinning (SX/EW) operations Leach ore placed in stockpiles (metric tons per day) 648,800 589,400 1,095,200 798,200 801,200 Average copper ore grade (percent) 0.24 0.29 0.22 0.23 0.30 Copper production (millions of recoverable pounds) 746 859 943 940 1,013Mill operations Ore milled (metric tons per day) 189,200 169,900 249,600 223,800 199,300 Average ore grade (percent): Copper 0.32 0.33 0.40 0.35 0.33 Molybdenum 0.03 0.02 0.02 0.02 0.02 Copper recovery rate (percent) 83.0 86.0 82.9 84.5 85.0 Production (millions of recoverable pounds): Copper 398 364 599 501 414 Molybdenum 25 25 30 30 31
SOUTH AMERICA MININGCopper (recoverable) Production (millions of pounds) 1,354 1,390 1,506 1,413 1,133 Production (thousands of metric tons) 614 631 683 641 514 Sales (millions of pounds) 1,335 1,394 1,521 1,399 1,126 Sales (thousands of metric tons) 606 632 690 635 511 Average realized price per pound $ 3.68 $ 2.70 $ 2.57 $ 3.25 $ 3.03Gold (thousands of recoverable ounces) Production 93 92 114 116 112 Sales 93 90 116 114 111 Average realized price per ounce $ 1,263 $ 982 $ 853 $ 683 $ 552Molybdenum (millions of recoverable pounds) Production 7 2 3 1 —SX/EW operations Leach ore placed in stockpiles (metric tons per day) 268,800 258,200 279,700 289,100 257,400 Average copper ore grade (percent) 0.41 0.45 0.45 0.43 0.45 Copper production (millions of recoverable pounds) 504 565 560 569 695
FRE
EP
OR
T-McM
oRan C
OP
PE
R &
GO
LD IN
C. 2
010 A
nnual Rep
ort
21
Years Ended December 31, 2010 2009 2008 2007a 2006a
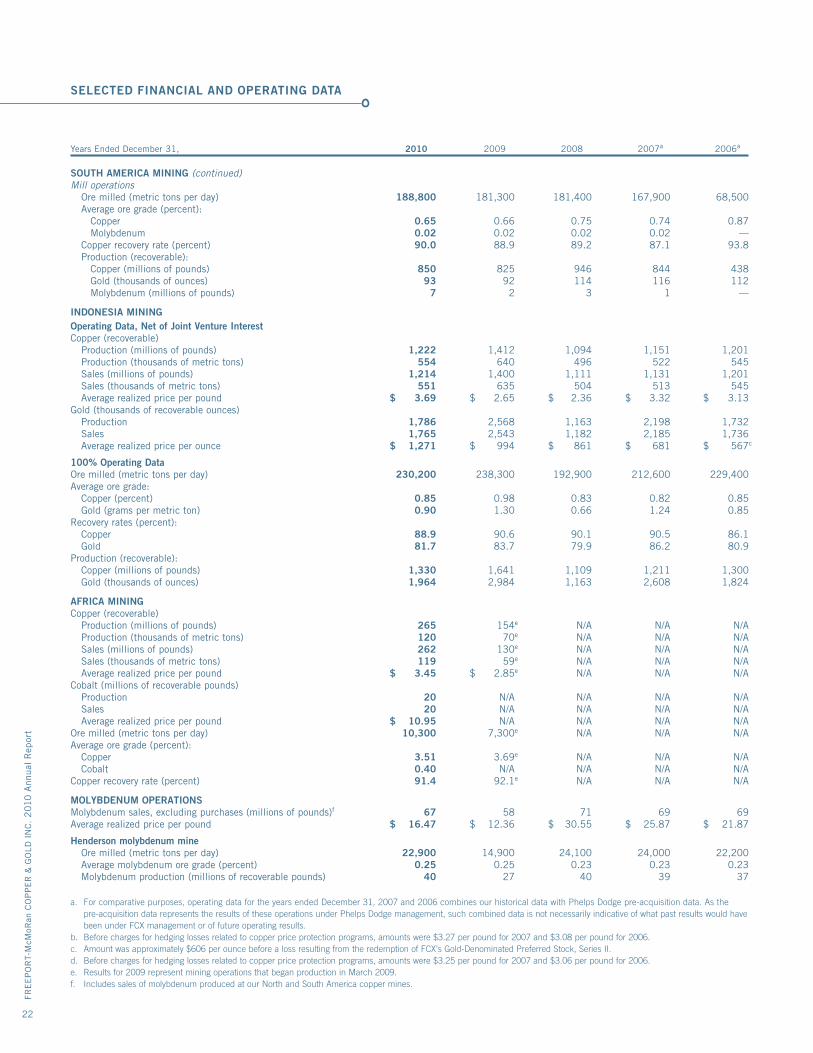
SOUTH AMERICA MINING (continued)Mill operations Ore milled (metric tons per day) 188,800 181,300 181,400 167,900 68,500 Average ore grade (percent): Copper 0.65 0.66 0.75 0.74 0.87 Molybdenum 0.02 0.02 0.02 0.02 — Copper recovery rate (percent) 90.0 88.9 89.2 87.1 93.8 Production (recoverable): Copper (millions of pounds) 850 825 946 844 438 Gold (thousands of ounces) 93 92 114 116 112 Molybdenum (millions of pounds) 7 2 3 1 —
INDONESIA MININGOperating Data, Net of Joint Venture InterestCopper (recoverable) Production (millions of pounds) 1,222 1,412 1,094 1,151 1,201 Production (thousands of metric tons) 554 640 496 522 545 Sales (millions of pounds) 1,214 1,400 1,111 1,131 1,201 Sales (thousands of metric tons) 551 635 504 513 545 Average realized price per pound $ 3.69 $ 2.65 $ 2.36 $ 3.32 $ 3.13Gold (thousands of recoverable ounces) Production 1,786 2,568 1,163 2,198 1,732 Sales 1,765 2,543 1,182 2,185 1,736 Average realized price per ounce $ 1,271 $ 994 $ 861 $ 681 $ 567c
100% Operating DataOre milled (metric tons per day) 230,200 238,300 192,900 212,600 229,400Average ore grade: Copper (percent) 0.85 0.98 0.83 0.82 0.85 Gold (grams per metric ton) 0.90 1.30 0.66 1.24 0.85Recovery rates (percent): Copper 88.9 90.6 90.1 90.5 86.1 Gold 81.7 83.7 79.9 86.2 80.9Production (recoverable): Copper (millions of pounds) 1,330 1,641 1,109 1,211 1,300 Gold (thousands of ounces) 1,964 2,984 1,163 2,608 1,824
AFRICA MININGCopper (recoverable) Production (millions of pounds) 265 154e N/A N/A N/A Production (thousands of metric tons) 120 70e N/A N/A N/A Sales (millions of pounds) 262 130e N/A N/A N/A Sales (thousands of metric tons) 119 59e N/A N/A N/A Average realized price per pound $ 3.45 $ 2.85e N/A N/A N/ACobalt (millions of recoverable pounds) Production 20 N/A N/A N/A N/A Sales 20 N/A N/A N/A N/A Average realized price per pound $ 10.95 N/A N/A N/A N/AOre milled (metric tons per day) 10,300 7,300e N/A N/A N/AAverage ore grade (percent): Copper 3.51 3.69e N/A N/A N/A Cobalt 0.40 N/A N/A N/A N/ACopper recovery rate (percent) 91.4 92.1e N/A N/A N/A
MOLYBDENUM OPERATIONSMolybdenum sales, excluding purchases (millions of pounds)f 67 58 71 69 69Average realized price per pound $ 16.47 $ 12.36 $ 30.55 $ 25.87 $ 21.87
Henderson molybdenum mine Ore milled (metric tons per day) 22,900 14,900 24,100 24,000 22,200 Average molybdenum ore grade (percent) 0.25 0.25 0.23 0.23 0.23 Molybdenum production (millions of recoverable pounds) 40 27 40 39 37
a. For comparative purposes, operating data for the years ended December 31, 2007 and 2006 combines our historical data with Phelps Dodge pre-acquisition data. As the pre-acquisition data represents the results of these operations under Phelps Dodge management, such combined data is not necessarily indicative of what past results would have been under FCX management or of future operating results.
b. Before charges for hedging losses related to copper price protection programs, amounts were $3.27 per pound for 2007 and $3.08 per pound for 2006.c. Amount was approximately $606 per ounce before a loss resulting from the redemption of FCX’s Gold-Denominated Preferred Stock, Series II.d. Before charges for hedging losses related to copper price protection programs, amounts were $3.25 per pound for 2007 and $3.06 per pound for 2006.e. Results for 2009 represent mining operations that began production in March 2009.f. Includes sales of molybdenum produced at our North and South America copper mines.
FRE
EP
OR
T-M
cMoR
an C
OP
PE
R &
GO
LD I
NC
. 2
010
Ann
ual
Rep
ort
22
SELECTED FINANCIAL AND OPERATING DATA
MANAGEMENT’S DISCUSSION AND ANALYSIS
OVERVIEW
In Management’s Discussion and Analysis of Financial Condition and
Results of Operations, “we,” “us” and “our” refer to Freeport-
McMoRan Copper & Gold Inc. (FCX) and its consolidated subsidiaries.
The results of operations reported and summarized below
are not necessarily indicative of future operating results (refer to
“Cautionary Statement” for further discussion). References to
“Notes” are Notes included in our Notes to Consolidated
Financial Statements. Throughout Management’s Discussion and
Analysis of Financial Condition and Results of Operations, all
references to earnings or losses per share are on a diluted basis,
unless otherwise noted, and have been retroactively adjusted to
reflect the February 1, 2011, two-for-one stock split.
We are one of the world’s largest copper, gold and molybdenum
mining companies in terms of reserves and production. Our portfolio
of assets includes the Grasberg minerals district in Indonesia,
significant mining operations in North and South America, and the
Tenke Fungurume (Tenke) minerals district in the Democratic
Republic of Congo (DRC). The Grasberg minerals district contains the
largest single recoverable copper reserve and the largest single gold
reserve of any mine in the world based on the latest available reserve
data provided by third-party industry consultants. We also operate
Atlantic Copper, our wholly owned copper smelting and refining unit
in Spain.
We have significant reserves, resources and future development
opportunities within our portfolio of assets. Since the merger with
Phelps Dodge Corporation (Phelps Dodge) in 2007, we have added
42.9 billion pounds of proven and probable copper reserves,
including 20.2 billion pounds during 2010, and 1.72 billion pounds
of proven and probable molybdenum reserves, including 0.87 billion
pounds during 2010. At December 31, 2010, our estimated
consolidated recoverable proven and probable reserves totaled
120.5 billion pounds of copper, which were determined using a
long-term average copper price of $2.00 per pound (refer to “Critical
Accounting Estimates — Mineral Reserves” for further discussion).
During 2010, 60 percent of our consolidated copper production
was from our Grasberg, Morenci and Cerro Verde mines. We also
produce gold, primarily at the Grasberg minerals district in Indonesia,
which accounted for 95 percent of our consolidated gold production
for 2010. For 2010, 56 percent of our consolidated molybdenum
production was from the Henderson molybdenum mine, 34 percent
was produced at certain of our North America copper mines and
10 percent was produced at our Cerro Verde mine in Peru. Refer to
“Operations” for further discussion of our mining operations.
We are increasing near-term production at several of our copper
mines and are undertaking major projects, including the development
of the El Abra sulfide reserves and the underground ore bodies at
Grasberg. We are also advancing development activities at the Climax
molybdenum mine. Studies are under way to evaluate a large-scale
concentrator expansion at Cerro Verde, a major mill project at
El Abra, various mill projects to process significant sulfide ore in
North America and staged expansion options at Tenke. The
advancement of these studies is designed to position us to invest
in production growth within our existing portfolio of assets. Refer to
“Operations” for further discussion of our current operating and
development activities.
Our results for the year 2010, compared with 2009, primarily
reflected higher average realized metals prices, partially offset by
lower copper and gold sales volumes (refer to “Consolidated Results”
for further discussion of our consolidated financial results for the
years ended December 31, 2010, and 2009).
At December 31, 2010, we had $3.7 billion in consolidated cash
and $4.8 billion in long-term debt. Since January 1, 2009, we
repaid approximately $2.6 billion in debt (refer to “Capital Resources
and Liquidity” for further discussion). At current copper prices
we expect to produce substantial operating cash flows in 2011, and
plan to focus on using our cash to invest in our development
projects and return cash to shareholders through common stock
dividends and/or share repurchases. On February 24, 2011, we
announced our intent to redeem the remaining $1.1 billion of the
8.25% Senior Notes due 2015 on April 1, 2011. We expect to
record a loss on early extinguishment of debt of approximately
$56 million (approximately $49 million to net income attributable
to FCX common stockholders) in second-quarter 2011 in
connection with this redemption. We have no significant debt
maturities in the near term; however, we may consider additional
opportunities to prepay debt in advance of scheduled maturities.
In December 2010, our Board of Directors authorized a
$0.50 per share supplemental common stock dividend paid on
December 30, 2010, and a two-for-one common stock split
effected on February 1, 2011 (refer to Note 11 for further
discussion). All references to shares of our common stock, per
share amounts and dividends on common stock herein have been
retroactively adjusted to reflect the two-for-one stock split.
In October 2010, the government of the DRC announced the
conclusion of the review of Tenke Fungurume Mining S.A.R.L.’s
(TFM) contracts, confirmed that TFM’s existing mining contracts
are in good standing and acknowledged the rights and benefits
granted under those contracts. In connection with the review, TFM
made several commitments that have been reflected in amendments
to its mining contracts. In December 2010, the addenda to
TFM’s Amended and Restated Mining Convention and Amended
and Restated Shareholders’ Agreement were signed by the parties
and are pending a Presidential Decree. TFM’s existing mining
contracts will be in effect until the Presidential Decree is obtained.
After giving effect to the amendments and obtaining approval of the
FRE
EP
OR
T-McM
oRan C
OP
PE
R &
GO
LD IN
C. 2
010 A
nnual Rep
ort
23
MANAGEMENT’S DISCUSSION AND ANALYSIS
modification to TFM’s bylaws, our effective ownership interest
in the project will be 56.0 percent, compared to our
previous ownership interest of 57.75 percent (refer to Note 14
for further discussion).
OUTLOOK
We view the long-term outlook for our business positively, supported
by limitations on supplies of copper and by the requirements
for copper in the world’s economy, and will continue to adjust our
operating strategy as market conditions change.
Our financial results can vary significantly as a result of
fluctuations in the market prices of copper and, to a lesser extent,
gold and molybdenum. World market prices for these commodities
have fluctuated historically and are affected by numerous
factors beyond our control. Because we cannot control the price of
our products, the key measures that management focuses on in
operating our business are sales volumes, unit net cash costs and
operating cash flow. Discussion of the outlook for each of these
measures follows.
Sales Volumes. Following are our actual consolidated sales volumes
for 2010 and our projected consolidated sales volumes for 2011:
2010 2011 (Actual) (Projected)
Copper (billions of recoverable pounds): North America copper mines 1.1 1.2 South America mining 1.3 1.3 Indonesia mining 1.2 1.0 Africa mining 0.3 0.3 3.9 3.9a
Gold (millions of recoverable ounces): Indonesia mining 1.8 1.3 South America mining 0.1 0.1 1.9 1.4
Molybdenum (millions of recoverable pounds)b 67 70
a. Represents the sum of projected copper sales volumes before rounding.b. Includes sales of molybdenum produced at our North and South America
copper mines.
Consolidated sales volumes for 2011 are estimated to approximate
3.85 billion pounds of copper, 1.4 million ounces of gold
and 70 million pounds of molybdenum. Lower copper sales from
Indonesia as a result of mining in a lower grade section of the
Grasberg open pit are expected to be offset by increases from North
America primarily reflecting increased mining rates at Morenci.
Lower estimated gold sales volumes for 2011 are a result of lower ore
grades at Grasberg. Our projected sales volumes for 2011 depend
on the achievement of targeted mining rates, the successful
operation of production facilities, the impact of weather conditions
and other factors.
Unit Net Cash Costs. Assuming average prices of $1,350 per
ounce of gold and $15 per pound of molybdenum for 2011, and
achievement of current 2011 sales volume and cost estimates,
we estimate our consolidated unit net cash costs (net of by-product
credits) for our copper mining operations would average
approximately $1.10 per pound in 2011. The impact of price changes
in 2011 on consolidated unit net cash costs would approximate
$0.02 per pound for each $50 per ounce change in the average
price of gold and for each $2 per pound change in the average price
of molybdenum. Consolidated unit net cash costs in 2011 are
expected to be higher than consolidated unit net cash costs of
$0.79 per pound of copper in 2010 primarily because of the impact
of higher unit net cash costs at Grasberg associated with lower
copper and gold volumes and higher input costs. Refer to
“Consolidated Results — Production and Delivery Costs” for further
discussion of consolidated production and delivery costs.
Operating Cash Flows. Our operating cash flows vary with prices
realized from copper, gold and molybdenum sales, our sales volumes,
production costs, income taxes and other working capital changes
and other factors. Based on the above projected consolidated sales
volumes and unit net cash costs for 2011, and assuming average
prices of $4.25 per pound of copper, $1,350 per ounce of gold and
$15 per pound of molybdenum in 2011, we estimate consolidated
operating cash flows will approximate $8 billion in 2011, net of an
estimated $100 million for working capital requirements. In addition
to projected working capital requirements, our estimate of operating
cash flow for the year 2011 is also net of estimated taxes of
$3.5 billion (refer to “Consolidated Results — (Provision for) Benefit
from Income Taxes” for discussion of our projected annual
consolidated effective tax rate for 2011). The impact of price changes
in 2011 on operating cash flows would approximate $150 million
for each $0.05 per pound change in the average price of copper,
$55 million for each $50 per ounce change in the average price
of gold and $80 million for each $2 per pound change in the average
price of molybdenum.
COPPER, GOLD AND MOLYBDENUM MARKETS
World prices for copper, gold and molybdenum can fluctuate
significantly. During the period from January 2001 through
February 11, 2011, the London Metal Exchange (LME) spot copper
price varied from a low of $0.60 per pound in 2001 to a new record
high of $4.60 per pound in February 2011; the London gold price
fluctuated from a low of $256 per ounce in 2001 to a new record
high of $1,421 per ounce in November 2010; and the Metals Week
Molybdenum Dealer Oxide weekly average price ranged from a low
of $2.19 per pound in 2001 to a high of $39.25 per pound in 2005.
Copper, gold and molybdenum prices are affected by numerous
factors beyond our control as described further in our “Risk Factors”
contained in Part I, Item 1A of our Form 10-K for the year ended
December 31, 2010.
FRE
EP
OR
T-M
cMoR
an C
OP
PE
R &
GO
LD I
NC
. 2
010
Ann
ual
Rep
ort
24
MANAGEMENT’S DISCUSSION AND ANALYSIS
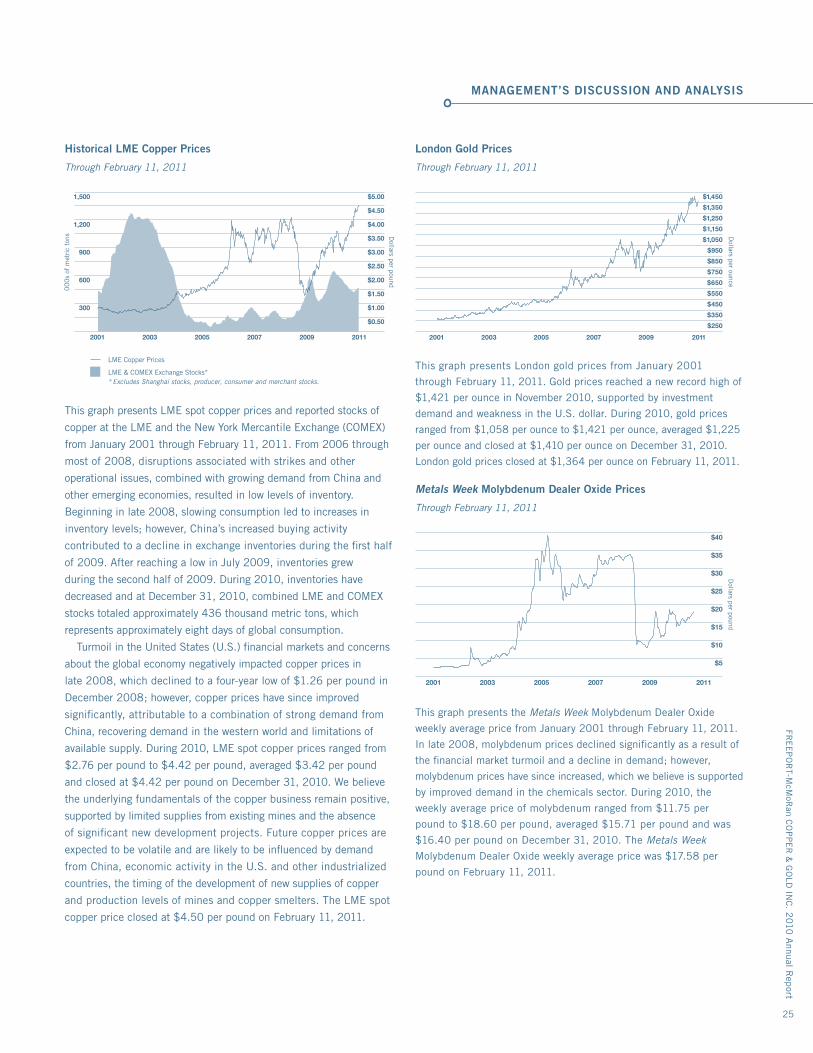
Historical LME Copper Prices
Through February 11, 2011
This graph presents LME spot copper prices and reported stocks of
copper at the LME and the New York Mercantile Exchange (COMEX)
from January 2001 through February 11, 2011. From 2006 through
most of 2008, disruptions associated with strikes and other
operational issues, combined with growing demand from China and
other emerging economies, resulted in low levels of inventory.
Beginning in late 2008, slowing consumption led to increases in
inventory levels; however, China’s increased buying activity
contributed to a decline in exchange inventories during the first half
of 2009. After reaching a low in July 2009, inventories grew
during the second half of 2009. During 2010, inventories have
decreased and at December 31, 2010, combined LME and COMEX
stocks totaled approximately 436 thousand metric tons, which
represents approximately eight days of global consumption.
Turmoil in the United States (U.S.) financial markets and concerns
about the global economy negatively impacted copper prices in
late 2008, which declined to a four-year low of $1.26 per pound in
December 2008; however, copper prices have since improved
significantly, attributable to a combination of strong demand from
China, recovering demand in the western world and limitations of
available supply. During 2010, LME spot copper prices ranged from
$2.76 per pound to $4.42 per pound, averaged $3.42 per pound
and closed at $4.42 per pound on December 31, 2010. We believe
the underlying fundamentals of the copper business remain positive,
supported by limited supplies from existing mines and the absence
of significant new development projects. Future copper prices are
expected to be volatile and are likely to be influenced by demand
from China, economic activity in the U.S. and other industrialized
countries, the timing of the development of new supplies of copper
and production levels of mines and copper smelters. The LME spot
copper price closed at $4.50 per pound on February 11, 2011.
London Gold Prices
Through February 11, 2011
This graph presents London gold prices from January 2001
through February 11, 2011. Gold prices reached a new record high of
$1,421 per ounce in November 2010, supported by investment
demand and weakness in the U.S. dollar. During 2010, gold prices
ranged from $1,058 per ounce to $1,421 per ounce, averaged $1,225
per ounce and closed at $1,410 per ounce on December 31, 2010.
London gold prices closed at $1,364 per ounce on February 11, 2011.
Metals Week Molybdenum Dealer Oxide Prices
Through February 11, 2011
This graph presents the Metals Week Molybdenum Dealer Oxide
weekly average price from January 2001 through February 11, 2011.
In late 2008, molybdenum prices declined significantly as a result of
the financial market turmoil and a decline in demand; however,
molybdenum prices have since increased, which we believe is supported
by improved demand in the chemicals sector. During 2010, the
weekly average price of molybdenum ranged from $11.75 per
pound to $18.60 per pound, averaged $15.71 per pound and was
$16.40 per pound on December 31, 2010. The Metals Week
Molybdenum Dealer Oxide weekly average price was $17.58 per
pound on February 11, 2011.
FRE
EP
OR
T-McM
oRan C
OP
PE
R &
GO
LD IN
C. 2
010 A
nnual Rep
ort
25
1,500
2001 20052003 2007 2009 2011
$5.00
$4.00
$3.00
$2.00
$4.50
$3.50
$2.50
$1.00
$1.50
$0.50
1,200
900
600
300
2001 20052003 2007 2009 2011
$1,450
$1,350
$1,050
$750
$1,250
$950
$650
$1,150
$850
$550
$250
$350
$450
2001 20052003 2007 2009 2011
$40
$35
$30
$25
$20
$15
$10
$5
LME Copper Prices
LME & COMEX Exchange Stocks** Excludes Shanghai stocks, producer, consumer and merchant stocks.
Dollars per pound
00
0s
of m
etri
c to
ns Dollars per ounce
Dollars per pound
MANAGEMENT’S DISCUSSION AND ANALYSIS
CRITICAL ACCOUNTING ESTIMATES
Management’s Discussion and Analysis of Financial Condition and
Results of Operations is based on our consolidated financial
statements, which have been prepared in conformity with generally
accepted accounting principles (GAAP) in the U.S. The preparation
of these statements requires that we make estimates and
assumptions that affect the reported amounts of assets, liabilities,
revenues and expenses. We base these estimates on historical
experience and on assumptions that we consider reasonable under
the circumstances; however, reported results could differ from those
based on the current estimates under different assumptions or
conditions. The areas requiring the use of management’s estimates
are also discussed in Note 1 under the subheading “Use of
Estimates.” Management has reviewed the following discussion of its
development and selection of critical accounting estimates with the
Audit Committee of our Board of Directors.
Mineral Reserves. Recoverable proven and probable reserves are
the part of a mineral deposit that can be economically and legally
extracted or produced at the time of the reserve determination.
The determination of reserves involves numerous uncertainties with
respect to the ultimate geology of the ore bodies, including
quantities, grades and recovery rates. Estimating the quantity and
grade of reserves requires us to determine the size, shape and depth
of our ore bodies by analyzing geological data, such as samplings
of drill holes, tunnels and other underground workings. In addition
to the geology of our mines, assumptions are required to determine
the economic feasibility of mining these reserves, including
estimates of future commodity prices and demand, the mining
methods we use and the related costs incurred to develop and mine
our reserves. Our estimates of recoverable proven and probable
reserves are prepared by and are the responsibility of our employees.
A majority of these estimates have been reviewed and verified by
independent experts in mining, geology and reserve determination.
At December 31, 2010, our consolidated recoverable proven and
probable reserves included 120.5 billion pounds of copper,
35.5 million ounces of gold and 3.39 billion pounds of molybdenum,
which were determined using long-term average prices of $2.00 per
pound for copper, $750 per ounce for gold and $10.00 per pound
for molybdenum, compared with $1.60 per pound for copper,
$550 per ounce for gold and $8.00 per pound for molybdenum for
the proven and probable reserve estimates at December 31, 2009.
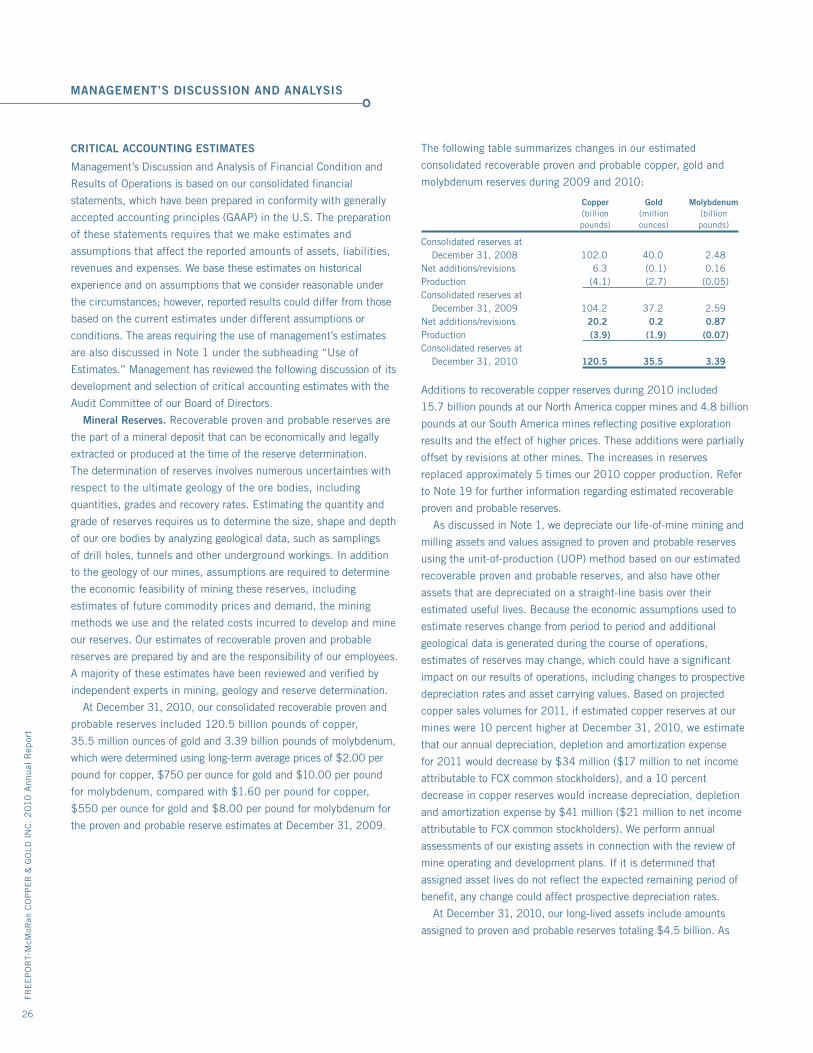
The following table summarizes changes in our estimated
consolidated recoverable proven and probable copper, gold and
molybdenum reserves during 2009 and 2010:
Copper Gold Molybdenum (billion (million (billion pounds) ounces) pounds)
Consolidated reserves at December 31, 2008 102.0 40.0 2.48Net additions/revisions 6.3 (0.1) 0.16Production (4.1) (2.7) (0.05)Consolidated reserves at December 31, 2009 104.2 37.2 2.59Net additions/revisions 20.2 0.2 0.87Production (3.9) (1.9) (0.07)Consolidated reserves at December 31, 2010 120.5 35.5 3.39
Additions to recoverable copper reserves during 2010 included
15.7 billion pounds at our North America copper mines and 4.8 billion
pounds at our South America mines reflecting positive exploration
results and the effect of higher prices. These additions were partially
offset by revisions at other mines. The increases in reserves
replaced approximately 5 times our 2010 copper production. Refer
to Note 19 for further information regarding estimated recoverable
proven and probable reserves.
As discussed in Note 1, we depreciate our life-of-mine mining and
milling assets and values assigned to proven and probable reserves
using the unit-of-production (UOP) method based on our estimated
recoverable proven and probable reserves, and also have other
assets that are depreciated on a straight-line basis over their
estimated useful lives. Because the economic assumptions used to
estimate reserves change from period to period and additional
geological data is generated during the course of operations,
estimates of reserves may change, which could have a significant
impact on our results of operations, including changes to prospective
depreciation rates and asset carrying values. Based on projected
copper sales volumes for 2011, if estimated copper reserves at our
mines were 10 percent higher at December 31, 2010, we estimate
that our annual depreciation, depletion and amortization expense
for 2011 would decrease by $34 million ($17 million to net income
attributable to FCX common stockholders), and a 10 percent
decrease in copper reserves would increase depreciation, depletion
and amortization expense by $41 million ($21 million to net income
attributable to FCX common stockholders). We perform annual
assessments of our existing assets in connection with the review of
mine operating and development plans. If it is determined that
assigned asset lives do not reflect the expected remaining period of
benefit, any change could affect prospective depreciation rates.
At December 31, 2010, our long-lived assets include amounts
assigned to proven and probable reserves totaling $4.5 billion. As
FRE
EP
OR
T-M
cMoR
an C
OP
PE
R &
GO
LD I
NC
. 2
010
Ann
ual
Rep
ort
26
MANAGEMENT’S DISCUSSION AND ANALYSIS
discussed below and in Note 1, we review and evaluate our long-lived
assets for impairment when events or changes in circumstances
indicate that the related carrying amount of such assets may not be
recoverable, and changes to our estimates of recoverable proven
and probable reserves could have an impact on our assessment of
asset recoverability.
Recoverable Copper. We record, as inventory, applicable costs for
copper contained in mill and leach stockpiles that are expected to
be processed in the future based on proven processing technologies.
Mill and leach stockpiles are evaluated periodically to ensure that
they are stated at the lower of cost or market. Accounting for
recoverable copper from mill and leach stockpiles represents a
critical accounting estimate because (i) it is generally impracticable
to determine copper contained in mill and leach stockpiles by
physical count, which requires management to employ reasonable
estimation methods and (ii) recovery rates from leach stockpiles can
vary significantly. The quantity of material delivered to mill and
leach stockpiles is based on surveyed volumes of mined material and
daily production records. Sampling and assaying of blasthole
cuttings determine the estimated copper grade contained in the
material delivered to the mill and leach stockpiles.
Expected copper recovery rates for mill stockpiles are determined
by metallurgical testing. The recoverable copper in mill stockpiles,
once entered into the production process, can be produced into
copper concentrate almost immediately.
Expected copper recovery rates for leach stockpiles are determined
using small-scale laboratory tests, small- to large-scale column
testing (which simulates the production-scale process), historical
trends and other factors, including mineralogy of the ore and rock
type. Ultimate recovery of copper contained in leach stockpiles can
vary significantly from a low percentage to more than 90 percent
depending on several variables, including type of copper recovery,
mineralogy and particle size of the rock. For newly placed material
on active stockpiles, as much as 70 percent of the copper
ultimately recoverable may be extracted during the first year, and the
remaining copper may be recovered over many years.
Processes and recovery rates are monitored regularly, and recovery
rate estimates are adjusted periodically as additional information
becomes available and as related technology changes. During
fourth-quarter 2010, revised recovery rate estimates at El Abra
resulted in a reduction of 163 million pounds in leach stockpiles.
At December 31, 2010, estimated recoverable copper was 2.6 billion
pounds in leach stockpiles (with a carrying value of $1.8 billion)
and 1.3 billion pounds in mill stockpiles (with a carrying value of
$505 million).
Environmental Obligations. Our mining, exploration, production
and historical operating activities are subject to stringent laws and
regulations governing the protection of the environment, and
compliance with those laws requires significant expenditures.
Environmental expenditures for closed facilities and closed portions
of operating facilities are expensed or capitalized depending upon
their future economic benefits. The general guidance provided by
U.S. GAAP requires that liabilities for contingencies be recorded
when it is probable that a liability has been incurred and the amount
can be reasonably estimated. Refer to Note 1 for discussion of our
accounting policy for environmental expenditures.
Accounting for environmental obligations represents a critical
accounting estimate because changes to environmental laws and
regulations and/or circumstances affecting our operations could
result in significant changes to our estimates, which could have a
significant impact on our results of operations. We review changes
in facts and circumstances associated with our environmental
obligations on a quarterly basis. Judgments and estimates are based
upon available facts, existing technology, presently enacted laws
and regulations, remediation experience, whether or not we are a
potentially responsible party (PRP), the ability of other PRPs to pay
their allocated portions and take into consideration reasonably
possible outcomes. Our cost estimates can change substantially as
additional information becomes available regarding the nature
or extent of site contamination, required remediation methods and
actions by or against governmental agencies or private parties.
At December 31, 2010, environmental obligations recorded in our
consolidated balance sheets totaled approximately $1.4 billion,
which reflect obligations for environmental liabilities attributed to the
Comprehensive Environmental Response, Compensation, and
Liability Act (CERCLA) or analogous state programs and for
estimated future costs associated with environmental matters at
closed facilities and closed portions of certain operating facilities.
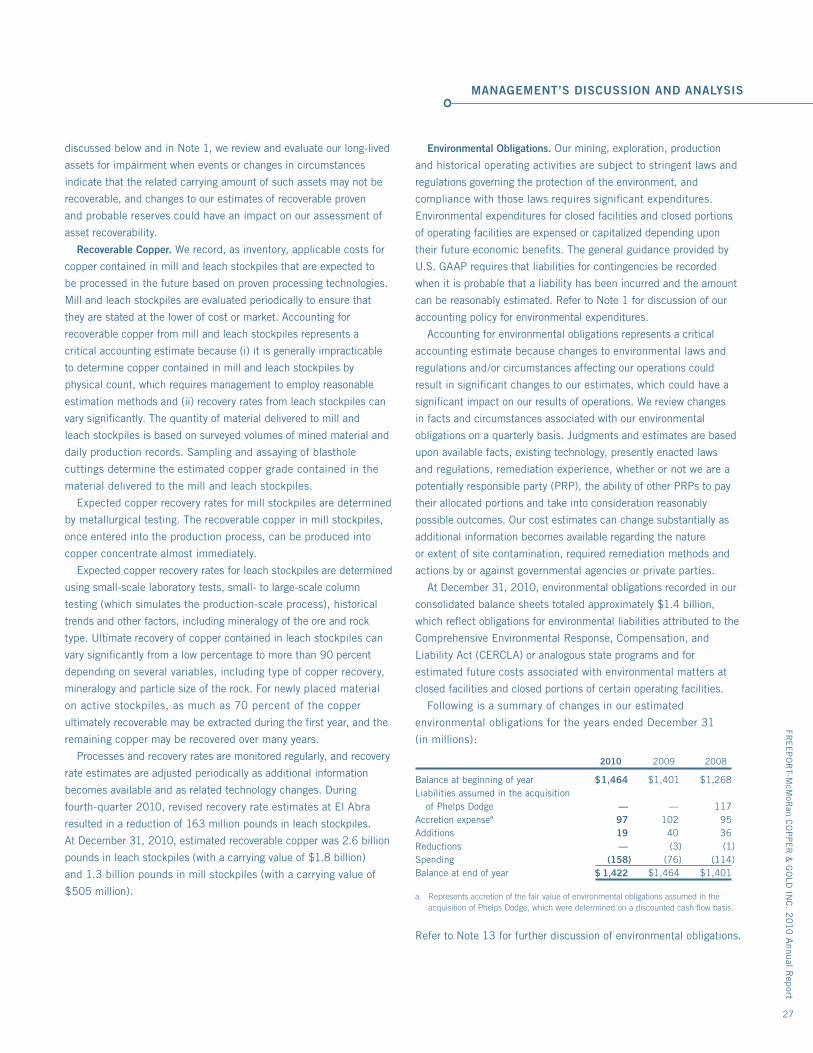
Following is a summary of changes in our estimated
environmental obligations for the years ended December 31
(in millions):
2010 2009 2008
Balance at beginning of year $ 1,464 $ 1,401 $ 1,268Liabilities assumed in the acquisition of Phelps Dodge — — 117Accretion expensea 97 102 95Additions 19 40 36Reductions — (3) (1)Spending (158) (76) (114)Balance at end of year $ 1,422 $ 1,464 $ 1,401
a. Represents accretion of the fair value of environmental obligations assumed in the acquisition of Phelps Dodge, which were determined on a discounted cash flow basis.
Refer to Note 13 for further discussion of environmental obligations.
FRE
EP
OR
T-McM
oRan C
OP
PE
R &
GO
LD IN
C. 2
010 A
nnual Rep
ort
27
MANAGEMENT’S DISCUSSION AND ANALYSIS
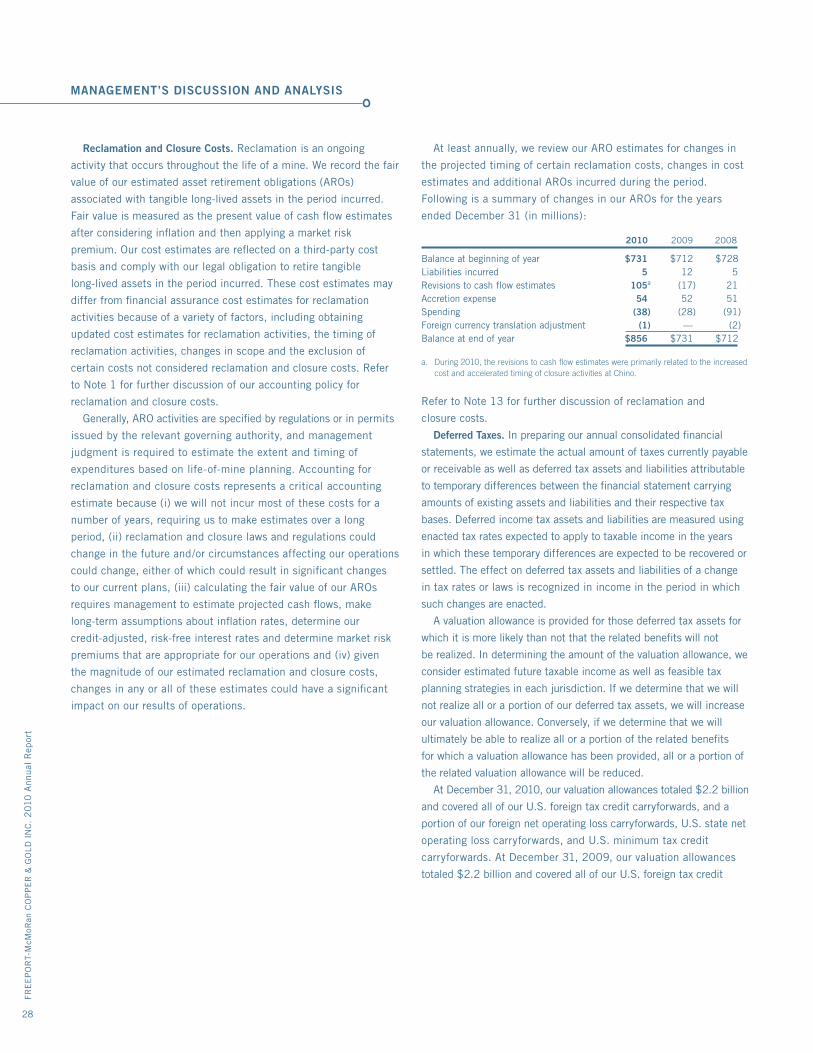
Reclamation and Closure Costs. Reclamation is an ongoing
activity that occurs throughout the life of a mine. We record the fair
value of our estimated asset retirement obligations (AROs)
associated with tangible long-lived assets in the period incurred.
Fair value is measured as the present value of cash flow estimates
after considering inflation and then applying a market risk
premium. Our cost estimates are reflected on a third-party cost
basis and comply with our legal obligation to retire tangible
long-lived assets in the period incurred. These cost estimates may
differ from financial assurance cost estimates for reclamation
activities because of a variety of factors, including obtaining
updated cost estimates for reclamation activities, the timing of
reclamation activities, changes in scope and the exclusion of
certain costs not considered reclamation and closure costs. Refer
to Note 1 for further discussion of our accounting policy for
reclamation and closure costs.
Generally, ARO activities are specified by regulations or in permits
issued by the relevant governing authority, and management
judgment is required to estimate the extent and timing of
expenditures based on life-of-mine planning. Accounting for
reclamation and closure costs represents a critical accounting
estimate because (i) we will not incur most of these costs for a
number of years, requiring us to make estimates over a long
period, (ii) reclamation and closure laws and regulations could
change in the future and/or circumstances affecting our operations
could change, either of which could result in significant changes
to our current plans, (iii) calculating the fair value of our AROs
requires management to estimate projected cash flows, make
long-term assumptions about inflation rates, determine our
credit-adjusted, risk-free interest rates and determine market risk
premiums that are appropriate for our operations and (iv) given
the magnitude of our estimated reclamation and closure costs,
changes in any or all of these estimates could have a significant
impact on our results of operations.
At least annually, we review our ARO estimates for changes in
the projected timing of certain reclamation costs, changes in cost
estimates and additional AROs incurred during the period.
Following is a summary of changes in our AROs for the years
ended December 31 (in millions):
2010 2009 2008
Balance at beginning of year $ 731 $ 712 $ 728Liabilities incurred 5 12 5Revisions to cash flow estimates 105a (17) 21Accretion expense 54 52 51Spending (38) (28) (91)Foreign currency translation adjustment (1) — (2)Balance at end of year $ 856 $ 731 $ 712 a. During 2010, the revisions to cash flow estimates were primarily related to the increased
cost and accelerated timing of closure activities at Chino.
Refer to Note 13 for further discussion of reclamation and
closure costs.
Deferred Taxes. In preparing our annual consolidated financial
statements, we estimate the actual amount of taxes currently payable
or receivable as well as deferred tax assets and liabilities attributable
to temporary differences between the financial statement carrying
amounts of existing assets and liabilities and their respective tax
bases. Deferred income tax assets and liabilities are measured using
enacted tax rates expected to apply to taxable income in the years
in which these temporary differences are expected to be recovered or
settled. The effect on deferred tax assets and liabilities of a change
in tax rates or laws is recognized in income in the period in which
such changes are enacted.
A valuation allowance is provided for those deferred tax assets for
which it is more likely than not that the related benefits will not
be realized. In determining the amount of the valuation allowance, we
consider estimated future taxable income as well as feasible tax
planning strategies in each jurisdiction. If we determine that we will
not realize all or a portion of our deferred tax assets, we will increase
our valuation allowance. Conversely, if we determine that we will
ultimately be able to realize all or a portion of the related benefits
for which a valuation allowance has been provided, all or a portion of
the related valuation allowance will be reduced.
At December 31, 2010, our valuation allowances totaled $2.2 billion
and covered all of our U.S. foreign tax credit carryforwards, and a
portion of our foreign net operating loss carryforwards, U.S. state net
operating loss carryforwards, and U.S. minimum tax credit
carryforwards. At December 31, 2009, our valuation allowances
totaled $2.2 billion and covered all of our U.S. foreign tax credit
FRE
EP
OR
T-M
cMoR
an C
OP
PE
R &
GO
LD I
NC
. 2
010
Ann
ual
Rep
ort
28
MANAGEMENT’S DISCUSSION AND ANALYSIS
During fourth-quarter 2008, we concluded that the then-current
economic environment and significant declines in copper and
molybdenum prices represented significant adverse changes in our
business and evaluated our long-lived assets for impairment.
Projected metal prices represented the most significant assumption
used in the cash flow estimates to assess recoverability and measure
fair value of our individual mining operations. Our evaluation resulted
in the recognition of asset impairment charges totaling $10.9 billion
($6.6 billion to net loss attributable to FCX common stockholders or
$8.67 per share) for 2008. Refer to Note 17 for further discussion of
the 2008 asset impairment charges.
Additionally, goodwill was recorded in connection with the March
2007 acquisition of Phelps Dodge and was assigned to the
reporting units, or individual mines, that were expected to benefit
from the business combination. Goodwill is required to be
evaluated for impairment at least annually and at any other time if
an event or change in circumstances indicates that the fair value of
a reporting unit is below its carrying amount. Our annual goodwill
impairment test was performed in fourth-quarter 2008, which
resulted in the full impairment of goodwill and the recognition of
charges totaling $6.0 billion ($6.0 billion to net loss attributable to
FCX common stockholders or $7.84 per share). Refer to Note 5 for
further discussion.
FRE
EP
OR
T-McM
oRan C
OP
PE
R &
GO
LD IN
C. 2
010 A
nnual Rep
ort
29
carryforwards and U.S. state net operating loss carryforwards, and
a portion of our foreign net operating loss carryforwards and U.S.
minimum tax credit carryforwards. These valuation allowances
include $59 million and $44 million, respectively, relating to tax
benefits that, if recognized, would be credited directly to other
comprehensive income. The $69 million increase in the valuation
allowance during 2010 was primarily the result of an increase in
foreign tax credit carryforwards, partially offset by a decrease in
minimum tax credit carryforwards.
Refer to Note 12 for further discussion.
Impairment of Assets. We evaluate our long-lived assets (to be held
and used) for impairment when events or changes in circumstances
indicate that the related carrying amount of such assets may not be
recoverable. In evaluating our long-lived assets for recoverability,
estimates of after-tax undiscounted future cash flows of our individual
mining operations are used, with impairment losses measured by
reference to fair value. As quoted market prices are unavailable for
our individual mining operations, fair value is determined through the
use of discounted estimated future cash flows. The estimated cash
flows used to assess recoverability of our long-lived assets and
measure fair value of our mining operations are derived from current
business plans, which are developed using near-term price forecasts
reflective of the current price environment and management’s
projections for long-term average metal prices. In addition to near
and long-term metal price assumptions, other key estimates include
commodity-based and other input costs; proven and probable
reserves, including the timing and cost to develop and produce the
reserves; and the use of appropriate escalation and discount rates.
Because the cash flows used to assess recoverability of our
long-lived assets and measure fair value of our mining operations
require us to make several estimates and assumptions that are
subject to risk and uncertainty, changes in these estimates and
assumptions could result in the impairment of our long-lived assets
values. Events that could result in impairment of our long-lived assets
include, but are not limited to, decreases in future metal prices,
decreases in estimated recoverable proven and probable reserves and
any event that might otherwise have a material adverse effect on
mine site production levels or costs.
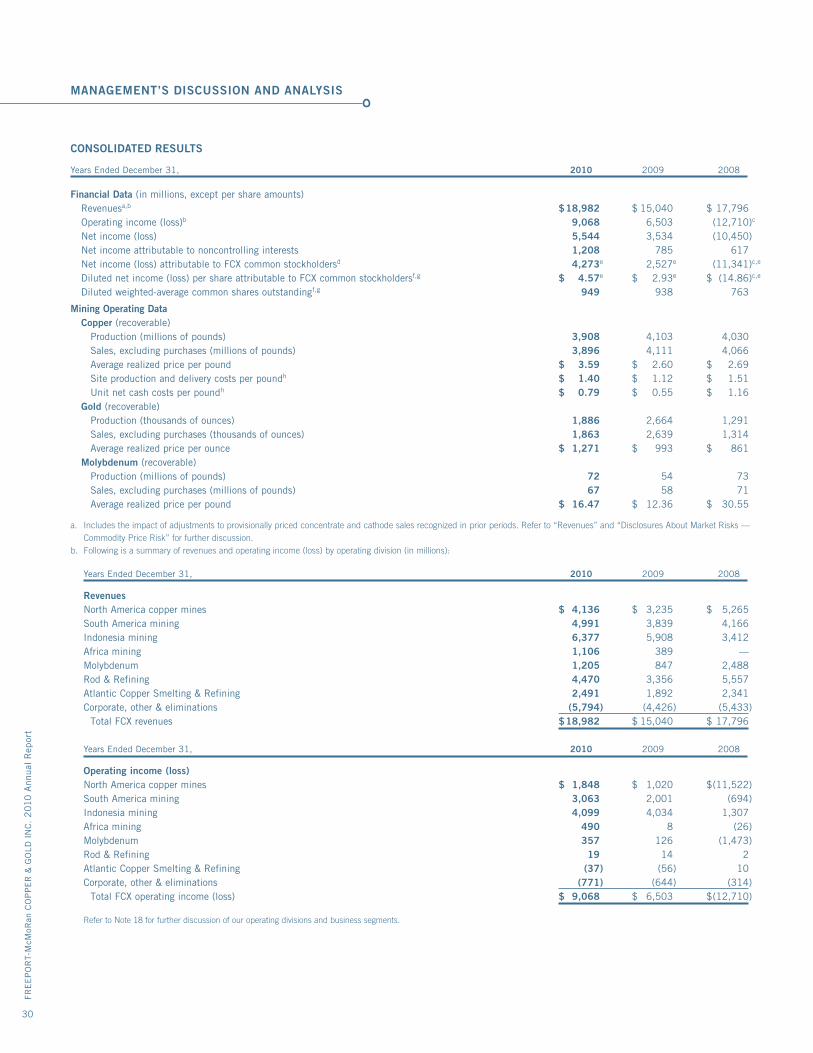
MANAGEMENT’S DISCUSSION AND ANALYSIS
FRE
EP
OR
T-M
cMoR
an C
OP
PE
R &
GO
LD I
NC
. 2
010
Ann
ual
Rep
ort
30
CONSOLIDATED RESULTS
Years Ended December 31, 2010 2009 2008
Financial Data (in millions, except per share amounts) Revenuesa,b $ 18,982 $ 15,040 $ 17,796 Operating income (loss)b 9,068 6,503 (12,710)c
Net income (loss) 5,544 3,534 (10,450) Net income attributable to noncontrolling interests 1,208 785 617 Net income (loss) attributable to FCX common stockholdersd 4,273e 2,527e (11,341)c,e
Diluted net income (loss) per share attributable to FCX common stockholdersf,g $ 4.57e $ 2.93e $ (14.86)c,e
Diluted weighted-average common shares outstandingf,g 949 938 763
Mining Operating Data Copper (recoverable) Production (millions of pounds) 3,908 4,103 4,030 Sales, excluding purchases (millions of pounds) 3,896 4,111 4,066 Average realized price per pound $ 3.59 $ 2.60 $ 2.69 Site production and delivery costs per poundh $ 1.40 $ 1.12 $ 1.51 Unit net cash costs per poundh $ 0.79 $ 0.55 $ 1.16 Gold (recoverable) Production (thousands of ounces) 1,886 2,664 1,291 Sales, excluding purchases (thousands of ounces) 1,863 2,639 1,314 Average realized price per ounce $ 1,271 $ 993 $ 861 Molybdenum (recoverable) Production (millions of pounds) 72 54 73 Sales, excluding purchases (millions of pounds) 67 58 71 Average realized price per pound $ 16.47 $ 12.36 $ 30.55 a. Includes the impact of adjustments to provisionally priced concentrate and cathode sales recognized in prior periods. Refer to “Revenues” and “Disclosures About Market Risks —
Commodity Price Risk” for further discussion.b. Following is a summary of revenues and operating income (loss) by operating division (in millions):
Years Ended December 31, 2010 2009 2008
Revenues North America copper mines $ 4,136 $ 3,235 $ 5,265South America mining 4,991 3,839 4,166Indonesia mining 6,377 5,908 3,412Africa mining 1,106 389 —Molybdenum 1,205 847 2,488Rod & Refining 4,470 3,356 5,557Atlantic Copper Smelting & Refining 2,491 1,892 2,341Corporate, other & eliminations (5,794) (4,426) (5,433) Total FCX revenues $ 18,982 $ 15,040 $ 17,796
Years Ended December 31, 2010 2009 2008
Operating income (loss) North America copper mines $ 1,848 $ 1,020 $ (11,522)South America mining 3,063 2,001 (694)Indonesia mining 4,099 4,034 1,307Africa mining 490 8 (26)Molybdenum 357 126 (1,473)Rod & Refining 19 14 2Atlantic Copper Smelting & Refining (37) (56) 10Corporate, other & eliminations (771) (644) (314) Total FCX operating income (loss) $ 9,068 $ 6,503 $ (12,710)
Refer to Note 18 for further discussion of our operating divisions and business segments.
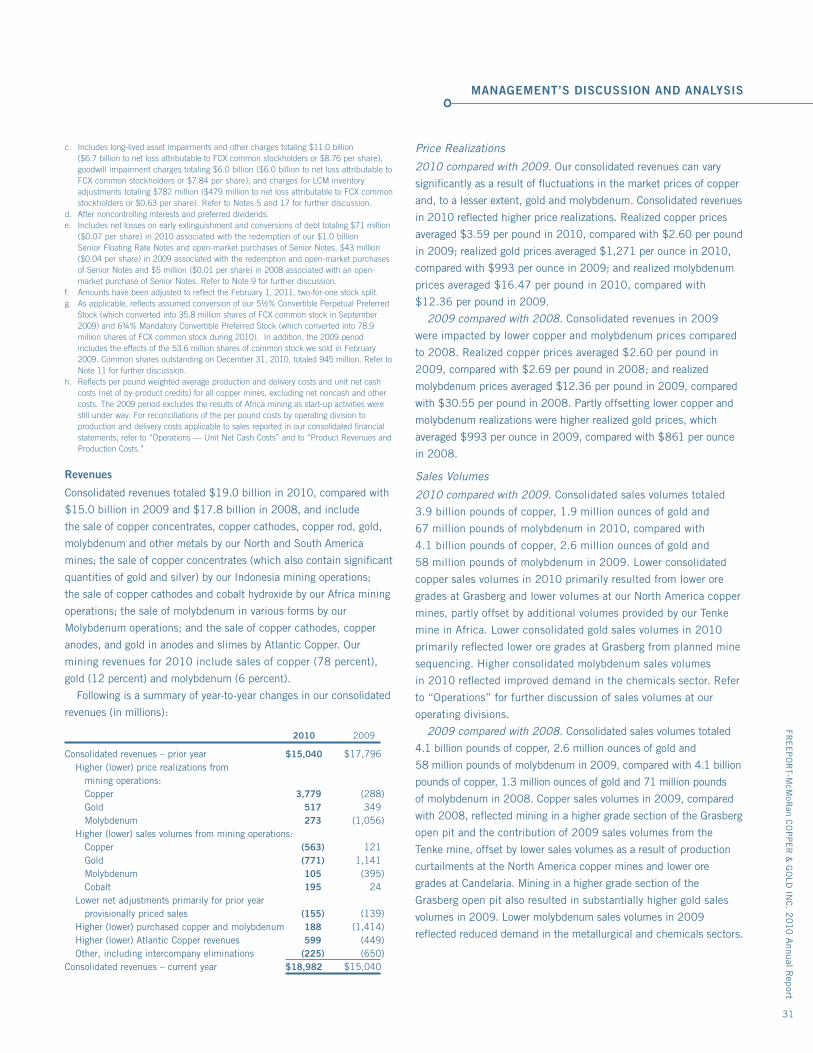
MANAGEMENT’S DISCUSSION AND ANALYSIS
c. Includes long-lived asset impairments and other charges totaling $11.0 billion ($6.7 billion to net loss attributable to FCX common stockholders or $8.76 per share), goodwill impairment charges totaling $6.0 billion ($6.0 billion to net loss attributable to FCX common stockholders or $7.84 per share), and charges for LCM inventory adjustments totaling $782 million ($479 million to net loss attributable to FCX common stockholders or $0.63 per share). Refer to Notes 5 and 17 for further discussion.
d. After noncontrolling interests and preferred dividends.e. Includes net losses on early extinguishment and conversions of debt totaling $71 million
($0.07 per share) in 2010 associated with the redemption of our $1.0 billion Senior Floating Rate Notes and open-market purchases of Senior Notes, $43 million ($0.04 per share) in 2009 associated with the redemption and open-market purchases of Senior Notes and $5 million ($0.01 per share) in 2008 associated with an open-market purchase of Senior Notes. Refer to Note 9 for further discussion.
f. Amounts have been adjusted to reflect the February 1, 2011, two-for-one stock split.g. As applicable, reflects assumed conversion of our 5½% Convertible Perpetual Preferred
Stock (which converted into 35.8 million shares of FCX common stock in September 2009) and 6¾% Mandatory Convertible Preferred Stock (which converted into 78.9 million shares of FCX common stock during 2010). In addition, the 2009 period includes the effects of the 53.6 million shares of common stock we sold in February 2009. Common shares outstanding on December 31, 2010, totaled 945 million. Refer to Note 11 for further discussion.
h. Reflects per pound weighted average production and delivery costs and unit net cash costs (net of by-product credits) for all copper mines, excluding net noncash and other costs. The 2009 period excludes the results of Africa mining as start-up activities were still under way. For reconciliations of the per pound costs by operating division to production and delivery costs applicable to sales reported in our consolidated financial statements, refer to “Operations — Unit Net Cash Costs” and to “Product Revenues and Production Costs.”
Revenues
Consolidated revenues totaled $19.0 billion in 2010, compared with
$15.0 billion in 2009 and $17.8 billion in 2008, and include
the sale of copper concentrates, copper cathodes, copper rod, gold,
molybdenum and other metals by our North and South America
mines; the sale of copper concentrates (which also contain significant
quantities of gold and silver) by our Indonesia mining operations;
the sale of copper cathodes and cobalt hydroxide by our Africa mining
operations; the sale of molybdenum in various forms by our
Molybdenum operations; and the sale of copper cathodes, copper
anodes, and gold in anodes and slimes by Atlantic Copper. Our
mining revenues for 2010 include sales of copper (78 percent),
gold (12 percent) and molybdenum (6 percent).
Following is a summary of year-to-year changes in our consolidated
revenues (in millions):
2010 2009
Consolidated revenues – prior year $ 15,040 $ 17,796 Higher (lower) price realizations from mining operations: Copper 3,779 (288) Gold 517 349 Molybdenum 273 (1,056) Higher (lower) sales volumes from mining operations: Copper (563) 121 Gold (771) 1,141 Molybdenum 105 (395) Cobalt 195 24 Lower net adjustments primarily for prior year provisionally priced sales (155) (139) Higher (lower) purchased copper and molybdenum 188 (1,414) Higher (lower) Atlantic Copper revenues 599 (449) Other, including intercompany eliminations (225) (650)Consolidated revenues – current year $ 18,982 $ 15,040
Price Realizations
2010 compared with 2009. Our consolidated revenues can vary
significantly as a result of fluctuations in the market prices of copper
and, to a lesser extent, gold and molybdenum. Consolidated revenues
in 2010 reflected higher price realizations. Realized copper prices
averaged $3.59 per pound in 2010, compared with $2.60 per pound
in 2009; realized gold prices averaged $1,271 per ounce in 2010,
compared with $993 per ounce in 2009; and realized molybdenum
prices averaged $16.47 per pound in 2010, compared with
$12.36 per pound in 2009.
2009 compared with 2008. Consolidated revenues in 2009
were impacted by lower copper and molybdenum prices compared
to 2008. Realized copper prices averaged $2.60 per pound in
2009, compared with $2.69 per pound in 2008; and realized
molybdenum prices averaged $12.36 per pound in 2009, compared
with $30.55 per pound in 2008. Partly offsetting lower copper and
molybdenum realizations were higher realized gold prices, which
averaged $993 per ounce in 2009, compared with $861 per ounce
in 2008.
Sales Volumes
2010 compared with 2009. Consolidated sales volumes totaled
3.9 billion pounds of copper, 1.9 million ounces of gold and
67 million pounds of molybdenum in 2010, compared with
4.1 billion pounds of copper, 2.6 million ounces of gold and
58 million pounds of molybdenum in 2009. Lower consolidated
copper sales volumes in 2010 primarily resulted from lower ore
grades at Grasberg and lower volumes at our North America copper
mines, partly offset by additional volumes provided by our Tenke
mine in Africa. Lower consolidated gold sales volumes in 2010
primarily reflected lower ore grades at Grasberg from planned mine
sequencing. Higher consolidated molybdenum sales volumes
in 2010 reflected improved demand in the chemicals sector. Refer
to “Operations” for further discussion of sales volumes at our
operating divisions.
2009 compared with 2008. Consolidated sales volumes totaled
4.1 billion pounds of copper, 2.6 million ounces of gold and
58 million pounds of molybdenum in 2009, compared with 4.1 billion
pounds of copper, 1.3 million ounces of gold and 71 million pounds
of molybdenum in 2008. Copper sales volumes in 2009, compared
with 2008, reflected mining in a higher grade section of the Grasberg
open pit and the contribution of 2009 sales volumes from the
Tenke mine, offset by lower sales volumes as a result of production
curtailments at the North America copper mines and lower ore
grades at Candelaria. Mining in a higher grade section of the
Grasberg open pit also resulted in substantially higher gold sales
volumes in 2009. Lower molybdenum sales volumes in 2009
reflected reduced demand in the metallurgical and chemicals sectors.
FRE
EP
OR
T-McM
oRan C
OP
PE
R &
GO
LD IN
C. 2
010 A
nnual Rep
ort
31
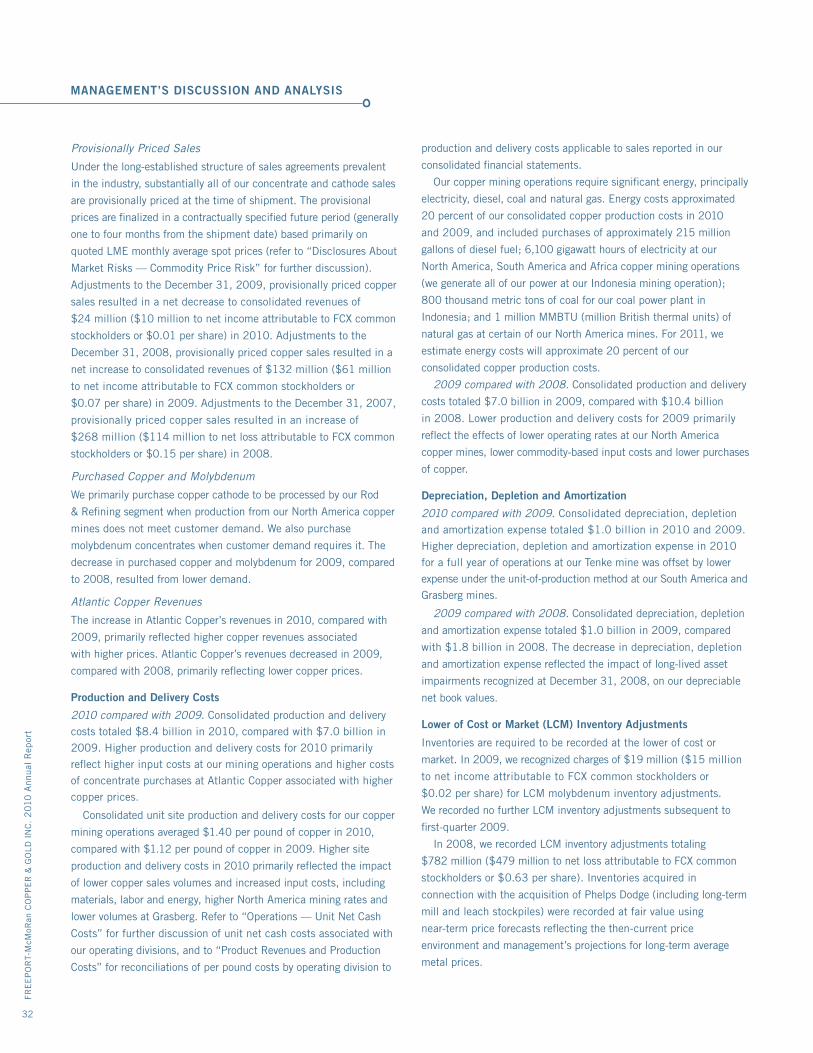
MANAGEMENT’S DISCUSSION AND ANALYSIS
Provisionally Priced Sales
Under the long-established structure of sales agreements prevalent
in the industry, substantially all of our concentrate and cathode sales
are provisionally priced at the time of shipment. The provisional
prices are finalized in a contractually specified future period (generally
one to four months from the shipment date) based primarily on
quoted LME monthly average spot prices (refer to “Disclosures About
Market Risks — Commodity Price Risk” for further discussion).
Adjustments to the December 31, 2009, provisionally priced copper
sales resulted in a net decrease to consolidated revenues of
$24 million ($10 million to net income attributable to FCX common
stockholders or $0.01 per share) in 2010. Adjustments to the
December 31, 2008, provisionally priced copper sales resulted in a
net increase to consolidated revenues of $132 million ($61 million
to net income attributable to FCX common stockholders or
$0.07 per share) in 2009. Adjustments to the December 31, 2007,
provisionally priced copper sales resulted in an increase of
$268 million ($114 million to net loss attributable to FCX common
stockholders or $0.15 per share) in 2008.
Purchased Copper and Molybdenum
We primarily purchase copper cathode to be processed by our Rod
& Refining segment when production from our North America copper
mines does not meet customer demand. We also purchase
molybdenum concentrates when customer demand requires it. The
decrease in purchased copper and molybdenum for 2009, compared
to 2008, resulted from lower demand.
Atlantic Copper Revenues
The increase in Atlantic Copper’s revenues in 2010, compared with
2009, primarily reflected higher copper revenues associated
with higher prices. Atlantic Copper’s revenues decreased in 2009,
compared with 2008, primarily reflecting lower copper prices.
Production and Delivery Costs
2010 compared with 2009. Consolidated production and delivery
costs totaled $8.4 billion in 2010, compared with $7.0 billion in
2009. Higher production and delivery costs for 2010 primarily
reflect higher input costs at our mining operations and higher costs
of concentrate purchases at Atlantic Copper associated with higher
copper prices.
Consolidated unit site production and delivery costs for our copper
mining operations averaged $1.40 per pound of copper in 2010,
compared with $1.12 per pound of copper in 2009. Higher site
production and delivery costs in 2010 primarily reflected the impact
of lower copper sales volumes and increased input costs, including
materials, labor and energy, higher North America mining rates and
lower volumes at Grasberg. Refer to “Operations — Unit Net Cash
Costs” for further discussion of unit net cash costs associated with
our operating divisions, and to “Product Revenues and Production
Costs” for reconciliations of per pound costs by operating division to
production and delivery costs applicable to sales reported in our
consolidated financial statements.
Our copper mining operations require significant energy, principally
electricity, diesel, coal and natural gas. Energy costs approximated
20 percent of our consolidated copper production costs in 2010
and 2009, and included purchases of approximately 215 million
gallons of diesel fuel; 6,100 gigawatt hours of electricity at our
North America, South America and Africa copper mining operations
(we generate all of our power at our Indonesia mining operation);
800 thousand metric tons of coal for our coal power plant in
Indonesia; and 1 million MMBTU (million British thermal units) of
natural gas at certain of our North America mines. For 2011, we
estimate energy costs will approximate 20 percent of our
consolidated copper production costs.
2009 compared with 2008. Consolidated production and delivery
costs totaled $7.0 billion in 2009, compared with $10.4 billion
in 2008. Lower production and delivery costs for 2009 primarily
reflect the effects of lower operating rates at our North America
copper mines, lower commodity-based input costs and lower purchases
of copper.
Depreciation, Depletion and Amortization
2010 compared with 2009. Consolidated depreciation, depletion
and amortization expense totaled $1.0 billion in 2010 and 2009.
Higher depreciation, depletion and amortization expense in 2010
for a full year of operations at our Tenke mine was offset by lower
expense under the unit-of-production method at our South America and
Grasberg mines.
2009 compared with 2008. Consolidated depreciation, depletion
and amortization expense totaled $1.0 billion in 2009, compared
with $1.8 billion in 2008. The decrease in depreciation, depletion
and amortization expense reflected the impact of long-lived asset
impairments recognized at December 31, 2008, on our depreciable
net book values.
Lower of Cost or Market (LCM) Inventory Adjustments
Inventories are required to be recorded at the lower of cost or
market. In 2009, we recognized charges of $19 million ($15 million
to net income attributable to FCX common stockholders or
$0.02 per share) for LCM molybdenum inventory adjustments.
We recorded no further LCM inventory adjustments subsequent to
first-quarter 2009.
In 2008, we recorded LCM inventory adjustments totaling
$782 million ($479 million to net loss attributable to FCX common
stockholders or $0.63 per share). Inventories acquired in
connection with the acquisition of Phelps Dodge (including long-term
mill and leach stockpiles) were recorded at fair value using
near-term price forecasts reflecting the then-current price
environment and management’s projections for long-term average
metal prices.
FRE
EP
OR
T-M
cMoR
an C
OP
PE
R &
GO
LD I
NC
. 2
010
Ann
ual
Rep
ort
32
MANAGEMENT’S DISCUSSION AND ANALYSIS
Selling, General and Administrative Expenses
2010 compared with 2009. Consolidated selling, general and
administrative expenses totaled $381 million in 2010, compared
with $321 million in 2009. Approximately half of the increase in
selling, general and administrative expenses reflected higher
stock-based compensation and other incentive compensation costs
related to financial performance.
2009 compared with 2008. Consolidated selling, general
and administrative expenses totaled $321 million in 2009, compared
with $269 million in 2008. Higher selling, general and administrative
expenses primarily reflected a net increase in incentive compensation
costs related to financial performance, partly offset by reductions
associated with administrative costs savings initiatives.
Exploration and Research Expenses
Consolidated exploration and research expenses totaled $143 million
in 2010, $90 million in 2009 and $292 million in 2008.
Throughout most of 2008, expenditures primarily reflected
increased exploration efforts in North America and also in Africa,
including targets outside the area of initial development at Tenke.
However, in response to weak market conditions at the end of 2008,
we revised operating plans to significantly reduce exploration costs
in 2009. During 2009 and 2010, we focused on analyzing exploration
data gained through the core drilling previously undertaken in
addition to conducting new activities.
Exploration activities are being conducted near our existing mines
with a focus on opportunities to expand reserves that will support
additional future production capacity in the large minerals districts
where we currently operate. Favorable exploration results indicate
opportunities for significant future potential reserve additions in North
and South America and in the Tenke minerals district. The drilling
data in North America continue to indicate the potential for expanded
sulfide production.
For 2011, exploration and research expenditures are being
increased to an estimated $250 million, including approximately
$200 million for exploration. Exploration activities will continue
to focus primarily on the potential for future reserve additions in our
existing minerals districts.
Long-Lived Asset Impairments and Other Charges
During 2009, net restructuring and other charges totaled $77 million
($61 million to net income attributable to FCX common stockholders
or $0.07 per share), which included a charge of $54 million
($43 million to net income attributable to FCX common stockholders
or $0.05 per share) associated with the partial settlement of the
City of Blackwell lawsuit.
During 2008, we recognized charges totaling $11.0 billion
($6.7 billion to net loss attributable to FCX common stockholders
or $8.76 per share) for long-lived asset impairments and other
charges. During fourth-quarter 2008, we concluded that the
declines in copper and molybdenum prices and the deterioration of
the economic environment represented significant adverse changes
in the business and evaluated our long-lived assets for impairment
as of December 31, 2008, which resulted in the recognition of
asset impairment charges totaling $10.9 billion ($6.6 billion to net
loss attributable to FCX common stockholders or $8.67 per share).
In addition, we recorded net restructuring and other charges
totaling $111 million ($67 million to net loss attributable to FCX
common stockholders or $0.09 per share) associated with our
revised operating plans, including contract termination costs, other
project cancellation costs, employee severance and benefits and
special retirement benefits and curtailments.
Refer to Note 17 for further discussion of these charges.
Goodwill Impairment
Our annual impairment test of goodwill at December 31, 2008,
resulted in the full impairment of goodwill and the recognition of
charges totaling $6.0 billion ($6.0 billion to net loss attributable
to FCX common stockholders or $7.84 per share). Refer to Note 5 for
further discussion.
Interest Expense, Net
Consolidated interest expense (before capitalization) totaled
$528 million in 2010, $664 million in 2009 and $706 million in
2008. Lower interest expense primarily reflected the impact of
debt repayments during 2009 and 2010 (refer to “Capital Resources
and Liquidity — Financing Activities” for discussion of debt
repayments). Lower interest expense in 2009, compared with 2008,
also reflected lower interest rates on our variable-rate debt.
Capitalized interest is primarily related to our development
projects and totaled $66 million in 2010, $78 million in 2009 and
$122 million in 2008.
Losses on Early Extinguishment of Debt
During 2010, we recorded losses on early extinguishment of debt
totaling $81 million ($71 million to net income attributable to FCX
common stockholders or $0.07 per share) associated with the
redemption of our Senior Floating Rate Notes and open-market
purchases of our 8.25%, 8.375% and 9.50% Senior Notes.
During 2009, we recorded losses on early extinguishment of debt
totaling $48 million ($43 million to net income attributable to
FCX common stockholders or $0.04 per share), associated with
the redemption of our 67/8% Senior Notes and for open-market
purchases of our 8.25%, 8.375% and 8¾% Senior Notes.
During 2008, we recorded net losses on early extinguishment of
debt totaling $6 million ($5 million to net loss attributable to
FCX common stockholders or $0.01 per share) associated with an
open-market purchase of our 9½% Senior Notes.
Refer to Note 9 for further discussion of these transactions.
FRE
EP
OR
T-McM
oRan C
OP
PE
R &
GO
LD IN
C. 2
010 A
nnual Rep
ort
33
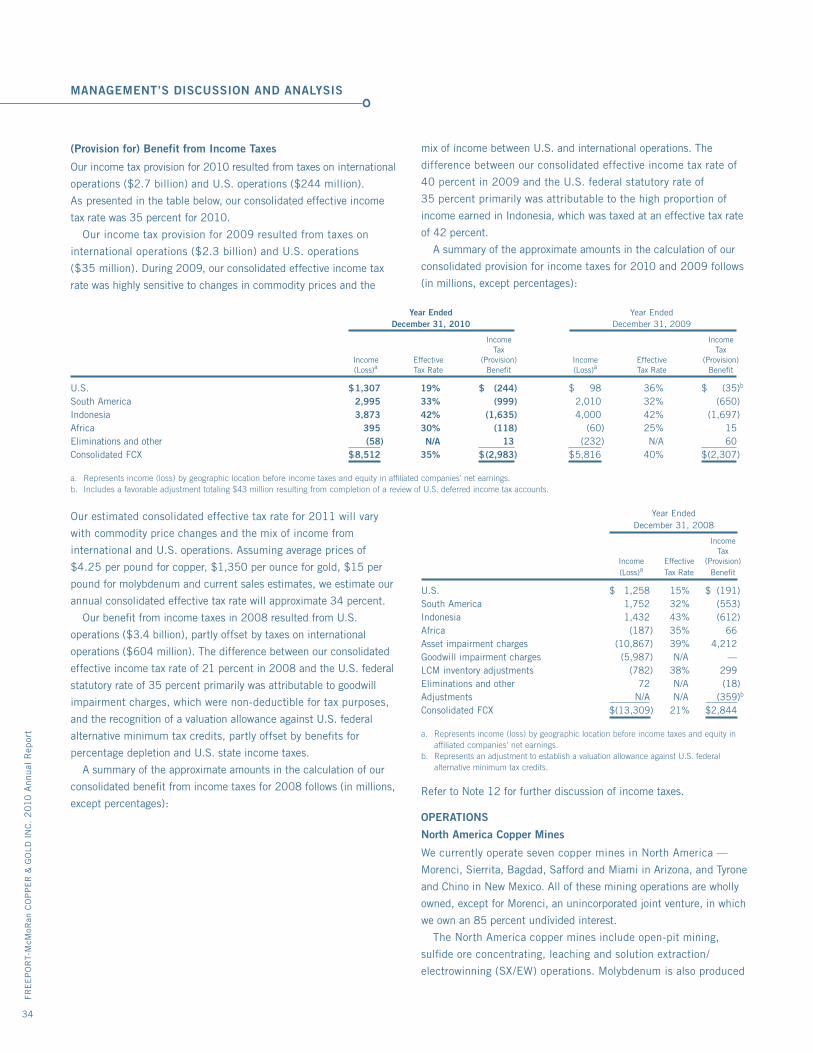
MANAGEMENT’S DISCUSSION AND ANALYSIS
FRE
EP
OR
T-M
cMoR
an C
OP
PE
R &
GO
LD I
NC
. 2
010
Ann
ual
Rep
ort
34
(Provision for) Benefit from Income Taxes
Our income tax provision for 2010 resulted from taxes on international
operations ($2.7 billion) and U.S. operations ($244 million).
As presented in the table below, our consolidated effective income
tax rate was 35 percent for 2010.
Our income tax provision for 2009 resulted from taxes on
international operations ($2.3 billion) and U.S. operations
($35 million). During 2009, our consolidated effective income tax
rate was highly sensitive to changes in commodity prices and the
mix of income between U.S. and international operations. The
difference between our consolidated effective income tax rate of
40 percent in 2009 and the U.S. federal statutory rate of
35 percent primarily was attributable to the high proportion of
income earned in Indonesia, which was taxed at an effective tax rate
of 42 percent.
A summary of the approximate amounts in the calculation of our
consolidated provision for income taxes for 2010 and 2009 follows
(in millions, except percentages):
Year Ended Year Ended December 31, 2010 December 31, 2009
Income Income Tax Tax Income Effective (Provision) Income Effective (Provision) (Loss)a Tax Rate Benefit (Loss)a Tax Rate Benefit
U.S. $ 1,307 19% $ (244) $ 98 36% $ (35)b
South America 2,995 33% (999) 2,010 32% (650)Indonesia 3,873 42% (1,635) 4,000 42% (1,697)Africa 395 30% (118) (60) 25% 15Eliminations and other (58) N/A 13 (232) N/A 60Consolidated FCX $ 8,512 35% $ (2,983) $ 5,816 40% $ (2,307)
a. Represents income (loss) by geographic location before income taxes and equity in affiliated companies’ net earnings.b. Includes a favorable adjustment totaling $43 million resulting from completion of a review of U.S. deferred income tax accounts.
Our estimated consolidated effective tax rate for 2011 will vary
with commodity price changes and the mix of income from
international and U.S. operations. Assuming average prices of
$4.25 per pound for copper, $1,350 per ounce for gold, $15 per
pound for molybdenum and current sales estimates, we estimate our
annual consolidated effective tax rate will approximate 34 percent.
Our benefit from income taxes in 2008 resulted from U.S.
operations ($3.4 billion), partly offset by taxes on international
operations ($604 million). The difference between our consolidated
effective income tax rate of 21 percent in 2008 and the U.S. federal
statutory rate of 35 percent primarily was attributable to goodwill
impairment charges, which were non-deductible for tax purposes,
and the recognition of a valuation allowance against U.S. federal
alternative minimum tax credits, partly offset by benefits for
percentage depletion and U.S. state income taxes.
A summary of the approximate amounts in the calculation of our
consolidated benefit from income taxes for 2008 follows (in millions,
except percentages):
Year Ended December 31, 2008
Income Tax Income Effective (Provision) (Loss)a Tax Rate Benefit
U.S. $ 1,258 15% $ (191)South America 1,752 32% (553)Indonesia 1,432 43% (612)Africa (187) 35% 66Asset impairment charges (10,867) 39% 4,212Goodwill impairment charges (5,987) N/A —LCM inventory adjustments (782) 38% 299Eliminations and other 72 N/A (18)Adjustments N/A N/A (359)b
Consolidated FCX $ (13,309) 21% $ 2,844
a. Represents income (loss) by geographic location before income taxes and equity in affiliated companies’ net earnings.
b. Represents an adjustment to establish a valuation allowance against U.S. federal alternative minimum tax credits.
Refer to Note 12 for further discussion of income taxes.
OPERATIONS
North America Copper Mines
We currently operate seven copper mines in North America —
Morenci, Sierrita, Bagdad, Safford and Miami in Arizona, and Tyrone
and Chino in New Mexico. All of these mining operations are wholly
owned, except for Morenci, an unincorporated joint venture, in which
we own an 85 percent undivided interest.
The North America copper mines include open-pit mining,
sulfide ore concentrating, leaching and solution extraction/
electrowinning (SX/EW) operations. Molybdenum is also produced
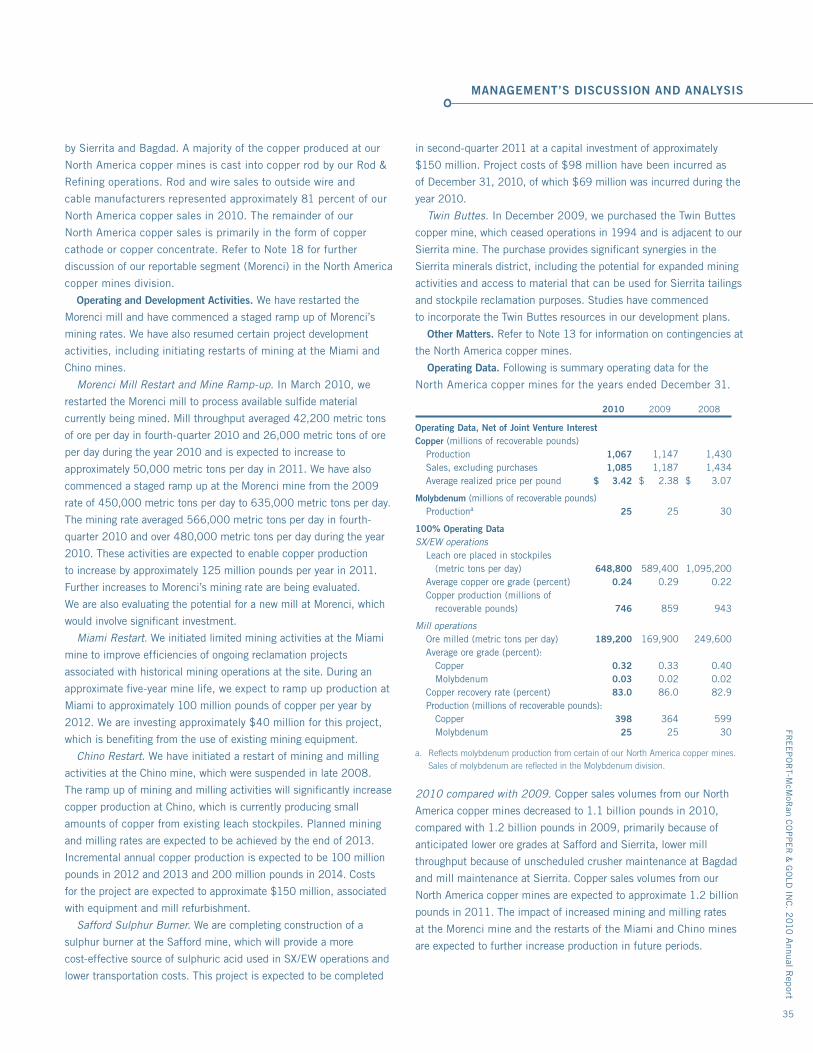
MANAGEMENT’S DISCUSSION AND ANALYSIS
by Sierrita and Bagdad. A majority of the copper produced at our
North America copper mines is cast into copper rod by our Rod &
Refining operations. Rod and wire sales to outside wire and
cable manufacturers represented approximately 81 percent of our
North America copper sales in 2010. The remainder of our
North America copper sales is primarily in the form of copper
cathode or copper concentrate. Refer to Note 18 for further
discussion of our reportable segment (Morenci) in the North America
copper mines division.
Operating and Development Activities. We have restarted the
Morenci mill and have commenced a staged ramp up of Morenci’s
mining rates. We have also resumed certain project development
activities, including initiating restarts of mining at the Miami and
Chino mines.
Morenci Mill Restart and Mine Ramp-up. In March 2010, we
restarted the Morenci mill to process available sulfide material
currently being mined. Mill throughput averaged 42,200 metric tons
of ore per day in fourth-quarter 2010 and 26,000 metric tons of ore
per day during the year 2010 and is expected to increase to
approximately 50,000 metric tons per day in 2011. We have also
commenced a staged ramp up at the Morenci mine from the 2009
rate of 450,000 metric tons per day to 635,000 metric tons per day.
The mining rate averaged 566,000 metric tons per day in fourth-
quarter 2010 and over 480,000 metric tons per day during the year
2010. These activities are expected to enable copper production
to increase by approximately 125 million pounds per year in 2011.
Further increases to Morenci’s mining rate are being evaluated.
We are also evaluating the potential for a new mill at Morenci, which
would involve significant investment.
Miami Restart. We initiated limited mining activities at the Miami
mine to improve efficiencies of ongoing reclamation projects
associated with historical mining operations at the site. During an
approximate five-year mine life, we expect to ramp up production at
Miami to approximately 100 million pounds of copper per year by
2012. We are investing approximately $40 million for this project,
which is benefiting from the use of existing mining equipment.
Chino Restart. We have initiated a restart of mining and milling
activities at the Chino mine, which were suspended in late 2008.
The ramp up of mining and milling activities will significantly increase
copper production at Chino, which is currently producing small
amounts of copper from existing leach stockpiles. Planned mining
and milling rates are expected to be achieved by the end of 2013.
Incremental annual copper production is expected to be 100 million
pounds in 2012 and 2013 and 200 million pounds in 2014. Costs
for the project are expected to approximate $150 million, associated
with equipment and mill refurbishment.
Safford Sulphur Burner. We are completing construction of a
sulphur burner at the Safford mine, which will provide a more
cost-effective source of sulphuric acid used in SX/EW operations and
lower transportation costs. This project is expected to be completed
in second-quarter 2011 at a capital investment of approximately
$150 million. Project costs of $98 million have been incurred as
of December 31, 2010, of which $69 million was incurred during the
year 2010.
Twin Buttes. In December 2009, we purchased the Twin Buttes
copper mine, which ceased operations in 1994 and is adjacent to our
Sierrita mine. The purchase provides significant synergies in the
Sierrita minerals district, including the potential for expanded mining
activities and access to material that can be used for Sierrita tailings
and stockpile reclamation purposes. Studies have commenced
to incorporate the Twin Buttes resources in our development plans.
Other Matters. Refer to Note 13 for information on contingencies at
the North America copper mines.
Operating Data. Following is summary operating data for the
North America copper mines for the years ended December 31.
2010 2009 2008
Operating Data, Net of Joint Venture InterestCopper (millions of recoverable pounds) Production 1,067 1,147 1,430 Sales, excluding purchases 1,085 1,187 1,434 Average realized price per pound $ 3.42 $ 2.38 $ 3.07
Molybdenum (millions of recoverable pounds) Productiona 25 25 30
100% Operating DataSX/EW operations Leach ore placed in stockpiles (metric tons per day) 648,800 589,400 1,095,200 Average copper ore grade (percent) 0.24 0.29 0.22 Copper production (millions of recoverable pounds) 746 859 943
Mill operations Ore milled (metric tons per day) 189,200 169,900 249,600 Average ore grade (percent): Copper 0.32 0.33 0.40 Molybdenum 0.03 0.02 0.02 Copper recovery rate (percent) 83.0 86.0 82.9 Production (millions of recoverable pounds): Copper 398 364 599 Molybdenum 25 25 30
a. Reflects molybdenum production from certain of our North America copper mines. Sales of molybdenum are reflected in the Molybdenum division.
2010 compared with 2009. Copper sales volumes from our North
America copper mines decreased to 1.1 billion pounds in 2010,
compared with 1.2 billion pounds in 2009, primarily because of
anticipated lower ore grades at Safford and Sierrita, lower mill
throughput because of unscheduled crusher maintenance at Bagdad
and mill maintenance at Sierrita. Copper sales volumes from our
North America copper mines are expected to approximate 1.2 billion
pounds in 2011. The impact of increased mining and milling rates
at the Morenci mine and the restarts of the Miami and Chino mines
are expected to further increase production in future periods.
FRE
EP
OR
T-McM
oRan C
OP
PE
R &
GO
LD IN
C. 2
010 A
nnual Rep
ort
35
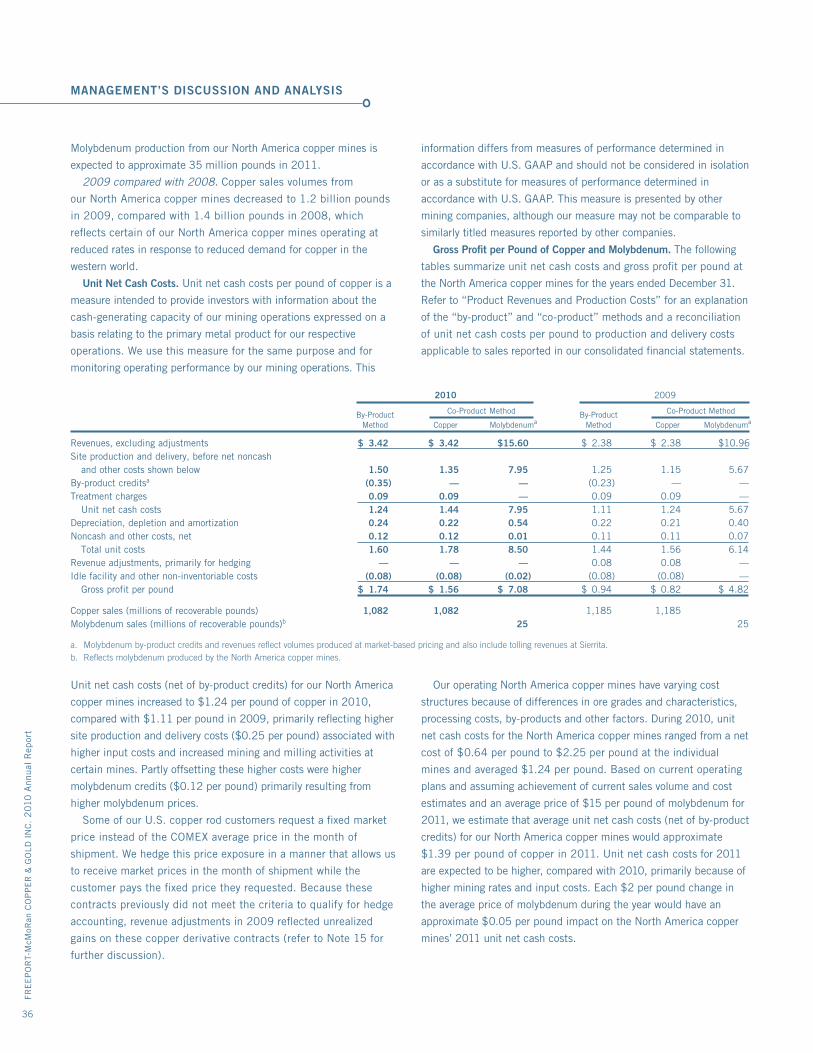
MANAGEMENT’S DISCUSSION AND ANALYSIS
FRE
EP
OR
T-M
cMoR
an C
OP
PE
R &
GO
LD I
NC
. 2
010
Ann
ual
Rep
ort
36
Molybdenum production from our North America copper mines is
expected to approximate 35 million pounds in 2011.
2009 compared with 2008. Copper sales volumes from
our North America copper mines decreased to 1.2 billion pounds
in 2009, compared with 1.4 billion pounds in 2008, which
reflects certain of our North America copper mines operating at
reduced rates in response to reduced demand for copper in the
western world.
Unit Net Cash Costs. Unit net cash costs per pound of copper is a
measure intended to provide investors with information about the
cash-generating capacity of our mining operations expressed on a
basis relating to the primary metal product for our respective
operations. We use this measure for the same purpose and for
monitoring operating performance by our mining operations. This
information differs from measures of performance determined in
accordance with U.S. GAAP and should not be considered in isolation
or as a substitute for measures of performance determined in
accordance with U.S. GAAP. This measure is presented by other
mining companies, although our measure may not be comparable to
similarly titled measures reported by other companies.
Gross Profit per Pound of Copper and Molybdenum. The following
tables summarize unit net cash costs and gross profit per pound at
the North America copper mines for the years ended December 31.
Refer to “Product Revenues and Production Costs” for an explanation
of the “by-product” and “co-product” methods and a reconciliation
of unit net cash costs per pound to production and delivery costs
applicable to sales reported in our consolidated financial statements.
2010 2009
By-Product Co-Product Method By-Product Co-Product Method
Method Copper Molybdenuma Method Copper Molybdenuma
Revenues, excluding adjustments $ 3.42 $ 3.42 $ 15.60 $ 2.38 $ 2.38 $ 10.96Site production and delivery, before net noncash and other costs shown below 1.50 1.35 7.95 1.25 1.15 5.67By-product creditsa (0.35) — — (0.23) — —Treatment charges 0.09 0.09 — 0.09 0.09 — Unit net cash costs 1.24 1.44 7.95 1.11 1.24 5.67Depreciation, depletion and amortization 0.24 0.22 0.54 0.22 0.21 0.40Noncash and other costs, net 0.12 0.12 0.01 0.11 0.11 0.07 Total unit costs 1.60 1.78 8.50 1.44 1.56 6.14Revenue adjustments, primarily for hedging — — — 0.08 0.08 —Idle facility and other non-inventoriable costs (0.08) (0.08) (0.02) (0.08) (0.08) — Gross profit per pound $ 1.74 $ 1.56 $ 7.08 $ 0.94 $ 0.82 $ 4.82
Copper sales (millions of recoverable pounds) 1,082 1,082 1,185 1,185Molybdenum sales (millions of recoverable pounds)b 25 25
a. Molybdenum by-product credits and revenues reflect volumes produced at market-based pricing and also include tolling revenues at Sierrita.b. Reflects molybdenum produced by the North America copper mines.
Unit net cash costs (net of by-product credits) for our North America
copper mines increased to $1.24 per pound of copper in 2010,
compared with $1.11 per pound in 2009, primarily reflecting higher
site production and delivery costs ($0.25 per pound) associated with
higher input costs and increased mining and milling activities at
certain mines. Partly offsetting these higher costs were higher
molybdenum credits ($0.12 per pound) primarily resulting from
higher molybdenum prices.
Some of our U.S. copper rod customers request a fixed market
price instead of the COMEX average price in the month of
shipment. We hedge this price exposure in a manner that allows us
to receive market prices in the month of shipment while the
customer pays the fixed price they requested. Because these
contracts previously did not meet the criteria to qualify for hedge
accounting, revenue adjustments in 2009 reflected unrealized
gains on these copper derivative contracts (refer to Note 15 for
further discussion).
Our operating North America copper mines have varying cost
structures because of differences in ore grades and characteristics,
processing costs, by-products and other factors. During 2010, unit
net cash costs for the North America copper mines ranged from a net
cost of $0.64 per pound to $2.25 per pound at the individual
mines and averaged $1.24 per pound. Based on current operating
plans and assuming achievement of current sales volume and cost
estimates and an average price of $15 per pound of molybdenum for
2011, we estimate that average unit net cash costs (net of by-product
credits) for our North America copper mines would approximate
$1.39 per pound of copper in 2011. Unit net cash costs for 2011
are expected to be higher, compared with 2010, primarily because of
higher mining rates and input costs. Each $2 per pound change in
the average price of molybdenum during the year would have an
approximate $0.05 per pound impact on the North America copper
mines’ 2011 unit net cash costs.
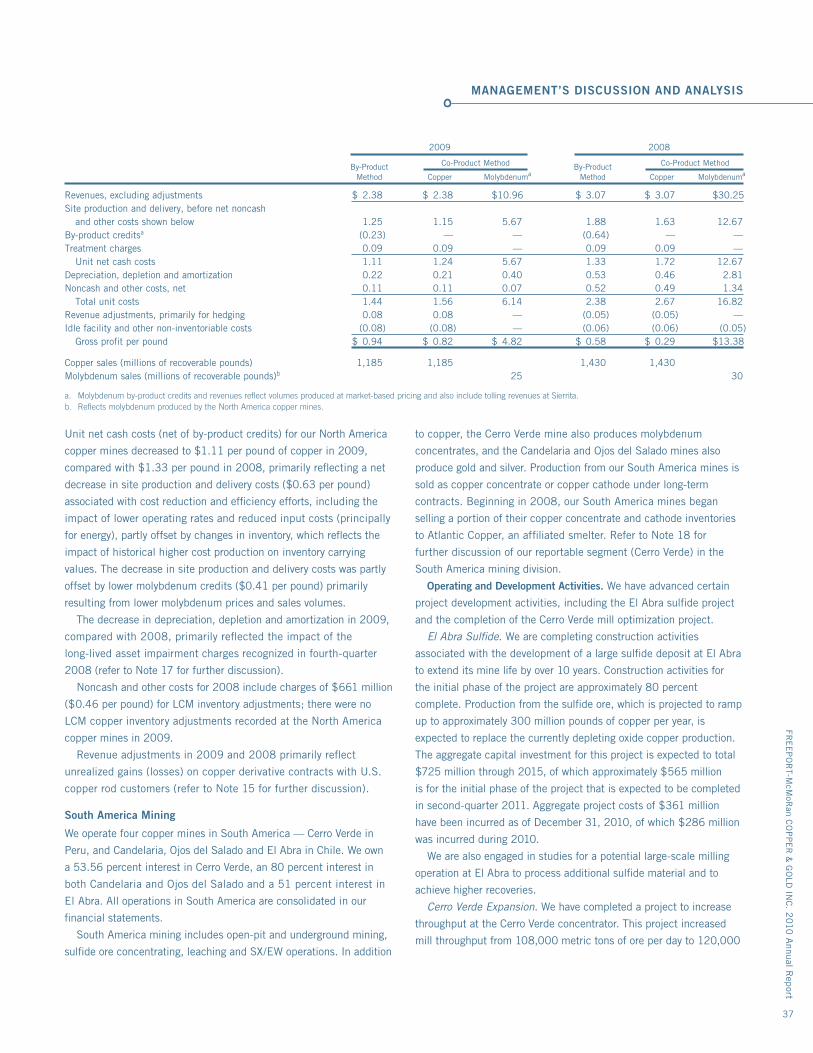
MANAGEMENT’S DISCUSSION AND ANALYSIS
2009 2008
By-Product Co-Product Method By-Product Co-Product Method
Method Copper Molybdenuma Method Copper Molybdenuma
Revenues, excluding adjustments $ 2.38 $ 2.38 $ 10.96 $ 3.07 $ 3.07 $ 30.25Site production and delivery, before net noncash and other costs shown below 1.25 1.15 5.67 1.88 1.63 12.67By-product creditsa (0.23) — — (0.64) — —Treatment charges 0.09 0.09 — 0.09 0.09 — Unit net cash costs 1.11 1.24 5.67 1.33 1.72 12.67Depreciation, depletion and amortization 0.22 0.21 0.40 0.53 0.46 2.81Noncash and other costs, net 0.11 0.11 0.07 0.52 0.49 1.34 Total unit costs 1.44 1.56 6.14 2.38 2.67 16.82Revenue adjustments, primarily for hedging 0.08 0.08 — (0.05) (0.05) —Idle facility and other non-inventoriable costs (0.08) (0.08) — (0.06) (0.06) (0.05) Gross profit per pound $ 0.94 $ 0.82 $ 4.82 $ 0.58 $ 0.29 $ 13.38
Copper sales (millions of recoverable pounds) 1,185 1,185 1,430 1,430Molybdenum sales (millions of recoverable pounds)b 25 30
a. Molybdenum by-product credits and revenues reflect volumes produced at market-based pricing and also include tolling revenues at Sierrita.b. Reflects molybdenum produced by the North America copper mines.
Unit net cash costs (net of by-product credits) for our North America
copper mines decreased to $1.11 per pound of copper in 2009,
compared with $1.33 per pound in 2008, primarily reflecting a net
decrease in site production and delivery costs ($0.63 per pound)
associated with cost reduction and efficiency efforts, including the
impact of lower operating rates and reduced input costs (principally
for energy), partly offset by changes in inventory, which reflects the
impact of historical higher cost production on inventory carrying
values. The decrease in site production and delivery costs was partly
offset by lower molybdenum credits ($0.41 per pound) primarily
resulting from lower molybdenum prices and sales volumes.
The decrease in depreciation, depletion and amortization in 2009,
compared with 2008, primarily reflected the impact of the
long-lived asset impairment charges recognized in fourth-quarter
2008 (refer to Note 17 for further discussion).
Noncash and other costs for 2008 include charges of $661 million
($0.46 per pound) for LCM inventory adjustments; there were no
LCM copper inventory adjustments recorded at the North America
copper mines in 2009.
Revenue adjustments in 2009 and 2008 primarily reflect
unrealized gains (losses) on copper derivative contracts with U.S.
copper rod customers (refer to Note 15 for further discussion).
South America Mining
We operate four copper mines in South America — Cerro Verde in
Peru, and Candelaria, Ojos del Salado and El Abra in Chile. We own
a 53.56 percent interest in Cerro Verde, an 80 percent interest in
both Candelaria and Ojos del Salado and a 51 percent interest in
El Abra. All operations in South America are consolidated in our
financial statements.
South America mining includes open-pit and underground mining,
sulfide ore concentrating, leaching and SX/EW operations. In addition
to copper, the Cerro Verde mine also produces molybdenum
concentrates, and the Candelaria and Ojos del Salado mines also
produce gold and silver. Production from our South America mines is
sold as copper concentrate or copper cathode under long-term
contracts. Beginning in 2008, our South America mines began
selling a portion of their copper concentrate and cathode inventories
to Atlantic Copper, an affiliated smelter. Refer to Note 18 for
further discussion of our reportable segment (Cerro Verde) in the
South America mining division.
Operating and Development Activities. We have advanced certain
project development activities, including the El Abra sulfide project
and the completion of the Cerro Verde mill optimization project.
El Abra Sulfide. We are completing construction activities
associated with the development of a large sulfide deposit at El Abra
to extend its mine life by over 10 years. Construction activities for
the initial phase of the project are approximately 80 percent
complete. Production from the sulfide ore, which is projected to ramp
up to approximately 300 million pounds of copper per year, is
expected to replace the currently depleting oxide copper production.
The aggregate capital investment for this project is expected to total
$725 million through 2015, of which approximately $565 million
is for the initial phase of the project that is expected to be completed
in second-quarter 2011. Aggregate project costs of $361 million
have been incurred as of December 31, 2010, of which $286 million
was incurred during 2010.
We are also engaged in studies for a potential large-scale milling
operation at El Abra to process additional sulfide material and to
achieve higher recoveries.
Cerro Verde Expansion. We have completed a project to increase
throughput at the Cerro Verde concentrator. This project increased
mill throughput from 108,000 metric tons of ore per day to 120,000
FRE
EP
OR
T-McM
oRan C
OP
PE
R &
GO
LD IN
C. 2
010 A
nnual Rep
ort
37
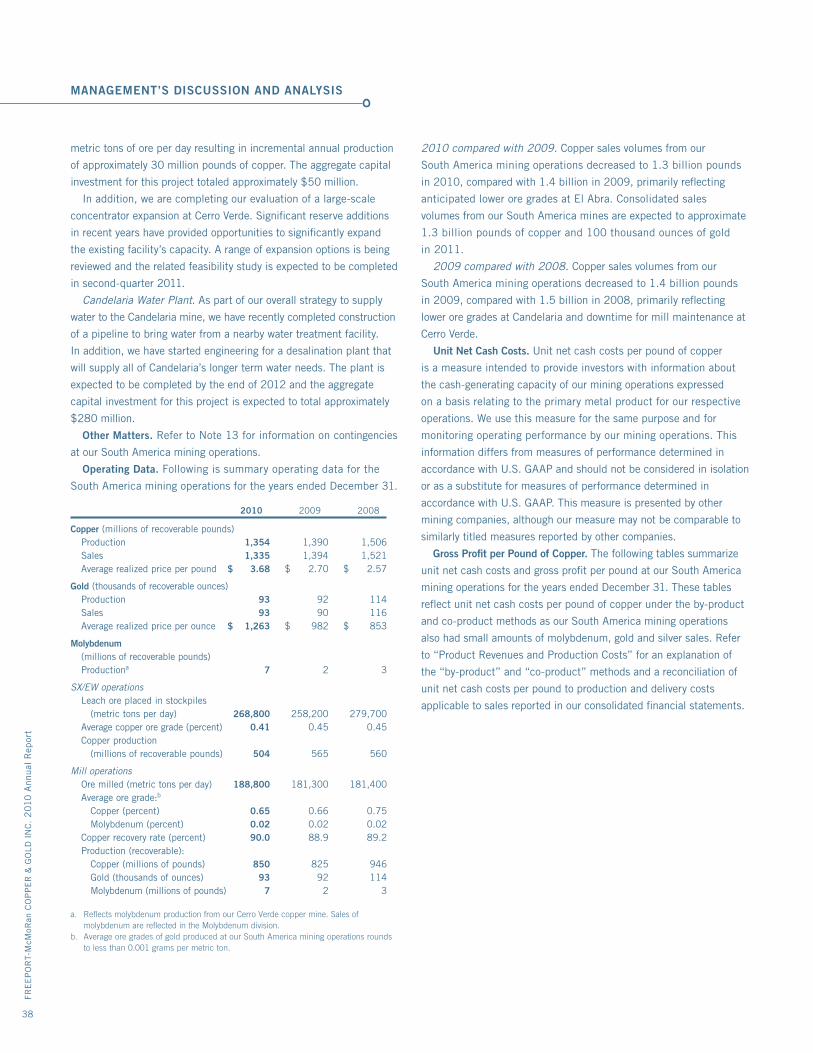
MANAGEMENT’S DISCUSSION AND ANALYSIS
FRE
EP
OR
T-M
cMoR
an C
OP
PE
R &
GO
LD I
NC
. 2
010
Ann
ual
Rep
ort
38
metric tons of ore per day resulting in incremental annual production
of approximately 30 million pounds of copper. The aggregate capital
investment for this project totaled approximately $50 million.
In addition, we are completing our evaluation of a large-scale
concentrator expansion at Cerro Verde. Significant reserve additions
in recent years have provided opportunities to significantly expand
the existing facility’s capacity. A range of expansion options is being
reviewed and the related feasibility study is expected to be completed
in second-quarter 2011.
Candelaria Water Plant. As part of our overall strategy to supply
water to the Candelaria mine, we have recently completed construction
of a pipeline to bring water from a nearby water treatment facility.
In addition, we have started engineering for a desalination plant that
will supply all of Candelaria’s longer term water needs. The plant is
expected to be completed by the end of 2012 and the aggregate
capital investment for this project is expected to total approximately
$280 million.
Other Matters. Refer to Note 13 for information on contingencies
at our South America mining operations.
Operating Data. Following is summary operating data for the
South America mining operations for the years ended December 31.
2010 2009 2008
Copper (millions of recoverable pounds) Production 1,354 1,390 1,506 Sales 1,335 1,394 1,521 Average realized price per pound $ 3.68 $ 2.70 $ 2.57
Gold (thousands of recoverable ounces) Production 93 92 114 Sales 93 90 116 Average realized price per ounce $ 1,263 $ 982 $ 853
Molybdenum (millions of recoverable pounds) Productiona 7 2 3
SX/EW operations Leach ore placed in stockpiles (metric tons per day) 268,800 258,200 279,700 Average copper ore grade (percent) 0.41 0.45 0.45 Copper production (millions of recoverable pounds) 504 565 560
Mill operations Ore milled (metric tons per day) 188,800 181,300 181,400 Average ore grade:b
Copper (percent) 0.65 0.66 0.75 Molybdenum (percent) 0.02 0.02 0.02 Copper recovery rate (percent) 90.0 88.9 89.2 Production (recoverable): Copper (millions of pounds) 850 825 946 Gold (thousands of ounces) 93 92 114 Molybdenum (millions of pounds) 7 2 3
a. Reflects molybdenum production from our Cerro Verde copper mine. Sales of molybdenum are reflected in the Molybdenum division.
b. Average ore grades of gold produced at our South America mining operations rounds to less than 0.001 grams per metric ton.
2010 compared with 2009. Copper sales volumes from our
South America mining operations decreased to 1.3 billion pounds
in 2010, compared with 1.4 billion in 2009, primarily reflecting
anticipated lower ore grades at El Abra. Consolidated sales
volumes from our South America mines are expected to approximate
1.3 billion pounds of copper and 100 thousand ounces of gold
in 2011.
2009 compared with 2008. Copper sales volumes from our
South America mining operations decreased to 1.4 billion pounds
in 2009, compared with 1.5 billion in 2008, primarily reflecting
lower ore grades at Candelaria and downtime for mill maintenance at
Cerro Verde.
Unit Net Cash Costs. Unit net cash costs per pound of copper
is a measure intended to provide investors with information about
the cash-generating capacity of our mining operations expressed
on a basis relating to the primary metal product for our respective
operations. We use this measure for the same purpose and for
monitoring operating performance by our mining operations. This
information differs from measures of performance determined in
accordance with U.S. GAAP and should not be considered in isolation
or as a substitute for measures of performance determined in
accordance with U.S. GAAP. This measure is presented by other
mining companies, although our measure may not be comparable to
similarly titled measures reported by other companies.
Gross Profit per Pound of Copper. The following tables summarize
unit net cash costs and gross profit per pound at our South America
mining operations for the years ended December 31. These tables
reflect unit net cash costs per pound of copper under the by-product
and co-product methods as our South America mining operations
also had small amounts of molybdenum, gold and silver sales. Refer
to “Product Revenues and Production Costs” for an explanation of
the “by-product” and “co-product” methods and a reconciliation of
unit net cash costs per pound to production and delivery costs
applicable to sales reported in our consolidated financial statements.
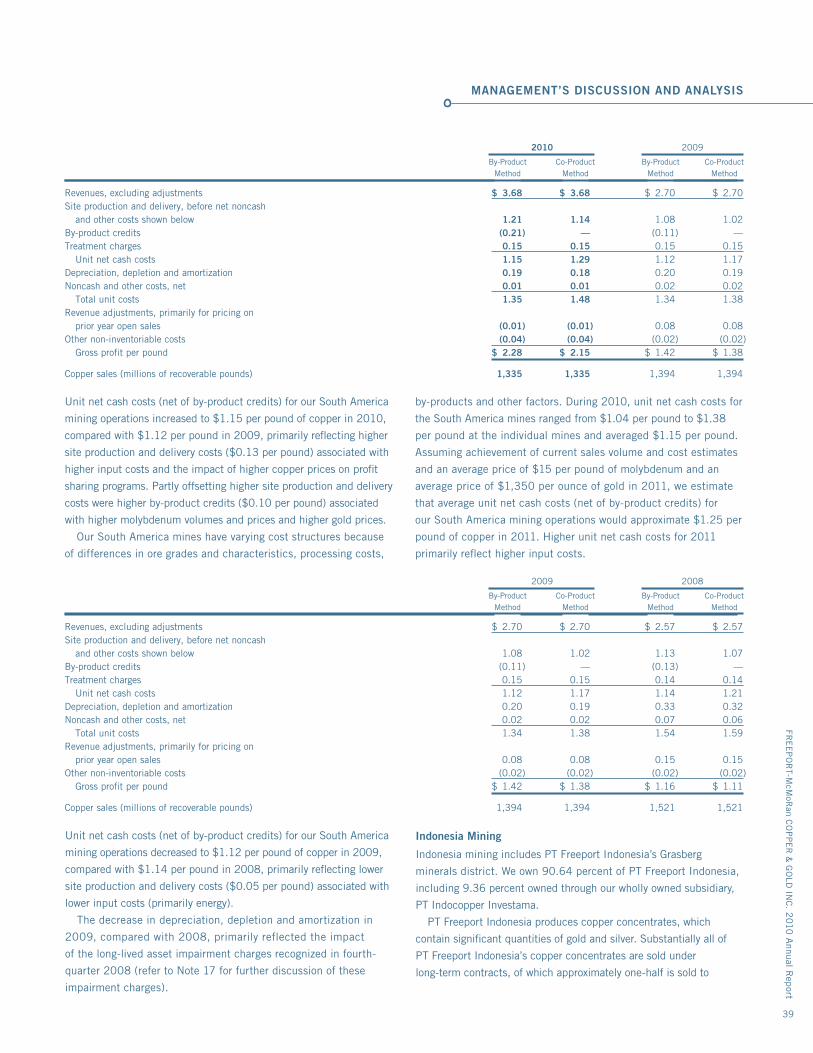
MANAGEMENT’S DISCUSSION AND ANALYSIS
2010 2009
By-Product Co-Product By-Product Co-Product Method Method Method Method
Revenues, excluding adjustments $ 3.68 $ 3.68 $ 2.70 $ 2.70Site production and delivery, before net noncash and other costs shown below 1.21 1.14 1.08 1.02By-product credits (0.21) — (0.11) —Treatment charges 0.15 0.15 0.15 0.15 Unit net cash costs 1.15 1.29 1.12 1.17Depreciation, depletion and amortization 0.19 0.18 0.20 0.19Noncash and other costs, net 0.01 0.01 0.02 0.02 Total unit costs 1.35 1.48 1.34 1.38Revenue adjustments, primarily for pricing on prior year open sales (0.01) (0.01) 0.08 0.08Other non-inventoriable costs (0.04) (0.04) (0.02) (0.02) Gross profit per pound $ 2.28 $ 2.15 $ 1.42 $ 1.38
Copper sales (millions of recoverable pounds) 1,335 1,335 1,394 1,394
Unit net cash costs (net of by-product credits) for our South America
mining operations increased to $1.15 per pound of copper in 2010,
compared with $1.12 per pound in 2009, primarily reflecting higher
site production and delivery costs ($0.13 per pound) associated with
higher input costs and the impact of higher copper prices on profit
sharing programs. Partly offsetting higher site production and delivery
costs were higher by-product credits ($0.10 per pound) associated
with higher molybdenum volumes and prices and higher gold prices.
Our South America mines have varying cost structures because
of differences in ore grades and characteristics, processing costs,
by-products and other factors. During 2010, unit net cash costs for
the South America mines ranged from $1.04 per pound to $1.38
per pound at the individual mines and averaged $1.15 per pound.
Assuming achievement of current sales volume and cost estimates
and an average price of $15 per pound of molybdenum and an
average price of $1,350 per ounce of gold in 2011, we estimate
that average unit net cash costs (net of by-product credits) for
our South America mining operations would approximate $1.25 per
pound of copper in 2011. Higher unit net cash costs for 2011
primarily reflect higher input costs.
2009 2008
By-Product Co-Product By-Product Co-Product Method Method Method Method
Revenues, excluding adjustments $ 2.70 $ 2.70 $ 2.57 $ 2.57Site production and delivery, before net noncash and other costs shown below 1.08 1.02 1.13 1.07By-product credits (0.11) — (0.13) —Treatment charges 0.15 0.15 0.14 0.14 Unit net cash costs 1.12 1.17 1.14 1.21Depreciation, depletion and amortization 0.20 0.19 0.33 0.32Noncash and other costs, net 0.02 0.02 0.07 0.06 Total unit costs 1.34 1.38 1.54 1.59Revenue adjustments, primarily for pricing on prior year open sales 0.08 0.08 0.15 0.15Other non-inventoriable costs (0.02) (0.02) (0.02) (0.02) Gross profit per pound $ 1.42 $ 1.38 $ 1.16 $ 1.11
Copper sales (millions of recoverable pounds) 1,394 1,394 1,521 1,521
Unit net cash costs (net of by-product credits) for our South America
mining operations decreased to $1.12 per pound of copper in 2009,
compared with $1.14 per pound in 2008, primarily reflecting lower
site production and delivery costs ($0.05 per pound) associated with
lower input costs (primarily energy).
The decrease in depreciation, depletion and amortization in
2009, compared with 2008, primarily reflected the impact
of the long-lived asset impairment charges recognized in fourth-
quarter 2008 (refer to Note 17 for further discussion of these
impairment charges).
Indonesia Mining
Indonesia mining includes PT Freeport Indonesia’s Grasberg
minerals district. We own 90.64 percent of PT Freeport Indonesia,
including 9.36 percent owned through our wholly owned subsidiary,
PT Indocopper Investama.
PT Freeport Indonesia produces copper concentrates, which
contain significant quantities of gold and silver. Substantially all of
PT Freeport Indonesia’s copper concentrates are sold under
long-term contracts, of which approximately one-half is sold to
FRE
EP
OR
T-McM
oRan C
OP
PE
R &
GO
LD IN
C. 2
010 A
nnual Rep
ort
39
MANAGEMENT’S DISCUSSION AND ANALYSIS
FRE
EP
OR
T-M
cMoR
an C
OP
PE
R &
GO
LD I
NC
. 2
010
Ann
ual
Rep
ort
40
affiliated smelters, Atlantic Copper and PT Smelting (PT Freeport
Indonesia’s 25-percent owned copper smelter and refinery in
Indonesia — refer to Note 2 for further discussion), and the remainder
to other customers.
Refer to Note 2 for further discussion of our joint ventures with
Rio Tinto plc and to Note 14 for further discussion of PT Freeport
Indonesia’s Contract of Work with the Government of Indonesia.
Development Activities. We have several projects in progress in the
Grasberg minerals district, including development of the large-scale,
high-grade underground ore bodies located beneath and adjacent
to the Grasberg open pit. Aggregate capital spending on these
projects approximated $288 million for the year 2010 ($228 million
net to PT Freeport Indonesia). Over the next five years, aggregate
capital spending on these projects is expected to average $600 million
per year ($470 million net to PT Freeport Indonesia). Considering
the long-term nature and large size of these projects, actual costs
could differ materially from these estimates.
The following provides additional information on these projects,
including the continued development of the Common Infrastructure
project, the Grasberg Block Cave and Big Gossan underground mines,
the completed expansion of the Deep Ore Zone (DOZ) underground
mine and development of the Deep Mill Level Zone (DMLZ) ore body.
Common Infrastructure and Grasberg Block Cave. In 2004,
PT Freeport Indonesia commenced its Common Infrastructure project
to provide access to its large undeveloped underground ore bodies
located in the Grasberg minerals district through a tunnel system
located approximately 400 meters deeper than its existing
underground tunnel system. In addition to providing access to our
underground ore bodies, the tunnel system will enable PT Freeport
Indonesia to conduct future exploration in prospective areas
associated with currently identified ore bodies. The tunnel system has
reached the Big Gossan terminal and development of the lower
Big Gossan infrastructure is ongoing. We have also advanced
development of the Grasberg spur and have completed the tunneling
required to reach the Grasberg underground ore body. Development
continues on the Grasberg Block Cave terminal infrastructure and
mine access.
In 2008, we completed the feasibility study for the development of
the Grasberg Block Cave underground mine, which accounts for over
one-third of our reserves in Indonesia. Production at the Grasberg
Block Cave mine is currently scheduled to commence at the end of
mining the Grasberg open pit, which is currently expected to continue
until mid-2016. The timing of the transition to underground
Grasberg Block Cave mine development will continue to be assessed.
Aggregate mine development capital for the Grasberg Block Cave
mine and associated Common Infrastructure is expected to
approximate $3.7 billion (to be incurred between 2008 and 2021),
with PT Freeport Indonesia’s share totaling approximately
$3.4 billion. Aggregate project costs totaling $260 million have been
incurred through December 31, 2010, of which $143 million was
incurred during 2010. Targeted production rates once the Grasberg
Block Cave mining operation reaches full capacity are expected to
approximate 160,000 metric tons of ore per day.
Big Gossan. The Big Gossan underground mine is a high-grade
deposit located near PT Freeport Indonesia’s existing milling
complex. The Big Gossan mine is being developed as an open-stope
mine with backfill consisting of mill tailings and cement, an
established mining methodology expected to be higher cost than the
block-cave method used at the DOZ mine. Production, which began
in fourth-quarter 2010, is designed to ramp up to 7,000 metric tons
of ore per day by late 2012 (equal to average annual aggregate
incremental production of 125 million pounds of copper and 65,000
ounces of gold, with PT Freeport Indonesia receiving 60 percent of
these amounts). The aggregate capital investment for this project is
currently estimated at approximately $535 million, with PT Freeport
Indonesia’s share totaling approximately $500 million. Aggregate
project costs of $444 million have been incurred through
December 31, 2010, of which $67 million was incurred during 2010.
DOZ Expansion. PT Freeport Indonesia’s further expansion of
the DOZ mine to 80,000 metric tons of ore per day was completed in
first-quarter 2010. The capital cost for this expansion approximated
$100 million, with PT Freeport Indonesia’s share totaling
approximately $60 million. The success of the development of the
DOZ mine, one of the world’s largest underground mines, provides
confidence in the future development of PT Freeport Indonesia’s
large-scale undeveloped underground ore bodies.
DMLZ. The DMLZ ore body lies below the DOZ mine at the
2,590-meter elevation and represents the downward continuation of
mineralization in the Ertsberg East Skarn system and neighboring
Ertsberg porphyry. The DMLZ feasibility study was completed
in fourth-quarter 2009. We plan to mine the ore body using a
block-cave method with production beginning in 2015, near
completion of mining at the DOZ. Drilling efforts continue to
determine the extent of this ore body. We continue to develop the
Common Infrastructure project and tunnels from mill level. In 2009,
we completed a portion of the spur to the DMLZ mine and reached
the edge of the DMLZ terminal and development continued on
terminal infrastructure and mine access in 2010. Aggregate mine
development capital costs for the DMLZ are expected to
approximate $2.0 billion (to be incurred from 2009 to 2020),
with PT Freeport Indonesia’s share totaling approximately $1.2 billion.
Aggregate project costs totaling $103 million have been incurred
through December 31, 2010, including $78 million during 2010.
Targeted production rates once the DMLZ mining operation reaches
full capacity are expected to approximate 80,000 metric tons of
ore per day.
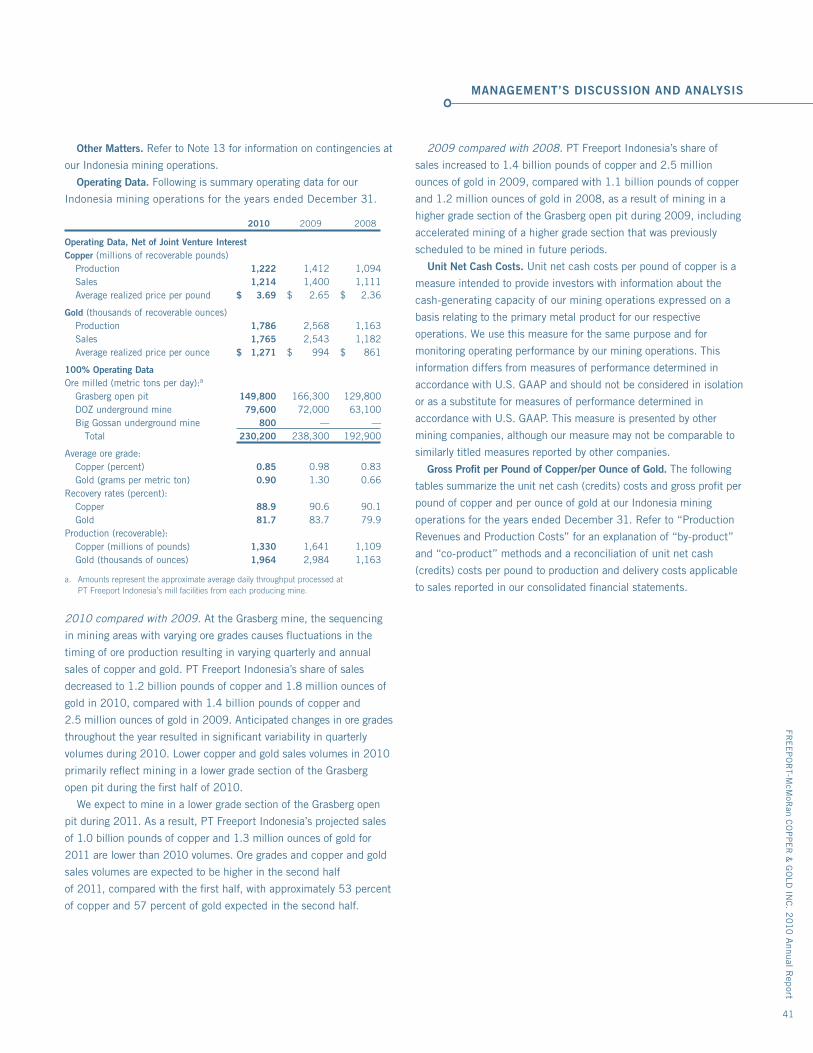
Other Matters. Refer to Note 13 for information on contingencies at
our Indonesia mining operations.
Operating Data. Following is summary operating data for our
Indonesia mining operations for the years ended December 31.
2010 2009 2008
Operating Data, Net of Joint Venture InterestCopper (millions of recoverable pounds) Production 1,222 1,412 1,094 Sales 1,214 1,400 1,111 Average realized price per pound $ 3.69 $ 2.65 $ 2.36
Gold (thousands of recoverable ounces) Production 1,786 2,568 1,163 Sales 1,765 2,543 1,182 Average realized price per ounce $ 1,271 $ 994 $ 861
100% Operating DataOre milled (metric tons per day):a
Grasberg open pit 149,800 166,300 129,800 DOZ underground mine 79,600 72,000 63,100 Big Gossan underground mine 800 — — Total 230,200 238,300 192,900
Average ore grade: Copper (percent) 0.85 0.98 0.83 Gold (grams per metric ton) 0.90 1.30 0.66Recovery rates (percent): Copper 88.9 90.6 90.1 Gold 81.7 83.7 79.9Production (recoverable): Copper (millions of pounds) 1,330 1,641 1,109 Gold (thousands of ounces) 1,964 2,984 1,163 a. Amounts represent the approximate average daily throughput processed at
PT Freeport Indonesia’s mill facilities from each producing mine.
2010 compared with 2009. At the Grasberg mine, the sequencing
in mining areas with varying ore grades causes fluctuations in the
timing of ore production resulting in varying quarterly and annual
sales of copper and gold. PT Freeport Indonesia’s share of sales
decreased to 1.2 billion pounds of copper and 1.8 million ounces of
gold in 2010, compared with 1.4 billion pounds of copper and
2.5 million ounces of gold in 2009. Anticipated changes in ore grades
throughout the year resulted in significant variability in quarterly
volumes during 2010. Lower copper and gold sales volumes in 2010
primarily reflect mining in a lower grade section of the Grasberg
open pit during the first half of 2010.
We expect to mine in a lower grade section of the Grasberg open
pit during 2011. As a result, PT Freeport Indonesia’s projected sales
of 1.0 billion pounds of copper and 1.3 million ounces of gold for
2011 are lower than 2010 volumes. Ore grades and copper and gold
sales volumes are expected to be higher in the second half
of 2011, compared with the first half, with approximately 53 percent
of copper and 57 percent of gold expected in the second half.
2009 compared with 2008. PT Freeport Indonesia’s share of
sales increased to 1.4 billion pounds of copper and 2.5 million
ounces of gold in 2009, compared with 1.1 billion pounds of copper
and 1.2 million ounces of gold in 2008, as a result of mining in a
higher grade section of the Grasberg open pit during 2009, including
accelerated mining of a higher grade section that was previously
scheduled to be mined in future periods.
Unit Net Cash Costs. Unit net cash costs per pound of copper is a
measure intended to provide investors with information about the
cash-generating capacity of our mining operations expressed on a
basis relating to the primary metal product for our respective
operations. We use this measure for the same purpose and for
monitoring operating performance by our mining operations. This
information differs from measures of performance determined in
accordance with U.S. GAAP and should not be considered in isolation
or as a substitute for measures of performance determined in
accordance with U.S. GAAP. This measure is presented by other
mining companies, although our measure may not be comparable to
similarly titled measures reported by other companies.
Gross Profit per Pound of Copper/per Ounce of Gold. The following
tables summarize the unit net cash (credits) costs and gross profit per
pound of copper and per ounce of gold at our Indonesia mining
operations for the years ended December 31. Refer to “Production
Revenues and Production Costs” for an explanation of “by-product”
and “co-product” methods and a reconciliation of unit net cash
(credits) costs per pound to production and delivery costs applicable
to sales reported in our consolidated financial statements.
MANAGEMENT’S DISCUSSION AND ANALYSIS
FRE
EP
OR
T-McM
oRan C
OP
PE
R &
GO
LD IN
C. 2
010 A
nnual Rep
ort
41
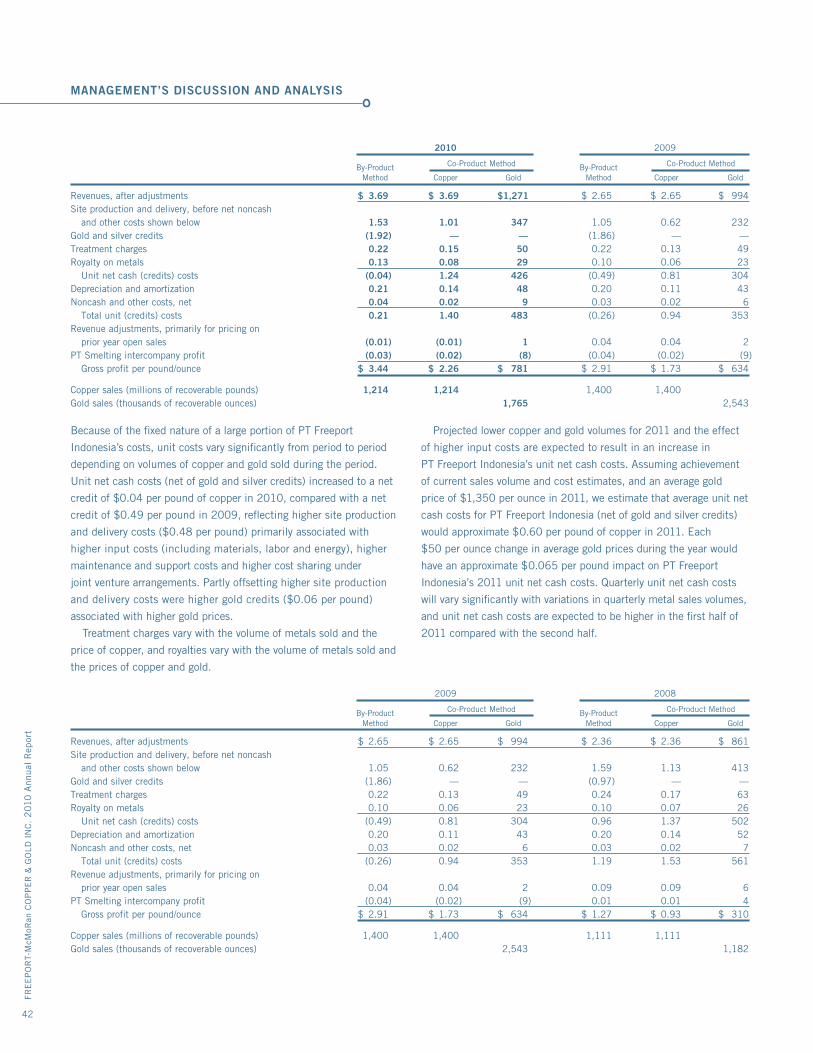
MANAGEMENT’S DISCUSSION AND ANALYSIS
FRE
EP
OR
T-M
cMoR
an C
OP
PE
R &
GO
LD I
NC
. 2
010
Ann
ual
Rep
ort
42
2010 2009
By-Product Co-Product Method By-Product Co-Product Method
Method Copper Gold Method Copper Gold
Revenues, after adjustments $ 3.69 $ 3.69 $ 1,271 $ 2.65 $ 2.65 $ 994Site production and delivery, before net noncash and other costs shown below 1.53 1.01 347 1.05 0.62 232Gold and silver credits (1.92) — — (1.86) — —Treatment charges 0.22 0.15 50 0.22 0.13 49Royalty on metals 0.13 0.08 29 0.10 0.06 23 Unit net cash (credits) costs (0.04) 1.24 426 (0.49) 0.81 304Depreciation and amortization 0.21 0.14 48 0.20 0.11 43Noncash and other costs, net 0.04 0.02 9 0.03 0.02 6 Total unit (credits) costs 0.21 1.40 483 (0.26) 0.94 353Revenue adjustments, primarily for pricing on prior year open sales (0.01) (0.01) 1 0.04 0.04 2PT Smelting intercompany profit (0.03) (0.02) (8) (0.04) (0.02) (9) Gross profit per pound/ounce $ 3.44 $ 2.26 $ 781 $ 2.91 $ 1.73 $ 634
Copper sales (millions of recoverable pounds) 1,214 1,214 1,400 1,400Gold sales (thousands of recoverable ounces) 1,765 2,543
Because of the fixed nature of a large portion of PT Freeport
Indonesia’s costs, unit costs vary significantly from period to period
depending on volumes of copper and gold sold during the period.
Unit net cash costs (net of gold and silver credits) increased to a net
credit of $0.04 per pound of copper in 2010, compared with a net
credit of $0.49 per pound in 2009, reflecting higher site production
and delivery costs ($0.48 per pound) primarily associated with
higher input costs (including materials, labor and energy), higher
maintenance and support costs and higher cost sharing under
joint venture arrangements. Partly offsetting higher site production
and delivery costs were higher gold credits ($0.06 per pound)
associated with higher gold prices.
Treatment charges vary with the volume of metals sold and the
price of copper, and royalties vary with the volume of metals sold and
the prices of copper and gold.
Projected lower copper and gold volumes for 2011 and the effect
of higher input costs are expected to result in an increase in
PT Freeport Indonesia’s unit net cash costs. Assuming achievement
of current sales volume and cost estimates, and an average gold
price of $1,350 per ounce in 2011, we estimate that average unit net
cash costs for PT Freeport Indonesia (net of gold and silver credits)
would approximate $0.60 per pound of copper in 2011. Each
$50 per ounce change in average gold prices during the year would
have an approximate $0.065 per pound impact on PT Freeport
Indonesia’s 2011 unit net cash costs. Quarterly unit net cash costs
will vary significantly with variations in quarterly metal sales volumes,
and unit net cash costs are expected to be higher in the first half of
2011 compared with the second half.
2009 2008
By-Product Co-Product Method By-Product Co-Product Method
Method Copper Gold Method Copper Gold
Revenues, after adjustments $ 2.65 $ 2.65 $ 994 $ 2.36 $ 2.36 $ 861Site production and delivery, before net noncash and other costs shown below 1.05 0.62 232 1.59 1.13 413Gold and silver credits (1.86) — — (0.97) — —Treatment charges 0.22 0.13 49 0.24 0.17 63Royalty on metals 0.10 0.06 23 0.10 0.07 26 Unit net cash (credits) costs (0.49) 0.81 304 0.96 1.37 502Depreciation and amortization 0.20 0.11 43 0.20 0.14 52Noncash and other costs, net 0.03 0.02 6 0.03 0.02 7 Total unit (credits) costs (0.26) 0.94 353 1.19 1.53 561Revenue adjustments, primarily for pricing on prior year open sales 0.04 0.04 2 0.09 0.09 6PT Smelting intercompany profit (0.04) (0.02) (9) 0.01 0.01 4 Gross profit per pound/ounce $ 2.91 $ 1.73 $ 634 $ 1.27 $ 0.93 $ 310
Copper sales (millions of recoverable pounds) 1,400 1,400 1,111 1,111Gold sales (thousands of recoverable ounces) 2,543 1,182
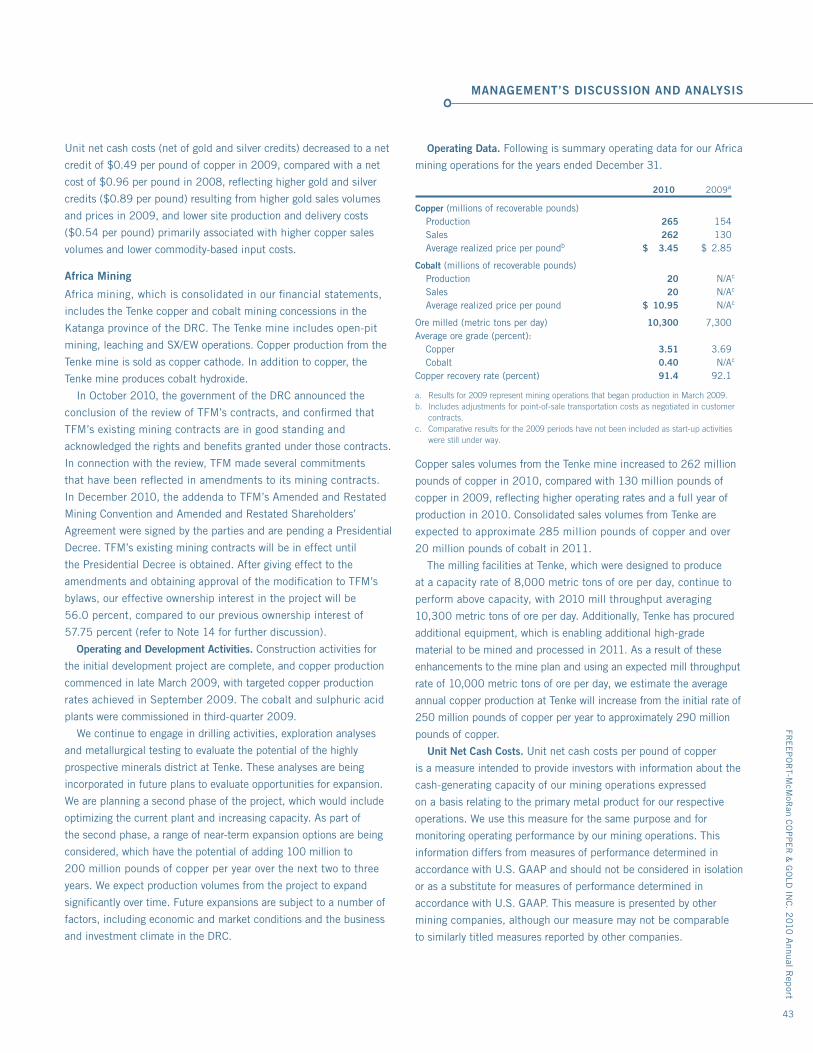
Unit net cash costs (net of gold and silver credits) decreased to a net
credit of $0.49 per pound of copper in 2009, compared with a net
cost of $0.96 per pound in 2008, reflecting higher gold and silver
credits ($0.89 per pound) resulting from higher gold sales volumes
and prices in 2009, and lower site production and delivery costs
($0.54 per pound) primarily associated with higher copper sales
volumes and lower commodity-based input costs.
Africa Mining
Africa mining, which is consolidated in our financial statements,
includes the Tenke copper and cobalt mining concessions in the
Katanga province of the DRC. The Tenke mine includes open-pit
mining, leaching and SX/EW operations. Copper production from the
Tenke mine is sold as copper cathode. In addition to copper, the
Tenke mine produces cobalt hydroxide.
In October 2010, the government of the DRC announced the
conclusion of the review of TFM’s contracts, and confirmed that
TFM’s existing mining contracts are in good standing and
acknowledged the rights and benefits granted under those contracts.
In connection with the review, TFM made several commitments
that have been reflected in amendments to its mining contracts.
In December 2010, the addenda to TFM’s Amended and Restated
Mining Convention and Amended and Restated Shareholders’
Agreement were signed by the parties and are pending a Presidential
Decree. TFM’s existing mining contracts will be in effect until
the Presidential Decree is obtained. After giving effect to the
amendments and obtaining approval of the modification to TFM’s
bylaws, our effective ownership interest in the project will be
56.0 percent, compared to our previous ownership interest of
57.75 percent (refer to Note 14 for further discussion).
Operating and Development Activities. Construction activities for
the initial development project are complete, and copper production
commenced in late March 2009, with targeted copper production
rates achieved in September 2009. The cobalt and sulphuric acid
plants were commissioned in third-quarter 2009.
We continue to engage in drilling activities, exploration analyses
and metallurgical testing to evaluate the potential of the highly
prospective minerals district at Tenke. These analyses are being
incorporated in future plans to evaluate opportunities for expansion.
We are planning a second phase of the project, which would include
optimizing the current plant and increasing capacity. As part of
the second phase, a range of near-term expansion options are being
considered, which have the potential of adding 100 million to
200 million pounds of copper per year over the next two to three
years. We expect production volumes from the project to expand
significantly over time. Future expansions are subject to a number of
factors, including economic and market conditions and the business
and investment climate in the DRC.
Operating Data. Following is summary operating data for our Africa
mining operations for the years ended December 31.
2010 2009a
Copper (millions of recoverable pounds) Production 265 154 Sales 262 130 Average realized price per poundb $ 3.45 $ 2.85
Cobalt (millions of recoverable pounds) Production 20 N/Ac
Sales 20 N/Ac
Average realized price per pound $ 10.95 N/Ac
Ore milled (metric tons per day) 10,300 7,300Average ore grade (percent): Copper 3.51 3.69 Cobalt 0.40 N/Ac
Copper recovery rate (percent) 91.4 92.1
a. Results for 2009 represent mining operations that began production in March 2009.b. Includes adjustments for point-of-sale transportation costs as negotiated in customer
contracts.c. Comparative results for the 2009 periods have not been included as start-up activities
were still under way.
Copper sales volumes from the Tenke mine increased to 262 million
pounds of copper in 2010, compared with 130 million pounds of
copper in 2009, reflecting higher operating rates and a full year of
production in 2010. Consolidated sales volumes from Tenke are
expected to approximate 285 million pounds of copper and over
20 million pounds of cobalt in 2011.
The milling facilities at Tenke, which were designed to produce
at a capacity rate of 8,000 metric tons of ore per day, continue to
perform above capacity, with 2010 mill throughput averaging
10,300 metric tons of ore per day. Additionally, Tenke has procured
additional equipment, which is enabling additional high-grade
material to be mined and processed in 2011. As a result of these
enhancements to the mine plan and using an expected mill throughput
rate of 10,000 metric tons of ore per day, we estimate the average
annual copper production at Tenke will increase from the initial rate of
250 million pounds of copper per year to approximately 290 million
pounds of copper.
Unit Net Cash Costs. Unit net cash costs per pound of copper
is a measure intended to provide investors with information about the
cash-generating capacity of our mining operations expressed
on a basis relating to the primary metal product for our respective
operations. We use this measure for the same purpose and for
monitoring operating performance by our mining operations. This
information differs from measures of performance determined in
accordance with U.S. GAAP and should not be considered in isolation
or as a substitute for measures of performance determined in
accordance with U.S. GAAP. This measure is presented by other
mining companies, although our measure may not be comparable
to similarly titled measures reported by other companies.
MANAGEMENT’S DISCUSSION AND ANALYSIS
FRE
EP
OR
T-McM
oRan C
OP
PE
R &
GO
LD IN
C. 2
010 A
nnual Rep
ort
43
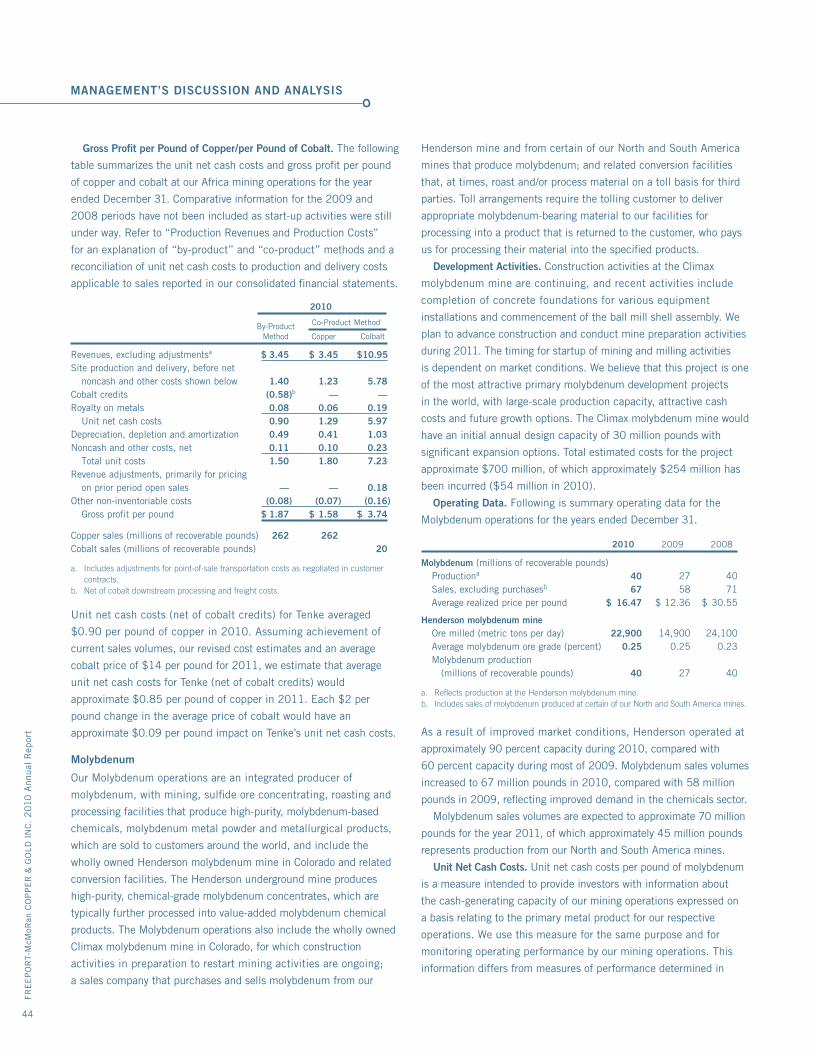
MANAGEMENT’S DISCUSSION AND ANALYSIS
FRE
EP
OR
T-M
cMoR
an C
OP
PE
R &
GO
LD I
NC
. 2
010
Ann
ual
Rep
ort
44
Gross Profit per Pound of Copper/per Pound of Cobalt. The following
table summarizes the unit net cash costs and gross profit per pound
of copper and cobalt at our Africa mining operations for the year
ended December 31. Comparative information for the 2009 and
2008 periods have not been included as start-up activities were still
under way. Refer to “Production Revenues and Production Costs”
for an explanation of “by-product” and “co-product” methods and a
reconciliation of unit net cash costs to production and delivery costs
applicable to sales reported in our consolidated financial statements.
2010
By-Product Co-Product Method
Method Copper Colbalt
Revenues, excluding adjustmentsa $ 3.45 $ 3.45 $ 10.95Site production and delivery, before net noncash and other costs shown below 1.40 1.23 5.78Cobalt credits (0.58)b — —Royalty on metals 0.08 0.06 0.19 Unit net cash costs 0.90 1.29 5.97Depreciation, depletion and amortization 0.49 0.41 1.03Noncash and other costs, net 0.11 0.10 0.23 Total unit costs 1.50 1.80 7.23Revenue adjustments, primarily for pricing on prior period open sales — — 0.18Other non-inventoriable costs (0.08) (0.07) (0.16) Gross profit per pound $ 1.87 $ 1.58 $ 3.74
Copper sales (millions of recoverable pounds) 262 262Cobalt sales (millions of recoverable pounds) 20 a. Includes adjustments for point-of-sale transportation costs as negotiated in customer
contracts.b. Net of cobalt downstream processing and freight costs.
Unit net cash costs (net of cobalt credits) for Tenke averaged
$0.90 per pound of copper in 2010. Assuming achievement of
current sales volumes, our revised cost estimates and an average
cobalt price of $14 per pound for 2011, we estimate that average
unit net cash costs for Tenke (net of cobalt credits) would
approximate $0.85 per pound of copper in 2011. Each $2 per
pound change in the average price of cobalt would have an
approximate $0.09 per pound impact on Tenke’s unit net cash costs.
Molybdenum
Our Molybdenum operations are an integrated producer of
molybdenum, with mining, sulfide ore concentrating, roasting and
processing facilities that produce high-purity, molybdenum-based
chemicals, molybdenum metal powder and metallurgical products,
which are sold to customers around the world, and include the
wholly owned Henderson molybdenum mine in Colorado and related
conversion facilities. The Henderson underground mine produces
high-purity, chemical-grade molybdenum concentrates, which are
typically further processed into value-added molybdenum chemical
products. The Molybdenum operations also include the wholly owned
Climax molybdenum mine in Colorado, for which construction
activities in preparation to restart mining activities are ongoing;
a sales company that purchases and sells molybdenum from our
Henderson mine and from certain of our North and South America
mines that produce molybdenum; and related conversion facilities
that, at times, roast and/or process material on a toll basis for third
parties. Toll arrangements require the tolling customer to deliver
appropriate molybdenum-bearing material to our facilities for
processing into a product that is returned to the customer, who pays
us for processing their material into the specified products.
Development Activities. Construction activities at the Climax
molybdenum mine are continuing, and recent activities include
completion of concrete foundations for various equipment
installations and commencement of the ball mill shell assembly. We
plan to advance construction and conduct mine preparation activities
during 2011. The timing for startup of mining and milling activities
is dependent on market conditions. We believe that this project is one
of the most attractive primary molybdenum development projects
in the world, with large-scale production capacity, attractive cash
costs and future growth options. The Climax molybdenum mine would
have an initial annual design capacity of 30 million pounds with
significant expansion options. Total estimated costs for the project
approximate $700 million, of which approximately $254 million has
been incurred ($54 million in 2010).
Operating Data. Following is summary operating data for the
Molybdenum operations for the years ended December 31.
2010 2009 2008
Molybdenum (millions of recoverable pounds) Productiona 40 27 40 Sales, excluding purchasesb 67 58 71 Average realized price per pound $ 16.47 $ 12.36 $ 30.55
Henderson molybdenum mine Ore milled (metric tons per day) 22,900 14,900 24,100 Average molybdenum ore grade (percent) 0.25 0.25 0.23 Molybdenum production (millions of recoverable pounds) 40 27 40
a. Reflects production at the Henderson molybdenum mine.b. Includes sales of molybdenum produced at certain of our North and South America mines.
As a result of improved market conditions, Henderson operated at
approximately 90 percent capacity during 2010, compared with
60 percent capacity during most of 2009. Molybdenum sales volumes
increased to 67 million pounds in 2010, compared with 58 million
pounds in 2009, reflecting improved demand in the chemicals sector.
Molybdenum sales volumes are expected to approximate 70 million
pounds for the year 2011, of which approximately 45 million pounds
represents production from our North and South America mines.
Unit Net Cash Costs. Unit net cash costs per pound of molybdenum
is a measure intended to provide investors with information about
the cash-generating capacity of our mining operations expressed on
a basis relating to the primary metal product for our respective
operations. We use this measure for the same purpose and for
monitoring operating performance by our mining operations. This
information differs from measures of performance determined in
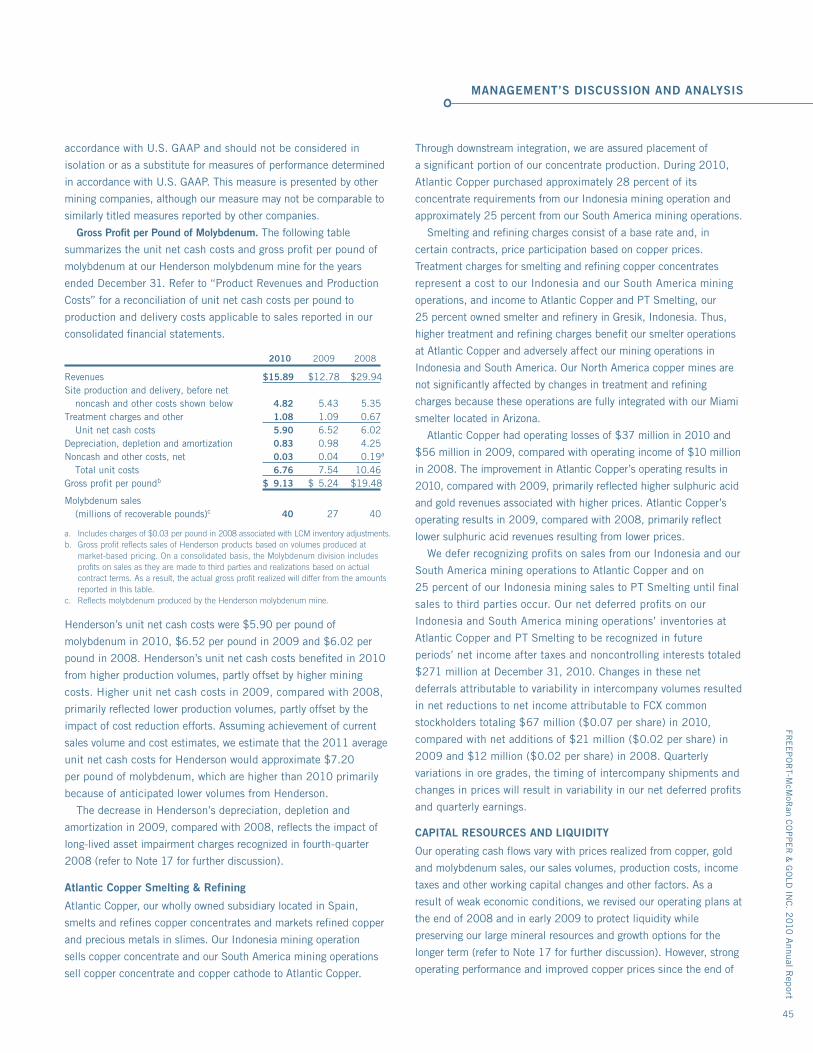
accordance with U.S. GAAP and should not be considered in
isolation or as a substitute for measures of performance determined
in accordance with U.S. GAAP. This measure is presented by other
mining companies, although our measure may not be comparable to
similarly titled measures reported by other companies.
Gross Profit per Pound of Molybdenum. The following table
summarizes the unit net cash costs and gross profit per pound of
molybdenum at our Henderson molybdenum mine for the years
ended December 31. Refer to “Product Revenues and Production
Costs” for a reconciliation of unit net cash costs per pound to
production and delivery costs applicable to sales reported in our
consolidated financial statements.
2010 2009 2008
Revenues $ 15.89 $ 12.78 $ 29.94Site production and delivery, before net noncash and other costs shown below 4.82 5.43 5.35Treatment charges and other 1.08 1.09 0.67 Unit net cash costs 5.90 6.52 6.02Depreciation, depletion and amortization 0.83 0.98 4.25Noncash and other costs, net 0.03 0.04 0.19a
Total unit costs 6.76 7.54 10.46Gross profit per poundb $ 9.13 $ 5.24 $ 19.48
Molybdenum sales (millions of recoverable pounds)c 40 27 40
a. Includes charges of $0.03 per pound in 2008 associated with LCM inventory adjustments.b. Gross profit reflects sales of Henderson products based on volumes produced at
market-based pricing. On a consolidated basis, the Molybdenum division includes profits on sales as they are made to third parties and realizations based on actual contract terms. As a result, the actual gross profit realized will differ from the amounts reported in this table.
c. Reflects molybdenum produced by the Henderson molybdenum mine.
Henderson’s unit net cash costs were $5.90 per pound of
molybdenum in 2010, $6.52 per pound in 2009 and $6.02 per
pound in 2008. Henderson’s unit net cash costs benefited in 2010
from higher production volumes, partly offset by higher mining
costs. Higher unit net cash costs in 2009, compared with 2008,
primarily reflected lower production volumes, partly offset by the
impact of cost reduction efforts. Assuming achievement of current
sales volume and cost estimates, we estimate that the 2011 average
unit net cash costs for Henderson would approximate $7.20
per pound of molybdenum, which are higher than 2010 primarily
because of anticipated lower volumes from Henderson.
The decrease in Henderson’s depreciation, depletion and
amortization in 2009, compared with 2008, reflects the impact of
long-lived asset impairment charges recognized in fourth-quarter
2008 (refer to Note 17 for further discussion).
Atlantic Copper Smelting & Refining
Atlantic Copper, our wholly owned subsidiary located in Spain,
smelts and refines copper concentrates and markets refined copper
and precious metals in slimes. Our Indonesia mining operation
sells copper concentrate and our South America mining operations
sell copper concentrate and copper cathode to Atlantic Copper.
Through downstream integration, we are assured placement of
a significant portion of our concentrate production. During 2010,
Atlantic Copper purchased approximately 28 percent of its
concentrate requirements from our Indonesia mining operation and
approximately 25 percent from our South America mining operations.
Smelting and refining charges consist of a base rate and, in
certain contracts, price participation based on copper prices.
Treatment charges for smelting and refining copper concentrates
represent a cost to our Indonesia and our South America mining
operations, and income to Atlantic Copper and PT Smelting, our
25 percent owned smelter and refinery in Gresik, Indonesia. Thus,
higher treatment and refining charges benefit our smelter operations
at Atlantic Copper and adversely affect our mining operations in
Indonesia and South America. Our North America copper mines are
not significantly affected by changes in treatment and refining
charges because these operations are fully integrated with our Miami
smelter located in Arizona.
Atlantic Copper had operating losses of $37 million in 2010 and
$56 million in 2009, compared with operating income of $10 million
in 2008. The improvement in Atlantic Copper’s operating results in
2010, compared with 2009, primarily reflected higher sulphuric acid
and gold revenues associated with higher prices. Atlantic Copper’s
operating results in 2009, compared with 2008, primarily reflect
lower sulphuric acid revenues resulting from lower prices.
We defer recognizing profits on sales from our Indonesia and our
South America mining operations to Atlantic Copper and on
25 percent of our Indonesia mining sales to PT Smelting until final
sales to third parties occur. Our net deferred profits on our
Indonesia and South America mining operations’ inventories at
Atlantic Copper and PT Smelting to be recognized in future
periods’ net income after taxes and noncontrolling interests totaled
$271 million at December 31, 2010. Changes in these net
deferrals attributable to variability in intercompany volumes resulted
in net reductions to net income attributable to FCX common
stockholders totaling $67 million ($0.07 per share) in 2010,
compared with net additions of $21 million ($0.02 per share) in
2009 and $12 million ($0.02 per share) in 2008. Quarterly
variations in ore grades, the timing of intercompany shipments and
changes in prices will result in variability in our net deferred profits
and quarterly earnings.
CAPITAL RESOURCES AND LIQUIDITY
Our operating cash flows vary with prices realized from copper, gold
and molybdenum sales, our sales volumes, production costs, income
taxes and other working capital changes and other factors. As a
result of weak economic conditions, we revised our operating plans at
the end of 2008 and in early 2009 to protect liquidity while
preserving our large mineral resources and growth options for the
longer term (refer to Note 17 for further discussion). However, strong
operating performance and improved copper prices since the end of
MANAGEMENT’S DISCUSSION AND ANALYSIS
FRE
EP
OR
T-McM
oRan C
OP
PE
R &
GO
LD IN
C. 2
010 A
nnual Rep
ort
45
MANAGEMENT’S DISCUSSION AND ANALYSIS
FRE
EP
OR
T-M
cMoR
an C
OP
PE
R &
GO
LD I
NC
. 2
010
Ann
ual
Rep
ort
46
2008 have enabled us to enhance our financial and liquidity
position, reduce debt and reinstate cash dividends to shareholders,
while maintaining our future growth opportunities. In addition,
we resumed certain project development activities at our mining
operations (refer to “Operations” for further discussion). We view the
long-term outlook for our business positively, supported by limitations
on supplies of copper and by the requirements for copper in the
world’s economy, and will continue to adjust our operating strategy
as market conditions change.
Based on current mine plans and subject to future copper, gold
and molybdenum prices, we expect estimated operating cash flows
for the year 2011 to be greater than our budgeted capital
expenditures, expected debt payments, dividends, noncontrolling
interest distributions and other cash requirements.
Cash and Cash Equivalents
At December 31, 2010, we had consolidated cash and cash
equivalents of $3.7 billion. The following table reflects the U.S. and
international components of consolidated cash and cash equivalents
at December 31, 2010 and 2009 (in billions):
2010 2009
Cash at domestic companiesa $ 1.9 $ 1.5Cash at international operations 1.8 1.2 Total consolidated cash and cash equivalents 3.7 2.7Less: Noncontrolling interests’ share (0.4) (0.3) Cash, net of noncontrolling interests’ share 3.3 2.4Less: Withholding taxes and other (0.2) (0.2) Net cash available to FCX $ 3.1 $ 2.2
a. Includes cash at our parent company and North America operations.
Operating Activities
During 2010, we generated operating cash flows totaling $6.3 billion,
net of $834 million for working capital uses. Operating cash flows
in 2009 totaled $4.4 billion, net of $770 million for working capital
uses, which included approximately $600 million related to
settlement of final pricing with customers on 2008 provisionally
priced copper sales. Operating cash flows in 2008 totaled
$3.4 billion, net of $965 million for working capital uses, which
included $598 million to settle the 2007 copper price protection
program contract.
Our operating cash flows vary with prices realized from copper, gold
and molybdenum sales, our sales volumes, production costs, income
taxes and other working capital changes and other factors. Higher
operating cash flows for 2010, compared with 2009, primarily
reflected higher copper and gold price realizations. Higher operating
cash flows for 2009, compared with 2008, primarily reflected lower
operating costs and higher gold sales volumes and price realizations.
Refer to “Outlook” for further discussion of projected 2011
operating cash flows.
Investing Activities
Capital Expenditures. Capital expenditures, including capitalized
interest, totaled $1.4 billion in 2010 (including $0.7 billion for major
projects), $1.6 billion in 2009 (including $1.0 billion for major
projects and the Twin Buttes property acquisition) and $2.7 billion in
2008 (including $1.6 billion for major projects). The decrease in
capital expenditures in 2010, compared with 2009, primarily
reflected lower capital spending for the initial Tenke development
project for which construction activities were substantially complete
by mid-2009, partly offset by higher spending associated with
underground development projects at Grasberg and the sulfide ore
project at El Abra. The decrease in capital expenditures in 2009,
compared with 2008, primarily reflected the effects of the decision
to defer capital spending for several projects, lower capital spending
for the initial Tenke development project and reduced spending for
sustaining capital.
Capital expenditures for the year 2011 are expected to
approximate $2.5 billion (including $1.3 billion for major projects),
primarily associated with underground development activities at
Grasberg, construction activities at the Climax molybdenum mine and
completion of the initial phase of the sulfide ore project at
El Abra. In addition, we are considering additional investments at
several of our sites. Capital spending plans will continue to be
reviewed and adjusted in response to changes in market conditions
and other factors. Refer to “Operations” for further discussion.
Investment in McMoRan Exploration Co. (MMR). In December
2010, we completed the purchase of 500,000 shares of MMR’s
5¾% Convertible Perpetual Preferred Stock (the Preferred Stock) for
an aggregate purchase price of $500 million. The Preferred Stock
is initially convertible into 62.5 shares of MMR common stock
per share of Preferred Stock (an aggregate of 31.25 million shares or
approximately 14 percent of MMR’s common stock on a fully
converted basis at December 31, 2010), or an initial conversion
price of $16 per share of MMR common stock.
Other Investing Activities. During 2008, our global reclamation
and remediation trusts decreased by $430 million resulting primarily
from reimbursement of previously incurred costs for reclamation
and environmental activities.
Financing Activities
Debt and Equity Transactions. Total debt approximated $4.8 billion
at December 31, 2010, $6.3 billion at December 31, 2009, and
$7.4 billion at December 31, 2008. Since January 1, 2009, we have
repaid approximately $2.6 billion in debt, resulting in estimated
annual interest savings of $167 million based on current interest rates.
We have an open-market share purchase program for up to
30 million shares. During 2008, on a pre-split basis, we
purchased 6.3 million shares of our common stock for $500 million
($79.15 per share average) under our open-market share
purchase program; however, because of financial market turmoil
and the declines in copper and molybdenum prices, in
September 2008, we suspended purchases of our common stock
under the program. We made no purchases under this program
during 2009 or 2010. There are 23.7 million shares remaining
under this program, and the timing of future purchases of our
common stock is dependent on many factors, including our
operating results; cash flows and financial position; copper, gold
and molybdenum prices; the price of our common shares; and
general economic and market conditions.
Dividends. The declaration of dividends is at the discretion of
our Board of Directors (the Board). The amount of cash dividends on
our common stock is dependent upon our financial results, cash
requirements, future prospects and other factors deemed relevant by
the Board. Because of the deterioration in copper and molybdenum
prices and in general economic conditions, in December 2008, the
Board suspended the cash dividend on our common stock; accordingly,
there were no common stock dividends paid in 2009, compared with
$693 million ($0.90625 per share) in 2008. In October 2009, the
Board reinstated a cash dividend on our common stock at an annual
rate of $0.30 per share ($0.075 per share quarterly). In April 2010, the
Board authorized an increase in the cash dividend to an annual rate
of $0.60 per share ($0.15 per share quarterly) and in October 2010,
the Board authorized another increase in the cash dividend to an
annual rate of $1.00 per share ($0.25 per share quarterly).
In December 2010, the Board also declared a supplemental
common stock dividend of $0.50 per share, which was paid on
December 30, 2010. For 2010, common stock dividends paid totaled
$885 million, which included $472 million for the supplemental
dividend paid on December 30, 2010. On December 29, 2010, the
Board declared a regular quarterly dividend of $0.25 per share,
which was paid on February 1, 2011, to common shareholders of
record at the close of business on January 15, 2011. Based on
outstanding common shares of 945 million at December 31, 2010,
at current levels our estimated common stock dividend for 2011
approximates $945 million.
In December 2010, the Board declared a two-for-one split of our
common stock, which was effected on February 1, 2011. On
February 2, 2011, our common stock began trading on the New York
Stock Exchange on a split adjusted basis. As discussed previously,
all common share and per share amounts have been adjusted
to reflect the two-for-one stock split, unless otherwise noted. Refer to
Note 11 for further discussion.
MANAGEMENT’S DISCUSSION AND ANALYSIS
FRE
EP
OR
T-McM
oRan C
OP
PE
R &
GO
LD IN
C. 2
010 A
nnual Rep
ort
47
During 2010, we redeemed all of our $1 billion Senior Floating
Rate Notes due 2015 for which holders received 101 percent
of the principal amount together with accrued and unpaid interest.
In addition, we made open-market purchases of $565 million of
our senior notes at a cost of $621 million.
During 2009, we redeemed $340 million of our 6 7/8% Senior
Notes for $352 million (plus accrued and unpaid interest), and also
made open-market purchases of $387 million of our senior notes
for $416 million.
In February 2008, we made open-market purchases of $33 million
of our 9½% Senior Notes for $46 million.
Refer to Note 9 for further discussion of these debt repayment
transactions.
We have no significant debt maturities in the near term; however,
we may consider opportunities to prepay debt in advance of
scheduled maturities. Our 8.375% Senior Notes are redeemable in
whole or in part, at our option, at make-whole redemption prices
prior to April 1, 2012, and afterwards at stated redemption prices.
Refer to Note 9 for further discussion of these notes.
We have revolving credit facilities available until March 19, 2012,
which are composed of (i) a $1.0 billion revolving credit facility
available to FCX and (ii) a $0.5 billion revolving credit facility available
to both FCX and PT Freeport Indonesia. Interest on the revolving
credit facilities accrues at the London Interbank Offered Rate (LIBOR)
plus 1.00 percent, subject to an increase or decrease in the interest
rate margin based on the credit ratings assigned by Standard & Poor’s
Rating Services and Moody’s Investors Service. At December 31,
2010, we had no borrowings and $43 million of letters of credit
issued under the facilities, resulting in availability of approximately
$1.5 billion ($957 million of which could be used for additional letters
of credit). The revolving credit facilities contain restrictions on the
amount available for dividend payments, purchases of our common
stock and certain debt prepayments. However, these restrictions do
not apply as long as availability under the revolvers plus domestic cash
exceeds $750 million. At December 31, 2010, we had availability
under the revolvers plus available domestic cash (as defined by the
revolving credit facility) of approximately $4.1 billion.
In addition, the indenture governing certain of our senior notes
contains restrictions on incurring debt, making restricted payments
and selling assets. As a result of the investment grade ratings on
these notes, these covenants are currently suspended. However, to
the extent the rating is downgraded below investment grade by both
Standard & Poor’s Rating Services and Moody’s Investors Service,
the covenants would again become effective.
In February 2009, we completed a public offering of 53.6 million
shares of our common stock at an average price of $14.00 per share,
which generated gross proceeds of $750 million (net proceeds of
approximately $740 million after fees and expenses), which were
used for general corporate purposes.
MANAGEMENT’S DISCUSSION AND ANALYSIS
FRE
EP
OR
T-M
cMoR
an C
OP
PE
R &
GO
LD I
NC
. 2
010
Ann
ual
Rep
ort
48
Preferred stock dividends paid totaled $95 million in 2010
representing dividends on our 6¾% Mandatory Convertible Preferred
Stock. Preferred stock dividends totaled $229 million in 2009 and
$255 million in 2008 representing dividends on our 5½% Convertible
Perpetual Preferred Stock and 6¾% Mandatory Convertible Preferred
Stock. During 2010, our 6¾% Mandatory Convertible Preferred Stock
converted into 78.9 million shares of our common stock, and in 2009,
we redeemed our 5½% Convertible Perpetual Preferred Stock in
exchange for 35.8 million shares of our common stock (refer to
Note 11 for further discussion). As a result of these transactions, we
no longer have requirements to pay preferred stock dividends.
Cash dividends and distributions paid to noncontrolling interests
totaled $816 million in 2010, $535 million in 2009 and $730 million
in 2008, reflecting dividends and distributions paid to the
noncontrolling interest owners of PT Freeport Indonesia and our
South America mines.
CONTRACTUAL OBLIGATIONS
We have contractual and other long-term obligations, including debt
maturities, which we expect to fund with projected operating
cash flows, availability under our revolving credit facilities or future
financing transactions, if necessary. A summary of these various
obligations at December 31, 2010, follows (in millions):
Total 2011 2012 to 2013 2014 to 2015 Thereafter
Debt maturities $ 4,755 $ 95 $ 2 $ 1,081 $ 3,577Scheduled interest payment obligationsa 2,728 381 755 711 881Reclamation and environmental obligationsb 4,881 207 287 211 4,176Take-or-pay contractsc 2,831 2,026 650 37 118Operating lease obligations 183 33 39 27 84Atlantic Copper obligation to insurance companyd 58 10 19 19 10PT Freeport Indonesia mine closure and reclamation funde 19 2 1 1 15Totalf $ 15,455 $ 2,754 $ 1,753 $ 2,087 $ 8,861
a. Scheduled interest payment obligations were calculated using stated coupon rates for fixed-rate debt and interest rates applicable at December 31, 2010, for variable-rate debt.b. Represents estimated cash payments, on an undiscounted and unescalated basis, associated with reclamation and environmental activities. The timing and the amount of these payments
could change as a result of changes in regulatory requirements, changes in scope and costs of reclamation activities and as actual spending occurs. Refer to Note 13 for additional discussion of environmental and reclamation matters.
c. Represents contractual obligations for purchases of goods or services that are defined by us as agreements that are enforceable and legally binding and that specify all significant terms. Take-or-pay contracts primarily comprise the procurement of copper concentrates and cathodes ($2.1 billion), transportation ($201 million), electricity ($144 million) and oxygen ($143 million). Some of our take-or-pay contracts are settled based on the prevailing market rate for the service or commodity purchased, and in some cases, the amount of the actual obligation may change over time because of market conditions. Obligations for copper concentrates and cathodes provide for deliveries of specified volumes, at market-based prices, primarily to Atlantic Copper and the North America copper mines. Transportation obligations are primarily for South America contracted ocean freight rates and for North America natural gas transportation. Electricity obligations are primarily for contractual minimum demand at the South America and Tenke mines. Oxygen obligations provide for deliveries of specified volumes, at fixed prices, primarily to Atlantic Copper.
d. In August 2002, Atlantic Copper complied with Spanish legislation by agreeing to fund 7.2 million euros annually for 15 years to an approved insurance company for an estimated 72 million euro contractual obligation to supplement amounts paid to certain retired employees. Atlantic Copper had $48 million recorded for this obligation at December 31, 2010.
e. Represents PT Freeport Indonesia’s commitments to contribute amounts to a cash fund designed to accumulate at least $100 million, including interest, by the end of our Indonesia mining activities to pay for mine closure and reclamation.
f. This table excludes certain other obligations in our consolidated balance sheets, including estimated funding for pension obligations as the funding may vary from year-to-year based on changes in the fair value of plan assets and actuarial assumptions, and accrued liabilities totaling $133 million that relate to unrecognized tax benefits where the timing of settlement is not determinable. This table also excludes purchase orders for the purchase of inventory and other goods and services, as purchase orders typically represent authorizations to purchase rather than binding agreements.
In addition to our debt maturities and other contractual obligations,
we have other commitments, which we expect to fund with projected
operating cash flows, available credit facilities or future financing
transactions, if necessary. These include (i) PT Freeport Indonesia’s
commitment to provide one percent of its annual revenue for the
development of the local people in its area of operations through the
Freeport Partnership Fund for Community Development, (ii) Cerro
Verde’s local mining fund contributions equal to 3.75 percent of
after-tax profits (refer to Note 14), (iii) Tenke’s commitment to
provide 0.3 percent of its annual revenue for the development of the
local people in its area of operations and (iv) other commercial
commitments, including standby letters of credit, surety bonds and
guarantees (refer to Notes 13 and 14 for further discussion).
ENVIRONMENTAL AND RECLAMATION MATTERS
Environmental. The cost of complying with environmental laws
is a fundamental and substantial cost of our business. We had
$1.4 billion at December 31, 2010, and $1.5 billion at December 31,
2009, recorded in our consolidated balance sheets for environmental
obligations attributed to CERCLA or analogous state programs and
for estimated future costs associated with environmental matters at
closed facilities and closed portions of certain operating facilities.
Refer to Note 13 for further information about environmental
regulation, including significant environmental matters.
During 2010, we incurred environmental capital expenditures
and other environmental costs (including our joint venture partners’
shares) of $372 million for programs to comply with applicable
environmental laws and regulations that affect our operations,
compared to $289 million in 2009 and $377 million in 2008. The
increase in environmental costs for 2010, compared with 2009,
primarily related to settlement of legal proceedings (see Note 13 for
further discussion). The decrease in environmental capital spending
for 2009, compared with 2008, primarily related to completion of
large projects in 2008, combined with reduced discretionary
spending and extended project timelines. For 2011, we expect to
incur approximately $460 million of aggregate environmental capital
expenditures and other environmental costs, which are part of our
overall 2011 operating budget and primarily relate to ongoing
environmental compliance.
Asset Retirement Obligations. We recognize AROs as liabilities when
incurred, with the initial measurement at fair value. These liabilities,
which are initially estimated based on discounted cash flow estimates,
are accreted to full value over time through charges to income.
Reclamation costs for future disturbances are recorded as an ARO in
the period of disturbance. Our cost estimates are reflected on a
third-party cost basis and comply with our legal obligation to
retire tangible, long-lived assets. We had recorded AROs totaling
$856 million at December 31, 2010, and $731 million at
December 31, 2009, in current and long-term liabilities on the
consolidated balance sheets. Spending on AROs totaled $38 million
in 2010, $28 million in 2009 and $91 million in 2008. The
decrease in ARO spending for 2009, compared with 2008, primarily
related to extended project timelines that resulted in reduced required
expenditures for 2009. For 2011, we expect to incur approximately
$51 million for aggregate ARO payments. Refer to Note 13 for further
discussion of reclamation and closure costs.
DISCLOSURES ABOUT MARKET RISKS
Commodity Price Risk. Our consolidated revenues include the sale of
copper concentrates, copper cathodes, copper rod, molybdenum,
gold and other metals by our North and South America mines, the
sale of copper concentrates (which also contain significant quantities
of gold and silver) by our Indonesia mining operations, the sale of
copper cathodes and cobalt hydroxide by our Africa mining operations,
the sale of molybdenum in various forms by our Molybdenum
operations, and the sale of copper cathodes, copper anodes and gold
in anodes and slimes by Atlantic Copper. Our financial results can
vary significantly as a result of fluctuations in the market prices of
copper and, to a lesser extent, gold and molybdenum. World market
prices for these commodities have fluctuated historically and
are affected by numerous factors beyond our control. Because we
cannot control the price of our products, the key measures that
management focuses on in operating our business are sales volumes,
unit net cash costs and operating cash flow. Refer to “Outlook” for
further discussion of projected sales volumes, unit net cash costs and
operating cash flows for 2011.
For 2010, 52 percent of our mined copper was sold in concentrate,
26 percent as cathodes and 22 percent as rod (principally from our
North America copper mines). Substantially all of our copper
concentrate and cathode sales contracts provide final copper pricing
in a specified future period (generally one to four months from the
shipment date) based primarily on quoted LME monthly average spot
prices. We receive market prices based on prices in the specified
future period, which results in price fluctuations recorded through
revenues until the date of settlement. We record revenues and invoice
customers at the time of shipment based on then-current LME prices,
which results in an embedded derivative on our provisional priced
concentrate and cathode sales that is adjusted to fair value through
earnings each period, using the period-end forward prices, until the
date of final pricing. To the extent final prices are higher or lower than
what was recorded on a provisional basis, an increase or decrease
to revenues is recorded each reporting period until the date of final
pricing. Accordingly, in times of rising copper prices, our revenues
benefit from higher prices received for contracts priced at current
market rates and also from an increase related to the final pricing of
provisionally priced sales pursuant to contracts entered into in prior
years; in times of falling copper prices, the opposite occurs.
At December 31, 2009, we had provisionally priced copper sales
totaling 378 million pounds at our copper mining operations
(net of intercompany sales and noncontrolling interests) recorded
at an average of $3.34 per pound. Consolidated revenues for 2010
include net reductions for adjustments related to these prior year
copper sales totaling $24 million ($10 million to net income
attributable to FCX common stockholders or $0.01 per share),
compared with net additions of $132 million ($61 million to net
income attributable to FCX common stockholders or $0.07 per share)
in 2009 and $268 million ($114 million to net loss attributable to
FCX common stockholders or $0.15 per share) in 2008.
At December 31, 2010, we had provisionally priced copper sales
totaling 417 million pounds of copper at our copper mining operations
(net of intercompany sales and noncontrolling interests) recorded
at an average price of $4.36 per pound, subject to final pricing over
the next several months. We estimate that each $0.05 change
in the price realized from the December 31, 2010, provisional price
recorded would have a net impact on our 2011 consolidated revenues
of approximately $27 million ($13 million to net income attributable
to FCX common stockholders). The LME spot copper price closed at
$4.50 per pound on February 11, 2011.
On limited past occasions, in response to market conditions, we
have entered into copper and gold price protection contracts for a
portion of our expected future mine production to mitigate the risk of
adverse price fluctuations. We do not currently intend to enter into
similar hedging programs in the future.
Foreign Currency Exchange Risk. The functional currency for
most of our operations is the U.S. dollar. All of our revenues and a
significant portion of our costs are denominated in U.S. dollars;
however, some costs and certain assets and liability accounts are
denominated in local currencies, including the Indonesian rupiah,
MANAGEMENT’S DISCUSSION AND ANALYSIS
FRE
EP
OR
T-McM
oRan C
OP
PE
R &
GO
LD IN
C. 2
010 A
nnual Rep
ort
49
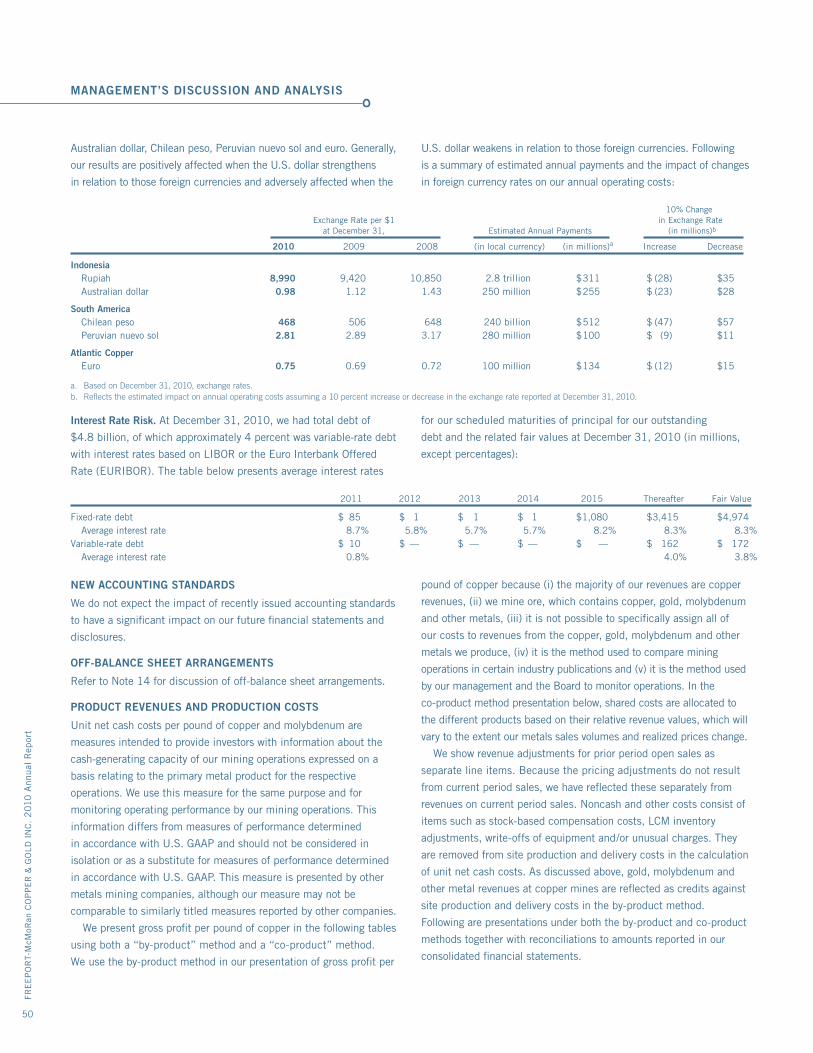
MANAGEMENT’S DISCUSSION AND ANALYSIS
FRE
EP
OR
T-M
cMoR
an C
OP
PE
R &
GO
LD I
NC
. 2
010
Ann
ual
Rep
ort
50
Interest Rate Risk. At December 31, 2010, we had total debt of
$4.8 billion, of which approximately 4 percent was variable-rate debt
with interest rates based on LIBOR or the Euro Interbank Offered
Rate (EURIBOR). The table below presents average interest rates
for our scheduled maturities of principal for our outstanding
debt and the related fair values at December 31, 2010 (in millions,
except percentages):
Australian dollar, Chilean peso, Peruvian nuevo sol and euro. Generally,
our results are positively affected when the U.S. dollar strengthens
in relation to those foreign currencies and adversely affected when the
U.S. dollar weakens in relation to those foreign currencies. Following
is a summary of estimated annual payments and the impact of changes
in foreign currency rates on our annual operating costs:
2011 2012 2013 2014 2015 Thereafter Fair Value
Fixed-rate debt $ 85 $ 1 $ 1 $ 1 $ 1,080 $ 3,415 $ 4,974 Average interest rate 8.7% 5.8% 5.7% 5.7% 8.2% 8.3% 8.3%Variable-rate debt $ 10 $ — $ — $ — $ — $ 162 $ 172 Average interest rate 0.8% 4.0% 3.8%
NEW ACCOUNTING STANDARDS
We do not expect the impact of recently issued accounting standards
to have a significant impact on our future financial statements and
disclosures.
OFF-BALANCE SHEET ARRANGEMENTS
Refer to Note 14 for discussion of off-balance sheet arrangements.
PRODUCT REVENUES AND PRODUCTION COSTS
Unit net cash costs per pound of copper and molybdenum are
measures intended to provide investors with information about the
cash-generating capacity of our mining operations expressed on a
basis relating to the primary metal product for the respective
operations. We use this measure for the same purpose and for
monitoring operating performance by our mining operations. This
information differs from measures of performance determined
in accordance with U.S. GAAP and should not be considered in
isolation or as a substitute for measures of performance determined
in accordance with U.S. GAAP. This measure is presented by other
metals mining companies, although our measure may not be
comparable to similarly titled measures reported by other companies.
We present gross profit per pound of copper in the following tables
using both a “by-product” method and a “co-product” method.
We use the by-product method in our presentation of gross profit per
pound of copper because (i) the majority of our revenues are copper
revenues, (ii) we mine ore, which contains copper, gold, molybdenum
and other metals, (iii) it is not possible to specifically assign all of
our costs to revenues from the copper, gold, molybdenum and other
metals we produce, (iv) it is the method used to compare mining
operations in certain industry publications and (v) it is the method used
by our management and the Board to monitor operations. In the
co-product method presentation below, shared costs are allocated to
the different products based on their relative revenue values, which will
vary to the extent our metals sales volumes and realized prices change.
We show revenue adjustments for prior period open sales as
separate line items. Because the pricing adjustments do not result
from current period sales, we have reflected these separately from
revenues on current period sales. Noncash and other costs consist of
items such as stock-based compensation costs, LCM inventory
adjustments, write-offs of equipment and/or unusual charges. They
are removed from site production and delivery costs in the calculation
of unit net cash costs. As discussed above, gold, molybdenum and
other metal revenues at copper mines are reflected as credits against
site production and delivery costs in the by-product method.
Following are presentations under both the by-product and co-product
methods together with reconciliations to amounts reported in our
consolidated financial statements.
10% Change Exchange Rate per $1 in Exchange Rate at December 31, Estimated Annual Payments (in millions)
2010 2009 2008 (in local currency) (in millions)a Increase Decrease
Indonesia Rupiah 8,990 9,420 10,850 2.8 trillion $ 311 $ (28) $ 35 Australian dollar 0.98 1.12 1.43 250 million $ 255 $ (23) $ 28
South America Chilean peso 468 506 648 240 billion $ 512 $ (47) $ 57 Peruvian nuevo sol 2.81 2.89 3.17 280 million $ 100 $ (9) $ 11
Atlantic Copper Euro 0.75 0.69 0.72 100 million $ 134 $ (12) $ 15
a. Based on December 31, 2010, exchange rates.b. Reflects the estimated impact on annual operating costs assuming a 10 percent increase or decrease in the exchange rate reported at December 31, 2010.
b
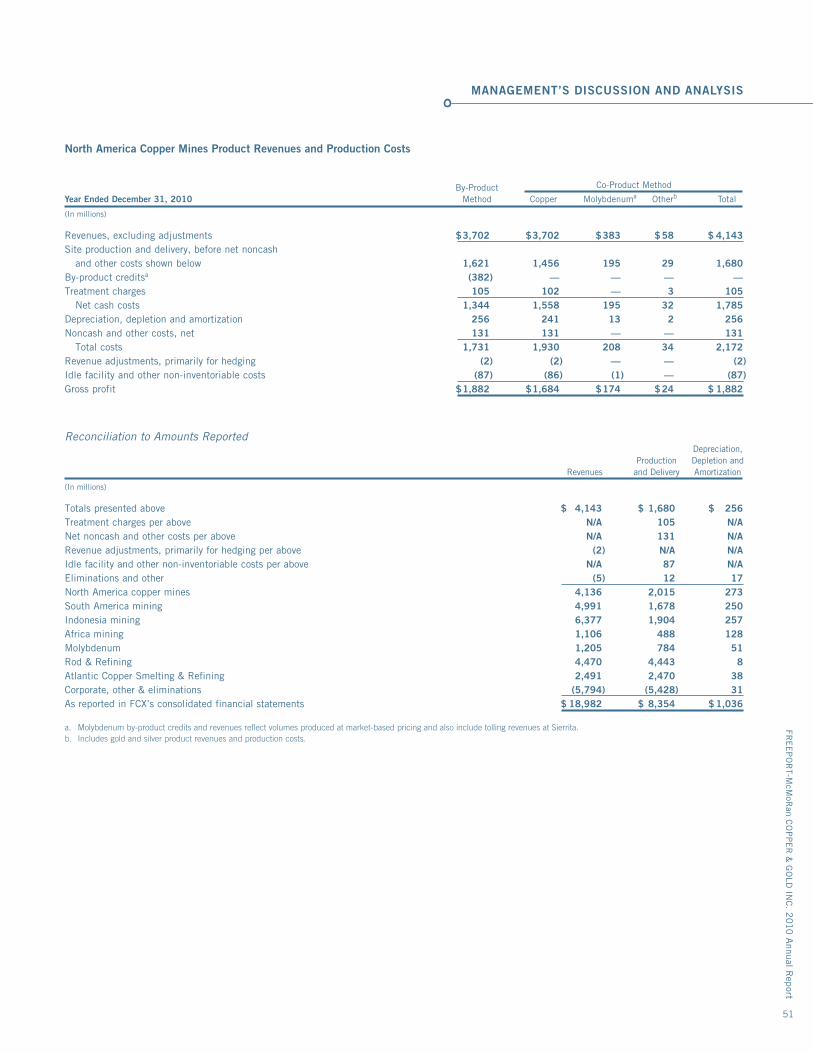
North America Copper Mines Product Revenues and Production Costs
By-Product Co-Product Method
Year Ended December 31, 2010 Method Copper Molybdenuma Otherb Total
(In millions)
Revenues, excluding adjustments $ 3,702 $ 3,702 $ 383 $ 58 $ 4,143Site production and delivery, before net noncash and other costs shown below 1,621 1,456 195 29 1,680By-product creditsa (382) — — — —Treatment charges 105 102 — 3 105 Net cash costs 1,344 1,558 195 32 1,785Depreciation, depletion and amortization 256 241 13 2 256Noncash and other costs, net 131 131 — — 131 Total costs 1,731 1,930 208 34 2,172Revenue adjustments, primarily for hedging (2) (2) — — (2)Idle facility and other non-inventoriable costs (87) (86) (1) — (87)Gross profit $ 1,882 $ 1,684 $ 174 $ 24 $ 1,882
Reconciliation to Amounts Reported Depreciation, Production Depletion and Revenues and Delivery Amortization
(In millions)
Totals presented above $ 4,143 $ 1,680 $ 256Treatment charges per above N/A 105 N/ANet noncash and other costs per above N/A 131 N/ARevenue adjustments, primarily for hedging per above (2) N/A N/AIdle facility and other non-inventoriable costs per above N/A 87 N/AEliminations and other (5) 12 17North America copper mines 4,136 2,015 273South America mining 4,991 1,678 250Indonesia mining 6,377 1,904 257Africa mining 1,106 488 128Molybdenum 1,205 784 51Rod & Refining 4,470 4,443 8Atlantic Copper Smelting & Refining 2,491 2,470 38Corporate, other & eliminations (5,794) (5,428) 31As reported in FCX’s consolidated financial statements $ 18,982 $ 8,354 $ 1,036 a. Molybdenum by-product credits and revenues reflect volumes produced at market-based pricing and also include tolling revenues at Sierrita.b. Includes gold and silver product revenues and production costs.
MANAGEMENT’S DISCUSSION AND ANALYSIS
FRE
EP
OR
T-McM
oRan C
OP
PE
R &
GO
LD IN
C. 2
010 A
nnual Rep
ort
51
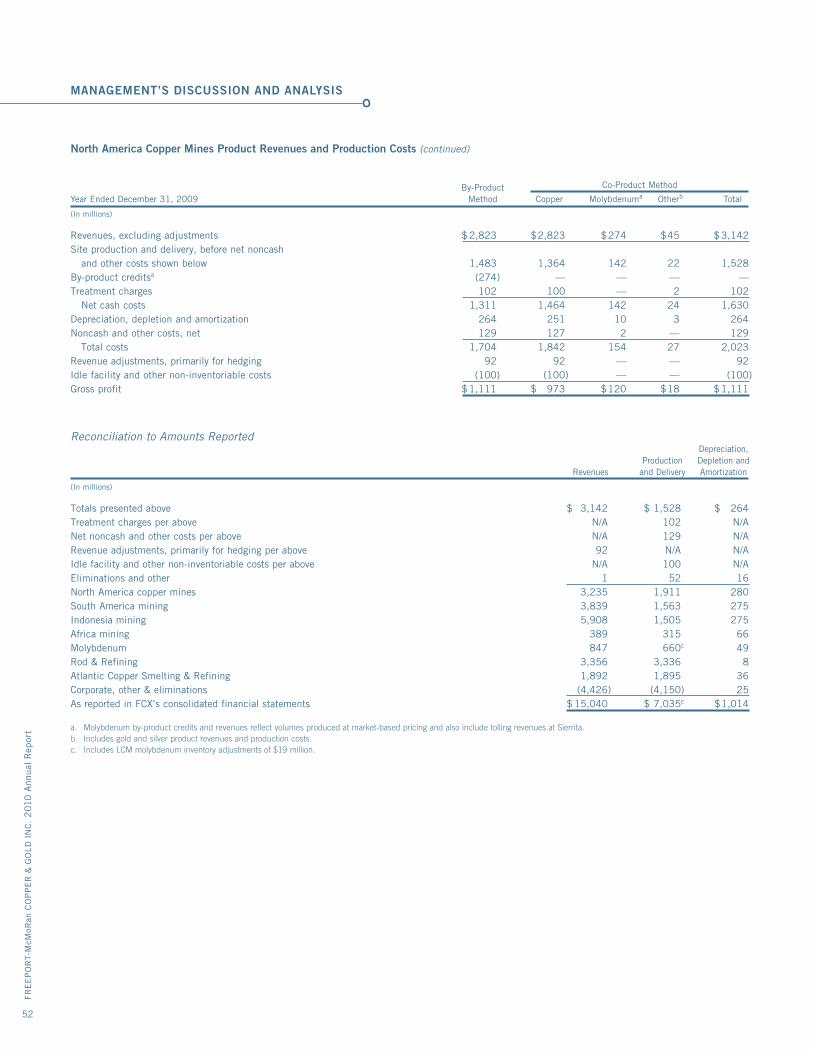
MANAGEMENT’S DISCUSSION AND ANALYSIS
FRE
EP
OR
T-M
cMoR
an C
OP
PE
R &
GO
LD I
NC
. 2
010
Ann
ual
Rep
ort
52
North America Copper Mines Product Revenues and Production Costs (continued)
By-Product Co-Product Method
Year Ended December 31, 2009 Method Copper Molybdenuma Otherb Total
(In millions)
Revenues, excluding adjustments $ 2,823 $ 2,823 $ 274 $ 45 $ 3,142Site production and delivery, before net noncash and other costs shown below 1,483 1,364 142 22 1,528By-product creditsa (274) — — — —Treatment charges 102 100 — 2 102 Net cash costs 1,311 1,464 142 24 1,630Depreciation, depletion and amortization 264 251 10 3 264Noncash and other costs, net 129 127 2 — 129 Total costs 1,704 1,842 154 27 2,023Revenue adjustments, primarily for hedging 92 92 — — 92Idle facility and other non-inventoriable costs (100) (100) — — (100)Gross profit $ 1,111 $ 973 $ 120 $ 18 $ 1,111
Reconciliation to Amounts Reported Depreciation, Production Depletion and Revenues and Delivery Amortization
(In millions)
Totals presented above $ 3,142 $ 1,528 $ 264Treatment charges per above N/A 102 N/ANet noncash and other costs per above N/A 129 N/ARevenue adjustments, primarily for hedging per above 92 N/A N/AIdle facility and other non-inventoriable costs per above N/A 100 N/AEliminations and other 1 52 16North America copper mines 3,235 1,911 280South America mining 3,839 1,563 275Indonesia mining 5,908 1,505 275Africa mining 389 315 66Molybdenum 847 660c 49Rod & Refining 3,356 3,336 8Atlantic Copper Smelting & Refining 1,892 1,895 36Corporate, other & eliminations (4,426) (4,150) 25As reported in FCX’s consolidated financial statements $ 15,040 $ 7,035c $ 1,014
a. Molybdenum by-product credits and revenues reflect volumes produced at market-based pricing and also include tolling revenues at Sierrita.b. Includes gold and silver product revenues and production costs.c. Includes LCM molybdenum inventory adjustments of $19 million.
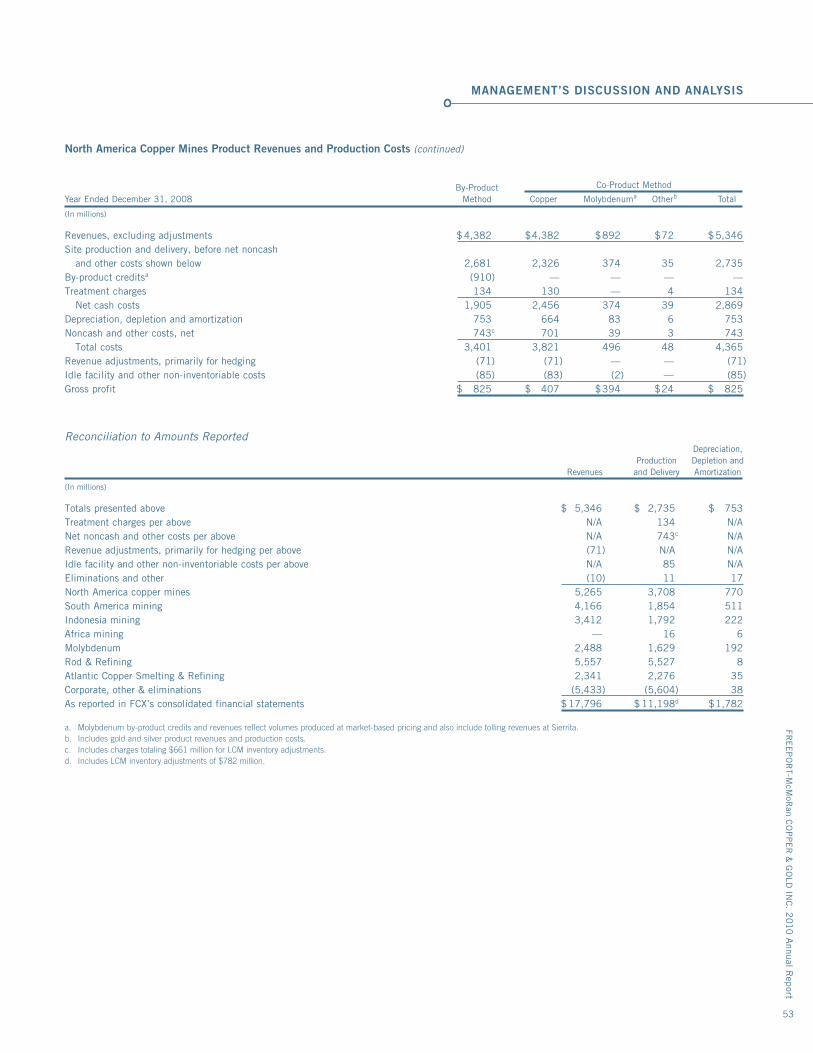
North America Copper Mines Product Revenues and Production Costs (continued)
By-Product Co-Product Method
Year Ended December 31, 2008 Method Copper Molybdenuma Otherb Total
(In millions)
Revenues, excluding adjustments $ 4,382 $ 4,382 $ 892 $ 72 $ 5,346Site production and delivery, before net noncash and other costs shown below 2,681 2,326 374 35 2,735By-product creditsa (910) — — — —Treatment charges 134 130 — 4 134 Net cash costs 1,905 2,456 374 39 2,869Depreciation, depletion and amortization 753 664 83 6 753Noncash and other costs, net 743c 701 39 3 743 Total costs 3,401 3,821 496 48 4,365Revenue adjustments, primarily for hedging (71) (71) — — (71)Idle facility and other non-inventoriable costs (85) (83) (2) — (85)Gross profit $ 825 $ 407 $ 394 $ 24 $ 825
Reconciliation to Amounts Reported Depreciation, Production Depletion and Revenues and Delivery Amortization
(In millions)
Totals presented above $ 5,346 $ 2,735 $ 753Treatment charges per above N/A 134 N/ANet noncash and other costs per above N/A 743c N/ARevenue adjustments, primarily for hedging per above (71) N/A N/AIdle facility and other non-inventoriable costs per above N/A 85 N/AEliminations and other (10) 11 17North America copper mines 5,265 3,708 770South America mining 4,166 1,854 511Indonesia mining 3,412 1,792 222Africa mining — 16 6Molybdenum 2,488 1,629 192Rod & Refining 5,557 5,527 8Atlantic Copper Smelting & Refining 2,341 2,276 35Corporate, other & eliminations (5,433) (5,604) 38As reported in FCX’s consolidated financial statements $ 17,796 $ 11,198d $ 1,782
a. Molybdenum by-product credits and revenues reflect volumes produced at market-based pricing and also include tolling revenues at Sierrita.b. Includes gold and silver product revenues and production costs.c. Includes charges totaling $661 million for LCM inventory adjustments.d. Includes LCM inventory adjustments of $782 million.
MANAGEMENT’S DISCUSSION AND ANALYSIS
FRE
EP
OR
T-McM
oRan C
OP
PE
R &
GO
LD IN
C. 2
010 A
nnual Rep
ort
53
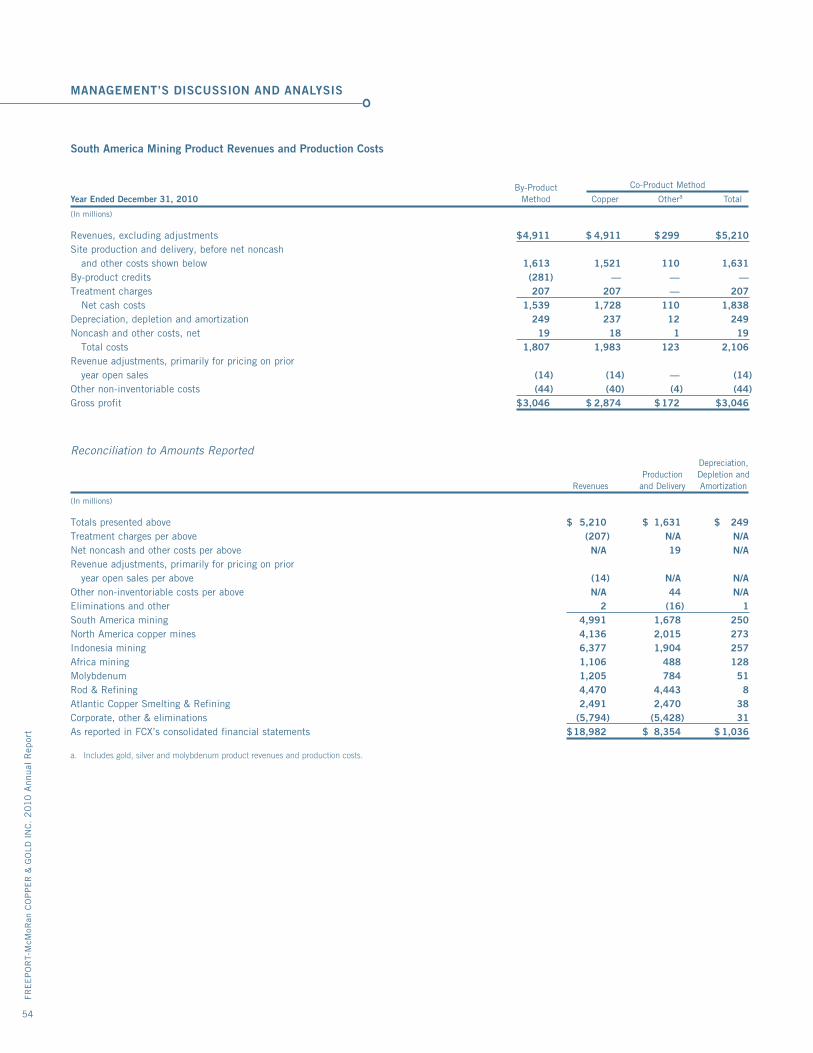
MANAGEMENT’S DISCUSSION AND ANALYSIS
FRE
EP
OR
T-M
cMoR
an C
OP
PE
R &
GO
LD I
NC
. 2
010
Ann
ual
Rep
ort
54
South America Mining Product Revenues and Production Costs
By-Product Co-Product Method
Year Ended December 31, 2010 Method Copper Othera Total
(In millions)
Revenues, excluding adjustments $ 4,911 $ 4,911 $ 299 $ 5,210Site production and delivery, before net noncash and other costs shown below 1,613 1,521 110 1,631By-product credits (281) — — —Treatment charges 207 207 — 207 Net cash costs 1,539 1,728 110 1,838Depreciation, depletion and amortization 249 237 12 249Noncash and other costs, net 19 18 1 19 Total costs 1,807 1,983 123 2,106Revenue adjustments, primarily for pricing on prior year open sales (14) (14) — (14)Other non-inventoriable costs (44) (40) (4) (44)Gross profit $ 3,046 $ 2,874 $ 172 $ 3,046
Reconciliation to Amounts Reported Depreciation, Production Depletion and Revenues and Delivery Amortization
(In millions)
Totals presented above $ 5,210 $ 1,631 $ 249Treatment charges per above (207) N/A N/ANet noncash and other costs per above N/A 19 N/ARevenue adjustments, primarily for pricing on prior year open sales per above (14) N/A N/AOther non-inventoriable costs per above N/A 44 N/AEliminations and other 2 (16) 1South America mining 4,991 1,678 250North America copper mines 4,136 2,015 273Indonesia mining 6,377 1,904 257Africa mining 1,106 488 128Molybdenum 1,205 784 51Rod & Refining 4,470 4,443 8Atlantic Copper Smelting & Refining 2,491 2,470 38Corporate, other & eliminations (5,794) (5,428) 31As reported in FCX’s consolidated financial statements $ 18,982 $ 8,354 $ 1,036
a. Includes gold, silver and molybdenum product revenues and production costs.
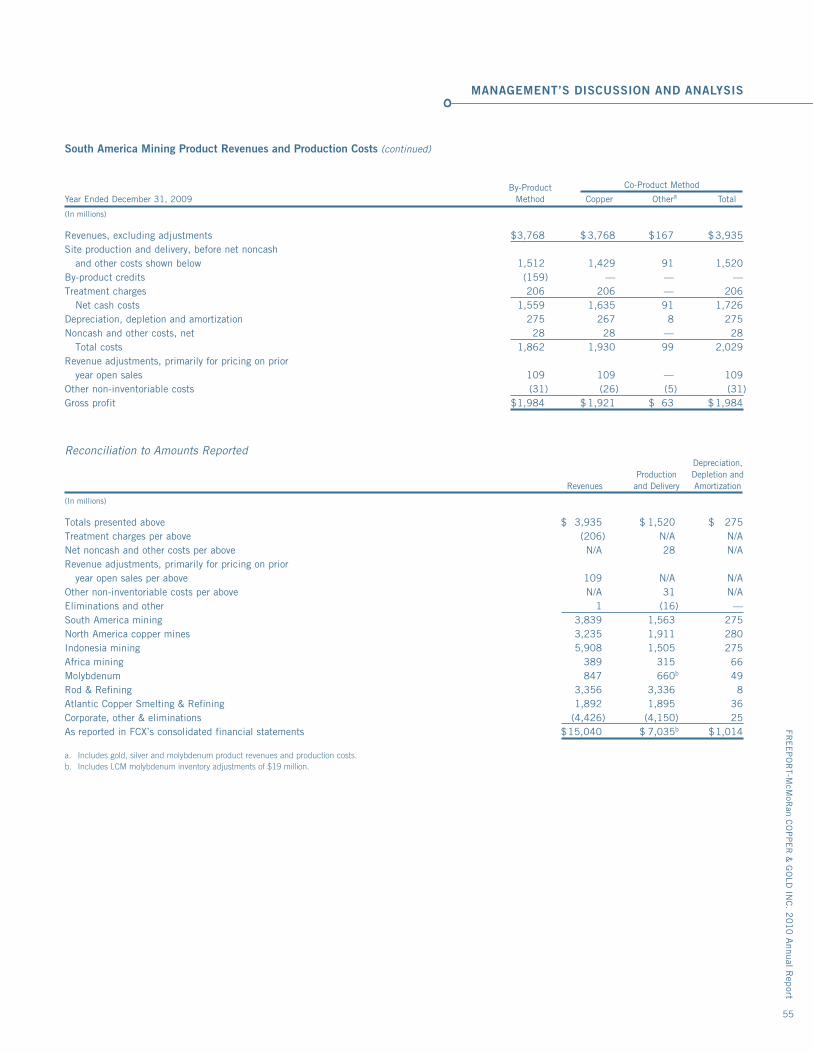
South America Mining Product Revenues and Production Costs (continued)
By-Product Co-Product Method
Year Ended December 31, 2009 Method Copper Othera Total
(In millions)
Revenues, excluding adjustments $ 3,768 $ 3,768 $ 167 $ 3,935Site production and delivery, before net noncash and other costs shown below 1,512 1,429 91 1,520By-product credits (159) — — —Treatment charges 206 206 — 206 Net cash costs 1,559 1,635 91 1,726Depreciation, depletion and amortization 275 267 8 275Noncash and other costs, net 28 28 — 28 Total costs 1,862 1,930 99 2,029Revenue adjustments, primarily for pricing on prior year open sales 109 109 — 109Other non-inventoriable costs (31) (26) (5) (31)Gross profit $ 1,984 $ 1,921 $ 63 $ 1,984
Reconciliation to Amounts Reported Depreciation, Production Depletion and Revenues and Delivery Amortization
(In millions)
Totals presented above $ 3,935 $ 1,520 $ 275Treatment charges per above (206) N/A N/ANet noncash and other costs per above N/A 28 N/ARevenue adjustments, primarily for pricing on prior year open sales per above 109 N/A N/AOther non-inventoriable costs per above N/A 31 N/AEliminations and other 1 (16) —South America mining 3,839 1,563 275North America copper mines 3,235 1,911 280Indonesia mining 5,908 1,505 275Africa mining 389 315 66Molybdenum 847 660b 49Rod & Refining 3,356 3,336 8Atlantic Copper Smelting & Refining 1,892 1,895 36Corporate, other & eliminations (4,426) (4,150) 25As reported in FCX’s consolidated financial statements $ 15,040 $ 7,035b $ 1,014
a. Includes gold, silver and molybdenum product revenues and production costs.b. Includes LCM molybdenum inventory adjustments of $19 million.
MANAGEMENT’S DISCUSSION AND ANALYSIS
FRE
EP
OR
T-McM
oRan C
OP
PE
R &
GO
LD IN
C. 2
010 A
nnual Rep
ort
55
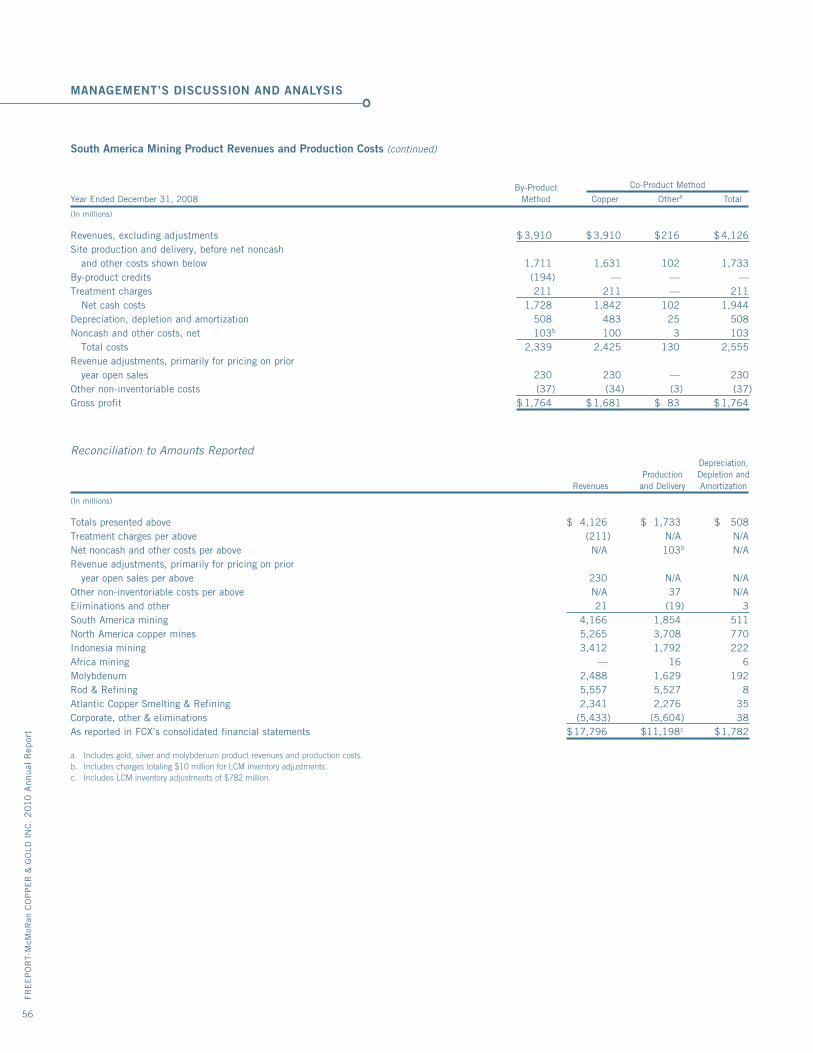
MANAGEMENT’S DISCUSSION AND ANALYSIS
FRE
EP
OR
T-M
cMoR
an C
OP
PE
R &
GO
LD I
NC
. 2
010
Ann
ual
Rep
ort
56
South America Mining Product Revenues and Production Costs (continued)
By-Product Co-Product Method
Year Ended December 31, 2008 Method Copper Othera Total
(In millions)
Revenues, excluding adjustments $ 3,910 $ 3,910 $ 216 $ 4,126Site production and delivery, before net noncash and other costs shown below 1,711 1,631 102 1,733By-product credits (194) — — —Treatment charges 211 211 — 211 Net cash costs 1,728 1,842 102 1,944Depreciation, depletion and amortization 508 483 25 508Noncash and other costs, net 103b 100 3 103 Total costs 2,339 2,425 130 2,555Revenue adjustments, primarily for pricing on prior year open sales 230 230 — 230Other non-inventoriable costs (37) (34) (3) (37)Gross profit $ 1,764 $ 1,681 $ 83 $ 1,764
Reconciliation to Amounts Reported Depreciation, Production Depletion and Revenues and Delivery Amortization
(In millions)
Totals presented above $ 4,126 $ 1,733 $ 508Treatment charges per above (211) N/A N/ANet noncash and other costs per above N/A 103b N/ARevenue adjustments, primarily for pricing on prior year open sales per above 230 N/A N/AOther non-inventoriable costs per above N/A 37 N/AEliminations and other 21 (19) 3South America mining 4,166 1,854 511North America copper mines 5,265 3,708 770Indonesia mining 3,412 1,792 222Africa mining — 16 6Molybdenum 2,488 1,629 192Rod & Refining 5,557 5,527 8Atlantic Copper Smelting & Refining 2,341 2,276 35Corporate, other & eliminations (5,433) (5,604) 38As reported in FCX’s consolidated financial statements $ 17,796 $ 11,198c $ 1,782
a. Includes gold, silver and molybdenum product revenues and production costs.b. Includes charges totaling $10 million for LCM inventory adjustments.c. Includes LCM inventory adjustments of $782 million.
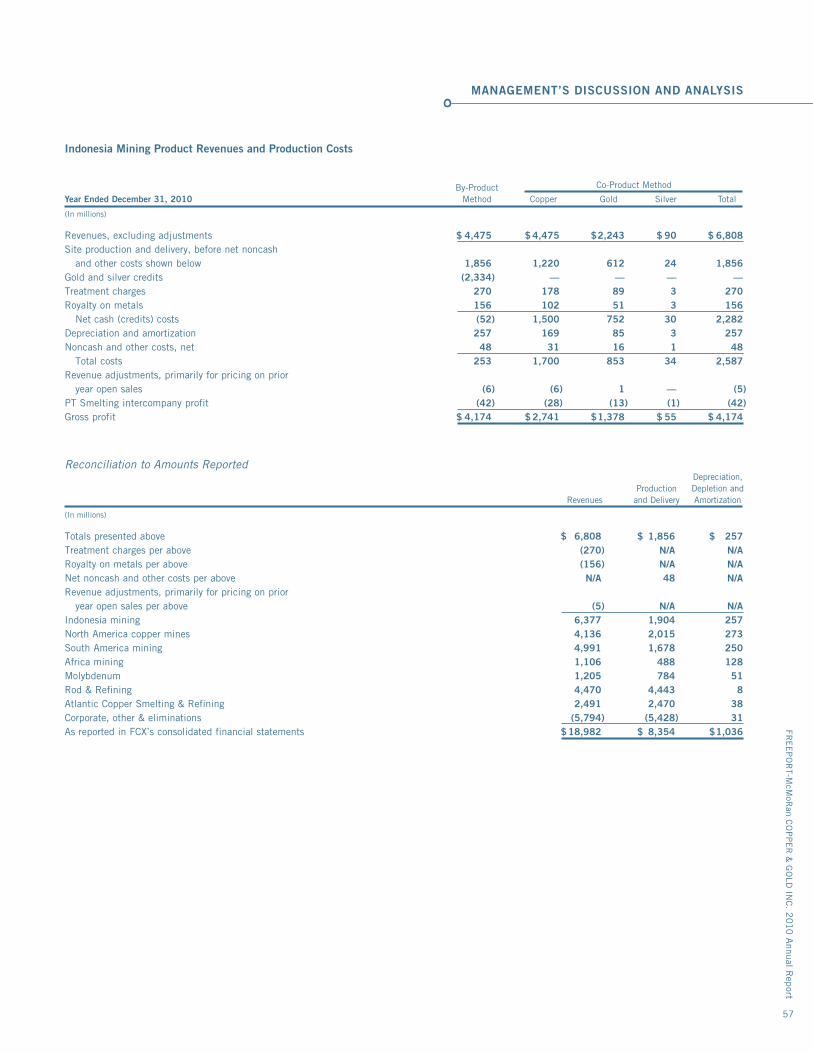
Indonesia Mining Product Revenues and Production Costs
By-Product Co-Product Method
Year Ended December 31, 2010 Method Copper Gold Silver Total
(In millions)
Revenues, excluding adjustments $ 4,475 $ 4,475 $ 2,243 $ 90 $ 6,808Site production and delivery, before net noncash and other costs shown below 1,856 1,220 612 24 1,856Gold and silver credits (2,334) — — — —Treatment charges 270 178 89 3 270Royalty on metals 156 102 51 3 156 Net cash (credits) costs (52) 1,500 752 30 2,282Depreciation and amortization 257 169 85 3 257Noncash and other costs, net 48 31 16 1 48 Total costs 253 1,700 853 34 2,587Revenue adjustments, primarily for pricing on prior year open sales (6) (6) 1 — (5)PT Smelting intercompany profit (42) (28) (13) (1) (42)Gross profit $ 4,174 $ 2,741 $ 1,378 $ 55 $ 4,174
Reconciliation to Amounts Reported Depreciation, Production Depletion and Revenues and Delivery Amortization
(In millions)
Totals presented above $ 6,808 $ 1,856 $ 257Treatment charges per above (270) N/A N/ARoyalty on metals per above (156) N/A N/ANet noncash and other costs per above N/A 48 N/ARevenue adjustments, primarily for pricing on prior year open sales per above (5) N/A N/AIndonesia mining 6,377 1,904 257North America copper mines 4,136 2,015 273South America mining 4,991 1,678 250Africa mining 1,106 488 128Molybdenum 1,205 784 51Rod & Refining 4,470 4,443 8Atlantic Copper Smelting & Refining 2,491 2,470 38Corporate, other & eliminations (5,794) (5,428) 31As reported in FCX’s consolidated financial statements $ 18,982 $ 8,354 $ 1,036
MANAGEMENT’S DISCUSSION AND ANALYSIS
FRE
EP
OR
T-McM
oRan C
OP
PE
R &
GO
LD IN
C. 2
010 A
nnual Rep
ort
57
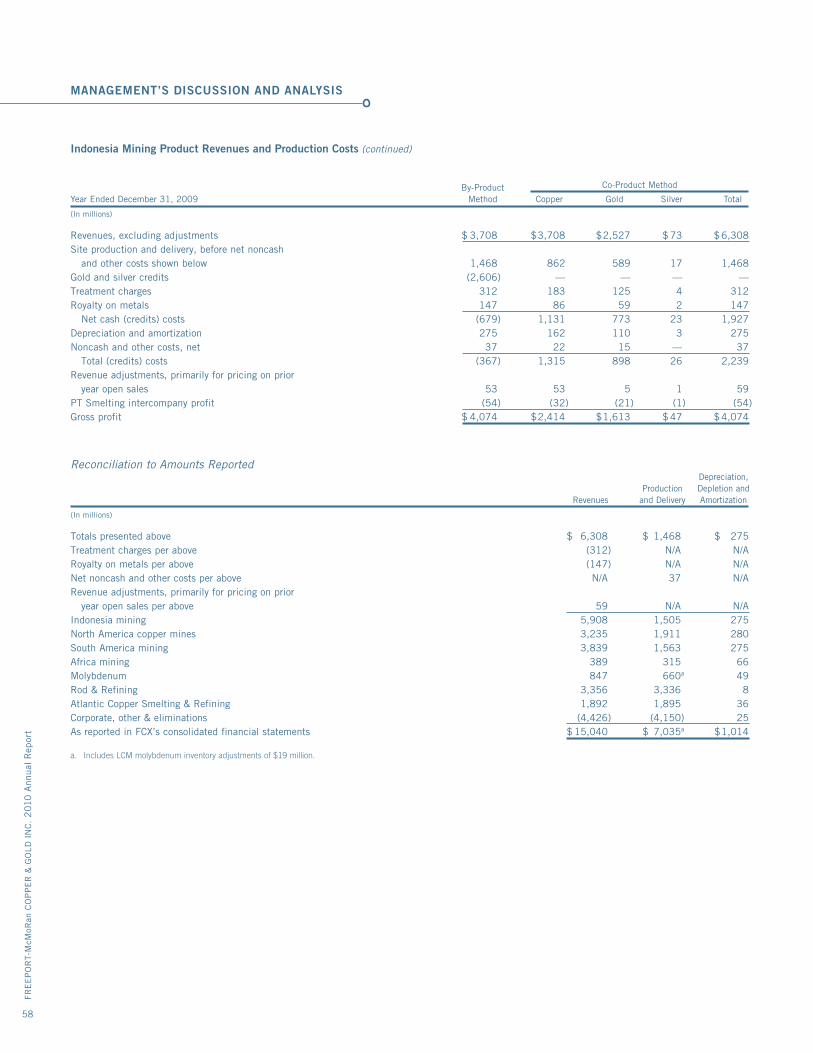
MANAGEMENT’S DISCUSSION AND ANALYSIS
FRE
EP
OR
T-M
cMoR
an C
OP
PE
R &
GO
LD I
NC
. 2
010
Ann
ual
Rep
ort
58
Indonesia Mining Product Revenues and Production Costs (continued)
By-Product Co-Product Method
Year Ended December 31, 2009 Method Copper Gold Silver Total
(In millions)
Revenues, excluding adjustments $ 3,708 $ 3,708 $ 2,527 $ 73 $ 6,308Site production and delivery, before net noncash and other costs shown below 1,468 862 589 17 1,468Gold and silver credits (2,606) — — — —Treatment charges 312 183 125 4 312Royalty on metals 147 86 59 2 147 Net cash (credits) costs (679) 1,131 773 23 1,927Depreciation and amortization 275 162 110 3 275Noncash and other costs, net 37 22 15 — 37 Total (credits) costs (367) 1,315 898 26 2,239Revenue adjustments, primarily for pricing on prior year open sales 53 53 5 1 59PT Smelting intercompany profit (54) (32) (21) (1) (54)Gross profit $ 4,074 $ 2,414 $ 1,613 $ 47 $ 4,074
Reconciliation to Amounts Reported Depreciation, Production Depletion and Revenues and Delivery Amortization
(In millions)
Totals presented above $ 6,308 $ 1,468 $ 275Treatment charges per above (312) N/A N/ARoyalty on metals per above (147) N/A N/ANet noncash and other costs per above N/A 37 N/ARevenue adjustments, primarily for pricing on prior year open sales per above 59 N/A N/AIndonesia mining 5,908 1,505 275North America copper mines 3,235 1,911 280South America mining 3,839 1,563 275Africa mining 389 315 66Molybdenum 847 660a 49Rod & Refining 3,356 3,336 8Atlantic Copper Smelting & Refining 1,892 1,895 36Corporate, other & eliminations (4,426) (4,150) 25As reported in FCX’s consolidated financial statements $ 15,040 $ 7,035a $ 1,014
a. Includes LCM molybdenum inventory adjustments of $19 million.
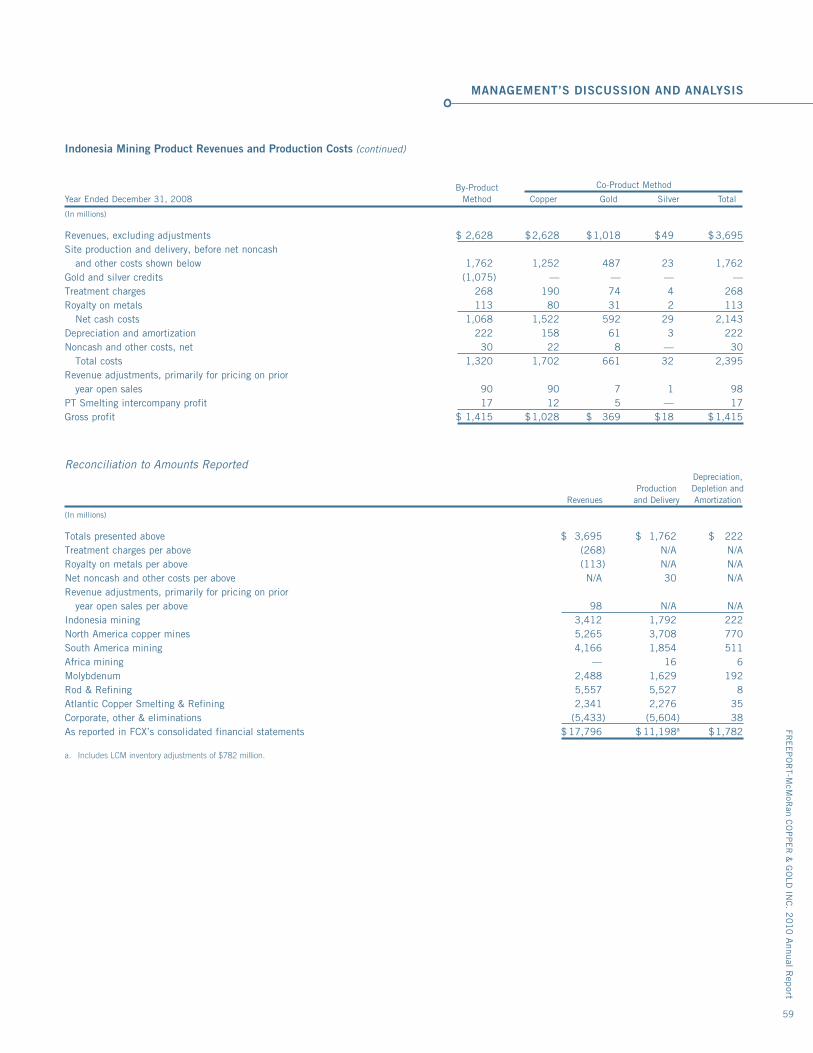
Indonesia Mining Product Revenues and Production Costs (continued)
By-Product Co-Product Method
Year Ended December 31, 2008 Method Copper Gold Silver Total
(In millions)
Revenues, excluding adjustments $ 2,628 $ 2,628 $ 1,018 $ 49 $ 3,695Site production and delivery, before net noncash and other costs shown below 1,762 1,252 487 23 1,762Gold and silver credits (1,075) — — — —Treatment charges 268 190 74 4 268Royalty on metals 113 80 31 2 113 Net cash costs 1,068 1,522 592 29 2,143Depreciation and amortization 222 158 61 3 222Noncash and other costs, net 30 22 8 — 30 Total costs 1,320 1,702 661 32 2,395Revenue adjustments, primarily for pricing on prior year open sales 90 90 7 1 98PT Smelting intercompany profit 17 12 5 — 17Gross profit $ 1,415 $ 1,028 $ 369 $ 18 $ 1,415
Reconciliation to Amounts Reported Depreciation, Production Depletion and Revenues and Delivery Amortization
(In millions)
Totals presented above $ 3,695 $ 1,762 $ 222Treatment charges per above (268) N/A N/ARoyalty on metals per above (113) N/A N/ANet noncash and other costs per above N/A 30 N/ARevenue adjustments, primarily for pricing on prior year open sales per above 98 N/A N/AIndonesia mining 3,412 1,792 222North America copper mines 5,265 3,708 770South America mining 4,166 1,854 511Africa mining — 16 6Molybdenum 2,488 1,629 192Rod & Refining 5,557 5,527 8Atlantic Copper Smelting & Refining 2,341 2,276 35Corporate, other & eliminations (5,433) (5,604) 38As reported in FCX’s consolidated financial statements $ 17,796 $ 11,198a $ 1,782
a. Includes LCM inventory adjustments of $782 million.
MANAGEMENT’S DISCUSSION AND ANALYSIS
FRE
EP
OR
T-McM
oRan C
OP
PE
R &
GO
LD IN
C. 2
010 A
nnual Rep
ort
59
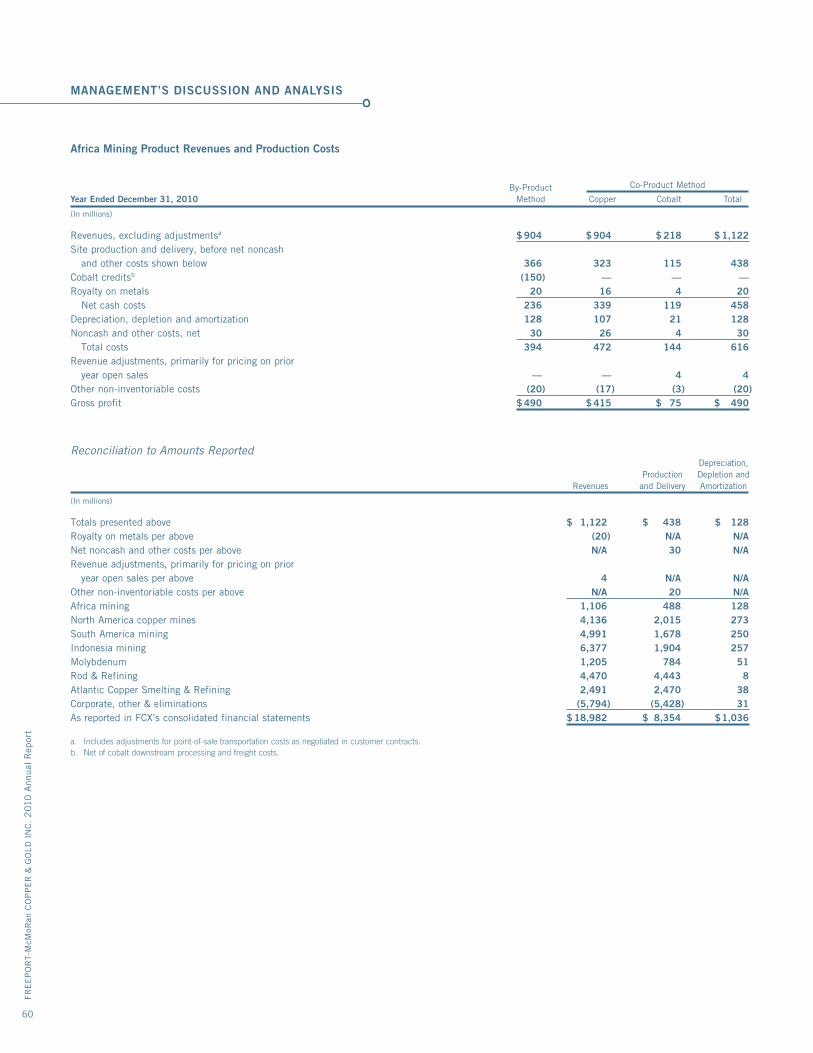
MANAGEMENT’S DISCUSSION AND ANALYSIS
FRE
EP
OR
T-M
cMoR
an C
OP
PE
R &
GO
LD I
NC
. 2
010
Ann
ual
Rep
ort
60
Africa Mining Product Revenues and Production Costs
By-Product Co-Product Method
Year Ended December 31, 2010 Method Copper Cobalt Total
(In millions)
Revenues, excluding adjustmentsa $ 904 $ 904 $ 218 $ 1,122Site production and delivery, before net noncash and other costs shown below 366 323 115 438Cobalt creditsb (150) — — —Royalty on metals 20 16 4 20 Net cash costs 236 339 119 458Depreciation, depletion and amortization 128 107 21 128Noncash and other costs, net 30 26 4 30 Total costs 394 472 144 616Revenue adjustments, primarily for pricing on prior year open sales — — 4 4Other non-inventoriable costs (20) (17) (3) (20)Gross profit $ 490 $ 415 $ 75 $ 490
Reconciliation to Amounts Reported Depreciation, Production Depletion and Revenues and Delivery Amortization
(In millions)
Totals presented above $ 1,122 $ 438 $ 128Royalty on metals per above (20) N/A N/ANet noncash and other costs per above N/A 30 N/ARevenue adjustments, primarily for pricing on prior year open sales per above 4 N/A N/AOther non-inventoriable costs per above N/A 20 N/AAfrica mining 1,106 488 128North America copper mines 4,136 2,015 273South America mining 4,991 1,678 250Indonesia mining 6,377 1,904 257Molybdenum 1,205 784 51Rod & Refining 4,470 4,443 8Atlantic Copper Smelting & Refining 2,491 2,470 38Corporate, other & eliminations (5,794) (5,428) 31As reported in FCX’s consolidated financial statements $ 18,982 $ 8,354 $ 1,036
a. Includes adjustments for point-of-sale transportation costs as negotiated in customer contracts.b. Net of cobalt downstream processing and freight costs.
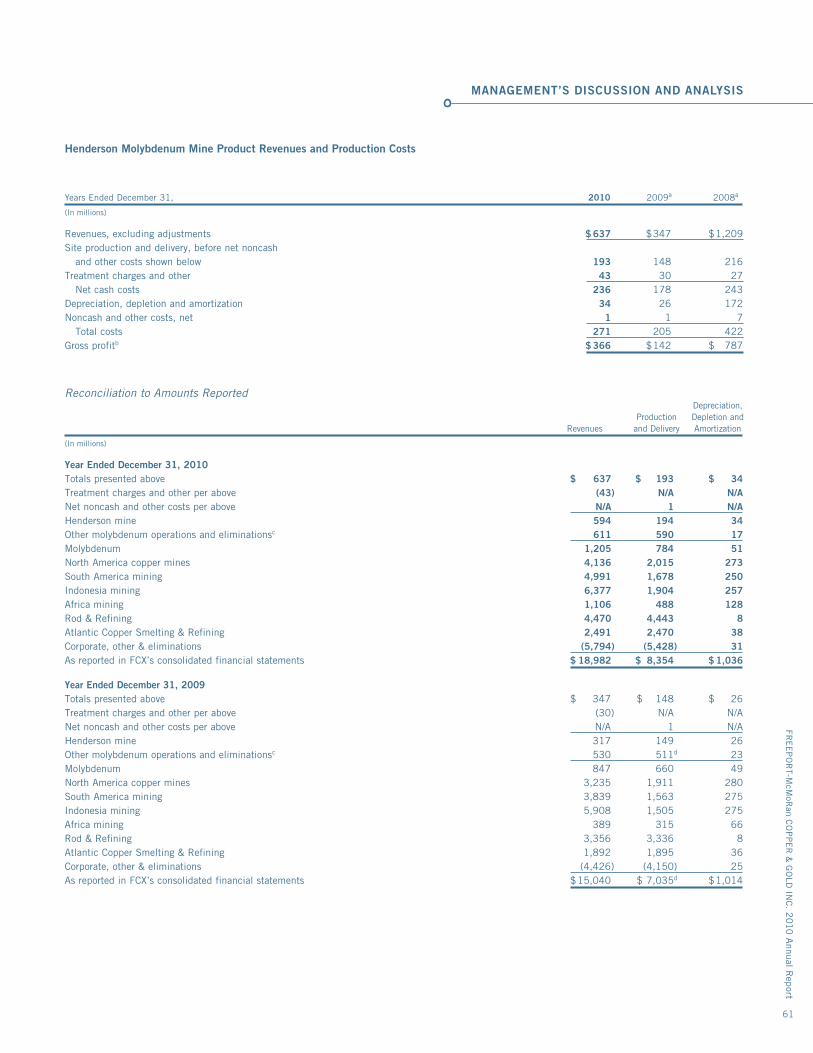
Henderson Molybdenum Mine Product Revenues and Production Costs
Years Ended December 31, 2010 2009a 2008a
(In millions)
Revenues, excluding adjustments $ 637 $ 347 $ 1,209Site production and delivery, before net noncash and other costs shown below 193 148 216Treatment charges and other 43 30 27 Net cash costs 236 178 243Depreciation, depletion and amortization 34 26 172Noncash and other costs, net 1 1 7 Total costs 271 205 422Gross profitb $ 366 $ 142 $ 787
Reconciliation to Amounts Reported Depreciation, Production Depletion and Revenues and Delivery Amortization
(In millions)
Year Ended December 31, 2010Totals presented above $ 637 $ 193 $ 34Treatment charges and other per above (43) N/A N/ANet noncash and other costs per above N/A 1 N/AHenderson mine 594 194 34Other molybdenum operations and eliminationsc 611 590 17Molybdenum 1,205 784 51North America copper mines 4,136 2,015 273South America mining 4,991 1,678 250Indonesia mining 6,377 1,904 257Africa mining 1,106 488 128Rod & Refining 4,470 4,443 8Atlantic Copper Smelting & Refining 2,491 2,470 38Corporate, other & eliminations (5,794) (5,428) 31As reported in FCX’s consolidated financial statements $ 18,982 $ 8,354 $ 1,036
Year Ended December 31, 2009Totals presented above $ 347 $ 148 $ 26Treatment charges and other per above (30) N/A N/ANet noncash and other costs per above N/A 1 N/AHenderson mine 317 149 26Other molybdenum operations and eliminationsc 530 511d 23Molybdenum 847 660 49North America copper mines 3,235 1,911 280South America mining 3,839 1,563 275Indonesia mining 5,908 1,505 275Africa mining 389 315 66Rod & Refining 3,356 3,336 8Atlantic Copper Smelting & Refining 1,892 1,895 36Corporate, other & eliminations (4,426) (4,150) 25As reported in FCX’s consolidated financial statements $ 15,040 $ 7,035d $ 1,014
MANAGEMENT’S DISCUSSION AND ANALYSIS
FRE
EP
OR
T-McM
oRan C
OP
PE
R &
GO
LD IN
C. 2
010 A
nnual Rep
ort
61
MANAGEMENT’S DISCUSSION AND ANALYSIS
FRE
EP
OR
T-M
cMoR
an C
OP
PE
R &
GO
LD I
NC
. 2
010
Ann
ual
Rep
ort
62
Reconciliation to Amounts Reported (continued) Depreciation, Production Depletion and Revenues and Delivery Amortization
(In millions)
Year Ended December 31, 2008Totals presented above $ 1,209 $ 216 $ 172Treatment charges per above (27) N/A N/ANet noncash and other costs per above N/A 7 N/AHenderson mine 1,182 223 172Other molybdenum operations and eliminationsc 1,306 1,406d 20Molybdenum 2,488 1,629 192North America copper mines 5,265 3,708 770South America mining 4,166 1,854 511Indonesia mining 3,412 1,792 222Africa mining — 16 6Rod & Refining 5,557 5,527 8Atlantic Copper Smelting & Refining 2,341 2,276 35Corporate, other & eliminations (5,433) (5,604) 38As reported in FCX’s consolidated financial statements $ 17,796 $ 11,198e $ 1,782
a. Revenues and costs were adjusted to include freight and downstream conversion costs in net cash costs; gross profit was not affected by these adjustments.b. Gross profit reflects sales of Henderson products based on volumes produced at market-based pricing. On a consolidated basis, the Molybdenum division includes profits on sales as they
are made to third parties and realizations based on actual contract terms. As a result, the actual gross profit realized will differ from the amounts reported in this table.c. Primarily includes amounts associated with the molybdenum sales company, which includes sales of molybdenum produced at our North and South America copper mines.d. Includes LCM molybdenum inventory adjustments of $19 million in 2009 and $100 million in 2008.e. Includes LCM inventory adjustments of $782 million.
CAUTIONARY STATEMENT
Our discussion and analysis contains forward-looking statements in
which we discuss factors we believe may affect our future
performance. Forward-looking statements are all statements other
than statements of historical facts, such as those statements
regarding projected ore grades and milling rates, projected production
and sales volumes, projected unit net cash costs, projected
operating cash flows, projected commodity prices, projected capital
expenditures, projected exploration efforts and results, projected
mine production and development plans, the impact of deferred
intercompany profits on earnings, liquidity, other financial
commitments and tax rates, the impact of copper, gold, molybdenum
and cobalt price changes, reserve estimates, potential prepayments
of debt, future dividend payments and potential share purchases.
The words “anticipates,” “may,” “can,” “plans,” “believes,”
“estimates,” “expects,” “projects,” “intends,” “likely,” “will,” “should,”
“to be,” and any similar expressions are intended to identify those
assertions as forward-looking statements. The declaration of
dividends is at the discretion of our Board of Directors and will
depend on our financial results, cash requirements, future prospects
and other factors deemed relevant by the Board.
In making any forward-looking statements, we believe that
the expectations are based on reasonable assumptions. We caution
readers that those statements are not guarantees of future
performance and our actual results may differ materially from those
anticipated, projected or assumed in the forward-looking
statements. Important factors that can cause our actual results to
differ materially from those anticipated in the forward-looking
statements include commodity prices, mine sequencing, production
rates, industry risks, regulatory changes, political risks, the
potential effects of violence in Indonesia, documentation of the
outcome of the contract review process and resolution of
administrative disputes in the Democratic Republic of Congo, risks
related to the investment in McMoRan Exploration Co., weather-
related risks, labor relations, environmental risks, litigation results,
currency translation risks and other factors described in more
detail under the heading “Risk Factors” in our Annual Report on
Form 10-K for the year ended December 31, 2010, filed with the SEC.
Investors are cautioned that many of the assumptions on which
our forward-looking statements are based are likely to change after
our forward-looking statements are made, including for example
commodity prices, which we cannot control, and production volumes
and costs, some aspects of which we may or may not be able to
control. Further, we may make changes to our business plans that
could or will affect our results. We caution investors that we do not
intend to update our forward-looking statements notwithstanding
any changes in our assumptions, changes in our business plans,
our actual experience, or other changes, and we undertake no
obligation to update any forward-looking statements more frequently
than quarterly.
TO THE BOARD OF DIRECTORS AND STOCKHOLDERS OF FREEPORT-McMoRan COPPER & GOLD INC.
We have audited the accompanying consolidated balance sheets of
Freeport-McMoRan Copper & Gold Inc. as of December 31, 2010
and 2009, and the related consolidated statements of operations,
equity and cash flows for each of the three years in the period ended
December 31, 2010. These financial statements are the
responsibility of the Company’s management. Our responsibility is
to express an opinion on these financial statements based on
our audits.
We conducted our audits in accordance with the standards of the
Public Company Accounting Oversight Board (United States).
Those standards require that we plan and perform the audit to obtain
reasonable assurance about whether the financial statements are
free of material misstatement. An audit includes examining, on a test
basis, evidence supporting the amounts and disclosures in the
financial statements. An audit also includes assessing the accounting
principles used and significant estimates made by management,
as well as evaluating the overall financial statement presentation. We
believe that our audits provide a reasonable basis for our opinion.
In our opinion, the financial statements referred to above present
fairly, in all material respects, the consolidated financial position
of Freeport-McMoRan Copper & Gold Inc. at December 31, 2010
and 2009, and the consolidated results of its operations and its
cash flows for each of the three years in the period ended
December 31, 2010, in conformity with U.S. generally accepted
accounting principles.
As discussed in Note 1 to the consolidated financial statements,
the Company changed its method of accounting for noncontrolling
interests with the adoption of the guidance originally issued in
FASB Statement No. 160, Noncontrolling Interests in Consolidated
Financial Statements (codified in FASB ASC Topic 810,
Consolidation) effective January 1, 2009.
We also have audited, in accordance with the standards of
the Public Company Accounting Oversight Board (United States),
Freeport-McMoRan Copper & Gold Inc.’s internal control over
financial reporting as of December 31, 2010, based on criteria
established in Internal Control-Integrated Framework issued
by the Committee of Sponsoring Organizations of the Treadway
Commission and our report dated February 25, 2011 expressed
an unqualified opinion thereon.
ERNST & YOUNG LLP
Phoenix, Arizona
February 25, 2011
REPORT OF INDEPENDENT REGISTERED PUBLIC ACCOUNTING FIRM
FRE
EP
OR
T-McM
oRan C
OP
PE
R &
GO
LD IN
C. 2
010 A
nnual Rep
ort
63
MANAGEMENT’S REPORT ON INTERNAL CONTROL OVER FINANCIAL REPORTING
FRE
EP
OR
T-M
cMoR
an C
OP
PE
R &
GO
LD I
NC
. 2
010
Ann
ual
Rep
ort
64
Freeport-McMoRan Copper & Gold Inc.’s (the Company’s)
management is responsible for establishing and maintaining
adequate internal control over financial reporting. Internal control
over financial reporting is defined in Rule 13a-15(f) or 15d-15(f)
under the Securities Exchange Act of 1934 as a process designed
by, or under the supervision of, the Company’s principal executive
and principal financial officers and effected by the Company’s Board
of Directors, management and other personnel, to provide reasonable
assurance regarding the reliability of financial reporting and the
preparation of financial statements for external purposes in
accordance with generally accepted accounting principles and
includes those policies and procedures that:• Pertain to the maintenance of records that in reasonable detail
accurately and fairly reflect the transactions and dispositions of
the Company’s assets;• Provide reasonable assurance that transactions are recorded as
necessary to permit preparation of financial statements in
accordance with generally accepted accounting principles, and
that receipts and expenditures of the Company are being made
only in accordance with authorizations of management and
directors of the Company; and• Provide reasonable assurance regarding prevention or timely
detection of unauthorized acquisition, use or disposition of the
Company’s assets that could have a material effect on the
financial statements.
Because of its inherent limitations, internal control over financial
reporting may not prevent or detect misstatements. Projections of any
evaluation of effectiveness to future periods are subject to the risk
that controls may become inadequate because of changes in
conditions, or that the degree of compliance with the policies or
procedures may deteriorate.
Our management, including our principal executive officer and
principal financial officer, assessed the effectiveness of our internal
control over financial reporting as of the end of the fiscal year covered
by this annual report on Form 10-K. In making this assessment, our
management used the criteria set forth in Internal Control-Integrated
Framework issued by the Committee of Sponsoring Organizations
of the Treadway Commission (COSO). Based on our management’s
assessment, management concluded that, as of December 31, 2010,
our Company’s internal control over financial reporting is effective
based on the COSO criteria.
Ernst & Young LLP, an independent registered public accounting
firm, who audited the Company’s consolidated financial statements
included in this Form 10-K, has issued an attestation report
on the Company’s internal control over financial reporting, which is
included herein.
Richard C. Adkerson Kathleen L. Quirk
President and Executive Vice President,
Chief Executive Officer Chief Financial Officer and
Treasurer
REPORT OF INDEPENDENT REGISTERED PUBLIC ACCOUNTING FIRM
TO THE BOARD OF DIRECTORS AND STOCKHOLDERS OF FREEPORT-McMoRan COPPER & GOLD INC.
We have audited Freeport-McMoRan Copper & Gold Inc.’s internal
control over financial reporting as of December 31, 2010, based on
criteria established in Internal Control-Integrated Framework issued
by the Committee of Sponsoring Organizations of the Treadway
Commission (the COSO criteria). Freeport-McMoRan Copper & Gold
Inc.’s management is responsible for maintaining effective internal
control over financial reporting, and for its assessment of the
effectiveness of internal control over financial reporting included
in the accompanying Management’s Report on Internal Control Over
Financial Reporting. Our responsibility is to express an opinion
on the company’s internal control over financial reporting based
on our audit.
We conducted our audit in accordance with the standards of the
Public Company Accounting Oversight Board (United States).
Those standards require that we plan and perform the audit to obtain
reasonable assurance about whether effective internal control over
financial reporting was maintained in all material respects. Our audit
included obtaining an understanding of internal control over financial
reporting, assessing the risk that a material weakness exists,
testing and evaluating the design and operating effectiveness of
internal control based on the assessed risk, and performing such
other procedures as we considered necessary in the circumstances.
We believe that our audit provides a reasonable basis for our opinion.
A company’s internal control over financial reporting is a process
designed to provide reasonable assurance regarding the reliability of
financial reporting and the preparation of financial statements for
external purposes in accordance with generally accepted accounting
principles. A company’s internal control over financial reporting
includes those policies and procedures that (1) pertain to the
maintenance of records that, in reasonable detail, accurately and
fairly reflect the transactions and dispositions of the assets of the
company; (2) provide reasonable assurance that transactions are
recorded as necessary to permit preparation of financial statements
in accordance with generally accepted accounting principles, and
that receipts and expenditures of the company are being made only
in accordance with authorizations of management and directors
of the company; and (3) provide reasonable assurance regarding
prevention or timely detection of unauthorized acquisition, use or
disposition of the company’s assets that could have a material effect
on the financial statements.
Because of its inherent limitations, internal control over financial
reporting may not prevent or detect misstatements. Also, projections
of any evaluation of effectiveness to future periods are subject to
the risk that controls may become inadequate because of changes in
conditions, or that the degree of compliance with the policies or
procedures may deteriorate.
In our opinion, Freeport-McMoRan Copper & Gold Inc.
maintained, in all material respects, effective internal control over
financial reporting as of December 31, 2010, based on the
COSO criteria.
We also have audited, in accordance with the standards of the
Public Company Accounting Oversight Board (United States),
the consolidated balance sheets of Freeport-McMoRan Copper &
Gold Inc. as of December 31, 2010 and 2009 and the related
consolidated statements of operations, equity and cash flows for
each of the three years in the period ended December 31, 2010,
and our report dated February 25, 2011 expressed an unqualified
opinion thereon.
ERNST & YOUNG LLP
Phoenix, Arizona
February 25, 2011
FRE
EP
OR
T-McM
oRan C
OP
PE
R &
GO
LD IN
C. 2
010 A
nnual Rep
ort
65
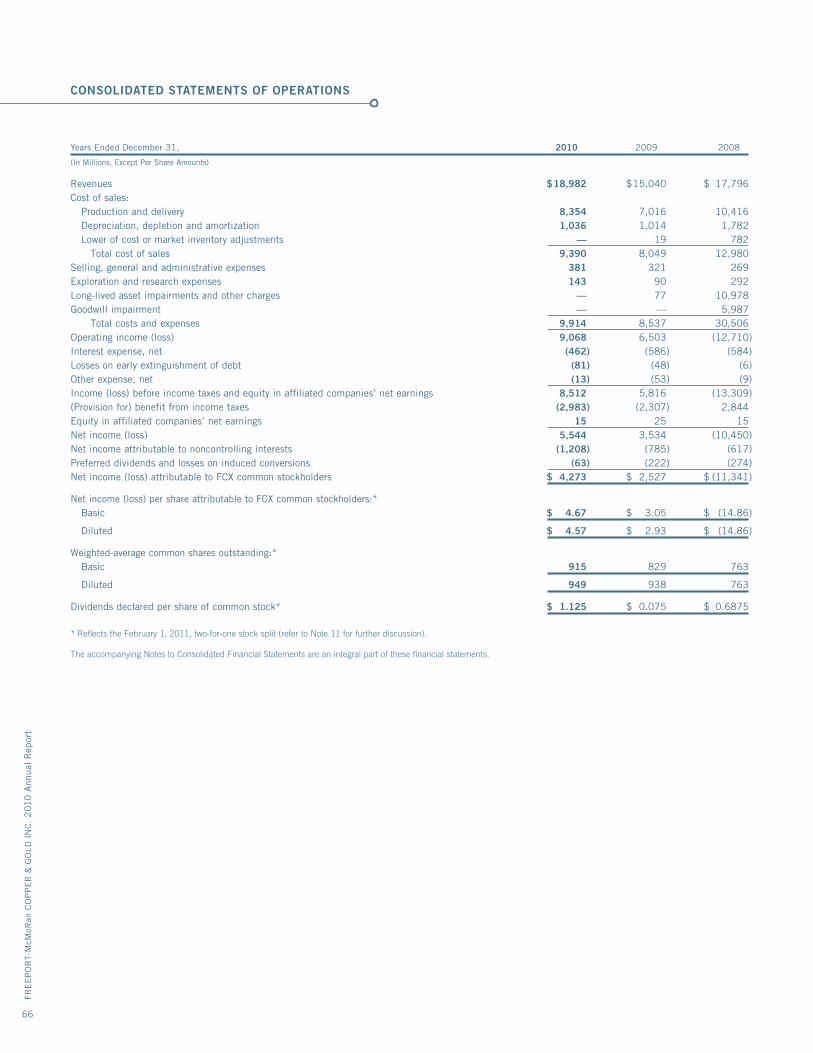
CONSOLIDATED STATEMENTS OF OPERATIONS
FRE
EP
OR
T-M
cMoR
an C
OP
PE
R &
GO
LD I
NC
. 2
010
Ann
ual
Rep
ort
66
Years Ended December 31, 2010 2009 2008
(In Millions, Except Per Share Amounts)
Revenues $ 18,982 $ 15,040 $ 17,796Cost of sales: Production and delivery 8,354 7,016 10,416 Depreciation, depletion and amortization 1,036 1,014 1,782 Lower of cost or market inventory adjustments — 19 782 Total cost of sales 9,390 8,049 12,980Selling, general and administrative expenses 381 321 269Exploration and research expenses 143 90 292Long-lived asset impairments and other charges — 77 10,978Goodwill impairment — — 5,987 Total costs and expenses 9,914 8,537 30,506Operating income (loss) 9,068 6,503 (12,710)Interest expense, net (462) (586) (584)Losses on early extinguishment of debt (81) (48) (6)Other expense, net (13) (53) (9)Income (loss) before income taxes and equity in affiliated companies’ net earnings 8,512 5,816 (13,309)(Provision for) benefit from income taxes (2,983) (2,307) 2,844Equity in affiliated companies’ net earnings 15 25 15Net income (loss) 5,544 3,534 (10,450)Net income attributable to noncontrolling interests (1,208) (785) (617)Preferred dividends and losses on induced conversions (63) (222) (274)Net income (loss) attributable to FCX common stockholders $ 4,273 $ 2,527 $ (11,341)
Net income (loss) per share attributable to FCX common stockholders:* Basic $ 4.67 $ 3.05 $ (14.86)
Diluted $ 4.57 $ 2.93 $ (14.86)
Weighted-average common shares outstanding:* Basic 915 829 763
Diluted 949 938 763
Dividends declared per share of common stock* $ 1.125 $ 0.075 $ 0.6875
* Reflects the February 1, 2011, two-for-one stock split (refer to Note 11 for further discussion).
The accompanying Notes to Consolidated Financial Statements are an integral part of these financial statements.
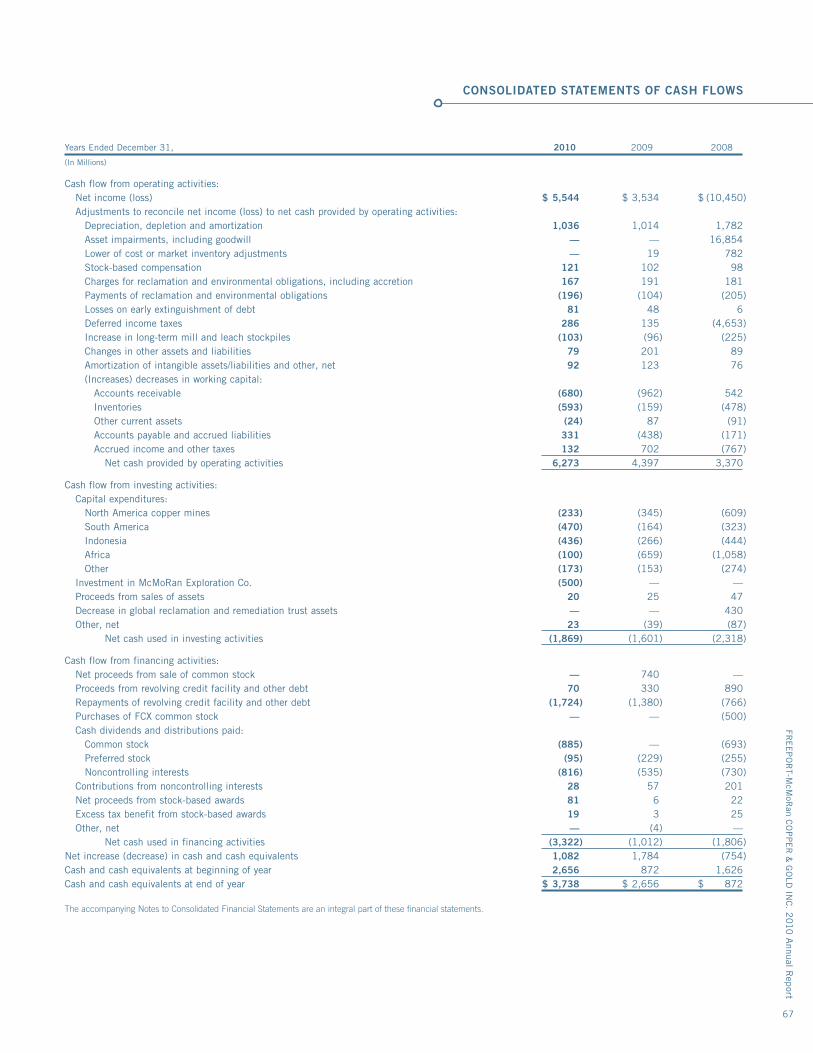
Years Ended December 31, 2010 2009 2008
(In Millions)
Cash flow from operating activities: Net income (loss) $ 5,544 $ 3,534 $ (10,450) Adjustments to reconcile net income (loss) to net cash provided by operating activities: Depreciation, depletion and amortization 1,036 1,014 1,782 Asset impairments, including goodwill — — 16,854 Lower of cost or market inventory adjustments — 19 782 Stock-based compensation 121 102 98 Charges for reclamation and environmental obligations, including accretion 167 191 181 Payments of reclamation and environmental obligations (196) (104) (205) Losses on early extinguishment of debt 81 48 6 Deferred income taxes 286 135 (4,653) Increase in long-term mill and leach stockpiles (103) (96) (225) Changes in other assets and liabilities 79 201 89 Amortization of intangible assets/liabilities and other, net 92 123 76 (Increases) decreases in working capital: Accounts receivable (680) (962) 542 Inventories (593) (159) (478) Other current assets (24) 87 (91) Accounts payable and accrued liabilities 331 (438) (171) Accrued income and other taxes 132 702 (767) Net cash provided by operating activities 6,273 4,397 3,370
Cash flow from investing activities: Capital expenditures: North America copper mines (233) (345) (609) South America (470) (164) (323) Indonesia (436) (266) (444) Africa (100) (659) (1,058) Other (173) (153) (274) Investment in McMoRan Exploration Co. (500) — — Proceeds from sales of assets 20 25 47 Decrease in global reclamation and remediation trust assets — — 430 Other, net 23 (39) (87) Net cash used in investing activities (1,869) (1,601) (2,318)
Cash flow from financing activities: Net proceeds from sale of common stock — 740 — Proceeds from revolving credit facility and other debt 70 330 890 Repayments of revolving credit facility and other debt (1,724) (1,380) (766) Purchases of FCX common stock — — (500) Cash dividends and distributions paid: Common stock (885) — (693) Preferred stock (95) (229) (255) Noncontrolling interests (816) (535) (730) Contributions from noncontrolling interests 28 57 201 Net proceeds from stock-based awards 81 6 22 Excess tax benefit from stock-based awards 19 3 25 Other, net — (4) — Net cash used in financing activities (3,322) (1,012) (1,806)Net increase (decrease) in cash and cash equivalents 1,082 1,784 (754)Cash and cash equivalents at beginning of year 2,656 872 1,626Cash and cash equivalents at end of year $ 3,738 $ 2,656 $ 872
The accompanying Notes to Consolidated Financial Statements are an integral part of these financial statements.
CONSOLIDATED STATEMENTS OF CASH FLOWS
FRE
EP
OR
T-McM
oRan C
OP
PE
R &
GO
LD IN
C. 2
010 A
nnual Rep
ort
67
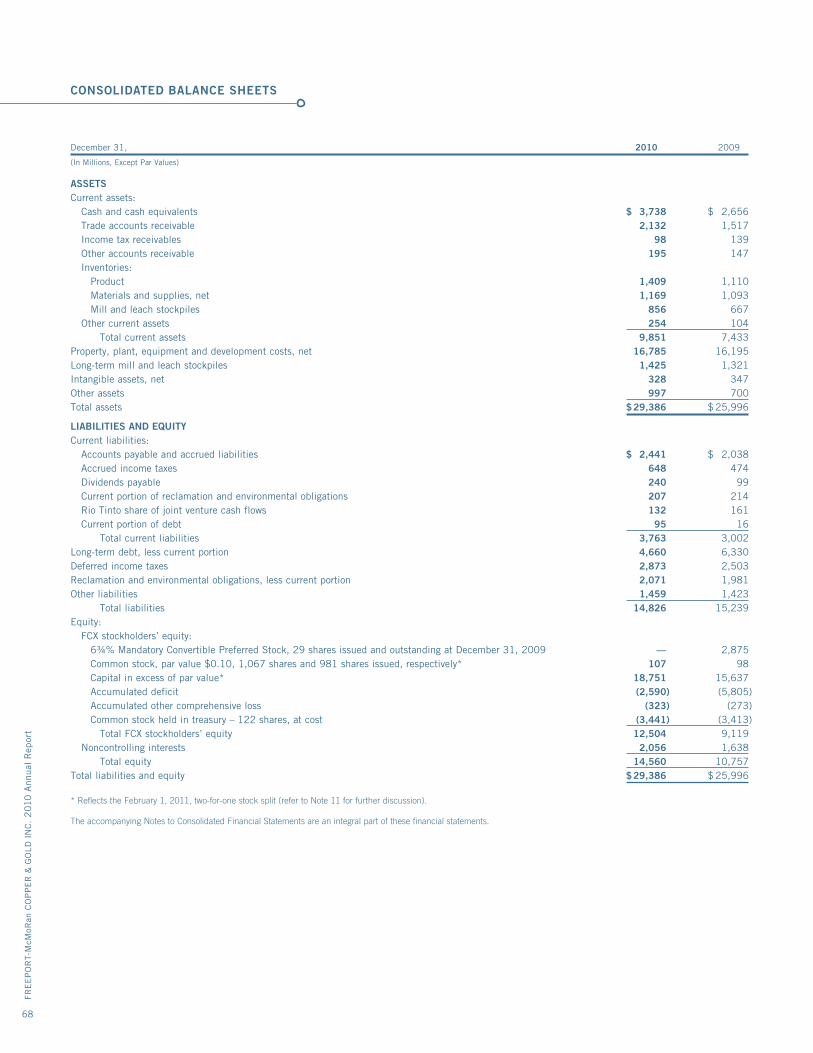
CONSOLIDATED BALANCE SHEETS
FRE
EP
OR
T-M
cMoR
an C
OP
PE
R &
GO
LD I
NC
. 2
010
Ann
ual
Rep
ort
68
December 31, 2010 2009
(In Millions, Except Par Values)
ASSETSCurrent assets: Cash and cash equivalents $ 3,738 $ 2,656 Trade accounts receivable 2,132 1,517 Income tax receivables 98 139 Other accounts receivable 195 147 Inventories: Product 1,409 1,110 Materials and supplies, net 1,169 1,093 Mill and leach stockpiles 856 667 Other current assets 254 104 Total current assets 9,851 7,433Property, plant, equipment and development costs, net 16,785 16,195Long-term mill and leach stockpiles 1,425 1,321Intangible assets, net 328 347Other assets 997 700Total assets $ 29,386 $ 25,996
LIABILITIES AND EQUITYCurrent liabilities: Accounts payable and accrued liabilities $ 2,441 $ 2,038 Accrued income taxes 648 474 Dividends payable 240 99 Current portion of reclamation and environmental obligations 207 214 Rio Tinto share of joint venture cash flows 132 161 Current portion of debt 95 16 Total current liabilities 3,763 3,002Long-term debt, less current portion 4,660 6,330Deferred income taxes 2,873 2,503Reclamation and environmental obligations, less current portion 2,071 1,981Other liabilities 1,459 1,423 Total liabilities 14,826 15,239Equity: FCX stockholders’ equity: 6¾% Mandatory Convertible Preferred Stock, 29 shares issued and outstanding at December 31, 2009 — 2,875 Common stock, par value $0.10, 1,067 shares and 981 shares issued, respectively* 107 98 Capital in excess of par value* 18,751 15,637 Accumulated deficit (2,590) (5,805) Accumulated other comprehensive loss (323) (273) Common stock held in treasury – 122 shares, at cost (3,441) (3,413) Total FCX stockholders’ equity 12,504 9,119 Noncontrolling interests 2,056 1,638 Total equity 14,560 10,757Total liabilities and equity $ 29,386 $ 25,996
* Reflects the February 1, 2011, two-for-one stock split (refer to Note 11 for further discussion).
The accompanying Notes to Consolidated Financial Statements are an integral part of these financial statements.
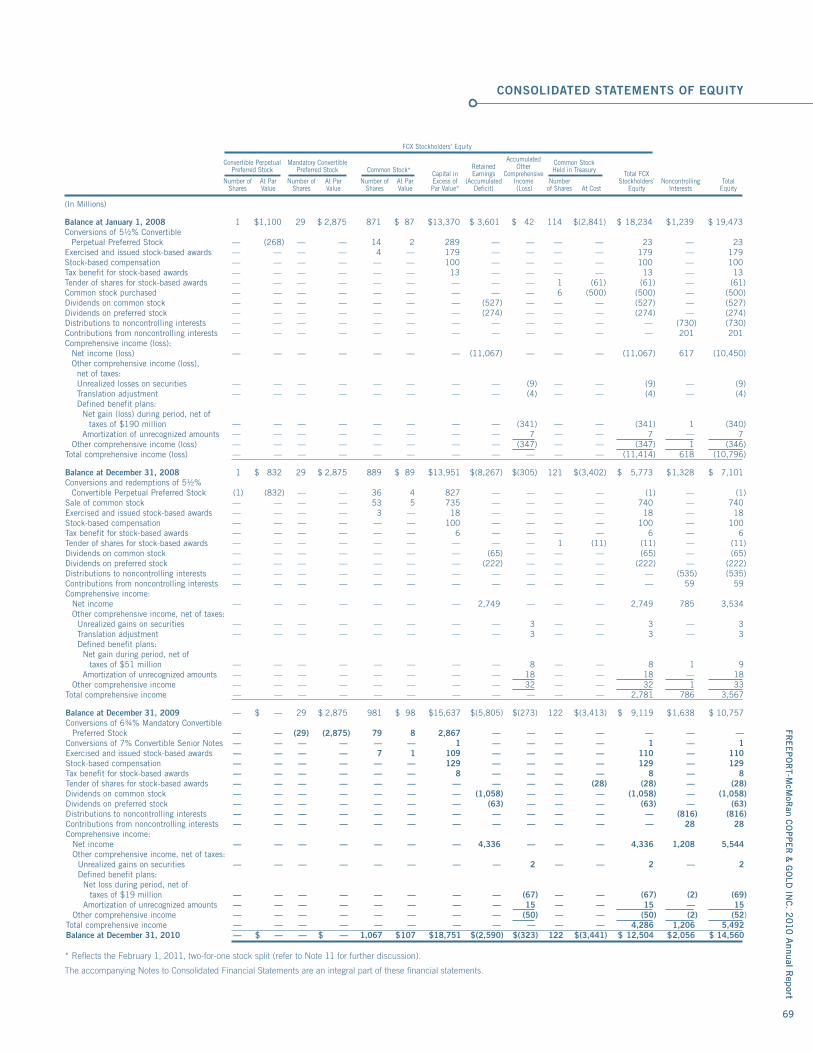
FRE
EP
OR
T-McM
oRan C
OP
PE
R &
GO
LD IN
C. 2
010 A
nnual Rep
ort
69
FRE
EP
OR
T-McM
oRan C
OP
PE
R &
GO
LD IN
C. 2
010 A
nnual Rep
ort
69
CONSOLIDATED STATEMENTS OF EQUITY
FCX Stockholders’ Equity
Accumulated Convertible Perpetual Mandatory Convertible Retained Other Common Stock Preferred Stock Preferred Stock Common Stock Capital in Earnings Comprehensive Held in Treasury Total FCX
Number of At Par Number of At Par Number of At Par Excess of (Accumulated Income Number Stockholders’ Noncontrolling Total Shares Value Shares Value Shares Value Par Value* Deficit) (Loss) of Shares At Cost Equity Interests Equity
(In Millions)
Balance at January 1, 2008 1 $ 1,100 29 $ 2,875 871 $ 87 $ 13,370 $ 3,601 $ 42 114 $ (2,841) $ 18,234 $ 1,239 $ 19,473Conversions of 5½% Convertible Perpetual Preferred Stock — (268) — — 14 2 289 — — — — 23 — 23Exercised and issued stock-based awards — — — — 4 — 179 — — — — 179 — 179Stock-based compensation — — — — — — 100 — — — — 100 — 100Tax benefit for stock-based awards — — — — — — 13 — — — — 13 — 13Tender of shares for stock-based awards — — — — — — — — — 1 (61) (61) — (61)Common stock purchased — — — — — — — — — 6 (500) (500) — (500)Dividends on common stock — — — — — — — (527) — — — (527) — (527)Dividends on preferred stock — — — — — — — (274) — — — (274) — (274)Distributions to noncontrolling interests — — — — — — — — — — — — (730) (730)Contributions from noncontrolling interests — — — — — — — — — — — — 201 201Comprehensive income (loss): Net income (loss) — — — — — — — (11,067) — — — (11,067) 617 (10,450) Other comprehensive income (loss), net of taxes: Unrealized losses on securities — — — — — — — — (9) — — (9) — (9) Translation adjustment — — — — — — — — (4) — — (4) — (4) Defined benefit plans: Net gain (loss) during period, net of taxes of $190 million — — — — — — — — (341) — — (341) 1 (340) Amortization of unrecognized amounts — — — — — — — — 7 — — 7 — 7 Other comprehensive income (loss) — — — — — — — — (347) — — (347) 1 (346)Total comprehensive income (loss) — — — — — — — — — — — (11,414) 618 (10,796)
Balance at December 31, 2008 1 $ 832 29 $ 2,875 889 $ 89 $ 13,951 $ (8,267) $ (305) 121 $ (3,402) $ 5,773 $ 1,328 $ 7,101Conversions and redemptions of 5½% Convertible Perpetual Preferred Stock (1) (832) — — 36 4 827 — — — — (1) — (1)Sale of common stock — — — — 53 5 735 — — — — 740 — 740Exercised and issued stock-based awards — — — — 3 — 18 — — — — 18 — 18Stock-based compensation — — — — — — 100 — — — — 100 — 100Tax benefit for stock-based awards — — — — — — 6 — — — — 6 — 6Tender of shares for stock-based awards — — — — — — — — — 1 (11) (11) — (11)Dividends on common stock — — — — — — — (65) — — — (65) — (65)Dividends on preferred stock — — — — — — — (222) — — — (222) — (222)Distributions to noncontrolling interests — — — — — — — — — — — — (535) (535)Contributions from noncontrolling interests — — — — — — — — — — — — 59 59Comprehensive income: Net income — — — — — — — 2,749 — — — 2,749 785 3,534 Other comprehensive income, net of taxes: Unrealized gains on securities — — — — — — — — 3 — — 3 — 3 Translation adjustment — — — — — — — — 3 — — 3 — 3 Defined benefit plans: Net gain during period, net of taxes of $51 million — — — — — — — — 8 — — 8 1 9 Amortization of unrecognized amounts — — — — — — — — 18 — — 18 — 18 Other comprehensive income — — — — — — — — 32 — — 32 1 33Total comprehensive income — — — — — — — — — — — 2,781 786 3,567
Balance at December 31, 2009 — $ — 29 $ 2,875 981 $ 98 $ 15,637 $ (5,805) $ (273) 122 $ (3,413) $ 9,119 $ 1,638 $ 10,757Conversions of 6¾% Mandatory Convertible Preferred Stock — — (29) (2,875) 79 8 2,867 — — — — — — —Conversions of 7% Convertible Senior Notes — — — — — — 1 — — — — 1 — 1Exercised and issued stock-based awards — — — — 7 1 109 — — — — 110 — 110Stock-based compensation — — — — — — 129 — — — — 129 — 129Tax benefit for stock-based awards — — — — — — 8 — — — — 8 — 8Tender of shares for stock-based awards — — — — — — — — — — (28) (28) — (28)Dividends on common stock — — — — — — — (1,058) — — — (1,058) — (1,058)Dividends on preferred stock — — — — — — — (63) — — — (63) — (63)Distributions to noncontrolling interests — — — — — — — — — — — — (816) (816)Contributions from noncontrolling interests — — — — — — — — — — — — 28 28Comprehensive income: Net income — — — — — — — 4,336 — — — 4,336 1,208 5,544 Other comprehensive income, net of taxes: Unrealized gains on securities — — — — — — — — 2 — — 2 — 2 Defined benefit plans: Net loss during period, net of taxes of $19 million — — — — — — — — (67) — — (67) (2) (69) Amortization of unrecognized amounts — — — — — — — — 15 — — 15 — 15 Other comprehensive income — — — — — — — — (50) — — (50) (2) (52)Total comprehensive income — — — — — — — — — — — 4,286 1,206 5,492Balance at December 31, 2010 — $ — — $ — 1,067 $ 107 $ 18,751 $ (2,590) $ (323) 122 $ (3,441) $ 12,504 $ 2,056 $ 14,560
* Reflects the February 1, 2011, two-for-one stock split (refer to Note 11 for further discussion).
The accompanying Notes to Consolidated Financial Statements are an integral part of these financial statements.
*
NOTES TO CONSOLIDATED FINANCIAL STATEMENTS
NOTE 1. Summary of Significant Accounting Policies
Basis of Presentation. The consolidated financial statements of
Freeport-McMoRan Copper & Gold Inc. (FCX) include the accounts of
those subsidiaries where FCX directly or indirectly has more
than 50 percent of the voting rights and has the right to control
significant management decisions. The most significant entities that
FCX consolidates include its 90.64 percent-owned subsidiary
PT Freeport Indonesia, and its wholly owned subsidiaries, Freeport-
McMoRan Corporation (FMC) and Atlantic Copper, S.A. (Atlantic
Copper). FCX’s unincorporated joint ventures with Rio Tinto plc
(Rio Tinto) and Sumitomo Metal Mining Arizona, Inc. (Sumitomo)
are reflected using the proportionate consolidation method
(refer to Note 2 for further discussion). All significant intercompany
transactions have been eliminated. Amounts in tables are stated
in millions, except per share amounts.
In December 2010, FCX’s Board of Directors declared a two-for-one
split of its common stock in the form of a stock dividend on issued
and outstanding shares, with the additional shares issued on
February 1, 2011, to common shareholders of record at the close of
business on January 15, 2011 (refer to Note 11 for further
discussion). All references to shares of common stock and per share
amounts have been retroactively adjusted to reflect the two-for-one
stock split, unless otherwise noted.
Investments in unconsolidated companies owned 20 percent or
more are recorded using the equity method. Investments in
companies owned less than 20 percent, and for which FCX does not
exercise significant influence, are carried at cost.
Business Segments. FCX has organized its operations into five
primary divisions — North America copper mines, South America
mining, Indonesia mining, Africa mining and Molybdenum operations.
Notwithstanding this structure, FCX internally reports information
on a mine-by-mine basis. Therefore, FCX concluded that its operating
segments include individual mines. Operating segments that meet
certain thresholds are reportable segments.
Use of Estimates. The preparation of FCX’s financial statements in
conformity with accounting principles generally accepted in the
United States (U.S.) requires management to make estimates and
assumptions that affect the amounts reported in these financial
statements and accompanying notes. The more significant areas
requiring the use of management estimates include mineral
reserve estimation; useful asset lives for depreciation, depletion and
amortization; reclamation and closure costs; environmental
obligations; estimates of recoverable copper in mill and leach
stockpiles; pension, postretirement, postemployment and other
employee benefits; deferred taxes and valuation allowances; reserves
for contingencies and litigation; and asset impairment, including
estimates used to derive future cash flows associated with those
assets. Actual results could differ from those estimates.
Foreign Currencies. For foreign subsidiaries whose functional
currency is the U.S. dollar, monetary assets and liabilities
denominated in the local currency are translated at current exchange
rates, and non-monetary assets and liabilities, such as inventories,
property, plant, equipment and development costs, are translated at
historical rates. Gains and losses resulting from translation of such
account balances are included in operating results, as are gains and
losses from foreign currency transactions.
For foreign subsidiaries whose functional currency is the local
currency, assets and liabilities are translated at current exchange
rates, while revenues and expenses are translated at average rates
in effect for the period. The related translation gains and
losses are included in accumulated other comprehensive income
(loss) within equity.
Cash Equivalents. Highly liquid investments purchased with
maturities of three months or less are considered cash equivalents.
Inventories. The largest components of inventories include finished
goods (primarily concentrates and cathodes) at mining operations,
concentrates and work-in-process at Atlantic Copper’s smelting
and refining operations, and materials and supplies inventories (refer
to Note 3 for further discussion). Inventories of materials and
supplies, as well as salable products, are stated at the lower of
weighted-average cost or market. Costs of finished goods and
work-in-process (i.e., not materials and supplies) inventories include
labor and benefits, supplies, energy, depreciation, depletion,
amortization, site overhead costs, and other necessary costs
associated with the extraction and processing of ore, including,
depending on the process, mining, haulage, milling, concentrating,
smelting, leaching, solution extraction, refining, roasting and
chemical processing. Corporate general and administrative costs are
not included in inventory costs.
Work-in-Process. In-process inventories represent materials that
are currently in the process of being converted to a salable product.
Conversion processes for mining operations vary depending on
the nature of the copper ore and the specific mining operation. For
sulfide ores, processing includes milling and concentrating and
results in the production of copper and molybdenum concentrates or,
alternatively, copper cathode by concentrate leaching. For oxide ores
and certain secondary sulfide ores, processing includes leaching
of stockpiles, solution extraction and electrowinning (SX/EW) and
results in the production of copper cathodes. In-process material
is measured based on assays of the material included in these
processes and projected recoveries. In-process inventories are valued
based on the costs incurred to various points in the process,
including depreciation relating to associated process facilities. For
Atlantic Copper, in-process inventories represent copper concentrates
at various stages of conversion into anodes and cathodes. Atlantic
Copper’s in-process inventories are valued at the weighted-average
cost of the material fed to the smelting and refining process plus
in-process conversion costs.
FRE
EP
OR
T-M
cMoR
an C
OP
PE
R &
GO
LD I
NC
. 2
010
Ann
ual
Rep
ort
70
NOTES TO CONSOLIDATED FINANCIAL STATEMENTS
Finished Goods. Finished goods include salable products (e.g.,
copper and molybdenum concentrates, copper anodes, copper
cathodes, copper rod, copper wire, molybdenum oxide, high-purity
molybdenum chemicals and other metallurgical products). Finished
goods are valued based on the weighted-average cost of source
material plus applicable conversion costs relating to associated
process facilities.
Mill and Leach Stockpiles. Mill and leach stockpiles are stated
at the lower of weighted-average cost or market. Both mill and
leach stockpiles generally contain lower grade ores that have been
extracted from the ore body and are available for copper recovery.
For mill stockpiles, recovery is through milling, concentrating,
smelting and refining or, alternatively, by concentrate leaching.
For leach stockpiles, recovery is through exposure to acidic solutions
that dissolve contained copper and deliver it in solution to
extraction processing facilities. The recorded cost of mill and
leach stockpiles includes mining and haulage costs incurred to
deliver ore to stockpiles, depreciation, depletion, amortization and
site overhead costs.
Because it is generally impracticable to determine copper
contained in mill and leach stockpiles by physical count, reasonable
estimation methods are employed. The quantity of material delivered
to mill and leach stockpiles is based on surveyed volumes of mined
material and daily production records. Sampling and assaying of
blasthole cuttings determine the estimated copper grade of the
material delivered to mill and leach stockpiles.
Expected copper recovery rates for mill stockpiles are determined
by metallurgical testing. The recoverable copper in mill stockpiles,
once entered into the production process, can be produced into
copper concentrate almost immediately.
Expected copper recovery rates for leach stockpiles are determined
using small-scale laboratory tests, small- to large-scale column
testing (which simulates the production-scale process), historical
trends and other factors, including mineralogy of the ore and rock
type. Ultimate recovery of copper contained in leach stockpiles can
vary significantly from a low percentage to more than 90 percent
depending on several variables, including type of copper recovery,
mineralogy and particle size of the rock. For newly placed material on
active stockpiles, as much as 70 percent of the copper ultimately
recoverable may be extracted during the first year, and the remaining
copper may be recovered over many years.
Processes and recovery rates are monitored regularly, and recovery
rate estimates are adjusted periodically as additional information
becomes available and as related technology changes.
Property, Plant, Equipment and Development Costs. Property, plant,
equipment and development costs are carried at cost. Mineral
exploration costs, as well as drilling and other costs incurred for the
purpose of converting mineral resources to proven and probable
reserves or identifying new mineral resources at development or
production stage properties, are charged to expense as incurred.
Development costs are capitalized beginning after proven and
probable reserves have been established. Development costs include
costs incurred resulting from mine pre-production activities
undertaken to gain access to proven and probable reserves including
shafts, adits, drifts, ramps, permanent excavations, infrastructure
and removal of overburden. Additionally, interest expense allocable to
the cost of developing mining properties and to constructing new
facilities is capitalized until assets are ready for their intended use.
Expenditures for replacements and improvements are capitalized.
Costs related to periodic scheduled maintenance (i.e., turnarounds)
are expensed as incurred. Depreciation for mining and milling
life-of-mine assets, infrastructure and other common costs is
determined using the unit-of-production method based on total
estimated recoverable proven and probable copper reserves (for
primary copper mines) and proven and probable molybdenum
reserves (for the primary molybdenum mine). Development costs and
acquisition costs for proven and probable reserves that relate to a
specific ore body are depreciated using the unit-of-production
method based on estimated recoverable proven and probable
reserves for the ore body benefited. Depreciation, depletion and
amortization using the unit-of-production method is recorded upon
extraction of the recoverable copper or molybdenum from the ore
body, at which time it is allocated to inventory cost and then included
as a component of cost of goods sold. Other assets are depreciated
on a straight-line basis over estimated useful lives of up to 30 years
for buildings and three to 20 years for machinery and equipment, and
mobile equipment.
Included in property, plant, equipment and development costs is
value beyond proven and probable reserves (VBPP) primarily resulting
from FCX’s acquisition of Phelps Dodge Corporation (Phelps Dodge)
in 2007. The concept of VBPP has been interpreted differently by
different mining companies. FCX’s VBPP is attributable to
(i) mineralized material, which includes measured and indicated
amounts, that FCX believes could be brought into production with the
establishment or modification of required permits and should market
conditions and technical assessments warrant, (ii) inferred mineral
resources and (iii) exploration potential, as further defined below.
Mineralized material is a mineralized body that has been
delineated by appropriately spaced drilling and/or underground
sampling to support reported tonnage and average grade of minerals.
Such a deposit does not qualify as proven and probable reserves until
legal and economic feasibility are confirmed based upon a
comprehensive evaluation of development costs, unit costs, grades,
recoveries and other material factors. Inferred mineral resources are
that part of a mineral resource for which the overall tonnages, grades
and mineral contents can be estimated with a reasonable level of
confidence based on geological evidence and apparent geological and
grade continuity after applying economic parameters. An inferred
mineral resource has a lower level of confidence than that applying to
FRE
EP
OR
T-McM
oRan C
OP
PE
R &
GO
LD IN
C. 2
010 A
nnual Rep
ort
71
FRE
EP
OR
T-M
cMoR
an C
OP
PE
R &
GO
LD I
NC
. 2
010
Ann
ual
Rep
ort
72
NOTES TO CONSOLIDATED FINANCIAL STATEMENTS
an indicated mineral resource. Exploration potential is the estimated
value of potential mineral deposits that FCX has the legal right to
access. The value assigned to exploration potential was determined
by interpreting the known exploration information and exploration
results, including geological data and/or geological information, that
were available as of the acquisition date.
Carrying amounts assigned to VBPP are not charged to expense
until the VBPP becomes associated with additional proven and
probable reserves and the reserves are produced or the VBPP is
determined to be impaired. Additions to proven and probable reserves
for properties with VBPP will carry with them the value assigned to
VBPP at the date acquired, less any impairment amounts.
Goodwill. FCX recorded goodwill as a result of the acquisition of
Phelps Dodge. Goodwill had an indefinite useful life and was not
amortized, but rather was tested for impairment at least annually,
unless events occurred or circumstances changed between annual
tests that would more likely than not reduce the fair value of a
related reporting unit below its carrying amount. FCX used
discounted cash flow models to determine if the carrying value of
the reporting unit was less than the fair value of the reporting unit.
FCX’s annual impairment test in the fourth quarter of 2008
resulted in the full impairment of goodwill (refer to Note 5 for
further discussion).
Intangible Assets and Liabilities. FCX recorded intangible assets
and liabilities as a result of the acquisition of Phelps Dodge.
Indefinite-lived intangibles primarily include water rights. Definite-
lived intangibles include favorable and unfavorable contracts
(primarily related to treatment and refining contract rates, power
contracts and tire contracts), royalty payments, patents and process
technology. The fair value of identifiable intangible assets was
estimated based principally upon comparable market transactions
and discounted future cash flow projections. The ranges for estimated
useful lives are 1 to 10 years for treatment and refining, power and
tire contracts; 1 to 12 years for royalty payments; and principally
10 to 20 years for patents and process technology. All indefinite-
lived intangible assets are subject to impairment testing at least
annually, unless events occur or circumstances change between
annual tests that would more likely than not reduce the indefinite-
lived intangible asset’s fair value below its carrying value.
Asset Impairment. FCX reviews and evaluates its long-lived assets
for impairment when events or changes in circumstances indicate
that the related carrying amounts may not be recoverable. Long-lived
assets, other than indefinite-lived intangible assets, are evaluated for
impairment under the two-step model. An impairment is considered
to exist if total estimated future cash flows on an undiscounted basis
are less than the carrying amount of the asset. Once it is determined
that an impairment exists, an impairment loss is measured as the
amount by which the asset carrying value exceeds its fair value. Fair
value is generally determined using valuation techniques such as
estimated future cash flows.
In evaluating mining operations’ long-lived assets for recoverability,
estimates of after-tax undiscounted future cash flows of FCX’s
individual mining operations are used, with impairment losses
measured by reference to fair value. As quoted market prices are
unavailable for FCX’s individual mining operations, fair value is
determined through the use of discounted estimated future cash
flows. Estimated cash flows used to assess recoverability of long-lived
assets and measure the fair value of FCX’s mining operations are
derived from current business plans, which are developed using
near-term price forecasts reflective of the current price environment
and management’s projections for long-term average metal prices.
Estimates of future cash flows include near and long-term metal price
assumptions; estimates of commodity-based and other input costs;
proven and probable reserve estimates, including any costs to
develop the reserves and the timing of producing the reserves; and
the use of appropriate current escalation and discount rates.
Deferred Mining Costs. Stripping costs (i.e., the costs of removing
overburden and waste material to access mineral deposits) incurred
during the production phase of a mine are considered variable
production costs and are included as a component of inventory
produced during the period in which stripping costs are incurred.
Major development expenditures, including stripping costs to prepare
unique and identifiable areas outside the current mining area for
future production that are considered to be pre-production mine
development, are capitalized and amortized on the unit-of-production
method based on estimated recoverable proven and probable
reserves for the ore body benefited. However, where a second or
subsequent pit or major expansion is considered to be a continuation
of existing mining activities, stripping costs are accounted for as a
current production cost and a component of the associated inventory.
Environmental Expenditures. Environmental expenditures are
expensed or capitalized, depending upon their future economic
benefits. Accruals for such expenditures are recorded when it is
probable that obligations have been incurred and the costs can be
reasonably estimated. For closed facilities and closed portions of
operating facilities with environmental obligations, an environmental
obligation is accrued when a decision to close a facility, or a portion
of a facility, is made by management and the environmental
obligation is considered to be probable. Environmental obligations
attributed to the Comprehensive Environmental Response,
Compensation, and Liability Act (CERCLA) or analogous state
programs are considered probable when a claim is asserted, or is
probable of assertion, and FCX, or any of its subsidiaries, have been
associated with the site. Other environmental remediation obligations
are considered probable based on specific facts and circumstances.
FCX’s estimates of these costs are based on an evaluation of various
factors, including currently available facts, existing technology,
presently enacted laws and regulations, remediation experience,
whether or not FCX is a potentially responsible party (PRP) and the
FRE
EP
OR
T-McM
oRan C
OP
PE
R &
GO
LD IN
C. 2
010 A
nnual Rep
ort
73
NOTES TO CONSOLIDATED FINANCIAL STATEMENTS
ability of other PRPs to pay their allocated portions. With the
exception of those obligations assumed in the acquisition of Phelps
Dodge that were recorded at estimated fair values (refer to Note 13
for further discussion), environmental obligations are recorded on an
undiscounted basis. Where the available information is sufficient to
estimate the amount of the obligation, that estimate has been used.
Where the information is only sufficient to establish a range of
probable liability and no point within the range is more likely than any
other, the lower end of the range has been used. Possible recoveries
of some of these costs from other parties are not recognized in the
consolidated financial statements until they become probable. Legal
costs associated with environmental remediation (such as fees to
outside law firms for work relating to determining the extent and type
of remedial actions and the allocation of costs among PRPs) are
included as part of the estimated obligation. Environmental
obligations assumed in the acquisition of Phelps Dodge, which were
initially estimated on a discounted basis, are accreted to full value
over time through charges to interest expense. Adjustments to the
obligations are charged to operating income.
Asset Retirement Obligations. FCX records the fair value of
estimated asset retirement obligations (AROs) associated with
tangible long-lived assets in the period incurred. Retirement
obligations associated with long-lived assets are those for which
there is a legal obligation to settle under existing or enacted law,
statute, written or oral contract or by legal construction. These
obligations, which are initially estimated based on discounted cash
flow estimates, are accreted to full value over time through charges
to cost of sales. In addition, asset retirement costs (ARCs) are
capitalized as part of the related asset’s carrying value and are
depreciated (primarily on a unit-of-production basis) over the
asset’s respective useful life. Reclamation costs for future
disturbances are recognized as an ARO and as a related ARC in the
period of the disturbance. FCX’s AROs consist primarily of costs
associated with mine reclamation and closure activities. These
activities, which are site specific, generally include costs for
earthwork, revegetation, water treatment and demolition (refer to
Note 13 for further discussion).
Income Taxes. FCX accounts for deferred income taxes utilizing an
asset and liability method, whereby deferred tax assets and liabilities
are recognized based on the tax effects of temporary differences
between the financial statements and the tax basis of assets and
liabilities, as measured by current enacted tax rates (refer to Note 12
for further discussion). When appropriate, FCX evaluates the need for
a valuation allowance to reduce deferred tax assets to estimated
recoverable amounts. The effect on deferred income tax assets and
liabilities of a change in tax rates or laws is recognized in income in
the period in which such changes are enacted.
FCX accounts for uncertain income tax positions using a threshold
and measurement attribute for the financial statement recognition
and measurement of a tax position taken or expected to be taken in a
tax return. FCX’s policy associated with uncertain tax positions is to
record accrued interest in interest expense and accrued penalties in
other income and expenses rather than in the provision for income
taxes (refer to Note 12 for further discussion).
With the exception of FCX’s Congolese operations, income taxes
are provided on the earnings of FCX’s material foreign subsidiaries
under the assumption that these earnings will be distributed. FCX has
determined that undistributed earnings related to its Congolese
operations are reinvested indefinitely or have been allocated toward
specifically identifiable needs of the local operations. FCX has not
provided for other differences between the book and tax carrying
amounts of these investments as FCX considers its ownership
position to be permanent in duration and quantification of the related
deferred tax liability is not practicable.
Derivative Instruments. FCX and its subsidiaries have entered
into derivative contracts to manage certain risks resulting from
fluctuations in commodity prices (primarily copper and gold), foreign
currency exchange rates and interest rates by creating offsetting
market exposures. Every derivative instrument (including certain
derivative instruments embedded in other contracts) is recorded in
the balance sheet as either an asset or liability measured at its fair
value. The accounting for changes in the fair value of a derivative
instrument depends on the intended use of the derivative and the
resulting designation. Refer to Note 15 for a summary of FCX’s
outstanding derivative instruments at December 31, 2010, and a
discussion of FCX’s risk management strategies for those designated
as hedges.
Revenue Recognition. FCX sells its products pursuant to sales
contracts entered into with its customers. Revenue for all FCX’s
products is recognized when title and risk of loss pass to the
customer and when collectibility is reasonably assured. The passing
of title and risk of loss to the customer are based on terms of the
sales contract, generally upon shipment or delivery of product.
Revenues from FCX’s concentrate and cathode sales are recorded
based on a provisional sales price or a final sales price calculated
in accordance with the terms specified in the relevant sales contract.
Revenues from concentrate sales are recorded net of treatment and
all refining charges (including price participation, if applicable, as
discussed below) and the impact of derivative contracts. Moreover,
because a portion of the metals contained in copper concentrates
is unrecoverable as a result of the smelting process, FCX’s revenues
from concentrate sales are also recorded net of allowances based on
the quantity and value of these unrecoverable metals. These
allowances are a negotiated term of FCX’s contracts and vary by
customer. Treatment and refining charges represent payments
or price adjustments to smelters and refiners and are either fixed
or, in certain cases, vary with the price of copper (referred to as
price participation).
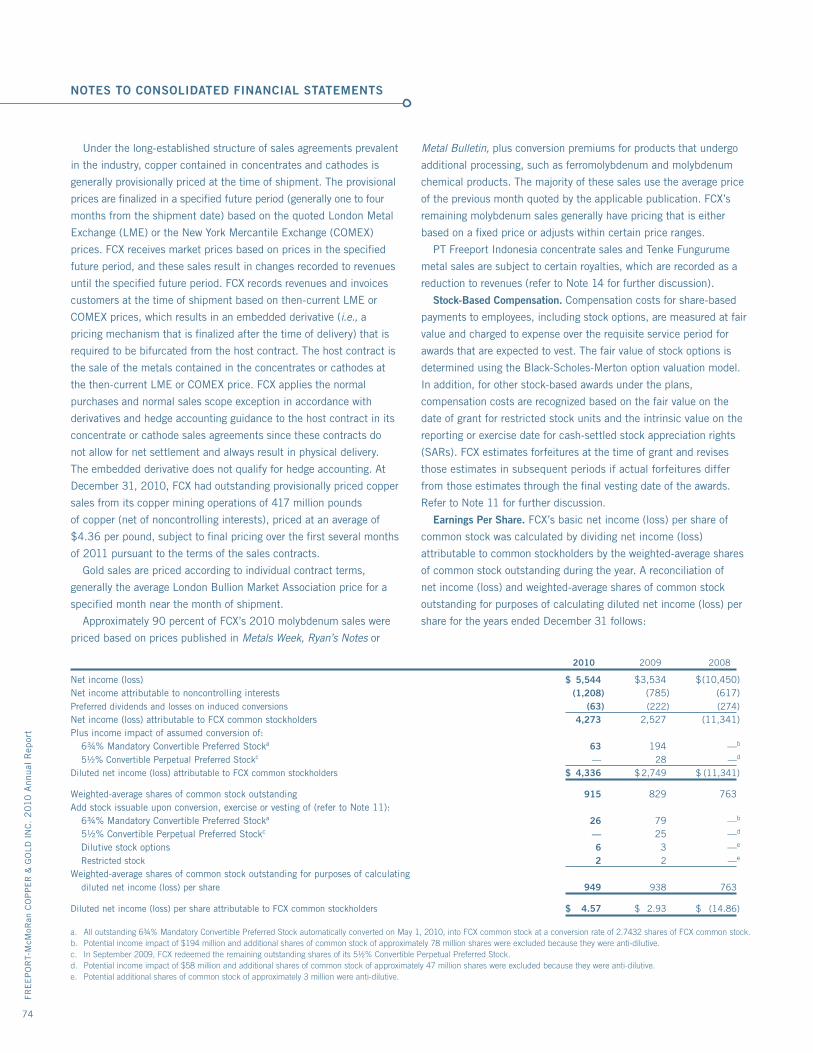
FRE
EP
OR
T-M
cMoR
an C
OP
PE
R &
GO
LD I
NC
. 2
010
Ann
ual
Rep
ort
74
Metal Bulletin, plus conversion premiums for products that undergo
additional processing, such as ferromolybdenum and molybdenum
chemical products. The majority of these sales use the average price
of the previous month quoted by the applicable publication. FCX’s
remaining molybdenum sales generally have pricing that is either
based on a fixed price or adjusts within certain price ranges.
PT Freeport Indonesia concentrate sales and Tenke Fungurume
metal sales are subject to certain royalties, which are recorded as a
reduction to revenues (refer to Note 14 for further discussion).
Stock-Based Compensation. Compensation costs for share-based
payments to employees, including stock options, are measured at fair
value and charged to expense over the requisite service period for
awards that are expected to vest. The fair value of stock options is
determined using the Black-Scholes-Merton option valuation model.
In addition, for other stock-based awards under the plans,
compensation costs are recognized based on the fair value on the
date of grant for restricted stock units and the intrinsic value on the
reporting or exercise date for cash-settled stock appreciation rights
(SARs). FCX estimates forfeitures at the time of grant and revises
those estimates in subsequent periods if actual forfeitures differ
from those estimates through the final vesting date of the awards.
Refer to Note 11 for further discussion.
Earnings Per Share. FCX’s basic net income (loss) per share of
common stock was calculated by dividing net income (loss)
attributable to common stockholders by the weighted-average shares
of common stock outstanding during the year. A reconciliation of
net income (loss) and weighted-average shares of common stock
outstanding for purposes of calculating diluted net income (loss) per
share for the years ended December 31 follows:
NOTES TO CONSOLIDATED FINANCIAL STATEMENTS
Under the long-established structure of sales agreements prevalent
in the industry, copper contained in concentrates and cathodes is
generally provisionally priced at the time of shipment. The provisional
prices are finalized in a specified future period (generally one to four
months from the shipment date) based on the quoted London Metal
Exchange (LME) or the New York Mercantile Exchange (COMEX)
prices. FCX receives market prices based on prices in the specified
future period, and these sales result in changes recorded to revenues
until the specified future period. FCX records revenues and invoices
customers at the time of shipment based on then-current LME or
COMEX prices, which results in an embedded derivative (i.e., a
pricing mechanism that is finalized after the time of delivery) that is
required to be bifurcated from the host contract. The host contract is
the sale of the metals contained in the concentrates or cathodes at
the then-current LME or COMEX price. FCX applies the normal
purchases and normal sales scope exception in accordance with
derivatives and hedge accounting guidance to the host contract in its
concentrate or cathode sales agreements since these contracts do
not allow for net settlement and always result in physical delivery.
The embedded derivative does not qualify for hedge accounting. At
December 31, 2010, FCX had outstanding provisionally priced copper
sales from its copper mining operations of 417 million pounds
of copper (net of noncontrolling interests), priced at an average of
$4.36 per pound, subject to final pricing over the first several months
of 2011 pursuant to the terms of the sales contracts.
Gold sales are priced according to individual contract terms,
generally the average London Bullion Market Association price for a
specified month near the month of shipment.
Approximately 90 percent of FCX’s 2010 molybdenum sales were
priced based on prices published in Metals Week, Ryan’s Notes or
2010 2009 2008
Net income (loss) $ 5,544 $ 3,534 $ (10,450)Net income attributable to noncontrolling interests (1,208) (785) (617)Preferred dividends and losses on induced conversions (63) (222) (274)Net income (loss) attributable to FCX common stockholders 4,273 2,527 (11,341)Plus income impact of assumed conversion of: 6¾% Mandatory Convertible Preferred Stocka 63 194 —b
5½% Convertible Perpetual Preferred Stockc — 28 —d
Diluted net income (loss) attributable to FCX common stockholders $ 4,336 $ 2,749 $ (11,341)
Weighted-average shares of common stock outstanding 915 829 763Add stock issuable upon conversion, exercise or vesting of (refer to Note 11): 6¾% Mandatory Convertible Preferred Stocka 26 79 —b
5½% Convertible Perpetual Preferred Stockc — 25 —d
Dilutive stock options 6 3 —e
Restricted stock 2 2 —e
Weighted-average shares of common stock outstanding for purposes of calculating diluted net income (loss) per share 949 938 763
Diluted net income (loss) per share attributable to FCX common stockholders $ 4.57 $ 2.93 $ (14.86)
a. All outstanding 6¾% Mandatory Convertible Preferred Stock automatically converted on May 1, 2010, into FCX common stock at a conversion rate of 2.7432 shares of FCX common stock.b. Potential income impact of $194 million and additional shares of common stock of approximately 78 million shares were excluded because they were anti-dilutive.c. In September 2009, FCX redeemed the remaining outstanding shares of its 5½% Convertible Perpetual Preferred Stock.d. Potential income impact of $58 million and additional shares of common stock of approximately 47 million shares were excluded because they were anti-dilutive.e. Potential additional shares of common stock of approximately 3 million were anti-dilutive.
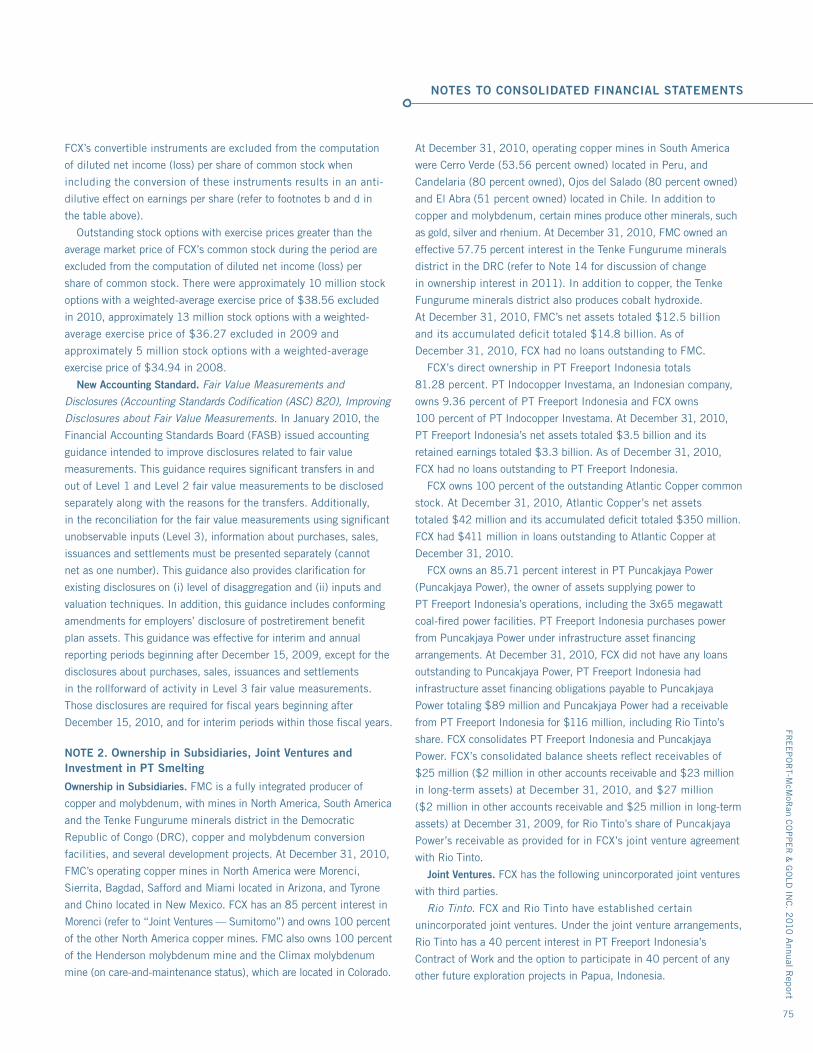
FRE
EP
OR
T-McM
oRan C
OP
PE
R &
GO
LD IN
C. 2
010 A
nnual Rep
ort
75
NOTES TO CONSOLIDATED FINANCIAL STATEMENTS
FCX’s convertible instruments are excluded from the computation
of diluted net income (loss) per share of common stock when
including the conversion of these instruments results in an anti-
dilutive effect on earnings per share (refer to footnotes b and d in
the table above).
Outstanding stock options with exercise prices greater than the
average market price of FCX’s common stock during the period are
excluded from the computation of diluted net income (loss) per
share of common stock. There were approximately 10 million stock
options with a weighted-average exercise price of $38.56 excluded
in 2010, approximately 13 million stock options with a weighted-
average exercise price of $36.27 excluded in 2009 and
approximately 5 million stock options with a weighted-average
exercise price of $34.94 in 2008.
New Accounting Standard. Fair Value Measurements and
Disclosures (Accounting Standards Codification (ASC) 820), Improving
Disclosures about Fair Value Measurements. In January 2010, the
Financial Accounting Standards Board (FASB) issued accounting
guidance intended to improve disclosures related to fair value
measurements. This guidance requires significant transfers in and
out of Level 1 and Level 2 fair value measurements to be disclosed
separately along with the reasons for the transfers. Additionally,
in the reconciliation for the fair value measurements using significant
unobservable inputs (Level 3), information about purchases, sales,
issuances and settlements must be presented separately (cannot
net as one number). This guidance also provides clarification for
existing disclosures on (i) level of disaggregation and (ii) inputs and
valuation techniques. In addition, this guidance includes conforming
amendments for employers’ disclosure of postretirement benefit
plan assets. This guidance was effective for interim and annual
reporting periods beginning after December 15, 2009, except for the
disclosures about purchases, sales, issuances and settlements
in the rollforward of activity in Level 3 fair value measurements.
Those disclosures are required for fiscal years beginning after
December 15, 2010, and for interim periods within those fiscal years.
NOTE 2. Ownership in Subsidiaries, Joint Ventures and Investment in PT Smelting
Ownership in Subsidiaries. FMC is a fully integrated producer of
copper and molybdenum, with mines in North America, South America
and the Tenke Fungurume minerals district in the Democratic
Republic of Congo (DRC), copper and molybdenum conversion
facilities, and several development projects. At December 31, 2010,
FMC’s operating copper mines in North America were Morenci,
Sierrita, Bagdad, Safford and Miami located in Arizona, and Tyrone
and Chino located in New Mexico. FCX has an 85 percent interest in
Morenci (refer to “Joint Ventures — Sumitomo”) and owns 100 percent
of the other North America copper mines. FMC also owns 100 percent
of the Henderson molybdenum mine and the Climax molybdenum
mine (on care-and-maintenance status), which are located in Colorado.
At December 31, 2010, operating copper mines in South America
were Cerro Verde (53.56 percent owned) located in Peru, and
Candelaria (80 percent owned), Ojos del Salado (80 percent owned)
and El Abra (51 percent owned) located in Chile. In addition to
copper and molybdenum, certain mines produce other minerals, such
as gold, silver and rhenium. At December 31, 2010, FMC owned an
effective 57.75 percent interest in the Tenke Fungurume minerals
district in the DRC (refer to Note 14 for discussion of change
in ownership interest in 2011). In addition to copper, the Tenke
Fungurume minerals district also produces cobalt hydroxide.
At December 31, 2010, FMC’s net assets totaled $12.5 billion
and its accumulated deficit totaled $14.8 billion. As of
December 31, 2010, FCX had no loans outstanding to FMC.
FCX’s direct ownership in PT Freeport Indonesia totals
81.28 percent. PT Indocopper Investama, an Indonesian company,
owns 9.36 percent of PT Freeport Indonesia and FCX owns
100 percent of PT Indocopper Investama. At December 31, 2010,
PT Freeport Indonesia’s net assets totaled $3.5 billion and its
retained earnings totaled $3.3 billion. As of December 31, 2010,
FCX had no loans outstanding to PT Freeport Indonesia.
FCX owns 100 percent of the outstanding Atlantic Copper common
stock. At December 31, 2010, Atlantic Copper’s net assets
totaled $42 million and its accumulated deficit totaled $350 million.
FCX had $411 million in loans outstanding to Atlantic Copper at
December 31, 2010.
FCX owns an 85.71 percent interest in PT Puncakjaya Power
(Puncakjaya Power), the owner of assets supplying power to
PT Freeport Indonesia’s operations, including the 3x65 megawatt
coal-fired power facilities. PT Freeport Indonesia purchases power
from Puncakjaya Power under infrastructure asset financing
arrangements. At December 31, 2010, FCX did not have any loans
outstanding to Puncakjaya Power, PT Freeport Indonesia had
infrastructure asset financing obligations payable to Puncakjaya
Power totaling $89 million and Puncakjaya Power had a receivable
from PT Freeport Indonesia for $116 million, including Rio Tinto’s
share. FCX consolidates PT Freeport Indonesia and Puncakjaya
Power. FCX’s consolidated balance sheets reflect receivables of
$25 million ($2 million in other accounts receivable and $23 million
in long-term assets) at December 31, 2010, and $27 million
($2 million in other accounts receivable and $25 million in long-term
assets) at December 31, 2009, for Rio Tinto’s share of Puncakjaya
Power’s receivable as provided for in FCX’s joint venture agreement
with Rio Tinto.
Joint Ventures. FCX has the following unincorporated joint ventures
with third parties.
Rio Tinto. FCX and Rio Tinto have established certain
unincorporated joint ventures. Under the joint venture arrangements,
Rio Tinto has a 40 percent interest in PT Freeport Indonesia’s
Contract of Work and the option to participate in 40 percent of any
other future exploration projects in Papua, Indonesia.
FRE
EP
OR
T-M
cMoR
an C
OP
PE
R &
GO
LD I
NC
. 2
010
Ann
ual
Rep
ort
76
NOTES TO CONSOLIDATED FINANCIAL STATEMENTS
Pursuant to the joint venture agreement, Rio Tinto has a 40 percent
interest in certain assets and future production exceeding specified
annual amounts of copper, gold and silver through 2021 in Block A
of PT Freeport Indonesia’s Contract of Work, and, after 2021, a
40 percent interest in all production from Block A. All of PT Freeport
Indonesia’s proven and probable reserves and its mining operations
are located in the Block A area. Operating, nonexpansion capital
and administrative costs are shared proportionately between
PT Freeport Indonesia and Rio Tinto based on the ratio of (i) the
incremental revenues from production from PT Freeport Indonesia’s
most recent expansion completed in 1998 to (ii) total revenues from
production from Block A, including production from PT Freeport
Indonesia’s previously existing reserves. PT Freeport Indonesia will
continue to receive 100 percent of the cash flow from specified
annual amounts of copper, gold and silver through 2021
calculated by reference to its proven and probable reserves as of
December 31, 1994, and 60 percent of all remaining cash flow.
The payable to Rio Tinto for its share of joint venture cash flows
was $132 million at December 31, 2010, and $161 million at
December 31, 2009.
Under the joint venture arrangements, Rio Tinto funded
$100 million in 1996 for approved exploration costs in the areas
covered by Contracts of Work held by FCX subsidiaries. Agreed-upon
exploration costs in the joint venture areas are shared 60 percent by
FCX and 40 percent by Rio Tinto. Since September 2008, Rio Tinto
is no longer participating in exploration joint ventures in the
PT Nabire Bakti Mining and PT Irja Eastern Minerals Contract of
Work areas in Indonesia. As a result, as long as Rio Tinto continues
not to fund these exploration projects, FCX has the option to fund
100 percent of future exploration costs in these areas and Rio Tinto’s
interest in these areas will decline over time in accordance with the
joint venture agreement. Rio Tinto has the option to resume
participation in PT Irja Eastern Minerals on a monthly basis and in
PT Nabire Bakti Mining on an annual basis. Rio Tinto continues
to participate in exploration joint ventures in PT Freeport Indonesia’s
Contract of Work areas.
Sumitomo. FCX owns an 85 percent undivided interest in Morenci
via an unincorporated joint venture. The remaining 15 percent is
owned by Sumitomo, a jointly owned subsidiary of Sumitomo Metal
Mining Co., Ltd. and Sumitomo Corporation. Each partner takes in
kind its share of Morenci’s production. FMC purchased 66 million
pounds of Morenci’s copper cathode from Sumitomo for $223 million
during 2010, 75 million pounds for $175 million during 2009 and
90 million pounds for $281 million during 2008. FCX had a
receivable from Sumitomo of $8 million at December 31, 2010, and
$6 million at December 31, 2009.
Investment in PT Smelting. PT Smelting, an Indonesian company,
operates a smelter and refinery in Gresik, Indonesia. During 2006,
PT Smelting completed an expansion of its production capacity to
275,000 metric tons of copper per year from 250,000 metric tons.
PT Freeport Indonesia, Mitsubishi Materials Corporation (Mitsubishi
Materials), Mitsubishi Corporation Unimetals Ltd. (Mitsubishi)
and Nippon Mining & Metals Co., Ltd. (Nippon) own 25 percent,
60.5 percent, 9.5 percent and 5 percent, respectively, of the
outstanding PT Smelting common stock.
PT Freeport Indonesia’s contract with PT Smelting provides for the
supply of 100 percent of the copper concentrate requirements
necessary for PT Smelting to produce 205,000 metric tons of copper
annually (essentially the smelter’s original design capacity) on a
priority basis. For the first 15 years of PT Smelting’s commercial
operations, beginning December 1998, PT Freeport Indonesia
agreed that the combined treatment and refining charges (processing
fees paid to smelters by miners) would approximate market rates,
but will not fall below specified minimum rates. The minimum rate,
applicable to the period April 27, 2008, to April 27, 2014, is
determined annually and must be sufficient to cover PT Smelting’s
annual cash operating costs (net of credits and including costs of
debt service) for 205,000 metric tons of copper. The maximum rate
is $0.30 per pound. The agreement is an amendment to the
long-term sales contract, which was approved by the Department of
Energy and Mineral Resources of the Government of Indonesia.
PT Freeport Indonesia also sells copper concentrate to PT Smelting at
market rates, which are not subject to a minimum or maximum rate,
for quantities in excess of 205,000 metric tons of copper annually.
FCX’s investment in PT Smelting totaled $11 million at
December 31, 2010, and $55 million at December 31, 2009.
PT Smelting had project-specific debt, nonrecourse to PT Freeport
Indonesia, totaling $180 million at December 31, 2010, and
$250 million at December 31, 2009. PT Freeport Indonesia had
a trade receivable from PT Smelting totaling $455 million at
December 31, 2010, and $300 million at December 31, 2009.
FRE
EP
OR
T-McM
oRan C
OP
PE
R &
GO
LD IN
C. 2
010 A
nnual Rep
ort
77
NOTES TO CONSOLIDATED FINANCIAL STATEMENTS
NOTE 3. Inventories, Including Long-Term Mill and Leach Stockpiles
The components of inventories follow:
December 31, 2010 2009
Mining Operations: Raw materials $ 1 $ 1 Work-in-process 93 108 Finished goodsa 704 588Atlantic Copper: Raw materials (concentrates) 336 171 Work-in-process 266 227 Finished goods 9 15Total product inventories 1,409 1,110Total materials and supplies, netb 1,169 1,093 Total inventories $ 2,578 $ 2,203
a. Primarily includes molybdenum concentrates and copper concentrates, anodes, cathodes and rod.
b. Materials and supplies inventory is net of obsolescence reserves totaling $26 million at December 31, 2010, and $21 million at December 31, 2009.
A summary of mill and leach stockpiles follows:
North SouthDecember 31, 2010 America America Indonesia Africa Total
Current: Mill stockpiles $ — $ 11 $ 24 $ — $ 35 Leach stockpiles 749 72 — — 821 Total current mill and leach stockpiles $ 749 $ 83 $ 24 $ — $ 856
Long-term:a
Mill stockpiles $ — $ 470 $ — $ — $ 470 Leach stockpiles 622 250 — 83 955 Total long-term mill and leach stockpiles $ 622 $ 720 $ — $ 83 $ 1,425
North SouthDecember 31, 2009 America America Indonesia Africa Total
Current: Mill stockpiles $ — $ 7 $ 39 $ — $ 46 Leach stockpiles 547 74 — — 621 Total current mill and leach stockpiles $ 547 $ 81 $ 39 $ — $ 667
Long-term:a
Mill stockpiles $ 15 $ 427 $ — $ — $ 442 Leach stockpiles 637 220 — 22 879 Total long-term mill and leach stockpiles $ 652 $ 647 $ — $ 22 $ 1,321
a. Materials in stockpiles not expected to be recovered within the next 12 months.
FCX recorded charges for lower of cost or market (LCM) molybdenum
inventory adjustments totaling $19 million ($15 million to net income
attributable to FCX common stockholders or $0.02 per diluted share)
during first-quarter 2009 resulting from lower molybdenum prices.
In 2008, FCX recorded charges totaling $782 million ($479 million
to net loss attributable to FCX common stockholders or $0.63 per
diluted share) for LCM inventory adjustments as a result of the declines
in copper and molybdenum prices in the fourth quarter of 2008 and
the impact of higher operating costs on inventory carrying values.
NOTE 4. Property, Plant, Equipment and Development Costs, Net
The components of net property, plant, equipment and development
costs, along with 2008 impairment charges, follow:
2008December 31, 2010 2009 Impairmentsa
Proven and probable reserves $ 4,503 $ 4,303 $ 10,056VBPP 1,100 1,297 471Development and other 3,188 2,983 279Buildings and infrastructure 2,815 2,703 167Machinery and equipment 7,523 7,282 938Mobile equipment 2,365 2,136 393Construction in progress 1,885 1,084 27 Property, plant, equipment and development costs 23,379 21,788 12,331Accumulated depreciation, depletion and amortization (6,594) (5,593) (1,583) Property, plant, equipment and development costs, net $ 16,785 $ 16,195 $ 10,748 a. FCX evaluated its long-lived assets for impairment as of December 31, 2008. These
evaluations resulted in the recognition of asset impairment charges to reduce the carrying value of its property, plant, equipment and development costs (refer to Note 17 for further discussion).
FCX recorded $2.2 billion for VBPP in connection with the Phelps
Dodge acquisition in 2007 and transferred $197 million during
2010, $159 million during 2009 and $383 million prior to 2009 to
proven and probable reserves.
FCX capitalized interest totaling $66 million in 2010, $78 million
in 2009 and $122 million in 2008. Capitalized interest primarily
related to development projects at the Climax and El Abra mines in
2010 and at the Tenke Fungurume mine in 2009 and 2008.
NOTE 5. Goodwill, and Intangible Assets and Liabilities
Goodwill. FCX recorded goodwill in 2007 in connection with the
Phelps Dodge acquisition, which primarily related to the requirement
to recognize a deferred tax liability for the difference between the
assigned values and the tax basis of assets acquired and liabilities
assumed in a business combination. In accordance with accounting
rules, goodwill resulting from a business combination is assigned
to the acquiring entity’s reporting units that are expected to benefit
from the business combination. The allocation of goodwill to
the reporting units, which FCX determined included its individual
mines, was completed in the first quarter of 2008.
As a result of FCX’s annual goodwill impairment testing in the
fourth quarter of 2008, FCX recognized impairment charges totaling
$6.0 billion ($6.0 billion to net loss attributable to FCX common
stockholders or $7.84 per diluted share) to eliminate the full carrying
value of goodwill. FCX’s evaluations were based at that time on
current business plans developed using near-term price forecasts
reflective of the then-current price environment and management’s
projections for long-term average metal prices (refer to Note 17
for further discussion of assumptions used in determining fair value).
FRE
EP
OR
T-M
cMoR
an C
OP
PE
R &
GO
LD I
NC
. 2
010
Ann
ual
Rep
ort
78
NOTES TO CONSOLIDATED FINANCIAL STATEMENTS
Intangible Assets and Liabilities. The components of intangible
assets and intangible liabilities (included in other liabilities) follow:
Gross Net Carrying Accumulated BookDecember 31, 2010 Value Amortization Value
Indefinite-lived water rights $ 245 $ — $ 245Patents and process technology 48 (11) 37Royalty payments 37 (18) 19Power contracts 25 (17) 8Other intangibles 25 (6) 19 Total intangible assets $ 380 $ (52) $ 328
Intangible liabilities: Treatment and refining terms in sales contracts $ 52 $ (25) $ 27
Gross Net Carrying Accumulated BookDecember 31, 2009 Value Amortization Value
Indefinite-lived water rights $ 253 $ — $ 253Patents and process technology 48 (8) 40Royalty payments 38 (15) 23Power contracts 25 (14) 11Other intangibles 25 (5) 20 Total intangible assets $ 389 $ (42) $ 347
Intangible liabilities: Treatment and refining terms in sales contracts $ 52 $ (21) $ 31
FCX evaluated its long-lived assets for impairment as of
December 31, 2008. These evaluations resulted in the recognition of
asset impairment charges totaling $119 million ($74 million to net
loss attributable to FCX common stockholders or $0.10 per diluted
share) to reduce the carrying values of definite-lived intangible assets
(refer to Note 17 for further discussion).
FCX performed its annual impairment testing of indefinite-lived
intangible assets in the fourth quarters of 2010, 2009 and 2008 and
concluded that there were no impairments.
Amortization of intangible assets recognized in production and
delivery costs was $10 million in 2010, $16 million in 2009 and
$63 million in 2008. Amortization of intangible liabilities recognized
in revenues was $4 million in 2010, $6 million in 2009 and
$3 million in 2008. The estimated net amortization expense for the
next five years is considered to be immaterial.
NOTE 6. Other Assets
The components of other assets follow:
December 31, 2010 2009
Cost-method investments: McMoRan Exploration Co. (MMR)a $ 500 $ — Other 3 3Notes and other receivables 200 168Trust assetsb,c 140 140Debt issue costs 58 95Equity-method investments: PT Smelting 11 55 Other 43 39Available-for-sale securities 28 62Deferred tax assets 2 126Other 12 12 Total other assets $ 997 $ 700
a. In December 2010, FCX purchased 500,000 shares of MMR’s 5¾% Convertible Perpetual Preferred Stock (the Preferred Stock) for an aggregate purchase price of $500 million. The Preferred Stock is initially convertible into 62.5 shares of MMR common stock per share of Preferred Stock (an aggregate of 31.25 million shares of MMR common stock), or an initial conversion price of $16 per share of MMR common stock. Several of FCX’s directors and executive officers also serve as directors or executive officers of MMR.
b. Includes $137 million in 2010 and $129 million in 2009 of legally restricted funds for AROs at the Chino, Tyrone and Cobre mines (refer to Note 13 for further discussion).
c. The current portion, which is included in other current assets, was $8 million at December 31, 2010, and $6 million at December 31, 2009.
NOTE 7. Accounts Payable and Accrued Liabilities
Additional information regarding accounts payable and accrued
liabilities follows:
December 31, 2010 2009
Accounts payable $ 1,272 $ 890Salaries, wages and other compensation 244 188Deferred revenue 180 54Pension, postretirement, postemployment and other employee benefitsa 156 127Other accrued taxes 152 133Community development programs 148 148Accrued interestb 92 113Current deferred tax liability 61 201Other 136 184 Total accounts payable and accrued liabilities $ 2,441 $ 2,038
a. Refer to Note 8 for long-term portion and Note 10 for further discussion.b. Third-party interest paid by FCX was $421 million in 2010, $504 million in 2009 and
$741 million in 2008.
NOTE 8. Other Liabilities
Additional information regarding other liabilities follows:
December 31, 2010 2009
Pension, postretirement, postemployment and other employment benefitsa $ 1,074 $ 950Reserve for uncertain tax benefits 133 157Insurance claim reserve 58 50Atlantic Copper contractual obligation to insurance company (refer to Note 10) 48 58Other 146 208 Total other liabilities $ 1,459 $ 1,423
a. Refer to Note 7 for short-term portion and Note 10 for further discussion.
FRE
EP
OR
T-McM
oRan C
OP
PE
R &
GO
LD IN
C. 2
010 A
nnual Rep
ort
79
NOTES TO CONSOLIDATED FINANCIAL STATEMENTS
NOTE 9. Debt
The components of debt follow:
December 31, 2010 2009
Revolving Credit Facilities $ — $ —Senior Notes: 8.375% Senior Notes due 2017 3,011 3,340 8.25% Senior Notes due 2015 1,079 1,297 Senior Floating Rate Notes due 2015 — 1,000 9½% Senior Notes due 2031 175 198 61/8% Senior Notes due 2034 115 115 71/8% Debentures due 2027 115 115 8¾% Senior Notes due 2011 85 87 7% Convertible Senior Notes due 2011 — 1Other (including equipment capital leases and short-term borrowings) 175 193 Total debt 4,755 6,346 Less current portion of debt (95) (16) Long-term debt $ 4,660 $ 6,330
Revolving Credit Facilities. The revolving credit facilities are available
until March 19, 2012, and are composed of (i) a $1.0 billion
revolving credit facility available to FCX and (ii) a $0.5 billion
revolving credit facility available to both FCX and PT Freeport
Indonesia. At December 31, 2010, FCX had no borrowings and
$43 million of letters of credit issued under the revolving credit
facilities, resulting in availability of approximately $1.5 billion,
of which $957 million could be used for additional letters of credit.
Interest on the revolving credit facilities is based on the London
Interbank Offered Rate (LIBOR) plus 1.00 percent, subject to an
increase or decrease in the interest rate margin based on the credit
ratings assigned by Standard & Poor’s Rating Services and Moody’s
Investors Service.
The revolving credit facilities are guaranteed by certain wholly
owned subsidiaries of FCX and are secured by the pledge of equity
in substantially all of these subsidiary guarantors and certain other
non-guarantor subsidiaries of FCX, and intercompany indebtedness
owed to FCX. Borrowings by FCX and PT Freeport Indonesia
under the $0.5 billion revolver are also secured with a pledge of
50.1 percent of the outstanding stock of PT Freeport Indonesia,
over 90 percent of the assets of PT Freeport Indonesia and, with
respect to borrowings by PT Freeport Indonesia, a pledge of the
Contract of Work.
Senior Notes. In March 2007, in connection with financing FCX’s
acquisition of Phelps Dodge, FCX sold $3.5 billion of 8.375% Senior
Notes due April 2017, $1.5 billion of 8.25% Senior Notes due April
2015 and $1.0 billion of Senior Floating Rate Notes due April 2015
for total net proceeds of $5.9 billion. Interest on the senior notes is
payable semiannually on April 1 and October 1. The Senior Floating
Rate Notes have been fully redeemed as further discussed below.
The 8.25% and 8.375% Senior Notes are redeemable in whole or in
part, at the option of FCX, at make-whole redemption prices prior
to the redemption dates, and afterwards at stated redemption prices.
The 8.25% Senior Notes are redeemable at fixed prices initially
starting at 104.125 percent for 12 months beginning on April 1,
2011, and the 8.375% Senior Notes are redeemable initially starting
at 104.188 percent for 12 months beginning on April 1, 2012.
During 2009, FCX purchased in open-market transactions
$203 million of the 8.25% Senior Notes for $218 million and
$160 million of the 8.375% Senior Notes for $172 million. These
open-market purchases resulted in losses on early extinguishment of
debt totaling $33 million ($29 million to net income attributable to
FCX common stockholders or $0.03 per diluted share). During 2010,
FCX purchased in open-market transactions $218 million of the
8.25% Senior Notes for $237 million and $329 million of the
8.375% Senior Notes for $358 million, which resulted in losses on
early extinguishment of debt totaling $55 million ($48 million to net
income attributable to FCX common stockholders or $0.05 per
diluted share). On April 1, 2010, FCX redeemed all of its $1.0 billion
of outstanding Senior Floating Rates Notes for which holders
received 101 percent of the principal amount together with accrued
and unpaid interest. As a result of this redemption, FCX recorded a
loss on early extinguishment of debt totaling $22 million ($20 million
to net income attributable to FCX common stockholders or $0.02 per
diluted share) during 2010. Refer to Note 21 for a discussion
of FCX’s February 2011 announcement to redeem the remaining
$1.1 billion of the 8.25% Senior Notes.
The 9½% Senior Notes due June 2031 and the 8¾% Senior Notes
due June 2011 bear interest payable semiannually on June 1 and
December 1. These notes are redeemable in whole or in part, at the
option of FCX, at a make-whole redemption price. In March 2007,
in connection with the acquisition of Phelps Dodge, FCX assumed
these senior notes with a stated value of $306 million, which was
increased by $54 million to reflect the fair market value of these
obligations at the acquisition date. The increase in value is being
amortized over the term of the notes and recorded as a reduction of
interest expense. In 2008, FCX purchased in an open-market
transaction $33 million of the 9½% Senior Notes for $46 million
and recorded losses on early extinguishment of debt totaling
$6 million ($5 million to net loss attributable to FCX common
stockholders or $0.01 per diluted share). In 2009, FCX purchased in
an open-market transaction $24 million of the 8¾% Senior Notes
for $26 million and recorded losses on early extinguishment of debt
totaling $1 million ($1 million to net income attributable to FCX
common stockholders or less than $0.01 per diluted share). In 2010,
FCX purchased in an open-market transaction $18 million of the
9½% Senior Notes for $26 million and recorded losses on early
extinguishment of debt totaling $4 million ($3 million to net income
attributable to FCX common stockholders or less than $0.01
per diluted share). At December 31, 2010, the outstanding principal
amount of the 9½% Senior Notes was $143 million and the 8¾%
Senior Notes was $84 million.
FRE
EP
OR
T-M
cMoR
an C
OP
PE
R &
GO
LD I
NC
. 2
010
Ann
ual
Rep
ort
80
NOTES TO CONSOLIDATED FINANCIAL STATEMENTS
The 61/8% Senior Notes due March 2034 bear interest payable
semiannually on March 15 and September 15. These notes are
redeemable in whole or in part, at the option of FCX, at a make-whole
redemption price. In March 2007, in connection with the acquisition
of Phelps Dodge, FCX assumed these senior notes with a stated
value of $150 million, which was reduced by $11 million to reflect
the fair market value of these obligations at the acquisition date.
The decrease in value is being amortized over the term of the notes
and recorded as additional interest expense. During 2007, FCX
purchased in an open-market transaction $26 million of these notes.
At December 31, 2010, the outstanding principal amount of these
senior notes was $124 million.
The 71/8% Debentures due November 2027 bear interest payable
semiannually on May 1 and November 1. The debentures are
redeemable in whole or in part, at the option of FCX, at a make-whole
redemption price. In March 2007, in connection with the acquisition
of Phelps Dodge, FCX assumed these debentures with a stated
and fair value of $115 million. At December 31, 2010, the
outstanding principal amount of these debentures was $115 million.
In February 2004, FCX sold $350 million of 67/8% Senior Notes
due February 2014 for net proceeds of $344 million. During 2004,
FCX purchased in open-market transactions $10 million of its 67/8%
Senior Notes. On August 20, 2009, FCX redeemed the remaining
$340 million of these notes for $352 million or a redemption price of
103.439 percent of the principal amount (plus accrued and unpaid
interest). FCX recorded losses on early extinguishment of debt
totaling $14 million ($13 million to net income attributable to FCX
common stockholders or $0.01 per diluted share) in 2009
associated with the redemption of the 67/8% Senior Notes.
All of FCX’s senior notes are unsecured.
Restrictive Covenants. The revolving credit facilities and the senior
notes used to finance the acquisition of Phelps Dodge contain
covenants that limit FCX’s ability to make certain payments. These
restrictions vary among the instruments, but generally limit FCX’s
ability to pay certain dividends on common and preferred stock,
repurchase or redeem common and preferred equity, prepay
subordinated debt and make certain investments. The revolving credit
facilities restrictions do not apply as long as availability under the
revolvers plus domestic cash exceeds $750 million. At December 31,
2010, FCX had availability under the revolvers plus domestic cash
(as defined by the revolving credit facility) totaling approximately
$4.1 billion. Because the ratings on the senior notes are investment
grade, the restrictions contained in FCX’s 8.375% and 8.25% Senior
Notes on incurring debt, making restricted payments and selling
assets are currently suspended. To the extent the rating is
downgraded below investment grade by both Standard & Poor’s
Rating Services and Moody’s Investors Service, the covenants would
again become effective. At December 31, 2010, the most restrictive
of the covenants related to restricted payments allowed for payments
up to approximately $11 billion.
Maturities. Maturities of debt instruments based on the amounts
and terms outstanding at December 31, 2010, total $95 million
in 2011, $1 million in 2012, $1 million in 2013, $1 million in 2014,
$1,080 million in 2015 and $3,577 million thereafter.
NOTE 10. Employee Benefits
Pension Plans. Following is a discussion of FCX’s pension plans.
FMC Plans. FMC has trusteed, non-contributory pension plans
covering substantially all of FMC’s U.S. employees and some
employees of its international subsidiaries. The applicable FMC plan
design determines the manner in which benefits are calculated for
any particular group of employees. For certain of these plans,
benefits are calculated based on final average monthly compensation
and years of service. In the case of other plans, benefits are calculated
based on a fixed amount for each year of service. Participants in the
FMC plans generally vest in their accrued benefits after five years of
service. Non-bargained FMC employees hired after December 31,
2006, are not eligible to participate in the FMC U.S. pension plan.
FCX’s funding policy for these plans provides that contributions to
pension trusts shall be at least equal to the minimum funding
requirements of the Employee Retirement Income Security Act of
1974, as amended, for U.S. plans; or, in the case of international
plans, the minimum legal requirements that may be applicable in the
various countries. Additional contributions also may be made from
time to time.
FCX’s policy for determining asset-mix targets for the Freeport-
McMoRan Corporation Defined Benefit Master Trust (Master Trust)
includes the periodic development of asset/liability studies to
determine expected long-term rates of return and expected risk for
various investment portfolios. Management considers these studies in
the formal establishment of asset-mix targets that are reviewed by
FCX’s retirement plan administration and investment committee.
FCX’s investment objective emphasizes the need to maintain a
well-diversified investment program through both the allocation of
the Master Trust assets among asset classes and the selection
of investment managers whose various styles are fundamentally
complementary to one another and serve to achieve satisfactory
rates of return. Diversification, by asset class and by investment
manager, is FCX’s principal means of reducing volatility and
exercising prudent investment judgment. FCX’s present target asset
allocation approximates 54 percent equity investments (35 percent
U.S. equities, 12 percent international equities and 7 percent
emerging markets equities), 35 percent fixed income (18 percent
U.S. fixed income, 5 percent international fixed income, 5 percent
high yield, 4 percent treasury inflation-protection securities and
3 percent emerging markets fixed income) and 11 percent alternative
investments (5 percent private equity, 3 percent private real estate
and 3 percent real estate investment trusts).
FRE
EP
OR
T-McM
oRan C
OP
PE
R &
GO
LD IN
C. 2
010 A
nnual Rep
ort
81
NOTES TO CONSOLIDATED FINANCIAL STATEMENTS
The expected rate of return on plan assets is evaluated at least
annually, taking into consideration asset allocation, historical returns
on the types of assets held in the Master Trust and the current
economic environment. For U.S. plans, the determination of the
expected long-term rate of return on plan assets is based on expected
future performance of the plan asset mix and active plan asset
management. Based on these factors, FCX expects the pension
assets will earn an average of 8.0 percent per annum during the
10 years beginning January 1, 2011. The 8.0 percent estimation was
based on a passive return on a compound basis of 7.5 percent and
a premium for active management of 0.5 percent reflecting the target
asset allocation and current investment array.
For estimation purposes, FCX assumes the long-term asset mix
for these plans generally will be consistent with the current mix.
Changes in the asset mix could impact the amount of recorded pension
income or expense, the funded status of the plans and the need for
future cash contributions. A lower-than-expected return on assets
also would decrease plan assets and increase the amount of recorded
pension expense in future years. When calculating the expected
return on plan assets, FCX uses the market value of assets.
Among the assumptions used to estimate the benefit obligation is
a discount rate used to calculate the present value of expected future
benefit payments for service to date. The discount rate assumption
for FCX’s U.S. plans is designed to reflect yields on high-quality,
fixed-income investments for a given duration. The determination of
the discount rate for these plans is based on expected future benefit
payments for service to date together with the Mercer Pension
Discount Curve. The Mercer Pension Discount Curve consists of
spot (i.e., zero coupon) interest rates at one-half year increments
for each of the next 30 years and is developed based on pricing
and yield information for high-quality corporate bonds. Prior to
December 31, 2010, FCX determined its discount rate based on
expected future benefit payments for service to date together with
the Citigroup Pension Discount Curve. Changes in the discount
rate are reflected in FCX’s benefit obligation and, therefore, in future
pension costs.
Other FCX Plans. In February 2004, FCX established an unfunded
Supplemental Executive Retirement Plan (SERP) for its two most
senior executive officers. The SERP provides for retirement benefits
payable in the form of a joint and survivor annuity or an equivalent
lump sum. The annuity will equal a percentage of the executive’s
highest average compensation for any consecutive three-year period
during the five years immediately preceding the earlier of the
executive’s retirement or completion of 25 years of credited service.
The SERP benefit will be reduced by the value of all benefits paid
or due under any defined benefit or defined contribution plan
sponsored by FM Services Company, FCX’s wholly owned subsidiary,
FCX or its predecessor, but not including accounts funded
exclusively by deductions from participant’s pay. FCX also has an
unfunded pension plan for its directors and an excess benefits plan
for its executives, both of which no longer accrue benefits.
PT Freeport Indonesia Plan. PT Freeport Indonesia has a defined
benefit pension plan denominated in Indonesian rupiah covering
substantially all of its Indonesian national employees. PT Freeport
Indonesia funds the plan and invests the assets in accordance
with Indonesian pension guidelines. The pension obligation was
valued at an exchange rate of 8,990 rupiah to one U.S. dollar
on December 31, 2010, and 9,420 rupiah to one U.S. dollar on
December 31, 2009. Indonesian labor laws enacted in 2003
require that companies provide a minimum level of benefits to
employees upon employment termination based on the reason for
termination and the employee’s years of service. PT Freeport
Indonesia’s pension benefit disclosures include benefits related to
this law. PT Freeport Indonesia’s expected rate of return on plan
assets is evaluated at least annually, taking into consideration its
historical yield and the long-range estimated return for the plan
based on the asset mix.
Atlantic Copper Plan. Atlantic Copper has a contractual obligation
denominated in euros to supplement amounts paid to certain
retired Spanish national employees. As required by Spanish law,
beginning in August 2002, Atlantic Copper began funding
7.2 million euros ($10 million based on a December 31, 2010,
exchange rate of $1.34 per euro) annually for 15 years to an approved
insurance company for its estimated 72 million euro contractual
obligation to the retired employees. The insurance company invests
the plan assets in accordance with Spanish regulations, and
Atlantic Copper has no control over these investments.
Plan Information. FCX uses a measurement date of December 31
for its plans. In some plans, the plan assets exceed the accumulated
benefit obligations, while in the remainder, the accumulated
benefit obligations exceed the plan assets. Information for those
plans where the accumulated benefit obligations exceed the plan
assets follows:
December 31, 2010 2009
Projected benefit obligation $ 1,662 $ 1,544Accumulated benefit obligation 1,581 1,450Fair value of plan assets 1,122 1,076
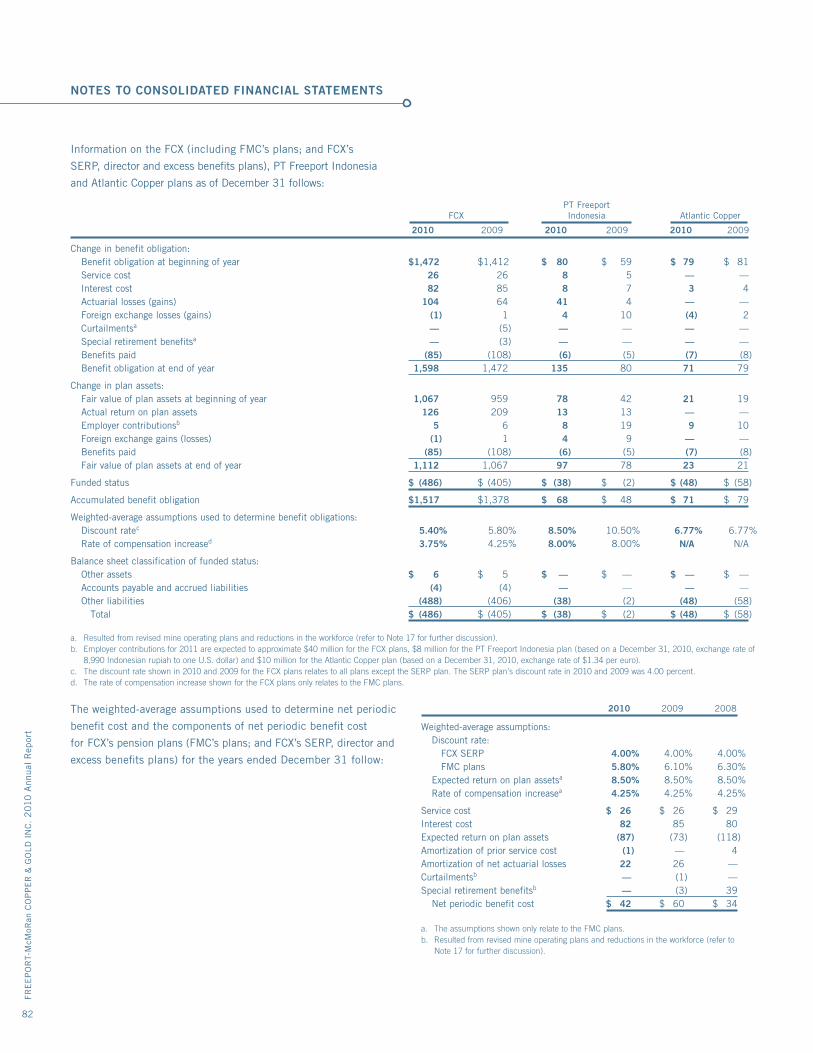
FRE
EP
OR
T-M
cMoR
an C
OP
PE
R &
GO
LD I
NC
. 2
010
Ann
ual
Rep
ort
82
NOTES TO CONSOLIDATED FINANCIAL STATEMENTS
Information on the FCX (including FMC’s plans; and FCX’s
SERP, director and excess benefits plans), PT Freeport Indonesia
and Atlantic Copper plans as of December 31 follows:
PT Freeport FCX Indonesia Atlantic Copper
2010 2009 2010 2009 2010 2009
Change in benefit obligation: Benefit obligation at beginning of year $ 1,472 $ 1,412 $ 80 $ 59 $ 79 $ 81 Service cost 26 26 8 5 — — Interest cost 82 85 8 7 3 4 Actuarial losses (gains) 104 64 41 4 — — Foreign exchange losses (gains) (1) 1 4 10 (4) 2 Curtailmentsa — (5) — — — — Special retirement benefitsa — (3) — — — — Benefits paid (85) (108) (6) (5) (7) (8) Benefit obligation at end of year 1,598 1,472 135 80 71 79
Change in plan assets: Fair value of plan assets at beginning of year 1,067 959 78 42 21 19 Actual return on plan assets 126 209 13 13 — — Employer contributionsb 5 6 8 19 9 10 Foreign exchange gains (losses) (1) 1 4 9 — — Benefits paid (85) (108) (6) (5) (7) (8) Fair value of plan assets at end of year 1,112 1,067 97 78 23 21
Funded status $ (486) $ (405) $ (38) $ (2) $ (48) $ (58)
Accumulated benefit obligation $ 1,517 $ 1,378 $ 68 $ 48 $ 71 $ 79
Weighted-average assumptions used to determine benefit obligations: Discount ratec 5.40% 5.80% 8.50% 10.50% 6.77% 6.77% Rate of compensation increased 3.75% 4.25% 8.00% 8.00% N/A N/A
Balance sheet classification of funded status: Other assets $ 6 $ 5 $ — $ — $ — $ — Accounts payable and accrued liabilities (4) (4) — — — — Other liabilities (488) (406) (38) (2) (48) (58) Total $ (486) $ (405) $ (38) $ (2) $ (48) $ (58)
a. Resulted from revised mine operating plans and reductions in the workforce (refer to Note 17 for further discussion).b. Employer contributions for 2011 are expected to approximate $40 million for the FCX plans, $8 million for the PT Freeport Indonesia plan (based on a December 31, 2010, exchange rate of
8,990 Indonesian rupiah to one U.S. dollar) and $10 million for the Atlantic Copper plan (based on a December 31, 2010, exchange rate of $1.34 per euro).c. The discount rate shown in 2010 and 2009 for the FCX plans relates to all plans except the SERP plan. The SERP plan’s discount rate in 2010 and 2009 was 4.00 percent.d. The rate of compensation increase shown for the FCX plans only relates to the FMC plans.
The weighted-average assumptions used to determine net periodic
benefit cost and the components of net periodic benefit cost
for FCX’s pension plans (FMC’s plans; and FCX’s SERP, director and
excess benefits plans) for the years ended December 31 follow:
2010 2009 2008
Weighted-average assumptions: Discount rate: FCX SERP 4.00% 4.00% 4.00% FMC plans 5.80% 6.10% 6.30% Expected return on plan assetsa 8.50% 8.50% 8.50% Rate of compensation increasea 4.25% 4.25% 4.25%
Service cost $ 26 $ 26 $ 29Interest cost 82 85 80Expected return on plan assets (87) (73) (118)Amortization of prior service cost (1) — 4Amortization of net actuarial losses 22 26 —Curtailmentsb — (1) —Special retirement benefitsb — (3) 39 Net periodic benefit cost $ 42 $ 60 $ 34
a. The assumptions shown only relate to the FMC plans.b. Resulted from revised mine operating plans and reductions in the workforce (refer to
Note 17 for further discussion).
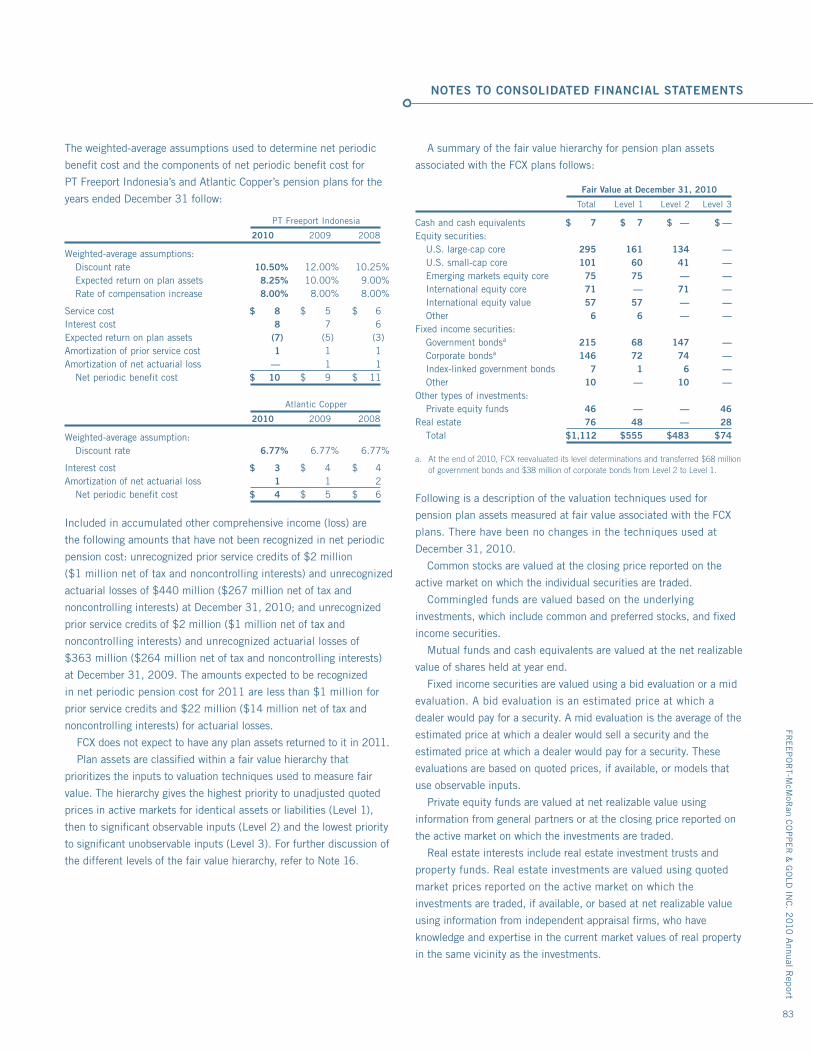
FRE
EP
OR
T-McM
oRan C
OP
PE
R &
GO
LD IN
C. 2
010 A
nnual Rep
ort
83
NOTES TO CONSOLIDATED FINANCIAL STATEMENTS
The weighted-average assumptions used to determine net periodic
benefit cost and the components of net periodic benefit cost for
PT Freeport Indonesia’s and Atlantic Copper’s pension plans for the
years ended December 31 follow:
PT Freeport Indonesia
2010 2009 2008
Weighted-average assumptions: Discount rate 10.50% 12.00% 10.25% Expected return on plan assets 8.25% 10.00% 9.00% Rate of compensation increase 8.00% 8.00% 8.00%
Service cost $ 8 $ 5 $ 6Interest cost 8 7 6Expected return on plan assets (7) (5) (3)Amortization of prior service cost 1 1 1Amortization of net actuarial loss — 1 1 Net periodic benefit cost $ 10 $ 9 $ 11
Atlantic Copper
2010 2009 2008
Weighted-average assumption: Discount rate 6.77% 6.77% 6.77%
Interest cost $ 3 $ 4 $ 4Amortization of net actuarial loss 1 1 2 Net periodic benefit cost $ 4 $ 5 $ 6
Included in accumulated other comprehensive income (loss) are
the following amounts that have not been recognized in net periodic
pension cost: unrecognized prior service credits of $2 million
($1 million net of tax and noncontrolling interests) and unrecognized
actuarial losses of $440 million ($267 million net of tax and
noncontrolling interests) at December 31, 2010; and unrecognized
prior service credits of $2 million ($1 million net of tax and
noncontrolling interests) and unrecognized actuarial losses of
$363 million ($264 million net of tax and noncontrolling interests)
at December 31, 2009. The amounts expected to be recognized
in net periodic pension cost for 2011 are less than $1 million for
prior service credits and $22 million ($14 million net of tax and
noncontrolling interests) for actuarial losses.
FCX does not expect to have any plan assets returned to it in 2011.
Plan assets are classified within a fair value hierarchy that
prioritizes the inputs to valuation techniques used to measure fair
value. The hierarchy gives the highest priority to unadjusted quoted
prices in active markets for identical assets or liabilities (Level 1),
then to significant observable inputs (Level 2) and the lowest priority
to significant unobservable inputs (Level 3). For further discussion of
the different levels of the fair value hierarchy, refer to Note 16.
A summary of the fair value hierarchy for pension plan assets
associated with the FCX plans follows:
Fair Value at December 31, 2010
Total Level 1 Level 2 Level 3
Cash and cash equivalents $ 7 $ 7 $ — $ —Equity securities: U.S. large-cap core 295 161 134 — U.S. small-cap core 101 60 41 — Emerging markets equity core 75 75 — — International equity core 71 — 71 — International equity value 57 57 — — Other 6 6 — —Fixed income securities: Government bondsa 215 68 147 — Corporate bondsa 146 72 74 — Index-linked government bonds 7 1 6 — Other 10 — 10 —Other types of investments: Private equity funds 46 — — 46Real estate 76 48 — 28 Total $ 1,112 $ 555 $ 483 $ 74
a. At the end of 2010, FCX reevaluated its level determinations and transferred $68 million of government bonds and $38 million of corporate bonds from Level 2 to Level 1.
Following is a description of the valuation techniques used for
pension plan assets measured at fair value associated with the FCX
plans. There have been no changes in the techniques used at
December 31, 2010.
Common stocks are valued at the closing price reported on the
active market on which the individual securities are traded.
Commingled funds are valued based on the underlying
investments, which include common and preferred stocks, and fixed
income securities.
Mutual funds and cash equivalents are valued at the net realizable
value of shares held at year end.
Fixed income securities are valued using a bid evaluation or a mid
evaluation. A bid evaluation is an estimated price at which a
dealer would pay for a security. A mid evaluation is the average of the
estimated price at which a dealer would sell a security and the
estimated price at which a dealer would pay for a security. These
evaluations are based on quoted prices, if available, or models that
use observable inputs.
Private equity funds are valued at net realizable value using
information from general partners or at the closing price reported on
the active market on which the investments are traded.
Real estate interests include real estate investment trusts and
property funds. Real estate investments are valued using quoted
market prices reported on the active market on which the
investments are traded, if available, or based at net realizable value
using information from independent appraisal firms, who have
knowledge and expertise in the current market values of real property
in the same vicinity as the investments.
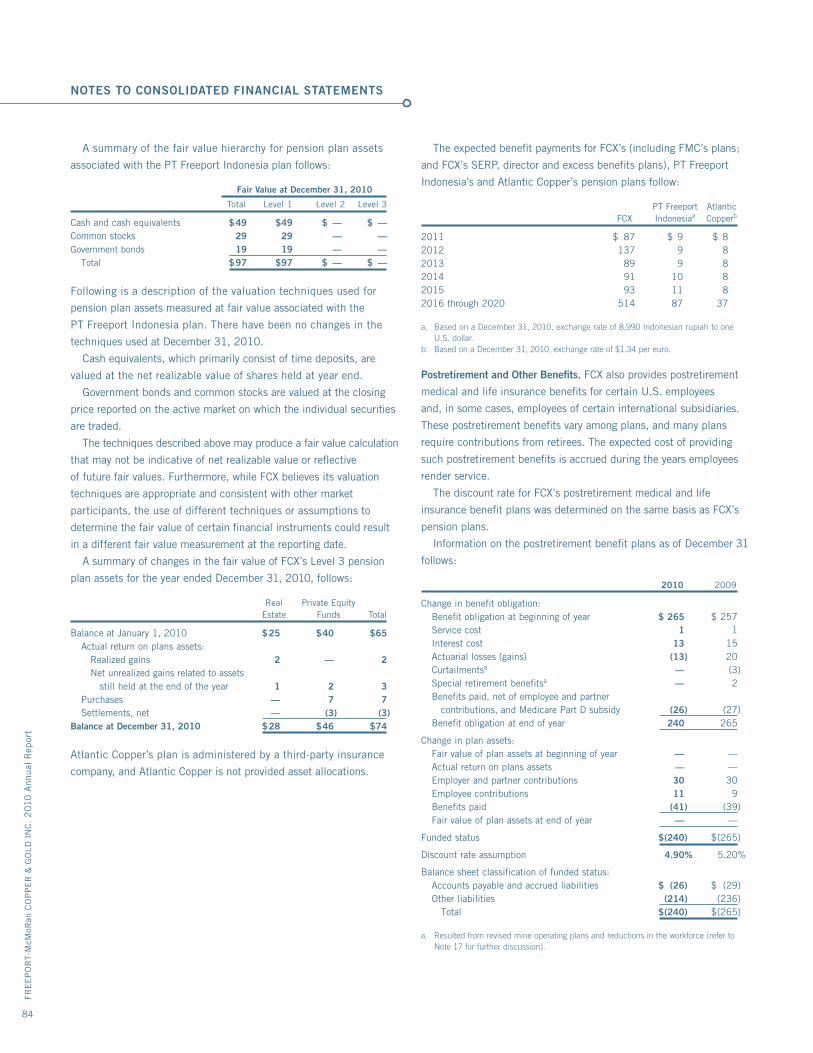
FRE
EP
OR
T-M
cMoR
an C
OP
PE
R &
GO
LD I
NC
. 2
010
Ann
ual
Rep
ort
84
NOTES TO CONSOLIDATED FINANCIAL STATEMENTS
A summary of the fair value hierarchy for pension plan assets
associated with the PT Freeport Indonesia plan follows:
Fair Value at December 31, 2010
Total Level 1 Level 2 Level 3
Cash and cash equivalents $ 49 $ 49 $ — $ —Common stocks 29 29 — —Government bonds 19 19 — — Total $ 97 $ 97 $ — $ —
Following is a description of the valuation techniques used for
pension plan assets measured at fair value associated with the
PT Freeport Indonesia plan. There have been no changes in the
techniques used at December 31, 2010.
Cash equivalents, which primarily consist of time deposits, are
valued at the net realizable value of shares held at year end.
Government bonds and common stocks are valued at the closing
price reported on the active market on which the individual securities
are traded.
The techniques described above may produce a fair value calculation
that may not be indicative of net realizable value or reflective
of future fair values. Furthermore, while FCX believes its valuation
techniques are appropriate and consistent with other market
participants, the use of different techniques or assumptions to
determine the fair value of certain financial instruments could result
in a different fair value measurement at the reporting date.
A summary of changes in the fair value of FCX’s Level 3 pension
plan assets for the year ended December 31, 2010, follows:
Real Private Equity Estate Funds Total
Balance at January 1, 2010 $ 25 $ 40 $ 65 Actual return on plans assets: Realized gains 2 — 2 Net unrealized gains related to assets still held at the end of the year 1 2 3 Purchases — 7 7 Settlements, net — (3) (3)Balance at December 31, 2010 $ 28 $ 46 $ 74 Atlantic Copper’s plan is administered by a third-party insurance
company, and Atlantic Copper is not provided asset allocations.
The expected benefit payments for FCX’s (including FMC’s plans;
and FCX’s SERP, director and excess benefits plans), PT Freeport
Indonesia’s and Atlantic Copper’s pension plans follow:
PT Freeport Atlantic FCX Indonesiaa Copperb
2011 $ 87 $ 9 $ 82012 137 9 82013 89 9 82014 91 10 82015 93 11 82016 through 2020 514 87 37
a. Based on a December 31, 2010, exchange rate of 8,990 Indonesian rupiah to one U.S. dollar.
b. Based on a December 31, 2010, exchange rate of $1.34 per euro.
Postretirement and Other Benefits. FCX also provides postretirement
medical and life insurance benefits for certain U.S. employees
and, in some cases, employees of certain international subsidiaries.
These postretirement benefits vary among plans, and many plans
require contributions from retirees. The expected cost of providing
such postretirement benefits is accrued during the years employees
render service.
The discount rate for FCX’s postretirement medical and life
insurance benefit plans was determined on the same basis as FCX’s
pension plans.
Information on the postretirement benefit plans as of December 31
follows:
2010 2009
Change in benefit obligation: Benefit obligation at beginning of year $ 265 $ 257 Service cost 1 1 Interest cost 13 15 Actuarial losses (gains) (13) 20 Curtailmentsa — (3) Special retirement benefitsa — 2 Benefits paid, net of employee and partner contributions, and Medicare Part D subsidy (26) (27) Benefit obligation at end of year 240 265
Change in plan assets: Fair value of plan assets at beginning of year — — Actual return on plans assets — — Employer and partner contributions 30 30 Employee contributions 11 9 Benefits paid (41) (39) Fair value of plan assets at end of year — —
Funded status $ (240) $ (265)
Discount rate assumption 4.90% 5.20%
Balance sheet classification of funded status: Accounts payable and accrued liabilities $ (26) $ (29) Other liabilities (214) (236) Total $ (240) $ (265)
a. Resulted from revised mine operating plans and reductions in the workforce (refer to Note 17 for further discussion).
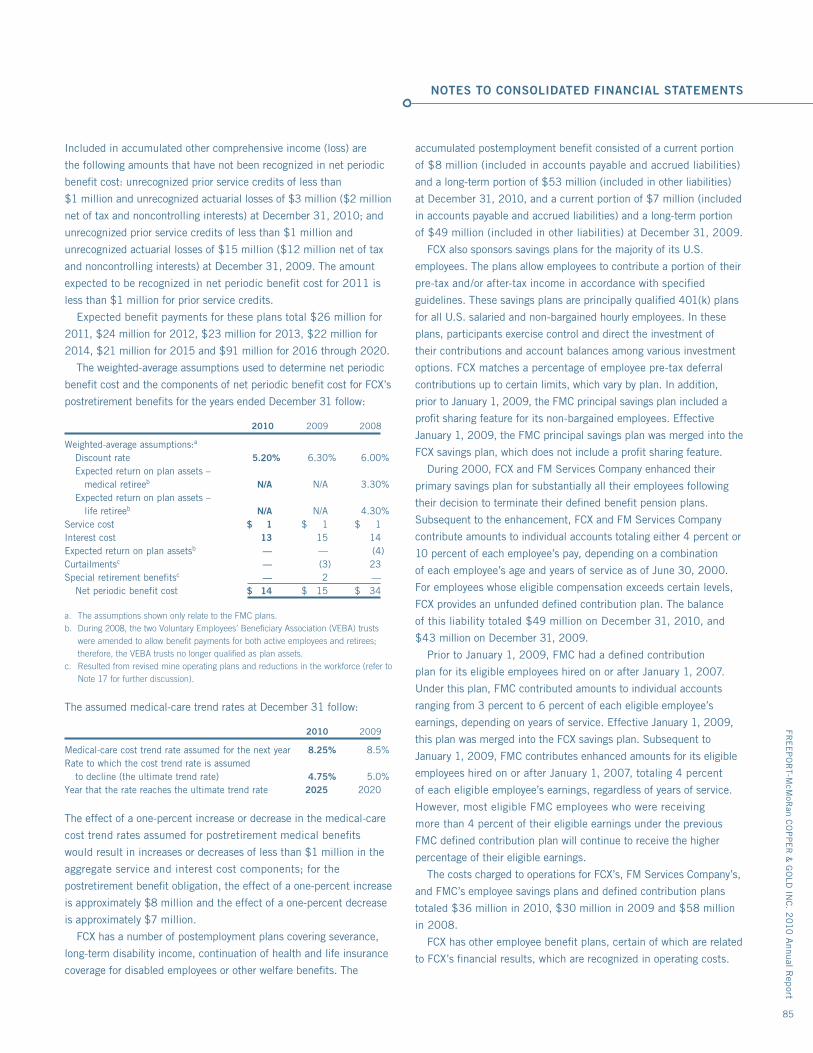
FRE
EP
OR
T-McM
oRan C
OP
PE
R &
GO
LD IN
C. 2
010 A
nnual Rep
ort
85
NOTES TO CONSOLIDATED FINANCIAL STATEMENTS
Included in accumulated other comprehensive income (loss) are
the following amounts that have not been recognized in net periodic
benefit cost: unrecognized prior service credits of less than
$1 million and unrecognized actuarial losses of $3 million ($2 million
net of tax and noncontrolling interests) at December 31, 2010; and
unrecognized prior service credits of less than $1 million and
unrecognized actuarial losses of $15 million ($12 million net of tax
and noncontrolling interests) at December 31, 2009. The amount
expected to be recognized in net periodic benefit cost for 2011 is
less than $1 million for prior service credits.
Expected benefit payments for these plans total $26 million for
2011, $24 million for 2012, $23 million for 2013, $22 million for
2014, $21 million for 2015 and $91 million for 2016 through 2020.
The weighted-average assumptions used to determine net periodic
benefit cost and the components of net periodic benefit cost for FCX’s
postretirement benefits for the years ended December 31 follow:
2010 2009 2008
Weighted-average assumptions:a
Discount rate 5.20% 6.30% 6.00% Expected return on plan assets – medical retireeb N/A N/A 3.30% Expected return on plan assets – life retireeb N/A N/A 4.30%Service cost $ 1 $ 1 $ 1Interest cost 13 15 14Expected return on plan assetsb — — (4)Curtailmentsc — (3) 23Special retirement benefitsc — 2 — Net periodic benefit cost $ 14 $ 15 $ 34
a. The assumptions shown only relate to the FMC plans.b. During 2008, the two Voluntary Employees’ Beneficiary Association (VEBA) trusts
were amended to allow benefit payments for both active employees and retirees; therefore, the VEBA trusts no longer qualified as plan assets.
c. Resulted from revised mine operating plans and reductions in the workforce (refer to Note 17 for further discussion).
The assumed medical-care trend rates at December 31 follow:
2010 2009
Medical-care cost trend rate assumed for the next year 8.25% 8.5%Rate to which the cost trend rate is assumed to decline (the ultimate trend rate) 4.75% 5.0%Year that the rate reaches the ultimate trend rate 2025 2020
The effect of a one-percent increase or decrease in the medical-care
cost trend rates assumed for postretirement medical benefits
would result in increases or decreases of less than $1 million in the
aggregate service and interest cost components; for the
postretirement benefit obligation, the effect of a one-percent increase
is approximately $8 million and the effect of a one-percent decrease
is approximately $7 million.
FCX has a number of postemployment plans covering severance,
long-term disability income, continuation of health and life insurance
coverage for disabled employees or other welfare benefits. The
accumulated postemployment benefit consisted of a current portion
of $8 million (included in accounts payable and accrued liabilities)
and a long-term portion of $53 million (included in other liabilities)
at December 31, 2010, and a current portion of $7 million (included
in accounts payable and accrued liabilities) and a long-term portion
of $49 million (included in other liabilities) at December 31, 2009.
FCX also sponsors savings plans for the majority of its U.S.
employees. The plans allow employees to contribute a portion of their
pre-tax and/or after-tax income in accordance with specified
guidelines. These savings plans are principally qualified 401(k) plans
for all U.S. salaried and non-bargained hourly employees. In these
plans, participants exercise control and direct the investment of
their contributions and account balances among various investment
options. FCX matches a percentage of employee pre-tax deferral
contributions up to certain limits, which vary by plan. In addition,
prior to January 1, 2009, the FMC principal savings plan included a
profit sharing feature for its non-bargained employees. Effective
January 1, 2009, the FMC principal savings plan was merged into the
FCX savings plan, which does not include a profit sharing feature.
During 2000, FCX and FM Services Company enhanced their
primary savings plan for substantially all their employees following
their decision to terminate their defined benefit pension plans.
Subsequent to the enhancement, FCX and FM Services Company
contribute amounts to individual accounts totaling either 4 percent or
10 percent of each employee’s pay, depending on a combination
of each employee’s age and years of service as of June 30, 2000.
For employees whose eligible compensation exceeds certain levels,
FCX provides an unfunded defined contribution plan. The balance
of this liability totaled $49 million on December 31, 2010, and
$43 million on December 31, 2009.
Prior to January 1, 2009, FMC had a defined contribution
plan for its eligible employees hired on or after January 1, 2007.
Under this plan, FMC contributed amounts to individual accounts
ranging from 3 percent to 6 percent of each eligible employee’s
earnings, depending on years of service. Effective January 1, 2009,
this plan was merged into the FCX savings plan. Subsequent to
January 1, 2009, FMC contributes enhanced amounts for its eligible
employees hired on or after January 1, 2007, totaling 4 percent
of each eligible employee’s earnings, regardless of years of service.
However, most eligible FMC employees who were receiving
more than 4 percent of their eligible earnings under the previous
FMC defined contribution plan will continue to receive the higher
percentage of their eligible earnings.
The costs charged to operations for FCX’s, FM Services Company’s,
and FMC’s employee savings plans and defined contribution plans
totaled $36 million in 2010, $30 million in 2009 and $58 million
in 2008.
FCX has other employee benefit plans, certain of which are related
to FCX’s financial results, which are recognized in operating costs.
FRE
EP
OR
T-M
cMoR
an C
OP
PE
R &
GO
LD I
NC
. 2
010
Ann
ual
Rep
ort
86
NOTES TO CONSOLIDATED FINANCIAL STATEMENTS
NOTE 11. Stockholders’ Equity and Stock-Based Compensation
Common Stock. At the 2008 annual stockholder meeting, FCX’s
stockholders approved an increase in FCX’s authorized shares of
capital stock to 1.85 billion shares, consisting of 1.8 billion shares of
common stock and 50 million shares of preferred stock. Authorized
shares were not affected by the two-for-one stock split.
In December 2010, FCX’s Board of Directors declared a
two-for-one split of its common stock in the form of a stock dividend
on issued and outstanding shares. Common shareholders of record
at the close of business on January 15, 2011, received one additional
share of common stock for every share they owned as of that date.
The additional shares were issued on February 1, 2011, and
increased the number of shares outstanding to approximately
945 million from approximately 472 million. The par value of FCX’s
common stock remains at $0.10 per share. All references to shares
of common stock and per common share amounts have been
retroactively adjusted to reflect the two-for-one stock split, unless
otherwise noted. FCX’s common stock began trading on a post-split
basis on February 2, 2011.
In July 2008, FCX’s Board of Directors approved an increase in
the open-market share purchase program for up to 30 million shares.
During 2008, on a pre-split basis, FCX acquired 6.3 million shares
for $500 million ($79.15 per share average) and 23.7 million shares
remain available under this program. During September 2008,
because of the financial turmoil and the decline in copper and
molybdenum prices, FCX suspended its purchases of shares under
its open-market share purchase program. The timing of future
purchases of FCX’s common stock is dependent on many factors,
including FCX’s operating results, cash flows and financial position;
copper, molybdenum and gold prices; the price of FCX’s common
stock; and general economic and market conditions.
In February 2009, FCX completed a public offering of 53.6 million
shares of FCX common stock at an average price of $14.00 per
share, which generated gross proceeds of $750 million (net proceeds
of approximately $740 million).
In December 2008, FCX’s Board of Directors suspended the cash
dividend on FCX’s common stock; accordingly, there were no
common stock dividends paid in 2009. In October 2009, FCX’s
Board of Directors reinstated a cash dividend on FCX’s common stock
at an annual rate of $0.30 per share. FCX’s Board of Directors
authorized an increase in the cash dividend on FCX’s common stock
to an annual rate of $0.60 per share in April 2010 and then to an
annual rate of $1.00 per share in October 2010. In December 2010,
FCX declared a supplemental common stock dividend of $0.50 per
share, which was paid on December 30, 2010, to common
shareholders of record at the close of business on December 20, 2010.
On December 29, 2010, FCX declared a regular quarterly dividend of
$0.25 per share, which was paid on February 1, 2011, to common
shareholders of record at the close of business on January 15, 2011.
The Board of Directors will continue to review FCX’s financial policy
on an ongoing basis.
Preferred Stock. On March 28, 2007, FCX sold 28.75 million
shares of 6¾% Mandatory Convertible Preferred Stock, with
a liquidation preference of $100 per share, for net proceeds of
$2.8 billion. The 6¾% Mandatory Convertible Preferred Stock
were automatically converted on May 1, 2010, into shares of
FCX common stock. The conversion rate was adjustable upon the
occurrence of certain events, including the payment in any
quarter of common stock dividends exceeding $0.15625 per
share, and, for shares converted on May 1, 2010, depended on
the applicable average market price of FCX’s common stock
over the 20-trading-day period ending on the third trading day
prior to May 1, 2010. Holders could elect to convert at any time
prior to May 1, 2010, at a conversion rate equal to 2.7432 shares
of FCX common stock. During 2010, a total of 28,749,560
outstanding shares of FCX’s 6¾% Mandatory Convertible Preferred
Stock were converted into 78.9 million shares of FCX common stock
(conversion rate equal to 2.7432 shares of FCX common stock).
In March 2004, FCX sold 1.1 million shares of 5½% Convertible
Perpetual Preferred Stock for net proceeds of $1.1 billion. The
conversion rate was adjustable upon the occurrence of certain events,
including the payment in any quarter of common stock dividends
exceeding $0.10 per share. As a result of the quarterly and
supplemental common stock dividends paid through August 31, 2009,
each share of preferred stock was convertible into 43.061 shares
of FCX common stock, equivalent to a conversion price of
approximately $23.22 per common share. In December 2008,
through privately negotiated transactions, FCX induced conversion
of 268,331 shares of its 5½% Convertible Perpetual Preferred Stock
with a liquidation preference of $268 million into 11.5 million
shares of FCX common stock. To induce conversion of these shares,
FCX issued to the holders an additional 2.0 million shares of FCX
common stock valued at $22 million, which was recorded as losses
on induced conversions in the consolidated statements of
operations. In September 2009, FCX called for redemption the
remaining outstanding shares of its 5½% Convertible Perpetual
Preferred Stock. Of the 831,554 shares outstanding at the time of
the call, 830,529 shares were converted into 35.8 million shares
of FCX common stock, and the remaining 1,025 shares were redeemed
for approximately $1 million in cash.
Stock Award Plans. FCX currently has awards outstanding under its
stock-based compensation plans, including two Phelps Dodge plans
resulting from the acquisition. As of December 31, 2010, only two of
the plans, both of which are stockholder approved (which are
discussed below), have awards available for grant.
The 2003 Stock Incentive Plan (the 2003 Plan) provides for the
issuance of stock options, SARs, restricted stock, restricted stock
FRE
EP
OR
T-McM
oRan C
OP
PE
R &
GO
LD IN
C. 2
010 A
nnual Rep
ort
87
NOTES TO CONSOLIDATED FINANCIAL STATEMENTS
units and other stock-based awards. The 2003 Plan allows FCX to
grant awards for up to 16 million common shares to eligible
participants. In 2006, FCX’s stockholders approved the 2006 Stock
Incentive Plan (the 2006 Plan), and FCX’s stockholders approved
amendments to the plan in 2007 primarily to increase the number of
shares available for grants and in 2010 to permit grants to outside
directors. The 2006 Plan provides for the issuance of stock options,
SARs, restricted stock, restricted stock units and other stock-based
awards for up to 74 million common shares. As of December 31,
2010, shares available for grant totaled 41.7 million shares under the
2006 Plan and less than 30,000 shares under the 2003 Plan.
In connection with the Phelps Dodge acquisition, former Phelps
Dodge stock options and restricted stock awards were converted into
1,613,190 FCX stock options and 174,782 FCX restricted stock
awards, which retain the terms by which they were originally granted
under Phelps Dodge’s plans. The stock options carry a maximum
term of 10 years with 1,344,268 stock options vested upon the
acquisition of Phelps Dodge and 268,922 stock options that vested
ratably over a three-year period or the period until the participant
became retirement-eligible, whichever was shorter. Restricted stock
awards generally became fully vested in five years, with a majority
of these shares having graded-vesting features in which 25 percent of
the shares would vest on the third and fourth anniversaries of the
award and the remaining 50 percent in the fifth year. In February 2010,
the former Phelps Dodge restricted stock agreements were amended
to accelerate the vesting period of the restricted stock awards
that were converted upon the acquisition of Phelps Dodge; therefore,
these restricted stock awards (excluding the cash portion that
resulted from the conversion of these restricted stock awards
at the time of the acquisition) became fully vested. The fair value of
the restricted stock awards was determined based on the quoted
market price at the time of the acquisition.
Stock-Based Compensation Cost. Compensation cost charged
against earnings for stock-based awards for the years ended
December 31 follows:
2010 2009 2008
Stock options awarded to employees (including directors) $ 84 $ 67 $ 66Stock options awarded to nonemployees 5 5 5Restricted stock units awarded to employees (including directors) 30 29 56Restricted stock units in lieu of cash awards — — (29)a
Restricted stock awards to employees 1 2 3Stock appreciation rights (SARs) 2 4 (6) Total stock-based compensation costb 122 107 95Tax benefit (45) (41) (36)Noncontrolling interests’ share (3) (3) (2) Impact on net income (loss) $ 74 $ 63 $ 57
a. Reflects an adjustment related to 2007 awards.b. Amounts are before Rio Tinto’s share of the cost of employee exercises of in-the-money
stock options, which decreased consolidated selling, general and administrative expenses by $4 million in 2010, $2 million in 2009 and $1 million in 2008.
FCX did not capitalize any stock-based compensation costs to
property, plant, equipment and development costs during the years
ended December 31, 2010, 2009 and 2008.
Options and SARs. Stock options and SARs granted under the
plans generally expire 10 years after the date of grant and vest
in 25 percent annual increments beginning one year from the date of
grant. The plans and award agreements provide that participants
will receive the following year’s vesting after retirement and provide
for accelerated vesting if there is a change in control (as defined
in the plans). FCX has elected to recognize compensation costs for
stock option awards that vest over several years on a straight-line
basis over the vesting period. FCX accelerates one year of
amortization for retirement-eligible employees.
A summary of options outstanding as of December 31, 2010,
including 95,896 SARs, and changes during the year ended
December 31, 2010, follows: Weighted- Average Weighted- Remaining Aggregate Number of Average Contractual Intrinsic Options Option Price Term (years) Value
Balance at January 1 24,921,594 $ 27.59 Granted 8,303,000 36.15 Exercised (6,081,650) 27.54 Expired/Forfeited (212,500) 30.29Balance at December 31 26,930,444 30.22 7.4 $ 803
Vested and exercisable at December 31 9,079,694 31.00 5.9 $ 264
Summaries of options outstanding, including SARs, and changes
during the years ended December 31 follow:
2009 2008
Weighted- Weighted- Number of Average Number of Average Options Option Price Options Option Price
Balance at January 1 19,705,894 $ 32.49 21,519,596 $ 29.09 Granted 7,302,000 12.94 2,899,000 45.55 Exercised (1,571,874) 20.15 (4,397,202) 24.25 Expired/Forfeited (514,426) 30.29 (315,500) 35.21Balance at December 31 24,921,594 27.59 19,705,894 32.49
The fair value of each option award is estimated on the date of grant
using the Black-Scholes-Merton option valuation model. Expected
volatility is based on implied volatilities from traded options on
FCX’s stock and historical volatility of FCX’s stock. FCX uses historical
data to estimate future option exercises, forfeitures and expected
life of the options. When appropriate, separate groups of employees
that have similar historical exercise behavior are considered
separately for valuation purposes. The expected dividend rate is
calculated using the annual dividend (excludes supplemental
dividends) at the date of grant. The risk-free interest rate is based
on Federal Reserve rates in effect for bonds with maturity dates equal
FRE
EP
OR
T-M
cMoR
an C
OP
PE
R &
GO
LD I
NC
. 2
010
Ann
ual
Rep
ort
88
NOTES TO CONSOLIDATED FINANCIAL STATEMENTS
to the expected term of the option at the grant date. The weighted-
average assumptions used to value stock option awards during the
years ended December 31 follow:
2010 2009 2008
Expected volatility 51.9% 70.6% 49.3%Expected life of options (in years) 4.61 4.37 4.60Expected dividend rate 0.8% —% 2.0%Risk-free interest rate 2.2% 1.5% 3.3% The weighted-average grant-date fair value of options granted was
$15.33 per option during 2010, $7.14 per option during 2009 and
$17.45 per option during 2008. The total intrinsic value of options
exercised was $129 million during 2010, $24 million during 2009
and $128 million during 2008. The total fair value of options
vested was $61 million during 2010, $70 million during 2009 and
$61 million during 2008. As of December 31, 2010, FCX had
$107 million of total unrecognized compensation cost related to
unvested stock options expected to be recognized over a weighted-
average period of 1.6 years.
The following table includes amounts related to exercises of stock
options and SARs and vesting of restricted stock units and restricted
stock awards during the years ended December 31:
2010 2009 2008
FCX shares tendered to pay the exercise price and/or the minimum required taxesa 934,099 542,786 823,915Cash received from stock option exercises $ 109 $ 18 $ 56Actual tax benefit realized for tax deductions 50 21 78Amounts FCX paid for employee taxes 28 12 34Amounts FCX paid for exercised SARs 1 1 1
a. Under terms of the related plans, upon exercise of stock options and vesting of restricted stock units and restricted stock awards, employees may tender FCX shares to FCX to pay the exercise price and/or the minimum required taxes. These treasury shares were not affected by the two-for-one stock split.
Restricted Stock Units. Prior to December 2008, FCX had a
restricted stock program that allowed FCX senior executives to elect
to receive restricted stock units in lieu of all or part of their annual
cash incentive compensation. Effective December 2, 2008, the
Board of Directors discontinued this program and, thereafter,
initiated a new annual incentive plan for the FCX executive officers.
The annual incentive plan requires that a portion of each executive’s
annual bonus be paid in restricted stock units that will continue
to be subject to a performance condition for three years. The annual
incentive award is a function of FCX’s consolidated operating cash
flows for the preceding year and, therefore, considered a
performance-based award. The restricted stock units vest ratably over
three years, and this plan provides that the FCX executive officers
will receive the following year’s vesting upon retirement provided the
performance condition is met. The fair value of the restricted stock
units are estimated based on projected operating cash flows for the
year and are charged to expense ratably over three years, beginning
with the year during which the cash flows were generated as
performance of services commenced in the calendar year preceding
the date of grant.
FCX also granted other restricted stock units that vest over a period
of up to five years. The plans and award agreements provide for
accelerated vesting of all restricted stock units if there is a change of
control (as defined in the plans) and provide that participants will
receive the following year’s vesting after retirement (except for the
restricted stock units with five year vesting that do not allow
acceleration because of retirement). Dividends and interest on
restricted stock units accrue and are paid upon the award’s vesting.
FCX grants restricted stock units to its directors. The restricted
stock units vest over four years. The fair value of the restricted stock
units is amortized over the four-year vesting period or the period
until the director becomes retirement-eligible, whichever is shorter.
Upon a director’s retirement, all of their unvested restricted
stock units immediately vest. For retirement-eligible directors, the
fair value of restricted stock units is recognized in earnings on the
date of grant.
A summary of outstanding restricted stock units as of December 31,
2010, and activity during the year ended December 31, 2010,
follows: Weighted- Average Number of Remaining Aggregate Restricted Contractual Intrinsic Stock Units Term (years) Value
Balance at January 1 2,873,998 Granted 671,734 Vested (1,401,486) Forfeited (3,332)Balance at December 31 2,140,914 1.1 $ 129 The total grant-date fair value of restricted stock units granted during
the year ended December 31, 2010, was $23 million. The total
intrinsic value of restricted stock units vested was $50 million during
2010, $22 million during 2009 and $33 million during 2008.
As of December 31, 2010, FCX had $9 million of total unrecognized
compensation cost related to unvested restricted stock units
expected to be recognized over a weighted-average period of less than
one year.
Restricted Stock Awards. As discussed above, FCX had
restricted stock awards that were issued in connection with the
Phelps Dodge acquisition. A summary of outstanding restricted stock
awards as of December 31, 2010, and activity during the year
ended December 31, 2010, follows:
Balance at January 1 74,228 Vested (74,228)Balance at December 31 —
FRE
EP
OR
T-McM
oRan C
OP
PE
R &
GO
LD IN
C. 2
010 A
nnual Rep
ort
89
NOTES TO CONSOLIDATED FINANCIAL STATEMENTS
The total grant-date fair value of restricted stock awards was
$5 million at the acquisition date. The total fair value of shares
released or vested was $3 million during 2010 and less than
$1 million during 2009 and 2008. As of December 31, 2010, FCX
had less than $1 million of total unrecognized compensation cost
related to the unvested cash portion, which resulted from the
conversion of restricted stock awards at the acquisition date, expected
to be recognized over a weighted-average period of less than one year.
NOTE 12. Income Taxes
Geographic sources of income (loss) before income taxes and
equity in affiliated companies’ net earnings for the years ended
December 31 consist of the following:
2010 2009 2008
United States $ 1,307 $ 98 $ (13,850)Foreign 7,205 5,718 541 Total $ 8,512 $ 5,816 $ (13,309)
2010 2009 2008
Amount Percent Amount Percent Amount Percent
U.S. federal statutory tax rate $ 2,979 35% $ 2,036 35% $ (4,658) 35%Foreign tax credit limitation 93 1 112 2 95 (1)Percentage depletion (263) (3) (168) (3) (336) 3Withholding taxes 174 2 228 4 4 —Valuation allowance on minimum tax credits 18 — 104 2 359 (3)Goodwill impairment — — — — 2,095 (16)State income taxes 17 — (2) — (437) 3Other items, net (35) — (3) — 34 —Provision for (benefit from) income taxes $ 2,983 35% $ 2,307 40% $ (2,844) 21%
FCX’s provision for (benefit from) income taxes for the years ended
December 31 consists of the following:
2010 2009 2008
Current income taxes: Federal $ 207 $ 19 $ 536 State 27 7 14 Foreign 2,500 2,172 1,261 Total current 2,734 2,198 1,811
Deferred income taxes (benefits): Federal 20 (70) (3,635) State (10) 79 (686) Foreign 239 100 (657) Total deferred 249 109 (4,978)
Valuation allowance on prior year deferred tax asset — — 323
Provision for (benefit from) income taxes $ 2,983 $ 2,307 $ (2,844)
A reconciliation of the U.S. federal statutory tax rate to FCX’s
effective income tax rate for the years ended December 31 follows:
At December 31, 2010, FCX had U.S. foreign tax credit carryforwards
of $1.8 billion that will expire between 2011 and 2020, and U.S.
minimum tax credits carryforwards of $413 million that can be
carried forward indefinitely, but may be used only to the extent that
regular tax exceeds the alternative minimum tax in any given year.
At December 31, 2010, FCX had (i) Congolese net operating loss
carryforwards of $898 million that can be carried forward indefinitely,
(ii) U.S. net state operating loss carryforwards of $669 million
that expire between 2011 and 2030, and (iii) Spanish net operating
loss carryforwards of $455 million that expire between 2011
and 2025.
On the basis of available information at December 31, 2010, FCX
has provided valuation allowances for certain of its deferred tax
assets where FCX believes it is more likely than not that some portion
or all of such assets will not be realized. At December 31, 2010,
valuation allowances totaled $2.2 billion and covered all of FCX’s
U.S. foreign tax credit carryforwards, and a portion of its
foreign net operating loss carryforwards, U.S. state net operating
loss carryforwards and U.S. minimum tax credit carryforwards.
This valuation allowance includes $59 million relating to
tax benefits that, if recognized, would be credited directly to other
comprehensive income.
FCX paid federal, state, local and foreign income taxes totaling
$2.6 billion in 2010, $1.6 billion in 2009 and $2.7 billion in 2008.
FCX received refunds of federal, state, local and foreign income taxes
of $26 million in 2010, $193 million in 2009 and $123 million
in 2008.
The components of deferred taxes follow:
December 31, 2010 2009
Deferred tax assets: Foreign tax credits $ 1,837 $ 1,664 Net operating loss carryforwards 442 521 Minimum tax credits 413 509 Accrued expenses 931 882 Employee benefit plans 215 234 Inventory 164 74 Other 224 136 Deferred tax assets 4,226 4,020 Valuation allowances (2,226) (2,157) Net deferred tax assets 2,000 1,863
Deferred tax liabilities: Property, plant, equipment and development costs (3,874) (3,609) Undistributed earnings (917) (766) Other (28) (66) Total deferred tax liabilities (4,819) (4,441)Net deferred tax liabilities $ (2,819) $ (2,578)
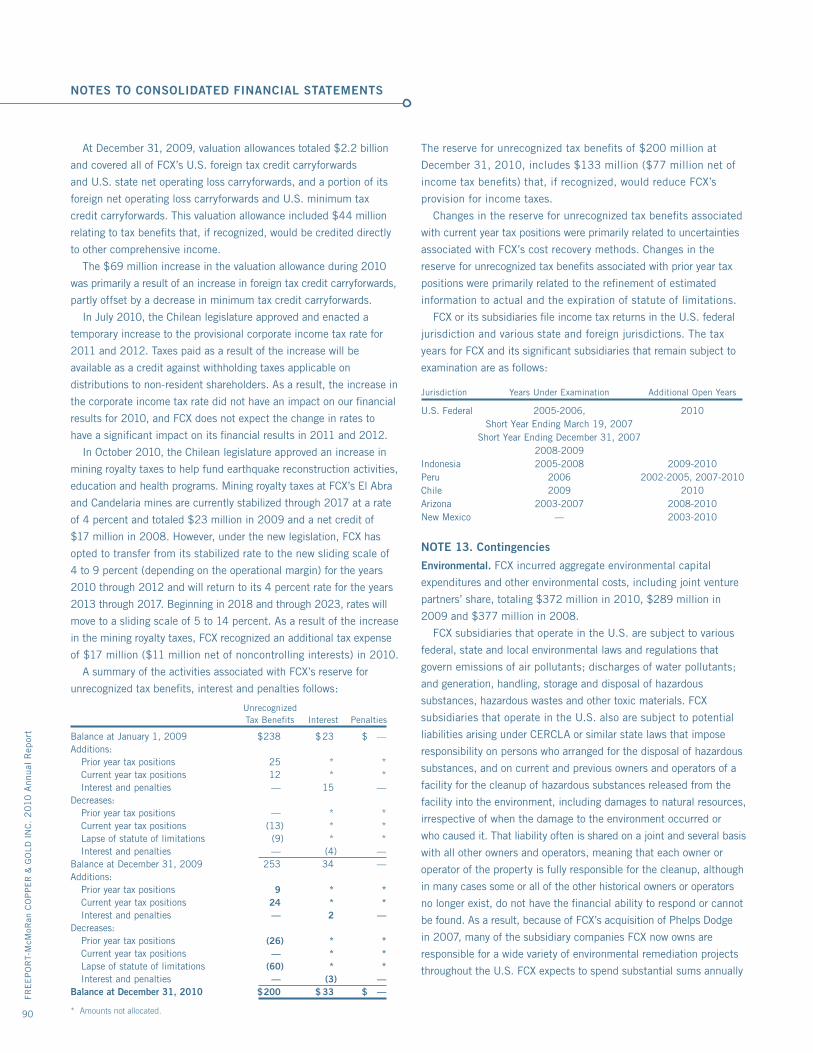
FRE
EP
OR
T-M
cMoR
an C
OP
PE
R &
GO
LD I
NC
. 2
010
Ann
ual
Rep
ort
90
NOTES TO CONSOLIDATED FINANCIAL STATEMENTS
At December 31, 2009, valuation allowances totaled $2.2 billion
and covered all of FCX’s U.S. foreign tax credit carryforwards
and U.S. state net operating loss carryforwards, and a portion of its
foreign net operating loss carryforwards and U.S. minimum tax
credit carryforwards. This valuation allowance included $44 million
relating to tax benefits that, if recognized, would be credited directly
to other comprehensive income.
The $69 million increase in the valuation allowance during 2010
was primarily a result of an increase in foreign tax credit carryforwards,
partly offset by a decrease in minimum tax credit carryforwards.
In July 2010, the Chilean legislature approved and enacted a
temporary increase to the provisional corporate income tax rate for
2011 and 2012. Taxes paid as a result of the increase will be
available as a credit against withholding taxes applicable on
distributions to non-resident shareholders. As a result, the increase in
the corporate income tax rate did not have an impact on our financial
results for 2010, and FCX does not expect the change in rates to
have a significant impact on its financial results in 2011 and 2012.
In October 2010, the Chilean legislature approved an increase in
mining royalty taxes to help fund earthquake reconstruction activities,
education and health programs. Mining royalty taxes at FCX’s El Abra
and Candelaria mines are currently stabilized through 2017 at a rate
of 4 percent and totaled $23 million in 2009 and a net credit of
$17 million in 2008. However, under the new legislation, FCX has
opted to transfer from its stabilized rate to the new sliding scale of
4 to 9 percent (depending on the operational margin) for the years
2010 through 2012 and will return to its 4 percent rate for the years
2013 through 2017. Beginning in 2018 and through 2023, rates will
move to a sliding scale of 5 to 14 percent. As a result of the increase
in the mining royalty taxes, FCX recognized an additional tax expense
of $17 million ($11 million net of noncontrolling interests) in 2010.
A summary of the activities associated with FCX’s reserve for
unrecognized tax benefits, interest and penalties follows:
Unrecognized Tax Benefits Interest Penalties
Balance at January 1, 2009 $ 238 $ 23 $ —Additions: Prior year tax positions 25 * * Current year tax positions 12 * * Interest and penalties — 15 —Decreases: Prior year tax positions — * * Current year tax positions (13) * * Lapse of statute of limitations (9) * * Interest and penalties — (4) —Balance at December 31, 2009 253 34 —Additions: Prior year tax positions 9 * * Current year tax positions 24 * * Interest and penalties — 2 —Decreases: Prior year tax positions (26) * * Current year tax positions — * * Lapse of statute of limitations (60) * * Interest and penalties — (3) —Balance at December 31, 2010 $ 200 $ 33 $ —
* Amounts not allocated.
The reserve for unrecognized tax benefits of $200 million at
December 31, 2010, includes $133 million ($77 million net of
income tax benefits) that, if recognized, would reduce FCX’s
provision for income taxes.
Changes in the reserve for unrecognized tax benefits associated
with current year tax positions were primarily related to uncertainties
associated with FCX’s cost recovery methods. Changes in the
reserve for unrecognized tax benefits associated with prior year tax
positions were primarily related to the refinement of estimated
information to actual and the expiration of statute of limitations.
FCX or its subsidiaries file income tax returns in the U.S. federal
jurisdiction and various state and foreign jurisdictions. The tax
years for FCX and its significant subsidiaries that remain subject to
examination are as follows:
Jurisdiction Years Under Examination Additional Open Years
U.S. Federal 2005-2006, 2010 Short Year Ending March 19, 2007 Short Year Ending December 31, 2007 2008-2009Indonesia 2005-2008 2009-2010Peru 2006 2002-2005, 2007-2010Chile 2009 2010Arizona 2003-2007 2008-2010New Mexico — 2003-2010
NOTE 13. Contingencies
Environmental. FCX incurred aggregate environmental capital
expenditures and other environmental costs, including joint venture
partners’ share, totaling $372 million in 2010, $289 million in
2009 and $377 million in 2008.
FCX subsidiaries that operate in the U.S. are subject to various
federal, state and local environmental laws and regulations that
govern emissions of air pollutants; discharges of water pollutants;
and generation, handling, storage and disposal of hazardous
substances, hazardous wastes and other toxic materials. FCX
subsidiaries that operate in the U.S. also are subject to potential
liabilities arising under CERCLA or similar state laws that impose
responsibility on persons who arranged for the disposal of hazardous
substances, and on current and previous owners and operators of a
facility for the cleanup of hazardous substances released from the
facility into the environment, including damages to natural resources,
irrespective of when the damage to the environment occurred or
who caused it. That liability often is shared on a joint and several basis
with all other owners and operators, meaning that each owner or
operator of the property is fully responsible for the cleanup, although
in many cases some or all of the other historical owners or operators
no longer exist, do not have the financial ability to respond or cannot
be found. As a result, because of FCX’s acquisition of Phelps Dodge
in 2007, many of the subsidiary companies FCX now owns are
responsible for a wide variety of environmental remediation projects
throughout the U.S. FCX expects to spend substantial sums annually
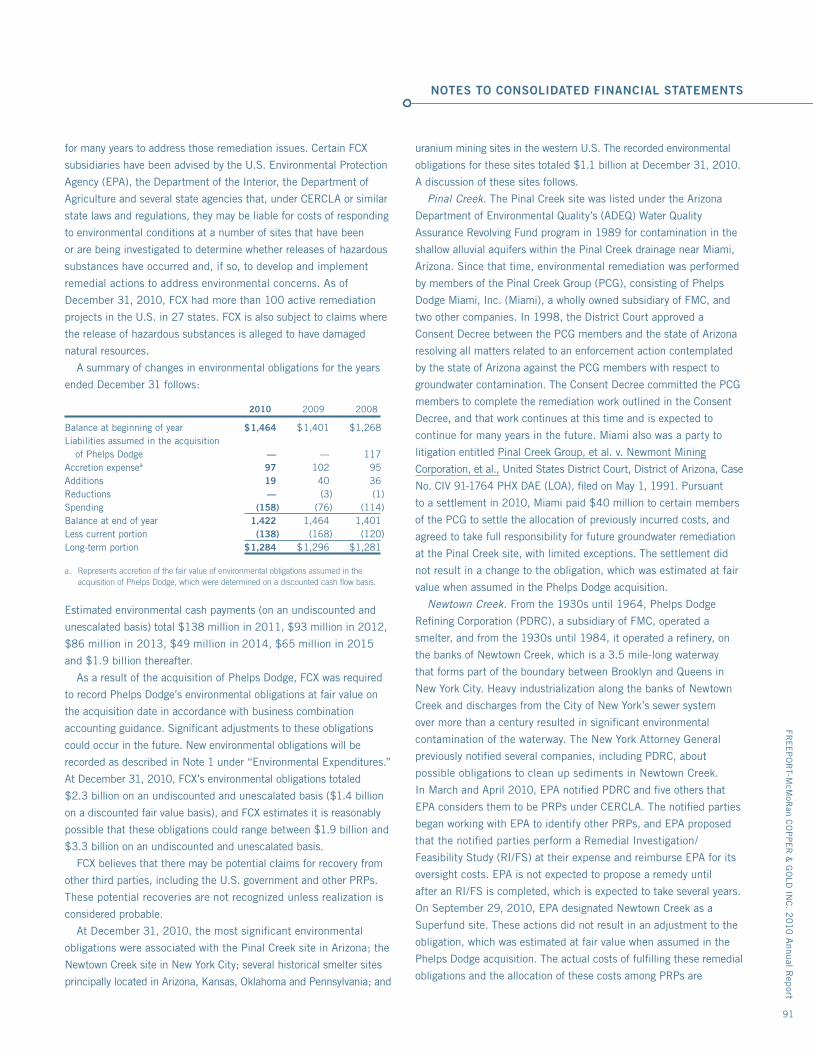
FRE
EP
OR
T-McM
oRan C
OP
PE
R &
GO
LD IN
C. 2
010 A
nnual Rep
ort
91
NOTES TO CONSOLIDATED FINANCIAL STATEMENTS
for many years to address those remediation issues. Certain FCX
subsidiaries have been advised by the U.S. Environmental Protection
Agency (EPA), the Department of the Interior, the Department of
Agriculture and several state agencies that, under CERCLA or similar
state laws and regulations, they may be liable for costs of responding
to environmental conditions at a number of sites that have been
or are being investigated to determine whether releases of hazardous
substances have occurred and, if so, to develop and implement
remedial actions to address environmental concerns. As of
December 31, 2010, FCX had more than 100 active remediation
projects in the U.S. in 27 states. FCX is also subject to claims where
the release of hazardous substances is alleged to have damaged
natural resources.
A summary of changes in environmental obligations for the years
ended December 31 follows:
2010 2009 2008
Balance at beginning of year $ 1,464 $ 1,401 $ 1,268Liabilities assumed in the acquisition of Phelps Dodge — — 117Accretion expensea 97 102 95Additions 19 40 36Reductions — (3) (1)Spending (158) (76) (114)Balance at end of year 1,422 1,464 1,401Less current portion (138) (168) (120)Long-term portion $ 1,284 $ 1,296 $ 1,281
a. Represents accretion of the fair value of environmental obligations assumed in the acquisition of Phelps Dodge, which were determined on a discounted cash flow basis.
Estimated environmental cash payments (on an undiscounted and
unescalated basis) total $138 million in 2011, $93 million in 2012,
$86 million in 2013, $49 million in 2014, $65 million in 2015
and $1.9 billion thereafter.
As a result of the acquisition of Phelps Dodge, FCX was required
to record Phelps Dodge’s environmental obligations at fair value on
the acquisition date in accordance with business combination
accounting guidance. Significant adjustments to these obligations
could occur in the future. New environmental obligations will be
recorded as described in Note 1 under “Environmental Expenditures.”
At December 31, 2010, FCX’s environmental obligations totaled
$2.3 billion on an undiscounted and unescalated basis ($1.4 billion
on a discounted fair value basis), and FCX estimates it is reasonably
possible that these obligations could range between $1.9 billion and
$3.3 billion on an undiscounted and unescalated basis.
FCX believes that there may be potential claims for recovery from
other third parties, including the U.S. government and other PRPs.
These potential recoveries are not recognized unless realization is
considered probable.
At December 31, 2010, the most significant environmental
obligations were associated with the Pinal Creek site in Arizona; the
Newtown Creek site in New York City; several historical smelter sites
principally located in Arizona, Kansas, Oklahoma and Pennsylvania; and
uranium mining sites in the western U.S. The recorded environmental
obligations for these sites totaled $1.1 billion at December 31, 2010.
A discussion of these sites follows.
Pinal Creek. The Pinal Creek site was listed under the Arizona
Department of Environmental Quality’s (ADEQ) Water Quality
Assurance Revolving Fund program in 1989 for contamination in the
shallow alluvial aquifers within the Pinal Creek drainage near Miami,
Arizona. Since that time, environmental remediation was performed
by members of the Pinal Creek Group (PCG), consisting of Phelps
Dodge Miami, Inc. (Miami), a wholly owned subsidiary of FMC, and
two other companies. In 1998, the District Court approved a
Consent Decree between the PCG members and the state of Arizona
resolving all matters related to an enforcement action contemplated
by the state of Arizona against the PCG members with respect to
groundwater contamination. The Consent Decree committed the PCG
members to complete the remediation work outlined in the Consent
Decree, and that work continues at this time and is expected to
continue for many years in the future. Miami also was a party to
litigation entitled Pinal Creek Group, et al. v. Newmont Mining
Corporation, et al., United States District Court, District of Arizona, Case
No. CIV 91-1764 PHX DAE (LOA), filed on May 1, 1991. Pursuant
to a settlement in 2010, Miami paid $40 million to certain members
of the PCG to settle the allocation of previously incurred costs, and
agreed to take full responsibility for future groundwater remediation
at the Pinal Creek site, with limited exceptions. The settlement did
not result in a change to the obligation, which was estimated at fair
value when assumed in the Phelps Dodge acquisition.
Newtown Creek. From the 1930s until 1964, Phelps Dodge
Refining Corporation (PDRC), a subsidiary of FMC, operated a
smelter, and from the 1930s until 1984, it operated a refinery, on
the banks of Newtown Creek, which is a 3.5 mile-long waterway
that forms part of the boundary between Brooklyn and Queens in
New York City. Heavy industrialization along the banks of Newtown
Creek and discharges from the City of New York’s sewer system
over more than a century resulted in significant environmental
contamination of the waterway. The New York Attorney General
previously notified several companies, including PDRC, about
possible obligations to clean up sediments in Newtown Creek.
In March and April 2010, EPA notified PDRC and five others that
EPA considers them to be PRPs under CERCLA. The notified parties
began working with EPA to identify other PRPs, and EPA proposed
that the notified parties perform a Remedial Investigation/
Feasibility Study (RI/FS) at their expense and reimburse EPA for its
oversight costs. EPA is not expected to propose a remedy until
after an RI/FS is completed, which is expected to take several years.
On September 29, 2010, EPA designated Newtown Creek as a
Superfund site. These actions did not result in an adjustment to the
obligation, which was estimated at fair value when assumed in the
Phelps Dodge acquisition. The actual costs of fulfilling these remedial
obligations and the allocation of these costs among PRPs are
FRE
EP
OR
T-M
cMoR
an C
OP
PE
R &
GO
LD I
NC
. 2
010
Ann
ual
Rep
ort
92
NOTES TO CONSOLIDATED FINANCIAL STATEMENTS
uncertain and subject to change based on characterization information,
EPA remedy selection and related allocation determinations.
Historical Smelter Sites. FMC and its predecessors at various
times owned or operated copper and zinc smelters in several states,
including Arizona, Kansas, Oklahoma and Pennsylvania. For some
of these smelter sites, certain FCX subsidiaries have been advised
by EPA or state agencies that they may be liable for costs of
investigating and, if appropriate, remediating environmental
conditions associated with the smelters. At other sites, certain
FCX subsidiaries have entered into state voluntary remediation
programs to investigate and, if appropriate, remediate site conditions
associated with the smelters. The historical smelter sites are
in various stages of assessment and remediation. The two most
significant environmental obligations for historical smelter sites
relate to Blackwell, Oklahoma, and Bisbee, Arizona.
From 1916 to 1974, Blackwell Zinc Company, Inc. (BZC), an
indirect subsidiary of FCX, owned and operated a zinc smelter in
Blackwell, Oklahoma. In 1974, the smelter was demolished and the
property deeded to the Blackwell Industrial Authority. Pursuant to an
administrative order with the state of Oklahoma, BZC undertook
remedial actions in Blackwell in 1996 and 1997, including sampling
the nearby residential and commercial properties, and removing soils
on properties that were found to have metal concentrations above
state-established cleanup standards. From 1997 to 2003, BZC
investigated the nature and extent of groundwater contamination
potentially attributable to the former smelter and evaluated options
for remedying such contamination. In 2003, the state of Oklahoma
adopted a cleanup plan requiring the installation of a groundwater
extraction and treatment system and the closure of domestic
groundwater wells within the groundwater plume area. BZC has
completed the construction of a groundwater extraction and
treatment system, with system startup and initial discharge of treated
water occurring in October 2010.
In 2007, FCX, on behalf of BZC, commenced a voluntary community
outreach program by inviting property owners in and around
Blackwell to have their properties sampled for the presence of
smelter-related contaminants, and offering to remediate properties
whose soils were found to have metal concentrations above state-
established cleanup standards. With the exception of possible related
interior cleanup work, residential yard cleanups, which started in
October 2008, are essentially complete; although it is possible that
additional homeowners could request to participate in the sampling/
remediation program in the future. All of these soil sampling and
remediation activities are being coordinated with, and supervised by,
the state of Oklahoma.
On April 14, 2008, a purported class action was filed against FCX
and several of its direct and indirect subsidiaries, including BZC,
entitled Coffey, et al., v. Freeport-McMoRan Copper & Gold, Inc., et al.,
Kay County, Oklahoma District Court, Case No. CJ-2008-68. This
suit alleges that the operations of BZC’s zinc smelter in Blackwell,
Oklahoma, from 1918 to 1974 resulted in contamination of soils and
groundwater in Blackwell and the surrounding area. The complaint
seeks unspecified compensatory and punitive damages on behalf
of the putative class members, consisting of current and former
residents and property owners, for alleged diminution in property
values. Plaintiffs also requested an order compelling remediation
of allegedly contaminated properties and the establishment of
a monetary fund to pay for monitoring the present and future health
of the putative class members. On February 2, 2010, the court
granted FCX’s motion to dismiss the plaintiffs’ medical monitoring
claims, and the court denied plaintiffs’ request for reconsideration
at a hearing on May 6, 2010.
On December 7, 2009, 18 individuals filed a related suit (Brown et
al. v. Freeport-McMoRan Copper & Gold Inc., et al., Kay County,
Oklahoma District Court, Case No. CJ-2009-213), alleging personal
injuries resulting from exposure to lead and seeking compensatory
and punitive damages. In March 2010, the case was removed to the
U.S. District Court for the Western District of Oklahoma in Oklahoma
City (CIV-10-295-HE). On July 23, 2010, the federal district
court denied plaintiffs’ request to remand the suit to state court.
FCX intends to defend both of these matters vigorously and no
estimates can be made for ranges of losses that are reasonably
possible with respect to these two cases.
On October 15, 2009, the City of Blackwell and the Blackwell
Municipal Authority filed an action in District Court of Kay County,
Oklahoma, against FCX and several of its direct and indirect
subsidiaries, including BZC, entitled City of Blackwell et al. v.
Freeport-McMoRan Copper & Gold, Inc, et al., Kay County, Oklahoma
District Court, Case No. CJ-2009-15B. The suit alleged that the
operations of BZC’s zinc smelter resulted in contamination of the
soils and groundwater in the City of Blackwell. The plaintiffs alleged
nuisance, trespass, negligence and unjust enrichment and claimed
unspecified actual, equitable (for unjust enrichment) and punitive
damages. In February 2010, FCX reached a partial settlement with
the City of Blackwell and the Blackwell Municipal Authority by
paying $54 million (included in accounts payable and accrued liabilities
at December 31, 2009) to settle all of the claims except for future
damages relating to the potential failure of FCX’s groundwater
remediation system (which commenced startup in October 2010) to
prevent contamination from entering the City of Blackwell’s
wastewater treatment system.
From the 1880s until 1975, FMC and certain predecessor and
subsidiary entities operated a copper mine near Bisbee, Arizona.
A series of smelters operated in Bisbee from approximately 1879
through 1908. In 2000, FMC entered the Bisbee area into the
Arizona Voluntary Remediation Program (VRP) administered by ADEQ.
In 2008, FMC expanded the VRP project to include other communities
near Bisbee and commenced a voluntary community outreach
program inviting property owners to have soils at their properties
sampled for the presence of smelter and mine-related metals.
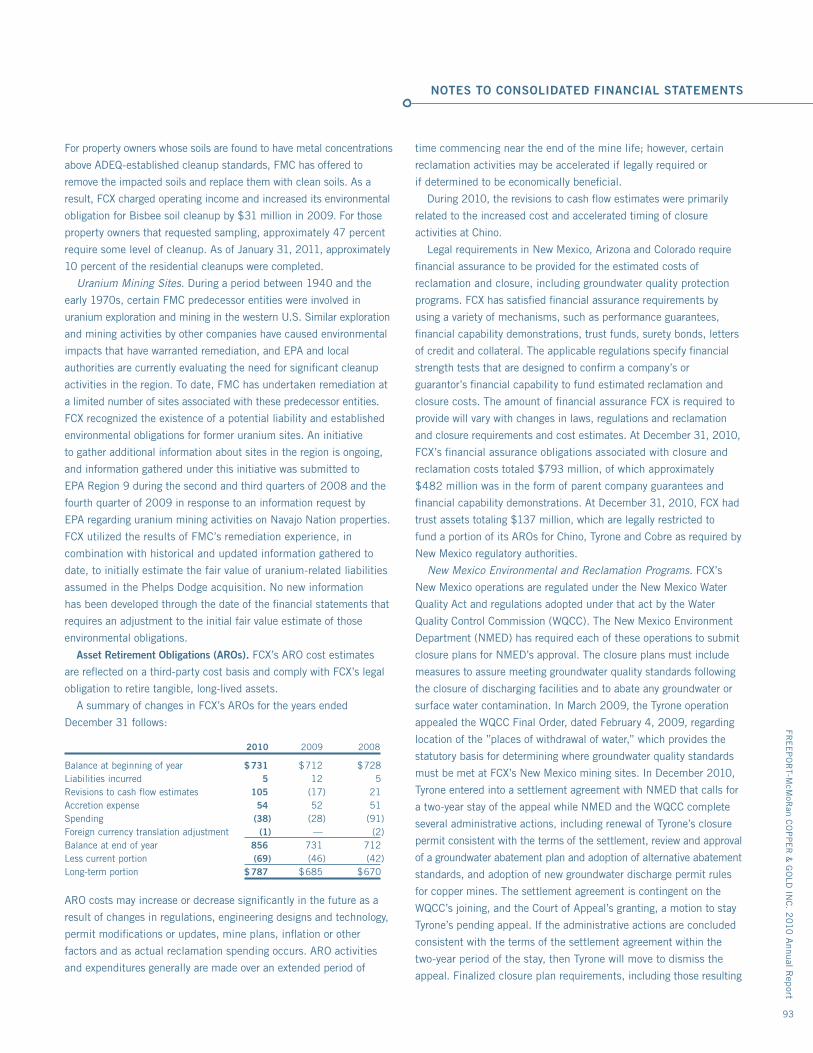
FRE
EP
OR
T-McM
oRan C
OP
PE
R &
GO
LD IN
C. 2
010 A
nnual Rep
ort
93
NOTES TO CONSOLIDATED FINANCIAL STATEMENTS
For property owners whose soils are found to have metal concentrations
above ADEQ-established cleanup standards, FMC has offered to
remove the impacted soils and replace them with clean soils. As a
result, FCX charged operating income and increased its environmental
obligation for Bisbee soil cleanup by $31 million in 2009. For those
property owners that requested sampling, approximately 47 percent
require some level of cleanup. As of January 31, 2011, approximately
10 percent of the residential cleanups were completed.
Uranium Mining Sites. During a period between 1940 and the
early 1970s, certain FMC predecessor entities were involved in
uranium exploration and mining in the western U.S. Similar exploration
and mining activities by other companies have caused environmental
impacts that have warranted remediation, and EPA and local
authorities are currently evaluating the need for significant cleanup
activities in the region. To date, FMC has undertaken remediation at
a limited number of sites associated with these predecessor entities.
FCX recognized the existence of a potential liability and established
environmental obligations for former uranium sites. An initiative
to gather additional information about sites in the region is ongoing,
and information gathered under this initiative was submitted to
EPA Region 9 during the second and third quarters of 2008 and the
fourth quarter of 2009 in response to an information request by
EPA regarding uranium mining activities on Navajo Nation properties.
FCX utilized the results of FMC’s remediation experience, in
combination with historical and updated information gathered to
date, to initially estimate the fair value of uranium-related liabilities
assumed in the Phelps Dodge acquisition. No new information
has been developed through the date of the financial statements that
requires an adjustment to the initial fair value estimate of those
environmental obligations.
Asset Retirement Obligations (AROs). FCX’s ARO cost estimates
are reflected on a third-party cost basis and comply with FCX’s legal
obligation to retire tangible, long-lived assets.
A summary of changes in FCX’s AROs for the years ended
December 31 follows:
2010 2009 2008
Balance at beginning of year $ 731 $ 712 $ 728Liabilities incurred 5 12 5Revisions to cash flow estimates 105 (17) 21Accretion expense 54 52 51Spending (38) (28) (91)Foreign currency translation adjustment (1) — (2)Balance at end of year 856 731 712Less current portion (69) (46) (42)Long-term portion $ 787 $ 685 $ 670
ARO costs may increase or decrease significantly in the future as a
result of changes in regulations, engineering designs and technology,
permit modifications or updates, mine plans, inflation or other
factors and as actual reclamation spending occurs. ARO activities
and expenditures generally are made over an extended period of
time commencing near the end of the mine life; however, certain
reclamation activities may be accelerated if legally required or
if determined to be economically beneficial.
During 2010, the revisions to cash flow estimates were primarily
related to the increased cost and accelerated timing of closure
activities at Chino.
Legal requirements in New Mexico, Arizona and Colorado require
financial assurance to be provided for the estimated costs of
reclamation and closure, including groundwater quality protection
programs. FCX has satisfied financial assurance requirements by
using a variety of mechanisms, such as performance guarantees,
financial capability demonstrations, trust funds, surety bonds, letters
of credit and collateral. The applicable regulations specify financial
strength tests that are designed to confirm a company’s or
guarantor’s financial capability to fund estimated reclamation and
closure costs. The amount of financial assurance FCX is required to
provide will vary with changes in laws, regulations and reclamation
and closure requirements and cost estimates. At December 31, 2010,
FCX’s financial assurance obligations associated with closure and
reclamation costs totaled $793 million, of which approximately
$482 million was in the form of parent company guarantees and
financial capability demonstrations. At December 31, 2010, FCX had
trust assets totaling $137 million, which are legally restricted to
fund a portion of its AROs for Chino, Tyrone and Cobre as required by
New Mexico regulatory authorities.
New Mexico Environmental and Reclamation Programs. FCX’s
New Mexico operations are regulated under the New Mexico Water
Quality Act and regulations adopted under that act by the Water
Quality Control Commission (WQCC). The New Mexico Environment
Department (NMED) has required each of these operations to submit
closure plans for NMED’s approval. The closure plans must include
measures to assure meeting groundwater quality standards following
the closure of discharging facilities and to abate any groundwater or
surface water contamination. In March 2009, the Tyrone operation
appealed the WQCC Final Order, dated February 4, 2009, regarding
location of the ”places of withdrawal of water,” which provides the
statutory basis for determining where groundwater quality standards
must be met at FCX’s New Mexico mining sites. In December 2010,
Tyrone entered into a settlement agreement with NMED that calls for
a two-year stay of the appeal while NMED and the WQCC complete
several administrative actions, including renewal of Tyrone’s closure
permit consistent with the terms of the settlement, review and approval
of a groundwater abatement plan and adoption of alternative abatement
standards, and adoption of new groundwater discharge permit rules
for copper mines. The settlement agreement is contingent on the
WQCC’s joining, and the Court of Appeal’s granting, a motion to stay
Tyrone’s pending appeal. If the administrative actions are concluded
consistent with the terms of the settlement agreement within the
two-year period of the stay, then Tyrone will move to dismiss the
appeal. Finalized closure plan requirements, including those resulting
FRE
EP
OR
T-M
cMoR
an C
OP
PE
R &
GO
LD I
NC
. 2
010
Ann
ual
Rep
ort
94
NOTES TO CONSOLIDATED FINANCIAL STATEMENTS
from the actions to be taken under the settlement agreement, could
result in increases in the Tyrone, Chino and Cobre closure costs.
FCX’s New Mexico operations also are subject to regulation under
the 1993 New Mexico Mining Act (the Mining Act) and the related
rules that are administered by the Mining and Minerals Division
(MMD) of the New Mexico Energy, Minerals and Natural Resources
Department. Under the Mining Act, mines are required to obtain
approval of plans describing the reclamation to be performed
following cessation of mining operations. At December 31, 2010,
FCX had accrued reclamation and closure costs of $405 million for
its New Mexico operations. As stated above, additional accruals
may be required based on the state’s review of FCX’s updated closure
plans and any resulting permit conditions, and the amount of those
accruals could be material.
Arizona Environmental and Reclamation Programs. FCX’s Arizona
properties are subject to regulatory oversight in several areas. ADEQ
has adopted regulations for its aquifer protection permit (APP) program
that require permits for certain facilities, activities and structures used
for mining, concentrating and smelting and require compliance with
aquifer water quality standards at an applicable point of compliance
well or location. The APP program also may require mitigation and
discharge reduction or elimination of some discharges.
An application for an APP requires a description of a closure
strategy that will meet applicable groundwater protection requirements
following cessation of operations and an estimate of the cost to
implement the closure strategy. An APP may specify closure
requirements, which may include post-closure monitoring and
maintenance. A more detailed closure plan must be submitted within
90 days after a permitted entity notifies ADEQ of its intent to
cease operations. A permit applicant must demonstrate its financial
ability to meet the closure costs estimated in the APP.
Portions of Arizona mining facilities that operated after January 1,
1986, also are subject to the Arizona Mined Land Reclamation Act
(AMLRA). AMLRA requires reclamation to achieve stability and safety
consistent with post-mining land use objectives specified in a
reclamation plan. Reclamation plans must be approved by the
State Mine Inspector and must include an estimate of the cost to
perform the reclamation measures specified in the plan. During 2008
and 2009, FCX updated its closure approaches at Sierrita, Tohono
and Bagdad to address site-specific regulatory obligations; during
2010, FCX updated its closure approaches for certain facilities at
Bagdad and Morenci. FCX will continue to evaluate options for future
reclamation and closure activities at its other operating and
non-operating sites, which are likely to result in additional adjustments
to FCX’s ARO liabilities. At December 31, 2010, FCX had accrued
reclamation and closure costs of $214 million for its Arizona operations.
PT Freeport Indonesia Reclamation and Closure Programs.
The ultimate amount of reclamation and closure costs to be incurred
at PT Freeport Indonesia’s operations will be determined based on
applicable laws and regulations and PT Freeport Indonesia’s
assessment of appropriate remedial activities in the circumstances,
after consultation with governmental authorities, affected local residents
and other affected parties and cannot currently be projected with
precision. Estimates of the ultimate reclamation and closure costs
PT Freeport Indonesia will incur in the future involve complex issues
requiring integrated assessments over a period of many years and are
subject to revision over time as more complete studies are performed.
Some reclamation costs will be incurred during mining activities,
while most closure costs and the remaining reclamation costs will be
incurred at the end of mining activities, which are currently estimated
to continue for more than 30 years. At December 31, 2010,
PT Freeport Indonesia had accrued reclamation and closure costs of
$129 million and a long-term receivable for Rio Tinto’s share of the
obligation of $13 million (included in other assets).
In 1996, PT Freeport Indonesia began contributing to a cash fund
($13 million balance at December 31, 2010) designed to accumulate
at least $100 million (including interest) by the end of its Indonesia
mining activities. PT Freeport Indonesia plans to use this fund,
including accrued interest, to pay mine closure and reclamation
costs. Any costs in excess of the $100 million fund would be funded
by operational cash flow or other sources.
In December 2010, the Indonesian Minister of the Department of
Energy and Mineral Resources revised its regulation regarding mine
reclamation and closure, which requires a company to provide a mine
closure guarantee in the form of a time deposit placed in a state-
owned bank in Indonesia. In accordance with its Contract of Work,
PT Freeport Indonesia is working with the Department of Energy and
Mineral Resources to review these requirements, including discussion
of other options for the mine closure guarantee. In October 2009,
PT Freeport Indonesia submitted its mine closure plan to the
Department of Energy and Mineral Resources for review and has
addressed comments received during the course of this review process.
Litigation. FCX is involved in various legal proceedings that arise
in the ordinary course of business or are associated with
environmental issues arising from legacy operations conducted over
the years by Phelps Dodge and its affiliates as discussed in this
note under “Environmental.”
Since approximately 1990, Phelps Dodge and various subsidiaries
have been named as defendants in a large number of lawsuits that
claim personal injury from exposure to asbestos allegedly contained
in electrical wire products produced or marketed many years ago,
either from asbestos contained in buildings and facilities located at
properties owned or operated by Phelps Dodge affiliates, or from
alleged asbestos in talc products. Many of these suits involve a large
number of codefendants. Based on litigation results to date and
facts currently known, FCX believes its liability, if any, in these
matters will not have a material adverse effect, either individually or
in the aggregate, upon its business, financial condition, liquidity,
results of operations or cash flow. There can be no assurance,
however, that future developments will not alter this conclusion.
FRE
EP
OR
T-McM
oRan C
OP
PE
R &
GO
LD IN
C. 2
010 A
nnual Rep
ort
95
NOTES TO CONSOLIDATED FINANCIAL STATEMENTS
On July 12, 2010, FCX was notified by the U.S. Department of
Justice, acting at the request of EPA, that the U.S. was preparing to
file suit in federal court against two of its wholly owned subsidiaries
(Cyprus Mines Corporation and Cyprus Amax Minerals Company, Inc.)
and several other parties to recover costs incurred or to be incurred
by the U.S. in responding to the release or threatened release of
hazardous substances at the Gilt Edge Mine Site in Lawrence County,
South Dakota. The letter stated that the U.S. would assert that the
Cyprus entities are jointly and severally liable with the other parties
for all response costs incurred by the U.S. at this site under CERCLA.
The letter asserted that the U.S. had incurred approximately
$91 million in response costs and expected to incur significant
additional response costs in the future. FCX does not know whether
the other parties could contribute materially to reimbursement of
these response costs.
FCX has conducted a detailed investigation of this site and has
concluded that the Cyprus entities were engaged only in exploration
at the site and were not involved in the large-scale mining operation
that left the site in its current condition. FCX believes there is a
reasonable basis for apportioning the response costs based on
historical records of activities at the site, so that the liability of the
Cyprus entities should be proportional to the actual harm done,
rather than joint and several, as the government asserts. FCX is
engaged in discussions with the U.S. and FCX intends to vigorously
defend this matter if the government files suit.
Columbian Chemicals Company (Columbian), formerly a subsidiary
of Phelps Dodge, has notified FCX of various indemnification claims
arising out of the 2005 agreement pursuant to which Columbian was
sold. The principal outstanding claims relate to (1) litigation pending
against Columbian in West Virginia state court for alleged personal
injury and property damage resulting from exposure to carbon black
(the carbon black matter) and (2) an investigation being conducted
by EPA of potential Clean Air Act violations during the period
Columbian was owned by Phelps Dodge (the Clean Air Act matter).
FCX believes that its indemnity obligations, if any, for both of these
matters are subject to an aggregate limit under the 2005 agreement
of approximately $110 million. FCX believes that Columbian’s
exposure, if any, for the Clean Air Act matter is below that aggregate
limit, but FCX cannot estimate Columbian’s exposure for the carbon
black matter. Columbian has asserted in a suit filed in New York state
court in April 2010 entitled Columbian Chemicals Company and
Columbian Chemicals Acquisition LLC v. Freeport-McMoRan
Corporation f/k/a Phelps Dodge Corporation, County of New York,
Supreme Court of the State of New York, Index No. 600999/2010,
that the carbon black matter is not subject to that limit, and FCX is
opposing that assertion. FCX intends to meet its obligations under the
2005 agreement, but will vigorously defend against any effort by
Columbian to expansively interpret those obligations.
Letters of Credit, Bank Guarantees and Surety Bonds. Letters of
credit and bank guarantees totaled $97 million at December 31, 2010,
primarily for reclamation and environmental obligations, workers’
compensation insurance programs, tax and customs obligations,
and other commercial obligations. In addition, FCX had surety bonds
totaling $123 million at December 31, 2010, associated with
reclamation and closure ($101 million — see discussion above),
self-insurance bonds primarily for workers’ compensation ($19 million)
and other bonds ($3 million).
Insurance. FCX purchases a variety of insurance products to
mitigate potential losses. The various insurance products typically
have specified deductible amounts or self-insured retentions and
policy limits. FCX generally is self-insured for U.S. workers’
compensation, but purchases excess insurance up to statutory limits.
An actuarial analysis is performed twice a year for various FCX
casualty programs, including workers’ compensation, to estimate
required insurance reserves. Insurance reserves totaled $67 million
at December 31, 2010, which consisted of a current portion of
$9 million (included in accounts payable and accrued liabilities) and
a long-term portion of $58 million (included in other liabilities).
Other. In October 2010, PT Freeport Indonesia received from the
Indonesian tax authorities an assessment for additional taxes
approximating $106 million and interest approximating $52 million
related to various audit exceptions for 2005. PT Freeport Indonesia
has filed objections to these assessments because it believes that
it has properly paid taxes for the year 2005 and is working with the
Indonesian tax authorities to resolve this matter.
In December 2009, PT Freeport Indonesia was notified by the
Large Taxpayer’s Office of the Government of Indonesia that
PT Freeport Indonesia is obligated to pay value added taxes on
certain goods imported after the year 2000. The amount of taxes
and penalties would be significant. PT Freeport Indonesia believes
that, pursuant to the terms of its Contract of Work, it is only required
to pay value added taxes on these types of goods imported after
December 30, 2009. PT Freeport Indonesia has not received an
assessment and is working with the applicable government
authorities to resolve this matter.
In December 2008, Cerro Verde was notified by SUNAT, the
Peruvian national tax authority, of its intent to assess mining royalties
related to the minerals processed by the Cerro Verde concentrator,
which was added to Cerro Verde’s processing facilities in late 2006.
In August 2009, Cerro Verde received an assessment approximating
$34 million in connection with its alleged obligations for mining
royalties and penalties for the period from October 2006 to
December 2007. In April 2010, SUNAT issued a ruling denying
Cerro Verde’s protest of the assessment, and in May 2010,
Cerro Verde appealed this decision to the Tax Court. Cerro Verde
also received an assessment approximating $41 million in mining
royalties and penalties for the year 2008 (refer to Note 21 for a
discussion of the ruling on this matter in February 2011) and a
request for information for mining royalties covering the year 2009.
SUNAT may continue to assess mining royalties annually until this
FRE
EP
OR
T-M
cMoR
an C
OP
PE
R &
GO
LD I
NC
. 2
010
Ann
ual
Rep
ort
96
NOTES TO CONSOLIDATED FINANCIAL STATEMENTS
matter is resolved by the Tax Court. Cerro Verde is challenging these
royalties because it believes that its stability agreement with the
Peruvian government exempts from royalties all minerals extracted
from its mining concession, irrespective of the method used
for processing those minerals. If Cerro Verde is ultimately found
responsible for these royalties, it will also be liable for interest,
which accrues at rates that range from 7 to 18 percent based on
the year accrued and the currency in which the amounts would
be payable. At December 31, 2010, the aggregate amount of the
October 2006 to December 2007 assessment with interest
approximated $57 million, and the 2008 assessment with interest
approximated $61 million. These amounts will continue to
increase at varying interest rates. No amounts have been accrued
for this contingency.
NOTE 14. Commitments and Guarantees
Operating Leases. FCX leases various types of properties, including
offices and equipment. A summary of future minimum rentals under
these non-cancelable leases at December 31, 2010, follows:
2011 $ 332012 222013 172014 142015 13Thereafter 84 Total payments $ 183
Minimum payments under operating leases have not been reduced
by aggregate minimum sublease rentals, which are minimal. Total
aggregate rental expense under operating leases was $64 million in
2010, $74 million in 2009 and $90 million in 2008.
Contractual Obligations. Based on applicable prices at
December 31, 2010, FCX has unconditional purchase obligations
of $2.8 billion, primarily comprising the procurement of copper
concentrates and cathodes ($2.1 billion), transportation
($201 million), electricity ($144 million) and oxygen ($143 million)
that are essential to its operations worldwide. Some of FCX’s
unconditional purchase obligations are settled based on the prevailing
market rate for the service or commodity purchased. In some cases,
the amount of the actual obligation may change over time because
of market conditions. Obligations for copper concentrates and
cathodes provide for deliveries of specified volumes, at market-based
prices, to Atlantic Copper and the North America copper mines.
Transportation obligations are for South America contracted ocean
freight rates and for North America natural gas transportation.
Electricity obligations are primarily for contractual minimum demand
at the South America and Tenke Fungurume mines. Oxygen
obligations provide for deliveries of specified volumes, at fixed prices,
primarily to Atlantic Copper.
FCX’s future commitments associated with unconditional purchase
obligations total $2.0 billion in 2011, $384 million in 2012,
$266 million in 2013, $18 million in 2014, $19 million in 2015 and
$118 million thereafter. During 2010, 2009 and 2008, FCX
fulfilled its minimum contractual purchase obligations or negotiated
settlements in those situations in which it terminated an agreement
containing an unconditional obligation.
Mining Contracts. Indonesia. FCX is entitled to mine in Indonesia
under the Contract of Work between PT Freeport Indonesia and the
Government of Indonesia. The original Contract of Work was entered
into in 1967 and was replaced with a new Contract of Work in 1991.
The initial term of the current Contract of Work expires in 2021, but
can be extended by PT Freeport Indonesia for two 10-year periods,
subject to Indonesian government approval, which cannot be withheld
or delayed unreasonably. Given the importance of contracts of
work under the Indonesian legal system and PT Freeport
Indonesia’s approximately 40 years of working with the Indonesian
government, which included entering into the Contract of Work
in 1991 well before the expiration of the 1967 Contract of Work,
PT Freeport Indonesia fully expects that the government will
approve the extensions as long as it continues to comply with the
terms of the Contract of Work.
In July 2004, FCX received a request from the Indonesian
Department of Energy and Mineral Resources that it offer to sell
shares in PT Indocopper Investama to Indonesian nationals at fair
market value. In response to this request and in view of the potential
benefits of having additional Indonesian ownership in the operations,
FCX agreed, at the time, to consider a potential sale of an interest
in PT Indocopper Investama at fair market value. Neither its Contract
of Work nor Indonesian law requires FCX to divest any portion of its
ownership in PT Freeport Indonesia or PT Indocopper Investama.
In May 2008, FCX signed a Memorandum of Understanding with
the Papua provincial government (the Province) whereby the parties
agreed to work cooperatively to determine the feasibility of an
acquisition by the Province of the PT Indocopper Investama shares
at market value.
The copper royalty rate payable by PT Freeport Indonesia under
its Contract of Work varies from 1.5 percent of copper net revenue at
a copper price of $0.90 or less per pound to 3.5 percent at a
copper price of $1.10 or more per pound. The Contract of Work
royalty rate for gold and silver sales is 1.0 percent.
A large part of the mineral royalties under Government of Indonesia
regulations is designated to the provinces from which the minerals
are extracted. In connection with its fourth concentrator mill
expansion completed in 1998, PT Freeport Indonesia agreed to pay
the Government of Indonesia additional royalties (royalties not
required by the Contract of Work) to provide further support to the
local governments and the people of the Indonesian province of
Papua. The additional royalties are paid on production exceeding
specified annual amounts of copper, gold and silver expected to be
generated when PT Freeport Indonesia’s milling facilities operate
FRE
EP
OR
T-McM
oRan C
OP
PE
R &
GO
LD IN
C. 2
010 A
nnual Rep
ort
97
NOTES TO CONSOLIDATED FINANCIAL STATEMENTS
above 200,000 metric tons of ore per day. The additional royalty for
copper equals the Contract of Work royalty rate, and for gold and
silver equals twice the Contract of Work royalty rates. Therefore,
PT Freeport Indonesia’s royalty rate on copper net revenues from
production above the agreed levels is double the Contract of Work
royalty rate, and the royalty rates on gold and silver sales from
production above the agreed levels are triple the Contract of Work
royalty rates.
The combined royalties, including the additional royalties that
became effective January 1, 1999, totaled $156 million in 2010,
$147 million in 2009 and $113 million in 2008.
In 2008, the Government of Indonesia enacted a new mining law,
which will operate under a licensing system as opposed to the
contract of work system that applies to PT Freeport Indonesia. In
2010, the Government of Indonesia promulgated regulations
under the 2008 mining law and certain provisions address existing
contracts of work. The regulations provide that contracts of work will
continue to be honored until their expiration. However, the regulations
attempt to apply certain provisions of the new law to contracts of
work and that any extension periods would be pursuant to the new
licensing system even though PT Freeport Indonesia’s Contract of
Work provides for two 10-year extension periods under the existing
terms of its Contract of Work.
Africa. FCX is entitled to mine in the DRC under the Amended and
Restated Mining Convention (ARMC) between Tenke Fungurume
Mining S.A.R.L. (TFM) and the Government of the DRC. The original
Mining Convention was entered into in 1996 and was replaced
with the ARMC in 2005. The current ARMC will remain in effect for
as long as the Tenke Fungurume concession is exploitable. The
royalty rate payable by TFM under the ARMC is 2 percent of net
revenue. These mining royalties totaled $20 million in 2010 and
$7 million in 2009.
In February 2008, the Ministry of Mines, Government of the DRC,
sent a letter seeking comment on proposed material modifications
to the mining contracts for the Tenke Fungurume concession,
including the amount of transfer payments payable to the government,
the government’s percentage ownership and involvement
in the management of the mine, regularization of certain matters
under Congolese law and the implementation of social plans. In
October 2010, the government of the DRC announced the conclusion
of the review of TFM’s mining contracts. The conclusion of the review
process confirmed that TFM’s existing mining contracts are in good
standing and acknowledged the rights and benefits granted under
those contracts. TFM’s key fiscal terms, including a 30 percent
income tax rate, a 2 percent mining royalty rate and a 1 percent
export fee, will continue to apply and are consistent with the rates
in the DRC’s current Mining Code. In connection with the review,
TFM made several commitments, which have been reflected in
amendments to its mining contracts, including (1) an increase in the
ownership interest of La Générale des Carrières et des Mines’
(Gécamines), which is wholly owned by the government of the DRC,
from 17.5 percent (non-dilutable) to 20.0 percent (non-dilutable),
resulting in a decrease of FCX’s effective ownership interest from
57.75 percent to 56.0 percent and Lundin Mining Corporation’s
effective ownership interest from 24.75 percent to 24.0 percent;
(2) an additional royalty of $1.2 million for each 100,000 metric
tons of proven and probable copper reserves above 2.5 million metric
tons at the time new reserves are established by FCX; (3) additional
payments totaling $30 million to be paid in six equal installments
of $5 million upon reaching certain production milestones;
(4) conversion of $50 million in intercompany loans to equity;
(5) a payment of approximately $5 million for surface area fees and
ongoing surface area fees of approximately $0.8 million annually;
(6) incorporating clarifying language stating that TFM’s rights and
obligations are governed by its ARMC; and (7) expanding Gécamines’
participation in TFM management. TFM has also reiterated its
commitment to the use of local services and Congolese employment.
In connection with the modifications, the annual interest rate on
advances from TFM shareholders increases from a rate of LIBOR plus
2 percent to LIBOR plus 6 percent. In December 2010, the addenda
to TFM’s ARMC and Amended and Restated Shareholders’
Agreement were signed by the parties and are pending a Presidential
Decree. TFM’s existing mining contracts will be in effect until the
Presidential Decree is obtained. In addition, the change in FCX’s
effective ownership interest in Tenke Fungurume and the conversion
of intercompany loans to equity will be effected after obtaining
approval of the modifications to TFM’s bylaws. In December 2010,
TFM made payments totaling $26.5 million, which have been
recorded as prepaid contract costs at December 31, 2010 (included
in other current assets).
Community Development Programs. FCX has adopted policies that
govern its working relationships with the communities where it
operates that are designed to guide its practices and programs in a
manner that respects basic human rights and the culture of the
local people impacted by FCX’s operations. FCX continues to make
significant expenditures on community development, education,
training and cultural programs.
In 1996, PT Freeport Indonesia established the Freeport
Partnership Fund for Community Development (formerly the Freeport
Fund for Irian Jaya Development) through which PT Freeport
Indonesia has made available funding and technical assistance to
support the economic health, education and social development
of the area. PT Freeport Indonesia has committed through 2011 to
provide one percent of its annual revenue for the development of the
local people in its area of operations through the Freeport
Partnership Fund for Community Development. PT Freeport
Indonesia charged $64 million in 2010, $59 million in 2009 and
$34 million in 2008 to cost of sales for this commitment.
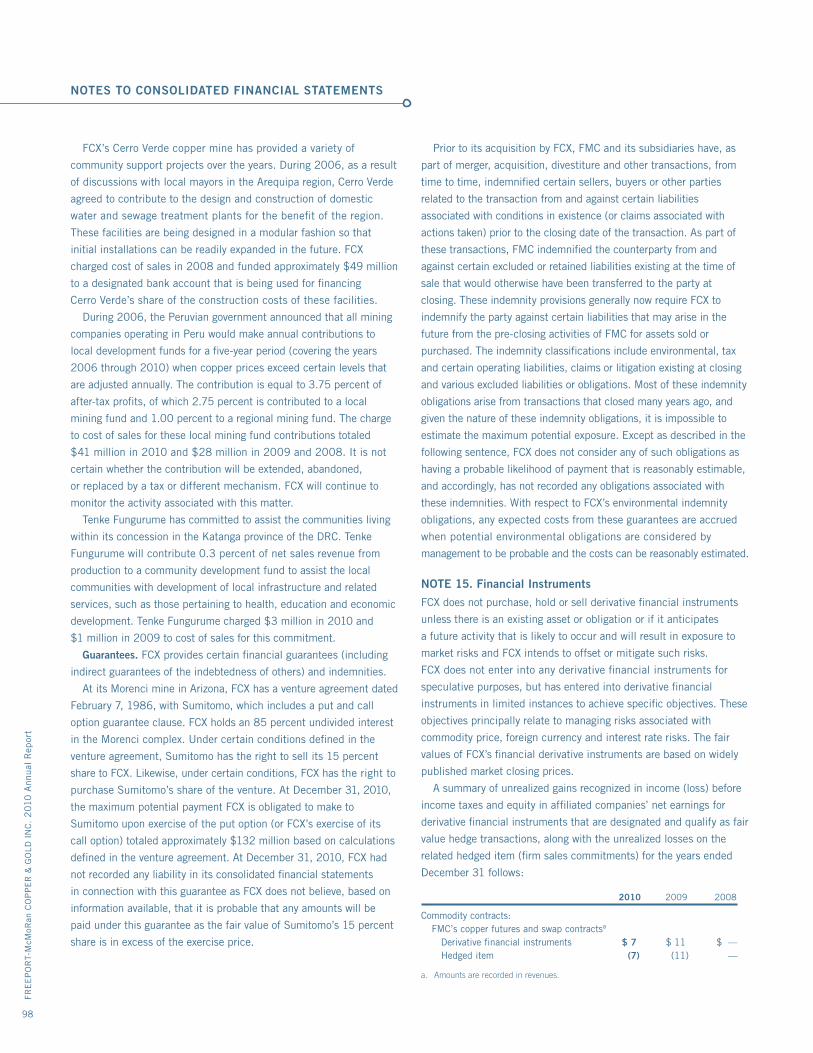
FRE
EP
OR
T-M
cMoR
an C
OP
PE
R &
GO
LD I
NC
. 2
010
Ann
ual
Rep
ort
98
NOTES TO CONSOLIDATED FINANCIAL STATEMENTS
FCX’s Cerro Verde copper mine has provided a variety of
community support projects over the years. During 2006, as a result
of discussions with local mayors in the Arequipa region, Cerro Verde
agreed to contribute to the design and construction of domestic
water and sewage treatment plants for the benefit of the region.
These facilities are being designed in a modular fashion so that
initial installations can be readily expanded in the future. FCX
charged cost of sales in 2008 and funded approximately $49 million
to a designated bank account that is being used for financing
Cerro Verde’s share of the construction costs of these facilities.
During 2006, the Peruvian government announced that all mining
companies operating in Peru would make annual contributions to
local development funds for a five-year period (covering the years
2006 through 2010) when copper prices exceed certain levels that
are adjusted annually. The contribution is equal to 3.75 percent of
after-tax profits, of which 2.75 percent is contributed to a local
mining fund and 1.00 percent to a regional mining fund. The charge
to cost of sales for these local mining fund contributions totaled
$41 million in 2010 and $28 million in 2009 and 2008. It is not
certain whether the contribution will be extended, abandoned,
or replaced by a tax or different mechanism. FCX will continue to
monitor the activity associated with this matter.
Tenke Fungurume has committed to assist the communities living
within its concession in the Katanga province of the DRC. Tenke
Fungurume will contribute 0.3 percent of net sales revenue from
production to a community development fund to assist the local
communities with development of local infrastructure and related
services, such as those pertaining to health, education and economic
development. Tenke Fungurume charged $3 million in 2010 and
$1 million in 2009 to cost of sales for this commitment.
Guarantees. FCX provides certain financial guarantees (including
indirect guarantees of the indebtedness of others) and indemnities.
At its Morenci mine in Arizona, FCX has a venture agreement dated
February 7, 1986, with Sumitomo, which includes a put and call
option guarantee clause. FCX holds an 85 percent undivided interest
in the Morenci complex. Under certain conditions defined in the
venture agreement, Sumitomo has the right to sell its 15 percent
share to FCX. Likewise, under certain conditions, FCX has the right to
purchase Sumitomo’s share of the venture. At December 31, 2010,
the maximum potential payment FCX is obligated to make to
Sumitomo upon exercise of the put option (or FCX’s exercise of its
call option) totaled approximately $132 million based on calculations
defined in the venture agreement. At December 31, 2010, FCX had
not recorded any liability in its consolidated financial statements
in connection with this guarantee as FCX does not believe, based on
information available, that it is probable that any amounts will be
paid under this guarantee as the fair value of Sumitomo’s 15 percent
share is in excess of the exercise price.
Prior to its acquisition by FCX, FMC and its subsidiaries have, as
part of merger, acquisition, divestiture and other transactions, from
time to time, indemnified certain sellers, buyers or other parties
related to the transaction from and against certain liabilities
associated with conditions in existence (or claims associated with
actions taken) prior to the closing date of the transaction. As part of
these transactions, FMC indemnified the counterparty from and
against certain excluded or retained liabilities existing at the time of
sale that would otherwise have been transferred to the party at
closing. These indemnity provisions generally now require FCX to
indemnify the party against certain liabilities that may arise in the
future from the pre-closing activities of FMC for assets sold or
purchased. The indemnity classifications include environmental, tax
and certain operating liabilities, claims or litigation existing at closing
and various excluded liabilities or obligations. Most of these indemnity
obligations arise from transactions that closed many years ago, and
given the nature of these indemnity obligations, it is impossible to
estimate the maximum potential exposure. Except as described in the
following sentence, FCX does not consider any of such obligations as
having a probable likelihood of payment that is reasonably estimable,
and accordingly, has not recorded any obligations associated with
these indemnities. With respect to FCX’s environmental indemnity
obligations, any expected costs from these guarantees are accrued
when potential environmental obligations are considered by
management to be probable and the costs can be reasonably estimated.
NOTE 15. Financial Instruments
FCX does not purchase, hold or sell derivative financial instruments
unless there is an existing asset or obligation or if it anticipates
a future activity that is likely to occur and will result in exposure to
market risks and FCX intends to offset or mitigate such risks.
FCX does not enter into any derivative financial instruments for
speculative purposes, but has entered into derivative financial
instruments in limited instances to achieve specific objectives. These
objectives principally relate to managing risks associated with
commodity price, foreign currency and interest rate risks. The fair
values of FCX’s financial derivative instruments are based on widely
published market closing prices.
A summary of unrealized gains recognized in income (loss) before
income taxes and equity in affiliated companies’ net earnings for
derivative financial instruments that are designated and qualify as fair
value hedge transactions, along with the unrealized losses on the
related hedged item (firm sales commitments) for the years ended
December 31 follows:
2010 2009 2008
Commodity contracts: FMC’s copper futures and swap contractsa
Derivative financial instruments $ 7 $ 11 $ — Hedged item (7) (11) —
a. Amounts are recorded in revenues.
FRE
EP
OR
T-McM
oRan C
OP
PE
R &
GO
LD IN
C. 2
010 A
nnual Rep
ort
99
NOTES TO CONSOLIDATED FINANCIAL STATEMENTS
FCX realized gains, which are recorded in revenues, totaled
$37 million during 2010 and $49 million during 2009 from
matured derivative financial instruments that qualified for
hedge accounting.
A summary of the realized and unrealized gains (losses)
recognized in income (loss) before income taxes and equity in
affiliated companies’ net earnings for derivative financial
instruments, including embedded derivatives, which do not qualify as
hedge transactions, for the years ended December 31 follows:
2010 2009 2008
Commodity contracts: Embedded derivatives in provisional sales contractsa $ 619 $ 1,393 $ (1,278) Embedded derivatives in provisional purchase contractsb (2) (3) 34 PT Freeport Indonesia’s copper forward contractsa — (104) — Atlantic Copper’s copper forward contractsb (30) 2 (71) FMC’s copper futures and swap contractsa — 64 (184)
a. Amounts recorded in revenues.b. Amounts recorded in cost of sales as production and delivery costs.
A summary of the fair values of unsettled derivative financial
instruments recorded on the consolidated balance sheets follows:
December 31, 2010 2009
Derivatives designated as hedging instrumentsCommodity contracts: FMC’s copper futures and swap contracts: Asset positiona $ 18 $ 11
Derivatives not designated as hedging instrumentsCommodity contracts: Embedded derivatives in provisional sales/purchases contracts:b
Asset position 357 235 Liability position (115) (70) Atlantic Copper’s copper forward contracts: Asset positiona — 1 Liability positionc (10) — FMC’s copper futures and swap contracts:d
Asset positiona — 2
a. Amounts recorded in other current assets.b. Amounts recorded either as a net accounts receivable or a net accounts payable.c. Amounts recorded in accounts payable and accrued liabilities.d. At December 31, 2010, FCX had paid $3 million to a broker for margin requirements
(recorded in other current assets), and received $8 million from a broker associated with margin requirements (recorded in accounts payable and accrued liabilities). FCX had received $6 million from brokers associated with margin requirements (recorded in accounts payable and accrued liabilities) at December 31, 2009.
Commodity Contracts. From time to time, FCX has entered into
forward, futures, and swap contracts to hedge the market risk
associated with fluctuations in the prices of commodities it purchases
and sells. Derivative financial instruments used by FCX to manage
its risks do not contain credit risk-related contingent provisions. As of
December 31, 2010 and 2009, FCX had no price protection
contracts relating to its mine production. A summary of FCX’s derivative
contracts and programs follows.
Derivatives Designated as Hedging Instruments — Fair Value Hedges
Copper Futures and Swap Contracts. Some of FMC’s U.S. copper
rod customers request a fixed market price instead of the COMEX
average copper price in the month of shipment. FCX hedges this
price exposure in a manner that allows it to receive the COMEX
average price in the month of shipment while the customers pay the
fixed price they requested. FCX accomplishes this by entering into
copper futures and swap contracts and then liquidating the copper
futures contracts and settling the copper swap contracts during the
month of shipment, which generally results in FCX receiving the
COMEX average copper price in the month of shipment. Hedge gains
or losses from these copper futures and swap contracts are recorded
in revenues. FCX did not have any significant gains or losses during
the year ended December 31, 2010 and 2009, resulting from hedge
ineffectiveness. At December 31, 2010, FCX held copper futures
and swap contracts that qualified for hedge accounting for 30 million
pounds at an average price of $3.83 per pound, with maturities
through December 2012.
Derivatives Not Designated as Hedging Instruments
Embedded derivatives and derivative financial instruments that
do not meet the criteria to qualify for hedge accounting are
discussed below.
Embedded Derivatives. As described in Note 1 under “Revenue
Recognition,” certain FCX copper concentrate, copper cathode and
gold sales contracts provide for provisional pricing primarily based on
LME or COMEX prices (copper) and the London Bullion Market
Association price (gold) at the time of shipment as specified in the
contract. Similarly, FCX purchases copper and molybdenum under
contracts that provide for provisional pricing (molybdenum purchases
are generally based on an average Metals Week Molybdenum Dealer
Oxide price). FCX applies the normal purchases and normal sales
scope exception in accordance with derivatives and hedge accounting
guidance to the host sales agreements since the contracts do not
allow for net settlement and always result in physical delivery. Sales
and purchases with a provisional sales price contain an embedded
derivative (i.e., the price settlement mechanism that is settled after
the time of delivery) that is required to be bifurcated from the host
contract. The host contract is the sale or purchase of the metals
contained in the concentrates or cathodes at the then-current LME
or COMEX price (copper), the London Bullion Market Association
price (gold) or the average Metals Week Molybdenum Dealer Oxide
price (molybdenum) as defined in the contract. Mark-to-market price
fluctuations recorded through the settlement date are reflected in
revenues for sales contracts and in cost of sales as production and
delivery costs for purchase contracts.
FRE
EP
OR
T-M
cMoR
an C
OP
PE
R &
GO
LD I
NC
. 2
010
Ann
ual
Rep
ort
100
NOTES TO CONSOLIDATED FINANCIAL STATEMENTS
A summary of FCX’s embedded derivatives at December 31, 2010,
follows:
Average Price
Open Per Unit Maturities Positions Contract Market Through
Embedded derivatives in provisional sales contracts: Copper (millions of pounds) 663 $ 3.84 $ 4.36 May 2011 Gold (thousands of ounces) 297 1,382 1,411 March 2011Embedded derivatives in provisional purchase contracts: Copper (millions of pounds) 210 3.82 4.37 April 2011 Molybdenum (thousands of pounds) 245 15.28 15.71 January 2011 Copper Forward Contracts. Atlantic Copper enters into forward
copper contracts designed to hedge its copper price risk whenever
its physical purchases and sales pricing periods do not match.
These economic hedge transactions are intended to hedge against
changes in copper prices, with the mark-to-market hedging gains or
losses recorded in cost of sales. At December 31, 2010, Atlantic
Copper held net forward copper sales contracts for 43 million pounds
at an average price of $4.15 per pound, with maturities through
February 2011.
In April 2009, FCX entered into copper forward sales contracts to
lock in prices at an average of $1.86 per pound on 355 million
pounds of PT Freeport Indonesia’s provisionally priced copper sales
at March 31, 2009, which final priced from April 2009 through
July 2009. These economic hedge transactions were intended to
reduce short-term price volatility in earnings and cash flows. Gains
and losses for these economic hedge transactions were recorded
in revenues. FCX has not entered into additional forward sales
contracts since April 2009 for its provisionally priced copper sales,
but may enter into future transactions to lock in pricing on
provisionally priced sales from time to time. However, FCX does not
currently intend to change its long-standing policy of not hedging
future copper production.
Copper Futures and Swap Contracts. In addition to the contracts
discussed above that qualify for fair value hedge accounting, FCX
also had similar contracts with FMC’s U.S. copper rod customers that
did not qualify for hedge accounting because of certain terms
in the sales contracts. Gains and losses for these economic hedge
transactions were recorded in revenues.
Foreign Currency Exchange Contracts. As a global company,
FCX transacts business in many countries and in many currencies.
Foreign currency transactions of FCX’s international subsidiaries
increase its risks because exchange rates can change between the
time agreements are made and the time foreign currency transactions
are settled. FCX may hedge or protect its international subsidiaries’
foreign currency transactions from time to time by entering into
forward exchange contracts to lock in or minimize the effects of
fluctuations in exchange rates. FCX had no outstanding foreign
currency exchange contracts at December 31, 2010.
Interest Rate Swap Contracts. From time to time, FCX or its
subsidiaries may enter into interest rate swaps to manage its exposure
to interest rate changes and to achieve a desired proportion of
fixed-rate versus floating-rate debt based on current and projected
market conditions. FCX may enter into interest rate swap contracts to
lock in an interest rate considered to be favorable in order to
protect against its exposure to variability in future interest payments
attributable to increases in interest rates of the designated floating-
rate debt. In some situations, FCX may enter into fixed-to-floating
interest rate swap contracts to protect against changes in the fair
value of the underlying fixed-rate debt that result from market interest
rate changes and to take advantage of lower interest rates. FCX
had no outstanding interest rate swap contracts at December 31, 2010.
Credit Risk. FCX is exposed to credit loss when financial
institutions with which FCX has entered into derivative transactions
(commodity, foreign exchange and interest rate swaps) are unable to
pay. To minimize the risk of such losses, FCX uses highly rated
financial institutions that meet certain requirements. FCX also
periodically reviews the creditworthiness of these institutions to
ensure that they are maintaining their credit ratings. FCX does
not anticipate that any of the financial institutions it deals with
will default on their obligations. As of December 31, 2010, FCX
did not have any significant credit exposure associated with
derivative transactions.
Other Financial Instruments. Other financial instruments include
cash and cash equivalents, accounts receivable, trust assets,
available-for-sale securities, accounts payable and accrued liabilities,
dividends payable, Rio Tinto share of joint venture cash flows and
long-term debt. Refer to Note 16 for the fair values of these financial
instruments.
Cash and Cash Equivalents, Accounts Receivable, Accounts
Payable and Accrued Liabilities, Dividends Payable and Rio Tinto
Share of Joint Venture Cash Flows. The financial statement amount
is a reasonable estimate of the fair value because of the short
maturity of these instruments and generally negligible credit losses.
Trust Assets and Available-for-Sale Securities. The financial
statement amount represents the fair value of trust assets and
available-for-sale securities.
Long-Term Debt. The financial statement amount represents cost
except for long-term debt acquired in the Phelps Dodge acquisition,
which was recorded at fair value at the acquisition date.
NOTE 16. Fair Value Measurement
Fair value accounting guidance includes a fair value hierarchy
that prioritizes the inputs to valuation techniques used to measure
fair value. The hierarchy gives the highest priority to unadjusted
quoted prices in active markets for identical assets or liabilities
(Level 1 inputs) and the lowest priority to unobservable inputs
(Level 3 inputs). The three levels of the fair value hierarchy are
described below:
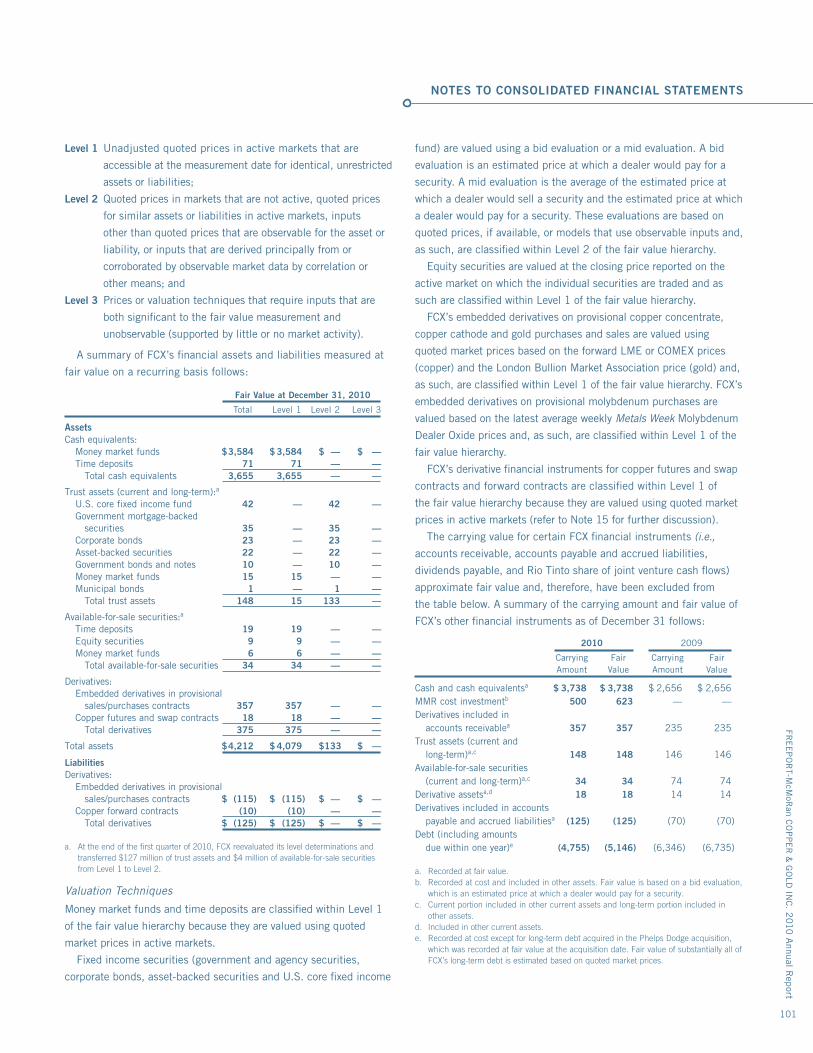
FRE
EP
OR
T-McM
oRan C
OP
PE
R &
GO
LD IN
C. 2
010 A
nnual Rep
ort
101
NOTES TO CONSOLIDATED FINANCIAL STATEMENTS
Level 1 Unadjusted quoted prices in active markets that are
accessible at the measurement date for identical, unrestricted
assets or liabilities;
Level 2 Quoted prices in markets that are not active, quoted prices
for similar assets or liabilities in active markets, inputs
other than quoted prices that are observable for the asset or
liability, or inputs that are derived principally from or
corroborated by observable market data by correlation or
other means; and
Level 3 Prices or valuation techniques that require inputs that are
both significant to the fair value measurement and
unobservable (supported by little or no market activity).
A summary of FCX’s financial assets and liabilities measured at
fair value on a recurring basis follows:
Fair Value at December 31, 2010
Total Level 1 Level 2 Level 3
AssetsCash equivalents: Money market funds $ 3,584 $ 3,584 $ — $ — Time deposits 71 71 — — Total cash equivalents 3,655 3,655 — —
Trust assets (current and long-term):a
U.S. core fixed income fund 42 — 42 — Government mortgage-backed securities 35 — 35 — Corporate bonds 23 — 23 — Asset-backed securities 22 — 22 — Government bonds and notes 10 — 10 — Money market funds 15 15 — — Municipal bonds 1 — 1 — Total trust assets 148 15 133 —
Available-for-sale securities:a
Time deposits 19 19 — — Equity securities 9 9 — — Money market funds 6 6 — — Total available-for-sale securities 34 34 — —
Derivatives: Embedded derivatives in provisional sales/purchases contracts 357 357 — — Copper futures and swap contracts 18 18 — — Total derivatives 375 375 — —
Total assets $ 4,212 $ 4,079 $ 133 $ —
LiabilitiesDerivatives: Embedded derivatives in provisional sales/purchases contracts $ (115) $ (115) $ — $ — Copper forward contracts (10) (10) — — Total derivatives $ (125) $ (125) $ — $ —
a. At the end of the first quarter of 2010, FCX reevaluated its level determinations and transferred $127 million of trust assets and $4 million of available-for-sale securities from Level 1 to Level 2.
Valuation Techniques
Money market funds and time deposits are classified within Level 1
of the fair value hierarchy because they are valued using quoted
market prices in active markets.
Fixed income securities (government and agency securities,
corporate bonds, asset-backed securities and U.S. core fixed income
fund) are valued using a bid evaluation or a mid evaluation. A bid
evaluation is an estimated price at which a dealer would pay for a
security. A mid evaluation is the average of the estimated price at
which a dealer would sell a security and the estimated price at which
a dealer would pay for a security. These evaluations are based on
quoted prices, if available, or models that use observable inputs and,
as such, are classified within Level 2 of the fair value hierarchy.
Equity securities are valued at the closing price reported on the
active market on which the individual securities are traded and as
such are classified within Level 1 of the fair value hierarchy.
FCX’s embedded derivatives on provisional copper concentrate,
copper cathode and gold purchases and sales are valued using
quoted market prices based on the forward LME or COMEX prices
(copper) and the London Bullion Market Association price (gold) and,
as such, are classified within Level 1 of the fair value hierarchy. FCX’s
embedded derivatives on provisional molybdenum purchases are
valued based on the latest average weekly Metals Week Molybdenum
Dealer Oxide prices and, as such, are classified within Level 1 of the
fair value hierarchy.
FCX’s derivative financial instruments for copper futures and swap
contracts and forward contracts are classified within Level 1 of
the fair value hierarchy because they are valued using quoted market
prices in active markets (refer to Note 15 for further discussion).
The carrying value for certain FCX financial instruments (i.e.,
accounts receivable, accounts payable and accrued liabilities,
dividends payable, and Rio Tinto share of joint venture cash flows)
approximate fair value and, therefore, have been excluded from
the table below. A summary of the carrying amount and fair value of
FCX’s other financial instruments as of December 31 follows:
2010 2009
Carrying Fair Carrying Fair Amount Value Amount Value
Cash and cash equivalentsa $ 3,738 $ 3,738 $ 2,656 $ 2,656MMR cost investmentb 500 623 — —Derivatives included in accounts receivablea 357 357 235 235Trust assets (current and long-term)a,c 148 148 146 146Available-for-sale securities (current and long-term)a,c 34 34 74 74Derivative assetsa,d 18 18 14 14Derivatives included in accounts payable and accrued liabilitiesa (125) (125) (70) (70)Debt (including amounts due within one year)e (4,755) (5,146) (6,346) (6,735)
a. Recorded at fair value.b. Recorded at cost and included in other assets. Fair value is based on a bid evaluation,
which is an estimated price at which a dealer would pay for a security.c. Current portion included in other current assets and long-term portion included in
other assets.d. Included in other current assets.e. Recorded at cost except for long-term debt acquired in the Phelps Dodge acquisition,
which was recorded at fair value at the acquisition date. Fair value of substantially all of FCX’s long-term debt is estimated based on quoted market prices.
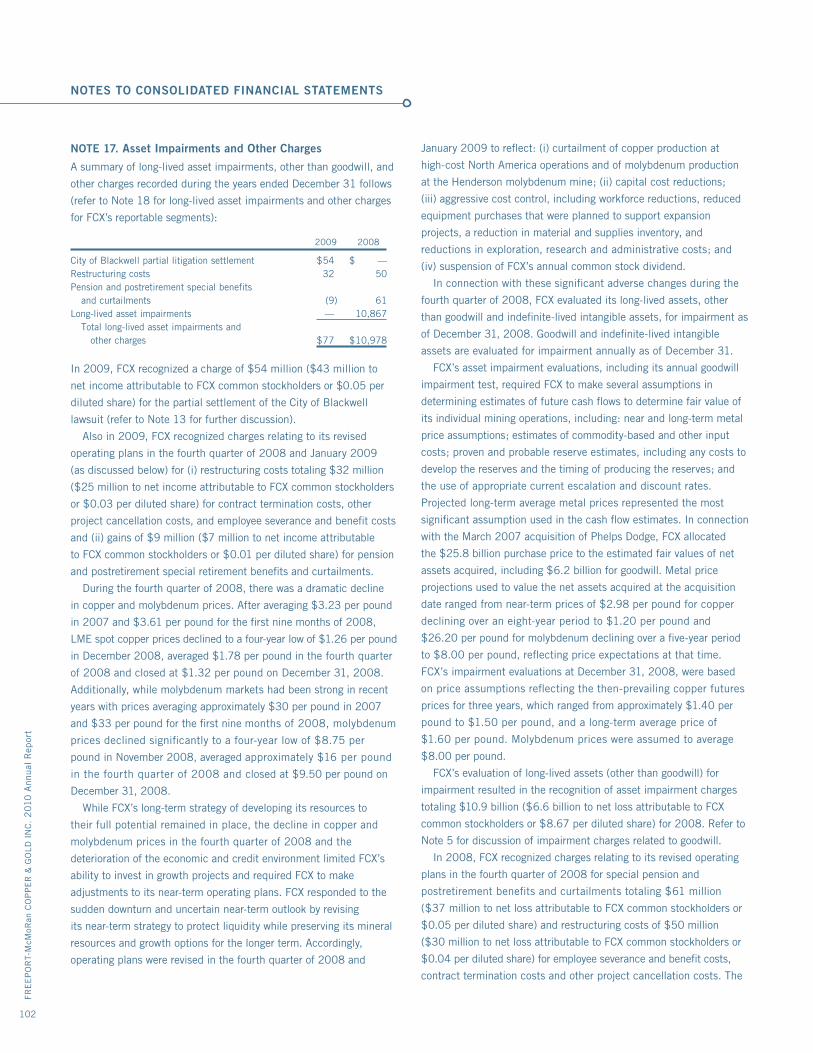
FRE
EP
OR
T-M
cMoR
an C
OP
PE
R &
GO
LD I
NC
. 2
010
Ann
ual
Rep
ort
102
NOTES TO CONSOLIDATED FINANCIAL STATEMENTS
NOTE 17. Asset Impairments and Other Charges
A summary of long-lived asset impairments, other than goodwill, and
other charges recorded during the years ended December 31 follows
(refer to Note 18 for long-lived asset impairments and other charges
for FCX’s reportable segments):
2009 2008
City of Blackwell partial litigation settlement $ 54 $ —Restructuring costs 32 50Pension and postretirement special benefits and curtailments (9) 61Long-lived asset impairments — 10,867 Total long-lived asset impairments and other charges $ 77 $ 10,978
In 2009, FCX recognized a charge of $54 million ($43 million to
net income attributable to FCX common stockholders or $0.05 per
diluted share) for the partial settlement of the City of Blackwell
lawsuit (refer to Note 13 for further discussion).
Also in 2009, FCX recognized charges relating to its revised
operating plans in the fourth quarter of 2008 and January 2009
(as discussed below) for (i) restructuring costs totaling $32 million
($25 million to net income attributable to FCX common stockholders
or $0.03 per diluted share) for contract termination costs, other
project cancellation costs, and employee severance and benefit costs
and (ii) gains of $9 million ($7 million to net income attributable
to FCX common stockholders or $0.01 per diluted share) for pension
and postretirement special retirement benefits and curtailments.
During the fourth quarter of 2008, there was a dramatic decline
in copper and molybdenum prices. After averaging $3.23 per pound
in 2007 and $3.61 per pound for the first nine months of 2008,
LME spot copper prices declined to a four-year low of $1.26 per pound
in December 2008, averaged $1.78 per pound in the fourth quarter
of 2008 and closed at $1.32 per pound on December 31, 2008.
Additionally, while molybdenum markets had been strong in recent
years with prices averaging approximately $30 per pound in 2007
and $33 per pound for the first nine months of 2008, molybdenum
prices declined significantly to a four-year low of $8.75 per
pound in November 2008, averaged approximately $16 per pound
in the fourth quarter of 2008 and closed at $9.50 per pound on
December 31, 2008.
While FCX’s long-term strategy of developing its resources to
their full potential remained in place, the decline in copper and
molybdenum prices in the fourth quarter of 2008 and the
deterioration of the economic and credit environment limited FCX’s
ability to invest in growth projects and required FCX to make
adjustments to its near-term operating plans. FCX responded to the
sudden downturn and uncertain near-term outlook by revising
its near-term strategy to protect liquidity while preserving its mineral
resources and growth options for the longer term. Accordingly,
operating plans were revised in the fourth quarter of 2008 and
January 2009 to reflect: (i) curtailment of copper production at
high-cost North America operations and of molybdenum production
at the Henderson molybdenum mine; (ii) capital cost reductions;
(iii) aggressive cost control, including workforce reductions, reduced
equipment purchases that were planned to support expansion
projects, a reduction in material and supplies inventory, and
reductions in exploration, research and administrative costs; and
(iv) suspension of FCX’s annual common stock dividend.
In connection with these significant adverse changes during the
fourth quarter of 2008, FCX evaluated its long-lived assets, other
than goodwill and indefinite-lived intangible assets, for impairment as
of December 31, 2008. Goodwill and indefinite-lived intangible
assets are evaluated for impairment annually as of December 31.
FCX’s asset impairment evaluations, including its annual goodwill
impairment test, required FCX to make several assumptions in
determining estimates of future cash flows to determine fair value of
its individual mining operations, including: near and long-term metal
price assumptions; estimates of commodity-based and other input
costs; proven and probable reserve estimates, including any costs to
develop the reserves and the timing of producing the reserves; and
the use of appropriate current escalation and discount rates.
Projected long-term average metal prices represented the most
significant assumption used in the cash flow estimates. In connection
with the March 2007 acquisition of Phelps Dodge, FCX allocated
the $25.8 billion purchase price to the estimated fair values of net
assets acquired, including $6.2 billion for goodwill. Metal price
projections used to value the net assets acquired at the acquisition
date ranged from near-term prices of $2.98 per pound for copper
declining over an eight-year period to $1.20 per pound and
$26.20 per pound for molybdenum declining over a five-year period
to $8.00 per pound, reflecting price expectations at that time.
FCX’s impairment evaluations at December 31, 2008, were based
on price assumptions reflecting the then-prevailing copper futures
prices for three years, which ranged from approximately $1.40 per
pound to $1.50 per pound, and a long-term average price of
$1.60 per pound. Molybdenum prices were assumed to average
$8.00 per pound.
FCX’s evaluation of long-lived assets (other than goodwill) for
impairment resulted in the recognition of asset impairment charges
totaling $10.9 billion ($6.6 billion to net loss attributable to FCX
common stockholders or $8.67 per diluted share) for 2008. Refer to
Note 5 for discussion of impairment charges related to goodwill.
In 2008, FCX recognized charges relating to its revised operating
plans in the fourth quarter of 2008 for special pension and
postretirement benefits and curtailments totaling $61 million
($37 million to net loss attributable to FCX common stockholders or
$0.05 per diluted share) and restructuring costs of $50 million
($30 million to net loss attributable to FCX common stockholders or
$0.04 per diluted share) for employee severance and benefit costs,
contract termination costs and other project cancellation costs. The
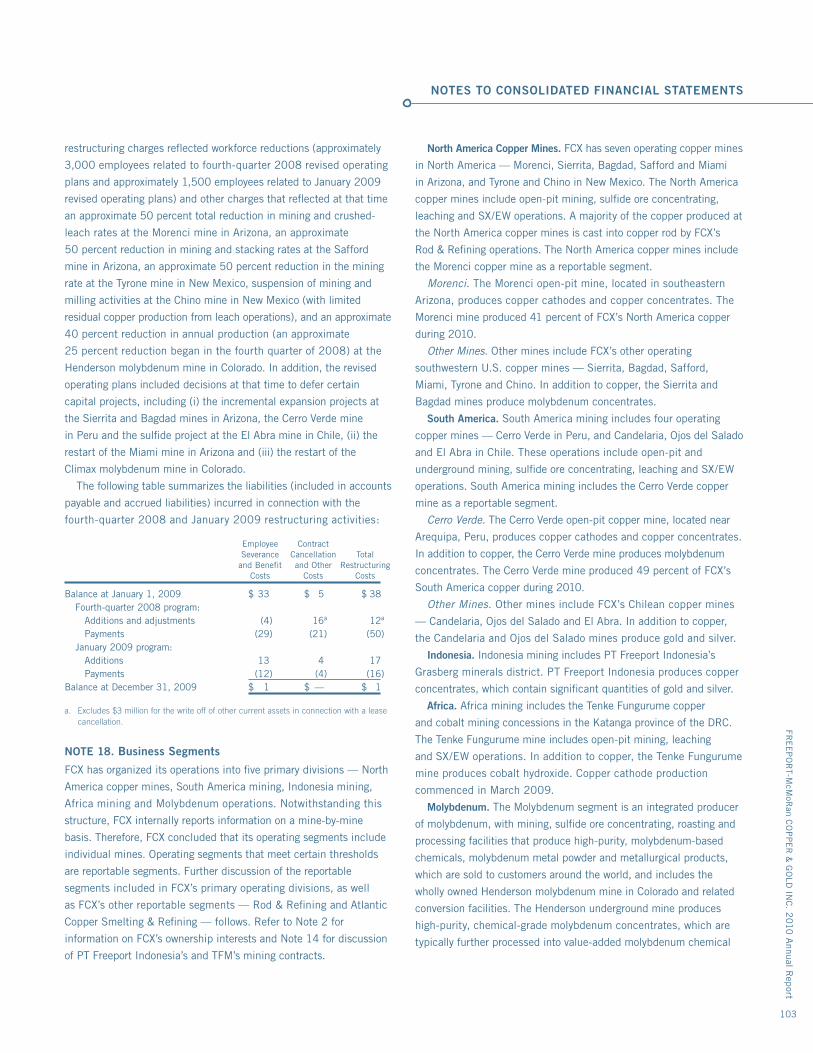
FRE
EP
OR
T-McM
oRan C
OP
PE
R &
GO
LD IN
C. 2
010 A
nnual Rep
ort
103
NOTES TO CONSOLIDATED FINANCIAL STATEMENTS
restructuring charges reflected workforce reductions (approximately
3,000 employees related to fourth-quarter 2008 revised operating
plans and approximately 1,500 employees related to January 2009
revised operating plans) and other charges that reflected at that time
an approximate 50 percent total reduction in mining and crushed-
leach rates at the Morenci mine in Arizona, an approximate
50 percent reduction in mining and stacking rates at the Safford
mine in Arizona, an approximate 50 percent reduction in the mining
rate at the Tyrone mine in New Mexico, suspension of mining and
milling activities at the Chino mine in New Mexico (with limited
residual copper production from leach operations), and an approximate
40 percent reduction in annual production (an approximate
25 percent reduction began in the fourth quarter of 2008) at the
Henderson molybdenum mine in Colorado. In addition, the revised
operating plans included decisions at that time to defer certain
capital projects, including (i) the incremental expansion projects at
the Sierrita and Bagdad mines in Arizona, the Cerro Verde mine
in Peru and the sulfide project at the El Abra mine in Chile, (ii) the
restart of the Miami mine in Arizona and (iii) the restart of the
Climax molybdenum mine in Colorado.
The following table summarizes the liabilities (included in accounts
payable and accrued liabilities) incurred in connection with the
fourth-quarter 2008 and January 2009 restructuring activities:
Employee Contract Severance Cancellation Total and Benefit and Other Restructuring Costs Costs Costs
Balance at January 1, 2009 $ 33 $ 5 $ 38 Fourth-quarter 2008 program: Additions and adjustments (4) 16a 12a
Payments (29) (21) (50) January 2009 program: Additions 13 4 17 Payments (12) (4) (16)Balance at December 31, 2009 $ 1 $ — $ 1
a. Excludes $3 million for the write off of other current assets in connection with a lease cancellation.
NOTE 18. Business Segments
FCX has organized its operations into five primary divisions — North
America copper mines, South America mining, Indonesia mining,
Africa mining and Molybdenum operations. Notwithstanding this
structure, FCX internally reports information on a mine-by-mine
basis. Therefore, FCX concluded that its operating segments include
individual mines. Operating segments that meet certain thresholds
are reportable segments. Further discussion of the reportable
segments included in FCX’s primary operating divisions, as well
as FCX’s other reportable segments — Rod & Refining and Atlantic
Copper Smelting & Refining — follows. Refer to Note 2 for
information on FCX’s ownership interests and Note 14 for discussion
of PT Freeport Indonesia’s and TFM’s mining contracts.
North America Copper Mines. FCX has seven operating copper mines
in North America — Morenci, Sierrita, Bagdad, Safford and Miami
in Arizona, and Tyrone and Chino in New Mexico. The North America
copper mines include open-pit mining, sulfide ore concentrating,
leaching and SX/EW operations. A majority of the copper produced at
the North America copper mines is cast into copper rod by FCX’s
Rod & Refining operations. The North America copper mines include
the Morenci copper mine as a reportable segment.
Morenci. The Morenci open-pit mine, located in southeastern
Arizona, produces copper cathodes and copper concentrates. The
Morenci mine produced 41 percent of FCX’s North America copper
during 2010.
Other Mines. Other mines include FCX’s other operating
southwestern U.S. copper mines — Sierrita, Bagdad, Safford,
Miami, Tyrone and Chino. In addition to copper, the Sierrita and
Bagdad mines produce molybdenum concentrates.
South America. South America mining includes four operating
copper mines — Cerro Verde in Peru, and Candelaria, Ojos del Salado
and El Abra in Chile. These operations include open-pit and
underground mining, sulfide ore concentrating, leaching and SX/EW
operations. South America mining includes the Cerro Verde copper
mine as a reportable segment.
Cerro Verde. The Cerro Verde open-pit copper mine, located near
Arequipa, Peru, produces copper cathodes and copper concentrates.
In addition to copper, the Cerro Verde mine produces molybdenum
concentrates. The Cerro Verde mine produced 49 percent of FCX’s
South America copper during 2010.
Other Mines. Other mines include FCX’s Chilean copper mines
— Candelaria, Ojos del Salado and El Abra. In addition to copper,
the Candelaria and Ojos del Salado mines produce gold and silver.
Indonesia. Indonesia mining includes PT Freeport Indonesia’s
Grasberg minerals district. PT Freeport Indonesia produces copper
concentrates, which contain significant quantities of gold and silver.
Africa. Africa mining includes the Tenke Fungurume copper
and cobalt mining concessions in the Katanga province of the DRC.
The Tenke Fungurume mine includes open-pit mining, leaching
and SX/EW operations. In addition to copper, the Tenke Fungurume
mine produces cobalt hydroxide. Copper cathode production
commenced in March 2009.
Molybdenum. The Molybdenum segment is an integrated producer
of molybdenum, with mining, sulfide ore concentrating, roasting and
processing facilities that produce high-purity, molybdenum-based
chemicals, molybdenum metal powder and metallurgical products,
which are sold to customers around the world, and includes the
wholly owned Henderson molybdenum mine in Colorado and related
conversion facilities. The Henderson underground mine produces
high-purity, chemical-grade molybdenum concentrates, which are
typically further processed into value-added molybdenum chemical
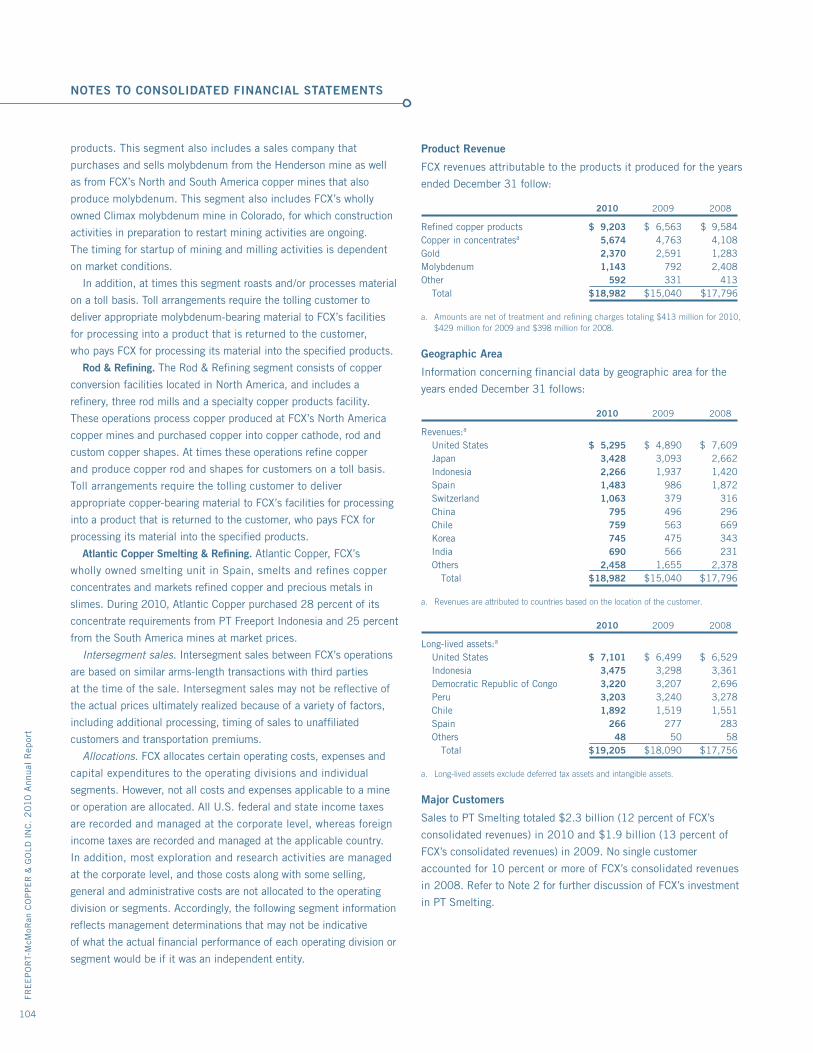
FRE
EP
OR
T-M
cMoR
an C
OP
PE
R &
GO
LD I
NC
. 2
010
Ann
ual
Rep
ort
104
NOTES TO CONSOLIDATED FINANCIAL STATEMENTS
products. This segment also includes a sales company that
purchases and sells molybdenum from the Henderson mine as well
as from FCX’s North and South America copper mines that also
produce molybdenum. This segment also includes FCX’s wholly
owned Climax molybdenum mine in Colorado, for which construction
activities in preparation to restart mining activities are ongoing.
The timing for startup of mining and milling activities is dependent
on market conditions.
In addition, at times this segment roasts and/or processes material
on a toll basis. Toll arrangements require the tolling customer to
deliver appropriate molybdenum-bearing material to FCX’s facilities
for processing into a product that is returned to the customer,
who pays FCX for processing its material into the specified products.
Rod & Refining. The Rod & Refining segment consists of copper
conversion facilities located in North America, and includes a
refinery, three rod mills and a specialty copper products facility.
These operations process copper produced at FCX’s North America
copper mines and purchased copper into copper cathode, rod and
custom copper shapes. At times these operations refine copper
and produce copper rod and shapes for customers on a toll basis.
Toll arrangements require the tolling customer to deliver
appropriate copper-bearing material to FCX’s facilities for processing
into a product that is returned to the customer, who pays FCX for
processing its material into the specified products.
Atlantic Copper Smelting & Refining. Atlantic Copper, FCX’s
wholly owned smelting unit in Spain, smelts and refines copper
concentrates and markets refined copper and precious metals in
slimes. During 2010, Atlantic Copper purchased 28 percent of its
concentrate requirements from PT Freeport Indonesia and 25 percent
from the South America mines at market prices.
Intersegment sales. Intersegment sales between FCX’s operations
are based on similar arms-length transactions with third parties
at the time of the sale. Intersegment sales may not be reflective of
the actual prices ultimately realized because of a variety of factors,
including additional processing, timing of sales to unaffiliated
customers and transportation premiums.
Allocations. FCX allocates certain operating costs, expenses and
capital expenditures to the operating divisions and individual
segments. However, not all costs and expenses applicable to a mine
or operation are allocated. All U.S. federal and state income taxes
are recorded and managed at the corporate level, whereas foreign
income taxes are recorded and managed at the applicable country.
In addition, most exploration and research activities are managed
at the corporate level, and those costs along with some selling,
general and administrative costs are not allocated to the operating
division or segments. Accordingly, the following segment information
reflects management determinations that may not be indicative
of what the actual financial performance of each operating division or
segment would be if it was an independent entity.
Product Revenue
FCX revenues attributable to the products it produced for the years
ended December 31 follow:
2010 2009 2008
Refined copper products $ 9,203 $ 6,563 $ 9,584Copper in concentratesa 5,674 4,763 4,108Gold 2,370 2,591 1,283Molybdenum 1,143 792 2,408Other 592 331 413 Total $ 18,982 $ 15,040 $ 17,796
a. Amounts are net of treatment and refining charges totaling $413 million for 2010, $429 million for 2009 and $398 million for 2008.
Geographic Area
Information concerning financial data by geographic area for the
years ended December 31 follows:
2010 2009 2008
Revenues:a
United States $ 5,295 $ 4,890 $ 7,609 Japan 3,428 3,093 2,662 Indonesia 2,266 1,937 1,420 Spain 1,483 986 1,872 Switzerland 1,063 379 316 China 795 496 296 Chile 759 563 669 Korea 745 475 343 India 690 566 231 Others 2,458 1,655 2,378 Total $ 18,982 $ 15,040 $ 17,796
a. Revenues are attributed to countries based on the location of the customer.
2010 2009 2008
Long-lived assets:a
United States $ 7,101 $ 6,499 $ 6,529 Indonesia 3,475 3,298 3,361 Democratic Republic of Congo 3,220 3,207 2,696 Peru 3,203 3,240 3,278 Chile 1,892 1,519 1,551 Spain 266 277 283 Others 48 50 58 Total $ 19,205 $ 18,090 $ 17,756
a. Long-lived assets exclude deferred tax assets and intangible assets.
Major Customers
Sales to PT Smelting totaled $2.3 billion (12 percent of FCX’s
consolidated revenues) in 2010 and $1.9 billion (13 percent of
FCX’s consolidated revenues) in 2009. No single customer
accounted for 10 percent or more of FCX’s consolidated revenues
in 2008. Refer to Note 2 for further discussion of FCX’s investment
in PT Smelting.
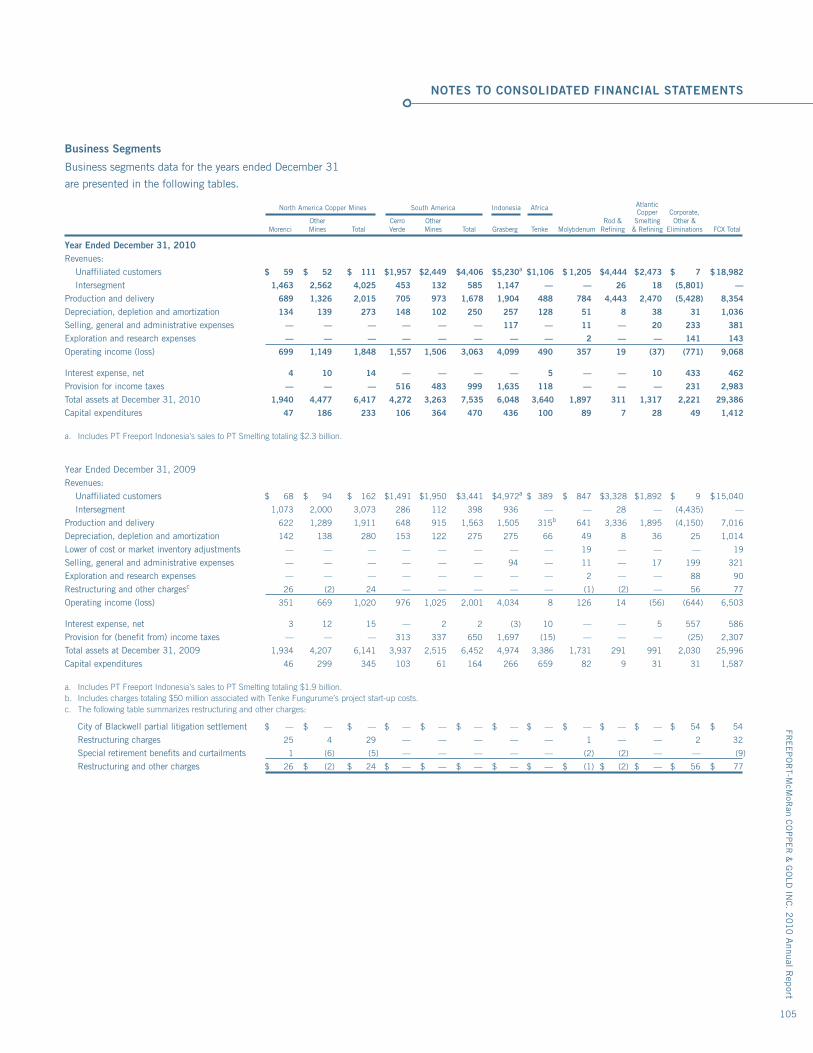
FRE
EP
OR
T-McM
oRan C
OP
PE
R &
GO
LD IN
C. 2
010 A
nnual Rep
ort
105
NOTES TO CONSOLIDATED FINANCIAL STATEMENTS
Business Segments
Business segments data for the years ended December 31
are presented in the following tables.
North America Copper Mines South America Indonesia Africa Atlantic Copper Corporate, Other Cerro Other Rod & Smelting Other & Morenci Mines Total Verde Mines Total Grasberg Tenke Molybdenum Refining & Refining Eliminations FCX Total
Year Ended December 31, 2010Revenues: Unaffiliated customers $ 59 $ 52 $ 111 $ 1,957 $ 2,449 $ 4,406 $ 5,230a $ 1,106 $ 1,205 $ 4,444 $ 2,473 $ 7 $ 18,982
Intersegment 1,463 2,562 4,025 453 132 585 1,147 — — 26 18 (5,801) —
Production and delivery 689 1,326 2,015 705 973 1,678 1,904 488 784 4,443 2,470 (5,428) 8,354
Depreciation, depletion and amortization 134 139 273 148 102 250 257 128 51 8 38 31 1,036
Selling, general and administrative expenses — — — — — — 117 — 11 — 20 233 381
Exploration and research expenses — — — — — — — — 2 — — 141 143
Operating income (loss) 699 1,149 1,848 1,557 1,506 3,063 4,099 490 357 19 (37) (771) 9,068
Interest expense, net 4 10 14 — — — — 5 — — 10 433 462
Provision for income taxes — — — 516 483 999 1,635 118 — — — 231 2,983
Total assets at December 31, 2010 1,940 4,477 6,417 4,272 3,263 7,535 6,048 3,640 1,897 311 1,317 2,221 29,386
Capital expenditures 47 186 233 106 364 470 436 100 89 7 28 49 1,412
a. Includes PT Freeport Indonesia’s sales to PT Smelting totaling $2.3 billion.
Year Ended December 31, 2009Revenues: Unaffiliated customers $ 68 $ 94 $ 162 $ 1,491 $ 1,950 $ 3,441 $ 4,972a $ 389 $ 847 $ 3,328 $ 1,892 $ 9 $ 15,040
Intersegment 1,073 2,000 3,073 286 112 398 936 — — 28 — (4,435) —
Production and delivery 622 1,289 1,911 648 915 1,563 1,505 315b 641 3,336 1,895 (4,150) 7,016
Depreciation, depletion and amortization 142 138 280 153 122 275 275 66 49 8 36 25 1,014
Lower of cost or market inventory adjustments — — — — — — — — 19 — — — 19
Selling, general and administrative expenses — — — — — — 94 — 11 — 17 199 321
Exploration and research expenses — — — — — — — — 2 — — 88 90
Restructuring and other chargesc 26 (2) 24 — — — — — (1) (2) — 56 77
Operating income (loss) 351 669 1,020 976 1,025 2,001 4,034 8 126 14 (56) (644) 6,503
Interest expense, net 3 12 15 — 2 2 (3) 10 — — 5 557 586
Provision for (benefit from) income taxes — — — 313 337 650 1,697 (15) — — — (25) 2,307
Total assets at December 31, 2009 1,934 4,207 6,141 3,937 2,515 6,452 4,974 3,386 1,731 291 991 2,030 25,996
Capital expenditures 46 299 345 103 61 164 266 659 82 9 31 31 1,587
a. Includes PT Freeport Indonesia’s sales to PT Smelting totaling $1.9 billion.b. Includes charges totaling $50 million associated with Tenke Fungurume’s project start-up costs.c. The following table summarizes restructuring and other charges:
City of Blackwell partial litigation settlement $ — $ — $ — $ — $ — $ — $ — $ — $ — $ — $ — $ 54 $ 54
Restructuring charges 25 4 29 — — — — — 1 — — 2 32
Special retirement benefits and curtailments 1 (6) (5) — — — — — (2) (2) — — (9)
Restructuring and other charges $ 26 $ (2) $ 24 $ — $ — $ — $ — $ — $ (1) $ (2) $ — $ 56 $ 77
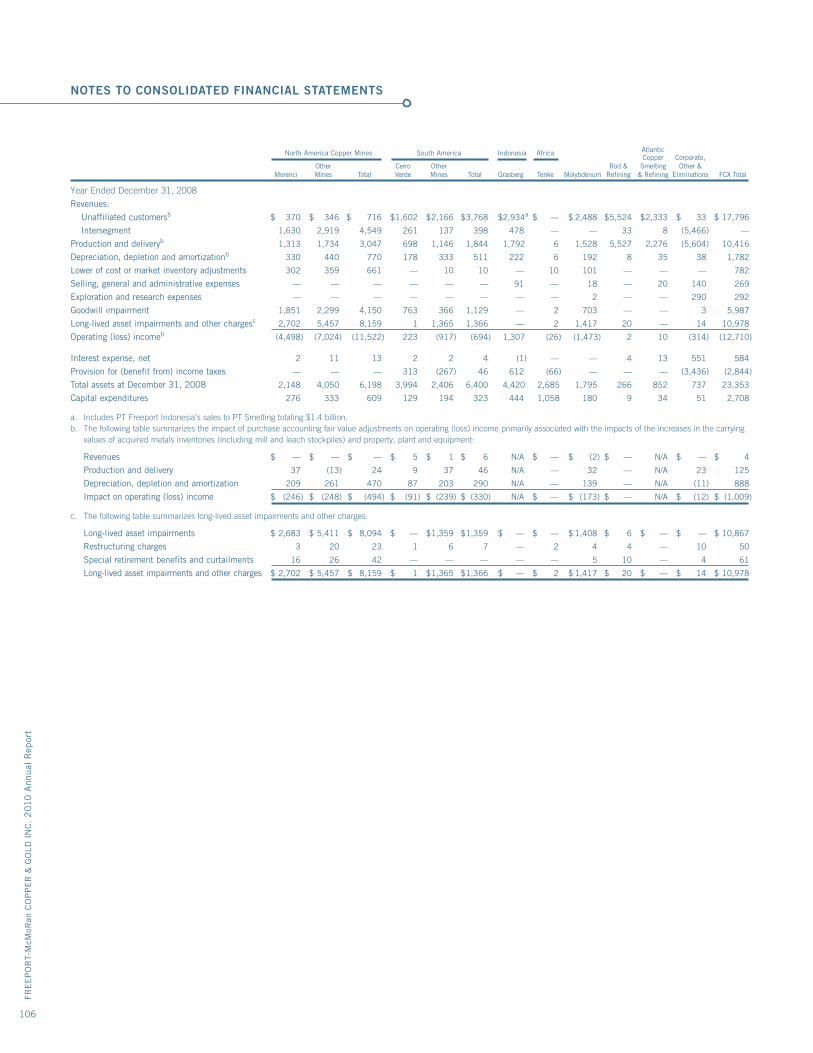
FRE
EP
OR
T-M
cMoR
an C
OP
PE
R &
GO
LD I
NC
. 2
010
Ann
ual
Rep
ort
106
North America Copper Mines South America Indonesia Africa Atlantic Copper Corporate, Other Cerro Other Rod & Smelting Other & Morenci Mines Total Verde Mines Total Grasberg Tenke Molybdenum Refining & Refining Eliminations FCX Total
Year Ended December 31, 2008Revenues: Unaffiliated customersb $ 370 $ 346 $ 716 $ 1,602 $ 2,166 $ 3,768 $ 2,934a $ — $ 2,488 $ 5,524 $ 2,333 $ 33 $ 17,796
Intersegment 1,630 2,919 4,549 261 137 398 478 — — 33 8 (5,466) —
Production and deliveryb 1,313 1,734 3,047 698 1,146 1,844 1,792 6 1,528 5,527 2,276 (5,604) 10,416
Depreciation, depletion and amortizationb 330 440 770 178 333 511 222 6 192 8 35 38 1,782
Lower of cost or market inventory adjustments 302 359 661 — 10 10 — 10 101 — — — 782
Selling, general and administrative expenses — — — — — — 91 — 18 — 20 140 269
Exploration and research expenses — — — — — — — — 2 — — 290 292
Goodwill impairment 1,851 2,299 4,150 763 366 1,129 — 2 703 — — 3 5,987
Long-lived asset impairments and other chargesc 2,702 5,457 8,159 1 1,365 1,366 — 2 1,417 20 — 14 10,978
Operating (loss) incomeb (4,498) (7,024) (11,522) 223 (917) (694) 1,307 (26) (1,473) 2 10 (314) (12,710)
Interest expense, net 2 11 13 2 2 4 (1) — — 4 13 551 584
Provision for (benefit from) income taxes — — — 313 (267) 46 612 (66) — — — (3,436) (2,844)
Total assets at December 31, 2008 2,148 4,050 6,198 3,994 2,406 6,400 4,420 2,685 1,795 266 852 737 23,353
Capital expenditures 276 333 609 129 194 323 444 1,058 180 9 34 51 2,708
a. Includes PT Freeport Indonesia’s sales to PT Smelting totaling $1.4 billion.b. The following table summarizes the impact of purchase accounting fair value adjustments on operating (loss) income primarily associated with the impacts of the increases in the carrying
values of acquired metals inventories (including mill and leach stockpiles) and property, plant and equipment:
Revenues $ — $ — $ — $ 5 $ 1 $ 6 N/A $ — $ (2) $ — N/A $ — $ 4
Production and delivery 37 (13) 24 9 37 46 N/A — 32 — N/A 23 125
Depreciation, depletion and amortization 209 261 470 87 203 290 N/A — 139 — N/A (11) 888
Impact on operating (loss) income $ (246) $ (248) $ (494) $ (91) $ (239) $ (330) N/A $ — $ (173) $ — N/A $ (12) $ (1,009)
c. The following table summarizes long-lived asset impairments and other charges:
Long-lived asset impairments $ 2,683 $ 5,411 $ 8,094 $ — $ 1,359 $ 1,359 $ — $ — $ 1,408 $ 6 $ — $ — $ 10,867
Restructuring charges 3 20 23 1 6 7 — 2 4 4 — 10 50
Special retirement benefits and curtailments 16 26 42 — — — — — 5 10 — 4 61
Long-lived asset impairments and other charges $ 2,702 $ 5,457 $ 8,159 $ 1 $ 1,365 $ 1,366 $ — $ 2 $ 1,417 $ 20 $ — $ 14 $ 10,978
NOTES TO CONSOLIDATED FINANCIAL STATEMENTS
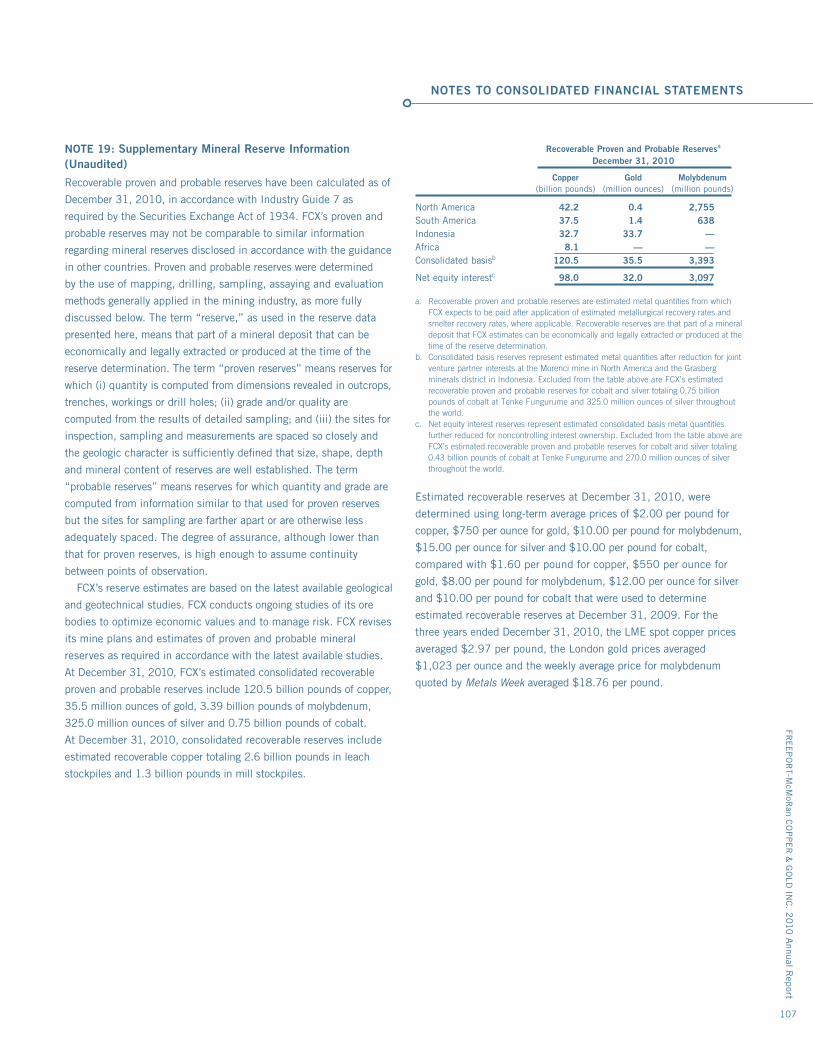
FRE
EP
OR
T-McM
oRan C
OP
PE
R &
GO
LD IN
C. 2
010 A
nnual Rep
ort
107
NOTES TO CONSOLIDATED FINANCIAL STATEMENTS
NOTE 19: Supplementary Mineral Reserve Information (Unaudited)
Recoverable proven and probable reserves have been calculated as of
December 31, 2010, in accordance with Industry Guide 7 as
required by the Securities Exchange Act of 1934. FCX’s proven and
probable reserves may not be comparable to similar information
regarding mineral reserves disclosed in accordance with the guidance
in other countries. Proven and probable reserves were determined
by the use of mapping, drilling, sampling, assaying and evaluation
methods generally applied in the mining industry, as more fully
discussed below. The term “reserve,” as used in the reserve data
presented here, means that part of a mineral deposit that can be
economically and legally extracted or produced at the time of the
reserve determination. The term “proven reserves” means reserves for
which (i) quantity is computed from dimensions revealed in outcrops,
trenches, workings or drill holes; (ii) grade and/or quality are
computed from the results of detailed sampling; and (iii) the sites for
inspection, sampling and measurements are spaced so closely and
the geologic character is sufficiently defined that size, shape, depth
and mineral content of reserves are well established. The term
“probable reserves” means reserves for which quantity and grade are
computed from information similar to that used for proven reserves
but the sites for sampling are farther apart or are otherwise less
adequately spaced. The degree of assurance, although lower than
that for proven reserves, is high enough to assume continuity
between points of observation.
FCX’s reserve estimates are based on the latest available geological
and geotechnical studies. FCX conducts ongoing studies of its ore
bodies to optimize economic values and to manage risk. FCX revises
its mine plans and estimates of proven and probable mineral
reserves as required in accordance with the latest available studies.
At December 31, 2010, FCX’s estimated consolidated recoverable
proven and probable reserves include 120.5 billion pounds of copper,
35.5 million ounces of gold, 3.39 billion pounds of molybdenum,
325.0 million ounces of silver and 0.75 billion pounds of cobalt.
At December 31, 2010, consolidated recoverable reserves include
estimated recoverable copper totaling 2.6 billion pounds in leach
stockpiles and 1.3 billion pounds in mill stockpiles.
Recoverable Proven and Probable Reservesa December 31, 2010
Copper Gold Molybdenum (billion pounds) (million ounces) (million pounds)
North America 42.2 0.4 2,755South America 37.5 1.4 638Indonesia 32.7 33.7 —Africa 8.1 — —Consolidated basisb 120.5 35.5 3,393
Net equity interestc 98.0 32.0 3,097
a. Recoverable proven and probable reserves are estimated metal quantities from which FCX expects to be paid after application of estimated metallurgical recovery rates and smelter recovery rates, where applicable. Recoverable reserves are that part of a mineral deposit that FCX estimates can be economically and legally extracted or produced at the time of the reserve determination.
b. Consolidated basis reserves represent estimated metal quantities after reduction for joint venture partner interests at the Morenci mine in North America and the Grasberg minerals district in Indonesia. Excluded from the table above are FCX’s estimated recoverable proven and probable reserves for cobalt and silver totaling 0.75 billion pounds of cobalt at Tenke Fungurume and 325.0 million ounces of silver throughout the world.
c. Net equity interest reserves represent estimated consolidated basis metal quantities further reduced for noncontrolling interest ownership. Excluded from the table above are FCX’s estimated recoverable proven and probable reserves for cobalt and silver totaling 0.43 billion pounds of cobalt at Tenke Fungurume and 270.0 million ounces of silver throughout the world.
Estimated recoverable reserves at December 31, 2010, were
determined using long-term average prices of $2.00 per pound for
copper, $750 per ounce for gold, $10.00 per pound for molybdenum,
$15.00 per ounce for silver and $10.00 per pound for cobalt,
compared with $1.60 per pound for copper, $550 per ounce for
gold, $8.00 per pound for molybdenum, $12.00 per ounce for silver
and $10.00 per pound for cobalt that were used to determine
estimated recoverable reserves at December 31, 2009. For the
three years ended December 31, 2010, the LME spot copper prices
averaged $2.97 per pound, the London gold prices averaged
$1,023 per ounce and the weekly average price for molybdenum
quoted by Metals Week averaged $18.76 per pound.
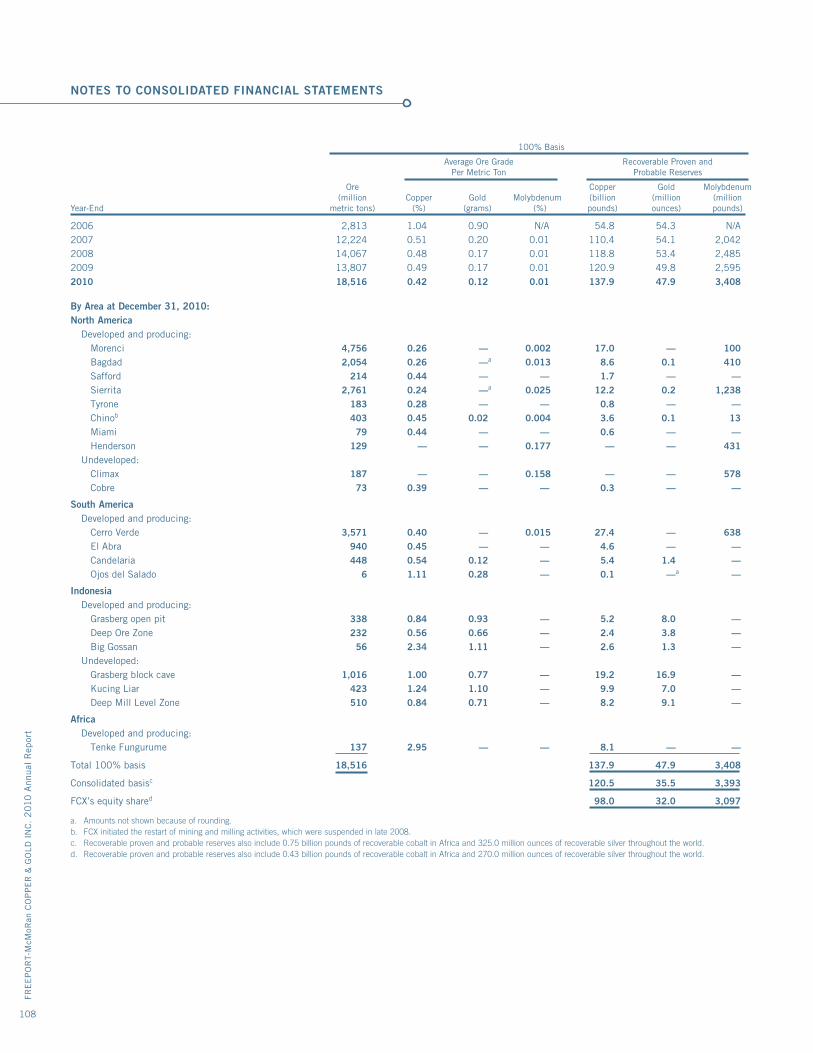
FRE
EP
OR
T-M
cMoR
an C
OP
PE
R &
GO
LD I
NC
. 2
010
Ann
ual
Rep
ort
108
100% Basis
Average Ore Grade Recoverable Proven and Per Metric Ton Probable Reserves
Ore Copper Gold Molybdenum (million Copper Gold Molybdenum (billion (million (millionYear-End metric tons) (%) (grams) (%) pounds) ounces) pounds)
2006 2,813 1.04 0.90 N/A 54.8 54.3 N/A2007 12,224 0.51 0.20 0.01 110.4 54.1 2,0422008 14,067 0.48 0.17 0.01 118.8 53.4 2,4852009 13,807 0.49 0.17 0.01 120.9 49.8 2,5952010 18,516 0.42 0.12 0.01 137.9 47.9 3,408
By Area at December 31, 2010:North America Developed and producing: Morenci 4,756 0.26 — 0.002 17.0 — 100 Bagdad 2,054 0.26 —a 0.013 8.6 0.1 410 Safford 214 0.44 — — 1.7 — — Sierrita 2,761 0.24 —a 0.025 12.2 0.2 1,238 Tyrone 183 0.28 — — 0.8 — — Chinob 403 0.45 0.02 0.004 3.6 0.1 13 Miami 79 0.44 — — 0.6 — — Henderson 129 — — 0.177 — — 431 Undeveloped: Climax 187 — — 0.158 — — 578 Cobre 73 0.39 — — 0.3 — —
South America Developed and producing: Cerro Verde 3,571 0.40 — 0.015 27.4 — 638 El Abra 940 0.45 — — 4.6 — — Candelaria 448 0.54 0.12 — 5.4 1.4 — Ojos del Salado 6 1.11 0.28 — 0.1 —a —
Indonesia Developed and producing: Grasberg open pit 338 0.84 0.93 — 5.2 8.0 — Deep Ore Zone 232 0.56 0.66 — 2.4 3.8 — Big Gossan 56 2.34 1.11 — 2.6 1.3 — Undeveloped: Grasberg block cave 1,016 1.00 0.77 — 19.2 16.9 — Kucing Liar 423 1.24 1.10 — 9.9 7.0 — Deep Mill Level Zone 510 0.84 0.71 — 8.2 9.1 —
Africa Developed and producing: Tenke Fungurume 137 2.95 — — 8.1 — —
Total 100% basis 18,516 137.9 47.9 3,408
Consolidated basisc 120.5 35.5 3,393
FCX’s equity shared 98.0 32.0 3,097
a. Amounts not shown because of rounding.b. FCX initiated the restart of mining and milling activities, which were suspended in late 2008.c. Recoverable proven and probable reserves also include 0.75 billion pounds of recoverable cobalt in Africa and 325.0 million ounces of recoverable silver throughout the world.d. Recoverable proven and probable reserves also include 0.43 billion pounds of recoverable cobalt in Africa and 270.0 million ounces of recoverable silver throughout the world.
NOTES TO CONSOLIDATED FINANCIAL STATEMENTS
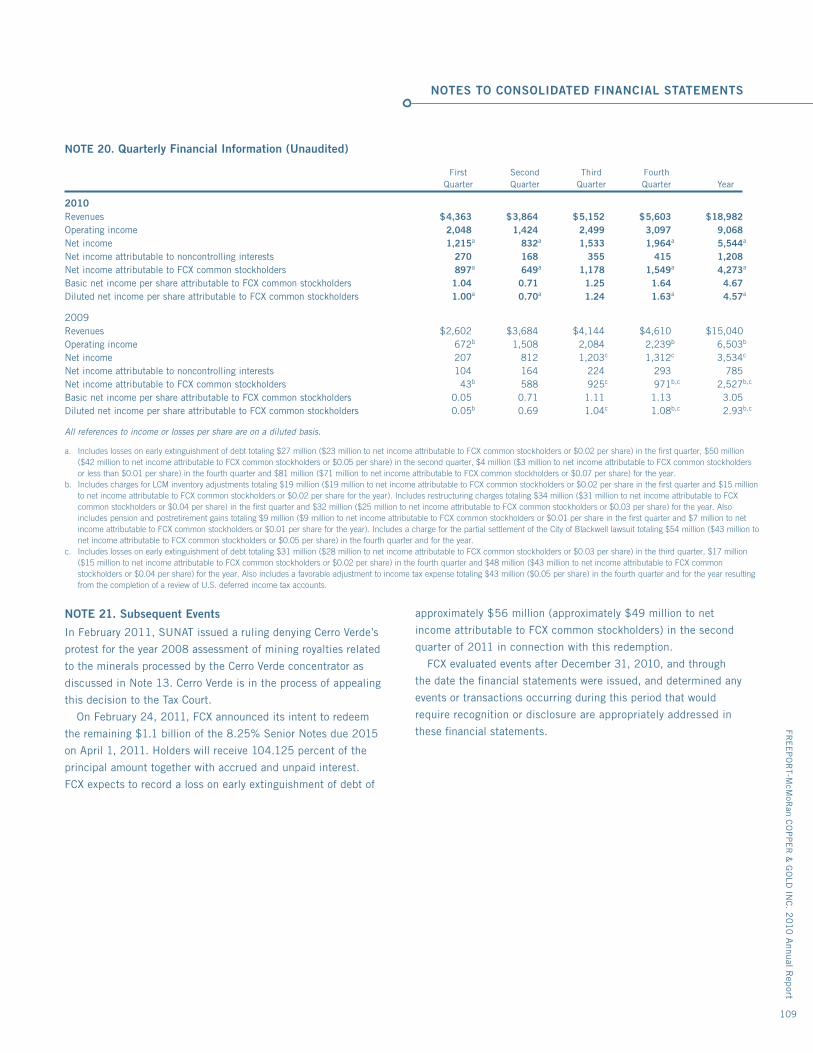
FRE
EP
OR
T-McM
oRan C
OP
PE
R &
GO
LD IN
C. 2
010 A
nnual Rep
ort
109
NOTES TO CONSOLIDATED FINANCIAL STATEMENTS
NOTE 20. Quarterly Financial Information (Unaudited)
First Second Third Fourth Quarter Quarter Quarter Quarter Year
2010Revenues $ 4,363 $ 3,864 $ 5,152 $ 5,603 $ 18,982Operating income 2,048 1,424 2,499 3,097 9,068Net income 1,215a 832a 1,533 1,964a 5,544a
Net income attributable to noncontrolling interests 270 168 355 415 1,208Net income attributable to FCX common stockholders 897a 649a 1,178 1,549a 4,273a
Basic net income per share attributable to FCX common stockholders 1.04 0.71 1.25 1.64 4.67Diluted net income per share attributable to FCX common stockholders 1.00a 0.70a 1.24 1.63a 4.57a
2009Revenues $ 2,602 $ 3,684 $ 4,144 $ 4,610 $ 15,040Operating income 672b 1,508 2,084 2,239b 6,503b
Net income 207 812 1,203c 1,312c 3,534c
Net income attributable to noncontrolling interests 104 164 224 293 785Net income attributable to FCX common stockholders 43b 588 925c 971b,c 2,527b,c
Basic net income per share attributable to FCX common stockholders 0.05 0.71 1.11 1.13 3.05Diluted net income per share attributable to FCX common stockholders 0.05b 0.69 1.04c 1.08b,c 2.93b,c
All references to income or losses per share are on a diluted basis.
a. Includes losses on early extinguishment of debt totaling $27 million ($23 million to net income attributable to FCX common stockholders or $0.02 per share) in the first quarter, $50 million ($42 million to net income attributable to FCX common stockholders or $0.05 per share) in the second quarter, $4 million ($3 million to net income attributable to FCX common stockholders or less than $0.01 per share) in the fourth quarter and $81 million ($71 million to net income attributable to FCX common stockholders or $0.07 per share) for the year.
b. Includes charges for LCM inventory adjustments totaling $19 million ($19 million to net income attributable to FCX common stockholders or $0.02 per share in the first quarter and $15 million to net income attributable to FCX common stockholders or $0.02 per share for the year). Includes restructuring charges totaling $34 million ($31 million to net income attributable to FCX common stockholders or $0.04 per share) in the first quarter and $32 million ($25 million to net income attributable to FCX common stockholders or $0.03 per share) for the year. Also includes pension and postretirement gains totaling $9 million ($9 million to net income attributable to FCX common stockholders or $0.01 per share in the first quarter and $7 million to net income attributable to FCX common stockholders or $0.01 per share for the year). Includes a charge for the partial settlement of the City of Blackwell lawsuit totaling $54 million ($43 million to net income attributable to FCX common stockholders or $0.05 per share) in the fourth quarter and for the year.
c. Includes losses on early extinguishment of debt totaling $31 million ($28 million to net income attributable to FCX common stockholders or $0.03 per share) in the third quarter, $17 million ($15 million to net income attributable to FCX common stockholders or $0.02 per share) in the fourth quarter and $48 million ($43 million to net income attributable to FCX common stockholders or $0.04 per share) for the year. Also includes a favorable adjustment to income tax expense totaling $43 million ($0.05 per share) in the fourth quarter and for the year resulting from the completion of a review of U.S. deferred income tax accounts.
NOTE 21. Subsequent Events
In February 2011, SUNAT issued a ruling denying Cerro Verde’s
protest for the year 2008 assessment of mining royalties related
to the minerals processed by the Cerro Verde concentrator as
discussed in Note 13. Cerro Verde is in the process of appealing
this decision to the Tax Court.
On February 24, 2011, FCX announced its intent to redeem
the remaining $1.1 billion of the 8.25% Senior Notes due 2015
on April 1, 2011. Holders will receive 104.125 percent of the
principal amount together with accrued and unpaid interest.
FCX expects to record a loss on early extinguishment of debt of
approximately $56 million (approximately $49 million to net
income attributable to FCX common stockholders) in the second
quarter of 2011 in connection with this redemption.
FCX evaluated events after December 31, 2010, and through
the date the financial statements were issued, and determined any
events or transactions occurring during this period that would
require recognition or disclosure are appropriately addressed in
these financial statements.
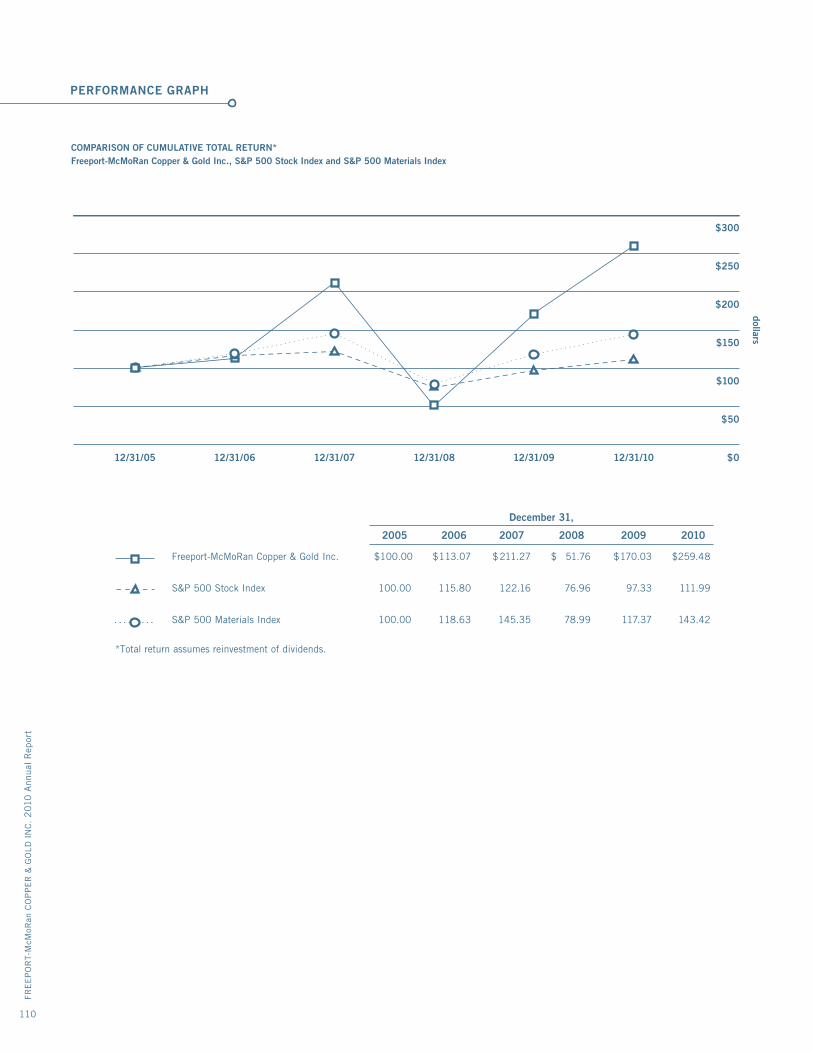
PERFORMANCE GRAPH
FRE
EP
OR
T-M
cMoR
an C
OP
PE
R &
GO
LD I
NC
. 2
010
Ann
ual
Rep
ort
110
COMPARISON OF CUMULATIVE TOTAL RETURN*Freeport-McMoRan Copper & Gold Inc., S&P 500 Stock Index and S&P 500 Materials Index
$300
$250
$200
$150
dollars
$100
$50
$012/31/1012/31/0912/31/0812/31/0712/31/0612/31/05
Freeport-McMoRan Copper & Gold Inc. $ 100.00 $ 113.07 $ 211.27 $ 51.76 $ 170.03 $ 259.48
S&P 500 Stock Index 100.00 115.80 122.16 76.96 97.33 111.99
S&P 500 Materials Index 100.00 118.63 145.35 78.99 117.37 143.42
December 31,
2005 2006 2007 2008 2009 2010
*Total return assumes reinvestment of dividends.
Investor Inquiries
The Investor Relations Department will be pleased to receive any
inquiries about the company. A link to our Annual Report on Form
10-K filed with the Securities and Exchange Commission, which
includes certifications of our Chief Executive Officer and Chief
Financial Officer and the company’s Principles of Business Conduct,
is available on our website. Additionally, copies will be furnished,
without charge, to any stockholder of the company entitled to vote
at its annual meeting, upon written request. The Investor Relations
Department can be contacted as follows:
Freeport-McMoRan Copper & Gold Inc.
Investor Relations Department
333 North Central Avenue
Phoenix, Arizona 85004
Telephone (602) 366-8400
www.fcx.com
Transfer Agent
Questions about lost certificates, lost or missing dividend checks,
or notifications of change of address should be directed to the
Freeport-McMoRan Copper & Gold Inc. transfer agent, registrar and
dividend disbursement agent:
BNY Mellon Shareowner Services
480 Washington Boulevard
Jersey City, New Jersey 07310-8015
Telephone (800) 953-2493
www.bnymellon.com/shareowner/isd
Notice of Annual Meeting
The annual meeting of stockholders will be held on June 15, 2011.
Notice of the annual meeting will be sent to stockholders. In
accordance with SEC rules, we will report the voting results of our
annual meeting on a Form 8-K that will be available on our website
(www.fcx.com).
FCX Common Stock
Our common stock trades on the New York Stock Exchange (NYSE)
under the symbol “FCX.” The FCX common stock price is reported
daily in the financial press under “FMCG” in most listings of NYSE
securities. At year-end 2010, the number of holders of record of our
common stock was 17,542.
NYSE composite tape common stock price ranges during 2010
and 2009 were:
Common Stock Dividends
In December 2010, the Board of Directors declared a two-for-one split of FCX common stock in the form of a stock dividend on issued and outstanding shares effective February 1, 2011. All references to common stock dividends have been adjusted to reflect the two-for-one stock split.
In December 2008, the Board of Directors suspended the cash dividend on our common stock; accordingly, there were no common stock dividends paid in 2009. In October 2009, the Board of Directors reinstated a cash dividend on our common stock. Below is a summary of the common stock dividends declared and paid for the quarterly periods of 2010 and the 2010 supplemental dividend:
In October 2010, the Board of Directors authorized an increase in the cash dividend on our common stock to an annual rate of $1.00 per share, payable quarterly at a rate of $0.25 per share beginning February 1, 2011.
Tax Withholding – Nonresident Alien Stockholders
Nonresident aliens who own stock in a United States corporation are generally subject to a federal withholding tax on 100 percent of the dividends paid on preferred and/or common stock. However, when 80 percent or more of a corporation’s income is generated outside the United States, the withholding percentage is not calculated on 100 percent of the dividend, but rather on that portion of the dividend attributable to income generated in the United States. We have determined that, for quarterly dividends paid in 2010 to nonresident alien stockholders, 100 percent of the dividend amount was subject to federal withholding tax.
For quarterly dividends paid in 2011, we estimate that 100 percent of the total dividend amount is subject to federal withholding tax unless exempted by tax treaty. The withholding tax rate may also be reduced by tax treaty.
If you have any questions, please contact the Investor Relations Department.
FCX Beneficial Owner
The beneficial owner of more than five percent of our outstanding common stock as of December 31, 2010, is BlackRock, Inc. (7.8 percent).
Stockholder Information
2010 a 2009 a
High Low High Low
First Quarter $ 45.28 $ 33.02 $ 21.73 $ 10.58
Second Quarter 44.15 29.12 30.78 18.30
Third Quarter 43.96 28.36 36.72 21.60
Fourth Quarter 60.39 43.19 43.68 31.50
2010
Amount per Share Record Date Payment Date
First Quarter $ 0.075 Jan. 15, 2010 Feb. 1, 2010
Second Quarter 0.075 Apr. 15, 2010 May 1, 2010
Third Quarter 0.150 July 15, 2010 Aug. 1, 2010
Fourth Quarter 0.150 Oct. 15, 2010 Nov. 1, 2010
Supplemental Dividend 0.500 Dec. 20, 2010 Dec. 30, 2010
FRE
EP
OR
T-McM
oRan C
OP
PE
R &
GO
LD IN
C. 2
010 A
nnual Rep
ort111
a. Common share prices have been adjusted to reflect the February 1, 2011,
two-for-one stock split.

FRE
EP
OR
T-M
cMoR
an C
OP
PE
R &
GO
LD I
NC
. 2
010
Ann
ual
Rep
ort
1
333 NORTH CENTRAL AVENUE PHOENIX, ARIZONA 85004 602.366.8100 WWW.FCX.COM