Embed Size (px)
Citation preview
7/30/2019 Final Aviation Industry
http://slidepdf.com/reader/full/final-aviation-industry 1/12
Ankit Tiwari (R#7) Avneesh Munjal (R#18)Meenakshi Deshpande
(R#34)Sanket Tandon (R# 52)Sobhit Agarwal (R# 56)
Indian Institute of ForeignTrade
MBA(IB) 2013-15
7/30/2019 Final Aviation Industry
http://slidepdf.com/reader/full/final-aviation-industry 2/12
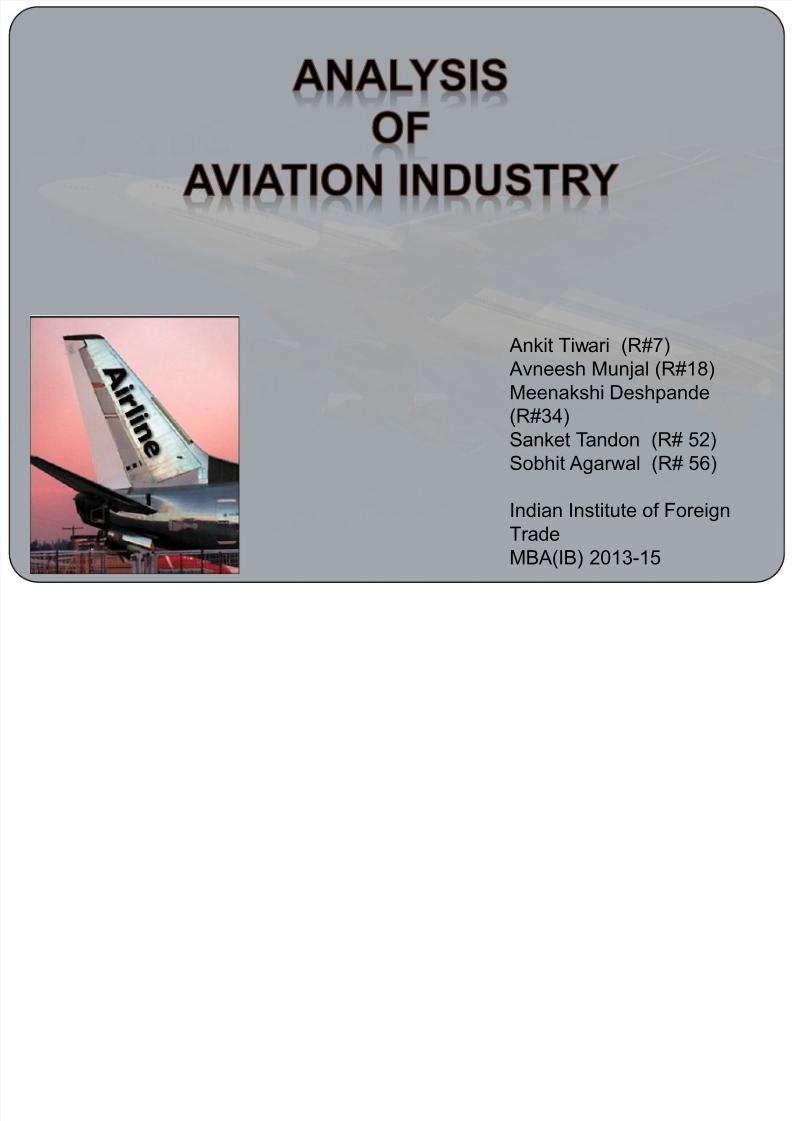
Industry Overview
Major Players in the Industry
Performance Overview
Recent Happenings
Major Events in Aviation Industry
Porter Analysis
Aero Turbine Fuel (ATF)
Policy Support
Future Outlook
AGENDA
7/30/2019 Final Aviation Industry
http://slidepdf.com/reader/full/final-aviation-industry 3/12
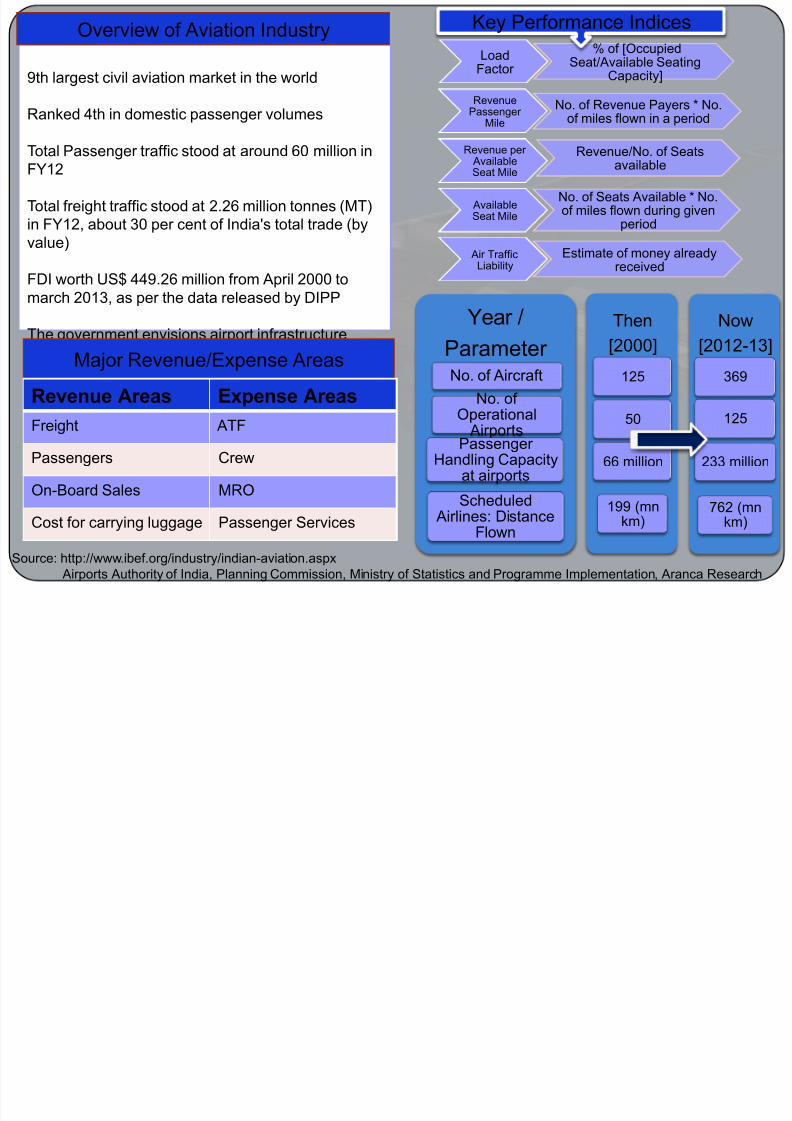
9th largest civil aviation market in the world
Ranked 4th in domestic passenger volumes
Total Passenger traffic stood at around 60 million inFY12
Total freight traffic stood at 2.26 million tonnes (MT)in FY12, about 30 per cent of India's total trade (byvalue)
FDI worth US$ 449.26 million from April 2000 tomarch 2013, as per the data released by DIPP
The government envisions airport infrastructureinvestment of US$11.4 billion under the 12th FiveYear Plan (2012-17)
Year /
Parameter No. of Aircraft
No. of
Operational Airports
Passenger Handling Capacity
at airports
Scheduled Airlines: Distance
Flown
Then
[2000]
125
50
66 million
199 (mnkm)
Now
[2012-13]
369
125
233 million
762 (mnkm)
Source: http://www.ibef.org/industry/indian-aviation.aspx Airports Authority of India, Planning Commission, Ministry of Statistics and Programme Implementation, Aranca Research
LoadFactor
% of [OccupiedSeat/Available Seating
Capacity]
RevenuePassenger
Mile
No. of Revenue Payers * No.of miles flown in a period
Revenue per AvailableSeat Mile
Revenue/No. of Seatsavailable
AvailableSeat Mile
No. of Seats Available * No.of miles flown during given
period
Air TrafficLiability
Estimate of money alreadyreceived
Key Performance IndicesOverview of Aviation Industry
Major Revenue/Expense Areas
Revenue Areas Expense Areas
Freight ATF
Passengers Crew
On-Board Sales MRO
Cost for carrying luggage Passenger Services
7/30/2019 Final Aviation Industry
http://slidepdf.com/reader/full/final-aviation-industry 4/12
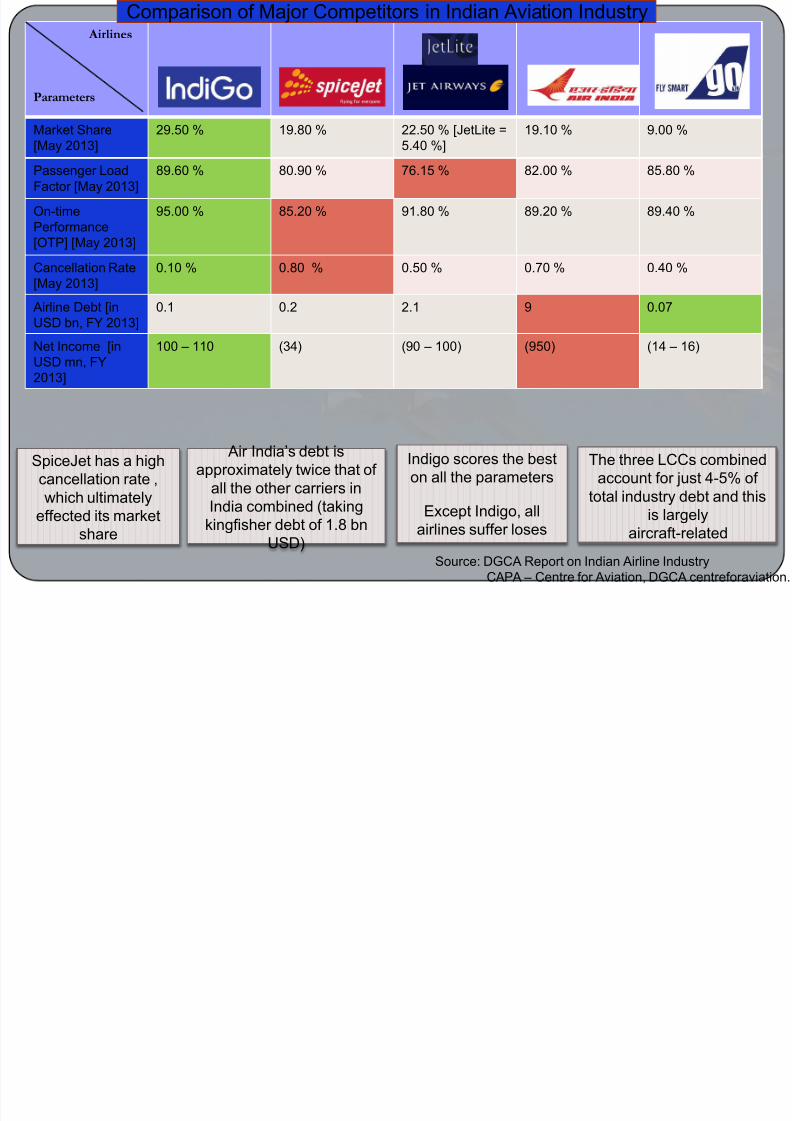
Airlines
Parameters
Market Share[May 2013]
29.50 % 19.80 % 22.50 % [JetLite =5.40 %]
19.10 % 9.00 %
Passenger LoadFactor [May 2013]
89.60 % 80.90 % 76.15 % 82.00 % 85.80 %
On-timePerformance[OTP] [May 2013]
95.00 % 85.20 % 91.80 % 89.20 % 89.40 %
Cancellation Rate[May 2013]
0.10 % 0.80 % 0.50 % 0.70 % 0.40 %
Airline Debt [inUSD bn, FY 2013]
0.1 0.2 2.1 9 0.07
Net Income [inUSD mn, FY2013]
100 – 110 (34) (90 – 100) (950) (14 – 16)
Source: DGCA Report on Indian Airline IndustryCAPA – Centre for Aviation, DGCA centreforaviation.
Indigo scores the beston all the parameters
Except Indigo, allairlines suffer loses
SpiceJet has a highcancellation rate ,which ultimately
effected its marketshare
Air India’s debt is approximately twice that of
all the other carriers inIndia combined (taking
kingfisher debt of 1.8 bnUSD)
The three LCCs combinedaccount for just 4-5% of
total industry debt and thisis largely
aircraft-related
Comparison of Major Competitors in Indian Aviation Industry
7/30/2019 Final Aviation Industry
http://slidepdf.com/reader/full/final-aviation-industry 5/12
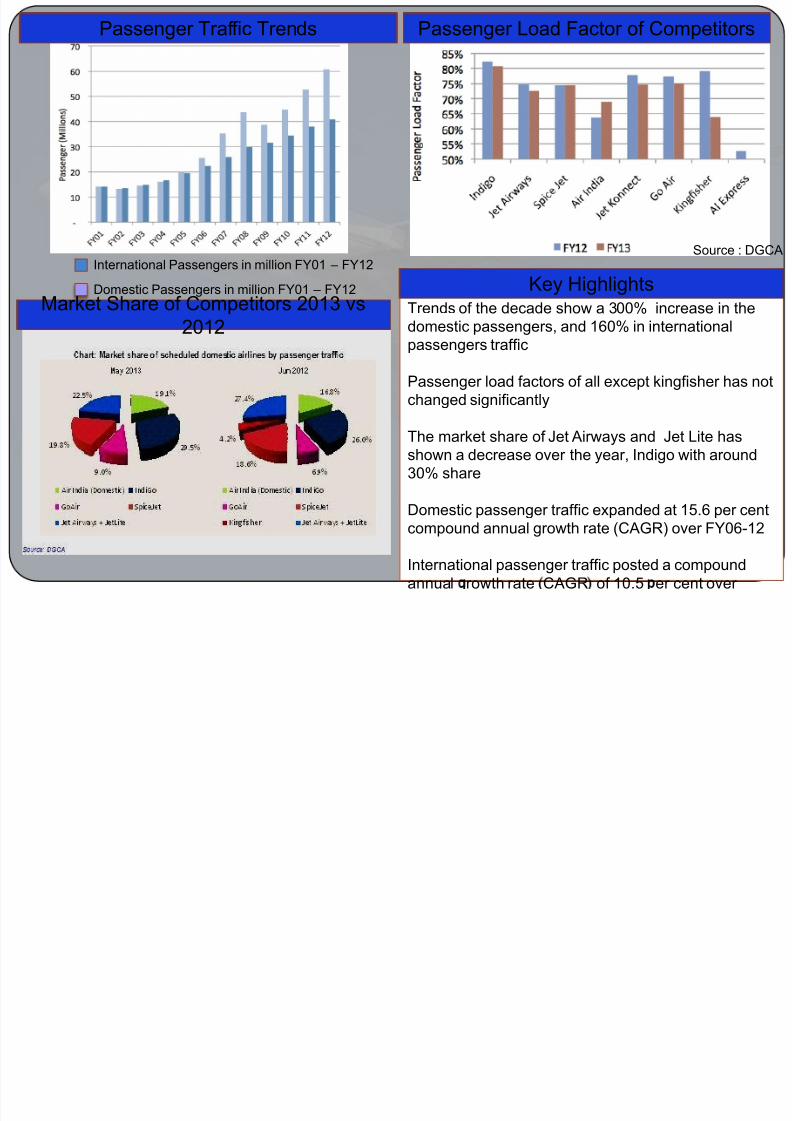
Trends of the decade show a 300% increase in thedomestic passengers, and 160% in internationalpassengers traffic
Passenger load factors of all except kingfisher has notchanged significantly
The market share of Jet Airways and Jet Lite hasshown a decrease over the year, Indigo with around30% share
Domestic passenger traffic expanded at 15.6 per centcompound annual growth rate (CAGR) over FY06-12
International passenger traffic posted a compoundannual rowth rate CAGR of 10.5 er cent over
Domestic Passengers in million FY01 – FY12
International Passengers in million FY01 – FY12Source : DGCA
Key Highlights
Passenger Traffic Trends Passenger Load Factor of Competitors
Market Share of Competitors 2013 vs2012
7/30/2019 Final Aviation Industry
http://slidepdf.com/reader/full/final-aviation-industry 6/12
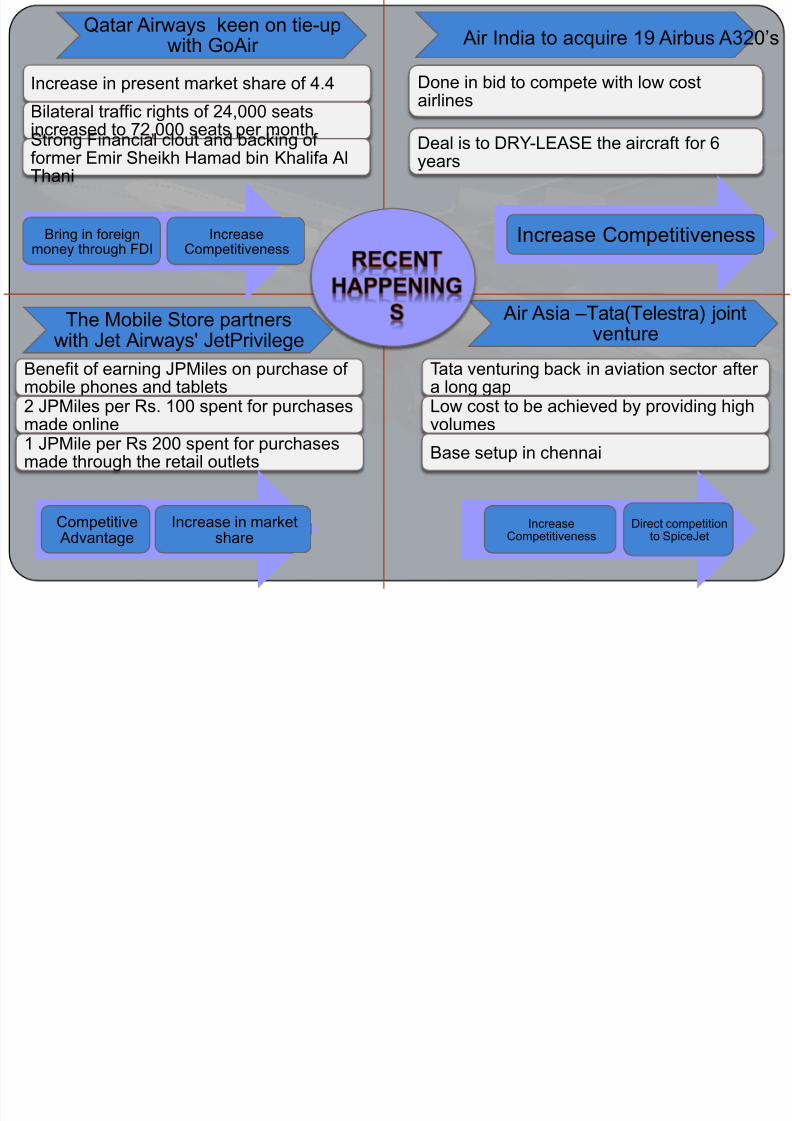
Qatar Airways keen on tie-upwith GoAir
Increase in present market share of 4.4
Bilateral traffic rights of 24,000 seats
increased to 72,000 seats per month
Strong Financial clout and backing of former Emir Sheikh Hamad bin Khalifa AlThani
Bring in foreignmoney through FDI
IncreaseCompetitiveness
Done in bid to compete with low costairlines
Deal is to DRY-LEASE the aircraft for 6years
Increase Competitiveness
The Mobile Store partnerswith Jet Airways' JetPrivilege
Air Asia –Tata(Telestra) jointventure
Benefit of earning JPMiles on purchase of mobile phones and tablets
2 JPMiles per Rs. 100 spent for purchasesmade online
1 JPMile per Rs 200 spent for purchasesmade through the retail outlets
Tata venturing back in aviation sector after a long gap
Low cost to be achieved by providing highvolumes
Base setup in chennai
Competitive Advantage
Increase in marketshare
IncreaseCompetitiveness
Direct competitionto SpiceJet
Air India to acquire 19 Airbus A320’s
7/30/2019 Final Aviation Industry
http://slidepdf.com/reader/full/final-aviation-industry 7/12
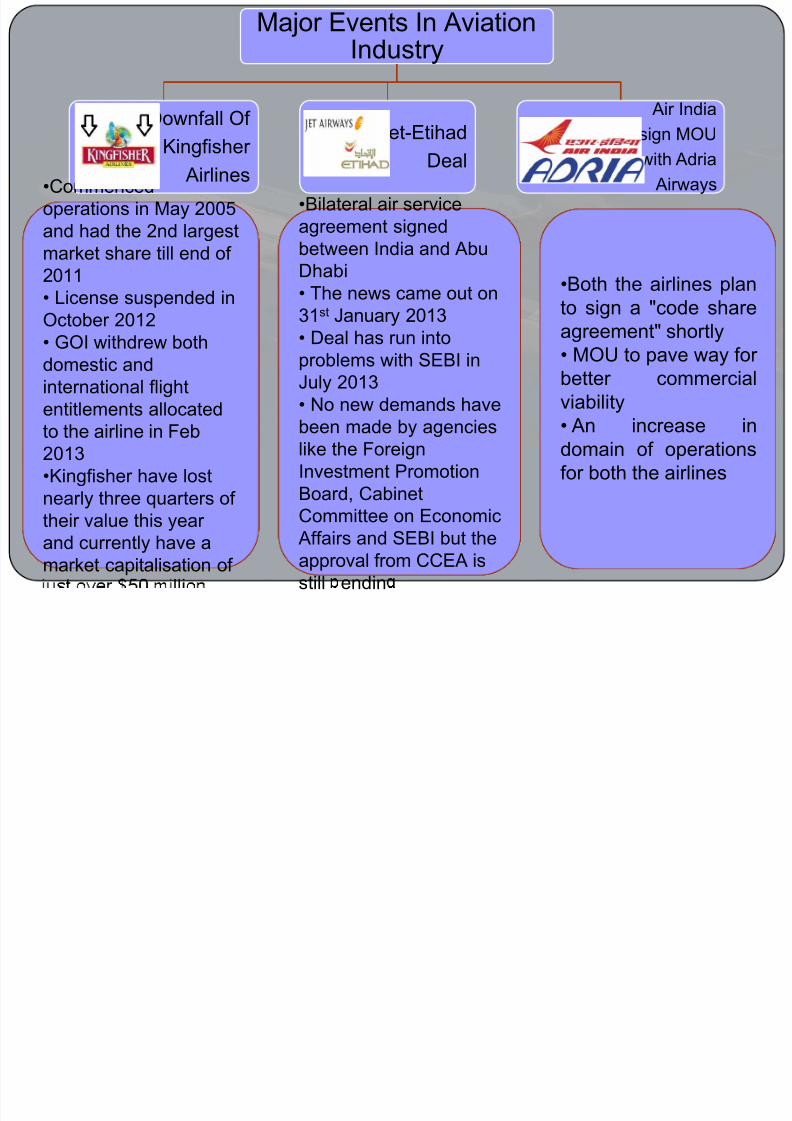
Major Events In AviationIndustry
Downfall Of
Kingfisher
Airlines
Jet-EtihadDeal
Air India
sign MOUwith Adria
Airways•Commencedoperations in May 2005and had the 2nd largestmarket share till end of
2011• License suspended inOctober 2012• GOI withdrew bothdomestic andinternational flight
entitlements allocatedto the airline in Feb2013•Kingfisher have lostnearly three quarters of their value this year
and currently have amarket capitalisation of
•Bilateral air serviceagreement signedbetween India and Abu
Dhabi• The news came out on31st January 2013• Deal has run intoproblems with SEBI inJuly 2013•
No new demands havebeen made by agencieslike the ForeignInvestment PromotionBoard, CabinetCommittee on Economic
Affairs and SEBI but theapproval from CCEA isstill endin
•Both the airlines planto sign a "code shareagreement" shortly• MOU to pave way for better commercialviability• An increase indomain of operationsfor both the airlines
7/30/2019 Final Aviation Industry
http://slidepdf.com/reader/full/final-aviation-industry 8/12
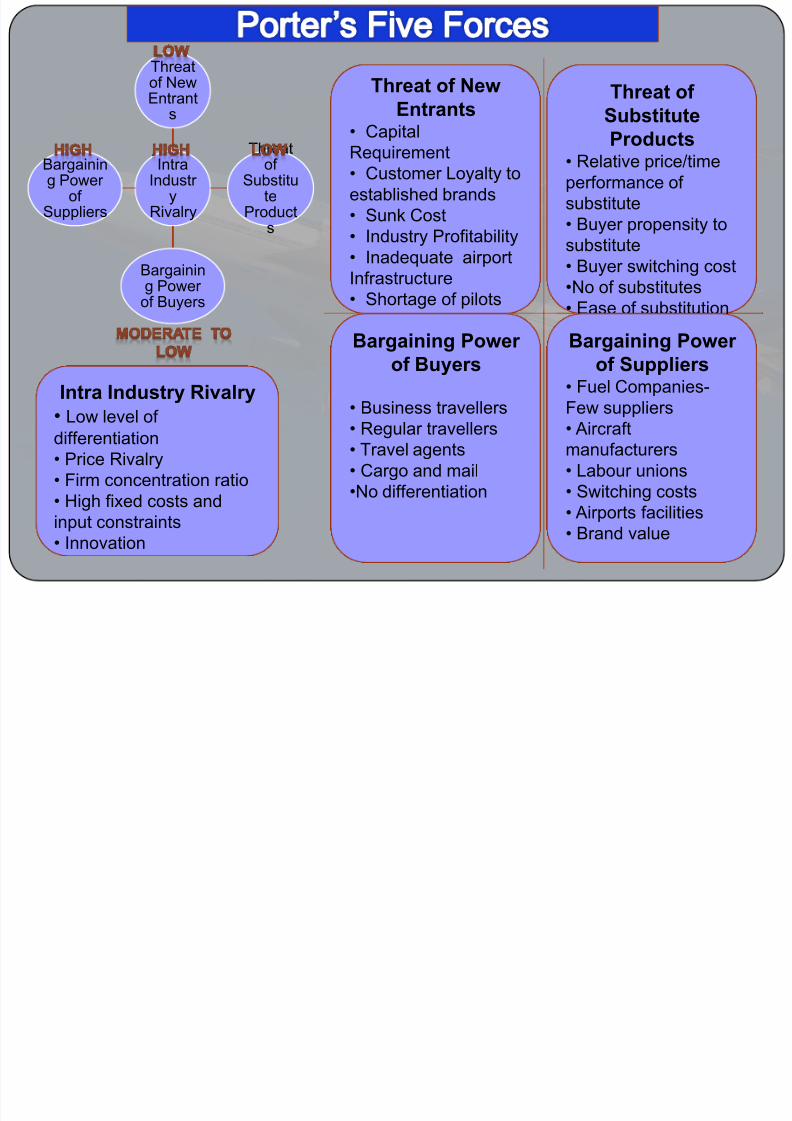
IntraIndustr
yRivalry
Threatof NewEntrant
s
Threatof
Substitute
Products
Bargaining Power of Buyers
Bargaining Power
of Suppliers
Threat of
Substitute
Products• Relative price/timeperformance of substitute• Buyer propensity tosubstitute
• Buyer switching cost •No of substitutes
• Ease of substitution• Video conferencing,railways.
Threat of New
Entrants
• CapitalRequirement• Customer Loyalty toestablished brands• Sunk Cost• Industry Profitability• Inadequate airport
Infrastructure• Shortage of pilotsand high fuel cost.
Bargaining Power
of Suppliers• Fuel Companies-
Few suppliers • Aircraftmanufacturers
• Labour unions
• Switching costs
• Airports facilities
• Brand value
Bargaining Power
of Buyers
• Business travellers • Regular travellers
• Travel agents
• Cargo and mail•No differentiation
Intra Industry Rivalry
• Low level of differentiation
• Price Rivalry
• Firm concentration ratio• High fixed costs andinput constraints• Innovation
7/30/2019 Final Aviation Industry
http://slidepdf.com/reader/full/final-aviation-industry 9/12
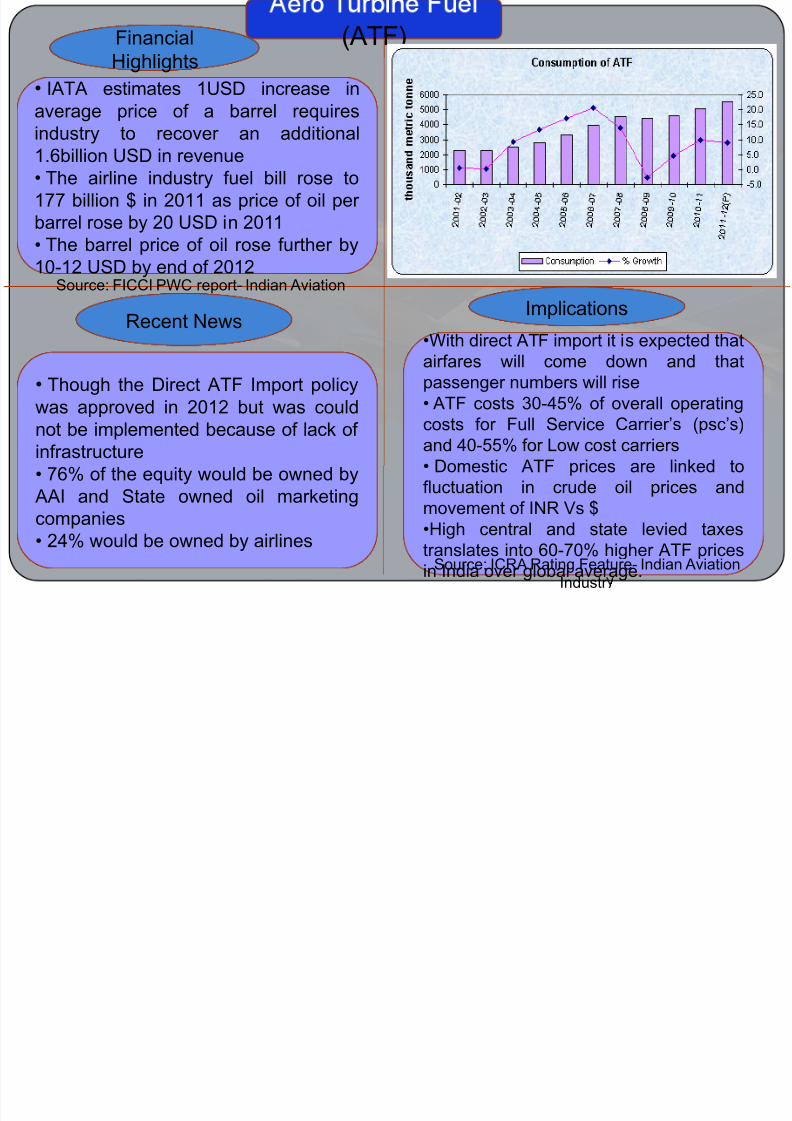
(ATF)Financial
Highlights
Recent NewsImplications
• IATA estimates 1USD increase inaverage price of a barrel requires
industry to recover an additional1.6billion USD in revenue• The airline industry fuel bill rose to177 billion $ in 2011 as price of oil per barrel rose by 20 USD in 2011• The barrel price of oil rose further by
10-12 USD by end of 2012
• Though the Direct ATF Import policy
was approved in 2012 but was couldnot be implemented because of lack of infrastructure• 76% of the equity would be owned by
AAI and State owned oil marketingcompanies• 24% would be owned by airlines
•With direct ATF import it is expected thatairfares will come down and thatpassenger numbers will rise• ATF costs 30-45% of overall operatingcosts for Full Service Carrier’s (psc’s)and 40-55% for Low cost carriers• Domestic ATF prices are linked tofluctuation in crude oil prices andmovement of INR Vs $•High central and state levied taxes
translates into 60-70% higher ATF pricesin India over global average.
Source: FICCI PWC report- Indian Aviation
Source: ICRA Rating Feature- Indian AviationIndustr
7/30/2019 Final Aviation Industry
http://slidepdf.com/reader/full/final-aviation-industry 10/12
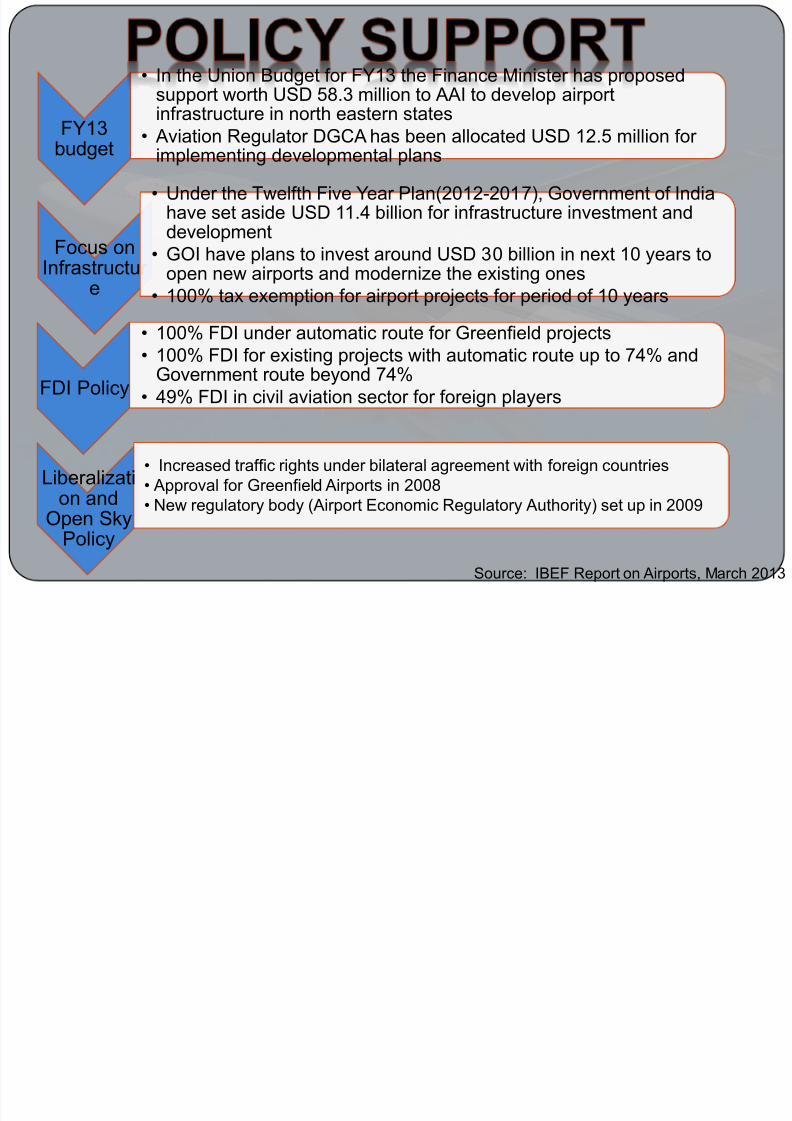
FY13budget
• In the Union Budget for FY13 the Finance Minister has proposedsupport worth USD 58.3 million to AAI to develop airportinfrastructure in north eastern states
• Aviation Regulator DGCA has been allocated USD 12.5 million for implementing developmental plans
Focus on
Infrastructur e
• Under the Twelfth Five Year Plan(2012-2017), Government of Indiahave set aside USD 11.4 billion for infrastructure investment anddevelopment
• GOI have plans to invest around USD 30 billion in next 10 years to
open new airports and modernize the existing ones• 100% tax exemption for airport projects for period of 10 years
FDI Policy
• 100% FDI under automatic route for Greenfield projects• 100% FDI for existing projects with automatic route up to 74% and
Government route beyond 74%• 49% FDI in civil aviation sector for foreign players
Liberalization and
Open SkyPolicy
• Increased traffic rights under bilateral agreement with foreign countries• Approval for Greenfield Airports in 2008• New regulatory body (Airport Economic Regulatory Authority) set up in 2009
Source: IBEF Report on Airports, March 2013
7/30/2019 Final Aviation Industry
http://slidepdf.com/reader/full/final-aviation-industry 11/12
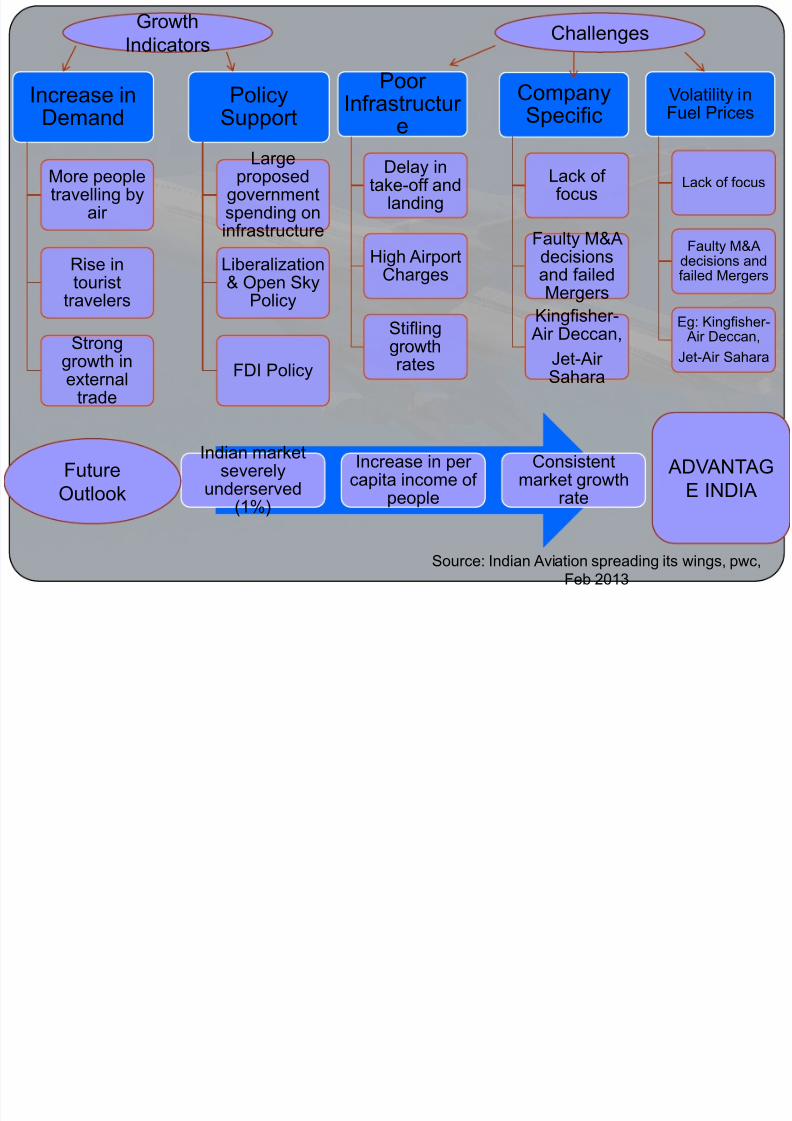
Increase inDemand
More peopletravelling by
air
Rise intourist
travelers
Stronggrowth inexternal
trade
PolicySupport
Largeproposed
governmentspending oninfrastructure
Liberalization& Open Sky
Policy
FDI Policy
GrowthIndicators
Poor Infrastructur
e
Delay intake-off and
landing
High Airport
Charges
Stiflinggrowthrates
CompanySpecific
Lack of focus
Faulty M&Adecisions
and failedMergers
Kingfisher- Air Deccan,
Jet-Air Sahara
Volatility inFuel Prices
Lack of focus
Faulty M&Adecisions and
failed Mergers
Eg: Kingfisher- Air Deccan,
Jet-Air Sahara
Challenges
Indian marketseverely
underserved(1%)
Increase in per capita income of
people
Consistentmarket growth
rate
FutureOutlook
ADVANTAGE INDIA
Source: Indian Aviation spreading its wings, pwc,Feb 2013

7/30/2019 Final Aviation Industry
http://slidepdf.com/reader/full/final-aviation-industry 12/12