Embed Size (px)
Citation preview

Article
Finite Element Modelling of Concrete-Encased Steel Columns Subjected to Eccentric Loadings Worakarn Anuntasenaa, Akhrawat Lenwarib,*, and Thaksin Thepchatric
Composite Structures Research Unit, Department of Civil Engineering, Faculty of Engineering, Chulalongkorn University, Phayathai Rd., Pathumwan, Bangkok 10330, Thailand E-mail: [email protected], [email protected] (Corresponding author),[email protected] Abstract. This paper presents the 3D finite element (FE) analysis of the concrete-encased steel (CES) columns subjected to concentric or eccentric loadings. A new simplified technique of FE modelling that incorporates the concrete confinement behavior of the composite columns is proposed. This technique eliminates the need of predefining zones and constitutive properties of the confined concrete. After validated with past experimental data, the FE analysis is conducted to construct the strength interaction diagrams of the short CES columns. The effects of material properties including the compressive strength of concrete and yield strength of structural steel on the strength interaction diagrams of CES columns are numerically investigated. The FE results show that the concrete strength only has a significant effect on the column strength under combined compression and bending (compression phase) of the interaction diagram, while the yield strength of structural steel has a significant effect on both compression and tension phases. A comparison between the strength interaction diagrams predicted by FE analysis and the plastic stress distribution method specified in AISC360-16 “Specification for Structural Steel Buildings” shows that the design provision underestimates the strength of the short CES columns subjected to concentric or eccentric loadings. Such underestimation reduces as the compressive strength of concrete decreases or yield strength of structural steel increases. Keywords: Concrete-encased steel column, 3D finite element analysis, concrete confinement, strength interaction diagram.
ENGINEERING JOURNAL Volume 23 Issue 6 Received 21 May 2019 Accepted 30 September 2019 Published 30 November 2019
Online at http://www.engj.org/ DOI:10.4186/ej.2019.23.6.299
brought to you by COREView metadata, citation and similar papers at core.ac.uk
provided by Engineering Journal (Faculty of Engineering, Chulalongkorn University, Bangkok)

DOI:10.4186/ej.2019.23.6.299
300 ENGINEERING JOURNAL Volume 23 Issue 6, ISSN 0125-8281 (http://www.engj.org/)
1. Introduction Concrete-encased steel (CES) columns have been widely used in high-rise buildings due to combined advantages of structural steel and reinforced concrete columns such as high stiffness, high earthquake resistance, and high fire resistance. Numerous past studies have been conducted to investigate the compression behavior of CES columns including the maximum capacities under concentric and eccentric loadings, axial deformation of concentrically loaded columns, and lateral deflection of eccentrically loaded columns (e.g., SSRC Task Group 20 1979 [1], Mirza and Skrabek 1991 [2], Mirza and Skrabek 1992 [3], Ricles and Paboojian 1994 [4], Mirza et al. 1996 [5], Kato 1996 [6], Wang 1999 [7], Weng and Yen 2002 [8]). Effects of the material properties (concrete and steel) and column slenderness ratio on the compression behavior of the composite columns have also been studied. Analytical or numerical models have been proposed to predict the compression behavior of CES columns [9-13]. Chen and Lin (2006) [9] proposed an analytical model to predict the axial force-deformation of short CES columns. In the model, the confinement zones and stress-strain relationships of confined concrete were predefined. The concrete in the CES column was divided into unconfined, partially confined, and highly confined concrete zones. An unconfined concrete was the concrete outside the parabolic arching formed by longitudinal reinforcement bars. A highly confined concrete was the concrete inside the perimeter of the structural steel section and the arching formed by the structural steel section. A partially confined concrete was the concrete between the unconfined concrete and highly confined one. The model was used to study the effects of the structural steel shape and stirrup spacing on the axial force-deformation behavior of CES columns. Ellobody and Young (2011) [10] and Ellobody et al. (2011) [11] employed the finite element (FE) software ABAQUS to perform a 3D nonlinear analysis of the CES columns subjected to concentric and eccentric loadings. Assumptions on the concrete confinement behavior were similar to Chen and Lin (2006) [9]. Effects of the effective length, concrete strength, and steel strength on the maximum capacities under concentric and eccentric loads were numerically investigated. Ky et al. (2015) [12] employed the fiber element analysis to predict the axial force-deformation relationships of the short and slender CES columns. The confinement zones and stress-strain relationships of confined concrete were predefined similar to Chen and Lin (2006) [9]. The analysis was used to study the effects of the width-to-effective length ratio, stirrup spacing, concrete strength, and yield strength of structural steel on the axial force-deformation behavior of the short and slender CES columns. Chen and Wu (2017) [13] proposed a thorough analytical model to predict the axial force-deformation behavior of short CES columns considering the concrete confinement effect. According to the literature review, therefore, previous analytical and numerical studies have simulated the confinement effect by predefining the confinement zones and associated stress-strain relationships of confined concrete. In addition, no attempt has been made to investigate the strength interaction (P-M) diagrams of the CES columns.
This paper describes the 3D nonlinear FE analysis technique that incorporates the confinement effect without predefining the confinement zones and stress-strain relationships of the confined concrete. A commercial FE software ANSYS [14] was employed. The FE results are validated with experimental data by Chen and Yeh (1996) [15] for the CES columns subjected to concentric loadings. A comparison between the predicted concrete confinement zones and predefined zones assumed by Chen and Lin (2006) [9] is discussed. Then, the FE results are validated with experimental data by Al-Shahari et al. (2003) [16] for the CES columns subjected to eccentric loadings. After the validation, the strength interaction diagrams are constructed to investigate the effects of design parameters including the compressive strength of concrete and yield strength of the structural steel section (W-shape) on the column capacities and assess the plastic stress distribution method specified in AISC360-16 “Specification for Structural Steel Buildings.” (AISC 2016) [17].
2. 3D Finite Element Modelling A 3D FE model of the CES column consists of concrete, structural steel, reinforcement steel and steel plate. The element types and material properties in ANSYS program are appropriately chosen for concrete and steel materials. Loading, boundary, and interface conditions are simulated. Assumptions includes 1) short columns, 2) perfect columns (straight and no residual stress), 3) perfect bonding (no slip), and 4) no local buckling.
Figure 1 shows three components of the CES column (concrete, structural steel, and reinforcement steel). The Solid185 element is used for steel components (structural steel, reinforcement steel, and steel plate),

DOI:10.4186/ej.2019.23.6.299
ENGINEERING JOURNAL Volume # Issue #, ISSN 0125-8281 (http://www.engj.org/) 301
while the Solid65 element is used for concrete. A total number of elements is approximately 50,000 (40,000 elements for concrete, 6,000 elements for structural steel, and 4,000 elements for reinforcement steel).
(a) concrete (b) structural steel (c) reinforcement steel
Fig. 1. Model components of CES column. 2.1. Concrete Encasement The SOLID65 element, a 3D structural solid element which is specific for concrete in ANSYS, has eight nodes with three degrees of freedom per node. It can predict crushing and cracking behavior of concrete. Concrete material properties include the concrete strength in uniaxial compression, concrete strength in tension, and Poisson’s ratio. The following stress-strain relationship of concrete under uniaxial compression (unconfined concrete) is given by Park and Paulay 1975 [18],
2
0 0
2' c c
c cf f
(1)
0
2 'c
c
f
E (2)
4730 'c cE f (3)
where 'cf is the uniaxial compressive strength of concrete cylinder.
In the FE modelling, only the stress-strain relationship portion with the positive slope, i.e., a parabola
from the origin point to the maximum uniaxial compressive strength of concrete, is used. Generally, the
concrete has tensile strength ( tf ) less than 20% of the compressive strength (Park and Paulay 1975 [18]).
Therefore, the tensile strength of concrete is assumed to be 10% of the maximum compressive strength. The Poisson’s ratio, which is the ratio between transverse strain and longitudinal strain, is a significant
factor that influences the confinement behavior. Samaan et al. (1998) [19] studied the Poisson’s ratio of concrete in terms of the dilation rate, which is a negative of the ratio between the change in lateral strain and the change in axial strain. Figure 2 compares the dilation rates of plain concrete, steel-confined concrete, and FRP-confined concrete. All curves begin at the dilation rate of 0.2. Then, the dilation rate of unconfined concrete (plain concrete) rapidly increases due to the growth of micro cracks. Finally, the unconfined concrete becomes unstable when the maximum uniaxial compressive strength is approached. Such confinement behavior is different from the steel-confined [20] and FRP-confined concrete.

DOI:10.4186/ej.2019.23.6.299
302 ENGINEERING JOURNAL Volume 23 Issue 6, ISSN 0125-8281 (http://www.engj.org/)
Fig. 2. Dilation rate of plain concrete, steel-confined concrete and FRP-confined concrete (adapted from Samaan et al. 1998).
In the preliminary FE modelling, a constant Poisson’s ratio value of 0.2 is chosen. It is observed that the
concrete confinement is not evident as the steel flanges are only pushed by the steel web (but not pushed by the inner concrete). This is because the lateral expansion of concrete is less than structural steel (Poisson’s ratio of steel is constant at 0.3). Figures 3(a) and 3(b) show the preliminary deformed shape of the structural steel section and longitudinal (axial) stress contours of concrete in the CES column subjected to concentric loading, respectively.
(a) deformed shape of structural steel (b) longitudinal stress contours of concrete
Fig. 3. Deformed shape of steel section and longitudinal stress contours of concrete in the CES column at maximum concentric load. (Using Poisson’s ratio of concrete of 0.2)
As the FE modelling using the non-constant Poisson’s ratio that is dependent on the stress-strain state is complicated, a new simplified technique is proposed in this study. According to the preliminary FE results, the Poisson’s ratio of concrete should correspond to the high stress level and be higher than the Poisson’s ratio of steel to simulate the concrete confinement behavior. Therefore, a constant Poisson’s ratio of concrete is chosen to be 0.4. Figure 4(a) shows the deformed shape of the structural steel section. Obviously, both tips of steel flanges (pushed out by inner concrete) deflect more than the web-to-flange junction (pushed out by the web of structural steel).
In this research, Willam and Warnke (1974) [21] failure criterion available in ANSYS program is used. However, the use of constant Poisson’ ratio value of 0.4 causes a premature failure of concrete outside the reinforcement bars before the maximum compressive strength of the column is achieved. To avoid the premature failure of concrete due to over-simulated lateral stress from the use of high Poisson’s ratio, the failure criterion needs the modification. In this study, the uniaxial compressive strength of concrete is increased by a factor of 1.45, which is derived from a calibration with the available experimental data (Chen and Yeh 1996) [15]. Note that the stress-strain relationship of concrete is not modified.
0
0.5
1
1.5
2
0 0.01 0.02 0.03 0.04 0.05
Dil
ati
on
rate
Axial strain
Steel-confined concreteFRP-confined concretePlain concrete

DOI:10.4186/ej.2019.23.6.299
ENGINEERING JOURNAL Volume # Issue #, ISSN 0125-8281 (http://www.engj.org/) 303
Figure 4(b) shows the longitudinal (axial) stress contours of concrete in the CES column subjected to concentric loading. The highly confined concrete zone is enclosed by the structural steel web, flanges, and the parabolic curve. The maximum concrete stress occurs at the edge of flange and web of the structural steel section. The partially confined concrete zone is enclosed by the stirrup and parabolic curve. The FE confinement zones are similar to the predefined zones assumed by Chen and Lin (2006) [9].
(a) deformed shape of structural steel (b) longitudinal stress contours of concrete Fig. 4. Deformed shape of steel section and longitudinal stress contours of concrete in the CES column at maximum concentric load. (Using Poisson’s ratio of concrete of 0.4 with modified uniaxial compressive strength of concrete.)
In addition to W-shape structural steel sections, the FE model can simulate the concrete confinement behavior of CES columns with cross-shaped structural steel sections. Figure 5(a) and 5(b) show the deformed shape of the stirrup that corresponds to the confinement mechanism and confinement zones in the CES column with the cross-shaped steel section subjected to concentric loading, respectively.
In summary, the FE input data for concrete are: 1. Using SOLID65 structural element
2. Elastic modulus of concrete ( cE )
3. Poisson’ ratio of concrete ( c = 0.4)
4. Stress-strain relationship of concrete ( c c )
5. Ultimate uniaxial compressive strength (1.45 'cf )
6. Ultimate uniaxial tensile strength (0.1 'cf )
7. Shear transfer coefficients for an opened crack (0.2) 8. Shear transfer coefficients for a closed crack (0.4)

DOI:10.4186/ej.2019.23.6.299
304 ENGINEERING JOURNAL Volume 23 Issue 6, ISSN 0125-8281 (http://www.engj.org/)
(a) deformed shape of stirrup (b) longitudinal stress contours of concrete Fig. 5. Deformed shape of stirrup and longitudinal stress contours of concrete in the CES column with cross-shape steel section. 2.2. Structural and Reinforcement Steel For structural and reinforcement steel, a bilinear stress-strain relationship is used. The first part is linear elastic
with elastic modulus ( sE ). The second part is perfectly plastic with yield strength (yf ). The SOLID185
element is chosen. The element has eight nodes with three degrees of freedom per node. It can predict the plasticity, hyper-elasticity, stress stiffening, creep, large deflection, and large strain capabilities. The FE input data for steel are:
1. Using SOLID185 structural element
2. Elastic modulus of steel ( sE )
3. Poisson’ ratio of steel ( s = 0.3)
4. Stress-strain relationship of steel ( s s )
5. Yield strength of steel (yf )
2.3. Loading and Boundary Conditions A displacement-controlled loading is simulated to observe the post-peak behavior of the CES columns. The loading is applied at the upper steel plate, while the pin-ended support conditions are applied at the lower steel plate. Figure 6 shows the deformed shapes of the CES columns subjected to concentric and eccentric loadings.

DOI:10.4186/ej.2019.23.6.299
ENGINEERING JOURNAL Volume # Issue #, ISSN 0125-8281 (http://www.engj.org/) 305
(a) The column subjected to concentric loadings (b) The column subjected to eccentric loadings
(Model of specimen SRC2 of Chen and Yeh 1996) (Model of specimen No.5 of Al-Shahari et al. 2003) Fig. 6. Deformed shapes of CES columns subjected to concentric and eccentric loadings. 2.4. Interface Conditions In the FE modelling, the slips between structural steel, concrete and reinforcement bar are not considered. All internal interfaces are modelled with the GLUE function of ANSYS program. However, the interfaces between the CES column and steel plates depend on the loading condition. For the CES columns subjected to concentric loadings, the interfaces are modelled with COUPLING function as the steel plates transfer only the longitudinal force to the column. For the CES columns subjected to eccentric loadings, the interfaces are modelled with GLUE function.
3. Validation of Finite Element Modelling The FE results are compared with two past experimental studies on the CES columns (Chen and Yeh 1996 [15] for concentric loadings and Al-Shahari et al. 2003 [16] for eccentric loadings). In Chen and Yeh 1996 [15], ten short CES columns subjected to concentric loadings were tested. Test variables are the structural
steel shape and stirrup spacing. All columns have square cross-section of 280 280 mm with 12 longitudinal reinforcement bars as shown in Fig. 7. The column height is 1200 mm. Structural steel shapes include H shape, cross shape, and I shape. Diameters of longitudinal bars and stirrups are 15.9 and 8 mm, respectively.
Fig. 7. Cross-section configurations of tested CES columns (adapted from Chen and Yeh 1996).
In Al-Shahari et al. 2003 [16], ten CES columns subjected to different eccentric loadings were tested. The
column height ranges from 2,000 to 3,000 mm. The columns have a square cross-section of 230 230 mm with four longitudinal reinforcement bars as shown in Fig. 8. Two different sizes of H-shaped structural steel were studied. Diameters of longitudinal steel bars and stirrups are 12 and 8 mm, respectively.

DOI:10.4186/ej.2019.23.6.299
306 ENGINEERING JOURNAL Volume 23 Issue 6, ISSN 0125-8281 (http://www.engj.org/)
Fig. 8. Cross-section configurations of tested CES columns (adapted from Al-Shahari et al. 2003). 3.1. Validation of CES Columns Subjected to Concentric Loadings Figure 9 compares the axial compressive load-strain relationships predicted by FE models with the test results (Chen and Yeh 1996 [15]). The ratios of test-to-FE maximum compressive loads range from 0.91 to 1.04. The mean and standard deviation of the ratios are 0.98 and 0.04, respectively.
Fig. 9. FE prediction v.s. test data of CES columns subjected to concentric loadings [15]. 3.2. Validation of CES Columns Subjected to Eccentric Loadings Figure 10 compares the eccentric load-lateral deflection at mid-height relationships predicted by FE models with the test results (Al-Shahari et al. 2003 [16]). The ratios of test-to-FE maximum compressive loads range from 0.90 to 1.16. The mean and standard deviation of the ratios are 1.03 and 0.09, respectively.
Fig. 10. FE prediction v.s. test data of CES columns subjected to eccentric loadings [16].
4. Strength Interaction Diagrams of CES Columns 4.1. Finite Element Analysis The verified simplified 3D FE analysis is used to construct the strength interaction diagrams of the CES columns. Only major axis bending is considered. The diagram is constructed by connecting points that represent the concentric and eccentric loads of different eccentricities, including compression and tension

DOI:10.4186/ej.2019.23.6.299
ENGINEERING JOURNAL Volume # Issue #, ISSN 0125-8281 (http://www.engj.org/) 307
phases, with a straight line. The FE models of the CES columns subjected to concentric and eccentric loads with different eccentricities (e/D=0, e/D=0.15, e/D=0.27, e/D=0.50, e/D=1.00, e/D=2.00 and e/D=4.00) are analyzed. An example FE model is shown in Fig. 11. At a specific eccentricity, the maximum load is obtained. Figure 12 shows the construction of strength interaction diagram of specimen SRC2 in Chen and Yeh 1996 (yield strength of structural steel is 240 MPa, yield strength of reinforcement steel is 400 MPa, and compressive strength of concrete is 40 MPa). s
(a) top view (b) side view
Fig. 11. Example FE model of CES column subjected eccentric loading (e/D=1.00).
Fig. 12. Construction of FE strength interaction diagram. 4.2. Effects of Material Properties on Strength Interaction Diagrams To investigate the effects of design parameters on the strength interaction diagrams of the CES columns, specimen SRC2 in Chen and Yeh 1996 [15] is chosen. The specimen height is 1200 mm. The cross-section
is 280 280 mm with 12 longitudinal reinforcement bars. The structural steel is H shape. Diameters of longitudinal reinforcement bars and stirrups are 15.9 and 8 mm, respectively. 4.2.1. Compressive Strength of Concrete Figure 13 shows the effect of concrete compressive strength on the FE strength interaction diagram. The compressive strength of concrete is varied from 10 to 40 MPa. The yield strengths of structural steel and reinforcement bars are 240 MPa and 400 MPa, respectively. The concrete strength has a significant effect on

DOI:10.4186/ej.2019.23.6.299
308 ENGINEERING JOURNAL Volume 23 Issue 6, ISSN 0125-8281 (http://www.engj.org/)
the column strength under combined compression and bending (compression phase) of the interaction diagram. However, it has a minimal effect on the strength under combined tension and bending (tension phase) of the interaction diagram. A comparison between the FE predictions and the plastic stress distribution method (AISC 2016) is shown in Fig. 14. The AISC360-16 predicts lower strengths of the CES columns than FE analysis. Such difference increases when concrete strength increases.
Fig. 13. Effect of compressive strength of concrete on strength interaction diagrams of CES columns.
(a) 10 MPa (b) 20 MPa
(c) 40 MPa
Fig. 14. FE strength interaction diagrams vs. AISC360-16 plastic stress distribution method (effect of compressive strength of concrete). 4.2.2. Yield Strength of Structural Steel
DOI:10.4186/ej.2019.23.6.299
ENGINEERING JOURNAL Volume # Issue #, ISSN 0125-8281 (http://www.engj.org/) 309
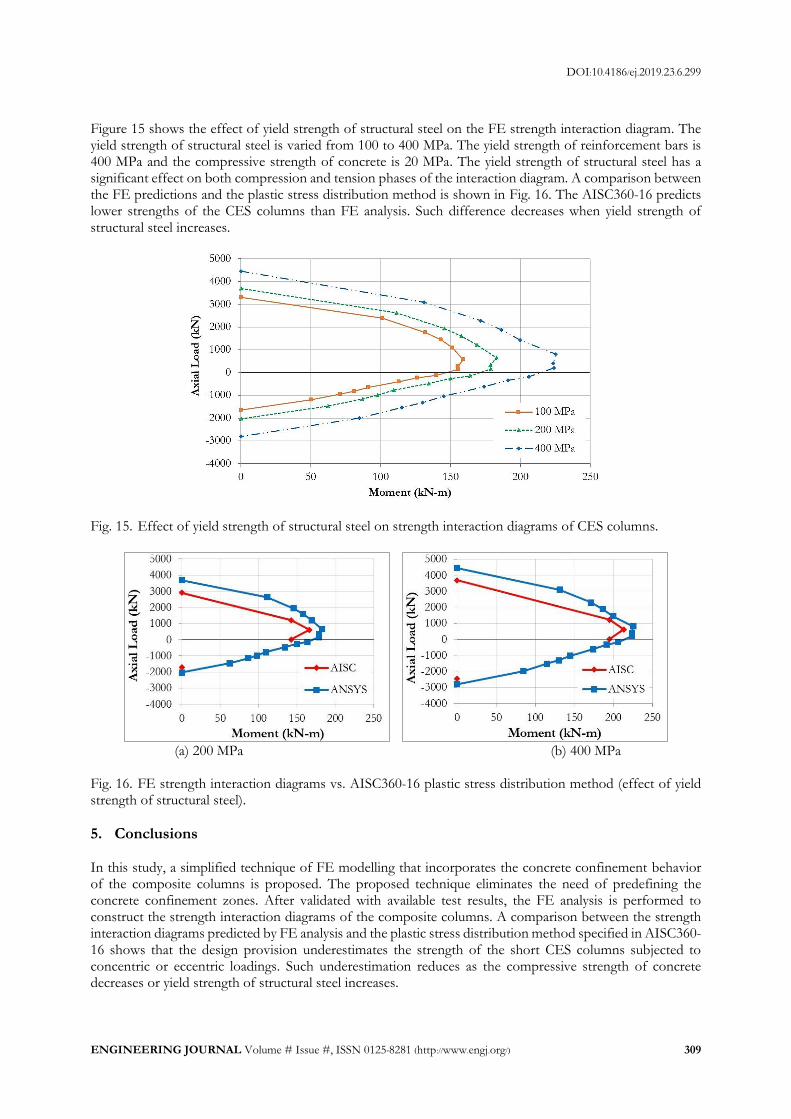
Figure 15 shows the effect of yield strength of structural steel on the FE strength interaction diagram. The yield strength of structural steel is varied from 100 to 400 MPa. The yield strength of reinforcement bars is 400 MPa and the compressive strength of concrete is 20 MPa. The yield strength of structural steel has a significant effect on both compression and tension phases of the interaction diagram. A comparison between the FE predictions and the plastic stress distribution method is shown in Fig. 16. The AISC360-16 predicts lower strengths of the CES columns than FE analysis. Such difference decreases when yield strength of structural steel increases.
Fig. 15. Effect of yield strength of structural steel on strength interaction diagrams of CES columns.
(a) 200 MPa (b) 400 MPa
Fig. 16. FE strength interaction diagrams vs. AISC360-16 plastic stress distribution method (effect of yield strength of structural steel).
5. Conclusions In this study, a simplified technique of FE modelling that incorporates the concrete confinement behavior of the composite columns is proposed. The proposed technique eliminates the need of predefining the concrete confinement zones. After validated with available test results, the FE analysis is performed to construct the strength interaction diagrams of the composite columns. A comparison between the strength interaction diagrams predicted by FE analysis and the plastic stress distribution method specified in AISC360-16 shows that the design provision underestimates the strength of the short CES columns subjected to concentric or eccentric loadings. Such underestimation reduces as the compressive strength of concrete decreases or yield strength of structural steel increases.

DOI:10.4186/ej.2019.23.6.299
310 ENGINEERING JOURNAL Volume 23 Issue 6, ISSN 0125-8281 (http://www.engj.org/)
Acknowledgement The first author would like to acknowledge the 100th Anniversary Chulalongkorn University Fund for Doctoral Scholarship, the 90th Anniversary Chulalongkorn University Fund (Ratchadaphiseksomphot Endowment Fund), and the Civil Engineering Centennial Scholarship of Chulalongkorn University.
References [1] SSRC, Task Group 20, “A specification for the design of steel-concrete composite columns,” AISC
Engineering Journal, Fourth Quarter, pp.101–15, 1979. [2] S. A. Mirza and B. W. Skrabek, “Reliability of short composite beam-column strength interaction,”
Journal of Structural Engineering, ASCE, vol. 117, no. 8, pp. 2320–39, 1991. [3] S. A. Mirza and B. W. Skrabek, “Statistical analysis of slender composite beam–column strength,” Journal
of Structural Engineering, ASCE, vol. 118, no. 5, pp. 1312–31, 1992. [4] J. M. Ricles and S. D. Paboojian, “Seismic performance of steel-encased composite columns,” Journal of
Structural Engineering, vol. 120, no. 8, 1994. [5] S. A. Mirza, V. Hyttinen, and E. Hyttinen, “Physical tests and analyses of composite steel–concrete
beam–columns,” Journal of Structural Engineering, ASCE, vol. 122, no. 11, pp. 1317–26, 1996. [6] B. Kato, “Column curves of steel-concrete composite members,” Journal of Constructional Steel Research,
vol. 39, no. 2, 1996. [7] Y. C. Wang, “Test on slender composite columns,” Journal of Constructional Steel Research, vol. 49, pp. 25-
41, 1999. [8] C. C. Weng and S. I. Yen, “Comparisons of concrete-encased composite column strength provisions of
ACI code and AISC specification,” Engineering Structures, vol. 24, pp. 59-72, 2002. [9] C. C. Chen and N. J. Lin, “Analytical model for predicting axial capacity and behavior of concrete
encased steel composite stub columns,” Journal of Constructional Steel Research, vol. 62, pp. 424–33, 2006. [10] V. S. Ky, S. Tangaramvong, and T. Thepchatri, “Inelastic analysis for the post-collapse behavior of
concrete encased steel composite columns under axial compression,” Journal of Steel and Composite Structures, vol. 19, no. 5, pp. 1237-58, 2015.
[11] S. Chen, and P. Wu, “Analytical model for predicting axial compressive behavior of steel reinforced concrete column,” Journal of Constructional Steel Research, vol. 128, pp. 649-660, 2017.
[12] E. Ellobody and B. Young, “Numerical simulation of concrete encased steel composite columns,” Journal of Constructional Steel Research, vol. 67, pp. 211–22, 2011.
[13] E. Ellobody, B. Young, and D. Lam, “Eccentrically loaded concrete encased steel composite columns,” Thin-Walled Structures, vol. 49, pp. 53–65, 2011.
[14] ANSYS, ANSYS User’s Manual, ANSYS 15.0, ANSYS, Inc., Canonsburg, Pennsylvania, 2014. [15] C. C. Chen and S. C. Yeh, “Ultimate strength of concrete encased steel composite columns,” in Proceeding
of the Third National Conference on Structural Engineering, 1996. [16] A. M. Al-Shahari, Y. M. Hunaiti, and B. A. Ghazaleh, “Behavior of lightweight aggregate concrete-
encased composite columns,” Steel and Composite Structures, vol. 3, no. 2, pp. 97–110, 2003. [17] AISC, Specification for Structural Steel Buildings. American Institute of Steel Construction, ANSI/AISC 360-
16, Chicago, Illinois, 2016. [18] R. Park and T. Paulay, Reinforced Concrete Structures. A Wiley-Interscience, 1975. [19] M. Samaan, A. Mirmiran, and M. Shahawy, “Model of concrete confined by fiber composites,” Journal
of Structural Engineering, vol. 124, no. 9, pp. 1025-31, 1998. [20] J. B. Mander, M. J. N. Priestly, and R. Park, “Theoretical stress-strain model for confined concrete,”
Journal of Structural Engineering, ASCE, vol. 114, no. 8, pp. 1804–26, 1988. [21] K. J. William and E. P. Warnke, “Constitutive model for the triaxial behaviour of concrete,” presented
at Seminar on Concrete Structures Subjected to Triaxial Stresses, Bergamo, Italy, 1974.