Embed Size (px)
Citation preview

GEOHYDROLOGICAL AND
STRUCTURAL ANALYSIS AND MONITORING
I&W CAVERN, CARLSBAD, NEW MEXICO
STATUS REPORT NO. 1
Topical Report RSI-2060 Revision 1
prepared for
New Mexico Oil Conservation Division 1220 South St. Francis Drive
Santa Fe, New Mexico 87505
June 2009

GEOHYDROLOGICAL AND
STRUCTURAL ANALYSIS AND MONITORING
I&W CAVERN, CARLSBAD, NEW MEXICO
STATUS REPORT NO. 1
Topical Report RSI-2060 Revision 1
by
David A. Henard Leo L. Van Sambeek Michael G. Wallace
William M. Goodman Crystal M. Hocking Charles A. Barber
Eric L. Krantz
RESPEC P.O. Box 725
Rapid City, South Dakota 57709
prepared for
New Mexico Oil Conservation Division 1220 South St. Francis Drive
Santa Fe, New Mexico 87505
June 2009

i
EXECUTIVE SUMMARY, CONCLUSIONS, AND RECOMMENDATIONS
Since early April 2009, a series of tasks have been undertaken to characterize and monitor ground conditions at the I&W brine well facility in Carlsbad, New Mexico, and to assess the potential for, and possible consequences of, a cavern collapse (sinkhole) at the site. Accomplishment of three particular tasks enables us to render preliminary conclusions and offer recommendations relative to public safety.
The geohydrological characterization revealed there are no unusual geological, structural, or
hydrological factors that render this cavern site different from what was originally revealed in the driller’s logs. This finding has both positive and negative implications regarding cavern stability. Because the geological setting (relative to rock mechanics considerations) is similar to the two other 2008 cavern collapse (sinkhole) sites, rock strata overlying the cavern at the I&W site cannot be expected to be any stronger than the bridging units that failed at the other sites. However, no geological anomalies or brittle structures (i.e., fracture zones or faults) were discovered that would complicate the stability analysis. That is a positive aspect of the characterization completed to date.
The preliminary monitoring (early-warning system) installed during May and June has
already provided enough information that we can conclude the cavern is not actively failing. The surface is subsiding, but the subsidence rates directly over the cavern are about 1 inch per year or less. Similarly, angular tilts are being measured; however, the tilt rates are small (generally on the order of 1,000 microradians per year or less). The tilt direction has not indicated that a surface subsidence pattern is emerging.
As of late June, components of an automated warning system were in place and the remote
data acquisition and evaluation were started. The system currently consists of three ultra high-resolution borehole tiltmeters to monitor for the earliest indications of accelerating surface subsidence that could portend a potential cavern collapse. Two groundwater observation wells are instrumented with pressure transducers and dataloggers to monitor for any sudden changes in water level. The units are set to collect data at a high rate because any sudden change in water level related to vertical migration of water from the surficial aquifer to fill developing fracture porosity in the underlying Rustler strata will be transient. Because of the high permeability of the surficial aquifer, the water levels in the wells will likely recover quickly.
The most critical concern remaining relative to characterization of the I&W site is the lack of
documentation on the geometry of the well cavern. At present, one can only speculate on its shape and size, whether or not it has already failed into the lower Rustler Formation, and how deep a sinkhole could form before a potential collapse self arrests. Progress needs to be made in mapping the cavern void to determine its vertical and lateral boundaries. Indirect, geophysical mapping methods (two- and three-dimensional (2D and 3D) seismic, microgravity, and 3D

ii
electrical resistivity) were evaluated for their applicability to the site. No one technique is ideally suited to provide a complete, high-resolution image of the cavern. A sonar survey was conducted in one of the two wells in 2007, but only a relatively small cavern at the top of the salt was imaged. The goals of the 2007 sonar survey are unclear, but that survey did not provide adequate mapping of the large-diameter, morning glory-shaped cavern expected to exist after many years of reverse circulation solution mining with no blanket material. Reentering the cavern by an inclined well (for safety) will provide more information than the 2007 survey.
Based upon the findings to date, RESPEC offers the following recommendations:
• Reduce the frequency of manual data collection on the surface subsidence and manually read tilt plates. The past 6 weeks of data collection provide enough information on the background rates of surface movement to reduce the frequency of the measurements. The current frequency of every weekday (5 days per week) can be reduced to once or twice weekly, depending on whether any changes in data trends are detected.
• Remount tilt plates on wood beams should be relocated onto concrete pads or other structures.
• Prepare an assessment report on the data collected by the automated warning system after collecting 4 weeks of data (or sooner if the data quality suggests it is possible). This report will assess the reliability and quality of the data, the cultural noise in the data that causes false-positive alarms, the effects of earth tides and barometric pressure changes, and a comparison to the manually measured information (subsidence and tilts).
• Continue real-time early-warning monitoring effort.
• Develop and implement a plan to determine the geometry of the cavern. Mapping of the cavern geometry is essential in understanding the measured surface data (subsidence and tilts), allowing better engineering calculations of stability and developing remediation plans. An option for determining cavern geometry is to drill an inclined well into the cavern within the outline from the 2007 sonar survey. Another sonar survey should be performed, but fully inform the sonar company of the history of the cavern (two wells with the drilling logs and casing schedules, one well operated on injection and the other as a withdrawal well with reverse circulation mode of operation, no blanket material, history of at least 6.25 million barrels of produced brine, previous sonar surveys). Sonar surveys still might not be able to see to the ultimate diameter because the cavern height tapers too thin for sonar penetration without obscuring echoes. If the majority of the cavern volume is proven to exist as a thin, large-diameter lens, then cavern collapse becomes ever less of a concern because the maximum sinkhole depth decreases proportionally. Even if the sonar survey fails to define the maximum cavern diameter, the maximum sinkhole depth will be determined. Cavern geometry determined by sonar survey might be supplemented by seismic reflection, microgravity surveys, 3D electrical resistivity, and potentially other methods of cavern delineation.

iii
• Include backfilling in the mitigation plan. In situ backfilling would be slow and costly. Tailings could be trucked from one of the local potash mines. The material would be slurried into the cavern through inclined wells (at least three) aimed at the highest points along the centerline of the cavern. If stability monitoring shows that the cavern is stable, the two Eugenie wells could be drilled out and reentered (but only if there is significant cost savings over drilling inclined wells). As slurry is placed, brine would be displaced to lower the head in the cavern so actual flow of the slurry occurs rather than just sinking and settling of the solids. An engineering study would be required to calculate the maximum backfill rate through different numbers of wells to determine a trucking and backfilling schedule.
• Drill and complete three observation/monitoring wells into cavern.
• Monitor and maintain fluid levels in open cavern as prescribed by the Oil Conservation Division (OCD) at cavern closure.
• Determine cavern stabilization effectiveness of fluid level maintenance.
• Review mitigation options and make recommendations.
• Engineer and design the most technically advantageous mitigation option.
• Define a set of candidate water wells nearby in which water level will be measured daily for a month (to define baseline and variability), then reevalute measurement frequency. The wells might include C1275, C01953, C01578, C00013, C00978, C00012, C00067, and C90067. The results can be incorporated into contour plots to determine if there is any evidence of a gradient shift toward the site.
• Drill a monitor well into the Rustler Aquifer near the site but upgradient to the west and north, and monitor the water according to the recommendations above (monthly water-quality samples and depth-to-water).
• Measure stage and flow in the canal for a period of time to compare to irrigation district estimates by installing a continuous stage-recording device and developing a stage-discharge relationship.
• Collect monthly water-quality samples to analyze for baseline concentrations of major cations, major anions, and specific conductance from monitoring wells on site, those monitoring wells identified in the above list, and the irrigation canal. This information will be useful to determine baseline water quality in the event that a collapse degrades or changes water quality.
• Conduct a grouting cost study by (1) building upon the dewatering analysis already conducted while evaluating the full pumping scenario with a more refined model, such that no individual well pumps more than 1,000 gallons per minute (gpm); (2) building a set of models to also evaluate the impacts of selective grouting, which could reduce pumping needs; and (3) performing a cost benefit analysis that considers grouting, or

iv
pumping, or a combination of both, to determine the most cost-effective approach to dewatering.
• Implement Phase II of the subsurface modeling. This modeling effort would serve to provide a more detailed geological description of the site, identify the cavern geometry, and provide input into a groundwater model. Future efforts may require two models, both of which can be built starting with the existing model. Information gathered from future seismic and sonar tests will be incorporated for the detailed visualization of members and beds of these formations and caverns. The model will also become important for producing a synthetic seismogram for any future seismic reflection processes. Future models built from the Phase I model will facilitate better visualization and modeling of the groundwater flow system. Well logs for wells distant from the site can be added to improve the far-field details of the model. Elevations from the Mining Visualization System (MVS) model can be used as input into a groundwater flow or dewatering model. From the model, structural contour and isopach maps could also be generated. The maps would allow accurate estimation of drilling depth to the top of formations at a given location; hence, providing a tool to estimate time and materials needed before drilling.

v
TABLE OF CONTENTS
1.0 INTRODUCTION AND BACKGROUND........................................................................ 1
2.0 GEOLOGY ............................................................................................................................ 4
2.1 GEOLOGICAL SITE CHARACTERIZATION ........................................................... 4 2.1.1 Introduction........................................................................................................ 4
2.1.2 Stratigraphy-Lithology ...................................................................................... 4
2.1.2.1 Alluvial Deposits.................................................................................... 4 2.1.2.2 Permian—Rustler Formation ............................................................... 6
2.1.2.3 Permian—Salado Formation ................................................................ 6
2.1.3 Site-Specific Stratigraphy ................................................................................. 7 2.1.4 Conclusions......................................................................................................... 10
2.2 NEARBY SINKHOLE GEOLOGY .............................................................................. 11 2.2.1 Background......................................................................................................... 11
2.2.2 Sinkhole Geological Analysis ............................................................................ 11
2.2.3 Groundwater and Surface Water Interactions ................................................ 17 2.2.4 Discussion and Conclusion................................................................................ 17
2.3 GEOLOGICAL MODELING PHASE I ....................................................................... 18
2.3.1 Introduction........................................................................................................ 18 2.3.2 Methodology ....................................................................................................... 18
2.3.3 Results and Products ......................................................................................... 21
2.3.4 Phase II Model Refinement Plans .................................................................... 23
3.0 SURFACE MONITORING AND EARLY-WARNING SYSTEM ................................. 25
3.1 BACKGROUND............................................................................................................ 25
3.2 TILT MEASUREMENTS............................................................................................. 25
3.3 SUBSIDENCE SURVEY.............................................................................................. 31 3.4 EARLY-WARNING SYSTEM...................................................................................... 33
3.4.1 Sensors................................................................................................................ 36 3.4.2 Online Data ........................................................................................................ 36
4.0 REFERENCES..................................................................................................................... 38
4.1 CITED REFERENCES................................................................................................. 38
4.2 DOCUMENTS REVIEWED PERTAINING TO LOCAL BRINE WELLS ............... 39
APPENDIX A. SURFACE TILT METER DATA BY LOCATION .................................... A-1
APPENDIX B. SURFACE TILT METER TIME-SERIES GRAPHS ................................ B-1
APPENDIX C. DAILY SURVEY DATA.................................................................................. C-1
APPENDIX D. TIME-SERIES SUBSIDENCE GRAPHS ................................................... D-1

vi
TABLE OF CONTENTS (Continued)
APPENDIX E. STANDARD OPERATING PROCEDURES FOR THE I&W BRINE CAVERN SITE DATA COLLECTION ........................................................ E-1
APPENDIX F. HEALTH AND SAFETY PLAN FOR THE I&W BRINE CAVERN SITE................................................................................................................... F-1
APPENDIX G. BRINE WELL CHRONOLOGY REPORT.................................................. G-1
APPENDIX H. EMAIL REGARDING IRRIGATION IMPACTS FOLLOWING COLLAPSE AT THE I&W BRINE CAVERN SITE .................................. H-1
APPENDIX I. HYDROGEOLOGIC ANALYSIS OF THE I&W BRINE CAVERN SITE................................................................................................................... I-1
APPENDIX J. WATER WELLS WITHIN 6 MILES OF THE I&W BRINE FACILITY......................................................................................................... J-1

vii
LIST OF TABLES
TABLE PAGE
2-1 Top-of-Salt Data From Area Wells ................................................................................. 7
2-2 Stratigraphy at the I&W Brine Cavern Site in Carlsbad, New Mexico ...................... 9
2-3 Summary of D/H Ratio Information for I&W, Artesia, and Loco Hills Brine Caverns............................................................................................................................. 14
3-1 Tiltplate Type and Mounting Surface ............................................................................ 26
3-2 Tilt Rates for Each Tiltplate Read Using the Manually Read, Portable Tiltmeter.... 28
3-3 Surface Subsidence Rate and Standard Deviation for the Linear-Regression-Rate for Each Benchmark........................................................................................................ 34
A-1 Surface Tilt Meter Data for Site 1 .................................................................................. A-2
A-2 Surface Tilt Meter Data for Site 2 .................................................................................. A-5
A-3 Surface Tilt Meter Data for Site 3 .................................................................................. A-8
A-4 Surface Tilt Meter Data for Site 4 ..................................................................................A-11
A-5 Surface Tilt Meter Data for Site 5 ..................................................................................A-14
A-6 Surface Tilt Meter Data for Site 6 ..................................................................................A-17
A-7 Surface Tilt Meter Data for Site 7 ..................................................................................A-20
A-8 Surface Tilt Meter Data for Site 8 ..................................................................................A-23
A-9 Surface Tilt Meter Data for Site 9 ..................................................................................A-26
A-10 Surface Tilt Meter Data for Site 10................................................................................A-29
A-11 Surface Tilt Meter Data for Site 11................................................................................A-32
A-12 Surface Tilt Meter Data for Site 12................................................................................A-35
A-13 Surface Tilt Meter Data for Site 13................................................................................A-38
I-1 Simulated Pumping Schedules for Alluvial and Rustler Wells.................................... I-18

viii
LIST OF FIGURES
FIGURE PAGE
1-1 Location of the I&W Brine Cavern Site in Carlsbad, New Mexico .............................. 2
2-1 View (Looking Southwest) of a Three-Dimensional Cavern in Relation to Site Stratigraphy..................................................................................................................... 5
2-2 Stratigraphy at the I&W Cavern Site in Carlsbad, New Mexico................................. 8
2-3 Jim’s Water Service (BW-5) Site Location, (A) Presinkhole Development and (B) Postsinkhole Development........................................................................................ 12
2-4 Loco Hills (BW-21) Site Location (A) Presinkhole Development and (B) Postsinkhole Development........................................................................................ 13
2-5 Estimated Extents of Brine Caverns at the I&W Cavern Site, Carlsbad, New Mexico............................................................................................................................... 15
2-6 Sonar Profile of Loco Hills Cavern Conducted in 2001................................................. 16
2-7 Six-Mile by Six-Mile Extent of the Three-Dimensional Subsurface Model................. 19
2-8 Example of the Representation of the I&W Cavern That Was Entered into the Subsurface Model ............................................................................................................ 21
2-9 View of Three-Dimensional Cavern in Relation to Site Stratigraphy ......................... 22
2-10 Fence Diagram Through the I&W Site .......................................................................... 23
3-1 Locations of the 13 Tilt Plates Being Read With the Portable Tiltmeter.................... 27
3-2 Tilt Sensor Pads With Magnitude and Direction of Tilt............................................... 29
3-3 Tilt Sensor Pads With Magnitude and Direction of Tilt at Sites With Pad Not Mounted on Wood ............................................................................................................ 30
3-4 Locations of the Surface Subsidence Benchmarks........................................................ 32
3-5 Subsidence Rates (Inches/Year) Through June 19, 2009.............................................. 35
3-6 Installation of Wells for Borehole Tilt Meters (BTMs) ................................................. 37
B-1 Surface Tilt Meter Graph for ST-1 ................................................................................. B-2
B-2 Surface Tilt Meter Graph for ST-2 ................................................................................. B-3
B-3 Surface Tilt Meter Graph for ST-3 ................................................................................. B-4
B-4 Surface Tilt Meter Graph for ST-4 ................................................................................. B-5
B-5 Surface Tilt Meter Graph for ST-5 ................................................................................. B-6
B-6 Surface Tilt Meter Graph for ST-6 ................................................................................. B-7
B-7 Surface Tilt Meter Graph for ST-7 ................................................................................. B-8

ix
LIST OF FIGURES (Continued)
FIGURE PAGE
B-8 Surface Tilt Meter Graph for ST-8 ................................................................................. B-9
B-9 Surface Tilt Meter Graph for ST-9 .................................................................................B-10
B-10 Surface Tilt Meter Graph for ST-10 ...............................................................................B-11
B-11 Surface Tilt Meter Graph for ST-11 ...............................................................................B-12
B-12 Surface Tilt Meter Graph for ST-12 ...............................................................................B-13
B-13 Surface Tilt Meter Graph for ST-13 ...............................................................................B-14
D-1 Time-Series Subsidence Graph for Location 1............................................................... D-2
D-2 Time-Series Subsidence Graph for Location 7............................................................... D-3
D-3 Time-Series Subsidence Graph for Location 8............................................................... D-4
D-4 Time-Series Subsidence Graph for Location 9............................................................... D-5
D-5 Time-Series Subsidence Graph for Location 101 .......................................................... D-6
D-6 Time-Series Subsidence Graph for Location 102 .......................................................... D-7
D-7 Time-Series Subsidence Graph for Location 103 .......................................................... D-8
D-8 Time-Series Subsidence Graph for Location 104 .......................................................... D-9
D-9 Time-Series Subsidence Graph for Location 105 ..........................................................D-10
D-10 Time-Series Subsidence Graph for Location 106 ..........................................................D-11
D-11 Time-Series Subsidence Graph for Location 107 ..........................................................D-12
D-12 Time-Series Subsidence Graph for Location 108 ..........................................................D-13
D-13 Time-Series Subsidence Graph for Location 109 ..........................................................D-14
D-14 Time-Series Subsidence Graph for Location 110 ..........................................................D-15
D-15 Time-Series Subsidence Graph for Location 111 ..........................................................D-16
D-16 Time-Series Subsidence Graph for Location 112 ..........................................................D-17
D-17 Time-Series Subsidence Graph for Location 113 ..........................................................D-18
D-18 Time-Series Subsidence Graph for Location 114 ..........................................................D-19
D-19 Time-Series Subsidence Graph for Location 201 ..........................................................D-20
D-20 Time-Series Subsidence Graph for Location 202 ..........................................................D-21
D-21 Time-Series Subsidence Graph for Location 203 ..........................................................D-22
D-22 Time-Series Subsidence Graph for Location 204 ..........................................................D-23
D-23 Time-Series Subsidence Graph for Location 301 ..........................................................D-24

x
LIST OF FIGURES (Continued)
FIGURE PAGE
D-24 Time-Series Subsidence Graph for Location 302 ..........................................................D-25
D-25 Time-Series Subsidence Graph for Location 303 ..........................................................D-26
D-26 Time-Series Subsidence Graph for Location 304 ..........................................................D-27
D-27 Time-Series Subsidence Graph for Location 401 ..........................................................D-28
D-28 Time-Series Subsidence Graph for Location 402 ..........................................................D-29
I-1 Hydrogeographic Information Pertaining to the BW-6 Site......................................... I-4
I-2 Watersheds That Capture Recharge to the Capitan Reef Aquifer............................... I-6
I-3 Alluvial Aquifer and Other Related Features in the Carlsbad Area ........................... I-7
I-4 Carlsbad Irrigation District Irrigation System ............................................................. I-8
I-5 Image Showing the Spatial Grid (Black Lines) and Other Geographic and Physiographic Features................................................................................................... I-12
I-6 Addition of the Rustler Aquifer (Green Zone) to Layer 2 of the SEO Model............... I-14
I-7 Well Positions (Green Triangles) Assigned to Alluvial Aquifer ................................... I-15
I-8 Well Positions (Green Triangles) Assigned to Rustler Aquifer .................................... I-16
I-9 Drawdowns (in Feet) Within Alluvial Aquifer After 5 Months of Pumping According to the Simulated Pumping Schedule ............................................................ I-20
I-10 Drawdowns (in Feet) Within Rustler Aquifer After 5 Months of Pumping According to the Simulated Pumping Schedule ............................................................ I-21
I-11 Drawdowns (in Feet) Within Alluvial Aquifer After 3 Months of Pumping According to the Simulated Pumping Schedule ............................................................ I-22

1
1.0 INTRODUCTION AND BACKGROUND
The I&W site (BW-6) is located at Carlsbad, New Mexico (Figure 1-1). Specifically, the site is located in the NW¼ of SW¼ and SW¼ of SW¼ of S17-T22S-R27E, south and adjacent to the intersection of Highway 285 and Highway 62, a location known locally as “the South Y.” This is the site of a solution mine that operated almost continuously from 1979 until July 2008. The operation produced brine through the injection of fresh water into the Salado halite formation and the extraction of the resulting brine, resulting in the formation of an underground cavern which grew over the time of operation. Two wells were used in the operation, solution mining was conducted using two wells, designated Eugenie #1 (E-1) and Eugenie #2 (E-2).
In 2008, two brine well collapses in southeastern New Mexico triggered concern about
stability of similar wells in the area. On July 16, 2008, Jim’s Water Service reported the “disappearance” of its brine well to the New Mexico Oil Conservation Division (OCD). A similar collapse occurred on November 3, 2008, at the Loco Hills Water Disposal Company brine well operation. Immediately following the July collapse, OCD began reviewing operations of other brine wells in the area and determined that geologic and operative conditions at the I&W, Inc. (I&W) brine well in Carlsbad were similar to those at Jim’s Water Service. The brine well’s proximity to surrounding structures, highways, and an irrigation canal is a cause for elevated concern.
RESPEC attended the Brine Well Work Group discussion hosted by OCD in March 2009.
Other attendees included the OCD, Bureau of Land Management, State Land Office, New Mexico Bureau of Geology and Mineral Resources, and National Cave & Karst Research Institute. Numerous attendees expressed their mutually held concern about a potential collapse at the I&W site [New Mexico Oil Conservation Division, 2009].
On April 2, 2009, RESPEC was retained by OCD to provide technical advice and to evaluate
and monitor site characteristics. RESPEC assembled a team of engineers, geologists, and field-instrumentation specialists to perform the following tasks:
• Task 1 – Review available records for the subject site and the brine well collapse sites exhibiting similar geologic conditions.
• Task 2 – Map the subsurface geology of the subject site and adjacent areas from the Salado Formation to the surface and define the hydrogeology of the local alluvial sediments and the Permian strata overlying the Salado Formation.
• Task 3 – Develop a preliminary three-dimensional (3D) model of the subsurface geology of the subject site with the estimated extent of the cavern.

2
RSI-1886-09-057
Figure 1-1. Location of the I&W Brine Cavern Site in Carlsbad, New Mexico.

3
• Task 4 – Develop and populate a geospatial database to be made available to the client.
• Task 5 – Evaluate and report on the stability of the overburden of the subject site.
• Task 6 – Provide technical support to the OCD.
Since being retained, RESPEC moved forward on this project by fulfilling task requirements and communicating with local and federal agencies. Meetings were held with Carlsbad Irrigation District; New Mexico Energy Minerals, and Natural Resources Department; elected officials from the city of Carlsbad; the OCD; Eddy County officials, including Office of Emergency Management, New Mexico Department of Homeland Security and Emergency Management, Department of Transportation, National Cave & Karst Research Institute; U.S. Department of Energy, Bureau of Land Management, and fire and police officials from Carlsbad; and a representative of I&W and its counsel.
This report documents methods and findings related to the above-listed tasks. This report
describes current on site monitoring activities, provides a description of the monitoring equipment, analyzes and summarizes the data collected on site, provides recommendations concerning future work at the I&W site, and provides a basis for making educated and timely management decisions.

4
2.0 GEOLOGY
2.1 GEOLOGICAL SITE CHARACTERIZATION
The objective of the geological site characterization task is to provide a description of subsurface lithologic units at the I&W Cavern site.
2.1.1 Introduction
There are no known open-hole or cased-hole geophysical logs available for the two on site wells. Driller’s logs for E-1 and E-2 and geophysical logs from regional oil and gas wells were used as a basis for interpretations of site-specific subsurface conditions. Abundant information on local surficial alluvial deposits is readily available, and lithologic descriptions for the alluvium were taken from published literature. Detailed descriptions of Permian age formations that subcrop below the alluvial deposits generally have not been published except where noted for the Rustler Formation.
2.1.2 Stratigraphy-Lithology
The project site lies near the westernmost boundary of the Delaware Basin. Permian Rustler and Salado Formations pinchout abruptly against the Capitan Reef complex approximately 1½ miles northwest of the site location. Figure 2-1 is a simplified illustration of the geology and caverns at the I&W site. This cross-section was generated as part of the preliminary 3D subsurface modeling (see Section 2.3 of this report).
2.1.2.1 Alluvial Deposits
Alluvial deposits consist of gravel, sand, and silt with beds of caliche and limestone/ conglomerates. These stratified sediments were deposited primarily by the Pecos River and its tributaries, but some eolian deposits may be present. The alluvial deposits yield large quantities of fair-quality water. Measured depth to water from groundwater monitoring wells located on the I&W site is ±49.5 feet below ground surface (bgs).
Regional thickness and structural contour maps developed by Hiss [1975a] were used to supplement the available well log information. Within the Carlsbad area, the Quaternary Pecos Valley Alluvium (along with the Capitan Reef Aquifer) is a principal source of supplemental irrigation water. North of the site, where the alluvial aquifer directly overlies the Capitan Reef aquifer, the two aquifers are in hydraulic connection [Barroll et al., 2004].

5
RSI-1886-09-001
Figure 2-1. View (Looking Southwest) of a Three-Dimensional Cavern in Relation to Site Stratigraphy. Approximate cavern size based on 2007 sonar survey (black) overlain on engineered cavern (blue).

6
2.1.2.2 Permian—Rustler Formation
The Rustler Formation can typically be divided into the Tamarisk and Culebra members in the Delaware Basin. Only the lower half of the typical Rustler Formation stratigraphic succession for the Delaware Basin is present at the project site. The upper half of the Rustler Formation is missing at the unconformity beneath the surficial alluvial deposits. The Rustler Formation at the project site consists of interstratified loosely consolidated red beds, hard anhydrite layers, and a few hard dolomites. Gypsum stringers are also present as recorded by driller’s logs for E-1 and E-2. Competent dolomite beds exceeding 100 feet vertical thickness grade laterally into interbedded red beds, anhydrites, and dolomites at the site.
Geophysical logs for the Belco Petroleum Corporation Autry #1 well and the Martin #2-#5
wells located in Section 20 south of the project site were used for correlation. Cased-hole gamma ray logs were run through the Rustler section in these wells. The stratigraphy interpreted from the gamma ray signatures for the Rustler sections in these wells is generally consistent with description of the same interval in the driller’s logs for E-1 and E-2.
The Cities Service Oil Company, Merland A #1 well, located in Section 19, provides a
representative resistivity log section for the Culebra member. Resistivity trends indicate the Culebra Member is a freshwater-bearing zone in this well. The Culebra carbonate interval occurs from 430 feet to 470 feet bgs with a water-bearing interval from 440 feet to 460 feet bgs. The water-bearing interval on the log exhibits a resistivity of 5.5 ohms, indicating the water is fresh. The driller’s log for E-1 makes reference to a “hard layer” from an interval of 430 feet to 437 feet bgs, which probably correlates with the Culebra carbonate interval.
The same well logs were used to define the lowermost Los Medanos member of the Rustler
Formation in the local section. The Los Medanos member is generally 60 feet to 100 feet thick and consists of interbedded anhydrites and limestones. This unit is not fully described in the project site area; however, the driller’s logs make reference to an interval consisting of anhydrite and lime from 445 feet to 456 feet bgs.
The Los Medanos member is notable in the project area as being the unit into which the first
casing string or “surface” casing is set for oil and gas wells. The OCD requires all Rustler and alluvial deposits be cased off and the casing annulus be cemented to surface to protect freshwater-bearing zones before drilling deeper into the underlying Salado Formation.
2.1.2.3 Permian—Salado Formation
The Salado Formation is overlain by the Rustler Formation and conformably overlies and interfingers with the Castile Formation [Bjorklund and Motts, 1959]. The Salado Formation is dominated by bedded salt deposits. The salts in the local section are capped by the lower Rustler, a 60- to 100-foot-thick interval of anhydrites with salt stringers. Regional structure contour maps of the Salado developed by Hiss [1975a] were used to supplement the available

7
well log information. The depth to the top of the bedded salts and the wellhead elevations with respect to sea level, based on geophysical logs and driller’s logs for the wells cited above, are listed in Table 2-1.
Table 2-1. Top-of-Salt Data From Area Wells
Well Name/Operator Location Surface
Elevation (ft)
Depth to Salt (ft)
Elevation at Salt
(ft)
Autry #1/Belco Pet. Sec. 20 3,136 680 2,456
Martin #5/Belco Pet. Sec. 20 3,140 720 2,420
Martin #4/Belco Pet. Sec. 20 3,128 690 2,438
Martin #3/Belco Pet. Sec. 20 3,132 690 2,442
Martin #2/Belco Pet. Sec. 20 3,136 625 2,511
Pecos 20/Mewbourne Sec. 20 3,128 584(a) 2,544
BW-19/Key Sec. 36 3,203 715(b) 2,493
Eugenie #1/PBS&S Sec. 17 3,126 456(c) 2,670
(a) Geologist report. (b) Operator report, well in T22S-R26E. (c) Driller’s log.
2.1.3 Site-Specific Stratigraphy
The stratigraphy at the I&W site is described in the driller’s log for E-1 and E-2. Figure 2-2 is a graphical representation of the stratigraphy from the driller’s log; the same information is also presented in Table 2-2. It should be noted that the accuracy of these logs is questionable and may not exactly represent the site stratigraphy. There are no known geophysical logs or core samples available for wells located on site for comparison.
The alluvial material at the site is 171 feet thick. The uppermost layer consists of topsoil
and gravel. The lower stratified sediments are composed of gravel, sand, and silt with beds of caliche and limestone with gravel.
The Rustler Formation at the project site consists of interstratified loosely consolidated red
beds, hard anhydrite layers, and a few hard dolomites. Gypsum stringers are also present as recorded by the driller’s logs for E-1 and E-2. The Rustler Formation has an approximate thickness of 285 feet and is located from 171 to 456 feet bgs.

8
RSI-1886-09-058
Figure 2-2. Stratigraphy at the I&W Cavern Site in Carlsbad, New Mexico.

9
Table 2-2. Stratigraphy at the I&W Brine Cavern Site in Carlsbad, New Mexico (Page 1 of 2)
Depth Stratigraphy Thickness
(ft) Top (ft)
Bottom (ft)
Top Soil With Gravel 18 0 18
Cave 1 18 19
Caliche and Gravel 27 19 46
Sand and Gravel, Some Water 4 46 50
Gravel and Limestone 8 50 58
Limestone 6 58 64
Red Beds 1 64 65
Red Sand 13 65 78
Gravel 29 78 107
Brown Clay, Gravel, and Sand 56 107 163
Red Beds 8 163 171
Hard Limestone 7 171 178
Red Beds 47 178 225
Anhydrite and Red Beds 12 225 237
Limestone and Anhydrite 15 237 252
Red Beds 47 178 225
Anhydrite and Red Beds 12 225 237
Limestone and Anhydrite 15 237 252
Red Beds 16 252 268
Limestone With Gypsum Stringers 12 268 280
Anhydrite 5 280 285
Gypsum With Some Red Beds 20 285 305
Gypsum and Anhydrite 15 305 320
Red Beds 10 320 330
Anhydrite With Limestone and Sandstone 30 330 360

10
Table 2-2. Stratigraphy at the I&W Cavern Site in Carlsbad, New Mexico (Page 2 of 2)
Depth Stratigraphy Thickness
(ft) Top (ft)
Bottom (ft)
Hard Rock and Anhydrite 50 360 410
Anhydrite With Some Limestone 20 410 430
Hard Limestone and Anhydrite 7 430 437
Anhydrite 8 437 445
Anhydrite and Limestone 11 445 456
Salt 112 456 568
Salt and Blue Shale Stringer 8 568 576
Salt 16 576 592
Anhydrite 18 592 610
At the present time, designation of member-scale units has not been made with confidence, although it is known that the Rustler sequence beneath the site is not complete. The upper part of the Rustler Formation has been eroded at the top of bedrock surface immediately beneath the alluvium. The bottom of the Rustler Formation, above the Salado Formation (between 330 feet and 456 feet bgs), consists of 126 feet of anhydrite with interbedded minor salt layers. The top of the Salado Formation is located at a depth of 456 feet. The driller’s log suggests that the upper 112 feet of the formation is a relatively pure salt interval. An 8-foot-thick bed of shaley salt and an 18-foot-thick anhydrite bed occur in the Salado Formation beneath the zone of relatively pure salt.
Future on site drilling should confirm and expand upon the known site stratigraphy. At the
time of drilling, detailed drill logs should be prepared by a geologist. Geophysical surveys (including gamma ray, sonic, density, and resistivity) of the wells is also essential and can be of use in comparing geophysical logs from other nearby wells and will be important should seismic reflection surveys be conducted at the site in the future.
2.1.4 Conclusions
Based on available site geological information, the following conclusions were made:
• Alluvial deposits are an important groundwater source for the area. Two groundwater monitoring wells are located on the I&W site.

11
• The upper Rustler Formation is not present in this area. The lower Rustler Formation is represented by Tamarisk and Culebra members. The Tamarisk member consists mainly of unconsolidated red beds and anhydrites with gypsum and thinly bedded limestone and dolomite. The Culebra member appears to be a minor freshwater-bearing zone.
• The Salado Formation is dominated by bedded salt with overlying and interbedded anhydrite members.
• The casing shoe for Eugenie #1 was set above the salt.
2.2 NEARBY SINKHOLE GEOLOGY
Information about the two other New Mexico brine well collapses during 2008 is presented herein for comparison with the I&W site.
2.2.1 Background
Over approximately the same time period that the I&W site operated, two similar brine caverns were developed to the north of Carlsbad, near the town of Artesia, New Mexico. The Jim’s Water Service site (BW-5) is located at NW¼ of SE¼ of S24-T18S-R28E and is shown in Figure 2-3. The Loco Hills site (BW-21) is located at SW¼ of SW¼ of S16-T17S-R30E and is shown in Figure 2-4. Both sites developed sinkholes in 2008.
2.2.2 Sinkhole Geological Analysis
Karimi-Jafari et al. [2008] examined hundreds of salt caverns, primarily in France and Kansas, and developed an empirical relationship that gauges the risk of sinkhole or other cave-in potential at solution-mined sites. The empirical relationship is based on the ratio between the maximum lateral extent of the cavern (the “diameter, D”) and the distance between the cavern roof and the land surface (the “height, H”). Karimi-Jafari et al. concluded that “cratering does not occur when the ratio between cavern diameter and cavern depth (D/H) is significantly smaller than 0.67. The locations Karimi-Jafari et al. examined had similar geologic conditions to the I&W site, including bedded salt deposits and overlying sedimentary strata of similar thicknesses.
The stability assessment method by Karimi-Jafari et al. was used to compare the Artesia,
Loco Hills, and I&W sites. Each of these brine wells was completed near the top of the Salado Formation. In addition, the overburden height (thickness) is similar for each site. Although the overburden materials vary somewhat for each site, the D/H ratio method does not require specifying material properties of overburden. Jafari’s method assumes that layered overburden behaves in a similar fashion to continuous overburden.

Figure 2-3. Jim’s Water Service (BW-5) Site Location (A) Presinkhole Development, (green lines represent quarter-quarter sections (40-acre delineations)) and (B) Postsinkhole Development (photograph taken summer 2008).
RS
I-1886-09-002
12
A
B

Figure 2-4 Loco Hills (BW-21) Site Location (A) Presinkhole Development (green lines represent quarter-quarter sections (40-acre delineations)) and (B) Postsinkhole Development (photograph taken in spring 2009).
RS
I-1886-09-003
13
A
B
14
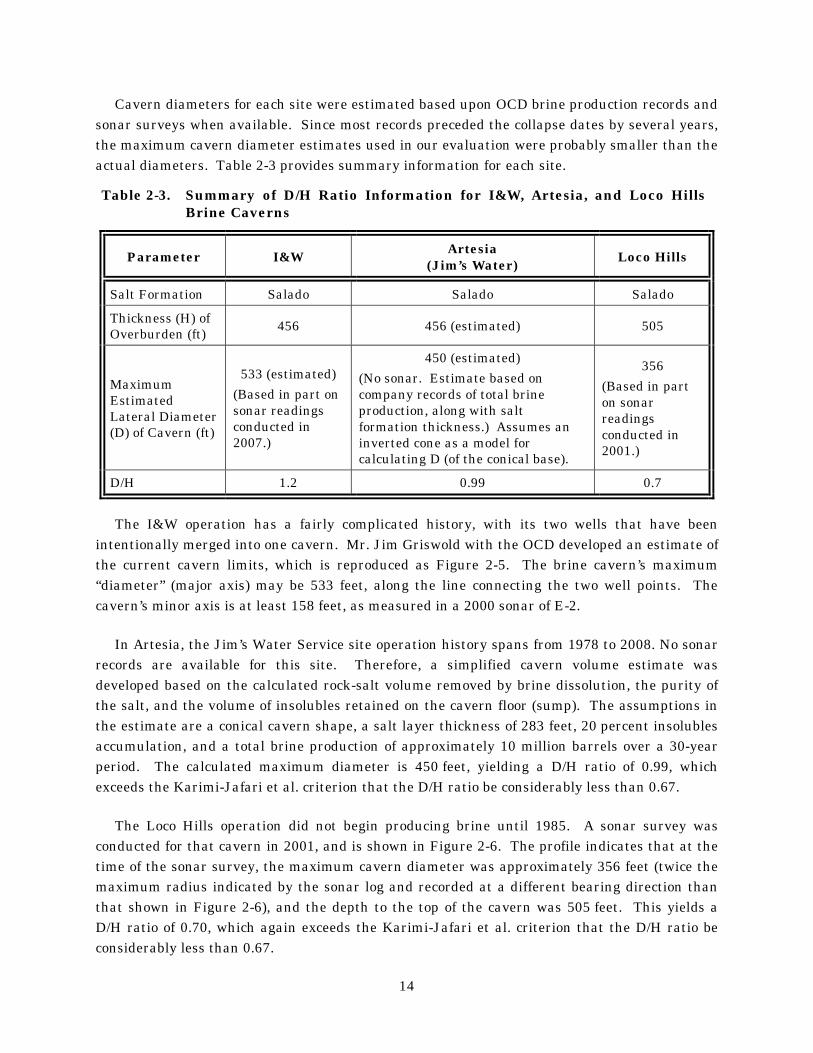
Cavern diameters for each site were estimated based upon OCD brine production records and sonar surveys when available. Since most records preceded the collapse dates by several years, the maximum cavern diameter estimates used in our evaluation were probably smaller than the actual diameters. Table 2-3 provides summary information for each site.
Table 2-3. Summary of D/H Ratio Information for I&W, Artesia, and Loco Hills Brine Caverns
Parameter I&W Artesia (Jim’s Water)
Loco Hills
Salt Formation Salado Salado Salado
Thickness (H) of Overburden (ft)
456 456 (estimated) 505
Maximum Estimated Lateral Diameter (D) of Cavern (ft)
533 (estimated)
(Based in part on sonar readings conducted in 2007.)
450 (estimated)
(No sonar. Estimate based on company records of total brine production, along with salt formation thickness.) Assumes an inverted cone as a model for calculating D (of the conical base).
356
(Based in part on sonar readings conducted in 2001.)
D/H 1.2 0.99 0.7
The I&W operation has a fairly complicated history, with its two wells that have been intentionally merged into one cavern. Mr. Jim Griswold with the OCD developed an estimate of the current cavern limits, which is reproduced as Figure 2-5. The brine cavern’s maximum “diameter” (major axis) may be 533 feet, along the line connecting the two well points. The cavern’s minor axis is at least 158 feet, as measured in a 2000 sonar of E-2.
In Artesia, the Jim’s Water Service site operation history spans from 1978 to 2008. No sonar records are available for this site. Therefore, a simplified cavern volume estimate was developed based on the calculated rock-salt volume removed by brine dissolution, the purity of the salt, and the volume of insolubles retained on the cavern floor (sump). The assumptions in the estimate are a conical cavern shape, a salt layer thickness of 283 feet, 20 percent insolubles accumulation, and a total brine production of approximately 10 million barrels over a 30-year period. The calculated maximum diameter is 450 feet, yielding a D/H ratio of 0.99, which exceeds the Karimi-Jafari et al. criterion that the D/H ratio be considerably less than 0.67.
The Loco Hills operation did not begin producing brine until 1985. A sonar survey was conducted for that cavern in 2001, and is shown in Figure 2-6. The profile indicates that at the time of the sonar survey, the maximum cavern diameter was approximately 356 feet (twice the maximum radius indicated by the sonar log and recorded at a different bearing direction than that shown in Figure 2-6), and the depth to the top of the cavern was 505 feet. This yields a D/H ratio of 0.70, which again exceeds the Karimi-Jafari et al. criterion that the D/H ratio be considerably less than 0.67.

15
RSI-1886-09-004
Figure 2-5. Estimated Extents of Brine Caverns at the I&W Cavern Site, Carlsbad, New Mexico.

16
RSI-1886-09-005
Figure 2-6. Sonar Profile of Loco Hills Cavern Conducted in 2001.
17
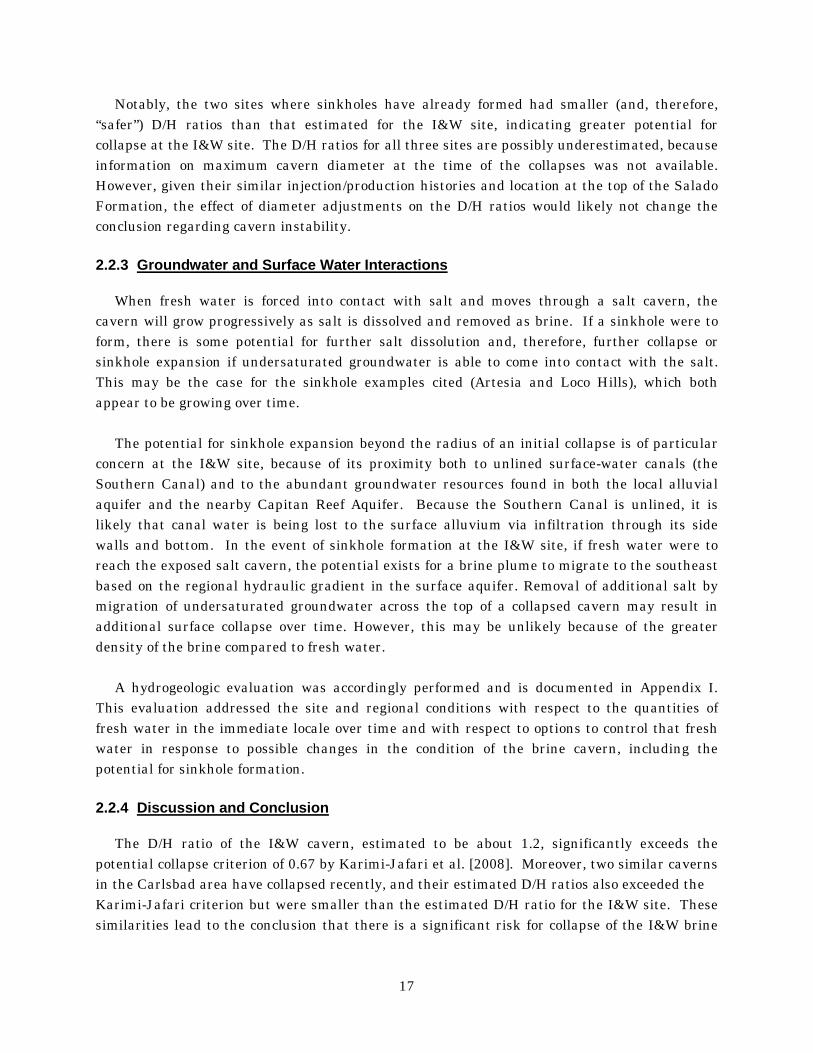
Notably, the two sites where sinkholes have already formed had smaller (and, therefore, “safer”) D/H ratios than that estimated for the I&W site, indicating greater potential for collapse at the I&W site. The D/H ratios for all three sites are possibly underestimated, because information on maximum cavern diameter at the time of the collapses was not available. However, given their similar injection/production histories and location at the top of the Salado Formation, the effect of diameter adjustments on the D/H ratios would likely not change the conclusion regarding cavern instability.
2.2.3 Groundwater and Surface Water Interactions
When fresh water is forced into contact with salt and moves through a salt cavern, the cavern will grow progressively as salt is dissolved and removed as brine. If a sinkhole were to form, there is some potential for further salt dissolution and, therefore, further collapse or sinkhole expansion if undersaturated groundwater is able to come into contact with the salt. This may be the case for the sinkhole examples cited (Artesia and Loco Hills), which both appear to be growing over time.
The potential for sinkhole expansion beyond the radius of an initial collapse is of particular
concern at the I&W site, because of its proximity both to unlined surface-water canals (the Southern Canal) and to the abundant groundwater resources found in both the local alluvial aquifer and the nearby Capitan Reef Aquifer. Because the Southern Canal is unlined, it is likely that canal water is being lost to the surface alluvium via infiltration through its side walls and bottom. In the event of sinkhole formation at the I&W site, if fresh water were to reach the exposed salt cavern, the potential exists for a brine plume to migrate to the southeast based on the regional hydraulic gradient in the surface aquifer. Removal of additional salt by migration of undersaturated groundwater across the top of a collapsed cavern may result in additional surface collapse over time. However, this may be unlikely because of the greater density of the brine compared to fresh water.
A hydrogeologic evaluation was accordingly performed and is documented in Appendix I.
This evaluation addressed the site and regional conditions with respect to the quantities of fresh water in the immediate locale over time and with respect to options to control that fresh water in response to possible changes in the condition of the brine cavern, including the potential for sinkhole formation.
2.2.4 Discussion and Conclusion
The D/H ratio of the I&W cavern, estimated to be about 1.2, significantly exceeds the potential collapse criterion of 0.67 by Karimi-Jafari et al. [2008]. Moreover, two similar caverns in the Carlsbad area have collapsed recently, and their estimated D/H ratios also exceeded the Karimi-Jafari criterion but were smaller than the estimated D/H ratio for the I&W site. These similarities lead to the conclusion that there is a significant risk for collapse of the I&W brine

18
cavern. The timing and extent of this collapse and the effects of fresh water flowing toward or into the sinkhole remain unquantified at the present time.
2.3 GEOLOGICAL MODELING PHASE I
RESPEC created a preliminary geologic data model and geodatabase for the I&W cavern site. The goals were to provide the OCD the capability to visualize the subsurface information, including geology, hydrogeology, wells, and the caverns. The model is preliminary and is mindful of additional seismic or sonar inputs to come during Phase II of this investigation.
2.3.1 Introduction
Project-specific tasks addressed by the geologic model includes:
• Establish a centralized digital repository of subsurface geologic and hydrogeologic information.
• Improve capability to visually represent site conditions to agencies and the public.
The geologic model was constructed from subsurface geological data using C-TECH’s Mining Visualization Systems (MVS). MVS is an advanced gridding, geostatistical analysis, and fully 3D visualization software package. MVS output can be viewed via two-dimensional (2D) images and 3D animations. MVS data input and output can also be incorporated into the project ArcGIS geodatabase and distributed via ArcServer. The following sections document the modeling methodology, the Phase I results and products, and plans for Phase II development.
2.3.2 Methodology
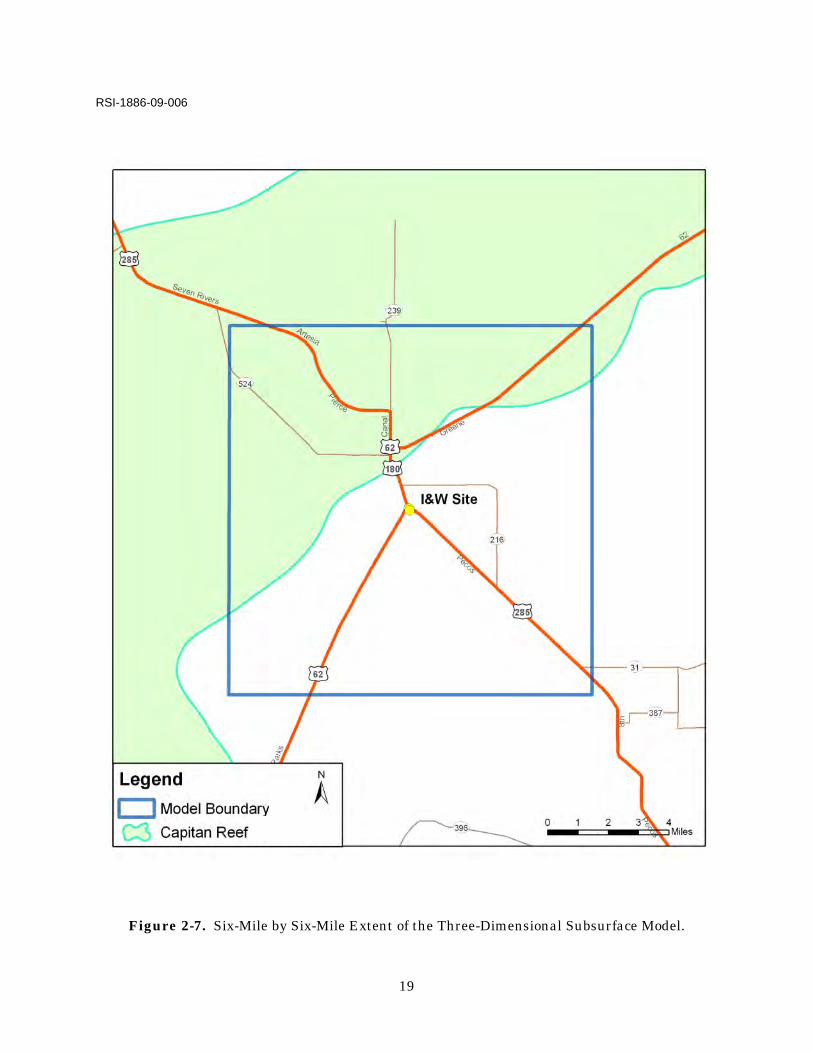
The Phase I 3D subsurface model extends 6 miles out from the I&W site, as shown in Figure 2-7. Currently, the model consists of four geologic units: alluvium, Rustler Formation, Salado Formation, and the Capitan Reef. The approximate cavern dimensions have also been incorporated into the model.
Available subsurface geology information was derived primarily from literature and area
well logs. Regional isopach (thickness) and structural contour maps (elevation) were used to define the alluvium, Rustler Formation, and Capitan Reef layers of the model. It was assumed that alluvial material represented the interval between the ground surface and the top of the Rustler Formation. Surface elevations were obtained with the 10-meter digital elevation model (DEM) raster. Data from Hiss [1976] were digitized within the modeled region to provide elevations for the top of the Rustler Formation in the subsurface. Previous investigations [Minnick, 2009] resulted in generating 3D data for the Capitan Reef based on data originally from Hiss [1975a; 1976].
19
RSI-1886-09-006
Figure 2-7. Six-Mile by Six-Mile Extent of the Three-Dimensional Subsurface Model.

20
Additional subsurface information was gleaned by collecting driller’s reports and geophysical logs for oil and gas wells within 1 mile of the I&W site. The data for these wells were obtained through the OCD Web site. Geologic information from the driller’s logs were collected and entered into a spreadsheet. Data from the driller’s logs were then compared to the geophysical logs. The stratigraphy interpreted from the gamma ray signatures for the sections were generally consistent with descriptions from the driller’s logs.
The exact dimensions and shape of the I&W cavern remains undocumented. However, the
distance between wells E-1 and E-2 is approximately 325 feet. The estimated volume of salt dissolved is 6 million cubic feet, based on 6.25 million barrels of produced brine. A recent sonar survey shows the diameter is at least 140 feet, and the height of the cavern, based on drilling records, is 118 feet. This sonar survey did not survey the entire cavern; it was limited to the upper portions. The cavern volume based on brine production may be a gross underestimate of the actual cavern “mechanical” volume due to insolubles. The cavern may have a diameter upward of 375 feet (30 percent insolubles) to 480 feet1 (40 percent insolubles). For modeling purposes, the current estimated cavern “mechanical” volume can be represented by a half-cone at each end with a wedge-shaped cross section in the center connecting them (Figure 2-8). Information derived from future work aimed to delineate cavern size will be incorporated in the model.
Before generating the 3D geological model in MVS, the spatial data were compiled into a
geodatabase. Using ArcScene, available geology data from the wells were used to create a minimodel for quality assurance/quality control (QA/QC) purposes and to generate an animation of the cavern (Figure 2-9). This smaller model includes only geologic data within 1 mile of the I&W site.
The next effort of the Phase I modeling involved converting all the raw data into a pregeology
file (PGF) usable by MVS. The PGF created is a text file with the xyz coordinates delineating the bottom of each rock unit. The three dimensional interpretation was completed as follows:
• The raw data was visually inspected as 3D boreholes by viewing the PGF data file in three dimensions using MVS. Data entry and interpretation errors were identified and fixed or removed from the file.
• Geologic surfaces were created using a method called “Geo Hierarchy,” an interpolation method developed by C-TECH. A set of new MVS files (.geo and .gmf) were created from this method. These files hold the data for the various layers or surfaces interpolated from the raw borehole data in the PGF. An interpolation method of kriging, which honors the input data, was used to generate the surfaces.
1 An independent analysis gives an estimated maximium cavern diameter of 533 feet. It must be noted that
both values are estimates and a sonar survey must be completed to define the actual cavern diameter.

21
• The postinterpolation surfaces were inspected for errors. Errors are typically not the result of the interpolation method, but rather, erroneous data points that were not identified during the review of posted samples. Various interpolation methods, however, do result in errors that become compounded in areas with little or no data. The corrective action for such errors included either removal of the erroneous data from the PGF or explaining the reason for the discrepancy.
• From these surfaces a solid, 3D geologic model was constructed and visualized in MVS. The tools utilized include “3D Geology Map,” “Explode,” and “Plume Volume.”
RSI-1886-09-007
Figure 2-8. Example of the Representation of the I&W Cavern That Was Entered into the Subsurface Model. Note: Dimensions shown are based on 2007 sonar survey and drilling depths, but cavern shape and size is hypothetical (in fact, the cavern cannot be this small and have produced 6.25 million barrels of brine).
2.3.3 Results and Products
Phase I subsurface modeling efforts focused on producing a preliminary model upon which to build as additional data are collected from the site. The model consists of subsurface data, including an approximate cavern shape. From the 3D model, cross sections and elevation data may be extracted. Unlike traditional hand-drawn cross sections, the model allows the user to change the location of a desired cross section (or fence diagram) quickly and with little effort (Figure 2-10).

Figure 2-9. View of Three-Dimensional Cavern in Relation to Site Stratigraphy. View is looking toward the southwest; E-1 is on the left and E-2 is on the right.
RS
I-1886-09-008
22
Alluvium
Rustler
Salado

23
RSI-1886-09-009
Figure 2-10. Fence Diagram Through the I&W Site. Cross section lines intersect near the I&W caverns. View looking toward the southwest. No vertical exaggeration. (Blue = Alluvium, Aqua = Rustler Fm, Green = Salado Fm, Red = Capitan Reef).
The accuracy of the model depends on the accuracy of the input data. The model is most accurate near the I&W site as the stratigraphy is clearly defined by well log data and literature information. With increasing distance from the site, quantity of data becomes sparse and geologic conditions are not documented as well.
2.3.4 Phase II Model Refinement Plans
The purpose of Phase II of the subsurface modeling is twofold: (1) provide a more detailed geological description of the site and identify the cavern geometry and (2) provide input into a groundwater model. Future efforts may require two models, both of which can be built from the existing model.
In the Phase I model, site stratigraphy was modeled to display only the alluvium, Rustler,
and Salado Formations. Information gathered from future seismic and sonar tests will be incorporated for the detailed visualization of members and beds of these formations and caverns. The model will also become important for producing a synthetic seismogram for any future seismic reflection processes.
S
E
W
N

24
Future models built from the Phase I model will facilitate better visualization and modeling of the groundwater flow system. Well logs for wells distant from the site can be added to improve the far-field details of the model. Elevations from the MVS model can be used as input into a groundwater flow or dewatering model. From the model, structural contour and isopach maps could also be generated. The maps would allow accurate estimation of drilling depth to the top of formations at a given location; hence, providing a tool to estimate time and materials needed before drilling.

25
3.0 SURFACE MONITORING AND EARLY-WARNING SYSTEM
3.1 BACKGROUND
On site work activities began immediately after the operators granted access to the I&W site in April 2009. Nearby landowners, including those for a church, a feed store, and the Carlsbad Irrigation District (operators of the Southern Canal), were notified of site activities and the potential for sinkhole development. The I&W area was secured with fencing, truck traffic was eliminated, and a Health and Safety Plan was developed. The Health and Safety Plan is provided in Appendix F.
Initially, field measurements were made to determine site characteristics and layout, and
global positioning system- (GPS-) linked photographs were taken at several locations on and around the site to document structure locations and then-current site conditions.
Tiltplates were installed to measure angular surface movement, and survey equipment was
procured to measure surface subsidence rates. Depths-to-water in two groundwater monitoring wells near the northern brine well were measured and recorded. The following sections describe and report initial results from tilt measurements and survey data.
3.2 TILT MEASUREMENTS
Thirteen tiltplates were installed over the I&W site. A tiltplate is a specially constructed ceramic or steel fixture that reliably repositions a portable electronic tiltmeter to measure the change in horizontal angle of the structure to which the tiltplate is affixed. All tilt measurements follow the procedure outlined in the portable tilt meter user’s manual. Each manual reading includes measurements of the angles in nominally the north-south and east-west directions. The measurement method specifically eliminates measurement bias because of misalignment of the portable tiltmeter. The portable tiltmeter and tiltplates are from Applied Geomechanics and the tiltmeter is on loan from RESPEC. Table 3-1 gives the plate type, bearing, and mounting surface of each tiltplate. Figure 3-1 shows locations around the I&W site where tiltplates were installed.
A series of measurements was made during late May to mid-June, and the data are
presented in Appendix A. Estimates of the tilt rates were determined for each of the 13 locations using time-series linear regression (see Appendix B). The measured tilt rates (through June 18, 2009) are listed in Table 3-2.
The angular change rates in Table 3-2 are in microradians per year according to the listed
direction. The two directional tilt rates were converted to their maximum (vectoral) component

26
to obtain the principal tilt magnitude and direction using trigonometric transforms. The principal tilt rate, when expressed in radians per unit time, is consistent with a slope-change rate, because for small angles (in radians), the tangent of the angle is approximately equal to the angle. Thus the tilt rate per year represents one unit of “tilt” per unit of length per year.
Table 3-1. Tiltplate Type and Mounting Surface
Site Plate Type Plate Bearing of N-S (1–3) Axis
Mounting Surface
ST-1 Ceramic N24E Concrete parking bumper on asphalt
ST-2 Ceramic N9E 1-foot-diameter concrete pad
ST-3 Ceramic N17E Existing large, fractured concrete pad
ST-4 Stainless Steel N8W 1 foot × 1 foot × 4 foot long block of wood set on ground
ST-5 Stainless Steel N50W 1 foot × 1 foot × 4 foot long block of wood set on ground
ST-6 Ceramic N29E Existing large, fractured concrete pad
ST-7 Stainless Steel N42W Feed store concrete floor
ST-8 Stainless Steel N44E 1 foot × 1 foot × 4 foot long block of wood set on ground
ST-9 Ceramic N19W Curb on west truck washout pad
ST-10 Ceramic N28W Curb on south truck washout pad
ST-11 Stainless Steel N2W 1 foot × 1 foot × 4 foot long block of wood set on ground
ST-12 Ceramic N2W Existing large, fractured concrete pad
ST-13 Ceramic N31W 2 feet × 2 feet × 4 inch thick concrete pad
Figure 3-2 shows the information listed in Table 3-2 as a spatial plot. At each tiltplate location, an arrowhead is drawn. The size of the arrowhead depends on the principal tilt rate (minimum of 2,575 and maximum of 120,240 microradians per year). Each arrowhead is oriented to point in the downward tilting direction (dip direction). The four largest tilt rates were measured at the four tilt plates installed on the wood beams (ST-4, ST-5, ST-8, and ST-11), which calls into questions the stability of the wood-mounting surface and suggests that the wood is expanding, contracting, or otherwise warping because of humidity changes or other causes. These tiltplates should be relocated onto concrete pads or other structures.

27
RSI-1886-09-010
Figure 3-1. Locations of the 13 Tilt Plates Being Read With the Portable Tiltmeter.
28
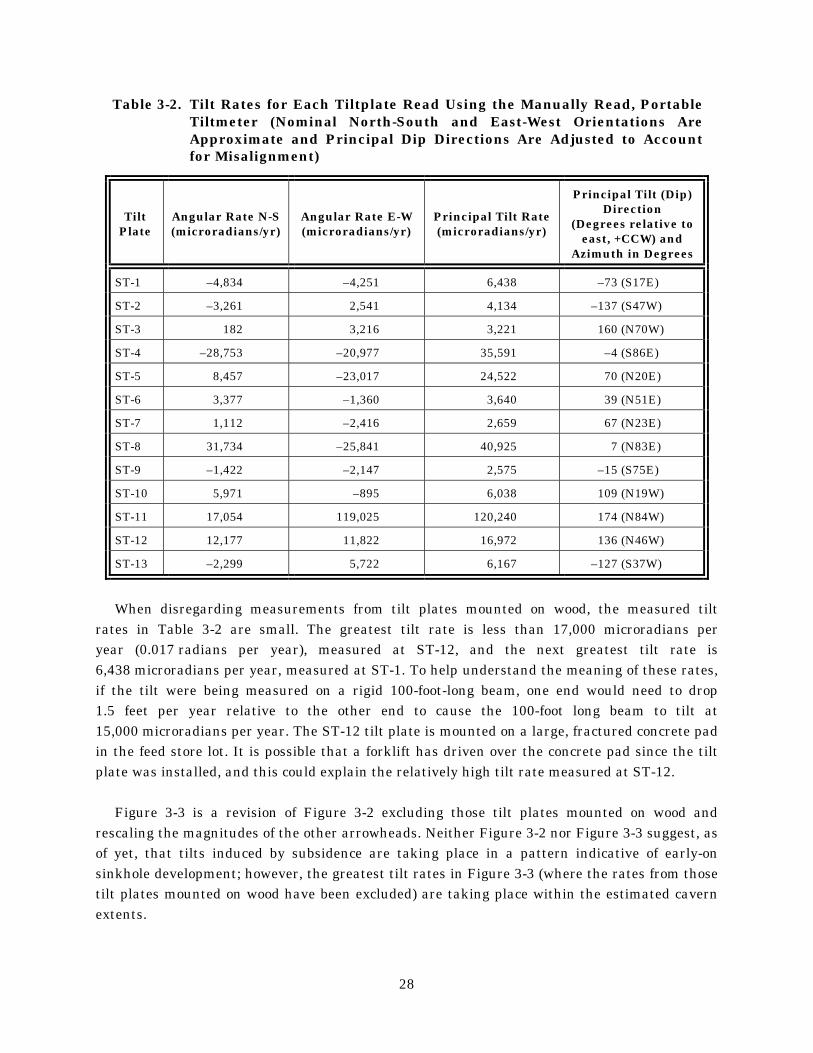
Table 3-2. Tilt Rates for Each Tiltplate Read Using the Manually Read, Portable Tiltmeter (Nominal North-South and East-West Orientations Are Approximate and Principal Dip Directions Are Adjusted to Account for Misalignment)
Tilt Plate
Angular Rate N-S (microradians/yr)
Angular Rate E-W (microradians/yr)
Principal Tilt Rate (microradians/yr)
Principal Tilt (Dip) Direction
(Degrees relative to east, +CCW) and
Azimuth in Degrees
ST-1 –4,834 –4,251 6,438 –73 (S17E)
ST-2 –3,261 2,541 4,134 –137 (S47W)
ST-3 182 3,216 3,221 160 (N70W)
ST-4 –28,753 –20,977 35,591 –4 (S86E)
ST-5 8,457 –23,017 24,522 70 (N20E)
ST-6 3,377 –1,360 3,640 39 (N51E)
ST-7 1,112 –2,416 2,659 67 (N23E)
ST-8 31,734 –25,841 40,925 7 (N83E)
ST-9 –1,422 –2,147 2,575 –15 (S75E)
ST-10 5,971 –895 6,038 109 (N19W)
ST-11 17,054 119,025 120,240 174 (N84W)
ST-12 12,177 11,822 16,972 136 (N46W)
ST-13 –2,299 5,722 6,167 –127 (S37W)
When disregarding measurements from tilt plates mounted on wood, the measured tilt
rates in Table 3-2 are small. The greatest tilt rate is less than 17,000 microradians per year (0.017 radians per year), measured at ST-12, and the next greatest tilt rate is 6,438 microradians per year, measured at ST-1. To help understand the meaning of these rates, if the tilt were being measured on a rigid 100-foot-long beam, one end would need to drop 1.5 feet per year relative to the other end to cause the 100-foot long beam to tilt at 15,000 microradians per year. The ST-12 tilt plate is mounted on a large, fractured concrete pad in the feed store lot. It is possible that a forklift has driven over the concrete pad since the tilt plate was installed, and this could explain the relatively high tilt rate measured at ST-12.
Figure 3-3 is a revision of Figure 3-2 excluding those tilt plates mounted on wood and
rescaling the magnitudes of the other arrowheads. Neither Figure 3-2 nor Figure 3-3 suggest, as of yet, that tilts induced by subsidence are taking place in a pattern indicative of early-on sinkhole development; however, the greatest tilt rates in Figure 3-3 (where the rates from those tilt plates mounted on wood have been excluded) are taking place within the estimated cavern extents.

29
RSI-1886-09-070
Figure 3-2. Tilt Sensor Pads With Magnitude and Direction of Tilt.

30
RSI-1886-09-071
Figure 3-3. Tilt Sensor Pads With Magnitude and Direction of Tilt at Sites With Pad Not Mounted on Wood.

31
3.3 SUBSIDENCE SURVEY
Based on past experience, it is known the surface will subside over the cavern in response to salt creep toward and into the brine-filled cavern and because of cavern roof deformation in response to rock collapse into the cavern, or both [Van Sambeek 1993; 2000]. Subsidence is measured by detecting elevation changes of installed benchmarks on the surface.
Survey equipment to measure the elevation changes consists of a Topcon GPT-9003A robotic
total station, a backsite reflector, and a roving reflector procured in late May 2009. The total station measures distance with an accuracy of ± (2mm + 2ppm × distance mean square error) and measures angles with an accuracy of one arc second. The unit also corrects measurements by accounting for refractive index effects caused by temperature, pressure, and the water vapor content of air—values which are entered into the instrument at the start of each survey.
Twenty-nine surface subsidence benchmarks are currently installed over the site
(Figure 3-4). The benchmarks are 2-foot-long rebars driven into the ground at 50-foot intervals in a cross pattern bisecting the well locations and extending to the estimated limits of the cavern. The benchmarks are clustered over the cavern, especially along its main axis, with a scattering of benchmarks at other key locations.
A backsite location was established outside of the potential collapse zone using a brass pin
placed in a concrete pad. An initial survey of in-place benchmarks and established rebar benchmarks took place on May 6, 2009. On May 27, 2009, the number of survey benchmarks was increased to 29. Currently, a survey of 29 benchmarks on the site is completed every weekday. The points are arranged in a cross pattern with three benchmark locations: backsite (Survey Point 6), base station (Survey Point 3), and “the rail” (Survey Point 1). Survey Points 1 and 3 correspond to preestablished lot corners and had survey markers in place at the time of initial site activity. Surveys done before and after May 27, 2009, are measured relative to the baseline survey completed on May 27 to calculate change in elevation. During the survey, a Standard Operating Procedure document for the survey equipment use and procedures was developed and is located in Appendix E. The subsidence benchmarks are surveyed using a Topcon robotic total station. While not an optimum instrument for precisely measuring elevation changes, this instrument is being used to have a contingency should the area above the cavern become inaccessible for a rod man as would be required if a standard automatic level or GPS were used.
After each daily survey, the data are uploaded to computer and analyzed to show the change
in elevation as compared to the baseline survey completed on May 27, 2009. Appendix C contains data for each day’s survey through June 19, 2009. Survey data are entered into a spreadsheet and daily movement rates are calculated. The data are also graphed over time so any trends in movement can be visualized. Graphs for each survey point are included in Appendix D.

32
RSI-1886-09-012
Figure 3-4. Locations of the Surface Subsidence Benchmarks.

33
The results of the elevation survey are summarized in Table 3-3 in terms of each benchmark and its subsidence rate (inches/year). Also shown in Table 3-3 is the standard deviation (square root of the variance) for the slope successively determined as each measurement is added to the linear time-series regression. The standard deviation provides an indication of the reliability of the subsidence rate (the “true” subsidence rate is likely to be within the range of the presented value ± the standard deviation). If the standard deviation spans the zero rate, then it can be concluded that the benchmark is not subsiding or is subsiding at a rate too slow for us to reliably measure (with the current instrument).
The subsidence rates, for the most part, are less than an inch per year. A “typical” rate of
–1.2 inches/year corresponds to about –0.0003 foot per day. A general observation is that the subsidence rates are still becoming statistically less variable as the number of surveys increases. Nonetheless, 10 of the 29 benchmarks have subsidence rates where the magnitude of the downward displacement rate exceeds the standard deviation; another 3 benchmarks have upward displacement rates where the magnitude of the rate exceeds the standard deviation. The remaining 16 benchmarks have standard deviations too great to determine a statistically significant rate at the current time.
Figure 3-5 is a spatial plot of the subsidence rates presented in Table 3-3. There is a trend for faster subsidence in the area of E-1 and E-2 and over the cavern between them. The magnitude of the subsidence rates suggests salt creep-induced subsidence in response to cavern closure.
3.4 EARLY-WARNING SYSTEM
An early-warning system was installed at the I&W site to detect ground movement and collapse signatures and to provide instant feedback should a ground movement occur. The system is comprised of sensors, a data acquisition system (DAQ), a dedicated on site computer, equipment infrastructure, and data-push software that will allow real-time access to data via internet connection for cooperating agencies and consultants.
Sensors include borehole tiltmeters (BTMs) and water-level transducers. BTMs were deemed
appropriate to measure both long-term subsidence and short-term cavern collapse activity [Van Sambeek and Henard, 2009]. Pressure transducers were installed to monitor water levels in monitoring wells screened in the surface alluvium. The pressure transducers will detect any sudden (but temporary) changes in water level that might take place if water drains into fractures as they are forming before a catastrophic collapse occurs.
A secure, portable, climate-controlled field office was set up on the northeast corner of the
site. The field office is equipped with AC power, wireless internet access, and contains the DAQ and a dedicated computer. Data from the sensors is transferred to the field office where it is processed on the computer and then uploaded to the Internet via a wireless connection.

34
Table 3-3. Surface Subsidence Rate and Standard Deviation for the Linear-Regression-Rate for Each Benchmark
Benchmark Subsidence Rate (in/yr)
Standard Deviation of Rate
(± in/yr)
1 –0.4 0.5
6 –1.1 2.0
7 0.0 0.2
8 –0.4 0.4
9 0.3 0.4
101 –1.0 0.4
102 –1.3 0.4
103 –0.8 0.4
104 –0.7 0.4
105 –0.1 1.0
106 –1.1 0.5
107 –0.3 0.5
108 –1.1 0.6
109 –0.7 0.5
110 0.1 0.7
111 0.5 0.6
112 –0.4 0.6
113 0.3 0.6
114 0.3 0.7
201 0.3 0.4
202 –0.1 0.3
203 –0.2 0.3
204 –0.1 0.3
301 0.7 0.6
302 –0.2 0.5
303 –1.1 0.5
304 –0.5 0.4
401 2.4 0.8
402 0.8 0.5

35
RSI-1886-09-013
Figure 3-5. Subsidence Rates (Inches/Year) Through June 19, 2009.
36
3.4.1 Sensors
Applied Geomechanics Lily-485 BTMs were installed at three locations on site. Boreholes were drilled using a 30-ton air-rotary-drill rig with an 8-inch bit and cutting foam (Figure 3-6). Each borehole was completed with 4-inch-diameter schedule 40 polyvinyl chloride (PVC) pressure pipe and grouted in place with approximately 300 pounds of Type II Portland cement. Steel-locking well boxes and concrete pads were also installed. BTMs were installed at a depth of approximately 20 feet and were sandpacked in place inside the PVC pipe. Data cables were snaked through PVC conduit to their full extent at the portable office building. Rollover areas were constructed of steel conduit and reinforced with either wood or gravel ramps to facilitate future equipment mobilization on site.
BTMs are being used to monitor ground movement and possible collapse signatures. Data
are being collected four times per minute and pushed continuously onto the online Web server. Data from the BTMs is routed back to the field office, stored on the computer, and pushed to the Internet over a wireless internet connection.
Vented vibrating-wire pressure transducers (Geokon) were installed in the two monitoring
wells already located on site. Both wells have 2-inch-diameter casings and are completed into the surface alluvium. One well is approximately 60 feet deep and the other well is approximately 220 feet deep. Water level in each well is measured four times per minute and transferred by data cable to a CR10x datalogger located in the field office. The data are then uploaded to the Internet via the wireless internet connection and Atlas software.
3.4.2 Online Data
Data are collected continuously and stored online and displayed through an interactive Web page using Atlas Software. Readings can be observed and organized in real time, graphed over a specified period, or downloaded for independent analysis. After allowing a period of time (approximately 30 days) to determine background noise parameters from local sources (such as train and truck traffic), a preliminary set of alarm parameters will be set for the BTM and pressure transducers. The software will send automatic emergency e-mails to a predetermined mailing list (Eddy County Emergency Response, OCD) for events that exceed the set levels. These levels will be adjusted during the startup period to attempt to minimize false readings and unnecessary emergency responses. First responders will have access to the data and will be able to “rewind” the data to view potential outside influences that might cause a false reading before making an unnecessary response.

37
RSI-1886-09-014
Figure 3-6. Installation of Wells for Borehole Tilt Meters (BTMs).

38
4.0 REFERENCES
4.1 CITED REFERENCES
Barroll, P., D. Jordan, and G. Ruskauff, 2004. The Carlsbad Area Groundwater Flow Model, prepared by New Mexico Office of the State Engineer, Santa Fe, NM, and Intera, Inc., Carlsbad, NM, pp. 307. Bjorklund, L. J. and W. S. Motts, 1959. Geology and Water Resources of the Carlsbad Area, Eddy County, New Mexico, U.S. Geological Survey Open-File Report 59-9, prepared by the U.S. Geological Survey, in cooperation with the New Mexico State Engineer, Santa Fe, NM, p. 322. Hiss, W. L. 1975a. Map Showing Thickness of the Permian (Guadalupian) Capitan Aquifer, Southeast New Mexico and West Texas, Resource Map 5, prepared by the U.S. Geological Survey in cooperation with the New Mexico State Engineer, Santa Fe, NM. Hiss, W. L. 1976. Map Showing Structure of the Permian (Ochoan) Rustler Formation, Southeast New Mexico and West Texas, Resource Map 7, prepared by the U.S. Geological Survey in cooperation with the New Mexico State Engineer, Santa Fe, NM. Karimi-Jafari, M., P. Berest, and B. Brouard, 2008. “Subsidence, Sinkholes and Craters Above Salt Caverns,” Solution Mining Research Institute Spring Meeting, Porto, Portugal, April 27–30, p. 269. Minnick, M. D., 2009. Capitan Reef Injection Well Impact Study, RSI-2048, prepared by RESPEC, Rapid City, SD, for the New Mexico Oil Conservation Division, Santa Fe, NM. New Mexico Oil Conservation Division. 2009. Brine Well Chronology Report, retrieved June 30, 2009, from the World Wide Web at http://www.emnrd.state.nm.us/ocd/documents/ Chronology.pdf. Provided in Appendix G. Van Sambeek, L. L., 1993. “Evaluating Cavern Tests and Surface Subsidence Using Simple Numerical Models,” Proceedings, 7th International Symposium on Salt, Kyoto International Conference Hall, April 6–9, 1992, Kyoto, Japan, H. Kakihana; H. R. Hardy, Jr.; T. Hoshi; and K. Toyokura (eds.), Elsevier Science Publishers B.V., Amsterdam, The Netherlands, Vol. 1, pp. 433-439. Van Sambeek, L. L., 2000. “An Introduction to Subsidence Over Salt and Potash Mining Facilities,” Solution Mining Research Institute Fall Meeting, San Antonio, TX, October 15–18, pp. 1–10. Van Sambeek, L. L. and D. A. Henard, 2009. Personal communication between L. L. Van Sambeek and D. A. Henard, RESPEC, Rapid City, SD, and J. Griswold, New Mexico Energy, Minerals & Natural Resources Department, Oil Conservation Division, Environmental Bureau, Santa Fe, NM, April 17.

39
4.2 DOCUMENTS REVIEWED PERTAINING TO LOCAL BRINE WELLS
Anderson, R. Y., 1981. “Deep-Seated Salt Dissolution in the Delaware Basin, Texas, and New Mexico,” Environmental Geology and Hydrology in New Mexico: Special Publication, S. G. Wells, W. Lamber, and J. F. Callender, (eds.), New Mexico Geological Society, V. 10, pp. 133–145. Bachman, G. O., 1984. “Regional Geology of Ochoan Evaporites, Northern Part of Delaware Basin,” New Mexico Bureau of Mines and Mineral Resources Circular 184, p. 22. Hiss, W. L., 1975b. Chloride-Ion Concentration in Groundwater in Permian Guadalupian Rocks, Southeast New Mexico and West Texas, Resource Map 4, New Mexico Bureau of Mines and Mineral Resources Resource Map, one sheet, scale 1:510,000. Oil Conservation Division, 2009. Eugenie No. 001, API Number 3001522574, ULSTR M-17-22S-27E, retrieved April 26, 2009, from the World Wide Web at http://ocdimage.emnrd.state. nm.us/imaging/WellFileView.aspx?RefType=WF&RefID=30015225740000 Oil Conservation Division, 2009. State 24 No. 001, API Number 3001502036, ULSTR J-24-18S-28E, retrieved April 26, 2009, from the World Wide Web at http://ocdimage.emnrd.state. nm.us/imaging/WellFileView.aspx?RefType=WF&RefID=30015020360000 Oil Conservation Division, 2009. Brine Well No. 002, API Number 3001536119, ULSTR L-16-17S-30E, retrieved April 26, 2009, from the World Wide Web at http://ocdimage.emnrd.state. nm.us/imaging/WellFileView.aspx?RefType=WF&RefID=30015361190000 Richey, S. F., J. G. Wells, and K. T. Stephens, 1985. “Geohydrology of the Delaware Basin and Vicinity, Texas and New Mexico,” U.S. Geological Survey Water-Resources Investigations 84-4077. Socon Sonar Well Services, Inc., 2007. Results of the Cavern Survey by Means of Echo-Sounding in the Cavern, Eugenie #1, Consultant Report 073055, Customer I&W Inc., Carlsbad, NM, August 30.

A-1
APPENDIX A
SURFACE TILT METER DATA BY LOCATION

A-2
Table A-1. Surface Tilt Meter Data for Site 1 (Page 1 of 3)
Site Date Time Temp (°C) X1 X3
(X1+X3) 2
(bias)
(X1-X3) 2
(∆) Tilt1 X2 X4
(X2+X4) 2
(bias)
(X2-X4) 2
(∆) Tilt2
Measured By Remarks
ST-1 5/29/2009 14:09 36.9 0.235 –0.176 0.030 0.206 0.216 0.584 –0.520 0.032 0.552 0.580 BM
ST-1 5/29/2009 0.241 –0.175 0.033 0.208 0.218 0.582 –0.519 0.032 0.551 0.578 BM
ST-1 5/29/2009 0.236 –0.177 0.030 0.207 0.217 0.578 –0.518 0.030 0.548 0.575 BM
ST-1 5/29/2009 37.4 0.239 –0.176 0.032 0.208 0.218 0.575 –0.518 0.029 0.547 0.574 BM
ST-1 5/30/2009 10:20 26.8 0.239 –0.177 0.031 0.208 0.218 0.579 –0.524 0.028 0.552 0.579 BM
ST-1 5/30/2009 0.248 –0.179 0.035 0.214 0.224 0.574 –0.523 0.026 0.549 0.576 BM
ST-1 5/30/2009 0.241 –0.174 0.034 0.208 0.218 0.578 –0.522 0.028 0.550 0.578 BM
ST-1 5/30/2009 27.4 0.234 –0.175 0.030 0.205 0.215 0.576 –0.524 0.026 0.550 0.578 BM
ST-1 5/31/2009 9:34 26.2 0.239 –0.177 0.031 0.208 0.218 0.571 –0.521 0.025 0.546 0.573 BM
ST-1 5/31/2009 0.237 –0.177 0.030 0.207 0.217 0.572 –0.522 0.025 0.547 0.574 BM
ST-1 5/31/2009 0.234 –0.180 0.027 0.207 0.217 0.574 –0.523 0.026 0.549 0.576 BM
ST-1 5/31/2009 26.9 0.239 –0.177 0.031 0.208 0.218 0.574 –0.522 0.026 0.548 0.575 BM
ST-1 6/1/2009 12:01 26.5 0.240 –0.176 0.032 0.208 0.218 0.574 –0.520 0.027 0.547 0.574 BM
ST-1 6/1/2009 0.241 –0.177 0.032 0.209 0.219 0.575 –0.520 0.028 0.548 0.575 BM
ST-1 6/1/2009 0.236 –0.178 0.029 0.207 0.217 0.576 –0.524 0.026 0.550 0.578 BM
ST-1 6/1/2009 27.6 0.238 –0.181 0.029 0.210 0.220 0.574 –0.525 0.025 0.550 0.577 BM
ST-1 6/2/2009 15:06 36.0 0.234 –0.172 0.031 0.203 0.213 0.572 –0.518 0.027 0.545 0.572 CF, BM
ST-1 6/2/2009 0.234 –0.171 0.032 0.203 0.213 0.572 –0.521 0.026 0.547 0.574 CF, BM
ST-1 6/2/2009 0.232 –0.175 0.029 0.204 0.214 0.572 –0.522 0.025 0.547 0.574 CF, BM
ST-1 6/2/2009 37.5 0.236 –0.177 0.030 0.207 0.217 0.572 –0.522 0.025 0.547 0.574 CF, BM
ST-1 6/3/2009 9:42 22.4 0.235 –0.183 0.026 0.209 0.219 0.567 –0.521 0.023 0.544 0.571 BM
ST-1 6/3/2009 0.237 –0.182 0.028 0.210 0.220 0.572 –0.522 0.025 0.547 0.574 BM
ST-1 6/3/2009 0.233 –0.181 0.026 0.207 0.217 0.570 –0.522 0.024 0.546 0.573 BM
ST-1 6/3/2009 22.8 0.233 –0.183 0.025 0.208 0.218 0.572 –0.524 0.024 0.548 0.575 BM
ST-1 6/4/2009 11:53 32.9 0.236 –0.179 0.029 0.208 0.218 0.568 –0.518 0.025 0.543 0.570 BM
ST-1 6/4/2009 0.237 –0.178 0.030 0.208 0.218 0.569 –0.515 0.027 0.542 0.569 BM
ST-1 6/4/2009 0.238 –0.177 0.031 0.208 0.218 0.570 –0.517 0.027 0.544 0.571 BM
ST-1 6/4/2009 32.9 0.236 –0.178 0.029 0.207 0.217 0.571 –0.516 0.028 0.544 0.571 BM

A-3
Table A-1. Surface Tilt Meter Data for Site 1 (Page 2 of 3)
Site Date Time Temp (°C) X1 X3
(X1+X3) 2
(bias)
(X1-X3) 2
(∆) Tilt1 X2 X4
(X2+X4) 2
(bias)
(X2-X4) 2
(∆) Tilt2
Measured By Remarks
ST-1 6/5/2009 10:26 29.6 0.231 –0.176 0.028 0.204 0.214 0.568 –0.518 0.025 0.543 0.570 BM
ST-1 6/5/2009 0.232 –0.176 0.028 0.204 0.214 0.570 –0.517 0.027 0.544 0.571 BM
ST-1 6/5/2009 0.232 –0.177 0.028 0.205 0.215 0.570 –0.518 0.026 0.544 0.571 BM
ST-1 6/5/2009 30.1 0.232 –0.177 0.028 0.205 0.215 0.570 –0.519 0.026 0.545 0.572 BM
ST-1 6/6/2009 7:56 26.4 0.235 –0.174 0.031 0.205 0.215 0.567 –0.514 0.027 0.541 0.568 BM
ST-1 6/6/2009 0.236 –0.176 0.030 0.206 0.216 0.569 –0.519 0.025 0.544 0.571 BM
ST-1 6/6/2009 0.236 –0.177 0.030 0.207 0.217 0.570 –0.518 0.026 0.544 0.571 BM
ST-1 6/6/2009 26.6 0.232 –0.177 0.028 0.205 0.215 0.571 –0.519 0.026 0.545 0.572 BM
ST-1 6/7/2009 13:57 36.2 0.235 –0.168 0.034 0.202 0.212 0.568 –0.514 0.027 0.541 0.568 BM
ST-1 6/7/2009 0.233 –0.164 0.035 0.199 0.208 0.570 –0.515 0.028 0.543 0.570 BM
ST-1 6/7/2009 0.232 –0.168 0.032 0.200 0.210 0.571 –0.518 0.027 0.545 0.572 BM
ST-1 6/7/2009 36.7 0.232 –0.170 0.031 0.201 0.211 0.571 –0.518 0.027 0.545 0.572 BM
ST-1 6/8/2009 10:22 29.5 0.233 –0.181 0.026 0.207 0.217 0.572 –0.510 0.031 0.541 0.568 BM
ST-1 6/8/2009 0.233 –0.178 0.028 0.206 0.216 0.572 –0.515 0.029 0.544 0.571 BM
ST-1 6/8/2009 0.234 –0.177 0.029 0.206 0.216 0.574 –0.514 0.030 0.544 0.571 BM
ST-1 6/8/2009 30.2 0.233 –0.177 0.028 0.205 0.215 0.573 –0.516 0.029 0.545 0.572 BM
ST-1 6/9/2009 10:40 36.6 0.234 –0.165 0.035 0.200 0.209 0.577 –0.516 0.031 0.547 0.574 ELK, BM
ST-1 6/9/2009 0.233 –0.166 0.034 0.200 0.209 0.577 –0.516 0.031 0.547 0.574 ELK, BM
ST-1 6/9/2009 0.234 –0.167 0.034 0.201 0.211 0.576 –0.517 0.030 0.547 0.574 ELK, BM
ST-1 6/9/2009 36.3 0.235 –0.169 0.033 0.202 0.212 0.576 –0.517 0.030 0.547 0.574 ELK, BM
ST-1 6/10/2009 11:25 35.0 0.233 –0.176 0.029 0.205 0.215 0.568 –0.513 0.028 0.541 0.568 BM
ST-1 6/10/2009 0.232 –0.175 0.029 0.204 0.214 0.569 –0.515 0.027 0.542 0.569 BM
ST-1 6/10/2009 0.233 –0.175 0.029 0.204 0.214 0.569 –0.516 0.027 0.543 0.570 BM
ST-1 6/10/2009 35.0 0.233 –0.176 0.029 0.205 0.215 0.570 –0.517 0.027 0.544 0.571 BM
ST-1 6/11/2009 10:16 28.4 0.227 –0.169 0.029 0.198 0.208 0.569 –0.515 0.027 0.542 0.569 BM, JL, CB
ST-1 6/11/2009 0.235 –0.171 0.032 0.203 0.213 0.569 –0.516 0.027 0.543 0.570 BM, JL, CB
ST-1 6/11/2009 0.233 –0.171 0.031 0.202 0.212 0.570 –0.517 0.027 0.544 0.571 BM, JL, CB
ST-1 6/11/2009 30.1 0.232 –0.171 0.031 0.202 0.212 0.570 –0.518 0.026 0.544 0.571 BM, JL, CB
ST-1 6/12/2009 2:14 36.7 0.227 –0.165 0.031 0.196 0.206 0.567 –0.513 0.027 0.540 0.567 JL
ST-1 6/12/2009 0.227 –0.164 0.032 0.196 0.205 0.568 –0.514 0.027 0.541 0.568 JL

A-4
Table A-1. Surface Tilt Meter Data for Site 1 (Page 3 of 3)
Site Date Time Temp (°C) X1 X3
(X1+X3) 2
(bias)
(X1-X3) 2
(∆) Tilt1 X2 X4
(X2+X4) 2
(bias)
(X2-X4) 2
(∆) Tilt2
Measured By Remarks
ST-1 6/12/2009 0.228 –0.163 0.033 0.196 0.205 0.568 –0.514 0.027 0.541 0.568 JL
ST-1 6/12/2009 37.8 0.227 –0.164 0.032 0.196 0.205 0.568 –0.513 0.028 0.541 0.568 JL
ST-1 6/13/2009 2:53 37.7 0.220 –0.165 0.028 0.193 0.202 0.567 –0.512 0.028 0.540 0.566 JL
ST-1 6/13/2009 0.226 –0.165 0.031 0.196 0.205 0.567 –0.512 0.028 0.540 0.566 JL
ST-1 6/13/2009 0.224 –0.166 0.029 0.195 0.205 0.567 –0.512 0.028 0.540 0.566 JL
ST-1 6/13/2009 38.8 0.225 –0.165 0.030 0.195 0.205 0.567 –0.511 0.028 0.539 0.566 JL
ST-1 6/14/2009 9:38 28.1 0.227 –0.173 0.027 0.200 0.210 0.570 –0.510 0.030 0.540 0.567 JL
ST-1 6/14/2009 0.227 –0.172 0.028 0.200 0.209 0.567 –0.511 0.028 0.539 0.566 JL
ST-1 6/14/2009 0.227 –0.173 0.027 0.200 0.210 0.567 –0.512 0.028 0.540 0.566 JL
ST-1 6/14/2009 29.0 0.228 –0.174 0.027 0.201 0.211 0.568 –0.512 0.028 0.540 0.567 JL
ST-1 6/15/2009 10:58 33.5 0.225 –0.168 0.029 0.197 0.206 0.563 –0.511 0.026 0.537 0.564 JL
ST-1 6/15/2009 0.225 –0.169 0.028 0.197 0.207 0.564 –0.510 0.027 0.537 0.564 JL
ST-1 6/15/2009 0.223 –0.170 0.027 0.197 0.206 0.564 –0.512 0.026 0.538 0.565 JL
ST-1 6/15/2009 34.2 0.225 –0.171 0.027 0.198 0.208 0.564 –0.512 0.026 0.538 0.565 JL
ST-1 6/16/2009 1:00 37.1 0.222 –0.165 0.029 0.194 0.203 0.565 –0.510 0.028 0.538 0.564 JL
ST-1 6/16/2009 0.226 –0.166 0.030 0.196 0.206 0.565 –0.510 0.028 0.538 0.564 JL
ST-1 6/16/2009 0.224 –0.166 0.029 0.195 0.205 0.563 –0.509 0.027 0.536 0.563 JL
ST-1 6/16/2009 37.8 0.223 –0.166 0.029 0.195 0.204 0.563 –0.510 0.027 0.537 0.563 JL
ST-1 6/17/2009 11:24 29.3 0.223 –0.163 0.030 0.193 0.203 0.565 –0.510 0.028 0.538 0.564 JL
ST-1 6/17/2009 0.224 –0.165 0.030 0.195 0.204 0.563 –0.509 0.027 0.536 0.563 JL
ST-1 6/17/2009 0.224 –0.166 0.029 0.195 0.205 0.564 –0.509 0.028 0.537 0.563 JL
ST-1 6/17/2009 30.2 0.224 –0.166 0.029 0.195 0.205 0.564 –0.510 0.027 0.537 0.564 JL
ST-1 6/18/2009 10:19 29.9 0.223 –0.165 0.029 0.194 0.204 0.563 –0.510 0.027 0.537 0.563 JL
ST-1 6/18/2009 0.224 –0.166 0.029 0.195 0.205 0.562 –0.509 0.027 0.536 0.562 JL
ST-1 6/18/2009 0.224 –0.165 0.030 0.195 0.204 0.563 –0.509 0.027 0.536 0.563 JL
ST-1 6/18/2009 30.5 0.224 –0.167 0.029 0.196 0.205 0.563 –0.510 0.027 0.537 0.563 JL
ST-1 6/19/2009 11:15 27.0 0.224 –0.167 0.029 0.196 0.205 0.563 –0.511 0.026 0.537 0.564 JL
ST-1 6/19/2009 0.224 –0.168 0.028 0.196 0.206 0.562 –0.511 0.026 0.537 0.563 JL
ST-1 6/19/2009 0.226 –0.168 0.029 0.197 0.207 0.562 –0.512 0.025 0.537 0.564 JL
ST-1 6/19/2009 27.4 0.225 –0.168 0.029 0.197 0.206 0.562 –0.511 0.026 0.537 0.563 JL

A-5
Table A-2. Surface Tilt Meter Data for Site 2 (Page 1 of 3)
Site Date Time Temp (°C) X1 X3
(X1+X3) 2
(bias)
(X1-X3) 2
(∆) Tilt1 X2 X4
(X2+X4) 2
(bias)
(X2-X4) 2
(∆) Tilt2
Measured By Remarks
ST-2 5/29/2009 14:16 37.5 –0.167 0.224 0.029 –0.196 –0.205 0.036 0.026 0.031 0.005 0.005 BM
ST-2 5/29/2009 –0.165 0.220 0.028 –0.193 –0.202 0.033 0.020 0.027 0.007 0.007 BM
ST-2 5/29/2009 –0.168 0.220 0.026 –0.194 –0.204 0.032 0.024 0.028 0.004 0.004 BM
ST-2 5/29/2009 37.8 –0.166 0.220 0.027 –0.193 –0.203 0.036 0.019 0.028 0.009 0.009 BM
ST-2 5/30/2009 10:29 27.5 –0.176 0.227 0.026 –0.202 –0.212 0.042 0.005 0.024 0.019 0.019 BM
ST-2 5/30/2009 –0.179 0.228 0.025 –0.204 –0.214 0.047 0.006 0.027 0.021 0.022 BM
ST-2 5/30/2009 –0.178 0.227 0.025 –0.203 –0.213 0.046 0.009 0.028 0.019 0.019 BM
ST-2 5/30/2009 28.9 –0.172 0.227 0.028 –0.200 –0.209 0.049 0.012 0.031 0.019 0.019 BM
ST-2 5/31/2009 9:39 26.7 –0.178 0.233 0.028 –0.206 –0.216 0.040 0.018 0.029 0.011 0.012 BM
ST-2 5/31/2009 –0.174 0.233 0.030 –0.204 –0.214 0.042 0.009 0.026 0.017 0.017 BM
ST-2 5/31/2009 –0.173 0.231 0.029 –0.202 –0.212 0.043 0.008 0.026 0.018 0.018 BM
ST-2 5/31/2009 27.3 –0.173 0.234 0.031 –0.204 –0.214 0.046 0.007 0.027 0.020 0.020 BM
ST-2 6/1/2009 12:09 28.5 –0.171 0.232 0.031 –0.202 –0.212 0.045 0.016 0.031 0.015 0.015 BM
ST-2 6/1/2009 –0.175 0.229 0.027 –0.202 –0.212 0.045 0.007 0.026 0.019 0.020 BM
ST-2 6/1/2009 –0.170 0.230 0.030 –0.200 –0.210 0.044 0.007 0.026 0.019 0.019 BM
ST-2 6/1/2009 30.0 –0.171 0.228 0.029 –0.200 –0.209 0.047 0.012 0.030 0.018 0.018 BM
ST-2 6/2/2009 15:18 37.9 –0.171 0.229 0.029 –0.200 –0.210 0.049 0.012 0.031 0.019 0.019 CF, BM
ST-2 6/2/2009 –0.170 0.226 0.028 –0.198 –0.208 0.047 0.014 0.031 0.017 0.017 CF, BM
ST-2 6/2/2009 –0.173 0.228 0.028 –0.201 –0.211 0.046 0.017 0.032 0.015 0.015 CF, BM
ST-2 6/2/2009 38.5 –0.173 0.231 0.029 –0.202 –0.212 0.047 0.015 0.031 0.016 0.017 CF, BM
ST-2 6/3/2009 9:47 22.6 –0.178 0.238 0.030 –0.208 –0.218 0.049 0.007 0.028 0.021 0.022 BM
ST-2 6/3/2009 –0.178 0.235 0.029 –0.207 –0.217 0.051 0.008 0.030 0.022 0.023 BM
ST-2 6/3/2009 –0.178 0.232 0.027 –0.205 –0.215 0.052 0.008 0.030 0.022 0.023 BM
ST-2 6/3/2009 22.9 –0.178 0.231 0.027 –0.205 –0.215 0.052 0.006 0.029 0.023 0.024 BM
ST-2 6/4/2009 11:57 32.5 –0.177 0.227 0.025 –0.202 –0.212 0.053 0.015 0.034 0.019 0.020 BM
ST-2 6/4/2009 –0.176 0.230 0.027 –0.203 –0.213 0.051 0.011 0.031 0.020 0.021 BM
ST-2 6/4/2009 –0.176 0.231 0.028 –0.204 –0.214 0.051 0.010 0.031 0.021 0.022 BM
ST-2 6/4/2009 32.7 –0.176 0.232 0.028 –0.204 –0.214 0.051 0.009 0.030 0.021 0.022 BM

A-6
Table A-2. Surface Tilt Meter Data for Site 2 (Page 2 of 3)
Site Date Time Temp (°C) X1 X3
(X1+X3) 2
(bias)
(X1-X3) 2
(∆) Tilt1 X2 X4
(X2+X4) 2
(bias)
(X2-X4) 2
(∆) Tilt2
Measured By Remarks
ST-2 6/5/2009 10:30 30.1 –0.177 0.238 0.031 –0.208 –0.218 0.047 0.005 0.026 0.021 0.022 BM
ST-2 6/5/2009 –0.176 0.237 0.031 –0.207 –0.217 0.049 0.005 0.027 0.022 0.023 BM
ST-2 6/5/2009 –0.176 0.236 0.030 –0.206 –0.216 0.050 0.005 0.028 0.023 0.024 BM
ST-2 6/5/2009 30.5 –0.175 0.236 0.031 –0.206 –0.216 0.049 0.005 0.027 0.022 0.023 BM
ST-2 6/6/2009 7:50 25.5 –0.183 0.229 0.023 –0.206 –0.216 0.055 0.005 0.030 0.025 0.026 BM
ST-2 6/6/2009 –0.183 0.232 0.025 –0.208 –0.218 0.053 0.004 0.029 0.025 0.026 BM
ST-2 6/6/2009 –0.183 0.234 0.026 –0.209 –0.219 0.053 0.002 0.028 0.026 0.027 BM
ST-2 6/6/2009 26.5 –0.183 0.238 0.028 –0.211 –0.221 0.052 0.003 0.028 0.025 0.026 BM
ST-2 6/7/2009 14:02 36.9 –0.177 0.236 0.030 –0.207 –0.217 0.054 0.013 0.034 0.021 0.022 BM
ST-2 6/7/2009 –0.175 0.237 0.031 –0.206 –0.216 0.053 0.010 0.032 0.022 0.023 BM
ST-2 6/7/2009 –0.176 0.235 0.030 –0.206 –0.216 0.052 0.010 0.031 0.021 0.022 BM
ST-2 6/7/2009 37.5 –0.174 0.235 0.031 –0.205 –0.215 0.053 0.010 0.032 0.022 0.023 BM
ST-2 6/8/2009 10:20 30.2 –0.179 0.240 0.031 –0.210 –0.220 0.058 0.002 0.030 0.028 0.029 BM
ST-2 6/8/2009 –0.176 0.238 0.031 –0.207 –0.217 0.059 0.000 0.030 0.030 0.031 BM
ST-2 6/8/2009 –0.178 0.238 0.030 –0.208 –0.218 0.059 0.000 0.030 0.030 0.031 BM
ST-2 6/8/2009 30.6 –0.179 0.238 0.030 –0.209 –0.219 0.059 0.000 0.030 0.030 0.031 BM
ST-2 6/9/2009 10:46 35.7 –0.172 0.239 0.034 –0.206 –0.216 0.057 0.010 0.034 0.024 0.025 ELK, BM
ST-2 6/9/2009 –0.174 0.239 0.033 –0.207 –0.217 0.055 0.009 0.032 0.023 0.024 ELK, BM
ST-2 6/9/2009 –0.175 0.239 0.032 –0.207 –0.217 0.054 0.007 0.031 0.024 0.025 ELK, BM
ST-2 6/9/2009 35.7 –0.175 0.239 0.032 –0.207 –0.217 0.054 0.006 0.030 0.024 0.025 ELK, BM
ST-2 6/10/2009 11:20 35.2 –0.178 0.234 0.028 –0.206 –0.216 0.059 –0.010 0.025 0.035 0.036 BM
ST-2 6/10/2009 –0.178 0.235 0.029 –0.207 –0.217 0.058 –0.009 0.025 0.034 0.035 BM
ST-2 6/10/2009 –0.178 0.234 0.028 –0.206 –0.216 0.057 –0.007 0.025 0.032 0.034 BM
ST-2 6/10/2009 35.4 –0.178 0.234 0.028 –0.206 –0.216 0.056 –0.007 0.025 0.032 0.033 BM
ST-2 6/11/2009 10:24 29.9 –0.177 0.243 0.033 –0.210 –0.221 0.058 0.001 0.030 0.029 0.030 BM, JL, CB
ST-2 6/11/2009 –0.178 0.240 0.031 –0.209 –0.219 0.059 0.000 0.030 0.030 0.031 BM, JL, CB
ST-2 6/11/2009 –0.181 0.240 0.030 –0.211 –0.221 0.059 –0.006 0.027 0.033 0.034 BM, JL, CB
ST-2 6/11/2009 31.1 –0.179 0.239 0.030 –0.209 –0.219 0.059 0.000 0.030 0.030 0.031 BM, JL, CB
ST-2 6/12/2009 2:20 39.2 –0.177 0.234 0.029 –0.206 –0.216 0.053 0.008 0.031 0.023 0.024 JL
ST-2 6/12/2009 –0.175 0.234 0.030 –0.205 –0.215 0.055 0.009 0.032 0.023 0.024 JL
ST-2 6/5/2009 10:30 30.1 –0.177 0.238 0.031 –0.208 –0.218 0.047 0.005 0.026 0.021 0.022 BM

A-7
Table A-2. Surface Tilt Meter Data for Site 2 (Page 3 of 3)
Site Date Time Temp (°C) X1 X3
(X1+X3) 2
(bias)
(X1-X3) 2
(∆) Tilt1 X2 X4
(X2+X4) 2
(bias)
(X2-X4) 2
(∆) Tilt2
Measured By Remarks
ST-2 6/12/2009 –0.175 0.235 0.030 –0.205 –0.215 0.053 0.010 0.032 0.022 0.023 JL
ST-2 6/12/2009 39.9 –0.175 0.236 0.031 –0.206 –0.216 0.052 0.009 0.031 0.022 0.023 JL
ST-2 6/13/2009 2:59 39.6 –0.181 0.237 0.028 –0.209 –0.219 0.048 0.007 0.028 0.021 0.022 JL
ST-2 6/13/2009 –0.182 0.237 0.028 –0.210 –0.220 0.048 0.008 0.028 0.020 0.021 JL
ST-2 6/13/2009 –0.183 0.237 0.027 –0.210 –0.221 0.049 0.008 0.029 0.021 0.022 JL
ST-2 6/13/2009 40.3 –0.183 0.238 0.028 –0.211 –0.221 0.050 0.007 0.029 0.022 0.023 JL
ST-2 6/14/2009 9:44 29.5 –0.183 0.245 0.031 –0.214 –0.225 0.055 0.006 0.031 0.025 0.026 JL
ST-2 6/14/2009 –0.184 0.244 0.030 –0.214 –0.225 0.054 0.004 0.029 0.025 0.026 JL
ST-2 6/14/2009 –0.184 0.244 0.030 –0.214 –0.225 0.053 0.005 0.029 0.024 0.025 JL
ST-2 6/14/2009 30.3 –0.184 0.245 0.031 –0.215 –0.225 0.053 0.005 0.029 0.024 0.025 JL
ST-2 6/15/2009 11:08 34.3 –0.186 0.239 0.027 –0.213 –0.223 0.052 –0.003 0.025 0.028 0.029 JL
ST-2 6/15/2009 –0.186 0.239 0.027 –0.213 –0.223 0.053 –0.002 0.026 0.028 0.029 JL
ST-2 6/15/2009 –0.185 0.239 0.027 –0.212 –0.223 0.053 –0.001 0.026 0.027 0.028 JL
ST-2 6/15/2009 35.3 –0.186 0.239 0.027 –0.213 –0.223 0.053 –0.001 0.026 0.027 0.028 JL
ST-2 6/16/2009 1:07 38.1 –0.184 0.233 0.025 –0.209 –0.219 0.046 0.011 0.029 0.018 0.018 JL
ST-2 6/16/2009 –0.183 0.234 0.026 –0.209 –0.219 0.046 0.011 0.029 0.018 0.018 JL
ST-2 6/16/2009 –0.184 0.236 0.026 –0.210 –0.221 0.047 0.012 0.030 0.018 0.018 JL
ST-2 6/16/2009 38.8 –0.183 0.235 0.026 –0.209 –0.219 0.046 0.011 0.029 0.018 0.018 JL
ST-2 6/17/2009 11:32 30.5 –0.190 0.236 0.023 –0.213 –0.224 0.044 0.012 0.028 0.016 0.017 JL
ST-2 6/17/2009 –0.189 0.236 0.024 –0.213 –0.223 0.045 0.012 0.029 0.017 0.017 JL
ST-2 6/17/2009 –0.187 0.237 0.025 –0.212 –0.223 0.046 0.013 0.030 0.017 0.017 JL
ST-2 6/17/2009 31.7 –0.188 0.237 0.025 –0.213 –0.223 0.046 0.012 0.029 0.017 0.018 JL
ST-2 6/18/2009 10:30 31.0 –0.188 0.243 0.028 –0.216 –0.226 0.054 0.006 0.030 0.024 0.025 JL
ST-2 6/18/2009 –0.187 0.242 0.028 –0.215 –0.225 0.053 0.005 0.029 0.024 0.025 JL
ST-2 6/18/2009 –0.187 0.240 0.027 –0.214 –0.224 0.052 0.005 0.029 0.024 0.025 JL
ST-2 6/18/2009 31.4 –0.187 0.240 0.027 –0.214 –0.224 0.052 0.005 0.029 0.024 0.025 JL
ST-2 6/19/2009 11:25 27.7 –0.170 0.220 0.025 –0.195 –0.205 0.049 0.007 0.028 0.021 0.022 JL
ST-2 6/19/2009 –0.170 0.222 0.026 –0.196 –0.206 0.050 0.005 0.028 0.023 0.024 JL
ST-2 6/19/2009 –0.170 0.223 0.027 –0.197 –0.206 0.050 0.004 0.027 0.023 0.024 JL

A-8
Table A-3. Surface Tilt Meter Data for Site 3 (Page 1 of 3)
Site Date Time Temp (°C) X1 X3
(X1+X3) 2
(bias)
(X1-X3) 2
(∆) Tilt1 X2 X4
(X2+X4) 2
(bias)
(X2-X4) 2
(∆) Tilt2
Measured By Remarks
ST-3 5/29/2009 14:24 37.8 0.196 –0.141 0.028 0.169 0.177 0.990 –0.943 0.024 0.967 1.015 BM
ST-3 5/29/2009 0.199 –0.141 0.029 0.170 0.179 1.003 –0.941 0.031 0.972 1.021 BM
ST-3 5/29/2009 0.198 –0.137 0.031 0.168 0.176 1.001 –0.941 0.030 0.971 1.020 BM
ST-3 5/29/2009 37.8 0.200 –0.137 0.032 0.169 0.177 1.000 –0.941 0.030 0.971 1.019 BM
ST-3 5/30/2009 10:37 29.7 0.185 –0.130 0.028 0.158 0.165 0.994 –0.945 0.025 0.970 1.018 BM
ST-3 5/30/2009 0.185 –0.122 0.031 0.154 0.161 0.997 –0.946 0.026 0.972 1.020 BM
ST-3 5/30/2009 0.182 –0.127 0.028 0.155 0.162 0.990 –0.946 0.022 0.968 1.016 BM
ST-3 5/30/2009 31.0 0.185 –0.124 0.031 0.155 0.162 0.993 –0.947 0.023 0.970 1.019 BM
ST-3 5/31/2009 9:45 27.0 0.175 –0.121 0.027 0.148 0.155 0.986 –0.932 0.027 0.959 1.007 BM
ST-3 5/31/2009 0.180 –0.127 0.027 0.154 0.161 0.990 –0.943 0.024 0.967 1.015 BM
ST-3 5/31/2009 0.177 –0.122 0.028 0.150 0.157 0.990 –0.936 0.027 0.963 1.011 BM
ST-3 5/31/2009 27.6 0.180 –0.125 0.028 0.153 0.160 0.989 –0.943 0.023 0.966 1.014 BM
ST-3 6/1/2009 12:15 30.5 0.192 –0.122 0.035 0.157 0.165 0.996 –0.940 0.028 0.968 1.016 BM
ST-3 6/1/2009 0.195 –0.127 0.034 0.161 0.169 0.995 –0.940 0.028 0.968 1.016 BM
ST-3 6/1/2009 0.191 –0.122 0.035 0.157 0.164 0.994 –0.938 0.028 0.966 1.014 BM
ST-3 6/1/2009 31.7 0.193 –0.125 0.034 0.159 0.167 0.996 –0.940 0.028 0.968 1.016 BM
ST-3 6/2/2009 15:22 38.4 0.192 –0.127 0.033 0.160 0.167 0.996 –0.942 0.027 0.969 1.017 CF, BM
ST-3 6/2/2009 0.188 –0.126 0.031 0.157 0.165 0.996 –0.940 0.028 0.968 1.016 CF, BM
ST-3 6/2/2009 0.187 –0.123 0.032 0.155 0.163 0.994 –0.943 0.026 0.969 1.017 CF, BM
ST-3 6/2/2009 38.9 0.187 –0.126 0.031 0.157 0.164 0.995 –0.942 0.027 0.969 1.017 CF, BM
ST-3 6/3/2009 9:58 23.0 0.180 –0.115 0.033 0.148 0.155 0.989 –0.937 0.026 0.963 1.011 BM
ST-3 6/3/2009 0.182 –0.122 0.030 0.152 0.160 0.989 –0.937 0.026 0.963 1.011 BM
ST-3 6/3/2009 0.182 –0.121 0.031 0.152 0.159 0.990 –0.941 0.025 0.966 1.014 BM
ST-3 6/3/2009 23.7 0.183 –0.120 0.032 0.152 0.159 0.988 –0.941 0.024 0.965 1.013 BM
ST-3 6/4/2009 11:44 32.1 0.186 –0.126 0.030 0.156 0.164 0.992 –0.933 0.030 0.963 1.011 BM
ST-3 6/4/2009 0.187 –0.127 0.030 0.157 0.165 0.992 –0.940 0.026 0.966 1.014 BM
ST-3 6/4/2009 0.189 –0.127 0.031 0.158 0.166 0.994 –0.942 0.026 0.968 1.016 BM
ST-3 6/4/2009 32.8 0.187 –0.126 0.031 0.157 0.164 0.993 –0.943 0.025 0.968 1.016 BM

A-9
Table A-3. Surface Tilt Meter Data for Site 3 (Page 2 of 3)
Site Date Time Temp (°C) X1 X3
(X1+X3) 2
(bias)
(X1-X3) 2
(∆) Tilt1 X2 X4
(X2+X4) 2
(bias)
(X2-X4) 2
(∆) Tilt2
Measured By Remarks
ST-3 6/5/2009 10:22 28.9 0.182 –0.126 0.028 0.154 0.162 0.991 –0.940 0.026 0.966 1.014 BM
ST-3 6/5/2009 0.186 –0.123 0.032 0.155 0.162 0.990 –0.942 0.024 0.966 1.014 BM
ST-3 6/5/2009 0.186 –0.121 0.033 0.154 0.161 0.991 –0.942 0.025 0.967 1.015 BM
ST-3 6/5/2009 29.5 0.184 –0.122 0.031 0.153 0.161 0.994 –0.943 0.026 0.969 1.017 BM
ST-3 6/6/2009 8:09 25.7 0.180 –0.114 0.033 0.147 0.154 0.992 –0.936 0.028 0.964 1.012 BM
ST-3 6/6/2009 0.176 –0.118 0.029 0.147 0.154 0.994 –0.939 0.028 0.967 1.015 BM
ST-3 6/6/2009 0.177 –0.117 0.030 0.147 0.154 0.993 –0.940 0.027 0.967 1.015 BM
ST-3 6/6/2009 26.3 0.178 –0.116 0.031 0.147 0.154 0.993 –0.941 0.026 0.967 1.015 BM
ST-3 6/7/2009 11:07 37.8 0.188 –0.123 0.033 0.156 0.163 0.997 –0.939 0.029 0.968 1.016 BM
ST-3 6/7/2009 0.188 –0.122 0.033 0.155 0.163 0.995 –0.941 0.027 0.968 1.016 BM
ST-3 6/7/2009 0.188 –0.125 0.032 0.157 0.164 0.994 –0.942 0.026 0.968 1.016 BM
ST-3 6/7/2009 37.8 0.188 –0.124 0.032 0.156 0.164 0.996 –0.943 0.027 0.970 1.018 BM
ST-3 6/8/2009 10:31 30.8 0.192 –0.121 0.036 0.157 0.164 0.996 –0.934 0.031 0.965 1.013 BM
ST-3 6/8/2009 0.190 –0.123 0.034 0.157 0.164 0.995 –0.941 0.027 0.968 1.016 BM
ST-3 6/8/2009 0.189 –0.125 0.032 0.157 0.165 0.998 –0.942 0.028 0.970 1.019 BM
ST-3 6/8/2009 32.1 0.188 –0.122 0.033 0.155 0.163 0.999 –0.943 0.028 0.971 1.020 BM
ST-3 6/9/2009 10:33 36.4 0.185 –0.119 0.033 0.152 0.160 1.003 –0.945 0.029 0.974 1.023 ELK, BM
ST-3 6/9/2009 0.183 –0.120 0.032 0.152 0.159 1.003 –0.946 0.029 0.975 1.023 ELK, BM
ST-3 6/9/2009 0.184 –0.120 0.032 0.152 0.160 1.003 –0.946 0.029 0.975 1.023 ELK, BM
ST-3 6/9/2009 37.0 0.184 –0.120 0.032 0.152 0.160 1.003 –0.947 0.028 0.975 1.024 ELK, BM
ST-3 6/10/2009 11:14 35.6 0.189 –0.123 0.033 0.156 0.164 0.998 –0.939 0.030 0.969 1.017 BM
ST-3 6/10/2009 0.190 –0.125 0.033 0.158 0.165 0.998 –0.942 0.028 0.970 1.019 BM
ST-3 6/10/2009 0.190 –0.126 0.032 0.158 0.166 0.999 –0.943 0.028 0.971 1.020 BM
ST-3 6/10/2009 35.9 0.190 –0.126 0.032 0.158 0.166 0.999 –0.943 0.028 0.971 1.020 BM
ST-3 6/11/2009 10:39 32.6 0.187 –0.133 0.027 0.160 0.168 0.999 –0.946 0.027 0.973 1.021 BM, JL, CB
ST-3 6/11/2009 0.198 –0.122 0.038 0.160 0.168 1.000 –0.945 0.028 0.973 1.021 BM, JL, CB
ST-3 6/11/2009 0.192 –0.129 0.032 0.161 0.169 0.999 –0.948 0.026 0.974 1.022 BM, JL, CB
ST-3 6/11/2009 33.9 0.188 –0.127 0.031 0.158 0.165 1.000 –0.948 0.026 0.974 1.023 BM, JL, CB
ST-3 6/12/2009 2:40 39.8 0.198 –0.126 0.036 0.162 0.170 1.004 –0.952 0.026 0.978 1.027 JL
ST-3 6/12/2009 0.196 –0.127 0.035 0.162 0.170 1.004 –0.950 0.027 0.977 1.026 JL

A-10
Table A-3. Surface Tilt Meter Data for Site 3 (Page 3 of 3)
Site Date Time Temp (°C) X1 X3
(X1+X3) 2
(bias)
(X1-X3) 2
(∆) Tilt1 X2 X4
(X2+X4) 2
(bias)
(X2-X4) 2
(∆) Tilt2
Measured By Remarks
ST-3 6/12/2009 0.196 –0.128 0.034 0.162 0.170 1.004 –0.951 0.027 0.978 1.026 JL
ST-3 6/12/2009 40.6 0.195 –0.127 0.034 0.161 0.169 1.004 –0.952 0.026 0.978 1.027 JL
ST-3 6/13/2009 3:07 40.9 0.196 –0.133 0.032 0.165 0.173 1.004 –0.944 0.030 0.974 1.023 JL
ST-3 6/13/2009 0.198 –0.133 0.033 0.166 0.174 1.003 –0.945 0.029 0.974 1.023 JL
ST-3 6/13/2009 0.197 –0.133 0.032 0.165 0.173 1.004 –0.946 0.029 0.975 1.024 JL
ST-3 6/13/2009 41.6 0.198 –0.132 0.033 0.165 0.173 1.005 –0.946 0.030 0.976 1.024 JL
ST-3 6/14/2009 9:53 31.0 0.185 –0.121 0.032 0.153 0.161 1.000 –0.948 0.026 0.974 1.023 JL
ST-3 6/14/2009 0.185 –0.121 0.032 0.153 0.161 1.000 –0.949 0.026 0.975 1.023 JL
ST-3 6/14/2009 0.184 –0.121 0.032 0.153 0.160 1.000 –0.948 0.026 0.974 1.023 JL
ST-3 6/14/2009 31.8 0.184 –0.120 0.032 0.152 0.160 1.000 –0.948 0.026 0.974 1.023 JL
ST-3 6/15/2009 11:12 35.9 0.193 –0.127 0.033 0.160 0.168 1.002 –0.947 0.028 0.975 1.023 JL
ST-3 6/15/2009 0.194 –0.128 0.033 0.161 0.169 1.003 –0.948 0.028 0.976 1.024 JL
ST-3 6/15/2009 0.194 –0.128 0.033 0.161 0.169 1.003 –0.948 0.028 0.976 1.024 JL
ST-3 6/15/2009 37.2 0.194 –0.128 0.033 0.161 0.169 1.003 –0.948 0.028 0.976 1.024 JL
ST-3 6/16/2009 1:15 39.4 0.198 –0.136 0.031 0.167 0.175 1.002 –0.947 0.028 0.975 1.023 JL
ST-3 6/16/2009 0.198 –0.134 0.032 0.166 0.174 1.002 –0.948 0.027 0.975 1.024 JL
ST-3 6/16/2009 0.198 –0.135 0.032 0.167 0.175 1.002 –0.948 0.027 0.975 1.024 JL
ST-3 6/16/2009 40.3 0.198 –0.135 0.032 0.167 0.175 1.002 –0.948 0.027 0.975 1.024 JL
ST-3 6/17/2009 11:39 32.0 0.183 –0.123 0.030 0.153 0.161 1.000 –0.947 0.027 0.974 1.022 JL
ST-3 6/17/2009 0.184 –0.123 0.031 0.154 0.161 1.000 –0.947 0.027 0.974 1.022 JL
ST-3 6/17/2009 0.183 –0.123 0.030 0.153 0.161 1.000 –0.948 0.026 0.974 1.023 JL
ST-3 6/17/2009 32.5 0.183 –0.123 0.030 0.153 0.161 1.000 –0.949 0.026 0.975 1.023 JL
ST-3 6/18/2009 10:37 31.8 0.183 –0.124 0.030 0.154 0.161 1.000 –0.948 0.026 0.974 1.023 JL
ST-3 6/18/2009 0.184 –0.124 0.030 0.154 0.162 1.001 –0.949 0.026 0.975 1.024 JL
ST-3 6/18/2009 0.184 –0.124 0.030 0.154 0.162 1.000 –0.951 0.025 0.976 1.024 JL
ST-3 6/18/2009 32.3 0.184 –0.124 0.030 0.154 0.162 1.000 –0.952 0.024 0.976 1.025 JL
ST-3 6/19/2009 11:33 28.3 0.180 –0.124 0.028 0.152 0.160 0.997 –0.947 0.025 0.972 1.021 JL
ST-3 6/19/2009 0.180 –0.123 0.029 0.152 0.159 0.997 –0.949 0.024 0.973 1.022 JL
ST-3 6/19/2009 0.181 –0.123 0.029 0.152 0.160 0.997 –0.949 0.024 0.973 1.022 JL
ST-3 6/19/2009 28.7 0.181 –0.123 0.029 0.152 0.160 0.997 –0.951 0.023 0.974 1.023 JL

A-11
Table A-4. Surface Tilt Meter Data for Site 4 (Page 1 of 3)
Site Date Time Temp (°C) X1 X3
(X1+X3) 2
(bias)
(X1-X3) 2
(∆) Tilt1 X2 X4
(X2+X4) 2
(bias)
(X2-X4) 2
(∆) Tilt2
Measured By Remarks
ST-4 5/29/2009 14:32 38.1 –2.348 2.418 0.035 –2.383 –2.502 0.756 –0.699 0.029 0.728 0.764 BM
ST-4 5/29/2009 –2.347 2.416 0.035 –2.382 –2.501 0.752 –0.703 0.025 0.728 0.764 BM
ST-4 5/29/2009 –2.349 2.418 0.035 –2.384 –2.503 0.756 –0.707 0.025 0.732 0.768 BM
ST-4 5/29/2009 38.7 –2.347 2.420 0.037 –2.384 –2.503 0.760 –0.706 0.027 0.733 0.770 BM
ST-4 5/30/2009 10:43 31.5 –2.363 2.420 0.029 –2.392 –2.511 0.760 –0.719 0.021 0.740 0.776 BM
ST-4 5/30/2009 –2.341 2.418 0.039 –2.380 –2.498 0.763 –0.712 0.026 0.738 0.774 BM
ST-4 5/30/2009 –2.323 2.418 0.048 –2.371 –2.489 0.760 –0.710 0.025 0.735 0.772 BM
ST-4 5/30/2009 38.7 –2.231 2.423 0.096 –2.327 –2.443 0.769 –0.711 0.029 0.740 0.777 BM
ST-4 5/31/2009 9:50 27.5 –2.384 2.449 0.033 –2.417 –2.537 0.771 –0.710 0.031 0.741 0.778 BM
ST-4 5/31/2009 –2.374 2.453 0.039 –2.414 –2.534 0.765 –0.715 0.025 0.740 0.777 BM
ST-4 5/31/2009 –2.373 2.455 0.041 –2.414 –2.535 0.770 –0.720 0.025 0.745 0.782 BM
ST-4 5/31/2009 28.6 –2.379 2.456 0.039 –2.418 –2.538 0.765 –0.726 0.020 0.746 0.783 BM
ST-4 6/1/2009 12:19 32.1 –2.403 2.470 0.034 –2.437 –2.558 0.754 –0.700 0.027 0.727 0.763 BM
ST-4 6/1/2009 –2.411 2.469 0.029 –2.440 –2.562 0.750 –0.700 0.025 0.725 0.761 BM
ST-4 6/1/2009 –2.404 2.473 0.035 –2.439 –2.560 0.751 –0.701 0.025 0.726 0.762 BM
ST-4 6/1/2009 33.2 –2.402 2.469 0.033 –2.436 –2.557 0.749 –0.702 0.024 0.726 0.762 BM
ST-4 6/2/2009 15:25 39.0 –2.446 2.525 0.039 –2.486 –2.610 0.738 –0.680 0.029 0.709 0.744 CF, BM
ST-4 6/2/2009 –2.445 2.527 0.041 –2.486 –2.610 0.738 –0.685 0.027 0.712 0.747 CF, BM
ST-4 6/2/2009 –2.450 2.528 0.039 –2.489 –2.613 0.739 –0.690 0.025 0.715 0.750 CF, BM
ST-4 6/2/2009 39.5 –2.454 2.518 0.032 –2.486 –2.610 0.737 –0.683 0.027 0.710 0.746 CF, BM
ST-4 6/3/2009 10:03 23.7 –2.435 2.498 0.032 –2.467 –2.590 0.751 –0.712 0.020 0.732 0.768 BM
ST-4 6/3/2009 –2.437 2.501 0.032 –2.469 –2.592 0.749 –0.707 0.021 0.728 0.764 BM
ST-4 6/3/2009 –2.436 2.504 0.034 –2.470 –2.594 0.750 –0.704 0.023 0.727 0.763 BM
ST-4 6/3/2009 24.2 –2.437 2.506 0.035 –2.472 –2.595 0.751 –0.705 0.023 0.728 0.764 BM
ST-4 6/4/2009 11:40 31.0 –2.436 2.504 0.034 –2.470 –2.594 0.742 –0.674 0.034 0.708 0.743 BM
ST-4 6/4/2009 –2.437 2.504 0.034 –2.471 –2.594 0.740 –0.682 0.029 0.711 0.747 BM
ST-4 6/4/2009 –2.438 2.506 0.034 –2.472 –2.596 0.742 –0.685 0.029 0.714 0.749 BM
ST-4 6/4/2009 31.9 –2.439 2.506 0.033 –2.473 –2.596 0.740 –0.685 0.028 0.713 0.748 BM

A-12
Table A-4. Surface Tilt Meter Data for Site 4 (Page 2 of 3)
Site Date Time Temp (°C) X1 X3
(X1+X3) 2
(bias)
(X1-X3) 2
(∆) Tilt1 X2 X4
(X2+X4) 2
(bias)
(X2-X4) 2
(∆) Tilt2
Measured By Remarks
ST-4 6/5/2009 10:18 27.8 –2.437 2.499 0.031 –2.468 –2.591 0.743 –0.675 0.034 0.709 0.744 BM
ST-4 6/5/2009 –2.436 2.503 0.034 –2.470 –2.593 0.740 –0.681 0.030 0.711 0.746 BM
ST-4 6/5/2009 –2.434 2.503 0.035 –2.469 –2.592 0.740 –0.684 0.028 0.712 0.748 BM
ST-4 6/5/2009 28.6 –2.433 2.504 0.036 –2.469 –2.592 0.740 –0.686 0.027 0.713 0.749 BM
ST-4 6/6/2009 8:07 26.3 –2.435 2.502 0.033 –2.469 –2.592 0.748 –0.689 0.030 0.719 0.754 BM
ST-4 6/6/2009 –2.437 2.508 0.036 –2.473 –2.596 0.745 –0.693 0.026 0.719 0.755 BM
ST-4 6/6/2009 –2.438 2.509 0.035 –2.474 –2.597 0.746 –0.694 0.026 0.720 0.756 BM
ST-4 6/6/2009 27.1 –2.439 2.509 0.035 –2.474 –2.598 0.745 –0.696 0.025 0.721 0.757 BM
ST-4 6/7/2009 10:57 37.8 –2.445 2.506 0.031 –2.476 –2.599 0.727 –0.690 0.019 0.709 0.744 BM
ST-4 6/7/2009 –2.446 2.514 0.034 –2.480 –2.604 0.728 –0.680 0.024 0.704 0.739 BM
ST-4 6/7/2009 –2.447 2.518 0.035 –2.483 –2.607 0.726 –0.677 0.025 0.702 0.737 BM
ST-4 6/7/2009 37.9 –2.448 2.518 0.035 –2.483 –2.607 0.725 –0.676 0.025 0.701 0.736 BM
ST-4 6/8/2009 10:35 32.5 –2.439 2.505 0.033 –2.472 –2.596 0.716 –0.649 0.034 0.683 0.717 BM
ST-4 6/8/2009 –2.438 2.506 0.034 –2.472 –2.596 0.714 –0.659 0.028 0.687 0.721 BM
ST-4 6/8/2009 –2.440 2.508 0.034 –2.474 –2.598 0.714 –0.659 0.028 0.687 0.721 BM
ST-4 6/8/2009 33.5 –2.440 2.507 0.034 –2.474 –2.597 0.714 –0.660 0.027 0.687 0.721 BM
ST-4 6/9/2009 10:25 35.8 –2.451 2.521 0.035 –2.486 –2.610 0.716 –0.660 0.028 0.688 0.722 ELK, BM
ST-4 6/9/2009 –2.452 2.525 0.037 –2.489 –2.613 0.714 –0.662 0.026 0.688 0.722 ELK, BM
ST-4 6/9/2009 –2.453 2.526 0.037 –2.490 –2.614 0.713 –0.660 0.027 0.687 0.721 ELK, BM
ST-4 6/9/2009 36.7 –2.455 2.526 0.035 –2.491 –2.615 0.713 –0.660 0.027 0.687 0.721 ELK, BM
ST-4 6/10/2009 11:08 34.9 –2.432 2.501 0.035 –2.467 –2.590 0.709 –0.650 0.030 0.680 0.713 BM
ST-4 6/10/2009 –2.433 2.501 0.034 –2.467 –2.590 0.706 –0.652 0.027 0.679 0.713 BM
ST-4 6/10/2009 –2.431 2.501 0.035 –2.466 –2.589 0.706 –0.655 0.026 0.681 0.715 BM
ST-4 6/10/2009 35.6 –2.433 2.500 0.034 –2.467 –2.590 0.706 –0.653 0.027 0.680 0.713 BM
ST-4 6/11/2009 10:42 34.1 –2.426 2.496 0.035 –2.461 –2.584 0.710 –0.669 0.021 0.690 0.724 BM, JL, CB
ST-4 6/11/2009 –2.432 2.503 0.036 –2.468 –2.591 0.701 –0.655 0.023 0.678 0.712 BM, JL, CB
ST-4 6/11/2009 –2.436 2.504 0.034 –2.470 –2.594 0.701 –0.658 0.022 0.680 0.713 BM, JL, CB
ST-4 6/11/2009 35.8 –2.434 2.505 0.035 –2.470 –2.593 0.703 –0.650 0.027 0.677 0.710 BM, JL, CB
ST-4 6/12/2009 2:46 40.6 –2.458 2.520 0.031 –2.489 –2.613 0.694 –0.640 0.027 0.667 0.700 JL
ST-4 6/12/2009 –2.456 2.525 0.035 –2.491 –2.615 0.692 –0.643 0.025 0.668 0.701 JL

A-13
Table A-4. Surface Tilt Meter Data for Site 4 (Page 3 of 3)
Site Date Time Temp (°C) X1 X3
(X1+X3) 2
(bias)
(X1-X3) 2
(∆) Tilt1 X2 X4
(X2+X4) 2
(bias)
(X2-X4) 2
(∆) Tilt2
Measured By Remarks
ST-4 6/12/2009 –2.455 2.526 0.035 –2.491 –2.615 0.693 –0.642 0.026 0.668 0.701 JL
ST-4 6/12/2009 41.2 –2.457 2.527 0.035 –2.492 –2.617 0.692 –0.642 0.025 0.667 0.700 JL
ST-4 6/13/2009 3:13 42.9 –2.463 2.537 0.037 –2.500 –2.625 0.698 –0.631 0.034 0.665 0.698 JL
ST-4 6/13/2009 –2.467 2.541 0.037 –2.504 –2.629 0.698 –0.634 0.032 0.666 0.699 JL
ST-4 6/13/2009 –2.468 2.542 0.037 –2.505 –2.630 0.698 –0.633 0.033 0.666 0.699 JL
ST-4 6/13/2009 43.3 –2.467 2.541 0.037 –2.504 –2.629 0.698 –0.633 0.033 0.666 0.699 JL
ST-4 6/14/2009 10:00 32.3 –2.438 2.501 0.031 –2.470 –2.593 0.700 –0.650 0.025 0.675 0.709 JL
ST-4 6/14/2009 –2.438 2.502 0.032 –2.470 –2.594 0.702 –0.649 0.027 0.676 0.709 JL
ST-4 6/14/2009 –2.438 2.501 0.031 –2.470 –2.593 0.701 –0.647 0.027 0.674 0.708 JL
ST-4 6/14/2009 33.1 –2.438 2.502 0.032 –2.470 –2.594 0.703 –0.648 0.028 0.676 0.709 JL
ST-4 6/15/2009 11:19 37.6 –2.427 2.488 0.031 –2.458 –2.580 0.696 –0.644 0.026 0.670 0.704 JL
ST-4 6/15/2009 –2.423 2.489 0.033 –2.456 –2.579 0.694 –0.644 0.025 0.669 0.702 JL
ST-4 6/15/2009 –2.424 2.489 0.033 –2.457 –2.579 0.694 –0.645 0.025 0.670 0.703 JL
ST-4 6/15/2009 38.7 –2.425 2.489 0.032 –2.457 –2.580 0.694 –0.645 0.025 0.670 0.703 JL
ST-4 6/16/2009 1:21 40.7 –2.444 2.512 0.034 –2.478 –2.602 0.689 –0.633 0.028 0.661 0.694 JL
ST-4 6/16/2009 –2.443 2.512 0.035 –2.478 –2.601 0.687 –0.635 0.026 0.661 0.694 JL
ST-4 6/16/2009 –2.444 2.514 0.035 –2.479 –2.603 0.687 –0.635 0.026 0.661 0.694 JL
ST-4 6/16/2009 41.7 –2.444 2.514 0.035 –2.479 –2.603 0.687 –0.635 0.026 0.661 0.694 JL
ST-4 6/17/2009 11:46 35.0 –2.452 2.503 0.026 –2.478 –2.601 0.703 –0.652 0.026 0.678 0.711 JL
ST-4 6/17/2009 –2.451 2.509 0.029 –2.480 –2.604 0.703 –0.654 0.025 0.679 0.712 JL
ST-4 6/17/2009 –2.450 2.513 0.031 –2.482 –2.606 0.705 –0.653 0.026 0.679 0.713 JL
ST-4 6/17/2009 35.7 –2.450 2.512 0.031 –2.481 –2.605 0.704 –0.654 0.025 0.679 0.713 JL
ST-4 6/18/2009 10:45 32.5 –2.437 2.496 0.030 –2.467 –2.590 0.696 –0.647 0.025 0.672 0.705 JL
ST-4 6/18/2009 –2.435 2.497 0.031 –2.466 –2.589 0.698 –0.647 0.026 0.673 0.706 JL
ST-4 6/18/2009 –2.436 2.499 0.032 –2.468 –2.591 0.696 –0.648 0.024 0.672 0.706 JL
ST-4 6/18/2009 33.5 –2.436 2.499 0.032 –2.468 –2.591 0.696 –0.649 0.024 0.673 0.706 JL
ST-4 6/19/2009 11:40 28.9 –2.541 2.603 0.031 –2.572 –2.701 0.750 –0.699 0.026 0.725 0.761 JL
ST-4 6/19/2009 –2.543 2.604 0.031 –2.574 –2.702 0.746 –0.701 0.023 0.724 0.760 JL
ST-4 6/19/2009 –2.543 2.605 0.031 –2.574 –2.703 0.747 –0.701 0.023 0.724 0.760 JL
ST-4 6/19/2009 29.1 –2.543 2.605 0.031 –2.574 –2.703 0.746 –0.703 0.022 0.725 0.761 JL
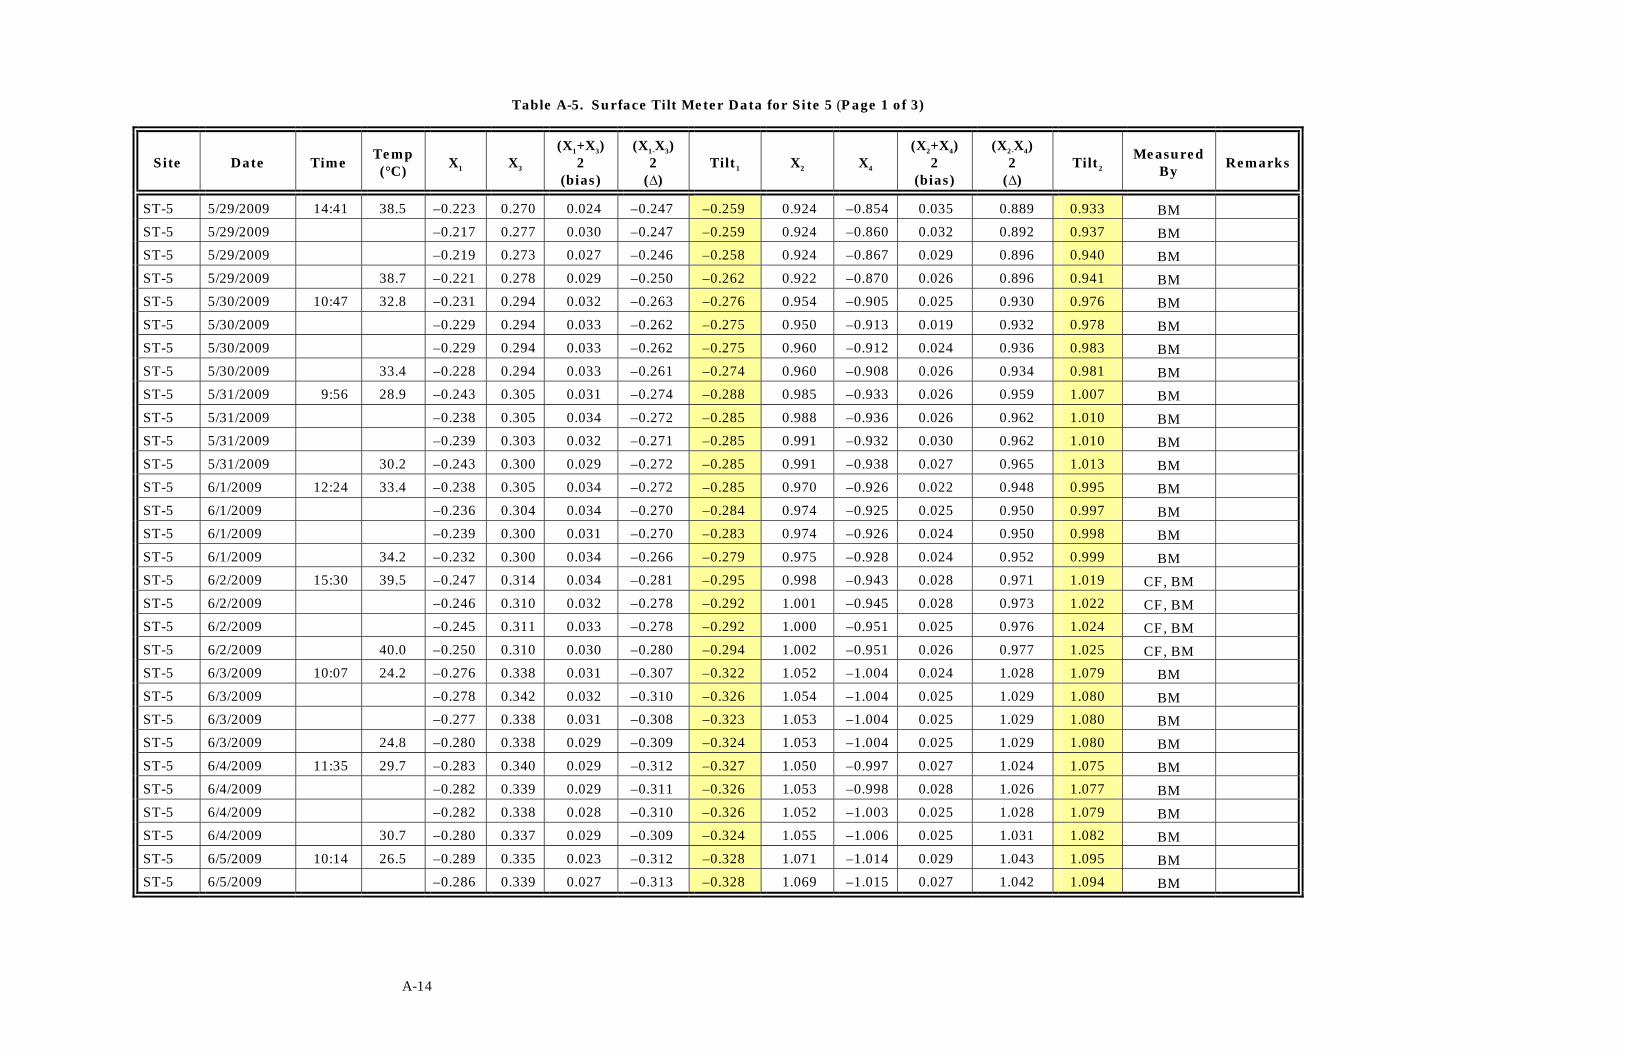
A-14
Table A-5. Surface Tilt Meter Data for Site 5 (Page 1 of 3)
Site Date Time Temp (°C) X1 X3
(X1+X3) 2
(bias)
(X1-X3) 2
(∆) Tilt1 X2 X4
(X2+X4) 2
(bias)
(X2-X4) 2
(∆) Tilt2
Measured By Remarks
ST-5 5/29/2009 14:41 38.5 –0.223 0.270 0.024 –0.247 –0.259 0.924 –0.854 0.035 0.889 0.933 BM
ST-5 5/29/2009 –0.217 0.277 0.030 –0.247 –0.259 0.924 –0.860 0.032 0.892 0.937 BM
ST-5 5/29/2009 –0.219 0.273 0.027 –0.246 –0.258 0.924 –0.867 0.029 0.896 0.940 BM
ST-5 5/29/2009 38.7 –0.221 0.278 0.029 –0.250 –0.262 0.922 –0.870 0.026 0.896 0.941 BM
ST-5 5/30/2009 10:47 32.8 –0.231 0.294 0.032 –0.263 –0.276 0.954 –0.905 0.025 0.930 0.976 BM
ST-5 5/30/2009 –0.229 0.294 0.033 –0.262 –0.275 0.950 –0.913 0.019 0.932 0.978 BM
ST-5 5/30/2009 –0.229 0.294 0.033 –0.262 –0.275 0.960 –0.912 0.024 0.936 0.983 BM
ST-5 5/30/2009 33.4 –0.228 0.294 0.033 –0.261 –0.274 0.960 –0.908 0.026 0.934 0.981 BM
ST-5 5/31/2009 9:56 28.9 –0.243 0.305 0.031 –0.274 –0.288 0.985 –0.933 0.026 0.959 1.007 BM
ST-5 5/31/2009 –0.238 0.305 0.034 –0.272 –0.285 0.988 –0.936 0.026 0.962 1.010 BM
ST-5 5/31/2009 –0.239 0.303 0.032 –0.271 –0.285 0.991 –0.932 0.030 0.962 1.010 BM
ST-5 5/31/2009 30.2 –0.243 0.300 0.029 –0.272 –0.285 0.991 –0.938 0.027 0.965 1.013 BM
ST-5 6/1/2009 12:24 33.4 –0.238 0.305 0.034 –0.272 –0.285 0.970 –0.926 0.022 0.948 0.995 BM
ST-5 6/1/2009 –0.236 0.304 0.034 –0.270 –0.284 0.974 –0.925 0.025 0.950 0.997 BM
ST-5 6/1/2009 –0.239 0.300 0.031 –0.270 –0.283 0.974 –0.926 0.024 0.950 0.998 BM
ST-5 6/1/2009 34.2 –0.232 0.300 0.034 –0.266 –0.279 0.975 –0.928 0.024 0.952 0.999 BM
ST-5 6/2/2009 15:30 39.5 –0.247 0.314 0.034 –0.281 –0.295 0.998 –0.943 0.028 0.971 1.019 CF, BM
ST-5 6/2/2009 –0.246 0.310 0.032 –0.278 –0.292 1.001 –0.945 0.028 0.973 1.022 CF, BM
ST-5 6/2/2009 –0.245 0.311 0.033 –0.278 –0.292 1.000 –0.951 0.025 0.976 1.024 CF, BM
ST-5 6/2/2009 40.0 –0.250 0.310 0.030 –0.280 –0.294 1.002 –0.951 0.026 0.977 1.025 CF, BM
ST-5 6/3/2009 10:07 24.2 –0.276 0.338 0.031 –0.307 –0.322 1.052 –1.004 0.024 1.028 1.079 BM
ST-5 6/3/2009 –0.278 0.342 0.032 –0.310 –0.326 1.054 –1.004 0.025 1.029 1.080 BM
ST-5 6/3/2009 –0.277 0.338 0.031 –0.308 –0.323 1.053 –1.004 0.025 1.029 1.080 BM
ST-5 6/3/2009 24.8 –0.280 0.338 0.029 –0.309 –0.324 1.053 –1.004 0.025 1.029 1.080 BM
ST-5 6/4/2009 11:35 29.7 –0.283 0.340 0.029 –0.312 –0.327 1.050 –0.997 0.027 1.024 1.075 BM
ST-5 6/4/2009 –0.282 0.339 0.029 –0.311 –0.326 1.053 –0.998 0.028 1.026 1.077 BM
ST-5 6/4/2009 –0.282 0.338 0.028 –0.310 –0.326 1.052 –1.003 0.025 1.028 1.079 BM
ST-5 6/4/2009 30.7 –0.280 0.337 0.029 –0.309 –0.324 1.055 –1.006 0.025 1.031 1.082 BM
ST-5 6/5/2009 10:14 26.5 –0.289 0.335 0.023 –0.312 –0.328 1.071 –1.014 0.029 1.043 1.095 BM
ST-5 6/5/2009 –0.286 0.339 0.027 –0.313 –0.328 1.069 –1.015 0.027 1.042 1.094 BM

A-15
Table A-5. Surface Tilt Meter Data for Site 5 (Page 2 of 3)
Site Date Time Temp (°C) X1 X3
(X1+X3) 2
(bias)
(X1-X3) 2
(∆) Tilt1 X2 X4
(X2+X4) 2
(bias)
(X2-X4) 2
(∆) Tilt2
Measured By Remarks
ST-5 6/5/2009 –0.286 0.339 0.027 –0.313 –0.328 1.071 –1.017 0.027 1.044 1.096 BM
ST-5 6/5/2009 27.5 –0.287 0.340 0.027 –0.314 –0.329 1.069 –1.018 0.026 1.044 1.096 BM
ST-5 6/6/2009 8:11 27.1 –0.294 0.361 0.034 –0.328 –0.344 1.089 –1.035 0.027 1.062 1.115 BM
ST-5 6/6/2009 –0.294 0.355 0.031 –0.325 –0.341 1.090 –1.039 0.026 1.065 1.118 BM
ST-5 6/6/2009 –0.294 0.354 0.030 –0.324 –0.340 1.090 –1.039 0.026 1.065 1.118 BM
ST-5 6/6/2009 27.6 –0.294 0.353 0.030 –0.324 –0.340 1.090 –1.040 0.025 1.065 1.118 BM
ST-5 6/7/2009 10:54 37.5 –0.278 0.344 0.033 –0.311 –0.327 1.057 –1.008 0.025 1.033 1.084 BM
ST-5 6/7/2009 –0.279 0.343 0.032 –0.311 –0.327 1.057 –1.007 0.025 1.032 1.084 BM
ST-5 6/7/2009 –0.280 0.341 0.031 –0.311 –0.326 1.057 –1.006 0.026 1.032 1.083 BM
ST-5 6/7/2009 34.7 –0.280 0.343 0.032 –0.312 –0.327 1.059 –1.006 0.027 1.033 1.084 BM
ST-5 6/8/2009 10:38 33.8 –0.283 0.345 0.031 –0.314 –0.330 1.052 –0.994 0.029 1.023 1.074 BM
ST-5 6/8/2009 –0.282 0.341 0.030 –0.312 –0.327 1.050 –0.995 0.028 1.023 1.074 BM
ST-5 6/8/2009 –0.281 0.340 0.030 –0.311 –0.326 1.051 –0.997 0.027 1.024 1.075 BM
ST-5 6/8/2009 34.7 –0.281 0.340 0.030 –0.311 –0.326 1.051 –0.997 0.027 1.024 1.075 BM
ST-5 6/9/2009 10:15 35.0 –0.287 0.346 0.030 –0.317 –0.332 1.062 –1.006 0.028 1.034 1.086 ELK, BM
ST-5 6/9/2009 –0.287 0.347 0.030 –0.317 –0.333 1.066 –1.008 0.029 1.037 1.089 ELK, BM
ST-5 6/9/2009 –0.286 0.348 0.031 –0.317 –0.333 1.065 –1.008 0.029 1.037 1.088 ELK, BM
ST-5 6/9/2009 35.9 –0.289 0.347 0.029 –0.318 –0.334 1.064 –1.007 0.029 1.036 1.087 ELK, BM
ST-5 6/10/2009 11:03 34.1 –0.294 0.350 0.028 –0.322 –0.338 1.050 –1.000 0.025 1.025 1.076 BM
ST-5 6/10/2009 –0.293 0.348 0.028 –0.321 –0.337 1.052 –1.000 0.026 1.026 1.077 BM
ST-5 6/10/2009 –0.294 0.347 0.027 –0.321 –0.337 1.051 –1.000 0.026 1.026 1.077 BM
ST-5 6/10/2009 34.9 –0.292 0.347 0.028 –0.320 –0.335 1.051 –1.001 0.025 1.026 1.077 BM
ST-5 6/11/2009 10:52 35.7 –0.280 0.349 0.035 –0.315 –0.330 1.068 –1.001 0.034 1.035 1.086 BM, JL, CB
ST-5 6/11/2009 –0.285 0.350 0.033 –0.318 –0.333 1.061 –1.007 0.027 1.034 1.086 BM, JL, CB
ST-5 6/11/2009 –0.288 0.348 0.030 –0.318 –0.334 1.060 –1.003 0.029 1.032 1.083 BM, JL, CB
ST-5 6/11/2009 36.1 –0.285 0.350 0.033 –0.318 –0.333 1.061 –1.002 0.030 1.032 1.083 BM, JL, CB
ST-5 6/12/2009 2:52 41.1 –0.172 0.240 0.034 –0.206 –0.216 0.805 –0.750 0.028 0.778 0.816 JL
ST-5 6/12/2009 –0.172 0.240 0.034 –0.206 –0.216 0.804 –0.750 0.027 0.777 0.816 JL
ST-5 6/12/2009 –0.172 0.241 0.035 –0.207 –0.217 0.807 –0.748 0.030 0.778 0.816 JL
ST-5 6/12/2009 41.8 –0.172 0.240 0.034 –0.206 –0.216 0.806 –0.749 0.029 0.778 0.816 JL
ST-5 6/13/2009 3:20 43.5 –0.182 0.251 0.035 –0.217 –0.227 0.835 –0.782 0.027 0.809 0.849 JL

A-16
Table A-5. Surface Tilt Meter Data for Site 5 (Page 3 of 3)
Site Date Time Temp (°C) X1 X3
(X1+X3) 2
(bias)
(X1-X3) 2
(∆) Tilt1 X2 X4
(X2+X4) 2
(bias)
(X2-X4) 2
(∆) Tilt2
Measured By Remarks
ST-5 6/13/2009 –0.183 0.252 0.035 –0.218 –0.228 0.837 –0.786 0.026 0.812 0.852 JL
ST-5 6/13/2009 –0.184 0.252 0.034 –0.218 –0.229 0.839 –0.786 0.027 0.813 0.853 JL
ST-5 6/13/2009 43.8 –0.185 0.254 0.035 –0.220 –0.230 0.839 –0.787 0.026 0.813 0.854 JL
ST-5 6/14/2009 10:07 33.5 –0.210 0.274 0.032 –0.242 –0.254 0.895 –0.835 0.030 0.865 0.908 JL
ST-5 6/14/2009 –0.210 0.274 0.032 –0.242 –0.254 0.896 –0.839 0.029 0.868 0.911 JL
ST-5 6/14/2009 –0.211 0.274 0.032 –0.243 –0.255 0.895 –0.843 0.026 0.869 0.912 JL
ST-5 6/14/2009 34.0 –0.212 0.275 0.032 –0.244 –0.256 0.898 –0.844 0.027 0.871 0.915 JL
ST-5 6/15/2009 11:27 38.9 –0.212 0.269 0.029 –0.241 –0.253 0.901 –0.853 0.024 0.877 0.921 JL
ST-5 6/15/2009 –0.214 0.272 0.029 –0.243 –0.255 0.901 –0.853 0.024 0.877 0.921 JL
ST-5 6/15/2009 –0.214 0.272 0.029 –0.243 –0.255 0.902 –0.854 0.024 0.878 0.922 JL
ST-5 6/15/2009 39.5 –0.214 0.273 0.030 –0.244 –0.256 0.902 –0.854 0.024 0.878 0.922 JL
ST-5 6/16/2009 1:28 41.9 –0.218 0.272 0.027 –0.245 –0.257 0.910 –0.851 0.030 0.881 0.925 JL
ST-5 6/16/2009 –0.217 0.275 0.029 –0.246 –0.258 0.909 –0.855 0.027 0.882 0.926 JL
ST-5 6/16/2009 –0.215 0.275 0.030 –0.245 –0.257 0.909 –0.858 0.026 0.884 0.928 JL
ST-5 6/16/2009 42.2 –0.216 0.275 0.030 –0.246 –0.258 0.909 –0.859 0.025 0.884 0.928 JL
ST-5 6/17/2009 11:52 36.0 –0.240 0.293 0.027 –0.267 –0.280 0.972 –0.919 0.027 0.946 0.993 JL
ST-5 6/17/2009 –0.238 0.294 0.028 –0.266 –0.279 0.970 –0.922 0.024 0.946 0.993 JL
ST-5 6/17/2009 –0.238 0.295 0.029 –0.267 –0.280 0.970 –0.923 0.024 0.947 0.994 JL
ST-5 6/17/2009 36.7 –0.239 0.295 0.028 –0.267 –0.280 0.970 –0.923 0.024 0.947 0.994 JL
ST-5 6/18/2009 10:52 33.9 –0.242 0.287 0.023 –0.265 –0.278 0.968 –0.915 0.027 0.942 0.989 JL
ST-5 6/18/2009 –0.242 0.290 0.024 –0.266 –0.279 0.968 –0.919 0.025 0.944 0.991 JL
ST-5 6/18/2009 –0.239 0.292 0.027 –0.266 –0.279 0.968 –0.920 0.024 0.944 0.991 JL
ST-5 6/18/2009 34.8 –0.241 0.292 0.026 –0.267 –0.280 0.968 –0.920 0.024 0.944 0.991 JL
ST-5 6/19/2009 11:47 29.2 –0.267 0.312 0.023 –0.290 –0.304 1.012 –0.961 0.026 0.987 1.036 JL
ST-5 6/19/2009 –0.266 0.316 0.025 –0.291 –0.306 1.010 –0.963 0.024 0.987 1.036 JL
ST-5 6/19/2009 –0.266 0.318 0.026 –0.292 –0.307 1.009 –0.963 0.023 0.986 1.035 JL
ST-5 6/19/2009 29.3 –0.263 0.320 0.029 –0.292 –0.306 1.009 –0.964 0.023 0.987 1.036 JL

A-17
Table A-6. Surface Tilt Meter Data for Site 6 (Page 1 of 3)
Site Date Time Temp (°C) X1 X3
(X1+X3) 2
(bias)
(X1-X3) 2
(∆) Tilt1 X2 X4
(X2+X4) 2
(bias)
(X2-X4) 2
(∆) Tilt2
Measured By Remarks
ST-6 5/29/2009 14:51 38.4 0.177 –0.118 0.030 0.148 0.155 –0.437 0.495 0.029 -0.466 -0.489 BM
ST-6 5/29/2009 0.178 –0.116 0.031 0.147 0.154 –0.440 0.497 0.029 -0.469 -0.492 BM
ST-6 5/29/2009 0.172 –0.113 0.030 0.143 0.150 –0.443 0.492 0.025 -0.468 -0.491 BM
ST-6 5/29/2009 37.3 0.173 –0.112 0.031 0.143 0.150 –0.433 0.493 0.030 -0.463 -0.486 BM
ST-6 5/30/2009 11:16 34.0 0.169 –0.119 0.025 0.144 0.151 –0.438 0.488 0.025 -0.463 -0.486 BM
ST-6 5/30/2009 0.172 –0.118 0.027 0.145 0.152 –0.438 0.498 0.030 -0.468 -0.491 BM
ST-6 5/30/2009 0.166 –0.111 0.028 0.139 0.145 –0.438 0.488 0.025 -0.463 -0.486 BM
ST-6 5/30/2009 33.9 0.169 –0.112 0.029 0.141 0.148 –0.438 0.488 0.025 -0.463 -0.486 BM
ST-6 5/31/2009 10:02 30.3 0.170 –0.110 0.030 0.140 0.147 –0.435 0.488 0.027 -0.462 -0.485 BM
ST-6 5/31/2009 0.176 –0.112 0.032 0.144 0.151 –0.438 0.488 0.025 -0.463 -0.486 BM
ST-6 5/31/2009 0.173 –0.111 0.031 0.142 0.149 –0.434 0.491 0.029 -0.463 -0.486 BM
ST-6 5/31/2009 30.8 0.171 –0.113 0.029 0.142 0.149 –0.436 0.492 0.028 -0.464 -0.487 BM
ST-6 6/1/2009 12:30 34.3 0.170 –0.111 0.030 0.141 0.148 –0.438 0.495 0.029 -0.467 -0.490 BM
ST-6 6/1/2009 0.162 –0.110 0.026 0.136 0.143 –0.438 0.494 0.028 -0.466 -0.489 BM
ST-6 6/1/2009 0.167 –0.110 0.029 0.139 0.145 –0.438 0.497 0.030 -0.468 -0.491 BM
ST-6 6/1/2009 34.5 0.166 –0.110 0.028 0.138 0.145 –0.439 0.493 0.027 -0.466 -0.489 BM
ST-6 6/2/2009 15:36 39.6 0.174 –0.120 0.027 0.147 0.154 –0.445 0.497 0.026 -0.471 -0.495 CF, BM
ST-6 6/2/2009 0.172 –0.120 0.026 0.146 0.153 –0.444 0.497 0.027 -0.471 -0.494 CF, BM
ST-6 6/2/2009 0.168 –0.120 0.024 0.144 0.151 –0.444 0.498 0.027 -0.471 -0.495 CF, BM
ST-6 6/2/2009 39.4 0.171 –0.120 0.026 0.146 0.153 –0.444 0.498 0.027 -0.471 -0.495 CF, BM
ST-6 6/3/2009 9:53 22.6 0.168 –0.115 0.027 0.142 0.149 –0.444 0.501 0.029 -0.473 -0.496 BM
ST-6 6/3/2009 0.168 –0.114 0.027 0.141 0.148 –0.443 0.498 0.028 -0.471 -0.494 BM
ST-6 6/3/2009 0.169 –0.113 0.028 0.141 0.148 –0.444 0.498 0.027 -0.471 -0.495 BM
ST-6 6/3/2009 23.2 0.169 –0.115 0.027 0.142 0.149 –0.444 0.497 0.027 -0.471 -0.494 BM
ST-6 6/4/2009 11:48 33.1 0.175 –0.112 0.032 0.144 0.151 –0.432 0.489 0.029 -0.461 -0.484 BM
ST-6 6/4/2009 0.170 –0.115 0.028 0.143 0.150 –0.437 0.494 0.029 -0.466 -0.489 BM
ST-6 6/4/2009 0.173 –0.113 0.030 0.143 0.150 –0.435 0.495 0.030 -0.465 -0.488 BM
ST-6 6/4/2009 33.3 0.171 –0.115 0.028 0.143 0.150 –0.438 0.496 0.029 -0.467 -0.490 BM
ST-6 6/5/2009 10:45 30.4 0.170 –0.104 0.033 0.137 0.144 –0.436 0.489 0.027 -0.463 -0.486 BM
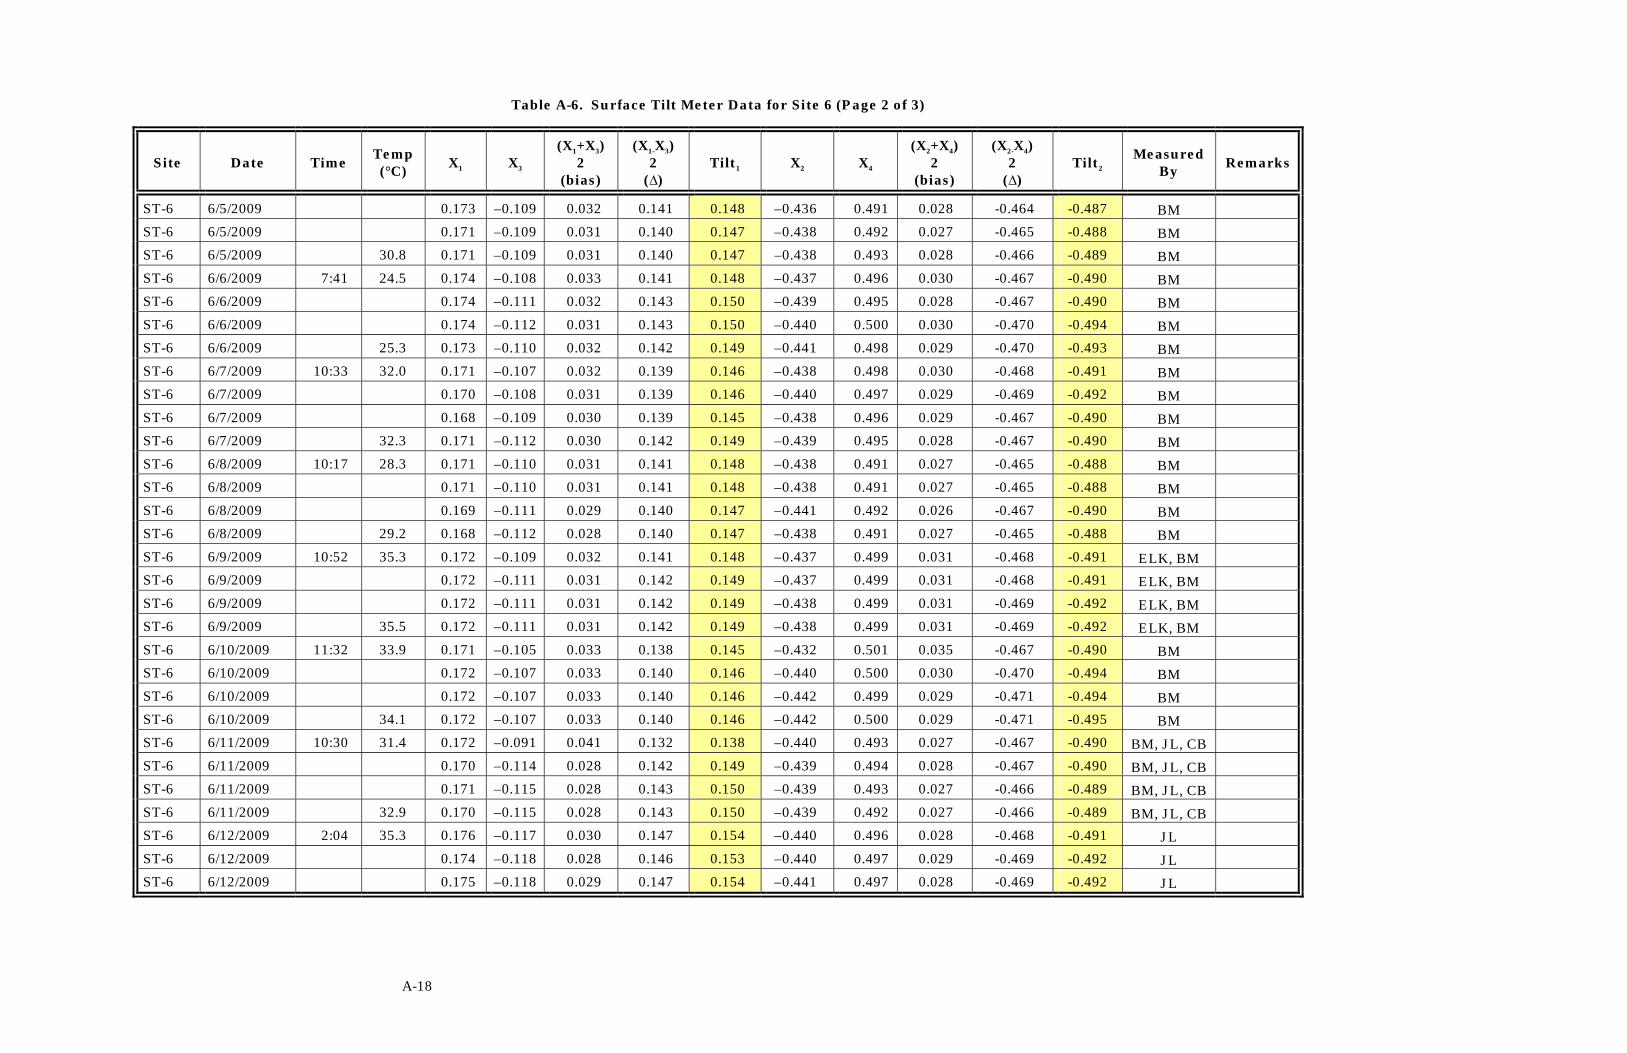
A-18
Table A-6. Surface Tilt Meter Data for Site 6 (Page 2 of 3)
Site Date Time Temp (°C) X1 X3
(X1+X3) 2
(bias)
(X1-X3) 2
(∆) Tilt1 X2 X4
(X2+X4) 2
(bias)
(X2-X4) 2
(∆) Tilt2
Measured By Remarks
ST-6 6/5/2009 0.173 –0.109 0.032 0.141 0.148 –0.436 0.491 0.028 -0.464 -0.487 BM
ST-6 6/5/2009 0.171 –0.109 0.031 0.140 0.147 –0.438 0.492 0.027 -0.465 -0.488 BM
ST-6 6/5/2009 30.8 0.171 –0.109 0.031 0.140 0.147 –0.438 0.493 0.028 -0.466 -0.489 BM
ST-6 6/6/2009 7:41 24.5 0.174 –0.108 0.033 0.141 0.148 –0.437 0.496 0.030 -0.467 -0.490 BM
ST-6 6/6/2009 0.174 –0.111 0.032 0.143 0.150 –0.439 0.495 0.028 -0.467 -0.490 BM
ST-6 6/6/2009 0.174 –0.112 0.031 0.143 0.150 –0.440 0.500 0.030 -0.470 -0.494 BM
ST-6 6/6/2009 25.3 0.173 –0.110 0.032 0.142 0.149 –0.441 0.498 0.029 -0.470 -0.493 BM
ST-6 6/7/2009 10:33 32.0 0.171 –0.107 0.032 0.139 0.146 –0.438 0.498 0.030 -0.468 -0.491 BM
ST-6 6/7/2009 0.170 –0.108 0.031 0.139 0.146 –0.440 0.497 0.029 -0.469 -0.492 BM
ST-6 6/7/2009 0.168 –0.109 0.030 0.139 0.145 –0.438 0.496 0.029 -0.467 -0.490 BM
ST-6 6/7/2009 32.3 0.171 –0.112 0.030 0.142 0.149 –0.439 0.495 0.028 -0.467 -0.490 BM
ST-6 6/8/2009 10:17 28.3 0.171 –0.110 0.031 0.141 0.148 –0.438 0.491 0.027 -0.465 -0.488 BM
ST-6 6/8/2009 0.171 –0.110 0.031 0.141 0.148 –0.438 0.491 0.027 -0.465 -0.488 BM
ST-6 6/8/2009 0.169 –0.111 0.029 0.140 0.147 –0.441 0.492 0.026 -0.467 -0.490 BM
ST-6 6/8/2009 29.2 0.168 –0.112 0.028 0.140 0.147 –0.438 0.491 0.027 -0.465 -0.488 BM
ST-6 6/9/2009 10:52 35.3 0.172 –0.109 0.032 0.141 0.148 –0.437 0.499 0.031 -0.468 -0.491 ELK, BM
ST-6 6/9/2009 0.172 –0.111 0.031 0.142 0.149 –0.437 0.499 0.031 -0.468 -0.491 ELK, BM
ST-6 6/9/2009 0.172 –0.111 0.031 0.142 0.149 –0.438 0.499 0.031 -0.469 -0.492 ELK, BM
ST-6 6/9/2009 35.5 0.172 –0.111 0.031 0.142 0.149 –0.438 0.499 0.031 -0.469 -0.492 ELK, BM
ST-6 6/10/2009 11:32 33.9 0.171 –0.105 0.033 0.138 0.145 –0.432 0.501 0.035 -0.467 -0.490 BM
ST-6 6/10/2009 0.172 –0.107 0.033 0.140 0.146 –0.440 0.500 0.030 -0.470 -0.494 BM
ST-6 6/10/2009 0.172 –0.107 0.033 0.140 0.146 –0.442 0.499 0.029 -0.471 -0.494 BM
ST-6 6/10/2009 34.1 0.172 –0.107 0.033 0.140 0.146 –0.442 0.500 0.029 -0.471 -0.495 BM
ST-6 6/11/2009 10:30 31.4 0.172 –0.091 0.041 0.132 0.138 –0.440 0.493 0.027 -0.467 -0.490 BM, JL, CB
ST-6 6/11/2009 0.170 –0.114 0.028 0.142 0.149 –0.439 0.494 0.028 -0.467 -0.490 BM, JL, CB
ST-6 6/11/2009 0.171 –0.115 0.028 0.143 0.150 –0.439 0.493 0.027 -0.466 -0.489 BM, JL, CB
ST-6 6/11/2009 32.9 0.170 –0.115 0.028 0.143 0.150 –0.439 0.492 0.027 -0.466 -0.489 BM, JL, CB
ST-6 6/12/2009 2:04 35.3 0.176 –0.117 0.030 0.147 0.154 –0.440 0.496 0.028 -0.468 -0.491 JL
ST-6 6/12/2009 0.174 –0.118 0.028 0.146 0.153 –0.440 0.497 0.029 -0.469 -0.492 JL
ST-6 6/12/2009 0.175 –0.118 0.029 0.147 0.154 –0.441 0.497 0.028 -0.469 -0.492 JL

A-19
Table A-6. Surface Tilt Meter Data for Site 6 (Page 3 of 3)
Site Date Time Temp (°C) X1 X3
(X1+X3) 2
(bias)
(X1-X3) 2
(∆) Tilt1 X2 X4
(X2+X4) 2
(bias)
(X2-X4) 2
(∆) Tilt2
Measured By Remarks
ST-6 6/12/2009 36.5 0.176 –0.114 0.031 0.145 0.152 –0.441 0.498 0.029 -0.470 -0.493 JL
ST-6 6/13/2009 2:45 35.8 0.177 –0.124 0.027 0.151 0.158 –0.441 0.495 0.027 -0.468 -0.491 JL
ST-6 6/13/2009 0.176 –0.121 0.028 0.149 0.156 –0.440 0.497 0.029 -0.469 -0.492 JL
ST-6 6/13/2009 0.176 –0.122 0.027 0.149 0.156 –0.440 0.495 0.028 -0.468 -0.491 JL
ST-6 6/13/2009 37.4 0.177 –0.123 0.027 0.150 0.158 –0.441 0.496 0.028 -0.469 -0.492 JL
ST-6 6/14/2009 9:30 25.9 0.179 –0.119 0.030 0.149 0.156 –0.441 0.496 0.028 -0.469 -0.492 JL
ST-6 6/14/2009 0.180 –0.119 0.031 0.150 0.157 –0.440 0.496 0.028 -0.468 -0.491 JL
ST-6 6/14/2009 0.180 –0.119 0.031 0.150 0.157 –0.441 0.496 0.028 -0.469 -0.492 JL
ST-6 6/14/2009 26.8 0.180 –0.119 0.031 0.150 0.157 –0.441 0.497 0.028 -0.469 -0.492 JL
ST-6 6/15/2009 10:48 31.3 0.175 –0.117 0.029 0.146 0.153 –0.442 0.491 0.025 -0.467 -0.490 JL
ST-6 6/15/2009 0.175 –0.116 0.030 0.146 0.153 –0.440 0.492 0.026 -0.466 -0.489 JL
ST-6 6/15/2009 0.175 –0.119 0.028 0.147 0.154 –0.442 0.493 0.026 -0.468 -0.491 JL
ST-6 6/15/2009 32.5 0.175 –0.117 0.029 0.146 0.153 –0.441 0.492 0.026 -0.467 -0.490 JL
ST-6 6/16/2009 2:29 41.9 0.181 –0.121 0.030 0.151 0.159 –0.438 0.493 0.028 -0.466 -0.489 JL
ST-6 6/16/2009 0.181 –0.122 0.030 0.152 0.159 –0.439 0.495 0.028 -0.467 -0.490 JL
ST-6 6/16/2009 0.182 –0.121 0.031 0.152 0.159 –0.440 0.496 0.028 -0.468 -0.491 JL
ST-6 6/16/2009 41.8 0.181 –0.121 0.030 0.151 0.159 –0.440 0.496 0.028 -0.468 -0.491 JL
ST-6 6/17/2009 12:55 34.2 0.181 –0.124 0.029 0.153 0.160 –0.444 0.497 0.027 -0.471 -0.494 JL
ST-6 6/17/2009 0.182 –0.125 0.029 0.154 0.161 –0.444 0.498 0.027 -0.471 -0.495 JL
ST-6 6/17/2009 0.183 –0.125 0.029 0.154 0.162 –0.442 0.499 0.029 -0.471 -0.494 JL
ST-6 6/17/2009 34.7 0.183 –0.124 0.030 0.154 0.161 –0.444 0.500 0.028 -0.472 -0.496 JL
ST-6 6/18/2009 10:10 28.2 0.182 –0.125 0.029 0.154 0.161 –0.447 0.494 0.024 -0.471 -0.494 JL
ST-6 6/18/2009 0.181 –0.125 0.028 0.153 0.161 –0.444 0.497 0.027 -0.471 -0.494 JL
ST-6 6/18/2009 0.182 –0.125 0.029 0.154 0.161 –0.444 0.497 0.027 -0.471 -0.494 JL
ST-6 6/18/2009 29.2 0.182 –0.125 0.029 0.154 0.161 –0.445 0.497 0.026 -0.471 -0.495 JL
ST-6 6/19/2009 11:05 26.8 0.178 –0.120 0.029 0.149 0.156 –0.447 0.495 0.024 -0.471 -0.495 JL
ST-6 6/19/2009 0.179 –0.121 0.029 0.150 0.158 –0.446 0.495 0.025 -0.471 -0.494 JL

A-20
Table A-7. Surface Tilt Meter Data for Site 7 (Page 1 of 3)
Site Date Time Temp (°C) X1 X3
(X1+X3) 2
(bias)
(X1-X3) 2
(∆) Tilt1 X2 X4
(X2+X4) 2
(bias)
(X2-X4) 2
(∆) Tilt2
Measured By Remarks
ST-7 5/29/2009 15:00 36.6 0.208 –0.146 0.031 0.177 0.186 –0.737 0.799 0.031 -0.768 -0.806 BM
ST-7 5/29/2009 0.207 –0.148 0.030 0.178 0.186 –0.748 0.804 0.028 -0.776 -0.815 BM
ST-7 5/29/2009 0.208 –0.154 0.027 0.181 0.190 –0.746 0.804 0.029 -0.775 -0.814 BM
ST-7 5/29/2009 35.4 0.203 –0.153 0.025 0.178 0.187 –0.743 0.804 0.031 -0.774 -0.812 BM
ST-7 5/30/2009 11:23 33.3 0.208 –0.145 0.032 0.177 0.185 –0.747 0.799 0.026 -0.773 -0.812 BM
ST-7 5/30/2009 0.209 –0.149 0.030 0.179 0.188 –0.748 0.799 0.026 -0.774 -0.812 BM
ST-7 5/30/2009 0.210 –0.152 0.029 0.181 0.190 –0.747 0.803 0.028 -0.775 -0.814 BM
ST-7 5/30/2009 32.9 0.212 –0.151 0.031 0.182 0.191 –0.752 0.807 0.028 -0.780 -0.818 BM
ST-7 6/1/2009 12:44 34.9 0.207 –0.149 0.029 0.178 0.187 –0.745 0.801 0.028 -0.773 -0.812 BM
ST-7 6/1/2009 0.208 –0.141 0.034 0.175 0.183 –0.745 0.802 0.029 -0.774 -0.812 BM
ST-7 6/1/2009 0.206 –0.146 0.030 0.176 0.185 –0.744 0.801 0.029 -0.773 -0.811 BM
ST-7 6/1/2009 34.7 0.208 –0.147 0.031 0.178 0.186 –0.744 0.803 0.030 -0.774 -0.812 BM
ST-7 6/2/2009 15:45 38.6 0.211 –0.159 0.026 0.185 0.194 –0.742 0.795 0.027 -0.769 -0.807 CF, BM
ST-7 6/2/2009 0.211 –0.155 0.028 0.183 0.192 –0.745 0.799 0.027 -0.772 -0.811 CF, BM
ST-7 6/2/2009 0.211 –0.153 0.029 0.182 0.191 –0.747 0.801 0.027 -0.774 -0.813 CF, BM
ST-7 6/2/2009 38.1 0.206 –0.154 0.026 0.180 0.189 –0.748 0.803 0.028 -0.776 -0.814 CF, BM
ST-7 6/3/2009 10:32 25.5 0.203 –0.144 0.030 0.174 0.182 –0.748 0.798 0.025 -0.773 -0.812 BM
ST-7 6/3/2009 0.201 –0.149 0.026 0.175 0.184 –0.748 0.799 0.026 -0.774 -0.812 BM
ST-7 6/3/2009 0.202 –0.148 0.027 0.175 0.184 –0.749 0.796 0.024 -0.773 -0.811 BM
ST-7 6/3/2009 25.6 0.203 –0.152 0.026 0.178 0.186 –0.751 0.799 0.024 -0.775 -0.814 BM
ST-7 6/4/2009 12:02 32.4 0.204 –0.150 0.027 0.177 0.186 –0.751 0.789 0.019 -0.770 -0.809 BM
ST-7 6/4/2009 0.204 –0.151 0.027 0.178 0.186 –0.749 0.794 0.023 -0.772 -0.810 BM
ST-7 6/4/2009 0.205 –0.150 0.028 0.178 0.186 –0.750 0.798 0.024 -0.774 -0.813 BM
ST-7 6/4/2009 32.3 0.205 –0.152 0.027 0.179 0.187 –0.750 0.797 0.024 -0.774 -0.812 BM
ST-7 6/5/2009 10:54 31.0 0.205 –0.146 0.030 0.176 0.184 –0.746 0.791 0.023 -0.769 -0.807 BM
ST-7 6/5/2009 0.206 –0.143 0.032 0.175 0.183 –0.746 0.795 0.025 -0.771 -0.809 BM
ST-7 6/5/2009 0.206 –0.149 0.029 0.178 0.186 –0.748 0.797 0.025 -0.773 -0.811 BM
ST-7 6/5/2009 31.2 0.204 –0.150 0.027 0.177 0.186 –0.748 0.798 0.025 -0.773 -0.812 BM
ST-7 6/6/2009 8:32 28.4 0.203 –0.148 0.028 0.176 0.184 –0.745 0.797 0.026 -0.771 -0.810 BM
ST-7 6/6/2009 0.204 –0.150 0.027 0.177 0.186 –0.746 0.798 0.026 -0.772 -0.811 BM

A-21
Table A-7. Surface Tilt Meter Data for Site 7 (Page 2 of 3)
Site Date Time Temp (°C) X1 X3
(X1+X3) 2
(bias)
(X1-X3) 2
(∆) Tilt1 X2 X4
(X2+X4) 2
(bias)
(X2-X4) 2
(∆) Tilt2
Measured By Remarks
ST-7 6/6/2009 0.204 –0.151 0.027 0.178 0.186 –0.747 0.798 0.026 -0.773 -0.811 BM
ST-7 6/6/2009 28.6 0.204 –0.151 0.027 0.178 0.186 –0.747 0.799 0.026 -0.773 -0.812 BM
ST-7 6/8/2009 11:00 37.3 0.204 –0.147 0.029 0.176 0.184 –0.745 0.800 0.028 -0.773 -0.811 BM
ST-7 6/8/2009 0.206 –0.149 0.029 0.178 0.186 –0.746 0.801 0.028 -0.774 -0.812 BM
ST-7 6/8/2009 0.208 –0.150 0.029 0.179 0.188 –0.745 0.801 0.028 -0.773 -0.812 BM
ST-7 6/8/2009 37.1 0.207 –0.152 0.028 0.180 0.188 –0.746 0.803 0.029 -0.775 -0.813 BM
ST-7 6/9/2009 11:03 35.5 0.211 –0.144 0.034 0.178 0.186 –0.739 0.799 0.030 -0.769 -0.807 ELK, BM
ST-7 6/9/2009 0.211 –0.147 0.032 0.179 0.188 –0.742 0.800 0.029 -0.771 -0.810 ELK, BM
ST-7 6/9/2009 0.211 –0.149 0.031 0.180 0.189 –0.744 0.800 0.028 -0.772 -0.811 ELK, BM
ST-7 6/9/2009 35.0 0.211 –0.150 0.031 0.181 0.190 –0.745 0.801 0.028 -0.773 -0.812 ELK, BM
ST-7 6/10/2009 11:41 34.5 0.207 –0.141 0.033 0.174 0.183 –0.742 0.800 0.029 -0.771 -0.810 BM
ST-7 6/10/2009 0.208 –0.147 0.031 0.178 0.186 –0.745 0.800 0.028 -0.773 -0.811 BM
ST-7 6/10/2009 0.209 –0.151 0.029 0.180 0.189 –0.746 0.801 0.028 -0.774 -0.812 BM
ST-7 6/10/2009 34.5 0.208 –0.151 0.029 0.180 0.188 –0.746 0.803 0.029 -0.775 -0.813 BM
ST-7 6/11/2009 11:18 36.5 0.208 –0.152 0.028 0.180 0.189 –0.755 0.801 0.023 -0.778 -0.817 BM, JL, CB
ST-7 6/11/2009 0.208 –0.152 0.028 0.180 0.189 –0.752 0.801 0.025 -0.777 -0.815 BM, JL, CB
ST-7 6/11/2009 0.209 –0.154 0.028 0.182 0.191 –0.749 0.803 0.027 -0.776 -0.815 BM, JL, CB
ST-7 6/11/2009 35.5 0.210 –0.158 0.026 0.184 0.193 –0.749 0.802 0.027 -0.776 -0.814 BM, JL, CB
ST-7 6/12/2009 3:45 34.7 0.207 –0.140 0.034 0.174 0.182 –0.742 0.807 0.033 -0.775 -0.813 JL
ST-7 6/12/2009 0.207 –0.145 0.031 0.176 0.185 –0.745 0.807 0.031 -0.776 -0.815 JL
ST-7 6/12/2009 0.208 –0.143 0.033 0.176 0.184 –0.746 0.807 0.031 -0.777 -0.815 JL
ST-7 6/12/2009 33.5 0.207 –0.147 0.030 0.177 0.186 –0.746 0.807 0.031 -0.777 -0.815 JL
ST-7 6/13/2009 3:55 41.7 0.210 –0.148 0.031 0.179 0.188 –0.746 0.809 0.032 -0.778 -0.816 JL
ST-7 6/13/2009 0.211 –0.149 0.031 0.180 0.189 –0.748 0.809 0.031 -0.779 -0.817 JL
ST-7 6/13/2009 0.211 –0.150 0.031 0.181 0.190 –0.748 0.809 0.031 -0.779 -0.817 JL
ST-7 6/13/2009 40.2 0.212 –0.151 0.031 0.182 0.191 –0.749 0.809 0.030 -0.779 -0.818 JL
ST-7 6/15/2009 12:09 40.7 0.208 –0.148 0.030 0.178 0.187 –0.747 0.808 0.031 -0.778 -0.816 JL
ST-7 6/15/2009 0.209 –0.149 0.030 0.179 0.188 –0.748 0.808 0.030 -0.778 -0.817 JL
ST-7 6/15/2009 0.208 –0.150 0.029 0.179 0.188 –0.749 0.807 0.029 -0.778 -0.817 JL
ST-7 6/15/2009 38.5 0.208 –0.151 0.029 0.180 0.188 –0.749 0.808 0.030 -0.779 -0.817 JL
ST-7 6/16/2009 2:10 44.3 0.206 –0.157 0.025 0.182 0.191 –0.757 0.806 0.025 -0.782 -0.821 JL

A-22
Table A-7. Surface Tilt Meter Data for Site 7 (Page 3 of 3)
Site Date Time Temp (°C) X1 X3
(X1+X3) 2
(bias)
(X1-X3) 2
(∆) Tilt1 X2 X4
(X2+X4) 2
(bias)
(X2-X4) 2
(∆) Tilt2
Measured By Remarks
ST-7 6/16/2009 0.207 –0.156 0.026 0.182 0.191 –0.754 0.808 0.027 -0.781 -0.820 JL
ST-7 6/16/2009 0.209 –0.155 0.027 0.182 0.191 –0.755 0.809 0.027 -0.782 -0.821 JL
ST-7 6/16/2009 42.4 0.208 –0.155 0.027 0.182 0.191 –0.754 0.809 0.028 -0.782 -0.821 JL
ST-7 6/17/2009 12:33 36.4 0.205 –0.157 0.024 0.181 0.190 –0.754 0.803 0.025 -0.779 -0.817 JL
ST-7 6/17/2009 0.208 –0.156 0.026 0.182 0.191 –0.754 0.804 0.025 -0.779 -0.818 JL
ST-7 6/17/2009 0.208 –0.156 0.026 0.182 0.191 –0.755 0.805 0.025 -0.780 -0.819 JL
ST-7 6/17/2009 35.3 0.207 –0.156 0.026 0.182 0.191 –0.755 0.805 0.025 -0.780 -0.819 JL
ST-7 6/18/2009 11:32 37.7 0.209 –0.157 0.026 0.183 0.192 –0.752 0.806 0.027 -0.779 -0.818 JL
ST-7 6/18/2009 0.206 –0.156 0.025 0.181 0.190 –0.754 0.806 0.026 -0.780 -0.819 JL
ST-7 6/18/2009 0.206 –0.156 0.025 0.181 0.190 –0.754 0.806 0.026 -0.780 -0.819 JL
ST-7 6/18/2009 36.0 0.206 –0.156 0.025 0.181 0.190 –0.754 0.807 0.027 -0.781 -0.820 JL
ST-7 6/19/2009 12:20 28.8 0.205 –0.158 0.024 0.182 0.191 –0.752 0.800 0.024 -0.776 -0.815 JL
ST-7 6/19/2009 0.206 –0.157 0.025 0.182 0.191 –0.753 0.802 0.025 -0.778 -0.816 JL
ST-7 6/19/2009 0.206 –0.157 0.025 0.182 0.191 –0.753 0.802 0.025 -0.778 -0.816 JL
ST-7 6/19/2009 28.2 0.206 –0.157 0.025 0.182 0.191 –0.754 0.802 0.024 -0.778 -0.817 JL

A-23
Table A-8. Surface Tilt Meter Data for Site 8 (Page 1 of 3)
Site Date Time Temp (°C) X1 X3
(X1+X3) 2
(bias)
(X1-X3) 2
(∆) Tilt1 X2 X4
(X2+X4) 2
(bias)
(X2-X4) 2
(∆) Tilt2
Measured By Remarks
ST-8 5/29/2009 15:26 37.7 0.864 –0.805 0.030 0.835 0.876 –0.173 0.225 0.026 -0.199 -0.209 BM
ST-8 5/29/2009 0.865 –0.809 0.028 0.837 0.879 –0.176 0.228 0.026 -0.202 -0.212 BM
ST-8 5/29/2009 0.871 –0.809 0.031 0.840 0.882 –0.175 0.230 0.028 -0.203 -0.213 BM
ST-8 5/29/2009 38.3 0.872 –0.813 0.030 0.843 0.885 –0.175 0.230 0.028 -0.203 -0.213 BM
ST-8 5/30/2009 11:32 33.3 0.878 –0.827 0.026 0.853 0.895 –0.193 0.250 0.029 -0.222 -0.233 BM
ST-8 5/30/2009 0.877 –0.820 0.029 0.849 0.891 –0.199 0.243 0.022 -0.221 -0.232 BM
ST-8 5/30/2009 0.872 –0.832 0.020 0.852 0.895 –0.205 0.250 0.023 -0.228 -0.239 BM
ST-8 5/30/2009 34.5 0.878 –0.834 0.022 0.856 0.899 –0.205 0.250 0.023 -0.228 -0.239 BM
ST-8 5/31/2009 10:08 30.6 0.876 –0.823 0.027 0.850 0.892 –0.204 0.261 0.029 -0.233 -0.244 BM
ST-8 5/31/2009 0.873 –0.821 0.026 0.847 0.889 –0.200 0.266 0.033 -0.233 -0.245 BM
ST-8 5/31/2009 0.873 –0.820 0.027 0.847 0.889 –0.199 0.271 0.036 -0.235 -0.247 BM
ST-8 5/31/2009 30.8 0.874 –0.821 0.027 0.848 0.890 –0.200 0.263 0.032 -0.232 -0.243 BM
ST-8 6/1/2009 12:34 34.3 0.884 –0.832 0.026 0.858 0.901 –0.179 0.233 0.027 -0.206 -0.216 BM
ST-8 6/1/2009 0.887 –0.833 0.027 0.860 0.903 –0.173 0.231 0.029 -0.202 -0.212 BM
ST-8 6/1/2009 0.887 –0.837 0.025 0.862 0.905 –0.179 0.228 0.025 -0.204 -0.214 BM
ST-8 6/1/2009 34.5 0.887 –0.839 0.024 0.863 0.906 –0.180 0.231 0.026 -0.206 -0.216 BM
ST-8 6/2/2009 16:01 37.4 0.893 –0.836 0.029 0.865 0.908 –0.158 0.214 0.028 -0.186 -0.195 CF, BM May have been bumped during moring survey.
ST-8 6/2/2009 0.892 –0.836 0.028 0.864 0.907 –0.158 0.218 0.030 -0.188 -0.197 CF, BM
ST-8 6/2/2009 0.893 –0.839 0.027 0.866 0.909 –0.157 0.215 0.029 -0.186 -0.195 CF, BM
ST-8 6/2/2009 37.9 0.893 –0.840 0.027 0.867 0.910 –0.157 0.212 0.028 -0.185 -0.194 CF, BM
ST-8 6/3/2009 10:26 25.6 0.884 –0.832 0.026 0.858 0.901 –0.176 0.226 0.025 -0.201 -0.211 BM
ST-8 6/3/2009 0.883 –0.836 0.024 0.860 0.902 –0.177 0.229 0.026 -0.203 -0.213 BM
ST-8 6/3/2009 0.887 –0.836 0.026 0.862 0.905 –0.176 0.231 0.028 -0.204 -0.214 BM
ST-8 6/3/2009 25.8 0.888 –0.834 0.027 0.861 0.904 –0.177 0.230 0.027 -0.204 -0.214 BM
ST-8 6/4/2009 12:16 31.6 0.881 –0.830 0.026 0.856 0.898 –0.121 0.183 0.031 -0.152 -0.160 BM
ST-8 6/4/2009 0.882 –0.831 0.026 0.857 0.899 –0.122 0.182 0.030 -0.152 -0.160 BM
ST-8 6/4/2009 0.881 –0.831 0.025 0.856 0.899 –0.122 0.181 0.030 -0.152 -0.159 BM
ST-8 6/4/2009 32.3 0.882 –0.832 0.025 0.857 0.900 –0.121 0.180 0.030 -0.151 -0.158 BM

A-24
Table A-8. Surface Tilt Meter Data for Site 8 (Page 2 of 3)
Site Date Time Temp (°C) X1 X3
(X1+X3) 2
(bias)
(X1-X3) 2
(∆) Tilt1 X2 X4
(X2+X4) 2
(bias)
(X2-X4) 2
(∆) Tilt2
Measured By Remarks
ST-8 6/5/2009 10:50 30.5 0.885 –0.819 0.033 0.852 0.895 –0.098 0.151 0.027 -0.125 -0.131 BM
ST-8 6/5/2009 0.883 –0.823 0.030 0.853 0.896 –0.097 0.153 0.028 -0.125 -0.131 BM
ST-8 6/5/2009 0.883 –0.823 0.030 0.853 0.896 –0.096 0.152 0.028 -0.124 -0.130 BM
ST-8 6/5/2009 31.0 0.883 –0.825 0.029 0.854 0.897 –0.097 0.151 0.027 -0.124 -0.130 BM
ST-8 6/6/2009 8:27 28.3 0.886 –0.827 0.030 0.857 0.899 –0.079 0.135 0.028 -0.107 -0.112 BM
ST-8 6/6/2009 0.887 –0.828 0.030 0.858 0.900 –0.077 0.133 0.028 -0.105 -0.110 BM
ST-8 6/6/2009 0.886 –0.829 0.029 0.858 0.900 –0.078 0.135 0.029 -0.107 -0.112 BM
ST-8 6/6/2009 28.6 0.888 –0.828 0.030 0.858 0.901 –0.077 0.136 0.030 -0.107 -0.112 BM
ST-8 6/7/2009 10:37 32.2 0.895 –0.835 0.030 0.865 0.908 –0.054 0.105 0.026 -0.080 -0.083 BM
ST-8 6/7/2009 0.895 –0.839 0.028 0.867 0.910 –0.053 0.106 0.027 -0.080 -0.083 BM
ST-8 6/7/2009 0.895 –0.838 0.029 0.867 0.910 –0.051 0.106 0.028 -0.079 -0.082 BM
ST-8 6/7/2009 33.2 0.895 –0.838 0.029 0.867 0.910 –0.052 0.107 0.028 -0.080 -0.083 BM
ST-8 6/8/2009 10:53 37.1 0.906 –0.849 0.029 0.878 0.921 –0.072 0.130 0.029 -0.101 -0.106 BM
ST-8 6/8/2009 0.907 –0.850 0.029 0.879 0.922 –0.073 0.131 0.029 -0.102 -0.107 BM
ST-8 6/8/2009 0.907 –0.851 0.028 0.879 0.923 –0.072 0.132 0.030 -0.102 -0.107 BM
ST-8 6/8/2009 37.7 0.907 –0.852 0.028 0.880 0.923 –0.073 0.132 0.030 -0.103 -0.108 BM
ST-8 6/9/2009 10:57 35.2 0.919 –0.855 0.032 0.887 0.931 –0.096 0.159 0.032 -0.128 -0.134 ELK, BM
ST-8 6/9/2009 0.919 –0.862 0.029 0.891 0.935 –0.094 0.158 0.032 -0.126 -0.132 ELK, BM
ST-8 6/9/2009 0.920 –0.862 0.029 0.891 0.936 –0.096 0.158 0.031 -0.127 -0.133 ELK, BM
ST-8 6/9/2009 35.5 0.920 –0.865 0.028 0.893 0.937 –0.096 0.157 0.031 -0.127 -0.133 ELK, BM
ST-8 6/10/2009 11:35 33.8 0.917 –0.859 0.029 0.888 0.932 –0.097 0.153 0.028 -0.125 -0.131 BM
ST-8 6/10/2009 0.919 –0.861 0.029 0.890 0.935 –0.096 0.151 0.028 -0.124 -0.130 BM
ST-8 6/10/2009 0.919 –0.861 0.029 0.890 0.935 –0.096 0.151 0.028 -0.124 -0.130 BM
ST-8 6/10/2009 34.4 0.919 –0.863 0.028 0.891 0.936 –0.095 0.151 0.028 -0.123 -0.129 BM
ST-8 6/11/2009 11:14 36.8 0.921 –0.868 0.027 0.895 0.939 –0.099 0.161 0.031 -0.130 -0.137 BM, JL, CB
ST-8 6/11/2009 0.922 –0.868 0.027 0.895 0.940 –0.099 0.158 0.030 -0.129 -0.135 BM, JL, CB
ST-8 6/11/2009 0.923 –0.868 0.028 0.896 0.940 –0.097 0.157 0.030 -0.127 -0.133 BM, JL, CB
ST-8 6/11/2009 37.0 0.921 –0.869 0.026 0.895 0.940 –0.097 0.157 0.030 -0.127 -0.133 BM, JL, CB
ST-8 6/12/2009 3:20 42.2 0.930 –0.852 0.039 0.891 0.936 –0.131 0.195 0.032 -0.163 -0.171 JL
ST-8 6/12/2009 0.930 –0.854 0.038 0.892 0.937 –0.132 0.194 0.031 -0.163 -0.171 JL

A-25
Table A-8. Surface Tilt Meter Data for Site 8 (Page 3 of 3)
Site Date Time Temp (°C) X1 X3
(X1+X3) 2
(bias)
(X1-X3) 2
(∆) Tilt1 X2 X4
(X2+X4) 2
(bias)
(X2-X4) 2
(∆) Tilt2
Measured By Remarks
ST-8 6/12/2009 0.931 –0.857 0.037 0.894 0.939 –0.131 0.195 0.032 -0.163 -0.171 JL
ST-8 6/12/2009 42.2 0.930 –0.858 0.036 0.894 0.939 –0.130 0.195 0.033 -0.163 -0.171 JL
ST-8 6/13/2009 3:45 42.7 0.918 –0.845 0.037 0.882 0.926 –0.098 0.158 0.030 -0.128 -0.134 JL
ST-8 6/13/2009 0.918 –0.850 0.034 0.884 0.928 –0.098 0.159 0.031 -0.129 -0.135 JL
ST-8 6/13/2009 0.918 –0.851 0.034 0.885 0.929 –0.099 0.159 0.030 -0.129 -0.135 JL
ST-8 6/13/2009 42.5 0.918 –0.851 0.034 0.885 0.929 –0.099 0.159 0.030 -0.129 -0.135 JL
ST-8 6/14/2009 10:35 36.4 0.907 –0.862 0.023 0.885 0.929 –0.113 0.166 0.027 -0.140 -0.146 JL
ST-8 6/14/2009 0.908 –0.861 0.024 0.885 0.929 –0.113 0.168 0.028 -0.141 -0.148 JL
ST-8 6/14/2009 0.907 –0.861 0.023 0.884 0.928 –0.113 0.167 0.027 -0.140 -0.147 JL
ST-8 6/14/2009 36.6 0.907 –0.862 0.023 0.885 0.929 –0.113 0.167 0.027 -0.140 -0.147 JL
ST-8 6/15/2009 11:58 41.3 0.908 –0.849 0.030 0.879 0.922 –0.080 0.135 0.028 -0.108 -0.113 JL
ST-8 6/15/2009 0.909 –0.850 0.030 0.880 0.923 –0.080 0.136 0.028 -0.108 -0.113 JL
ST-8 6/15/2009 0.909 –0.851 0.029 0.880 0.924 –0.080 0.136 0.028 -0.108 -0.113 JL
ST-8 6/15/2009 41.2 0.908 –0.851 0.029 0.880 0.923 –0.080 0.136 0.028 -0.108 -0.113 JL
ST-8 6/16/2009 1:58 44.1 0.913 –0.865 0.024 0.889 0.933 –0.117 0.181 0.032 -0.149 -0.156 JL
ST-8 6/16/2009 0.912 –0.864 0.024 0.888 0.932 –0.116 0.180 0.032 -0.148 -0.155 JL
ST-8 6/16/2009 0.913 –0.863 0.025 0.888 0.932 –0.117 0.181 0.032 -0.149 -0.156 JL
ST-8 6/16/2009 44.4 0.914 –0.863 0.026 0.889 0.933 –0.118 0.180 0.031 -0.149 -0.156 JL
ST-8 6/17/2009 12:23 36.9 0.896 –0.846 0.025 0.871 0.915 –0.116 0.171 0.028 -0.144 -0.151 JL
ST-8 6/17/2009 0.900 –0.847 0.027 0.874 0.917 –0.118 0.173 0.028 -0.146 -0.153 JL
ST-8 6/17/2009 0.901 –0.848 0.027 0.875 0.918 –0.118 0.173 0.028 -0.146 -0.153 JL
ST-8 6/17/2009 36.7 0.901 –0.849 0.026 0.875 0.919 –0.118 0.173 0.028 -0.146 -0.153 JL
ST-8 6/18/2009 11:22 37.2 0.897 –0.846 0.026 0.872 0.915 –0.107 0.162 0.028 -0.135 -0.141 JL
ST-8 6/18/2009 0.899 –0.847 0.026 0.873 0.917 –0.107 0.163 0.028 -0.135 -0.142 JL
ST-8 6/18/2009 0.898 –0.848 0.025 0.873 0.917 –0.106 0.161 0.028 -0.134 -0.140 JL
ST-8 6/18/2009 37.7 0.898 –0.848 0.025 0.873 0.917 –0.106 0.162 0.028 -0.134 -0.141 JL
ST-8 6/19/2009 12:12 30.0 1.145 –1.092 0.027 1.119 1.174 –0.760 0.810 0.025 -0.785 -0.824 JL
ST-8 6/19/2009 1.146 –1.094 0.026 1.120 1.176 –0.760 0.811 0.026 -0.786 -0.825 JL
ST-8 6/19/2009 1.146 –1.095 0.026 1.121 1.177 –0.760 0.810 0.025 -0.785 -0.824 JL
ST-8 6/19/2009 30.1 1.147 –1.096 0.026 1.122 1.178 –0.761 0.810 0.025 -0.786 -0.825 JL

A-26
Table A-9. Surface Tilt Meter Data for Site 9 (Page 1 of 3)
Site Date Time Temp (°C) X1 X3
(X1+X3) 2
(bias)
(X1-X3) 2
(∆) Tilt1 X2 X4
(X2+X4) 2
(bias)
(X2-X4) 2
(∆) Tilt2
Measured By Remarks
ST-9 5/29/2009 15:17 36.2 0.959 –0.892 0.034 0.926 0.972 0.701 –0.651 0.025 0.676 0.710 BM
ST-9 5/29/2009 0.966 –0.892 0.037 0.929 0.975 0.710 –0.658 0.026 0.684 0.718 BM
ST-9 5/29/2009 0.988 –0.896 0.046 0.942 0.989 0.700 –0.655 0.023 0.678 0.711 BM
ST-9 5/29/2009 38.2 0.953 –0.896 0.029 0.925 0.971 0.707 –0.661 0.023 0.684 0.718 BM
ST-9 5/30/2009 11:45 35.0 0.957 –0.892 0.033 0.925 0.971 0.721 –0.667 0.027 0.694 0.729 BM
ST-9 5/30/2009 0.961 –0.890 0.036 0.926 0.972 0.719 –0.668 0.026 0.694 0.728 BM
ST-9 5/30/2009 0.957 –0.898 0.030 0.928 0.974 0.717 –0.680 0.019 0.699 0.733 BM
ST-9 5/30/2009 35.5 0.956 –0.894 0.031 0.925 0.971 0.716 –0.664 0.026 0.690 0.725 BM
ST-9 5/31/2009 10:14 30.5 0.950 –0.890 0.030 0.920 0.966 0.675 –0.626 0.025 0.651 0.683 BM
ST-9 5/31/2009 0.949 –0.891 0.029 0.920 0.966 0.686 –0.633 0.027 0.660 0.692 BM
ST-9 5/31/2009 0.948 –0.890 0.029 0.919 0.965 0.678 –0.631 0.024 0.655 0.687 BM
ST-9 5/31/2009 30.8 0.951 –0.896 0.028 0.924 0.970 0.679 –0.630 0.025 0.655 0.687 BM
ST-9 6/1/2009 12:38 34.4 0.953 –0.887 0.033 0.920 0.966 0.702 –0.661 0.021 0.682 0.716 BM
ST-9 6/1/2009 0.954 –0.896 0.029 0.925 0.971 0.707 –0.660 0.024 0.684 0.718 BM
ST-9 6/1/2009 0.952 –0.897 0.028 0.925 0.971 0.707 –0.660 0.024 0.684 0.718 BM
ST-9 6/1/2009 34.8 0.952 –0.897 0.028 0.925 0.971 0.706 –0.659 0.024 0.683 0.717 BM
ST-9 6/2/2009 16:08 38.1 0.951 –0.879 0.036 0.915 0.961 0.705 –0.649 0.028 0.677 0.711 CF, BM
ST-9 6/2/2009 0.950 –0.885 0.033 0.918 0.963 0.706 –0.648 0.029 0.677 0.711 CF, BM
ST-9 6/2/2009 0.948 –0.884 0.032 0.916 0.962 0.702 –0.648 0.027 0.675 0.709 CF, BM
ST-9 6/2/2009 38.7 0.950 –0.886 0.032 0.918 0.964 0.705 –0.648 0.029 0.677 0.710 CF, BM
ST-9 6/3/2009 10:22 25.3 0.945 –0.875 0.035 0.910 0.956 0.664 –0.613 0.026 0.639 0.670 BM
ST-9 6/3/2009 0.951 –0.885 0.033 0.918 0.964 0.667 –0.615 0.026 0.641 0.673 BM
ST-9 6/3/2009 0.947 –0.884 0.032 0.916 0.961 0.667 –0.615 0.026 0.641 0.673 BM
ST-9 6/3/2009 25.7 0.950 –0.886 0.032 0.918 0.964 0.663 –0.616 0.024 0.640 0.671 BM
ST-9 6/4/2009 12:19 32.3 0.951 –0.886 0.033 0.919 0.964 0.702 –0.654 0.024 0.678 0.712 BM
ST-9 6/4/2009 0.953 –0.891 0.031 0.922 0.968 0.703 –0.657 0.023 0.680 0.714 BM
ST-9 6/4/2009 0.951 –0.891 0.030 0.921 0.967 0.706 –0.656 0.025 0.681 0.715 BM
ST-9 6/4/2009 33.0 0.952 –0.892 0.030 0.922 0.968 0.707 –0.657 0.025 0.682 0.716 BM

A-27
Table A-10. Surface Tilt Meter Data for Site 9 (Page 2 of 3)
Site Date Time Temp (°C) X1 X3
(X1+X3) 2
(bias)
(X1-X3) 2
(∆) Tilt1 X2 X4
(X2+X4) 2
(bias)
(X2-X4) 2
(∆) Tilt2
Measured By Remarks
ST-9 6/5/2009 11:05 31.6 0.949 –0.883 0.033 0.916 0.962 0.686 –0.641 0.023 0.664 0.697 BM
ST-9 6/5/2009 0.950 –0.885 0.033 0.918 0.963 0.689 –0.640 0.025 0.665 0.698 BM
ST-9 6/5/2009 0.949 –0.886 0.032 0.918 0.963 0.690 –0.642 0.024 0.666 0.699 BM
ST-9 6/5/2009 32.1 0.949 –0.885 0.032 0.917 0.963 0.692 –0.643 0.025 0.668 0.701 BM
ST-9 6/6/2009 8:23 28.3 0.948 –0.884 0.032 0.916 0.962 0.653 –0.605 0.024 0.629 0.660 BM
ST-9 6/6/2009 0.946 –0.889 0.029 0.918 0.963 0.657 –0.607 0.025 0.632 0.664 BM
ST-9 6/6/2009 0.950 –0.887 0.032 0.919 0.964 0.659 –0.608 0.026 0.634 0.665 BM
ST-9 6/6/2009 28.5 0.945 –0.886 0.030 0.916 0.961 0.658 –0.609 0.025 0.634 0.665 BM
ST-9 6/7/2009 10:42 33.7 0.953 –0.888 0.033 0.921 0.967 0.694 –0.655 0.020 0.675 0.708 BM
ST-9 6/7/2009 0.953 –0.891 0.031 0.922 0.968 0.698 –0.654 0.022 0.676 0.710 BM
ST-9 6/7/2009 0.952 –0.891 0.031 0.922 0.968 0.700 –0.653 0.024 0.677 0.710 BM
ST-9 6/7/2009 34.9 0.952 –0.893 0.030 0.923 0.969 0.699 –0.653 0.023 0.676 0.710 BM
ST-9 6/8/2009 10:50 36.4 0.952 –0.884 0.034 0.918 0.964 0.705 –0.663 0.021 0.684 0.718 BM
ST-9 6/8/2009 0.953 –0.889 0.032 0.921 0.967 0.706 –0.661 0.023 0.684 0.718 BM
ST-9 6/8/2009 0.953 –0.892 0.031 0.923 0.969 0.706 –0.660 0.023 0.683 0.717 BM
ST-9 6/8/2009 37.0 0.954 –0.891 0.032 0.923 0.969 0.706 –0.660 0.023 0.683 0.717 BM
ST-9 6/9/2009 11:17 34.6 0.944 –0.891 0.027 0.918 0.963 0.689 –0.648 0.021 0.669 0.702 ELK, BM
ST-9 6/9/2009 0.946 –0.891 0.028 0.919 0.964 0.690 –0.645 0.023 0.668 0.701 ELK, BM
ST-9 6/9/2009 0.947 –0.892 0.028 0.920 0.965 0.690 –0.644 0.023 0.667 0.700 ELK, BM
ST-9 6/9/2009 36.2 0.948 –0.892 0.028 0.920 0.966 0.690 –0.644 0.023 0.667 0.700 ELK, BM
ST-9 6/10/2009 10:50 29.2 0.953 –0.891 0.031 0.922 0.968 0.703 –0.651 0.026 0.677 0.711 BM
ST-9 6/10/2009 0.954 –0.892 0.031 0.923 0.969 0.702 –0.651 0.026 0.677 0.710 BM
ST-9 6/10/2009 0.954 –0.892 0.031 0.923 0.969 0.702 –0.651 0.026 0.677 0.710 BM
ST-9 6/10/2009 30.8 0.954 –0.892 0.031 0.923 0.969 0.701 –0.651 0.025 0.676 0.710 BM
ST-9 6/11/2009 11:09 36.5 0.952 –0.889 0.032 0.921 0.967 0.703 –0.652 0.026 0.678 0.711 BM, JL, CB
ST-9 6/11/2009 0.953 –0.891 0.031 0.922 0.968 0.705 –0.656 0.025 0.681 0.715 BM, JL, CB
ST-9 6/11/2009 0.950 –0.889 0.031 0.920 0.965 0.707 –0.656 0.026 0.682 0.716 BM, JL, CB
ST-9 6/11/2009 36.9 0.952 –0.890 0.031 0.921 0.967 0.707 –0.657 0.025 0.682 0.716 BM, JL, CB
ST-9 6/12/2009 3:14 41.7 0.955 -0.882 0.037 0.919 0.964 0.709 -0.652 0.029 0.681 0.715 JL
ST-9 6/12/2009 0.955 -0.883 0.036 0.919 0.965 0.711 -0.653 0.029 0.682 0.716 JL
ST-9 6/12/2009 0.954 -0.884 0.035 0.919 0.965 0.711 -0.650 0.031 0.681 0.715 JL

A-28
Table A-9. Surface Tilt Meter Data for Site 9 (Page 3 of 3)
Site Date Time Temp (°C) X1 X3
(X1+X3) 2
(bias)
(X1-X3) 2
(∆) Tilt1 X2 X4
(X2+X4) 2
(bias)
(X2-X4) 2
(∆) Tilt2
Measured By Remarks
ST-9 6/12/2009 42.0 0.954 –0.883 0.036 0.919 0.964 0.711 –0.651 0.030 0.681 0.715 JL
ST-9 6/13/2009 3:38 42.9 0.950 –0.885 0.033 0.918 0.963 0.704 –0.653 0.026 0.679 0.712 JL
ST-9 6/13/2009 0.950 –0.886 0.032 0.918 0.964 0.705 –0.653 0.026 0.679 0.713 JL
ST-9 6/13/2009 0.950 –0.886 0.032 0.918 0.964 0.704 –0.653 0.026 0.679 0.712 JL
ST-9 6/13/2009 42.8 0.950 –0.886 0.032 0.918 0.964 0.703 –0.652 0.026 0.678 0.711 JL
ST-9 6/14/2009 10:28 35.9 0.948 –0.892 0.028 0.920 0.966 0.686 –0.641 0.023 0.664 0.697 JL
ST-9 6/14/2009 0.948 –0.892 0.028 0.920 0.966 0.687 –0.641 0.023 0.664 0.697 JL
ST-9 6/14/2009 0.947 –0.892 0.028 0.920 0.965 0.686 –0.640 0.023 0.663 0.696 JL
ST-9 6/14/2009 36.2 0.948 –0.893 0.028 0.921 0.967 0.685 –0.640 0.023 0.663 0.696 JL
ST-9 6/15/2009 11:50 40.5 0.956 –0.889 0.034 0.923 0.969 0.712 –0.656 0.028 0.684 0.718 JL
ST-9 6/15/2009 0.956 –0.891 0.033 0.924 0.970 0.712 –0.659 0.027 0.686 0.720 JL
ST-9 6/15/2009 0.955 –0.891 0.032 0.923 0.969 0.713 –0.660 0.027 0.687 0.721 JL
ST-9 6/15/2009 41.0 0.956 –0.891 0.033 0.924 0.970 0.713 –0.660 0.027 0.687 0.721 JL
ST-9 6/16/2009 1:50 43.9 0.952 –0.885 0.034 0.919 0.964 0.713 –0.664 0.025 0.689 0.723 JL
ST-9 6/16/2009 0.955 –0.888 0.034 0.922 0.968 0.715 –0.665 0.025 0.690 0.725 JL
ST-9 6/16/2009 0.953 –0.887 0.033 0.920 0.966 0.715 –0.665 0.025 0.690 0.725 JL
ST-9 6/16/2009 44.0 0.954 –0.888 0.033 0.921 0.967 0.715 –0.666 0.025 0.691 0.725 JL
ST-9 6/17/2009 12:16 37.1 0.941 –0.888 0.027 0.915 0.960 0.670 –0.625 0.023 0.648 0.680 JL
ST-9 6/17/2009 0.943 –0.889 0.027 0.916 0.962 0.672 –0.627 0.023 0.650 0.682 JL
ST-9 6/17/2009 0.945 –0.889 0.028 0.917 0.963 0.673 –0.627 0.023 0.650 0.683 JL
ST-9 6/17/2009 37.0 0.945 –0.889 0.028 0.917 0.963 0.673 –0.627 0.023 0.650 0.683 JL
ST-9 6/18/2009 11:15 36.4 0.947 –0.894 0.027 0.921 0.967 0.689 –0.647 0.021 0.668 0.701 JL
ST-9 6/18/2009 0.948 –0.894 0.027 0.921 0.967 0.692 –0.648 0.022 0.670 0.704 JL
ST-9 6/18/2009 0.949 –0.894 0.028 0.922 0.968 0.693 –0.647 0.023 0.670 0.704 JL
ST-9 6/18/2009 37.0 0.949 –0.894 0.028 0.922 0.968 0.693 –0.647 0.023 0.670 0.704 JL
ST-9 6/19/2009 12:06 29.7 0.942 –0.888 0.027 0.915 0.961 0.665 –0.617 0.024 0.641 0.673 JL
ST-9 6/19/2009 0.943 –0.888 0.028 0.916 0.961 0.665 –0.618 0.024 0.642 0.674 JL
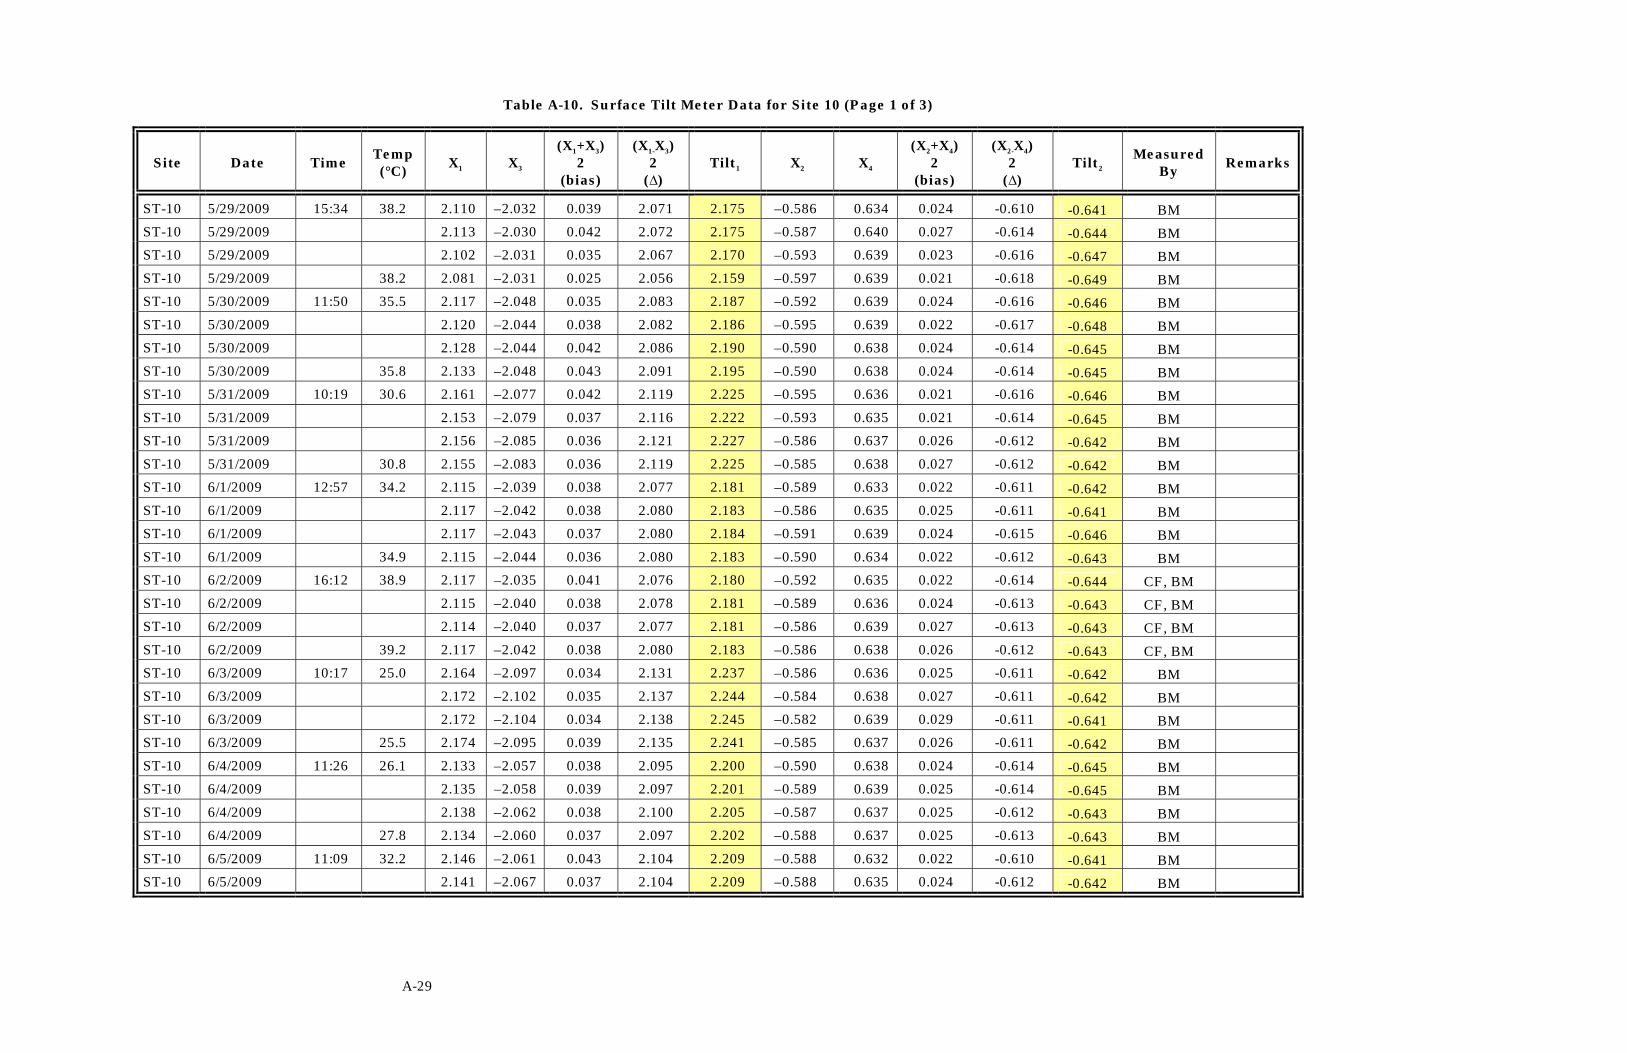
A-29
Table A-10. Surface Tilt Meter Data for Site 10 (Page 1 of 3)
Site Date Time Temp (°C) X1 X3
(X1+X3) 2
(bias)
(X1-X3) 2
(∆) Tilt1 X2 X4
(X2+X4) 2
(bias)
(X2-X4) 2
(∆) Tilt2
Measured By Remarks
ST-10 5/29/2009 15:34 38.2 2.110 –2.032 0.039 2.071 2.175 –0.586 0.634 0.024 -0.610 -0.641 BM
ST-10 5/29/2009 2.113 –2.030 0.042 2.072 2.175 –0.587 0.640 0.027 -0.614 -0.644 BM
ST-10 5/29/2009 2.102 –2.031 0.035 2.067 2.170 –0.593 0.639 0.023 -0.616 -0.647 BM
ST-10 5/29/2009 38.2 2.081 –2.031 0.025 2.056 2.159 –0.597 0.639 0.021 -0.618 -0.649 BM
ST-10 5/30/2009 11:50 35.5 2.117 –2.048 0.035 2.083 2.187 –0.592 0.639 0.024 -0.616 -0.646 BM
ST-10 5/30/2009 2.120 –2.044 0.038 2.082 2.186 –0.595 0.639 0.022 -0.617 -0.648 BM
ST-10 5/30/2009 2.128 –2.044 0.042 2.086 2.190 –0.590 0.638 0.024 -0.614 -0.645 BM
ST-10 5/30/2009 35.8 2.133 –2.048 0.043 2.091 2.195 –0.590 0.638 0.024 -0.614 -0.645 BM
ST-10 5/31/2009 10:19 30.6 2.161 –2.077 0.042 2.119 2.225 –0.595 0.636 0.021 -0.616 -0.646 BM
ST-10 5/31/2009 2.153 –2.079 0.037 2.116 2.222 –0.593 0.635 0.021 -0.614 -0.645 BM
ST-10 5/31/2009 2.156 –2.085 0.036 2.121 2.227 –0.586 0.637 0.026 -0.612 -0.642 BM
ST-10 5/31/2009 30.8 2.155 –2.083 0.036 2.119 2.225 –0.585 0.638 0.027 -0.612 -0.642 BM
ST-10 6/1/2009 12:57 34.2 2.115 –2.039 0.038 2.077 2.181 –0.589 0.633 0.022 -0.611 -0.642 BM
ST-10 6/1/2009 2.117 –2.042 0.038 2.080 2.183 –0.586 0.635 0.025 -0.611 -0.641 BM
ST-10 6/1/2009 2.117 –2.043 0.037 2.080 2.184 –0.591 0.639 0.024 -0.615 -0.646 BM
ST-10 6/1/2009 34.9 2.115 –2.044 0.036 2.080 2.183 –0.590 0.634 0.022 -0.612 -0.643 BM
ST-10 6/2/2009 16:12 38.9 2.117 –2.035 0.041 2.076 2.180 –0.592 0.635 0.022 -0.614 -0.644 CF, BM
ST-10 6/2/2009 2.115 –2.040 0.038 2.078 2.181 –0.589 0.636 0.024 -0.613 -0.643 CF, BM
ST-10 6/2/2009 2.114 –2.040 0.037 2.077 2.181 –0.586 0.639 0.027 -0.613 -0.643 CF, BM
ST-10 6/2/2009 39.2 2.117 –2.042 0.038 2.080 2.183 –0.586 0.638 0.026 -0.612 -0.643 CF, BM
ST-10 6/3/2009 10:17 25.0 2.164 –2.097 0.034 2.131 2.237 –0.586 0.636 0.025 -0.611 -0.642 BM
ST-10 6/3/2009 2.172 –2.102 0.035 2.137 2.244 –0.584 0.638 0.027 -0.611 -0.642 BM
ST-10 6/3/2009 2.172 –2.104 0.034 2.138 2.245 –0.582 0.639 0.029 -0.611 -0.641 BM
ST-10 6/3/2009 25.5 2.174 –2.095 0.039 2.135 2.241 –0.585 0.637 0.026 -0.611 -0.642 BM
ST-10 6/4/2009 11:26 26.1 2.133 –2.057 0.038 2.095 2.200 –0.590 0.638 0.024 -0.614 -0.645 BM
ST-10 6/4/2009 2.135 –2.058 0.039 2.097 2.201 –0.589 0.639 0.025 -0.614 -0.645 BM
ST-10 6/4/2009 2.138 –2.062 0.038 2.100 2.205 –0.587 0.637 0.025 -0.612 -0.643 BM
ST-10 6/4/2009 27.8 2.134 –2.060 0.037 2.097 2.202 –0.588 0.637 0.025 -0.613 -0.643 BM
ST-10 6/5/2009 11:09 32.2 2.146 –2.061 0.043 2.104 2.209 –0.588 0.632 0.022 -0.610 -0.641 BM
ST-10 6/5/2009 2.141 –2.067 0.037 2.104 2.209 –0.588 0.635 0.024 -0.612 -0.642 BM
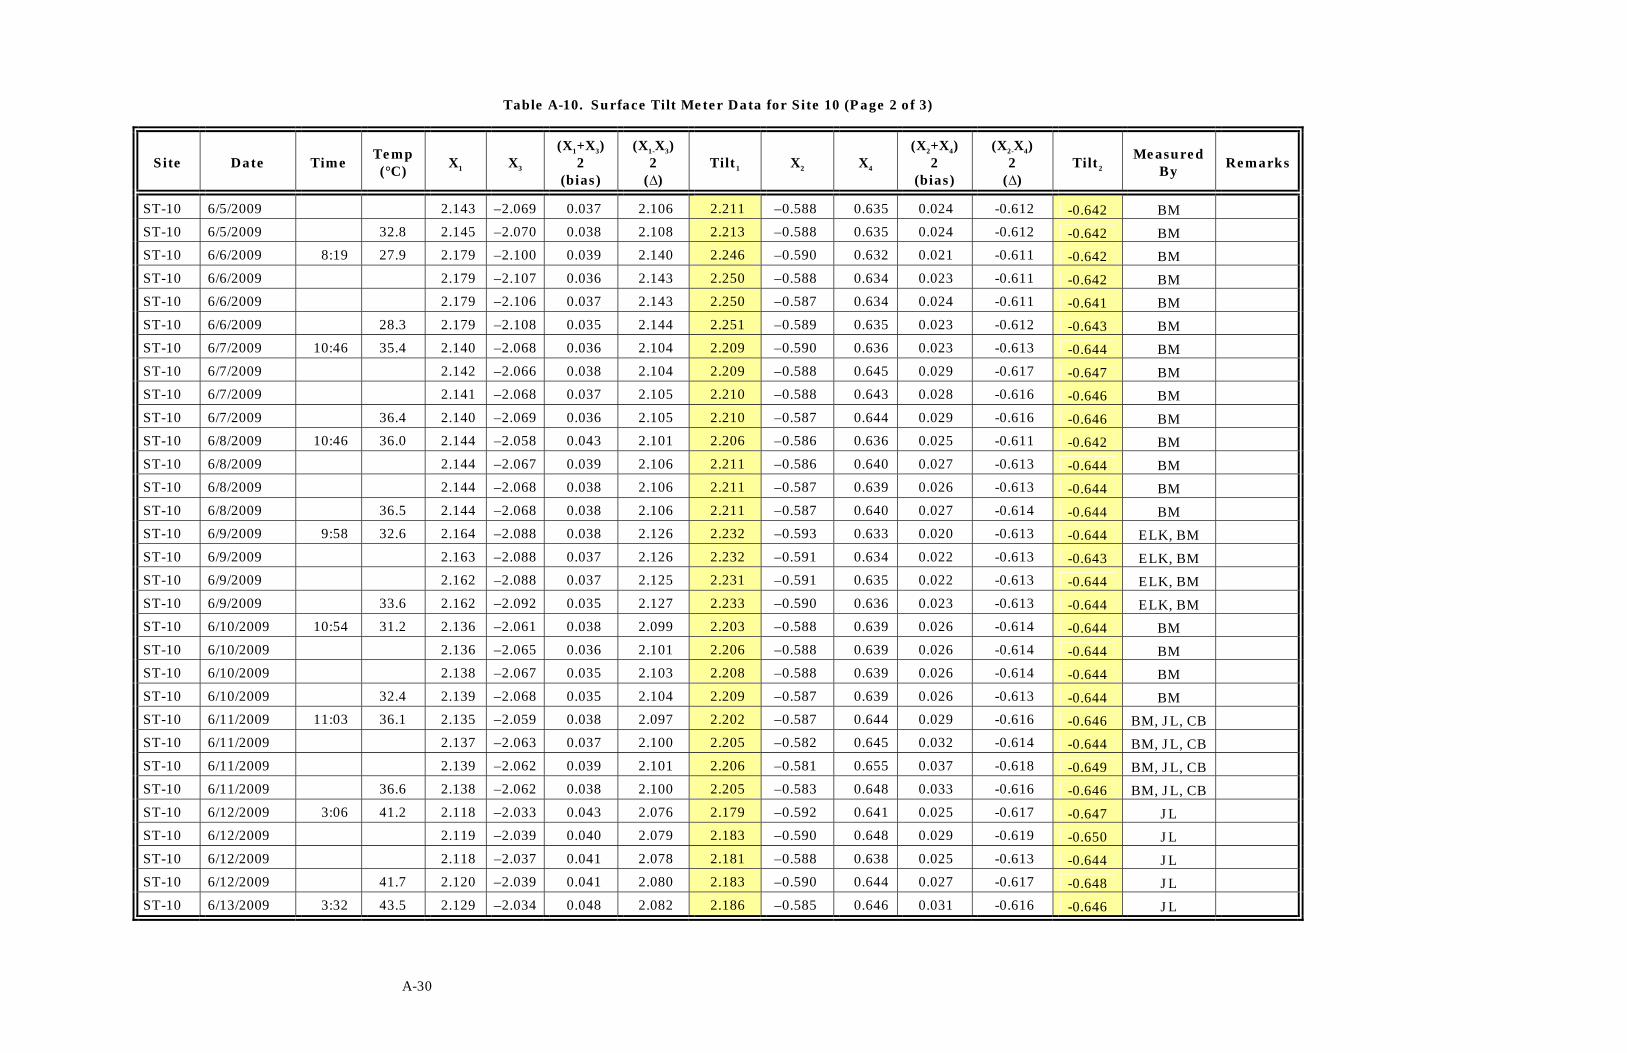
A-30
Table A-10. Surface Tilt Meter Data for Site 10 (Page 2 of 3)
Site Date Time Temp (°C) X1 X3
(X1+X3) 2
(bias)
(X1-X3) 2
(∆) Tilt1 X2 X4
(X2+X4) 2
(bias)
(X2-X4) 2
(∆) Tilt2
Measured By Remarks
ST-10 6/5/2009 2.143 –2.069 0.037 2.106 2.211 –0.588 0.635 0.024 -0.612 -0.642 BM
ST-10 6/5/2009 32.8 2.145 –2.070 0.038 2.108 2.213 –0.588 0.635 0.024 -0.612 -0.642 BM
ST-10 6/6/2009 8:19 27.9 2.179 –2.100 0.039 2.140 2.246 –0.590 0.632 0.021 -0.611 -0.642 BM
ST-10 6/6/2009 2.179 –2.107 0.036 2.143 2.250 –0.588 0.634 0.023 -0.611 -0.642 BM
ST-10 6/6/2009 2.179 –2.106 0.037 2.143 2.250 –0.587 0.634 0.024 -0.611 -0.641 BM
ST-10 6/6/2009 28.3 2.179 –2.108 0.035 2.144 2.251 –0.589 0.635 0.023 -0.612 -0.643 BM
ST-10 6/7/2009 10:46 35.4 2.140 –2.068 0.036 2.104 2.209 –0.590 0.636 0.023 -0.613 -0.644 BM
ST-10 6/7/2009 2.142 –2.066 0.038 2.104 2.209 –0.588 0.645 0.029 -0.617 -0.647 BM
ST-10 6/7/2009 2.141 –2.068 0.037 2.105 2.210 –0.588 0.643 0.028 -0.616 -0.646 BM
ST-10 6/7/2009 36.4 2.140 –2.069 0.036 2.105 2.210 –0.587 0.644 0.029 -0.616 -0.646 BM
ST-10 6/8/2009 10:46 36.0 2.144 –2.058 0.043 2.101 2.206 –0.586 0.636 0.025 -0.611 -0.642 BM
ST-10 6/8/2009 2.144 –2.067 0.039 2.106 2.211 –0.586 0.640 0.027 -0.613 -0.644 BM
ST-10 6/8/2009 2.144 –2.068 0.038 2.106 2.211 –0.587 0.639 0.026 -0.613 -0.644 BM
ST-10 6/8/2009 36.5 2.144 –2.068 0.038 2.106 2.211 –0.587 0.640 0.027 -0.614 -0.644 BM
ST-10 6/9/2009 9:58 32.6 2.164 –2.088 0.038 2.126 2.232 –0.593 0.633 0.020 -0.613 -0.644 ELK, BM
ST-10 6/9/2009 2.163 –2.088 0.037 2.126 2.232 –0.591 0.634 0.022 -0.613 -0.643 ELK, BM
ST-10 6/9/2009 2.162 –2.088 0.037 2.125 2.231 –0.591 0.635 0.022 -0.613 -0.644 ELK, BM
ST-10 6/9/2009 33.6 2.162 –2.092 0.035 2.127 2.233 –0.590 0.636 0.023 -0.613 -0.644 ELK, BM
ST-10 6/10/2009 10:54 31.2 2.136 –2.061 0.038 2.099 2.203 –0.588 0.639 0.026 -0.614 -0.644 BM
ST-10 6/10/2009 2.136 –2.065 0.036 2.101 2.206 –0.588 0.639 0.026 -0.614 -0.644 BM
ST-10 6/10/2009 2.138 –2.067 0.035 2.103 2.208 –0.588 0.639 0.026 -0.614 -0.644 BM
ST-10 6/10/2009 32.4 2.139 –2.068 0.035 2.104 2.209 –0.587 0.639 0.026 -0.613 -0.644 BM
ST-10 6/11/2009 11:03 36.1 2.135 –2.059 0.038 2.097 2.202 –0.587 0.644 0.029 -0.616 -0.646 BM, JL, CB
ST-10 6/11/2009 2.137 –2.063 0.037 2.100 2.205 –0.582 0.645 0.032 -0.614 -0.644 BM, JL, CB
ST-10 6/11/2009 2.139 –2.062 0.039 2.101 2.206 –0.581 0.655 0.037 -0.618 -0.649 BM, JL, CB
ST-10 6/11/2009 36.6 2.138 –2.062 0.038 2.100 2.205 –0.583 0.648 0.033 -0.616 -0.646 BM, JL, CB
ST-10 6/12/2009 3:06 41.2 2.118 –2.033 0.043 2.076 2.179 –0.592 0.641 0.025 -0.617 -0.647 JL
ST-10 6/12/2009 2.119 –2.039 0.040 2.079 2.183 –0.590 0.648 0.029 -0.619 -0.650 JL
ST-10 6/12/2009 2.118 –2.037 0.041 2.078 2.181 –0.588 0.638 0.025 -0.613 -0.644 JL
ST-10 6/12/2009 41.7 2.120 –2.039 0.041 2.080 2.183 –0.590 0.644 0.027 -0.617 -0.648 JL
ST-10 6/13/2009 3:32 43.5 2.129 –2.034 0.048 2.082 2.186 –0.585 0.646 0.031 -0.616 -0.646 JL

A-31
Table A-10. Surface Tilt Meter Data for Site 10 (Page 3 of 3)
Site Date Time Temp (°C) X1 X3
(X1+X3) 2
(bias)
(X1-X3) 2
(∆) Tilt1 X2 X4
(X2+X4) 2
(bias)
(X2-X4) 2
(∆) Tilt2
Measured By Remarks
ST-10 6/13/2009 2.129 –2.041 0.044 2.085 2.189 –0.584 0.645 0.031 -0.615 -0.645 JL
ST-10 6/13/2009 2.130 –2.046 0.042 2.088 2.192 –0.585 0.646 0.031 -0.616 -0.646 JL
ST-10 6/13/2009 43.0 2.131 –2.048 0.041 2.090 2.194 –0.586 0.644 0.029 -0.615 -0.646 JL
ST-10 6/14/2009 10:20 35.1 2.154 –2.075 0.039 2.115 2.220 –0.590 0.638 0.024 -0.614 -0.645 JL
ST-10 6/14/2009 2.154 –2.079 0.037 2.117 2.222 –0.589 0.638 0.025 -0.614 -0.644 JL
ST-10 6/14/2009 2.154 –2.083 0.035 2.119 2.224 –0.589 0.638 0.025 -0.614 -0.644 JL
ST-10 6/14/2009 35.6 2.155 –2.084 0.035 2.120 2.225 –0.590 0.637 0.024 -0.614 -0.644 JL
ST-10 6/15/2009 11:43 40.0 2.134 –2.056 0.039 2.095 2.200 –0.587 0.637 0.025 -0.612 -0.643 JL
ST-10 6/15/2009 2.134 –2.061 0.037 2.098 2.202 –0.587 0.640 0.027 -0.614 -0.644 JL
ST-10 6/15/2009 2.137 –2.062 0.038 2.100 2.204 –0.588 0.641 0.027 -0.615 -0.645 JL
ST-10 6/15/2009 40.3 2.138 –2.063 0.037 2.101 2.206 –0.588 0.641 0.027 -0.615 -0.645 JL
ST-10 6/16/2009 1:42 43.2 2.118 –2.049 0.035 2.084 2.188 –0.589 0.645 0.028 -0.617 -0.648 JL
ST-10 6/16/2009 2.118 –2.048 0.035 2.083 2.187 –0.589 0.643 0.027 -0.616 -0.647 JL
ST-10 6/16/2009 2.117 –2.047 0.035 2.082 2.186 –0.584 0.643 0.030 -0.614 -0.644 JL
ST-10 6/16/2009 43.7 2.118 –2.048 0.035 2.083 2.187 –0.587 0.643 0.028 -0.615 -0.646 JL
ST-10 6/17/2009 12:08 37.1 2.154 –2.087 0.033 2.121 2.227 –0.590 0.645 0.028 -0.618 -0.648 JL
ST-10 6/17/2009 2.157 –2.089 0.034 2.123 2.229 –0.590 0.643 0.027 -0.617 -0.647 JL
ST-10 6/17/2009 2.158 –2.091 0.033 2.125 2.231 –0.591 0.642 0.026 -0.617 -0.647 JL
ST-10 6/17/2009 37.1 2.158 –2.092 0.033 2.125 2.231 –0.591 0.642 0.026 -0.617 -0.647 JL
ST-10 6/18/2009 11:07 35.8 2.146 –2.075 0.035 2.111 2.216 –0.590 0.638 0.024 -0.614 -0.645 JL
ST-10 6/18/2009 2.146 –2.075 0.035 2.111 2.216 –0.588 0.639 0.026 -0.614 -0.644 JL
ST-10 6/18/2009 2.146 –2.077 0.035 2.112 2.217 –0.588 0.638 0.025 -0.613 -0.644 JL
ST-10 6/18/2009 36.2 2.146 –2.078 0.034 2.112 2.218 –0.589 0.638 0.025 -0.614 -0.644 JL
ST-10 6/19/2009 12:00 29.5 2.163 –2.094 0.035 2.129 2.235 –0.599 0.638 0.020 -0.619 -0.649 JL
ST-10 6/19/2009 2.165 –2.098 0.034 2.132 2.238 –0.592 0.639 0.024 -0.616 -0.646 JL
ST-10 6/19/2009 2.165 –2.101 0.032 2.133 2.240 –0.592 0.639 0.024 -0.616 -0.646 JL
ST-10 6/19/2009 29.6 2.166 –2.101 0.033 2.134 2.240 –0.593 0.639 0.023 -0.616 -0.647 JL

A-32
Table A-11. Surface Tilt Meter Data for Site 11 (Page 1 of 3)
Site Date Time Temp (°C) X1 X3
(X1+X3) 2
(bias)
(X1-X3) 2
(∆) Tilt1 X2 X4
(X2+X4) 2
(bias)
(X2-X4) 2
(∆) Tilt2
Measured By Remarks
ST-11 5/29/2009 15:43 38.2 0.857 –0.791 0.033 0.824 0.865 2.272 –2.206 0.033 2.239 2.351 BM
ST-11 5/29/2009 0.854 –0.797 0.029 0.826 0.867 2.273 –2.206 0.034 2.240 2.351 BM
ST-11 5/29/2009 0.853 –0.801 0.026 0.827 0.868 2.272 –2.205 0.033 2.239 2.350 BM
ST-11 5/29/2009 38.2 0.858 –0.797 0.031 0.828 0.869 2.275 –2.194 0.041 2.235 2.346 BM
ST-11 5/30/2009 11:50 35.8 0.870 –0.808 0.031 0.839 0.881 2.277 –2.213 0.032 2.245 2.357 BM
ST-11 5/30/2009 0.860 –0.812 0.024 0.836 0.878 2.277 –2.214 0.032 2.246 2.358 BM
ST-11 5/30/2009 0.865 –0.815 0.025 0.840 0.882 2.279 –2.216 0.031 2.248 2.360 BM
ST-11 5/30/2009 36.2 0.866 –0.812 0.027 0.839 0.881 2.280 –2.218 0.031 2.249 2.361 BM
ST-11 5/31/2009 10:24 30.6 0.876 –0.824 0.026 0.850 0.893 2.302 –2.234 0.034 2.268 2.381 BM
ST-11 5/31/2009 0.874 –0.823 0.026 0.849 0.891 2.305 –2.239 0.033 2.272 2.386 BM
ST-11 5/31/2009 0.868 –0.823 0.023 0.846 0.888 2.306 –2.244 0.031 2.275 2.389 BM
ST-11 5/31/2009 31.2 0.869 –0.820 0.025 0.845 0.887 2.307 –2.245 0.031 2.276 2.390 BM
ST-11 6/1/2009 13:01 35.0 0.882 –0.824 0.029 0.853 0.896 2.306 –2.230 0.038 2.268 2.381 BM
ST-11 6/1/2009 0.884 –0.824 0.030 0.854 0.897 2.307 –2.233 0.037 2.270 2.384 BM
ST-11 6/1/2009 0.882 –0.826 0.028 0.854 0.897 2.304 –2.231 0.037 2.268 2.381 BM
ST-11 6/1/2009 35.6 0.880 –0.822 0.029 0.851 0.894 2.306 –2.235 0.036 2.271 2.384 BM
ST-11 6/2/2009 16:16 39.2 0.878 –0.813 0.033 0.846 0.888 2.346 –2.268 0.039 2.307 2.422 CF, BM
ST-11 6/2/2009 0.873 –0.818 0.028 0.846 0.888 2.351 –2.274 0.039 2.313 2.428 CF, BM
ST-11 6/2/2009 0.874 –0.821 0.027 0.848 0.890 2.351 –2.274 0.039 2.313 2.428 CF, BM
ST-11 6/2/2009 39.4 0.872 –0.816 0.028 0.844 0.886 2.352 –2.274 0.039 2.313 2.429 CF, BM
ST-11 6/3/2009 10:12 24.7 0.876 –0.821 0.028 0.849 0.891 2.358 –2.276 0.041 2.317 2.433 BM
ST-11 6/3/2009 0.877 –0.821 0.028 0.849 0.891 2.365 –2.279 0.043 2.322 2.438 BM
ST-11 6/3/2009 0.876 –0.819 0.029 0.848 0.890 2.362 –2.282 0.040 2.322 2.438 BM
ST-11 6/3/2009 25.2 0.876 –0.822 0.027 0.849 0.891 2.364 –2.289 0.037 2.327 2.443 BM
ST-11 6/4/2009 11:31 28.3 0.877 –0.835 0.021 0.856 0.899 2.370 –2.304 0.033 2.337 2.454 BM
ST-11 6/4/2009 0.876 –0.829 0.024 0.853 0.895 2.372 –2.308 0.032 2.340 2.457 BM
ST-11 6/4/2009 0.876 –0.827 0.025 0.852 0.894 2.374 –2.307 0.034 2.341 2.458 BM
ST-11 6/4/2009 29.5 0.877 –0.828 0.025 0.853 0.895 2.376 –2.311 0.033 2.344 2.461 BM
ST-11 6/5/2009 10:09 25.3 0.882 –0.821 0.031 0.852 0.894 2.377 –2.309 0.034 2.343 2.460 BM
ST-11 6/5/2009 0.886 –0.822 0.032 0.854 0.897 2.382 –2.310 0.036 2.346 2.463 BM

A-33
Table A-11. Surface Tilt Meter Data for Site 11 (Page 2 of 3)
Site Date Time Temp (°C) X1 X3
(X1+X3) 2
(bias)
(X1-X3) 2
(∆) Tilt1 X2 X4
(X2+X4) 2
(bias)
(X2-X4) 2
(∆) Tilt2
Measured By Remarks
ST-11 6/5/2009 0.883 –0.825 0.029 0.854 0.897 2.384 –2.312 0.036 2.348 2.465 BM
ST-11 6/5/2009 26.3 0.884 –0.827 0.029 0.856 0.898 2.386 –2.312 0.037 2.349 2.466 BM
ST-11 6/6/2009 8:15 27.5 0.890 –0.832 0.029 0.861 0.904 2.404 –2.333 0.035 2.369 2.487 BM
ST-11 6/6/2009 0.892 –0.836 0.028 0.864 0.907 2.407 –2.335 0.036 2.371 2.490 BM
ST-11 6/6/2009 0.890 –0.835 0.028 0.863 0.906 2.407 –2.337 0.035 2.372 2.491 BM
ST-11 6/6/2009 28.0 0.890 –0.836 0.027 0.863 0.906 2.409 –2.337 0.036 2.373 2.492 BM
ST-11 6/7/2009 10:50 36.6 0.894 –0.841 0.027 0.868 0.911 2.412 –2.335 0.039 2.374 2.492 BM
ST-11 6/7/2009 0.893 –0.842 0.026 0.868 0.911 2.416 –2.340 0.038 2.378 2.497 BM
ST-11 6/7/2009 0.894 –0.841 0.027 0.868 0.911 2.416 –2.343 0.037 2.380 2.498 BM
ST-11 6/7/2009 37.4 0.898 –0.841 0.029 0.870 0.913 2.417 –2.343 0.037 2.380 2.499 BM
ST-11 6/8/2009 10:42 34.8 0.891 –0.834 0.029 0.863 0.906 2.425 –2.339 0.043 2.382 2.501 BM
ST-11 6/8/2009 0.890 –0.836 0.027 0.863 0.906 2.427 –2.348 0.040 2.388 2.507 BM
ST-11 6/8/2009 0.892 –0.837 0.028 0.865 0.908 2.428 –2.352 0.038 2.390 2.510 BM
ST-11 6/8/2009 35.8 0.891 –0.838 0.027 0.865 0.908 2.426 –2.352 0.037 2.389 2.508 BM
ST-11 6/9/2009 10:04 33.7 0.896 –0.836 0.030 0.866 0.909 2.449 –2.378 0.035 2.414 2.534 ELK, BM
ST-11 6/9/2009 0.896 –0.844 0.026 0.870 0.914 2.452 –2.379 0.037 2.416 2.536 ELK, BM
ST-11 6/9/2009 0.897 –0.843 0.027 0.870 0.914 2.452 –2.380 0.036 2.416 2.537 ELK, BM
ST-11 6/9/2009 34.7 0.897 –0.843 0.027 0.870 0.914 2.453 –2.381 0.036 2.417 2.538 ELK, BM
ST-11 6/10/2009 10:58 32.7 0.896 –0.840 0.028 0.868 0.911 2.439 –2.367 0.036 2.403 2.523 BM
ST-11 6/10/2009 0.897 –0.843 0.027 0.870 0.914 2.442 –2.368 0.037 2.405 2.525 BM
ST-11 6/10/2009 0.897 –0.844 0.027 0.871 0.914 2.443 –2.371 0.036 2.407 2.527 BM
ST-11 6/10/2009 33.7 0.897 –0.844 0.027 0.871 0.914 2.443 –2.373 0.035 2.408 2.528 BM
ST-11 6/11/2009 10:59 36.0 0.904 –0.846 0.029 0.875 0.919 2.449 –2.373 0.038 2.411 2.532 BM, JL, CB
ST-11 6/11/2009 0.904 –0.848 0.028 0.876 0.920 2.453 –2.378 0.037 2.416 2.536 BM, JL, CB
ST-11 6/11/2009 0.911 –0.844 0.034 0.878 0.921 2.451 –2.378 0.037 2.415 2.535 BM, JL, CB
ST-11 6/11/2009 36.3 0.907 –0.846 0.031 0.877 0.920 2.455 –2.378 0.039 2.417 2.537 BM, JL, CB
ST-11 6/12/2009 3:00 41.6 0.901 –0.844 0.029 0.873 0.916 2.469 –2.395 0.037 2.432 2.554 JL
ST-11 6/12/2009 0.899 –0.846 0.027 0.873 0.916 2.471 –2.394 0.039 2.433 2.554 JL
ST-11 6/12/2009 0.891 –0.845 0.023 0.868 0.911 2.473 –2.397 0.038 2.435 2.557 JL
ST-11 6/12/2009 41.2 0.901 –0.844 0.029 0.873 0.916 2.472 –2.397 0.038 2.435 2.556 JL
ST-11 6/13/2009 3:26 43.9 0.908 –0.834 0.037 0.871 0.915 2.512 –2.433 0.040 2.473 2.596 JL

A-34
Table A-11. Surface Tilt Meter Data for Site 11 (Page 3 of 3)
Site Date Time Temp (°C) X1 X3
(X1+X3) 2
(bias)
(X1-X3) 2
(∆) Tilt1 X2 X4
(X2+X4) 2
(bias)
(X2-X4) 2
(∆) Tilt2
Measured By Remarks
ST-11 6/13/2009 0.909 –0.842 0.034 0.876 0.919 2.513 –2.435 0.039 2.474 2.598 JL
ST-11 6/13/2009 43.2 0.910 –0.841 0.035 0.876 0.919 2.514 –2.436 0.039 2.475 2.599 JL
ST-11 6/14/2009 10:14 34.2 0.907 –0.849 0.029 0.878 0.922 2.544 –2.465 0.040 2.505 2.630 JL
ST-11 6/14/2009 0.907 –0.852 0.028 0.880 0.923 2.544 –2.472 0.036 2.508 2.633 JL
ST-11 6/14/2009 0.907 –0.852 0.028 0.880 0.923 2.545 –2.475 0.035 2.510 2.636 JL
ST-11 6/14/2009 34.7 0.907 –0.853 0.027 0.880 0.924 2.546 –2.477 0.035 2.512 2.637 JL
ST-11 6/15/2009 11:36 39.7 0.910 –0.855 0.028 0.883 0.927 2.571 –2.494 0.039 2.533 2.659 JL
ST-11 6/15/2009 0.911 –0.858 0.027 0.885 0.929 2.571 –2.498 0.037 2.535 2.661 JL
ST-11 6/15/2009 0.912 –0.860 0.026 0.886 0.930 2.573 –2.500 0.037 2.537 2.663 JL
ST-11 6/15/2009 39.9 0.912 –0.861 0.026 0.887 0.931 2.573 –2.499 0.037 2.536 2.663 JL
ST-11 6/16/2009 11:35 42.4 0.915 –0.861 0.027 0.888 0.932 2.586 –2.515 0.035 2.551 2.678 JL
ST-11 6/16/2009 0.917 –0.860 0.029 0.889 0.933 2.590 –2.517 0.037 2.554 2.681 JL
ST-11 6/16/2009 0.917 –0.860 0.029 0.889 0.933 2.591 –2.516 0.038 2.554 2.681 JL
ST-11 6/16/2009 42.9 0.917 –0.860 0.029 0.889 0.933 2.590 –2.517 0.037 2.554 2.681 JL
ST-11 6/17/2009 12:01 36.8 0.909 –0.860 0.025 0.885 0.929 2.638 –2.568 0.035 2.603 2.733 JL
ST-11 6/17/2009 0.914 –0.860 0.027 0.887 0.931 2.638 –2.572 0.033 2.605 2.735 JL
ST-11 6/17/2009 0.915 –0.862 0.027 0.889 0.933 2.639 –2.572 0.033 2.606 2.736 JL
ST-11 6/17/2009 37.1 0.913 –0.861 0.026 0.887 0.931 2.640 –2.573 0.034 2.607 2.737 JL
ST-11 6/18/2009 11:00 35.3 0.915 –0.862 0.027 0.889 0.933 2.658 –2.584 0.037 2.621 2.752 JL
ST-11 6/18/2009 0.916 –0.864 0.026 0.890 0.935 2.661 –2.590 0.036 2.626 2.757 JL
ST-11 6/18/2009 0.916 –0.863 0.027 0.890 0.934 2.662 –2.590 0.036 2.626 2.757 JL
ST-11 6/18/2009 35.7 0.916 –0.864 0.026 0.890 0.935 2.663 –2.590 0.037 2.627 2.758 JL
ST-11 6/19/2009 11:53 29.3 0.901 –0.856 0.023 0.879 0.922 2.612 –2.553 0.030 2.583 2.712 JL
ST-11 6/19/2009 0.901 –0.855 0.023 0.878 0.922 2.617 –2.556 0.031 2.587 2.716 JL
ST-11 6/19/2009 0.902 –0.855 0.024 0.879 0.922 2.619 –2.559 0.030 2.589 2.718 JL
ST-11 6/19/2009 29.4 0.903 –0.855 0.024 0.879 0.923 2.619 –2.560 0.030 2.590 2.719 JL
ST-11 6/13/2009 0.909 –0.842 0.034 0.876 0.919 2.513 –2.435 0.039 2.474 2.598 JL
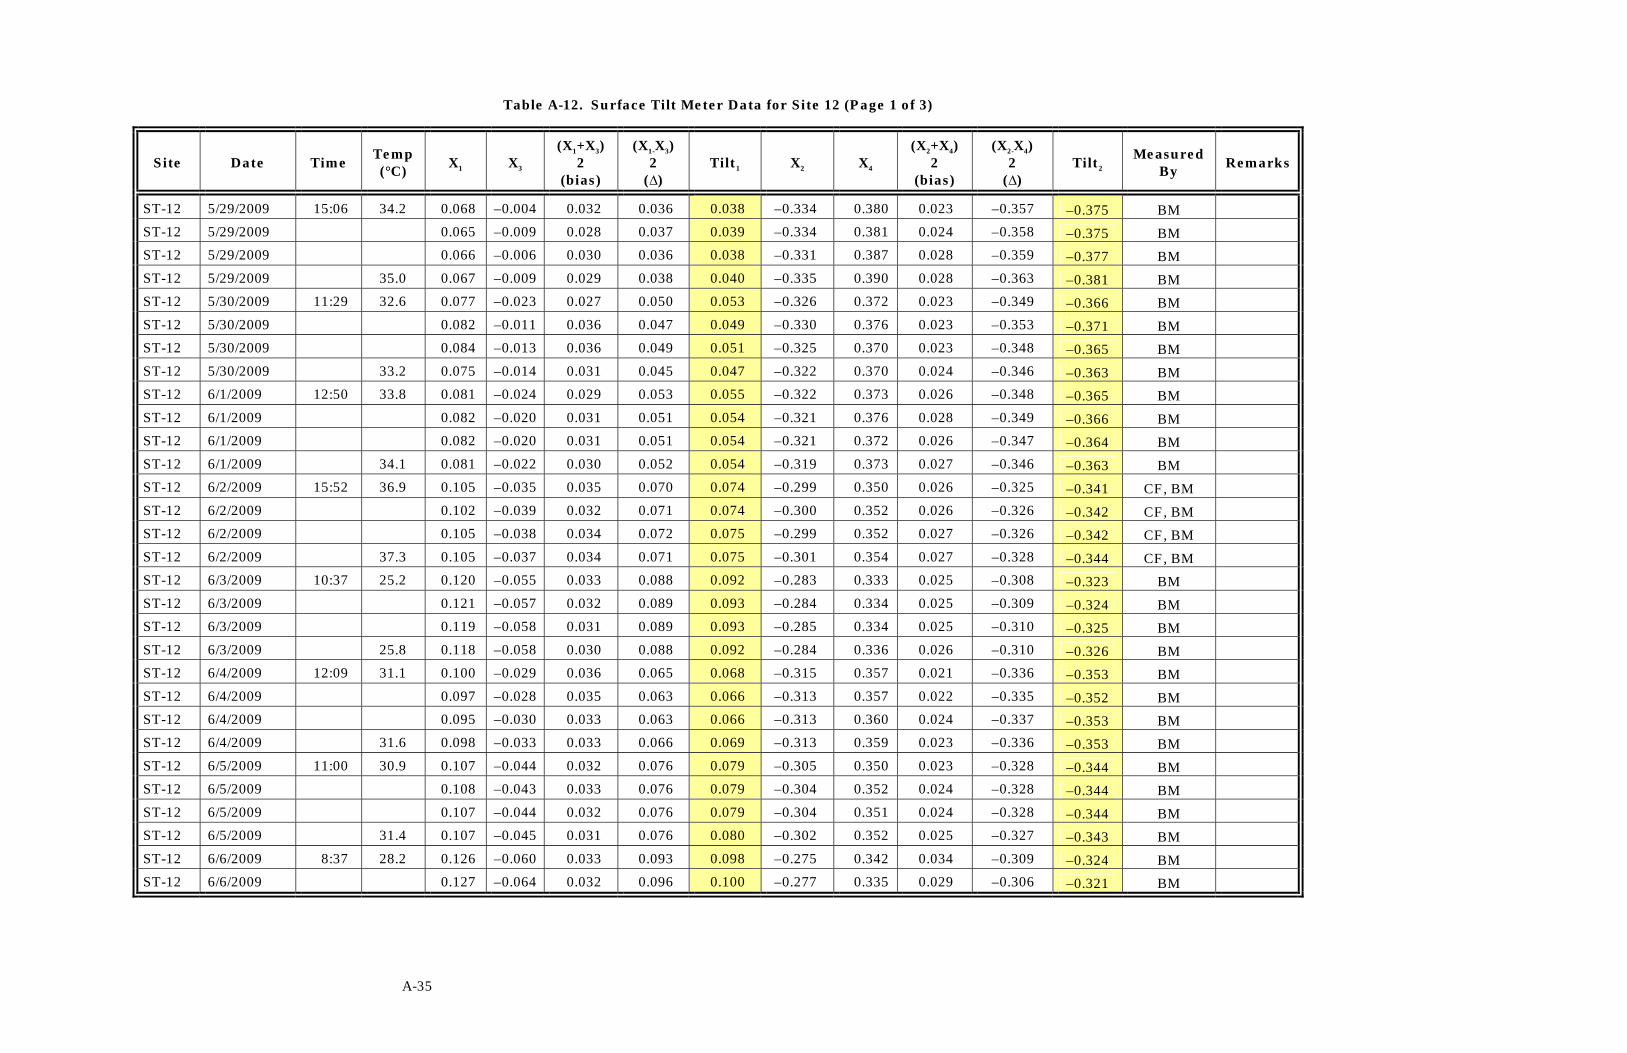
A-35
Table A-12. Surface Tilt Meter Data for Site 12 (Page 1 of 3)
Site Date Time Temp (°C) X1 X3
(X1+X3) 2
(bias)
(X1-X3) 2
(∆) Tilt1 X2 X4
(X2+X4) 2
(bias)
(X2-X4) 2
(∆) Tilt2
Measured By Remarks
ST-12 5/29/2009 15:06 34.2 0.068 –0.004 0.032 0.036 0.038 –0.334 0.380 0.023 –0.357 –0.375 BM
ST-12 5/29/2009 0.065 –0.009 0.028 0.037 0.039 –0.334 0.381 0.024 –0.358 –0.375 BM
ST-12 5/29/2009 0.066 –0.006 0.030 0.036 0.038 –0.331 0.387 0.028 –0.359 –0.377 BM
ST-12 5/29/2009 35.0 0.067 –0.009 0.029 0.038 0.040 –0.335 0.390 0.028 –0.363 –0.381 BM
ST-12 5/30/2009 11:29 32.6 0.077 –0.023 0.027 0.050 0.053 –0.326 0.372 0.023 –0.349 –0.366 BM
ST-12 5/30/2009 0.082 –0.011 0.036 0.047 0.049 –0.330 0.376 0.023 –0.353 –0.371 BM
ST-12 5/30/2009 0.084 –0.013 0.036 0.049 0.051 –0.325 0.370 0.023 –0.348 –0.365 BM
ST-12 5/30/2009 33.2 0.075 –0.014 0.031 0.045 0.047 –0.322 0.370 0.024 –0.346 –0.363 BM
ST-12 6/1/2009 12:50 33.8 0.081 –0.024 0.029 0.053 0.055 –0.322 0.373 0.026 –0.348 –0.365 BM
ST-12 6/1/2009 0.082 –0.020 0.031 0.051 0.054 –0.321 0.376 0.028 –0.349 –0.366 BM
ST-12 6/1/2009 0.082 –0.020 0.031 0.051 0.054 –0.321 0.372 0.026 –0.347 –0.364 BM
ST-12 6/1/2009 34.1 0.081 –0.022 0.030 0.052 0.054 –0.319 0.373 0.027 –0.346 –0.363 BM
ST-12 6/2/2009 15:52 36.9 0.105 –0.035 0.035 0.070 0.074 –0.299 0.350 0.026 –0.325 –0.341 CF, BM
ST-12 6/2/2009 0.102 –0.039 0.032 0.071 0.074 –0.300 0.352 0.026 –0.326 –0.342 CF, BM
ST-12 6/2/2009 0.105 –0.038 0.034 0.072 0.075 –0.299 0.352 0.027 –0.326 –0.342 CF, BM
ST-12 6/2/2009 37.3 0.105 –0.037 0.034 0.071 0.075 –0.301 0.354 0.027 –0.328 –0.344 CF, BM
ST-12 6/3/2009 10:37 25.2 0.120 –0.055 0.033 0.088 0.092 –0.283 0.333 0.025 –0.308 –0.323 BM
ST-12 6/3/2009 0.121 –0.057 0.032 0.089 0.093 –0.284 0.334 0.025 –0.309 –0.324 BM
ST-12 6/3/2009 0.119 –0.058 0.031 0.089 0.093 –0.285 0.334 0.025 –0.310 –0.325 BM
ST-12 6/3/2009 25.8 0.118 –0.058 0.030 0.088 0.092 –0.284 0.336 0.026 –0.310 –0.326 BM
ST-12 6/4/2009 12:09 31.1 0.100 –0.029 0.036 0.065 0.068 –0.315 0.357 0.021 –0.336 –0.353 BM
ST-12 6/4/2009 0.097 –0.028 0.035 0.063 0.066 –0.313 0.357 0.022 –0.335 –0.352 BM
ST-12 6/4/2009 0.095 –0.030 0.033 0.063 0.066 –0.313 0.360 0.024 –0.337 –0.353 BM
ST-12 6/4/2009 31.6 0.098 –0.033 0.033 0.066 0.069 –0.313 0.359 0.023 –0.336 –0.353 BM
ST-12 6/5/2009 11:00 30.9 0.107 –0.044 0.032 0.076 0.079 –0.305 0.350 0.023 –0.328 –0.344 BM
ST-12 6/5/2009 0.108 –0.043 0.033 0.076 0.079 –0.304 0.352 0.024 –0.328 –0.344 BM
ST-12 6/5/2009 0.107 –0.044 0.032 0.076 0.079 –0.304 0.351 0.024 –0.328 –0.344 BM
ST-12 6/5/2009 31.4 0.107 –0.045 0.031 0.076 0.080 –0.302 0.352 0.025 –0.327 –0.343 BM
ST-12 6/6/2009 8:37 28.2 0.126 –0.060 0.033 0.093 0.098 –0.275 0.342 0.034 –0.309 –0.324 BM
ST-12 6/6/2009 0.127 –0.064 0.032 0.096 0.100 –0.277 0.335 0.029 –0.306 –0.321 BM
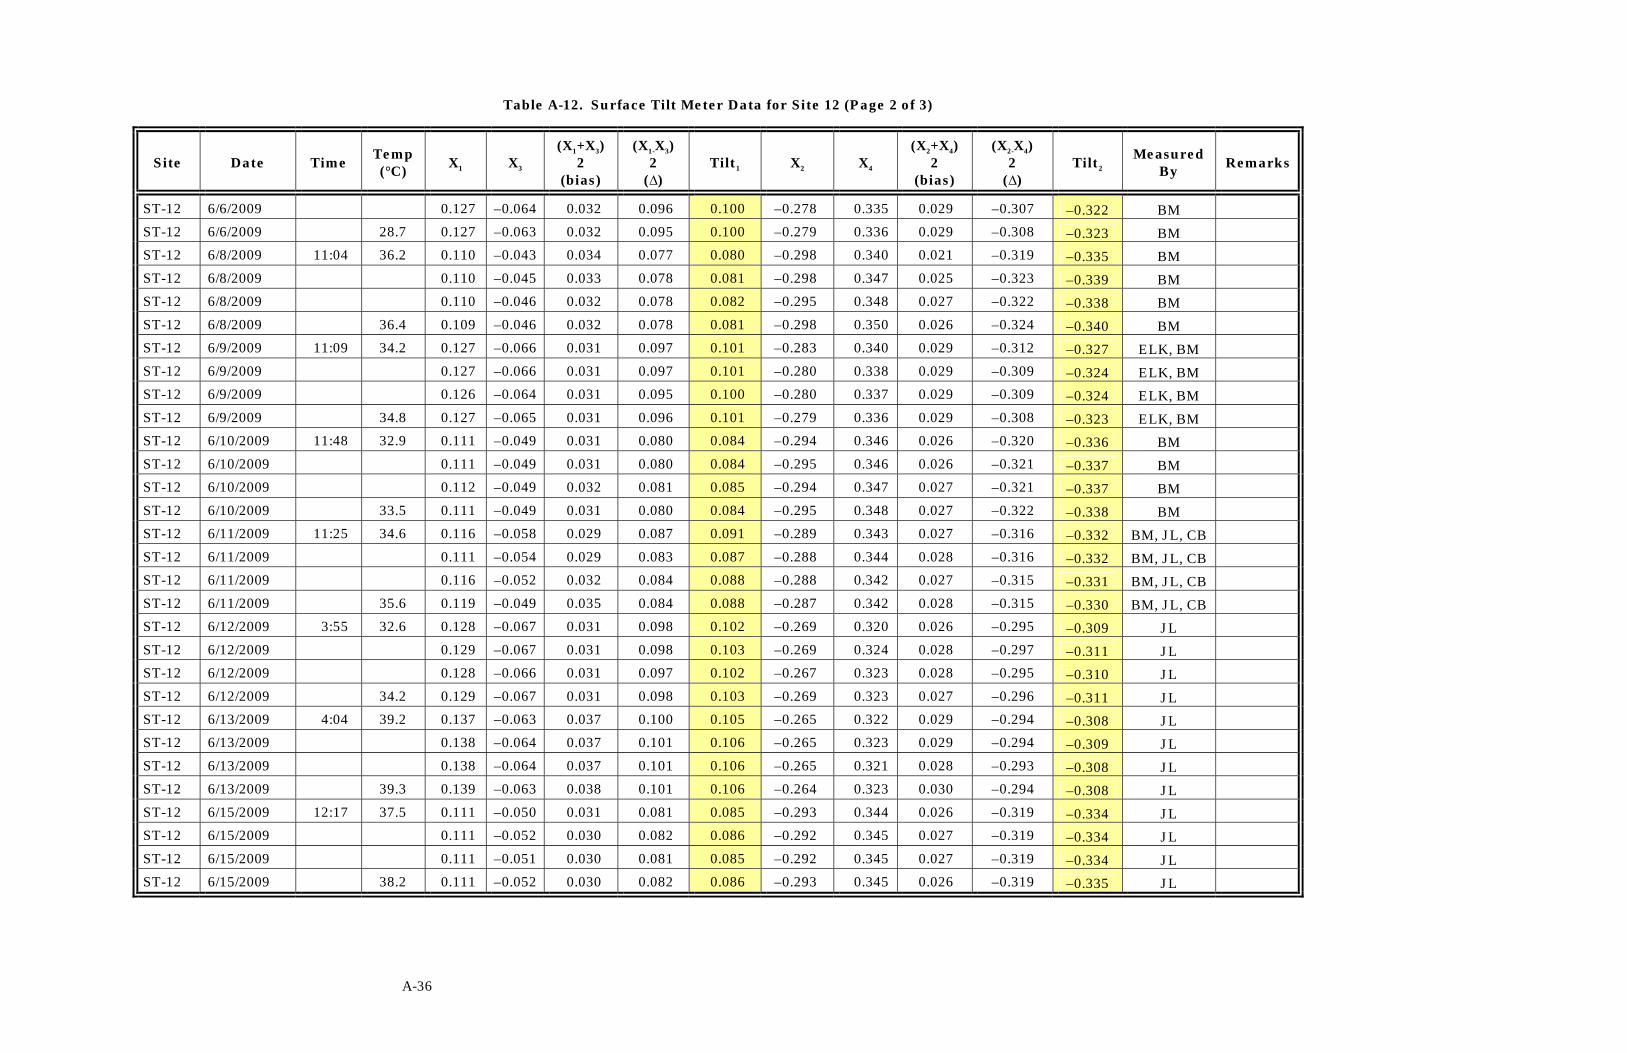
A-36
Table A-12. Surface Tilt Meter Data for Site 12 (Page 2 of 3)
Site Date Time Temp (°C) X1 X3
(X1+X3) 2
(bias)
(X1-X3) 2
(∆) Tilt1 X2 X4
(X2+X4) 2
(bias)
(X2-X4) 2
(∆) Tilt2
Measured By Remarks
ST-12 6/6/2009 0.127 –0.064 0.032 0.096 0.100 –0.278 0.335 0.029 –0.307 –0.322 BM
ST-12 6/6/2009 28.7 0.127 –0.063 0.032 0.095 0.100 –0.279 0.336 0.029 –0.308 –0.323 BM
ST-12 6/8/2009 11:04 36.2 0.110 –0.043 0.034 0.077 0.080 –0.298 0.340 0.021 –0.319 –0.335 BM
ST-12 6/8/2009 0.110 –0.045 0.033 0.078 0.081 –0.298 0.347 0.025 –0.323 –0.339 BM
ST-12 6/8/2009 0.110 –0.046 0.032 0.078 0.082 –0.295 0.348 0.027 –0.322 –0.338 BM
ST-12 6/8/2009 36.4 0.109 –0.046 0.032 0.078 0.081 –0.298 0.350 0.026 –0.324 –0.340 BM
ST-12 6/9/2009 11:09 34.2 0.127 –0.066 0.031 0.097 0.101 –0.283 0.340 0.029 –0.312 –0.327 ELK, BM
ST-12 6/9/2009 0.127 –0.066 0.031 0.097 0.101 –0.280 0.338 0.029 –0.309 –0.324 ELK, BM
ST-12 6/9/2009 0.126 –0.064 0.031 0.095 0.100 –0.280 0.337 0.029 –0.309 –0.324 ELK, BM
ST-12 6/9/2009 34.8 0.127 –0.065 0.031 0.096 0.101 –0.279 0.336 0.029 –0.308 –0.323 ELK, BM
ST-12 6/10/2009 11:48 32.9 0.111 –0.049 0.031 0.080 0.084 –0.294 0.346 0.026 –0.320 –0.336 BM
ST-12 6/10/2009 0.111 –0.049 0.031 0.080 0.084 –0.295 0.346 0.026 –0.321 –0.337 BM
ST-12 6/10/2009 0.112 –0.049 0.032 0.081 0.085 –0.294 0.347 0.027 –0.321 –0.337 BM
ST-12 6/10/2009 33.5 0.111 –0.049 0.031 0.080 0.084 –0.295 0.348 0.027 –0.322 –0.338 BM
ST-12 6/11/2009 11:25 34.6 0.116 –0.058 0.029 0.087 0.091 –0.289 0.343 0.027 –0.316 –0.332 BM, JL, CB
ST-12 6/11/2009 0.111 –0.054 0.029 0.083 0.087 –0.288 0.344 0.028 –0.316 –0.332 BM, JL, CB
ST-12 6/11/2009 0.116 –0.052 0.032 0.084 0.088 –0.288 0.342 0.027 –0.315 –0.331 BM, JL, CB
ST-12 6/11/2009 35.6 0.119 –0.049 0.035 0.084 0.088 –0.287 0.342 0.028 –0.315 –0.330 BM, JL, CB
ST-12 6/12/2009 3:55 32.6 0.128 –0.067 0.031 0.098 0.102 –0.269 0.320 0.026 –0.295 –0.309 JL
ST-12 6/12/2009 0.129 –0.067 0.031 0.098 0.103 –0.269 0.324 0.028 –0.297 –0.311 JL
ST-12 6/12/2009 0.128 –0.066 0.031 0.097 0.102 –0.267 0.323 0.028 –0.295 –0.310 JL
ST-12 6/12/2009 34.2 0.129 –0.067 0.031 0.098 0.103 –0.269 0.323 0.027 –0.296 –0.311 JL
ST-12 6/13/2009 4:04 39.2 0.137 –0.063 0.037 0.100 0.105 –0.265 0.322 0.029 –0.294 –0.308 JL
ST-12 6/13/2009 0.138 –0.064 0.037 0.101 0.106 –0.265 0.323 0.029 –0.294 –0.309 JL
ST-12 6/13/2009 0.138 –0.064 0.037 0.101 0.106 –0.265 0.321 0.028 –0.293 –0.308 JL
ST-12 6/13/2009 39.3 0.139 –0.063 0.038 0.101 0.106 –0.264 0.323 0.030 –0.294 –0.308 JL
ST-12 6/15/2009 12:17 37.5 0.111 –0.050 0.031 0.081 0.085 –0.293 0.344 0.026 –0.319 –0.334 JL
ST-12 6/15/2009 0.111 –0.052 0.030 0.082 0.086 –0.292 0.345 0.027 –0.319 –0.334 JL
ST-12 6/15/2009 0.111 –0.051 0.030 0.081 0.085 –0.292 0.345 0.027 –0.319 –0.334 JL
ST-12 6/15/2009 38.2 0.111 –0.052 0.030 0.082 0.086 –0.293 0.345 0.026 –0.319 –0.335 JL

A-37
Table A-12. Surface Tilt Meter Data for Site 12 (Page 3 of 3)
Site Date Time Temp (°C) X1 X3
(X1+X3) 2
(bias)
(X1-X3) 2
(∆) Tilt1 X2 X4
(X2+X4) 2
(bias)
(X2-X4) 2
(∆) Tilt2
Measured By Remarks
ST-12 6/16/2009 0.117 –0.057 0.030 0.087 0.091 –0.282 0.337 0.028 –0.310 –0.325 JL
ST-12 6/16/2009 0.116 –0.057 0.030 0.087 0.091 –0.283 0.337 0.027 –0.310 –0.326 JL
ST-12 6/16/2009 41.1 0.117 –0.058 0.030 0.088 0.092 –0.283 0.337 0.027 –0.310 –0.326 JL
ST-12 6/17/2009 12:44 33.8 0.129 –0.073 0.028 0.101 0.106 –0.267 0.321 0.027 –0.294 –0.309 JL
ST-12 6/17/2009 0.130 –0.071 0.030 0.101 0.106 –0.268 0.322 0.027 –0.295 –0.310 JL
ST-12 6/17/2009 0.130 –0.070 0.030 0.100 0.105 –0.267 0.320 0.027 –0.294 –0.308 JL
ST-12 6/17/2009 33.8 0.130 –0.071 0.030 0.101 0.106 –0.267 0.320 0.027 –0.294 –0.308 JL
ST-12 6/18/2009 11:39 34.1 0.113 –0.054 0.030 0.084 0.088 –0.291 0.342 0.026 –0.317 –0.332 JL
ST-12 6/18/2009 0.114 –0.054 0.030 0.084 0.088 –0.291 0.344 0.027 –0.318 –0.333 JL
ST-12 6/18/2009 0.114 –0.054 0.030 0.084 0.088 –0.292 0.343 0.026 –0.318 –0.333 JL
ST-12 6/18/2009 34.5 0.113 –0.054 0.030 0.084 0.088 –0.292 0.343 0.026 –0.318 –0.333 JL
ST-12 6/19/2009 12:28 28.1 0.100 –0.042 0.029 0.071 0.075 –0.304 0.356 0.026 –0.330 –0.347 JL
ST-12 6/19/2009 0.103 –0.044 0.030 0.074 0.077 –0.305 0.357 0.026 –0.331 –0.348 JL
ST-12 6/19/2009 0.102 –0.044 0.029 0.073 0.077 –0.304 0.355 0.026 –0.330 –0.346 JL
ST-12 6/19/2009 28.2 0.102 –0.045 0.029 0.074 0.077 –0.305 0.356 0.026 –0.331 –0.347 JL

A-38
Table A-13. Surface Tilt Meter Data for Site 13 (Page 1 of 3)
Site Date Time Temp (°C) X1 X3
(X1+X3) 2
(bias)
(X1-X3) 2
(∆) Tilt1 X2 X4
(X2+X4) 2
(bias)
(X2-X4) 2
(∆) Tilt2
Measured By Remarks
ST-13 5/29/2009 15:52 38.4 0.885 –0.829 0.028 0.857 0.900 0.093 –0.032 0.031 0.063 0.066 BM
ST-13 5/29/2009 0.881 –0.833 0.024 0.857 0.900 0.097 –0.038 0.030 0.068 0.071 BM
ST-13 5/29/2009 0.887 –0.831 0.028 0.859 0.902 0.098 –0.037 0.031 0.068 0.071 BM
ST-13 5/29/2009 0.887 –0.839 0.024 0.863 0.906 0.098 –0.036 0.031 0.067 0.070 BM
ST-13 5/30/2009 12:04 35.6 0.878 –0.825 0.027 0.852 0.894 0.097 –0.036 0.031 0.067 0.070 BM
ST-13 5/30/2009 0.895 –0.832 0.032 0.864 0.907 0.096 –0.034 0.031 0.065 0.068 BM
ST-13 5/30/2009 0.891 –0.828 0.032 0.860 0.902 0.098 –0.040 0.029 0.069 0.072 BM
ST-13 5/30/2009 36.0 0.890 –0.825 0.033 0.858 0.900 0.095 –0.038 0.029 0.067 0.070 BM
ST-13 5/31/2009 10:32 31.0 0.875 –0.820 0.028 0.848 0.890 0.092 –0.038 0.027 0.065 0.068 BM
ST-13 5/31/2009 0.877 –0.822 0.028 0.850 0.892 0.094 –0.043 0.026 0.069 0.072 BM
ST-13 5/31/2009 0.875 –0.825 0.025 0.850 0.893 0.092 –0.042 0.025 0.067 0.070 BM
ST-13 5/31/2009 31.8 0.876 –0.821 0.028 0.849 0.891 0.099 –0.043 0.028 0.071 0.075 BM
ST-13 6/1/2009 13:09 35.8 0.882 –0.818 0.032 0.850 0.893 0.093 –0.032 0.031 0.063 0.066 BM
ST-13 6/1/2009 0.887 –0.826 0.031 0.857 0.899 0.096 –0.036 0.030 0.066 0.069 BM
ST-13 6/1/2009 0.884 –0.827 0.029 0.856 0.898 0.097 –0.037 0.030 0.067 0.070 BM
ST-13 6/1/2009 36.3 0.884 –0.831 0.027 0.858 0.900 0.095 –0.036 0.030 0.066 0.069 BM
ST-13 6/2/2009 16:22 39.1 0.880 –0.834 0.023 0.857 0.900 0.110 –0.039 0.036 0.075 0.078 CF, BM
ST-13 6/2/2009 0.884 –0.828 0.028 0.856 0.899 0.103 –0.039 0.032 0.071 0.075 CF, BM
ST-13 6/2/2009 0.884 –0.828 0.028 0.856 0.899 0.103 –0.039 0.032 0.071 0.075 CF, BM
ST-13 6/2/2009 39.5 0.883 –0.833 0.025 0.858 0.901 0.101 –0.039 0.031 0.070 0.074 CF, BM
ST-13 6/3/2009 11:05 25.8 0.876 –0.820 0.028 0.848 0.890 0.099 –0.038 0.031 0.069 0.072 BM
ST-13 6/3/2009 0.876 –0.820 0.028 0.848 0.890 0.099 –0.036 0.032 0.068 0.071 BM
ST-13 6/3/2009 0.877 –0.823 0.027 0.850 0.893 0.098 –0.040 0.029 0.069 0.072 BM
ST-13 6/3/2009 26.7 0.877 –0.820 0.029 0.849 0.891 0.097 –0.038 0.030 0.068 0.071 BM
ST-13 6/4/2009 12:26 33.4 0.877 –0.820 0.029 0.849 0.891 0.101 –0.030 0.036 0.066 0.069 BM
ST-13 6/4/2009 0.881 –0.823 0.029 0.852 0.895 0.100 –0.035 0.033 0.068 0.071 BM
ST-13 6/4/2009 0.881 –0.823 0.029 0.852 0.895 0.100 –0.036 0.032 0.068 0.071 BM
ST-13 6/4/2009 34.2 0.880 –0.833 0.024 0.857 0.899 0.099 –0.037 0.031 0.068 0.071 BM
ST-13 6/5/2009 11:15 33.0 0.877 –0.820 0.029 0.849 0.891 0.096 –0.038 0.029 0.067 0.070 BM
ST-13 6/5/2009 0.881 –0.822 0.030 0.852 0.894 0.096 –0.041 0.028 0.069 0.072 BM

A-39
Table A-13. Surface Tilt Meter Data for Site 13 (Page 2 of 3)
Site Date Time Temp (°C) X1 X3
(X1+X3) 2
(bias)
(X1-X3) 2
(∆) Tilt1 X2 X4
(X2+X4) 2
(bias)
(X2-X4) 2
(∆) Tilt2
Measured By Remarks
ST-13 6/5/2009 33.5 0.878 –0.824 0.027 0.851 0.894 0.099 –0.040 0.030 0.070 0.073 BM
ST-13 6/6/2009 10:23 35.7 0.876 –0.821 0.028 0.849 0.891 0.103 –0.042 0.031 0.073 0.076 BM
ST-13 6/6/2009 0.872 –0.821 0.026 0.847 0.889 0.103 –0.045 0.029 0.074 0.078 BM
ST-13 6/6/2009 0.874 –0.822 0.026 0.848 0.890 0.101 –0.044 0.029 0.073 0.076 BM
ST-13 6/6/2009 36.1 0.875 –0.823 0.026 0.849 0.891 0.102 –0.045 0.029 0.074 0.077 BM
ST-13 6/7/2009 10:08 29.2 0.869 –0.822 0.024 0.846 0.888 0.092 –0.043 0.025 0.068 0.071 BM
ST-13 6/7/2009 0.869 –0.820 0.025 0.845 0.887 0.096 –0.043 0.027 0.070 0.073 BM
ST-13 6/7/2009 0.870 –0.820 0.025 0.845 0.887 0.099 –0.046 0.027 0.073 0.076 BM
ST-13 6/7/2009 30.4 0.869 –0.819 0.025 0.844 0.886 0.101 –0.047 0.027 0.074 0.078 BM
ST-13 6/8/2009 10:00 24.5 0.871 –0.812 0.030 0.842 0.884 0.097 –0.042 0.028 0.070 0.073 BM
ST-13 6/8/2009 0.870 –0.814 0.028 0.842 0.884 0.102 –0.048 0.027 0.075 0.079 BM
ST-13 6/8/2009 0.872 –0.815 0.029 0.844 0.886 0.104 –0.046 0.029 0.075 0.079 BM
ST-13 6/8/2009 25.4 0.871 –0.815 0.028 0.843 0.885 0.107 –0.048 0.030 0.078 0.081 BM
ST-13 6/9/2009 9:47 30.1 0.871 –0.817 0.027 0.844 0.886 0.109 –0.045 0.032 0.077 0.081 ELK, BM
ST-13 6/9/2009 0.871 –0.818 0.027 0.845 0.887 0.109 –0.049 0.030 0.079 0.083 ELK, BM
ST-13 6/9/2009 0.872 –0.818 0.027 0.845 0.887 0.109 –0.049 0.030 0.079 0.083 ELK, BM
ST-13 6/9/2009 0.872 –0.820 0.026 0.846 0.888 0.110 –0.050 0.030 0.080 0.084 ELK, BM
ST-13 6/10/2009 10:41 26.0 0.874 –0.822 0.026 0.848 0.890 0.105 –0.051 0.027 0.078 0.082 BM
ST-13 6/10/2009 0.874 –0.822 0.026 0.848 0.890 0.107 –0.050 0.029 0.079 0.082 BM
ST-13 6/10/2009 0.874 –0.822 0.026 0.848 0.890 0.106 –0.049 0.029 0.078 0.081 BM
ST-13 6/10/2009 27.7 0.874 –0.822 0.026 0.848 0.890 0.106 –0.050 0.028 0.078 0.082 BM
ST-13 6/11/2009 10:06 25.5 0.868 –0.815 0.027 0.842 0.884 0.105 –0.048 0.029 0.077 0.080 BM, JL, CB
ST-13 6/11/2009 0.868 –0.816 0.026 0.842 0.884 0.106 –0.050 0.028 0.078 0.082 BM, JL, CB
ST-13 6/11/2009 0.868 –0.818 0.025 0.843 0.885 0.106 –0.050 0.028 0.078 0.082 BM, JL, CB
ST-13 6/11/2009 27.1 0.870 –0.817 0.027 0.844 0.886 0.104 –0.050 0.027 0.077 0.081 BM, JL, CB
ST-13 6/12/2009 12:47 33.0 0.873 –0.827 0.023 0.850 0.893 0.111 –0.049 0.031 0.080 0.084 JL
ST-13 6/12/2009 0.875 –0.821 0.027 0.848 0.890 0.116 –0.049 0.034 0.083 0.087 JL
ST-13 6/12/2009 0.874 –0.820 0.027 0.847 0.889 0.116 –0.049 0.034 0.083 0.087 JL
ST-13 6/12/2009 36.9 0.875 –0.819 0.028 0.847 0.889 0.103 –0.049 0.027 0.076 0.080 JL
ST-13 6/13/2009 2:33 28.6 0.875 –0.819 0.028 0.847 0.889 0.113 –0.049 0.032 0.081 0.085 JL

A-40
Table A-13. Surface Tilt Meter Data for Site 13 (Page 3 of 3)
Site Date Time Temp (°C) X1 X3
(X1+X3) 2
(bias)
(X1-X3) 2
(∆) Tilt1 X2 X4
(X2+X4) 2
(bias)
(X2-X4) 2
(∆) Tilt2
Measured By Remarks
ST-13 6/13/2009 0.876 –0.820 0.028 0.848 0.890 0.107 –0.049 0.029 0.078 0.082 JL
ST-13 6/13/2009 0.877 –0.821 0.028 0.849 0.891 0.108 –0.049 0.030 0.079 0.082 JL
ST-13 6/13/2009 31.8 0.876 –0.821 0.028 0.849 0.891 0.108 –0.049 0.030 0.079 0.082 JL
ST-13 6/14/2009 9:15 21.1 0.871 –0.817 0.027 0.844 0.886 0.113 –0.054 0.030 0.084 0.088 JL
ST-13 6/14/2009 0.872 –0.818 0.027 0.845 0.887 0.113 –0.055 0.029 0.084 0.088 JL
ST-13 6/14/2009 0.872 –0.817 0.028 0.845 0.887 0.113 –0.055 0.029 0.084 0.088 JL
ST-13 6/14/2009 22.5 0.872 –0.818 0.027 0.845 0.887 0.114 –0.055 0.030 0.085 0.089 JL
ST-13 6/15/2009 10:35 24.5 0.876 –0.825 0.026 0.851 0.893 0.107 –0.054 0.027 0.081 0.085 JL
ST-13 6/15/2009 0.877 –0.826 0.026 0.852 0.894 0.109 –0.055 0.027 0.082 0.086 JL
ST-13 6/15/2009 0.878 –0.827 0.026 0.853 0.895 0.107 –0.054 0.027 0.081 0.085 JL
ST-13 6/15/2009 26.4 0.878 –0.827 0.026 0.853 0.895 0.108 –0.054 0.027 0.081 0.085 JL
ST-13 6/16/2009 12:50 32.2 0.876 –0.826 0.025 0.851 0.894 0.108 –0.052 0.028 0.080 0.084 JL
ST-13 6/16/2009 0.877 –0.827 0.025 0.852 0.895 0.110 –0.053 0.029 0.082 0.086 JL
ST-13 6/16/2009 0.877 –0.826 0.026 0.852 0.894 0.110 –0.053 0.029 0.082 0.086 JL
ST-13 6/16/2009 34.0 0.877 –0.826 0.026 0.852 0.894 0.111 –0.053 0.029 0.082 0.086 JL
ST-13 6/17/2009 10:45 23.4 0.873 –0.817 0.028 0.845 0.887 0.115 –0.055 0.030 0.085 0.089 JL
ST-13 6/17/2009 0.873 –0.818 0.028 0.846 0.888 0.115 –0.057 0.029 0.086 0.090 JL
ST-13 6/17/2009 0.873 –0.818 0.028 0.846 0.888 0.115 –0.057 0.029 0.086 0.090 JL
ST-13 6/17/2009 24.7 0.873 –0.818 0.028 0.846 0.888 0.115 –0.056 0.030 0.086 0.090 JL
ST-13 6/18/2009 10:00 25.2 0.877 –0.819 0.029 0.848 0.890 0.118 –0.054 0.032 0.086 0.090 JL
ST-13 6/18/2009 0.877 –0.819 0.029 0.848 0.890 0.115 –0.056 0.030 0.086 0.090 JL
ST-13 6/18/2009 0.877 –0.819 0.029 0.848 0.890 0.116 –0.057 0.030 0.087 0.091 JL
ST-13 6/18/2009 26.4 0.877 –0.819 0.029 0.848 0.890 0.116 –0.057 0.030 0.087 0.091 JL
ST-13 6/19/2009 10:41 22.6 0.878 –0.826 0.026 0.852 0.895 0.097 –0.043 0.027 0.070 0.074 JL
ST-13 6/19/2009 0.880 –0.827 0.027 0.854 0.896 0.098 –0.041 0.029 0.070 0.073 JL
ST-13 6/19/2009 0.880 –0.825 0.028 0.853 0.895 0.098 –0.041 0.029 0.070 0.073 JL
ST-13 6/19/2009 23.9 0.880 –0.827 0.027 0.854 0.896 0.098 –0.041 0.029 0.070 0.073 JL
ST-13 6/13/2009 0.876 –0.820 0.028 0.848 0.890 0.107 –0.049 0.029 0.078 0.082 JL

B-1
APPENDIX B
SURFACE TILT METER TIME-SERIES GRAPHS
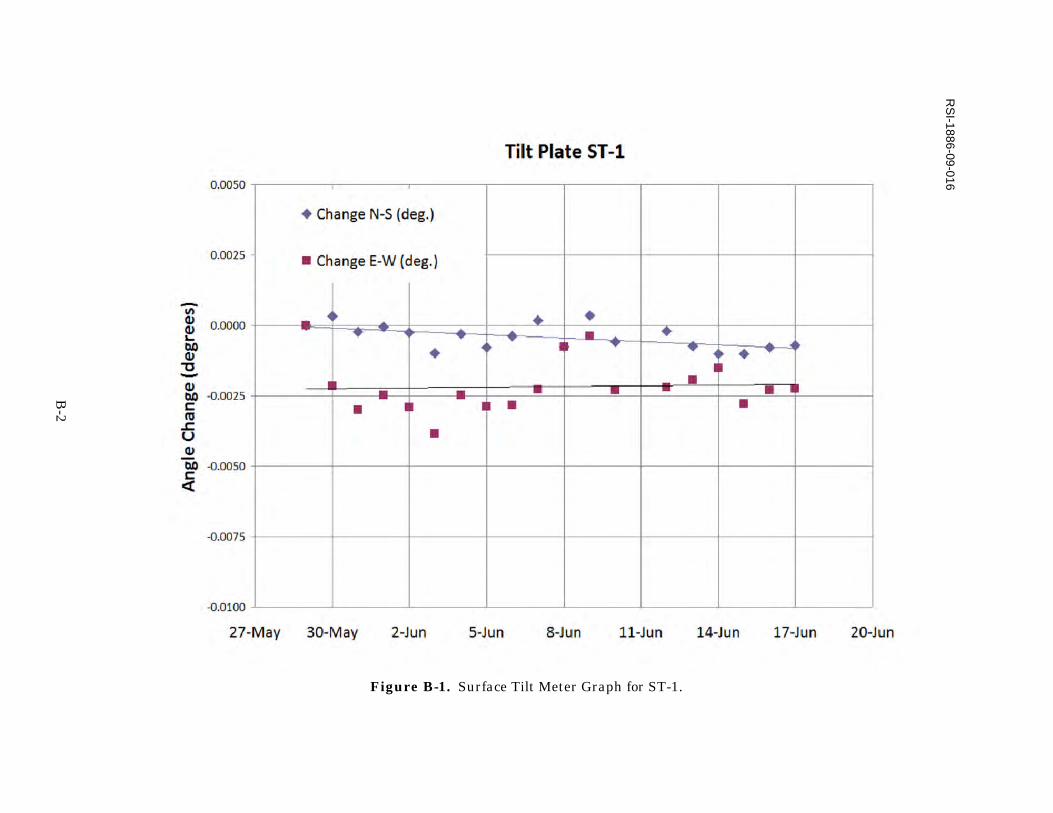
Figure B-1. Surface Tilt Meter Graph for ST-1.
RS
I-1886-09-016
B-2

Figure B-2. Surface Tilt Meter Graph for ST-2.
RS
I-1886-09-017
B-3
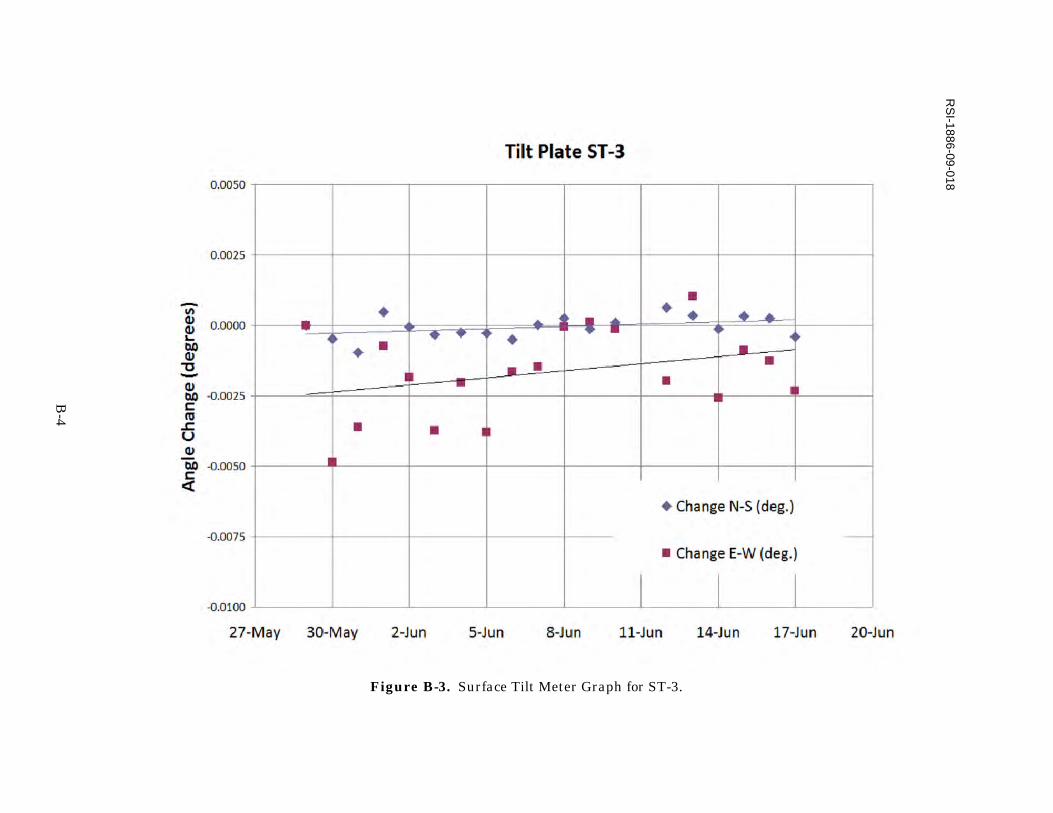
Figure B-3. Surface Tilt Meter Graph for ST-3.
RS
I-1886-09-018
B-4

Figure B-4. Surface Tilt Meter Graph for ST-4.
RS
I-1886-09-019
B-5

Figure B-5. Surface Tilt Meter Graph for ST-5.
RS
I-1886-09-020
B-6

Figure B-6. Surface Tilt Meter Graph for ST-6.
RS
I-1886-09-021
B-7

Figure B-7. Surface Tilt Meter Graph for ST-7.
RS
I-1886-09-022
B-8

Figure B-8. Surface Tilt Meter Graph for ST-8.
RS
I-1886-09-023
B-9

Figure B-9. Surface Tilt Meter Graph for ST-9.
RS
I-1886-09-024
B-10

Figure B-10. Surface Tilt Meter Graph for ST-10.
RS
I-1886-09-025
B-11
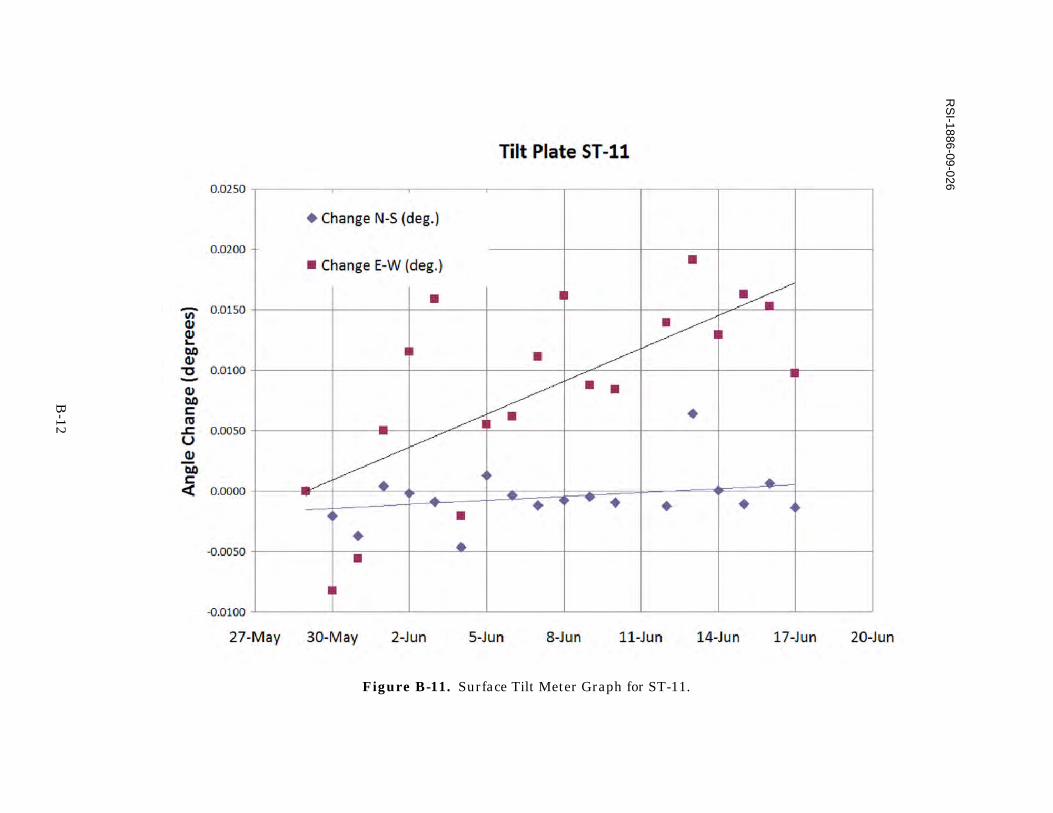
Figure B-11. Surface Tilt Meter Graph for ST-11.
RS
I-1886-09-026
B-12

Figure B-12. Surface Tilt Meter Graph for ST-12.
RS
I-1886-09-027
B-13

Figure B-13. Surface Tilt Meter Graph for ST-13.
RS
I-1886-09-028
B-14
C-1
APPENDIX C
DAILY SURVEY DATA

C-1
May 7, 2009
1 505292.722 576761.913 3129.360 BS3 504777.850 577130.836 3131.724 BM6 504839.447 576173.757 3132.528 BM6 Date: 5/7/2009
101 504802.980 576938.371 3129.654 RBS Time: 9:30 AM102 504851.071 576924.727 3129.625 RBS Operators: WD103 504899.205 576911.141 3129.713 RBS RR104 504946.965 576897.268 3129.795 RBS MG105 505018.149 576877.941 3128.812 RBS Temp: N/A106 505046.466 576868.457 3128.711 RBS Condition: N/A107 505066.248 576864.568 3128.477 RBS Humidity: N/A108 505113.885 576849.562 3128.610 RBS Press: N/A109 505161.767 576835.704 3128.034 RBS Wind: N/A110 505210.047 576822.443 3128.489 RBS111 505253.518 576811.369 3128.636 SEC_C112 505305.984 576794.709 3127.580 RBS113 505356.506 576763.933 3128.685 RBS114 505407.465 576725.421 3132.105 RBS301 505016.717 576773.491 3128.956 RBS302 505031.680 576820.825 3128.733 RBS303 505061.317 576916.317 3128.670 RBS304 505075.942 576963.873 3129.149 RBS N E Elev.5101 504802.938 576938.411 3129.674 -0.042 0.040 0.0205102 504851.064 576924.762 3129.649 -0.007 0.035 0.0245103 504899.184 576911.123 3129.744 -0.021 -0.018 0.0315104 504947.013 576897.296 3129.819 0.048 0.028 0.0245105 505018.173 576877.961 3128.835 0.024 0.020 0.0235106 505046.447 576868.473 3128.728 -0.019 0.016 0.0175107 505066.271 576864.615 3128.511 0.023 0.047 0.0345108 505113.892 576849.595 3128.643 0.007 0.033 0.0335109 505161.795 576835.753 3128.060 0.028 0.049 0.0265110 505210.040 576822.538 3128.539 -0.007 0.095 0.0505111 505253.523 576811.384 3128.654 0.005 0.015 0.0185112 505305.982 576794.727 3127.611 -0.002 0.018 0.0315113 505356.506 576763.959 3128.708 0.000 0.026 0.0235114 505407.492 576725.464 3132.142 0.027 0.043 0.0375301 505016.719 576773.518 3128.957 0.002 0.027 0.0015302 505031.684 576820.827 3128.762 0.004 0.002 0.0295303 505061.344 576916.307 3128.715 0.027 -0.010 0.0455304 505075.955 576963.902 3129.171 0.013 0.029 0.022
0.006 0.027 0.027 Avg-0.042 -0.018 0.001 Min0.048 0.095 0.050 Max
Data Collection Information
Difference Between 5/07/09 Stakeout and 5/06/09 Base Coordinates

C-2
May 8, 2009
1 505292.722 576761.913 3129.360 BS3 504777.850 577130.836 3131.724 BM6 504839.447 576173.757 3132.528 BM6 Date: 5/8/2009
101 504802.980 576938.371 3129.654 RBS Time: 7:30 AM102 504851.071 576924.727 3129.625 RBS Operators: WD103 504899.205 576911.141 3129.713 RBS RR104 504946.965 576897.268 3129.795 RBS105 505018.149 576877.941 3128.812 RBS Temp: N/A106 505046.466 576868.457 3128.711 RBS Condition: N/A107 505066.248 576864.568 3128.477 RBS Humidity: N/A108 505113.885 576849.562 3128.610 RBS Press: N/A109 505161.767 576835.704 3128.034 RBS Wind: N/A110 505210.047 576822.443 3128.489 RBS111 505253.518 576811.369 3128.636 SEC_C112 505305.984 576794.709 3127.580 RBS113 505356.506 576763.933 3128.685 RBS114 505407.465 576725.421 3132.105 RBS301 505016.717 576773.491 3128.956 RBS302 505031.680 576820.825 3128.733 RBS303 505061.317 576916.317 3128.670 RBS304 505075.942 576963.873 3129.149 RBS N E Elev.5101 504802.942 576938.372 3129.663 -0.038 0.001 0.0095102 504851.085 576924.717 3129.642 0.014 -0.010 0.0175103 504899.184 576911.130 3129.740 -0.021 -0.011 0.0275104 504946.990 576897.273 3129.815 0.025 0.005 0.0205105 505018.130 576877.955 3128.829 -0.019 0.014 0.0175106 505046.453 576868.473 3128.740 -0.013 0.016 0.0295107 505066.232 576864.603 3128.501 -0.016 0.035 0.0245108 505113.883 576849.555 3128.645 -0.002 -0.007 0.0355109 505161.847 576835.740 3128.059 0.080 0.036 0.0255110 505210.025 576822.510 3128.543 -0.022 0.067 0.0545111 505253.470 576811.413 3128.666 -0.048 0.044 0.0305112 505305.962 576794.714 3127.609 -0.022 0.005 0.0295113 505356.512 576763.959 3128.724 0.006 0.026 0.0395114 505407.477 576725.452 3132.146 0.012 0.031 0.0415301 505016.779 576773.486 3128.991 0.062 -0.005 0.0355302 505031.699 576820.807 3128.765 0.019 -0.018 0.0325303 505061.334 576916.278 3128.696 0.017 -0.039 0.0265304 505075.957 576963.876 3129.179 0.015 0.003 0.030
0.003 0.011 0.029 Avg-0.048 -0.039 0.009 Min0.080 0.067 0.054 Max
Data Collection Information
Difference Between 5/08/09 Stakeout and 5/06/09 Base Coordinates
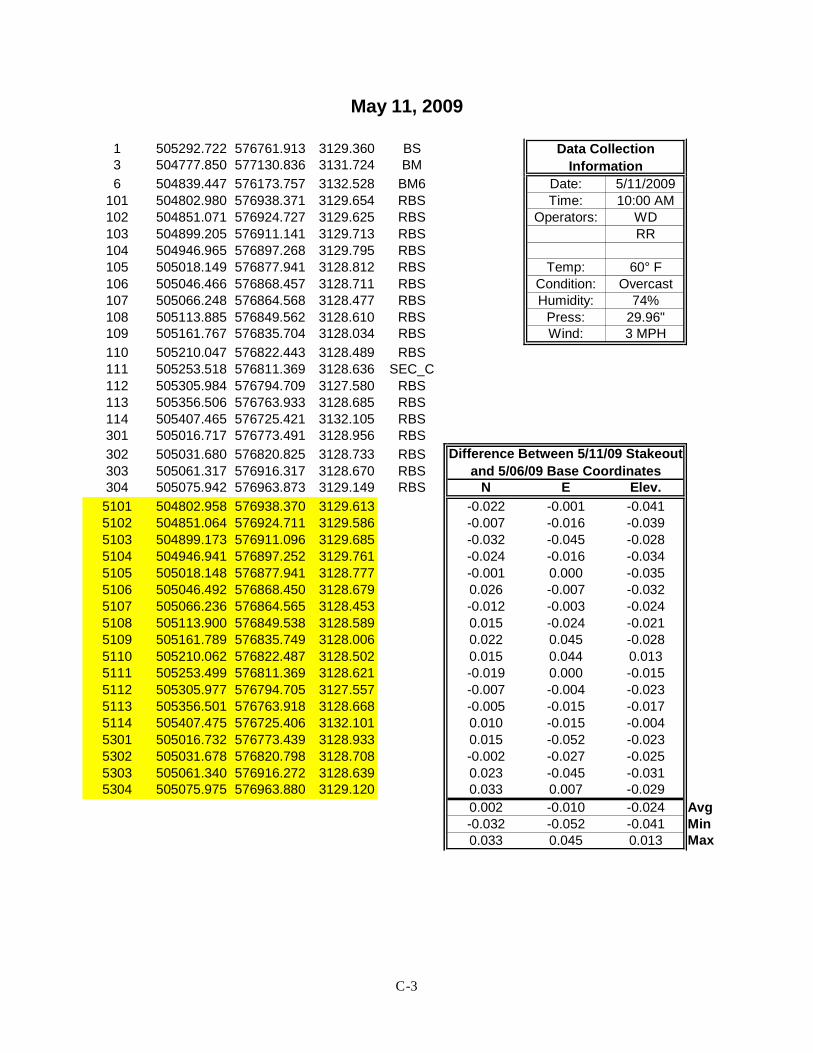
C-3
May 11, 2009
1 505292.722 576761.913 3129.360 BS3 504777.850 577130.836 3131.724 BM6 504839.447 576173.757 3132.528 BM6 Date: 5/11/2009
101 504802.980 576938.371 3129.654 RBS Time: 10:00 AM102 504851.071 576924.727 3129.625 RBS Operators: WD103 504899.205 576911.141 3129.713 RBS RR104 504946.965 576897.268 3129.795 RBS105 505018.149 576877.941 3128.812 RBS Temp: 60° F106 505046.466 576868.457 3128.711 RBS Condition: Overcast107 505066.248 576864.568 3128.477 RBS Humidity: 74%108 505113.885 576849.562 3128.610 RBS Press: 29.96"109 505161.767 576835.704 3128.034 RBS Wind: 3 MPH110 505210.047 576822.443 3128.489 RBS111 505253.518 576811.369 3128.636 SEC_C112 505305.984 576794.709 3127.580 RBS113 505356.506 576763.933 3128.685 RBS114 505407.465 576725.421 3132.105 RBS301 505016.717 576773.491 3128.956 RBS302 505031.680 576820.825 3128.733 RBS303 505061.317 576916.317 3128.670 RBS304 505075.942 576963.873 3129.149 RBS N E Elev.5101 504802.958 576938.370 3129.613 -0.022 -0.001 -0.0415102 504851.064 576924.711 3129.586 -0.007 -0.016 -0.0395103 504899.173 576911.096 3129.685 -0.032 -0.045 -0.0285104 504946.941 576897.252 3129.761 -0.024 -0.016 -0.0345105 505018.148 576877.941 3128.777 -0.001 0.000 -0.0355106 505046.492 576868.450 3128.679 0.026 -0.007 -0.0325107 505066.236 576864.565 3128.453 -0.012 -0.003 -0.0245108 505113.900 576849.538 3128.589 0.015 -0.024 -0.0215109 505161.789 576835.749 3128.006 0.022 0.045 -0.0285110 505210.062 576822.487 3128.502 0.015 0.044 0.0135111 505253.499 576811.369 3128.621 -0.019 0.000 -0.0155112 505305.977 576794.705 3127.557 -0.007 -0.004 -0.0235113 505356.501 576763.918 3128.668 -0.005 -0.015 -0.0175114 505407.475 576725.406 3132.101 0.010 -0.015 -0.0045301 505016.732 576773.439 3128.933 0.015 -0.052 -0.0235302 505031.678 576820.798 3128.708 -0.002 -0.027 -0.0255303 505061.340 576916.272 3128.639 0.023 -0.045 -0.0315304 505075.975 576963.880 3129.120 0.033 0.007 -0.029
0.002 -0.010 -0.024 Avg-0.032 -0.052 -0.041 Min0.033 0.045 0.013 Max
Data Collection Information
Difference Between 5/11/09 Stakeout and 5/06/09 Base Coordinates

C-4
May 12, 2009
1 505292.722 576761.913 3129.360 BS3 504777.850 577130.836 3131.724 BM6 504839.447 576173.757 3132.528 BM6 Date: 5/12/2009
101 504802.980 576938.371 3129.654 RBS Time: 8:15 AM102 504851.071 576924.727 3129.625 RBS Operators: WD103 504899.205 576911.141 3129.713 RBS RR104 504946.965 576897.268 3129.795 RBS105 505018.149 576877.941 3128.812 RBS Temp: 68° F106 505046.466 576868.457 3128.711 RBS Condition: Sunny107 505066.248 576864.568 3128.477 RBS Humidity: 66%108 505113.885 576849.562 3128.610 RBS Press: 29.71"109 505161.767 576835.704 3128.034 RBS Wind: 6 mph/S110 505210.047 576822.443 3128.489 RBS111 505253.518 576811.369 3128.636 SEC_C112 505305.984 576794.709 3127.580 RBS113 505356.506 576763.933 3128.685 RBS114 505407.465 576725.421 3132.105 RBS301 505016.717 576773.491 3128.956 RBS302 505031.680 576820.825 3128.733 RBS303 505061.317 576916.317 3128.670 RBS304 505075.942 576963.873 3129.149 RBS N E Elev.5101 504802.958 576938.426 3129.664 -0.022 0.055 0.0105102 504851.065 576924.748 3129.634 -0.006 0.021 0.0095103 504899.154 576911.131 3129.735 -0.051 -0.010 0.0225104 504946.982 576897.282 3129.809 0.017 0.014 0.0145105 505018.160 576877.973 3128.827 0.011 0.032 0.0155106 505046.496 576868.461 3128.724 0.030 0.004 0.0135107 505066.237 576864.574 3128.506 -0.011 0.006 0.0295108 505113.871 576849.557 3128.636 -0.014 -0.005 0.0265109 505161.784 576835.750 3128.054 0.017 0.046 0.0205110 505210.058 576822.497 3128.535 0.011 0.054 0.0465111 505253.517 576811.377 3128.653 -0.001 0.008 0.0175112 505305.990 576794.714 3127.602 0.006 0.005 0.0225113 505356.529 576763.979 3128.701 0.023 0.046 0.0165114 505407.480 576725.450 3132.140 0.015 0.029 0.0355301 505016.781 576773.423 3128.950 0.064 -0.068 -0.0065302 505031.697 576820.833 3128.759 0.017 0.008 0.0265303 505061.366 576916.306 3128.688 0.049 -0.011 0.0185304 505075.968 576963.908 3129.174 0.026 0.035 0.025
0.010 0.015 0.020 Avg-0.051 -0.068 -0.006 Min0.064 0.055 0.046 Max
Data Collection Information
Difference Between 5/12/09 Stakeout and 5/06/09 Base Coordinates

C-5
May 13, 2009
1 505292.722 576761.913 3129.360 BS3 504777.850 577130.836 3131.724 BM6 504839.447 576173.757 3132.528 BM6 Date: 5/13/2009
101 504802.980 576938.371 3129.654 RBS Time: 9:00 AM102 504851.071 576924.727 3129.625 RBS Operators: WD103 504899.205 576911.141 3129.713 RBS RR104 504946.965 576897.268 3129.795 RBS105 505018.149 576877.941 3128.812 RBS Temp: 73° F106 505046.466 576868.457 3128.711 RBS Condition: Sunny107 505066.248 576864.568 3128.477 RBS Humidity: 55%108 505113.885 576849.562 3128.610 RBS Press: 29.58"109 505161.767 576835.704 3128.034 RBS Wind: 2 mph/SSE110 505210.047 576822.443 3128.489 RBS111 505253.518 576811.369 3128.636 SEC_C112 505305.984 576794.709 3127.580 RBS113 505356.506 576763.933 3128.685 RBS114 505407.465 576725.421 3132.105 RBS301 505016.717 576773.491 3128.956 RBS302 505031.680 576820.825 3128.733 RBS303 505061.317 576916.317 3128.670 RBS304 505075.942 576963.873 3129.149 RBS N E Elev.
5101 504802.939 576938.377 3129.657 -0.041 0.006 0.0035102 504851.063 576924.741 3129.632 -0.008 0.014 0.0075103 504899.177 576911.108 3129.731 -0.028 -0.033 0.0185104 504946.968 576897.270 3129.808 0.003 0.002 0.0135105 505018.145 576877.956 3128.817 -0.004 0.015 0.0055106 505046.480 576868.451 3128.731 0.014 -0.006 0.0205107 505066.241 576864.584 3128.509 -0.007 0.016 0.0325108 505113.875 576849.545 3128.644 -0.010 -0.017 0.0345109 505161.790 576835.739 3128.057 0.023 0.035 0.0235110 505210.073 576822.517 3128.546 0.026 0.074 0.0575111 505253.495 576811.369 3128.668 -0.023 0.000 0.0325112 505306.008 576794.703 3127.609 0.024 -0.006 0.0295113 505356.466 576763.933 3128.731 -0.040 0.000 0.0465114 505407.454 576725.407 3132.138 -0.011 -0.014 0.0335301 505016.733 576773.480 3128.972 0.016 -0.011 0.0165302 505031.703 576820.804 3128.760 0.023 -0.021 0.0275303 505061.325 576916.259 3128.690 0.008 -0.058 0.0205304 505075.960 576963.851 3129.176 0.018 -0.022 0.027
-0.001 -0.001 0.025 Avg-0.041 -0.058 0.003 Min0.026 0.074 0.057 Max
Data Collection Information
Difference Between 5/13/09 Stakeout and 5/06/09 Base Coordinates

C-6
May 14, 2009
1 505292.722 576761.913 3129.360 BS3 504777.850 577130.836 3131.724 BM6 504839.447 576173.757 3132.528 BM6 Date: 5/14/2009
101 504802.980 576938.371 3129.654 RBS Time: 7:30 AM102 504851.071 576924.727 3129.625 RBS Operators: WD103 504899.205 576911.141 3129.713 RBS RR104 504946.965 576897.268 3129.795 RBS105 505018.149 576877.941 3128.812 RBS Temp: 62° F106 505046.466 576868.457 3128.711 RBS Condition: Sunny107 505066.248 576864.568 3128.477 RBS Humidity: 33%108 505113.885 576849.562 3128.610 RBS Press: 29.89"109 505161.767 576835.704 3128.034 RBS Wind: 15 mph/NNW110 505210.047 576822.443 3128.489 RBS111 505253.518 576811.369 3128.636 SEC_C112 505305.984 576794.709 3127.580 RBS113 505356.506 576763.933 3128.685 RBS114 505407.465 576725.421 3132.105 RBS301 505016.717 576773.491 3128.956 RBS302 505031.680 576820.825 3128.733 RBS303 505061.317 576916.317 3128.670 RBS304 505075.942 576963.873 3129.149 RBS N E Elev.
5101 504802.937 576938.373 3129.663 -0.043 0.002 0.0095102 504851.077 576924.715 3129.632 0.006 -0.012 0.0075103 504899.153 576911.103 3129.735 -0.052 -0.038 0.0225104 504946.979 576897.255 3129.808 0.014 -0.013 0.0135105 505018.143 576877.902 3128.827 -0.006 -0.039 0.0155106 505046.490 576868.449 3128.724 0.024 -0.008 0.0135107 505066.236 576864.565 3128.506 -0.012 -0.003 0.0295108 505113.894 576849.538 3128.645 0.009 -0.024 0.0355109 505161.787 576835.730 3128.061 0.020 0.026 0.0275110 505210.064 576822.480 3128.540 0.017 0.037 0.0515111 505253.501 576811.398 3128.669 -0.017 0.029 0.0335112 505305.998 576794.681 3127.602 0.014 -0.028 0.0225113 505356.514 576763.926 3128.711 0.008 -0.007 0.0265114 505407.487 576725.433 3132.151 0.022 0.012 0.0465301 505016.751 576773.433 3128.986 0.034 -0.058 0.0305302 505031.678 576820.792 3128.759 -0.002 -0.033 0.0265303 505061.336 576916.259 3128.688 0.019 -0.058 0.0185304 505075.968 576963.858 3129.173 0.026 -0.015 0.024
0.004 -0.013 0.025 Avg-0.052 -0.058 0.007 Min0.034 0.037 0.051 Max
Data Collection Information
Difference Between 5/14/09 Stakeout and 5/06/09 Base Coordinates

C-7
May 15, 2009
1 505292.722 576761.913 3129.360 BS3 504777.850 577130.836 3131.724 BM6 504839.447 576173.757 3132.528 BM6 Date: 5/15/2009
101 504802.980 576938.371 3129.654 RBS Time: 7:30 AM102 504851.071 576924.727 3129.625 RBS Operators: WD103 504899.205 576911.141 3129.713 RBS RR104 504946.965 576897.268 3129.795 RBS105 505018.149 576877.941 3128.812 RBS Temp: 70° F106 505046.466 576868.457 3128.711 RBS Condition: Overcast107 505066.248 576864.568 3128.477 RBS Humidity: 67%108 505113.885 576849.562 3128.610 RBS Press: 29.68"109 505161.767 576835.704 3128.034 RBS Wind: 3 mph/S110 505210.047 576822.443 3128.489 RBS111 505253.518 576811.369 3128.636 SEC_C112 505305.984 576794.709 3127.580 RBS113 505356.506 576763.933 3128.685 RBS114 505407.465 576725.421 3132.105 RBS301 505016.717 576773.491 3128.956 RBS302 505031.680 576820.825 3128.733 RBS303 505061.317 576916.317 3128.670 RBS304 505075.942 576963.873 3129.149 RBS N E Elev.
5101 504802.996 576938.365 3129.673 0.016 -0.006 0.0195102 504851.076 576924.725 3129.646 0.005 -0.002 0.0215103 504899.175 576911.108 3129.746 -0.030 -0.033 0.0335104 504946.962 576897.266 3129.821 -0.003 -0.002 0.0265105 505018.151 576877.935 3128.838 0.002 -0.006 0.0265106 505046.473 576868.445 3128.741 0.007 -0.012 0.0305107 505066.249 576864.571 3128.514 0.001 0.003 0.0375108 505113.874 576849.529 3128.654 -0.011 -0.033 0.0445109 505161.780 576835.744 3128.071 0.013 0.040 0.0375110 505210.049 576822.493 3128.554 0.002 0.050 0.0655111 505253.499 576811.376 3128.681 -0.019 0.007 0.0455112 505305.980 576794.688 3127.626 -0.004 -0.021 0.0465113 505356.489 576763.942 3128.724 -0.017 0.009 0.0395114 505407.459 576725.407 3132.161 -0.006 -0.014 0.0565301 505016.739 576773.455 3128.988 0.022 -0.036 0.0325302 505031.683 576820.814 3128.768 0.003 -0.011 0.0355303 505061.334 576916.280 3128.699 0.017 -0.037 0.0295304 505075.980 576963.846 3129.182 0.038 -0.027 0.033
0.002 -0.007 0.036 Avg-0.030 -0.037 0.019 Min0.038 0.050 0.065 Max
Data Collection Information
Difference Between 5/15/09 Stakeout and 5/06/09 Base Coordinates

C-8
May 18, 2009
1 505292.722 576761.913 3129.360 BS3 504777.850 577130.836 3131.724 BM6 504839.447 576173.757 3132.528 BM6 Date: 5/18/2009
101 504802.980 576938.371 3129.654 RBS Time: 7:15 AM102 504851.071 576924.727 3129.625 RBS Operators: WD103 504899.205 576911.141 3129.713 RBS RR104 504946.965 576897.268 3129.795 RBS105 505018.149 576877.941 3128.812 RBS Temp: 60° F106 505046.466 576868.457 3128.711 RBS Condition: Sunny107 505066.248 576864.568 3128.477 RBS Humidity: 47%108 505113.885 576849.562 3128.610 RBS Press: 30.05"109 505161.767 576835.704 3128.034 RBS Wind: 3 mph/ESE110 505210.047 576822.443 3128.489 RBS111 505253.518 576811.369 3128.636 SEC_C112 505305.984 576794.709 3127.580 RBS113 505356.506 576763.933 3128.685 RBS114 505407.465 576725.421 3132.105 RBS301 505016.717 576773.491 3128.956 RBS302 505031.680 576820.825 3128.733 RBS303 505061.317 576916.317 3128.670 RBS304 505075.942 576963.873 3129.149 RBS N E Elev.
5101 504802.975 576938.377 3129.669 -0.005 0.006 0.0155102 504851.101 576924.723 3129.643 0.030 -0.004 0.0185103 504899.195 576911.125 3129.739 -0.010 -0.016 0.0265104 504946.993 576897.276 3129.822 0.028 0.008 0.0275105 505018.200 576877.989 3128.837 0.051 0.048 0.0255106 505046.525 576868.491 3128.735 0.059 0.034 0.0245107 505066.298 576864.609 3128.513 0.050 0.041 0.0365108 505113.937 576849.582 3128.644 0.052 0.020 0.0345109 505161.777 576835.732 3128.062 0.010 0.028 0.0285110 505210.043 576822.485 3128.543 -0.004 0.042 0.0545111 505253.509 576811.383 3128.658 -0.009 0.014 0.0225112 505305.988 576794.683 3127.615 0.004 -0.026 0.0355113 505356.510 576763.929 3128.711 0.004 -0.004 0.0265114 505407.471 576725.408 3132.134 0.006 -0.013 0.0295301 505016.740 576773.461 3128.984 0.023 -0.030 0.0285302 505031.686 576820.791 3128.758 0.006 -0.034 0.0255303 505061.325 576916.276 3128.690 0.008 -0.041 0.0205304 505075.976 576963.860 3129.182 0.034 -0.013 0.033
0.019 0.003 0.028 Avg-0.010 -0.041 0.015 Min0.059 0.048 0.054 Max
Difference Between 5/18/09 Stakeout and 5/06/09 Base Coordinates
Data Collection Information

C-9
May 19, 2009
1 505292.722 576761.913 3129.360 BS3 504777.850 577130.836 3131.724 BM6 504839.447 576173.757 3132.528 BM6 Date: 5/19/2009
101 504802.980 576938.371 3129.654 RBS Time: 7:30 AM102 504851.071 576924.727 3129.625 RBS Operators: WD103 504899.205 576911.141 3129.713 RBS RR104 504946.965 576897.268 3129.795 RBS CB105 505018.149 576877.941 3128.812 RBS Temp: 64° F106 505046.466 576868.457 3128.711 RBS Condition: Sunny107 505066.248 576864.568 3128.477 RBS Humidity: 50%108 505113.885 576849.562 3128.610 RBS Press: 30.00"109 505161.767 576835.704 3128.034 RBS Wind: 8 mph/SE110 505210.047 576822.443 3128.489 RBS111 505253.518 576811.369 3128.636 SEC_C112 505305.984 576794.709 3127.580 RBS113 505356.506 576763.933 3128.685 RBS114 505407.465 576725.421 3132.105 RBS301 505016.717 576773.491 3128.956 RBS302 505031.680 576820.825 3128.733 RBS303 505061.317 576916.317 3128.670 RBS304 505075.942 576963.873 3129.149 RBS N E Elev.
5101 504802.960 576938.375 3129.656 -0.020 0.004 0.0025102 504851.081 576924.727 3129.629 0.010 0.000 0.0045103 504899.183 576911.107 3129.727 -0.022 -0.034 0.0145104 504947.009 576897.288 3129.800 0.044 0.020 0.0055105 505018.187 576877.935 3128.813 0.038 -0.006 0.0015106 505046.502 576868.460 3128.717 0.036 0.003 0.0065107 505066.252 576864.574 3128.495 0.004 0.006 0.0185108 505113.908 576849.546 3128.631 0.023 -0.016 0.0215109 505161.805 576835.760 3128.040 0.038 0.056 0.0065110 505210.047 576822.507 3128.527 0.000 0.064 0.0385111 505253.521 576811.391 3128.655 0.003 0.022 0.0195112 505306.007 576794.711 3127.601 0.023 0.002 0.0215113 505356.504 576763.956 3128.704 -0.002 0.023 0.0195114 505407.475 576725.432 3132.153 0.010 0.011 0.0485301 505016.730 576773.460 3128.969 0.013 -0.031 0.0135302 505031.695 576820.817 3128.745 0.015 -0.008 0.0125303 505061.320 576916.295 3128.673 0.003 -0.022 0.0035304 505075.995 576963.874 3129.167 0.053 0.001 0.018
0.015 0.005 0.015 Avg-0.022 -0.034 0.001 Min0.053 0.064 0.048 Max
Data Collection Information
Difference Between 5/19/09 Stakeout and 5/06/09 Base Coordinates

C-10
May 20, 2009
1 505292.722 576761.913 3129.360 BS3 504777.850 577130.836 3131.724 BM6 504839.447 576173.757 3132.528 BM6 Date: 5/20/2009
101 504802.980 576938.371 3129.654 RBS Time: 7:30 AM102 504851.071 576924.727 3129.625 RBS Operators: WD103 504899.205 576911.141 3129.713 RBS RR104 504946.965 576897.268 3129.795 RBS CB105 505018.149 576877.941 3128.812 RBS Temp: 62° F106 505046.466 576868.457 3128.711 RBS Condition: Sunny107 505066.248 576864.568 3128.477 RBS Humidity: 44%108 505113.885 576849.562 3128.610 RBS Press: 29.91"109 505161.767 576835.704 3128.034 RBS Wind: 3 mph/SSE110 505210.047 576822.443 3128.489 RBS111 505253.518 576811.369 3128.636 SEC_C112 505305.984 576794.709 3127.580 RBS113 505356.506 576763.933 3128.685 RBS114 505407.465 576725.421 3132.105 RBS301 505016.717 576773.491 3128.956 RBS302 505031.680 576820.825 3128.733 RBS303 505061.317 576916.317 3128.670 RBS304 505075.942 576963.873 3129.149 RBS N E Elev.5101 504802.948 576938.367 3129.657 -0.032 -0.004 0.0035102 504851.063 576924.724 3129.628 -0.008 -0.003 0.0035103 504899.185 576911.118 3129.727 -0.020 -0.023 0.0145104 504946.931 576897.243 3129.804 -0.034 -0.025 0.0095105 505018.145 576877.922 3128.819 -0.004 -0.019 0.0075106 505046.477 576868.439 3128.718 0.011 -0.018 0.0075107 505066.237 576864.564 3128.496 -0.011 -0.004 0.0195108 505113.896 576849.530 3128.632 0.011 -0.032 0.0225109 505161.801 576835.745 3128.046 0.034 0.041 0.0125110 505210.055 576822.474 3128.518 0.008 0.031 0.0295111 505253.506 576811.368 3128.655 -0.012 -0.001 0.0195112 505306.009 576794.685 3127.603 0.025 -0.024 0.0235113 505356.483 576763.922 3128.694 -0.023 -0.011 0.0095114 505407.465 576725.404 3132.140 0.000 -0.017 0.0355301 505016.730 576773.453 3128.972 0.013 -0.038 0.0165302 505031.661 576820.788 3128.747 -0.019 -0.037 0.0145303 505061.321 576916.294 3128.675 0.004 -0.023 0.0055304 505075.968 576963.885 3129.162 0.026 0.012 0.013
-0.002 -0.011 0.014 Avg-0.034 -0.038 0.003 Min0.034 0.041 0.035 Max
Data Collection Information
Difference Between 5/20/09 Stakeout and 5/06/09 Base Coordinates
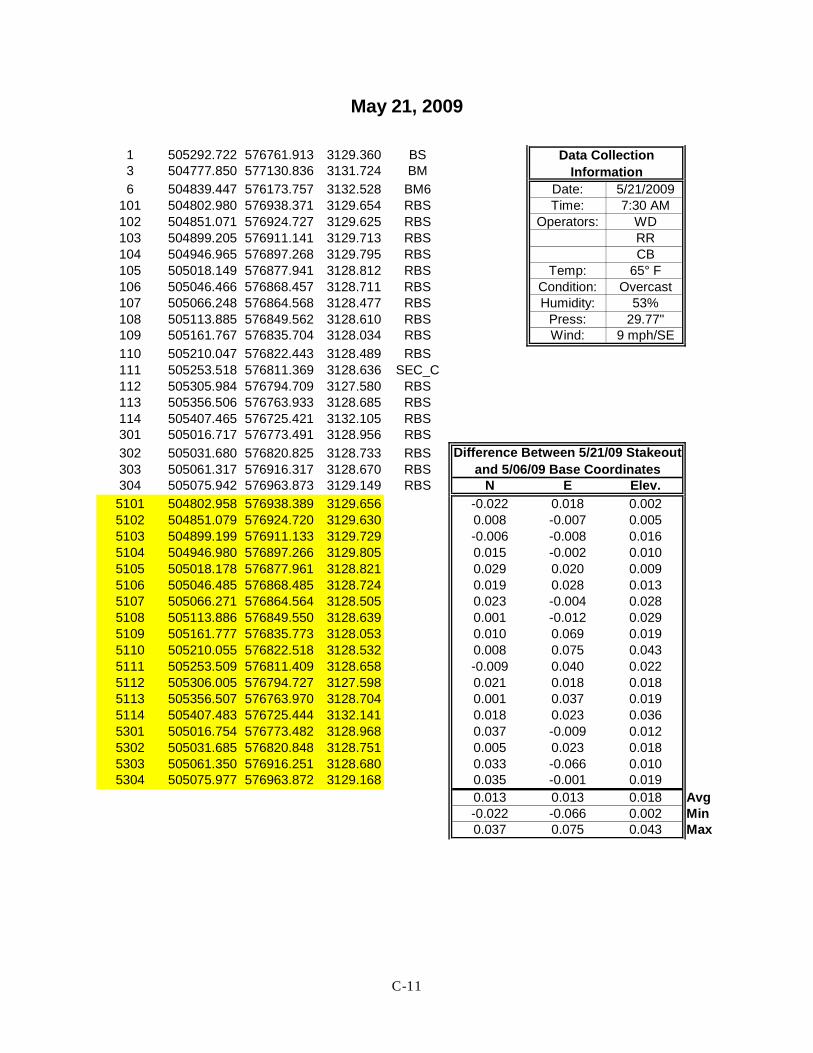
C-11
May 21, 2009
1 505292.722 576761.913 3129.360 BS3 504777.850 577130.836 3131.724 BM6 504839.447 576173.757 3132.528 BM6 Date: 5/21/2009
101 504802.980 576938.371 3129.654 RBS Time: 7:30 AM102 504851.071 576924.727 3129.625 RBS Operators: WD103 504899.205 576911.141 3129.713 RBS RR104 504946.965 576897.268 3129.795 RBS CB105 505018.149 576877.941 3128.812 RBS Temp: 65° F106 505046.466 576868.457 3128.711 RBS Condition: Overcast107 505066.248 576864.568 3128.477 RBS Humidity: 53%108 505113.885 576849.562 3128.610 RBS Press: 29.77"109 505161.767 576835.704 3128.034 RBS Wind: 9 mph/SE110 505210.047 576822.443 3128.489 RBS111 505253.518 576811.369 3128.636 SEC_C112 505305.984 576794.709 3127.580 RBS113 505356.506 576763.933 3128.685 RBS114 505407.465 576725.421 3132.105 RBS301 505016.717 576773.491 3128.956 RBS302 505031.680 576820.825 3128.733 RBS303 505061.317 576916.317 3128.670 RBS304 505075.942 576963.873 3129.149 RBS N E Elev.5101 504802.958 576938.389 3129.656 -0.022 0.018 0.0025102 504851.079 576924.720 3129.630 0.008 -0.007 0.0055103 504899.199 576911.133 3129.729 -0.006 -0.008 0.0165104 504946.980 576897.266 3129.805 0.015 -0.002 0.0105105 505018.178 576877.961 3128.821 0.029 0.020 0.0095106 505046.485 576868.485 3128.724 0.019 0.028 0.0135107 505066.271 576864.564 3128.505 0.023 -0.004 0.0285108 505113.886 576849.550 3128.639 0.001 -0.012 0.0295109 505161.777 576835.773 3128.053 0.010 0.069 0.0195110 505210.055 576822.518 3128.532 0.008 0.075 0.0435111 505253.509 576811.409 3128.658 -0.009 0.040 0.0225112 505306.005 576794.727 3127.598 0.021 0.018 0.0185113 505356.507 576763.970 3128.704 0.001 0.037 0.0195114 505407.483 576725.444 3132.141 0.018 0.023 0.0365301 505016.754 576773.482 3128.968 0.037 -0.009 0.0125302 505031.685 576820.848 3128.751 0.005 0.023 0.0185303 505061.350 576916.251 3128.680 0.033 -0.066 0.0105304 505075.977 576963.872 3129.168 0.035 -0.001 0.019
0.013 0.013 0.018 Avg-0.022 -0.066 0.002 Min0.037 0.075 0.043 Max
Data Collection Information
Difference Between 5/21/09 Stakeout and 5/06/09 Base Coordinates

C-12
May 22, 2009
1 505292.722 576761.913 3129.360 BS3 504777.850 577130.836 3131.724 BM6 504839.447 576173.757 3132.528 BM6 Date: 5/22/2009
101 504802.980 576938.371 3129.654 RBS Time: 7:30 AM102 504851.071 576924.727 3129.625 RBS Operators: WD103 504899.205 576911.141 3129.713 RBS RR104 504946.965 576897.268 3129.795 RBS CB105 505018.149 576877.941 3128.812 RBS Temp: 63° F106 505046.466 576868.457 3128.711 RBS Condition: Overcast107 505066.248 576864.568 3128.477 RBS Humidity: 83%108 505113.885 576849.562 3128.610 RBS Press: 29.84"109 505161.767 576835.704 3128.034 RBS Wind: 9 mph/E110 505210.047 576822.443 3128.489 RBS111 505253.518 576811.369 3128.636 SEC_C112 505305.984 576794.709 3127.580 RBS113 505356.506 576763.933 3128.685 RBS114 505407.465 576725.421 3132.105 RBS301 505016.717 576773.491 3128.956 RBS302 505031.680 576820.825 3128.733 RBS303 505061.317 576916.317 3128.670 RBS304 505075.942 576963.873 3129.149 RBS N E Elev.
5101 504802.965 576938.375 3129.655 -0.015 0.004 0.0015102 504851.102 576924.728 3129.629 0.031 0.001 0.0045103 504899.169 576911.110 3129.727 -0.036 -0.031 0.0145104 504947.010 576897.276 3129.804 0.045 0.008 0.0095105 505018.183 576877.944 3128.826 0.034 0.003 0.0145106 505046.503 576868.459 3128.726 0.037 0.002 0.0155107 505066.258 576864.579 3128.501 0.010 0.011 0.0245108 505113.895 576849.537 3128.640 0.010 -0.025 0.0305109 505161.789 576835.746 3128.055 0.022 0.042 0.0215110 505210.082 576822.495 3128.539 0.035 0.052 0.0505111 505253.513 576811.387 3128.661 -0.005 0.018 0.0255112 505306.012 576794.690 3127.609 0.028 -0.019 0.0295113 505356.496 576763.953 3128.714 -0.010 0.020 0.0295114 505407.483 576725.414 3132.149 0.018 -0.007 0.0445301 505016.766 576773.460 3128.969 0.049 -0.031 0.0135302 505031.695 576820.817 3128.751 0.015 -0.008 0.0185303 505061.354 576916.263 3128.683 0.037 -0.054 0.0135304 505075.986 576963.866 3129.171 0.044 -0.007 0.022
0.019 -0.001 0.021 Avg-0.036 -0.054 0.001 Min0.049 0.052 0.050 Max
Data Collection Information
Difference Between 5/22/09 Stakeout and 5/06/09 Base

C-13
May 26, 2009
1 505292.722 576761.913 3129.360 BS3 504777.850 577130.836 3131.724 BM6 504839.447 576173.757 3132.528 BM6 Date: 5/26/2009
101 504802.980 576938.371 3129.654 RBS Time: 8:00 AM102 504851.071 576924.727 3129.625 RBS Operators: WD103 504899.205 576911.141 3129.713 RBS RR104 504946.965 576897.268 3129.795 RBS105 505018.149 576877.941 3128.812 RBS Temp: 72° F106 505046.466 576868.457 3128.711 RBS Condition: Clear107 505066.248 576864.568 3128.477 RBS Humidity: 47%108 505113.885 576849.562 3128.610 RBS Press: 29.67"109 505161.767 576835.704 3128.034 RBS Wind: 8 mph/NNW110 505210.047 576822.443 3128.489 RBS111 505253.518 576811.369 3128.636 SEC_C112 505305.984 576794.709 3127.580 RBS113 505356.506 576763.933 3128.685 RBS114 505407.465 576725.421 3132.105 RBS301 505016.717 576773.491 3128.956 RBS302 505031.680 576820.825 3128.733 RBS303 505061.317 576916.317 3128.670 RBS304 505075.942 576963.873 3129.149 RBS N E Elev.
5101 504802.951 576938.392 3129.664 -0.029 0.021 0.0105102 504851.096 576924.751 3129.636 0.025 0.024 0.0115103 504899.175 576911.106 3129.735 -0.030 -0.035 0.0225104 504947.012 576897.283 3129.811 0.047 0.015 0.0165105 505018.173 576877.939 3128.830 0.024 -0.002 0.0185106 505046.466 576868.455 3128.733 0.000 -0.002 0.0225107 505066.271 576864.577 3128.507 0.023 0.009 0.0305108 505113.894 576849.596 3128.646 0.009 0.034 0.0365109 505161.791 576835.763 3128.052 0.024 0.059 0.0185110 505210.010 576822.487 3128.545 -0.037 0.044 0.0565111 505253.514 576811.396 3128.663 -0.004 0.027 0.0275112 505305.983 576794.708 3127.606 -0.001 -0.001 0.0265113 505356.522 576763.937 3128.709 0.016 0.004 0.0245114 505407.489 576725.449 3132.147 0.024 0.028 0.0425301 505016.759 576773.489 3128.991 0.042 -0.002 0.0355302 505031.714 576820.824 3128.747 0.034 -0.001 0.0145303 505061.342 576916.270 3128.677 0.025 -0.047 0.0075304 505075.987 576963.886 3129.177 0.045 0.013 0.028
0.013 0.010 0.025 Avg-0.037 -0.047 0.007 Min0.047 0.059 0.056 Max
Data Collection Information
Difference Between 5/26/09 Stakeout and 5/06/09 Base Coordinates
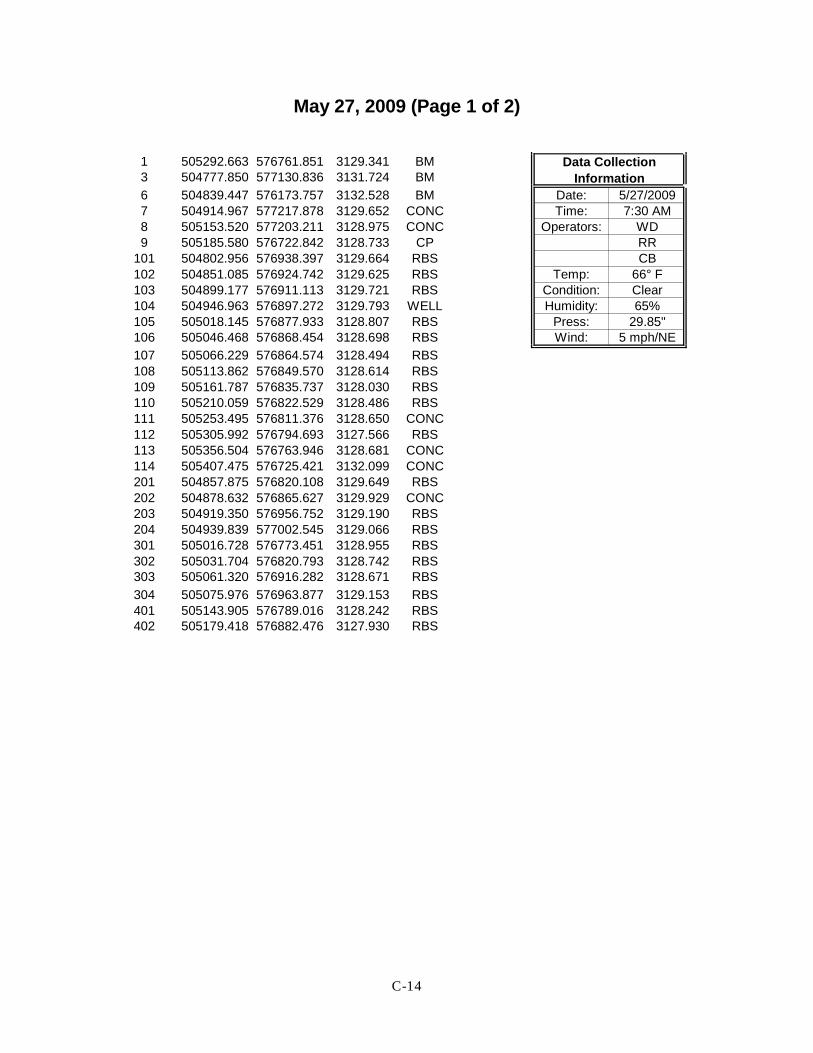
C-14
May 27, 2009 (Page 1 of 2)
1 505292.663 576761.851 3129.341 BM3 504777.850 577130.836 3131.724 BM6 504839.447 576173.757 3132.528 BM Date: 5/27/20097 504914.967 577217.878 3129.652 CONC Time: 7:30 AM8 505153.520 577203.211 3128.975 CONC Operators: WD9 505185.580 576722.842 3128.733 CP RR
101 504802.956 576938.397 3129.664 RBS CB102 504851.085 576924.742 3129.625 RBS Temp: 66° F103 504899.177 576911.113 3129.721 RBS Condition: Clear104 504946.963 576897.272 3129.793 WELL Humidity: 65%105 505018.145 576877.933 3128.807 RBS Press: 29.85"106 505046.468 576868.454 3128.698 RBS Wind: 5 mph/NE107 505066.229 576864.574 3128.494 RBS108 505113.862 576849.570 3128.614 RBS109 505161.787 576835.737 3128.030 RBS110 505210.059 576822.529 3128.486 RBS111 505253.495 576811.376 3128.650 CONC112 505305.992 576794.693 3127.566 RBS113 505356.504 576763.946 3128.681 CONC114 505407.475 576725.421 3132.099 CONC201 504857.875 576820.108 3129.649 RBS202 504878.632 576865.627 3129.929 CONC203 504919.350 576956.752 3129.190 RBS204 504939.839 577002.545 3129.066 RBS301 505016.728 576773.451 3128.955 RBS302 505031.704 576820.793 3128.742 RBS303 505061.320 576916.282 3128.671 RBS304 505075.976 576963.877 3129.153 RBS401 505143.905 576789.016 3128.242 RBS402 505179.418 576882.476 3127.930 RBS N E Elev.
Data Collection Information
Difference Between 5/27/09 Stakeout and 5/27/09 Base Coordinates

C-15
May 27, 2009 (Page 2 of 2)
304 505075.976 576963.877 3129.153 RBS401 505143.905 576789.016 3128.242 RBS402 505179.418 576882.476 3127.930 RBS N E Elev.5007 504914.957 577217.880 3129.656 -0.010 0.002 0.0045008 505153.501 577203.202 3128.993 -0.019 -0.009 0.0185009 505185.582 576722.873 3128.755 0.002 0.031 0.0225101 504802.966 576938.404 3129.656 0.010 0.007 -0.0085102 504851.090 576924.728 3129.629 0.005 -0.014 0.0045103 504899.185 576911.106 3129.733 0.008 -0.007 0.0125104 504946.970 576897.277 3129.807 0.007 0.005 0.0145105 505018.167 576877.961 3128.831 0.022 0.028 0.0245106 505046.502 576868.456 3128.730 0.034 0.002 0.0325107 505066.245 576864.585 3128.513 0.016 0.011 0.0195108 505113.872 576849.554 3128.634 0.010 -0.016 0.0205109 505161.772 576835.762 3128.035 -0.015 0.025 0.0055110 505210.062 576822.491 3128.529 0.003 -0.038 0.0435111 505253.491 576811.352 3128.646 -0.004 -0.024 -0.0045112 505305.994 576794.715 3127.599 0.002 0.022 0.0335113 505356.490 576763.933 3128.707 -0.014 -0.013 0.0265114 505407.468 576725.415 3132.143 -0.007 -0.006 0.0445201 504857.868 576820.099 3129.654 -0.007 -0.009 0.0055202 504878.657 576865.634 3129.941 0.025 0.007 0.0125203 504919.342 576956.778 3129.200 -0.008 0.026 0.0105204 504939.824 577002.535 3129.076 -0.015 -0.010 0.0105301 505016.743 576773.449 3128.982 0.015 -0.002 0.0275302 505031.685 576820.826 3128.765 -0.019 0.033 0.0235303 505061.332 576916.289 3128.675 0.012 0.007 0.0045304 505075.945 576963.851 3129.165 -0.031 -0.026 0.0125401 505143.905 576789.009 3128.212 0.000 -0.007 -0.0305402 505142.826 576831.259 3127.980 -36.592 -51.217 0.050
NOTE: 0.001 0.001 0.015 Avg5402 is a Bad Reading-- -0.031 -0.038 -0.030 MinNot Included in Avg, Min, & Max Calculations 0.034 0.033 0.044 Max
Difference Between 5/27/09 Stakeout and 5/27/09 Base Coordinates

C-16
May 28, 2009 (Page 1 of 2)
1 505292.663 576761.851 3129.341 BM3 504777.850 577130.836 3131.724 BM
6 504839.447 576173.757 3132.528 BM Date: 5/28/20097 504914.967 577217.878 3129.652 CONC Time: 7:45 AM8 505153.520 577203.211 3128.975 CONC Operators: WD9 505185.580 576722.842 3128.733 CP RR
101 504802.956 576938.397 3129.664 RBS CB102 504851.085 576924.742 3129.625 RBS BM103 504899.177 576911.113 3129.721 RBS Temp: 66° F104 504946.963 576897.272 3129.793 WELL TS_Temp: 75° F105 505018.145 576877.933 3128.807 RBS Condition: Clear106 505046.468 576868.454 3128.698 RBS Humidity: 62%107 505066.229 576864.574 3128.494 RBS Press: 29.88"108 505113.862 576849.570 3128.614 RBS Wind: 3 mph/NW
109 505161.787 576835.737 3128.030 RBS110 505210.059 576822.529 3128.486 RBS111 505253.495 576811.376 3128.650 CONC112 505305.992 576794.693 3127.566 RBS113 505356.504 576763.946 3128.681 CONC114 505407.475 576725.421 3132.099 CONC201 504857.875 576820.108 3129.649 RBS202 504878.632 576865.627 3129.929 CONC203 504919.350 576956.752 3129.190 RBS204 504939.839 577002.545 3129.066 RBS301 505016.728 576773.451 3128.955 RBS302 505031.704 576820.793 3128.742 RBS303 505061.320 576916.282 3128.671 RBS
304 505075.976 576963.877 3129.153 RBS401 505143.905 576789.016 3128.242 RBS402 505179.418 576882.476 3127.930 RBS N E Elev.
Data Collection Information
Difference Between 5/28/09 Stakeout and 5/27/09 Base Coordinates

C-17
May 28, 2009 (Page 2 of 2)
304 505075.976 576963.877 3129.153 RBS401 505143.905 576789.016 3128.242 RBS402 505179.418 576882.476 3127.930 RBS N E Elev.
5001 505292.733 576761.924 3129.366 0.070 0.073 0.0255006 504839.443 576173.741 3132.504 -0.004 -0.016 -0.0245007 504914.959 577217.902 3129.654 -0.008 0.024 0.0025008 505153.501 577203.272 3128.988 -0.019 0.061 0.0135009 505185.603 576722.860 3128.768 0.023 0.018 0.0355101 504802.966 576938.370 3129.664 0.010 -0.027 0.0005102 504851.084 576924.732 3129.630 -0.001 -0.010 0.0055103 504899.197 576911.120 3129.735 0.020 0.007 0.0145104 504946.956 576897.256 3129.810 -0.007 -0.016 0.0175105 505018.165 576877.955 3128.823 0.020 0.022 0.0165106 505046.507 576868.486 3128.719 0.039 0.032 0.0215107 505066.269 576864.614 3128.497 0.040 0.040 0.0035108 505113.909 576849.578 3128.631 0.047 0.008 0.0175109 505161.821 576835.772 3128.054 0.034 0.035 0.0245110 505210.093 576822.545 3128.537 0.034 0.016 0.0515111 505253.532 576811.424 3128.664 0.037 0.048 0.0145112 505306.015 576794.742 3127.600 0.023 0.049 0.0345113 505356.528 576763.984 3128.711 0.024 0.038 0.0305114 505407.487 576725.450 3132.142 0.012 0.029 0.0435201 504857.901 576820.077 3129.658 0.026 -0.031 0.0095202 504878.664 576865.637 3129.944 0.032 0.010 0.0155203 504919.373 576956.774 3129.206 0.023 0.022 0.0165204 504939.855 577002.562 3129.075 0.016 0.017 0.0095301 505016.790 576773.488 3128.983 0.062 0.037 0.0285302 505031.729 576820.825 3128.760 0.025 0.032 0.0185303 505061.362 576916.300 3128.689 0.042 0.018 0.0185304 505075.995 576963.914 3129.170 0.019 0.037 0.0175401 505143.962 576789.065 3128.275 0.057 0.049 0.0335402 505179.457 576882.542 3127.951 0.039 0.066 0.021
0.025 0.024 0.018 Avg-0.019 -0.031 -0.024 Min0.070 0.073 0.051 Max
Difference Between 5/28/09 Stakeout and 5/27/09 Base Coordinates

C-18
May 29, 2009 (Page 1 of 2)
1 505292.663 576761.851 3129.341 BM3 504777.850 577130.836 3131.724 BM
6 504839.447 576173.757 3132.528 BM Date: 5/28/20097 504914.967 577217.878 3129.652 CONC Time: 7:45 AM8 505153.520 577203.211 3128.975 CONC Operators: WD9 505185.580 576722.842 3128.733 CP RR
101 504802.956 576938.397 3129.664 RBS CB102 504851.085 576924.742 3129.625 RBS BM103 504899.177 576911.113 3129.721 RBS Temp: 66° F104 504946.963 576897.272 3129.793 WELL TS_Temp: 75° F105 505018.145 576877.933 3128.807 RBS Condition: Clear106 505046.468 576868.454 3128.698 RBS Humidity: 62%107 505066.229 576864.574 3128.494 RBS Press: 29.88"108 505113.862 576849.570 3128.614 RBS Wind: 3 mph/NW
109 505161.787 576835.737 3128.030 RBS110 505210.059 576822.529 3128.486 RBS111 505253.495 576811.376 3128.650 CONC112 505305.992 576794.693 3127.566 RBS113 505356.504 576763.946 3128.681 CONC114 505407.475 576725.421 3132.099 CONC201 504857.875 576820.108 3129.649 RBS202 504878.632 576865.627 3129.929 CONC203 504919.350 576956.752 3129.190 RBS204 504939.839 577002.545 3129.066 RBS301 505016.728 576773.451 3128.955 RBS302 505031.704 576820.793 3128.742 RBS303 505061.320 576916.282 3128.671 RBS
304 505075.976 576963.877 3129.153 RBS401 505143.905 576789.016 3128.242 RBS402 505179.418 576882.476 3127.930 RBS N E Elev.
Data Collection Information
Difference Between 5/28/09 Stakeout and 5/27/09 Base Coordinates

C-19
May 29, 2009 (Page 2 of 2)
304 505075.976 576963.877 3129.153 RBS401 505143.905 576789.016 3128.242 RBS402 505179.418 576882.476 3127.930 RBS N E Elev.
5001 505292.744 576761.931 3129.364 0.081 0.080 0.0235006 504839.439 576173.740 3132.586 -0.008 -0.017 0.0585007 504914.972 577217.919 3129.645 0.005 0.041 -0.0075008 505153.514 577203.284 3128.984 -0.006 0.073 0.0095009 505185.658 576722.873 3128.761 0.078 0.031 0.0285101 504802.977 576938.387 3129.653 0.021 -0.010 -0.0115102 504851.096 576924.742 3129.623 0.011 0.000 -0.0025103 504899.213 576911.111 3129.725 0.036 -0.002 0.0045104 504947.002 576897.295 3129.799 0.039 0.023 0.0065105 505018.185 576877.961 3128.739 0.040 0.028 -0.0685106 505046.522 576868.466 3128.715 0.054 0.012 0.0175107 505066.258 576864.609 3128.505 0.029 0.035 0.0115108 505113.919 576849.575 3128.635 0.057 0.005 0.0215109 505161.835 576835.782 3128.048 0.048 0.045 0.0185110 505210.078 576822.533 3128.532 0.019 0.004 0.0465111 505253.532 576811.398 3128.660 0.037 0.022 0.0105112 505306.045 576794.734 3127.595 0.053 0.041 0.0295113 505356.549 576763.990 3128.734 0.045 0.044 0.0535114 505407.533 576725.502 3132.141 0.058 0.081 0.0425201 504857.898 576820.076 3129.656 0.023 -0.032 0.0075202 504878.647 576865.620 3129.943 0.015 -0.007 0.0145203 504919.381 576956.768 3129.203 0.031 0.016 0.0135204 504939.869 577002.548 3129.070 0.030 0.003 0.0045301 505016.782 576773.470 3128.976 0.054 0.019 0.0215302 505031.741 576820.835 3128.759 0.037 0.042 0.0175303 505061.387 576916.324 3128.689 0.067 0.042 0.0185304 505076.010 576963.920 3129.165 0.034 0.043 0.0125401 505143.965 576789.046 3128.253 0.060 0.030 0.0115402 505179.476 576882.536 3127.944 0.058 0.060 0.014
0.038 0.026 0.014 Avg-0.008 -0.032 -0.068 Min0.081 0.081 0.058 Max
Difference Between 5/28/09 Stakeout and 5/27/09 Base Coordinates

C-20
June 1, 2009 (Page 1 of 2)
1 505292.663 576761.851 3129.341 BM3 504777.850 577130.836 3131.724 BM
6 504839.447 576173.757 3132.528 BM Date: 6/1/20097 504914.967 577217.878 3129.652 CONC Time: 7:45 AM8 505153.520 577203.211 3128.975 CONC Operators: WD9 505185.580 576722.842 3128.733 CP RR
101 504802.956 576938.397 3129.664 RBS BM102 504851.085 576924.742 3129.625 RBS103 504899.177 576911.113 3129.721 RBS Temp: 71° F104 504946.963 576897.272 3129.793 WELL TS_Temp: 75° F105 505018.145 576877.933 3128.807 RBS Condition: Clear106 505046.468 576868.454 3128.698 RBS Humidity: 61%107 505066.229 576864.574 3128.494 RBS Press: 29.74"108 505113.862 576849.570 3128.614 RBS Wind: 6 mph/S
109 505161.787 576835.737 3128.030 RBS110 505210.059 576822.529 3128.486 RBS111 505253.495 576811.376 3128.650 CONC112 505305.992 576794.693 3127.566 RBS113 505356.504 576763.946 3128.681 CONC114 505407.475 576725.421 3132.099 CONC201 504857.875 576820.108 3129.649 RBS202 504878.632 576865.627 3129.929 CONC203 504919.350 576956.752 3129.190 RBS204 504939.839 577002.545 3129.066 RBS301 505016.728 576773.451 3128.955 RBS302 505031.704 576820.793 3128.742 RBS303 505061.320 576916.282 3128.671 RBS
304 505075.976 576963.877 3129.153 RBS401 505143.905 576789.016 3128.242 RBS402 505179.418 576882.476 3127.930 RBS N E Elev.
Data Collection Information
Difference Between 6/1/09 Stakeout and 5/27/09 Base Coordinates

C-21
June 1, 2009 (Page 2 of 2)
304 505075.976 576963.877 3129.153 RBS401 505143.905 576789.016 3128.242 RBS402 505179.418 576882.476 3127.930 RBS N E Elev.
5001 505292.726 576761.922 3129.361 0.063 0.071 0.0205006 504839.443 576173.746 3132.504 -0.004 -0.011 -0.0245007 504914.988 577217.894 3129.647 0.021 0.016 -0.0055008 505153.472 577203.242 3128.977 -0.048 0.031 0.0025009 505185.594 576722.865 3128.739 0.014 0.023 0.0065101 504802.963 576938.364 3129.651 0.007 -0.033 -0.0135102 504851.075 576924.729 3129.620 -0.010 -0.013 -0.0055103 504899.192 576911.128 3129.720 0.015 0.015 -0.0015104 504946.993 576897.288 3129.796 0.030 0.016 0.0035105 505018.184 576877.972 3128.815 0.039 0.039 0.0085106 505046.496 576868.466 3128.708 0.028 0.012 0.0105107 505066.257 576864.615 3128.486 0.028 0.041 -0.0085108 505113.899 576849.581 3128.619 0.037 0.011 0.0055109 505161.816 576835.773 3128.036 0.029 0.036 0.0065110 505210.065 576822.523 3128.517 0.006 -0.006 0.0315111 505253.498 576811.410 3128.643 0.003 0.034 -0.0075112 505305.990 576794.758 3127.590 -0.002 0.065 0.0245113 505356.510 576763.975 3128.697 0.006 0.029 0.0165114 505407.482 576725.440 3132.127 0.007 0.019 0.0285201 504857.892 576820.106 3129.656 0.017 -0.002 0.0075202 504878.676 576865.588 3129.940 0.044 -0.039 0.0115203 504919.361 576956.770 3129.202 0.011 0.018 0.0125204 504939.845 577002.565 3129.061 0.006 0.020 -0.0055301 505016.766 576773.508 3128.965 0.038 0.057 0.0105302 505031.700 576820.833 3128.744 -0.004 0.040 0.0025303 505061.361 576916.314 3128.673 0.041 0.032 0.0025304 505075.983 576963.901 3129.164 0.007 0.024 0.0115401 505143.937 576789.052 3128.252 0.032 0.036 0.0105402 505179.442 576882.519 3127.927 0.024 0.043 -0.003
0.017 0.022 0.005 Avg-0.048 -0.039 -0.024 Min0.063 0.071 0.031 Max
Difference Between 6/1/09 Stakeout and 5/27/09 Base Coordinates

C-22
June 2, 2009 (Page 1 of 2)
1 505292.663 576761.851 3129.341 BM3 504777.850 577130.836 3131.724 BM
6 504839.447 576173.757 3132.528 BM Date: 6/2/20097 504914.967 577217.878 3129.652 CONC Time: 7:35 AM8 505153.520 577203.211 3128.975 CONC Operators: CF9 505185.580 576722.842 3128.733 CP RR
101 504802.956 576938.397 3129.664 RBS BM102 504851.085 576924.742 3129.625 RBS CB103 504899.177 576911.113 3129.721 RBS Temp: 66° F104 504946.963 576897.272 3129.793 WELL TS_Temp: 72.1° F105 505018.145 576877.933 3128.807 RBS Condition: Clear106 505046.468 576868.454 3128.698 RBS Humidity: 45%107 505066.229 576864.574 3128.494 RBS Press: 29.94"108 505113.862 576849.570 3128.614 RBS Wind: 8 mph/N
109 505161.787 576835.737 3128.030 RBS110 505210.059 576822.529 3128.486 RBS111 505253.495 576811.376 3128.650 CONC112 505305.992 576794.693 3127.566 RBS113 505356.504 576763.946 3128.681 CONC114 505407.475 576725.421 3132.099 CONC201 504857.875 576820.108 3129.649 RBS202 504878.632 576865.627 3129.929 CONC203 504919.350 576956.752 3129.190 RBS204 504939.839 577002.545 3129.066 RBS301 505016.728 576773.451 3128.955 RBS302 505031.704 576820.793 3128.742 RBS303 505061.320 576916.282 3128.671 RBS
304 505075.976 576963.877 3129.153 RBS401 505143.905 576789.016 3128.242 RBS402 505179.418 576882.476 3127.930 RBS N E Elev.
Data Collection Information
Difference Between 6/2/09 Stakeout and 5/27/09 Base Coordinates

C-23
June 2, 2009 (Page 2 of 2)
303 505061.320 576916.282 3128.671 RBS
304 505075.976 576963.877 3129.153 RBS401 505143.905 576789.016 3128.242 RBS402 505179.418 576882.476 3127.930 RBS N E Elev.
5007 504914.963 577217.904 3129.658 -0.004 0.026 0.0065008 505153.502 577203.242 3128.984 -0.018 0.031 0.0095009 505185.610 576722.881 3128.765 0.030 0.039 0.0325101 504802.970 576938.391 3129.666 0.014 -0.006 0.0025102 504851.098 576924.743 3129.638 0.013 0.001 0.0135103 504899.191 576911.128 3129.735 0.014 0.015 0.0145104 504946.957 576897.269 3129.814 -0.006 -0.003 0.0215105 505018.183 576877.958 3128.836 0.038 0.025 0.0295106 505046.508 576868.480 3128.733 0.040 0.026 0.0355107 505066.264 576864.601 3128.508 0.035 0.027 0.0145108 505113.911 576849.573 3128.646 0.049 0.003 0.0325109 505161.814 576835.780 3128.052 0.027 0.043 0.0225110 505210.079 576822.535 3128.543 0.020 0.006 0.0575111 505253.535 576811.429 3128.676 0.040 0.053 0.0265112 505306.023 576794.755 3127.609 0.031 0.062 0.0435113 505356.534 576764.004 3128.724 0.030 0.058 0.0435114 505407.501 576725.471 3132.154 0.026 0.050 0.0555201 504857.901 576820.103 3129.663 0.026 -0.005 0.0145202 504878.658 576865.597 3129.949 0.026 -0.030 0.0205203 504919.363 576956.773 3129.214 0.013 0.021 0.0245204 504939.839 577002.543 3129.081 0.000 -0.002 0.0155301 505016.742 576773.492 3128.989 0.014 0.041 0.0345302 505031.699 576820.833 3128.761 -0.005 0.040 0.0195303 505061.356 576916.283 3128.692 0.036 0.001 0.0215304 505075.964 576963.910 3129.180 -0.012 0.033 0.0275401 505143.924 576789.054 3128.263 0.019 0.038 0.0215402 505179.449 576882.512 3127.931 0.031 0.036 0.001
0.020 0.023 0.024 Avg-0.018 -0.030 0.001 Min0.049 0.062 0.057 Max
Difference Between 6/2/09 Stakeout and 5/27/09 Base Coordinates

C-24
June 3, 2009 (Page 1 of 2)
1 505292.663 576761.851 3129.341 BM3 504777.850 577130.836 3131.724 BM
6 504839.447 576173.757 3132.528 BM Date: 6/3/20097 504914.967 577217.878 3129.652 CONC Time: 7:55 AM8 505153.520 577203.211 3128.975 CONC Operators: CB9 505185.580 576722.842 3128.733 CP RR
101 504802.956 576938.397 3129.664 RBS BM102 504851.085 576924.742 3129.625 RBS103 504899.177 576911.113 3129.721 RBS Temp: 67.4° F104 504946.963 576897.272 3129.793 WELL TS_Temp: 69° F105 505018.145 576877.933 3128.807 RBS Condition: Clear106 505046.468 576868.454 3128.698 RBS Humidity: 51%107 505066.229 576864.574 3128.494 RBS Press: 29.97"108 505113.862 576849.570 3128.614 RBS Wind: 6-8 mph/N
109 505161.787 576835.737 3128.030 RBS110 505210.059 576822.529 3128.486 RBS111 505253.495 576811.376 3128.650 CONC112 505305.992 576794.693 3127.566 RBS113 505356.504 576763.946 3128.681 CONC114 505407.475 576725.421 3132.099 CONC201 504857.875 576820.108 3129.649 RBS202 504878.632 576865.627 3129.929 CONC203 504919.350 576956.752 3129.190 RBS204 504939.839 577002.545 3129.066 RBS301 505016.728 576773.451 3128.955 RBS302 505031.704 576820.793 3128.742 RBS303 505061.320 576916.282 3128.671 RBS304 505075.976 576963.877 3129.153 RBS401 505143.905 576789.016 3128.242 RBS402 505179.418 576882.476 3127.930 RBS N E Elev.
Data Collection Information
Difference Between 6/3/09 Stakeout and 5/27/09 Base Coordinates

C-25
June 3, 2009 (Page 2 of 2)
304 505075.976 576963.877 3129.153 RBS401 505143.905 576789.016 3128.242 RBS402 505179.418 576882.476 3127.930 RBS N E Elev.
5001 505292.709 576761.907 3129.367 0.046 0.056 0.0265006 504839.517 576173.750 3132.545 0.070 -0.007 0.0175007 504914.951 577217.893 3129.653 -0.016 0.015 0.0015008 505153.502 577203.263 3128.987 -0.018 0.052 0.0125009 505185.617 576722.882 3128.766 0.037 0.040 0.0335101 504802.969 576938.392 3129.654 0.013 -0.005 -0.0105102 504851.106 576924.762 3129.624 0.021 0.020 -0.0015103 504899.190 576911.134 3129.728 0.013 0.021 0.0075104 504946.982 576897.287 3129.806 0.019 0.015 0.0135105 505018.186 576877.982 3128.821 0.041 0.049 0.0145106 505046.513 576868.472 3128.715 0.045 0.018 0.0175107 505066.269 576864.594 3128.499 0.040 0.020 0.0055108 505113.887 576849.576 3128.636 0.025 0.006 0.0225109 505161.826 576835.771 3128.055 0.039 0.034 0.0255110 505210.066 576822.526 3128.543 0.007 -0.003 0.0575111 505253.511 576811.422 3128.672 0.016 0.046 0.0225112 505306.017 576794.737 3127.611 0.025 0.044 0.0455113 505356.512 576763.998 3128.715 0.008 0.052 0.0345114 505407.507 576725.463 3132.153 0.032 0.042 0.0545201 504857.900 576820.114 3129.647 0.025 0.006 -0.0025202 504878.684 576865.608 3129.939 0.052 -0.019 0.0105203 504919.357 576956.794 3129.207 0.007 0.042 0.0175204 504939.854 577002.555 3129.070 0.015 0.010 0.0045301 505016.774 576773.478 3128.978 0.046 0.027 0.0235302 505031.716 576820.816 3128.751 0.012 0.023 0.0095303 505061.357 576916.311 3128.684 0.037 0.029 0.0135304 505075.993 576963.901 3129.172 0.017 0.024 0.0195401 505143.947 576789.043 3128.260 0.042 0.027 0.0185402 505179.450 576882.525 3127.943 0.032 0.049 0.013
0.026 0.024 0.018 Avg-0.018 -0.019 -0.010 Min0.070 0.056 0.057 Max
Difference Between 6/3/09 Stakeout and 5/27/09 Base Coordinates

C-26
June 4, 2009 (Page 1 of 2)
1 505292.663 576761.851 3129.341 BM3 504777.850 577130.836 3131.724 BM
6 504839.447 576173.757 3132.528 BM Date: 6/4/20097 504914.967 577217.878 3129.652 CONC Time: 7:55 AM8 505153.520 577203.211 3128.975 CONC Operators: CB9 505185.580 576722.842 3128.733 CP RR
101 504802.956 576938.397 3129.664 RBS BM102 504851.085 576924.742 3129.625 RBS103 504899.177 576911.113 3129.721 RBS Temp: 66.1° F104 504946.963 576897.272 3129.793 WELL TS_Temp: 75° F105 505018.145 576877.933 3128.807 RBS Condition: Clear106 505046.468 576868.454 3128.698 RBS Humidity: 65%107 505066.229 576864.574 3128.494 RBS Press: 29.92"108 505113.862 576849.570 3128.614 RBS Wind: Calm
109 505161.787 576835.737 3128.030 RBS110 505210.059 576822.529 3128.486 RBS111 505253.495 576811.376 3128.650 CONC112 505305.992 576794.693 3127.566 RBS113 505356.504 576763.946 3128.681 CONC114 505407.475 576725.421 3132.099 CONC201 504857.875 576820.108 3129.649 RBS202 504878.632 576865.627 3129.929 CONC203 504919.350 576956.752 3129.190 RBS204 504939.839 577002.545 3129.066 RBS301 505016.728 576773.451 3128.955 RBS302 505031.704 576820.793 3128.742 RBS303 505061.320 576916.282 3128.671 RBS
304 505075.976 576963.877 3129.153 RBS401 505143.905 576789.016 3128.242 RBS402 505179.418 576882.476 3127.930 RBS N E Elev.
Data Collection Information
Difference Between 6/4/09 Stakeout and 5/27/09 Base Coordinates

C-27
June 4, 2009 (Page 2 of 2)
304 505075.976 576963.877 3129.153 RBS401 505143.905 576789.016 3128.242 RBS402 505179.418 576882.476 3127.930 RBS N E Elev.
5001 505292.723 576761.928 3129.372 0.046 0.056 0.0265006 504839.568 576173.759 3132.476 0.070 -0.007 0.0175007 504914.953 577217.907 3129.653 -0.016 0.015 0.0015008 505153.492 577203.288 3128.986 -0.018 0.052 0.0125009 505185.596 576722.876 3128.761 0.037 0.040 0.0335101 504802.981 576938.394 3129.659 0.013 -0.005 -0.0105102 504851.109 576924.749 3129.629 0.021 0.020 -0.0015103 504899.201 576911.140 3129.733 0.013 0.021 0.0075104 504946.928 576897.261 3129.805 0.019 0.015 0.0135105 505018.190 576877.995 3128.826 0.041 0.049 0.0145106 505046.514 576868.502 3128.717 0.045 0.018 0.0175107 505066.280 576864.621 3128.495 0.040 0.020 0.0055108 505113.909 576849.588 3128.623 0.025 0.006 0.0225109 505161.826 576835.798 3128.040 0.039 0.034 0.0255110 505210.090 576822.543 3128.538 0.007 -0.003 0.0575111 505253.525 576811.426 3128.645 0.016 0.046 0.0225112 505306.021 576794.763 3127.591 0.025 0.044 0.0455113 505356.539 576764.004 3128.708 0.008 0.052 0.0345114 505407.513 576725.493 3132.148 0.032 0.042 0.0545201 504857.910 576820.112 3129.655 0.025 0.006 -0.0025202 504878.672 576865.598 3129.945 0.052 -0.019 0.0105203 504919.376 576956.785 3129.206 0.007 0.042 0.0175204 504939.851 577002.569 3129.066 0.015 0.010 0.0045301 505016.794 576773.504 3128.975 0.046 0.027 0.0235302 505031.725 576820.850 3128.752 0.012 0.023 0.0095303 505061.367 576916.318 3128.684 0.037 0.029 0.0135304 505076.003 576963.921 3129.171 0.017 0.024 0.0195401 505143.952 576789.064 3128.257 0.042 0.027 0.0185402 505179.452 576882.539 3127.935 0.032 0.049 0.013
0.026 0.024 0.018 Avg-0.018 -0.019 -0.010 Min0.070 0.056 0.057 Max
Difference Between 6/4/09 Stakeout and 5/27/09 Base Coordinates

C-28
June 5, 2009 (Page 1 of 2)
1 505292.663 576761.851 3129.341 BM3 504777.850 577130.836 3131.724 BM
6 504839.447 576173.757 3132.528 BM Date: 6/5/20097 504914.967 577217.878 3129.652 CONC Time: 7:55 AM8 505153.520 577203.211 3128.975 CONC Operators: CB9 505185.580 576722.842 3128.733 CP RR
101 504802.956 576938.397 3129.664 RBS BM102 504851.085 576924.742 3129.625 RBS103 504899.177 576911.113 3129.721 RBS Temp: 69° F104 504946.963 576897.272 3129.793 WELL TS_Temp: 80° F105 505018.145 576877.933 3128.807 RBS Condition: Clear106 505046.468 576868.454 3128.698 RBS Humidity: 55%107 505066.229 576864.574 3128.494 RBS Press: 29.81"108 505113.862 576849.570 3128.614 RBS Wind: Calm
109 505161.787 576835.737 3128.030 RBS110 505210.059 576822.529 3128.486 RBS111 505253.495 576811.376 3128.650 CONC112 505305.992 576794.693 3127.566 RBS113 505356.504 576763.946 3128.681 CONC114 505407.475 576725.421 3132.099 CONC201 504857.875 576820.108 3129.649 RBS202 504878.632 576865.627 3129.929 CONC203 504919.350 576956.752 3129.190 RBS204 504939.839 577002.545 3129.066 RBS301 505016.728 576773.451 3128.955 RBS302 505031.704 576820.793 3128.742 RBS303 505061.320 576916.282 3128.671 RBS304 505075.976 576963.877 3129.153 RBS401 505143.905 576789.016 3128.242 RBS402 505179.418 576882.476 3127.930 RBS N E Elev.
Data Collection Information
Difference Between 6/5/09 Stakeout and 5/27/09 Base Coordinates

C-29
June 5, 2009 (Page 2 of 2)
303 505061.320 576916.282 3128.671 RBS304 505075.976 576963.877 3129.153 RBS401 505143.905 576789.016 3128.242 RBS402 505179.418 576882.476 3127.930 RBS N E Elev.
5001 505292.713 576761.870 3129.352 0.050 0.019 0.0115006 504839.452 576173.746 3132.533 0.005 -0.011 0.0055007 504914.975 577217.893 3129.644 0.008 0.015 -0.0085008 505153.503 577203.260 3128.971 -0.017 0.049 -0.0045009 505185.598 576722.849 3128.746 0.018 0.007 0.0135101 504802.966 576938.386 3129.649 0.010 -0.011 -0.0155102 504851.087 576924.734 3129.618 0.002 -0.008 -0.0075103 504899.181 576911.128 3129.725 0.004 0.015 0.0045104 504946.950 576897.264 3129.801 -0.013 -0.008 0.0085105 505018.174 576877.957 3128.815 0.029 0.024 0.0085106 505046.497 576868.455 3128.707 0.029 0.001 0.0095107 505066.259 576864.575 3128.486 0.030 0.001 -0.0085108 505113.916 576849.555 3128.619 0.054 -0.015 0.0055109 505161.803 576835.774 3128.036 0.016 0.037 0.0065110 505210.067 576822.509 3128.524 0.008 -0.020 0.0385111 505253.524 576811.396 3128.651 0.029 0.020 0.0015112 505306.005 576794.719 3127.590 0.013 0.026 0.0245113 505356.527 576763.984 3128.701 0.023 0.038 0.0205114 505407.487 576725.441 3132.142 0.012 0.020 0.0435201 504857.895 576820.102 3129.643 0.020 -0.006 -0.0065202 504878.642 576865.608 3129.935 0.010 -0.019 0.0065203 504919.353 576956.758 3129.193 0.003 0.006 0.0035204 504939.851 577002.559 3129.062 0.012 0.014 -0.0045301 505016.753 576773.464 3128.971 0.025 0.013 0.0165302 505031.699 576820.788 3128.742 -0.005 -0.005 0.0005303 505061.359 576916.288 3128.674 0.039 0.006 0.0035304 505075.996 576963.886 3129.163 0.020 0.009 0.0105401 505143.928 576789.037 3128.246 0.023 0.021 0.0045402 505179.422 576882.507 3127.926 0.004 0.031 -0.004
0.016 0.009 0.007 Avg-0.017 -0.020 -0.015 Min0.054 0.049 0.043 Max
Difference Between 6/5/09 Stakeout and 5/27/09 Base Coordinates

C-30
June 8, 2009 (Page 1 of 2)
1 505292.663 576761.851 3129.341 BM3 504777.850 577130.836 3131.724 BM
6 504839.447 576173.757 3132.528 BM Date: 6/8/20097 504914.967 577217.878 3129.652 CONC Time: 8:00 AM8 505153.520 577203.211 3128.975 CONC Operators: RR 9 505185.580 576722.842 3128.733 CP WD
101 504802.956 576938.397 3129.664 RBS BM102 504851.085 576924.742 3129.625 RBS103 504899.177 576911.113 3129.721 RBS Temp: 66° F104 504946.963 576897.272 3129.793 WELL TS_Temp: 85° F105 505018.145 576877.933 3128.807 RBS Condition: Clear106 505046.468 576868.454 3128.698 RBS Humidity: 25%107 505066.229 576864.574 3128.494 RBS Press: 29.74"108 505113.862 576849.570 3128.614 RBS Wind: 3/NNW
109 505161.787 576835.737 3128.030 RBS110 505210.059 576822.529 3128.486 RBS111 505253.495 576811.376 3128.650 CONC112 505305.992 576794.693 3127.566 RBS113 505356.504 576763.946 3128.681 CONC114 505407.475 576725.421 3132.099 CONC201 504857.875 576820.108 3129.649 RBS202 504878.632 576865.627 3129.929 CONC203 504919.350 576956.752 3129.190 RBS204 504939.839 577002.545 3129.066 RBS301 505016.728 576773.451 3128.955 RBS302 505031.704 576820.793 3128.742 RBS303 505061.320 576916.282 3128.671 RBS304 505075.976 576963.877 3129.153 RBS401 505143.905 576789.016 3128.242 RBS402 505179.418 576882.476 3127.930 RBS N E Elev.
Data Collection Information
Difference Between 6/8/09 Stakeout and 5/27/09 Base Coordinates

C-31
June 8, 2009 (Page 2 of 2)
304 505075.976 576963.877 3129.153 RBS401 505143.905 576789.016 3128.242 RBS402 505179.418 576882.476 3127.930 RBS N E Elev.
5001 505292.694 576761.877 3129.351 0.031 0.026 0.0105006 504839.457 576173.752 3132.526 0.010 -0.005 -0.0025007 504914.948 577217.886 3129.650 -0.019 0.008 -0.0025008 505153.513 577203.244 3128.973 -0.007 0.033 -0.0025009 505185.612 576722.867 3128.764 0.032 0.025 0.0315101 504802.960 576938.403 3129.650 0.004 0.006 -0.0145102 504851.090 576924.728 3129.624 0.005 -0.014 -0.0015103 504899.186 576911.118 3129.724 0.009 0.005 0.0035104 504946.964 576897.260 3129.803 0.001 -0.012 0.0105105 505018.179 576877.972 3128.819 0.034 0.039 0.0125106 505046.479 576868.462 3128.714 0.011 0.008 0.0165107 505066.275 576864.581 3128.497 0.046 0.007 0.0035108 505113.934 576849.535 3128.626 0.072 -0.035 0.0125109 505161.821 576835.777 3128.038 0.034 0.040 0.0085110 505210.086 576822.533 3128.531 0.027 0.004 0.0455111 505253.519 576811.430 3128.663 0.024 0.054 0.0135112 505306.017 576794.751 3127.593 0.025 0.058 0.0275113 505356.514 576763.989 3128.703 0.010 0.043 0.0225114 505407.501 576725.476 3132.137 0.026 0.055 0.0385201 504857.911 576820.099 3129.657 0.036 -0.009 0.0085202 504878.657 576865.602 3129.943 0.025 -0.025 0.0145203 504919.363 576956.756 3129.201 0.013 0.004 0.0115204 504939.845 577002.553 3129.072 0.006 0.008 0.0065301 505016.768 576773.472 3128.975 0.040 0.021 0.0205302 505031.725 576820.820 3128.759 0.021 0.027 0.0175303 505061.342 576916.311 3128.684 0.022 0.029 0.0135304 505075.996 576963.902 3129.166 0.020 0.025 0.0135401 505143.936 576789.049 3128.264 0.031 0.033 0.0225402 505179.454 576882.525 3127.924 0.036 0.049 -0.006
0.021 0.016 0.013 Avg-0.019 -0.035 -0.014 Min0.072 0.058 0.045 Max
Difference Between 6/8/09 Stakeout and 5/27/09 Base Coordinates
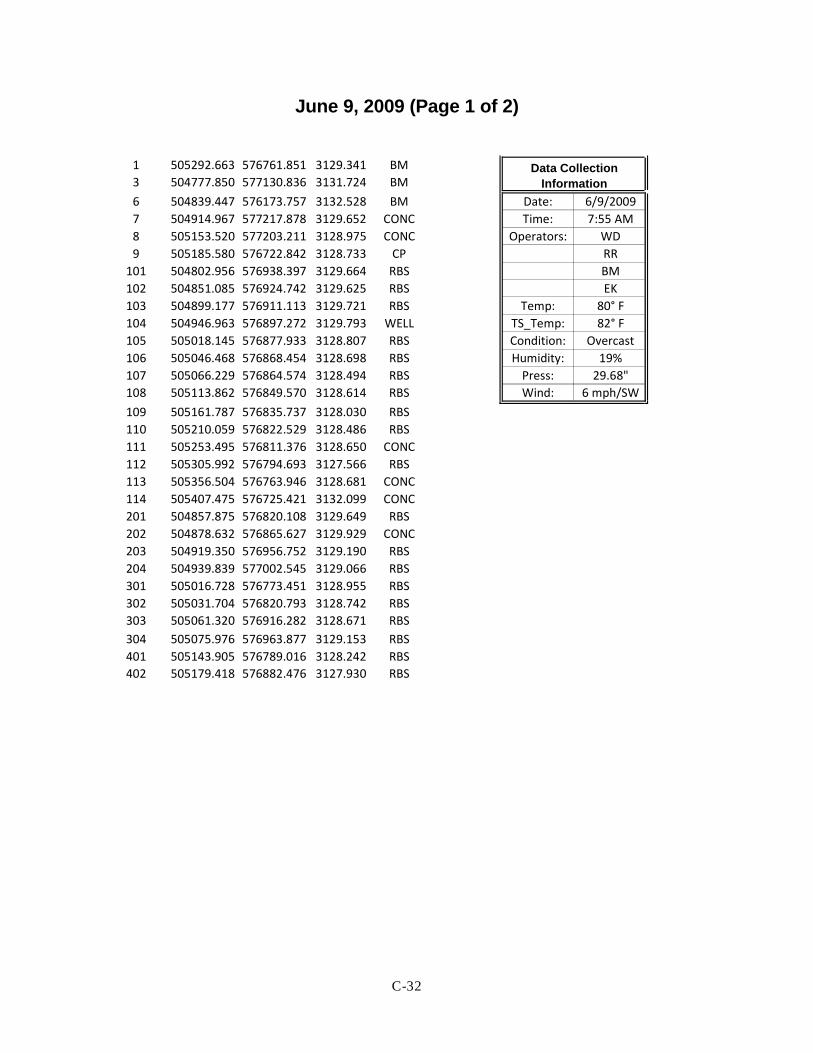
C-32
June 9, 2009 (Page 1 of 2)
1 505292.663 576761.851 3129.341 BM3 504777.850 577130.836 3131.724 BM
6 504839.447 576173.757 3132.528 BM Date: 6/9/20097 504914.967 577217.878 3129.652 CONC Time: 7:55 AM8 505153.520 577203.211 3128.975 CONC Operators: WD9 505185.580 576722.842 3128.733 CP RR
101 504802.956 576938.397 3129.664 RBS BM102 504851.085 576924.742 3129.625 RBS EK103 504899.177 576911.113 3129.721 RBS Temp: 80° F104 504946.963 576897.272 3129.793 WELL TS_Temp: 82° F105 505018.145 576877.933 3128.807 RBS Condition: Overcast106 505046.468 576868.454 3128.698 RBS Humidity: 19%107 505066.229 576864.574 3128.494 RBS Press: 29.68"108 505113.862 576849.570 3128.614 RBS Wind: 6 mph/SW
109 505161.787 576835.737 3128.030 RBS110 505210.059 576822.529 3128.486 RBS111 505253.495 576811.376 3128.650 CONC112 505305.992 576794.693 3127.566 RBS113 505356.504 576763.946 3128.681 CONC114 505407.475 576725.421 3132.099 CONC201 504857.875 576820.108 3129.649 RBS202 504878.632 576865.627 3129.929 CONC203 504919.350 576956.752 3129.190 RBS204 504939.839 577002.545 3129.066 RBS301 505016.728 576773.451 3128.955 RBS302 505031.704 576820.793 3128.742 RBS303 505061.320 576916.282 3128.671 RBS304 505075.976 576963.877 3129.153 RBS401 505143.905 576789.016 3128.242 RBS402 505179.418 576882.476 3127.930 RBS N E Elev.
Data Collection Information
Difference Between 6/9/09 Stakeout and 5/27/09 Base Coordinates

C-33
June 9, 2009 (Page 2 of 2)
304 505075.976 576963.877 3129.153 RBS401 505143.905 576789.016 3128.242 RBS402 505179.418 576882.476 3127.930 RBS N E Elev.
5001 505292.671 576761.844 3129.376 0.008 -0.007 0.0355006 504839.448 576173.746 3132.527 0.001 -0.011 -0.0015007 504914.983 577217.885 3129.656 0.016 0.007 0.0045008 505153.510 577203.233 3128.992 -0.010 0.022 0.0175009 505185.577 576722.819 3128.763 -0.003 -0.023 0.0305101 504802.967 576938.379 3129.661 0.011 -0.018 -0.0035102 504851.077 576924.729 3129.630 -0.008 -0.013 0.0055103 504899.178 576911.103 3129.730 0.001 -0.010 0.0095104 504946.926 576897.251 3129.808 -0.037 -0.021 0.0155105 505018.158 576877.946 3128.833 0.013 0.013 0.0265106 505046.476 576868.466 3128.724 0.008 0.012 0.0265107 505066.231 576864.570 3128.503 0.002 -0.004 0.0095108 505113.878 576849.531 3128.636 0.016 -0.039 0.0225109 505161.781 576835.734 3128.059 -0.006 -0.003 0.0295110 505210.046 576822.477 3128.551 -0.013 -0.052 0.0655111 505253.490 576811.369 3128.674 -0.005 -0.007 0.0245112 505305.985 576794.692 3127.609 -0.007 -0.001 0.0435113 505356.498 576763.917 3128.716 -0.006 -0.029 0.0355114 505407.464 576725.400 3132.163 -0.011 -0.021 0.0645201 504857.866 576820.083 3129.666 -0.009 -0.025 0.0175202 504878.648 576865.598 3129.947 0.016 -0.029 0.0185203 504919.354 576956.769 3129.211 0.004 0.017 0.0215204 504939.835 577002.541 3129.079 -0.004 -0.004 0.0135301 505016.727 576773.450 3128.982 -0.001 -0.001 0.0275302 505031.681 576820.797 3128.750 -0.023 0.004 0.0085303 505061.327 576916.275 3128.685 0.007 -0.007 0.0145304 505075.974 576963.863 3129.174 -0.002 -0.014 0.0215401 505143.905 576788.995 3128.268 0.000 -0.021 0.0265402 505179.430 576882.478 3127.945 0.012 0.002 0.015
-0.002 -0.010 0.022 Avg-0.037 -0.052 -0.003 Min0.016 0.022 0.065 Max
Difference Between 6/9/09 Stakeout and 5/27/09 Base Coordinates

C-34
June 10, 2009 (Page 1 of 2)
1 505292.7 576761.9 3129.341 BM3 504777.9 577130.8 3131.724 BM
6 504839.4 576173.8 3132.528 BM Date: 6/10/20097 504915 577217.9 3129.652 CONC Time: 7:50 AM8 505153.5 577203.2 3128.975 CONC Operators: WD9 505185.6 576722.8 3128.733 CP BM
101 504803 576938.4 3129.664 RBS 102 504851.1 576924.7 3129.625 RBS103 504899.2 576911.1 3129.721 RBS Temp: 70° F104 504947 576897.3 3129.793 WELL TS_Temp: 85° F105 505018.1 576877.9 3128.807 RBS Condition: Clear106 505046.5 576868.5 3128.698 RBS Humidity: 52%107 505066.2 576864.6 3128.494 RBS Press: 29.70"108 505113.9 576849.6 3128.614 RBS Wind: Calm
109 505161.8 576835.7 3128.03 RBS110 505210.1 576822.5 3128.486 RBS111 505253.5 576811.4 3128.65 CONC112 505306 576794.7 3127.566 RBS113 505356.5 576763.9 3128.681 CONC114 505407.5 576725.4 3132.099 CONC201 504857.9 576820.1 3129.649 RBS202 504878.6 576865.6 3129.929 CONC203 504919.4 576956.8 3129.19 RBS204 504939.8 577002.5 3129.066 RBS301 505016.7 576773.5 3128.955 RBS302 505031.7 576820.8 3128.742 RBS303 505061.3 576916.3 3128.671 RBS304 505076 576963.9 3129.153 RBS401 505143.9 576789 3128.242 RBS402 505179.4 576882.5 3127.93 RBS N E Elev.
Data Collection Information
Difference Between 6/10/09 Stakeout and 5/27/09 Base Coordinates
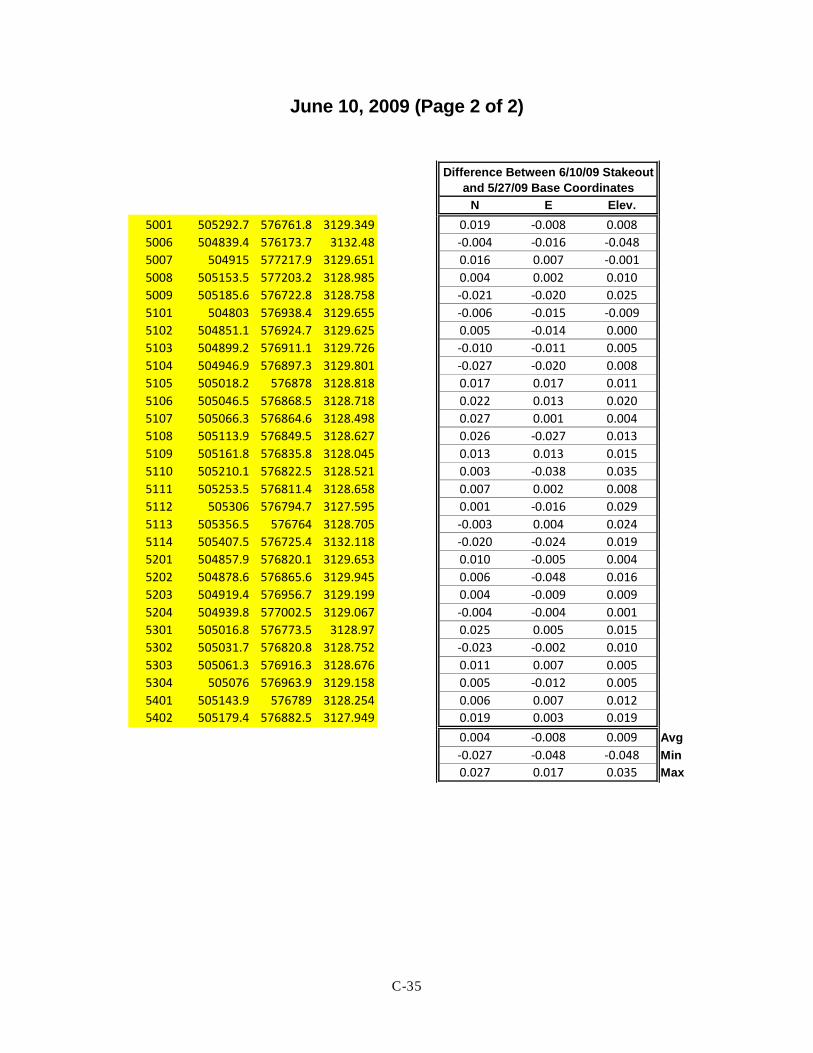
C-35
June 10, 2009 (Page 2 of 2)
304 505076 576963.9 3129.153 RBS401 505143.9 576789 3128.242 RBS402 505179.4 576882.5 3127.93 RBS N E Elev.
5001 505292.7 576761.8 3129.349 0.019 -0.008 0.0085006 504839.4 576173.7 3132.48 -0.004 -0.016 -0.0485007 504915 577217.9 3129.651 0.016 0.007 -0.0015008 505153.5 577203.2 3128.985 0.004 0.002 0.0105009 505185.6 576722.8 3128.758 -0.021 -0.020 0.0255101 504803 576938.4 3129.655 -0.006 -0.015 -0.0095102 504851.1 576924.7 3129.625 0.005 -0.014 0.0005103 504899.2 576911.1 3129.726 -0.010 -0.011 0.0055104 504946.9 576897.3 3129.801 -0.027 -0.020 0.0085105 505018.2 576878 3128.818 0.017 0.017 0.0115106 505046.5 576868.5 3128.718 0.022 0.013 0.0205107 505066.3 576864.6 3128.498 0.027 0.001 0.0045108 505113.9 576849.5 3128.627 0.026 -0.027 0.0135109 505161.8 576835.8 3128.045 0.013 0.013 0.0155110 505210.1 576822.5 3128.521 0.003 -0.038 0.0355111 505253.5 576811.4 3128.658 0.007 0.002 0.0085112 505306 576794.7 3127.595 0.001 -0.016 0.0295113 505356.5 576764 3128.705 -0.003 0.004 0.0245114 505407.5 576725.4 3132.118 -0.020 -0.024 0.0195201 504857.9 576820.1 3129.653 0.010 -0.005 0.0045202 504878.6 576865.6 3129.945 0.006 -0.048 0.0165203 504919.4 576956.7 3129.199 0.004 -0.009 0.0095204 504939.8 577002.5 3129.067 -0.004 -0.004 0.0015301 505016.8 576773.5 3128.97 0.025 0.005 0.0155302 505031.7 576820.8 3128.752 -0.023 -0.002 0.0105303 505061.3 576916.3 3128.676 0.011 0.007 0.0055304 505076 576963.9 3129.158 0.005 -0.012 0.0055401 505143.9 576789 3128.254 0.006 0.007 0.0125402 505179.4 576882.5 3127.949 0.019 0.003 0.019
0.004 -0.008 0.009 Avg-0.027 -0.048 -0.048 Min0.027 0.017 0.035 Max
Difference Between 6/10/09 Stakeout and 5/27/09 Base Coordinates

C-36
June 11, 2009 (Page 1 of 2)
1 505292.663 576761.851 3129.341 BM3 504777.850 577130.836 3131.724 BM
6 504839.447 576173.757 3132.528 BM Date: 6/11/20097 504914.967 577217.878 3129.652 CONC Time: 7:50 AM8 505153.520 577203.211 3128.975 CONC Operators: JL9 505185.580 576722.842 3128.733 CP BM
101 504802.956 576938.397 3129.664 RBS CB102 504851.085 576924.742 3129.625 RBS103 504899.177 576911.113 3129.721 RBS Temp: 82° F104 504946.963 576897.272 3129.793 WELL TS_Temp: 85° F105 505018.145 576877.933 3128.807 RBS Condition: Clear106 505046.468 576868.454 3128.698 RBS Humidity: 48%107 505066.229 576864.574 3128.494 RBS Press: 29.64"108 505113.862 576849.570 3128.614 RBS Wind: Calm
109 505161.787 576835.737 3128.030 RBS110 505210.059 576822.529 3128.486 RBS111 505253.495 576811.376 3128.650 CONC112 505305.992 576794.693 3127.566 RBS113 505356.504 576763.946 3128.681 CONC114 505407.475 576725.421 3132.099 CONC201 504857.875 576820.108 3129.649 RBS202 504878.632 576865.627 3129.929 CONC203 504919.350 576956.752 3129.190 RBS204 504939.839 577002.545 3129.066 RBS301 505016.728 576773.451 3128.955 RBS302 505031.704 576820.793 3128.742 RBS303 505061.320 576916.282 3128.671 RBS
304 505075.976 576963.877 3129.153 RBS401 505143.905 576789.016 3128.242 RBS402 505179.418 576882.476 3127.930 RBS N E Elev.
Data Collection Information
Difference Between 6/11/09 Stakeout and 5/27/09 Base Coordinates

C-37
June 11, 2009 (Page 2 of 2)
303 505061.320 576916.282 3128.671 RBS
304 505075.976 576963.877 3129.153 RBS401 505143.905 576789.016 3128.242 RBS402 505179.418 576882.476 3127.930 RBS N E Elev.
5001 505292.717 576761.909 3129.381 0.054 0.058 0.0405007 504914.960 577217.911 3129.659 -0.007 0.033 0.0075008 505153.513 577203.273 3128.996 -0.007 0.062 0.0215009 505185.642 576722.869 3128.762 0.062 0.027 0.0295101 504802.947 576938.382 3129.663 -0.009 -0.015 -0.0015102 504851.088 576924.722 3129.630 0.003 -0.020 0.0055103 504899.168 576911.103 3129.730 -0.009 -0.010 0.0095104 504946.933 576897.256 3129.810 -0.030 -0.016 0.0175105 505018.172 576877.960 3128.829 0.027 0.027 0.0225106 505046.503 576868.480 3128.725 0.035 0.026 0.0275107 505066.266 576864.602 3128.499 0.037 0.028 0.0055108 505113.916 576849.569 3128.636 0.054 -0.001 0.0225109 505161.813 576835.775 3128.054 0.026 0.038 0.0245110 505210.075 576822.526 3128.535 0.016 -0.003 0.0495111 505253.527 576811.407 3128.662 0.032 0.031 0.0125112 505306.037 576794.746 3127.593 0.045 0.053 0.0275113 505356.540 576763.992 3128.720 0.036 0.046 0.0395114 505407.518 576725.495 3132.156 0.043 0.074 0.0575201 504857.901 576820.097 3129.668 0.026 -0.011 0.0195202 504878.661 576865.603 3129.948 0.029 -0.024 0.0195203 504919.369 576956.774 3129.214 0.019 0.022 0.0245204 504939.844 577002.561 3129.078 0.005 0.016 0.0125301 505016.769 576773.478 3128.982 0.041 0.027 0.0275302 505031.713 576820.823 3128.772 0.009 0.030 0.0305303 505061.353 576916.294 3128.689 0.033 0.012 0.0185304 505075.991 576963.895 3129.178 0.015 0.018 0.0255401 505143.941 576789.048 3128.265 0.036 0.032 0.0235402 505179.439 576882.521 3127.954 0.021 0.045 0.024
0.023 0.021 0.023 Avg-0.030 -0.024 -0.001 Min0.062 0.074 0.057 Max
Difference Between 6/11/09 Stakeout and 5/27/09 Base Coordinates

C-38
June 12 , 2009 (Page 1 of 2)
1 505292.663 576761.851 3129.341 BM3 504777.850 577130.836 3131.724 BM
6 504839.447 576173.757 3132.528 BM Date: 6/12/20097 504914.967 577217.878 3129.652 CONC Time: 8:20 AM8 505153.520 577203.211 3128.975 CONC Operators: JL9 505185.580 576722.842 3128.733 CP WD
101 504802.956 576938.397 3129.664 RBS RR102 504851.085 576924.742 3129.625 RBS103 504899.177 576911.113 3129.721 RBS Temp: 83° F104 504946.963 576897.272 3129.793 WELL TS_Temp: 88° F105 505018.145 576877.933 3128.807 RBS Condition: Clear106 505046.468 576868.454 3128.698 RBS Humidity: 26%107 505066.229 576864.574 3128.494 RBS Press: 29.68"108 505113.862 576849.570 3128.614 RBS Wind: Steady
109 505161.787 576835.737 3128.030 RBS110 505210.059 576822.529 3128.486 RBS111 505253.495 576811.376 3128.650 CONC112 505305.992 576794.693 3127.566 RBS113 505356.504 576763.946 3128.681 CONC114 505407.475 576725.421 3132.099 CONC201 504857.875 576820.108 3129.649 RBS202 504878.632 576865.627 3129.929 CONC203 504919.350 576956.752 3129.190 RBS204 504939.839 577002.545 3129.066 RBS301 505016.728 576773.451 3128.955 RBS302 505031.704 576820.793 3128.742 RBS303 505061.320 576916.282 3128.671 RBS
304 505075.976 576963.877 3129.153 RBS401 505143.905 576789.016 3128.242 RBS402 505179.418 576882.476 3127.930 RBS N E Elev.
Data Collection Information
Difference Between 6/12/09 Stakeout and 5/27/09 Base Coordinates

C-39
June 12, 2009 (Page 2 of 2)
304 505075.976 576963.877 3129.153 RBS401 505143.905 576789.016 3128.242 RBS402 505179.418 576882.476 3127.930 RBS N E Elev.
5001 505292.716 576761.891 3129.362 0.053 0.040 0.0215006 504839.452 576173.756 3132.492 0.005 -0.001 -0.0365007 504914.960 577217.904 3129.653 -0.007 0.026 0.0015008 505153.514 577203.244 3128.992 -0.006 0.033 0.0175009 505185.621 576722.862 3128.761 0.041 0.020 0.0285101 504802.971 576938.389 3129.660 0.015 -0.008 -0.0045102 504851.091 576924.749 3129.625 0.006 0.007 0.0005103 504899.181 576911.126 3129.729 0.004 0.013 0.0085104 504946.983 576897.286 3129.808 0.020 0.014 0.0155105 505018.175 576877.969 3128.828 0.030 0.036 0.0215106 505046.500 576868.475 3128.717 0.032 0.021 0.0195107 505066.258 576864.599 3128.496 0.029 0.025 0.0025108 505113.895 576849.559 3128.629 0.033 -0.011 0.0155109 505161.813 576835.784 3128.043 0.026 0.047 0.0135110 505210.068 576822.534 3128.534 0.009 0.005 0.0485111 505253.529 576811.409 3128.663 0.034 0.033 0.0135112 505306.012 576794.744 3127.576 0.020 0.051 0.0105113 505356.558 576763.993 3128.699 0.054 0.047 0.0185114 505407.493 576725.455 3132.139 0.018 0.034 0.0405201 504857.889 576820.104 3129.655 0.014 -0.004 0.0065202 504878.679 576865.610 3129.941 0.047 -0.017 0.0125203 504919.369 576956.767 3129.205 0.019 0.015 0.0155204 504939.843 577002.558 3129.075 0.004 0.013 0.0095301 505016.765 576773.476 3128.973 0.037 0.025 0.0185302 505031.699 576820.824 3128.751 -0.005 0.031 0.0095303 505061.357 576916.289 3128.681 0.037 0.007 0.0105304 505075.985 576963.883 3129.160 0.009 0.006 0.0075401 505143.940 576789.046 3128.256 0.035 0.030 0.0145402 505179.448 576882.515 3127.934 0.030 0.039 0.004
0.021 0.019 0.012 Avg-0.007 -0.017 -0.036 Min0.054 0.051 0.048 Max
Difference Between 6/12/09 Stakeout and 5/27/09 Base Coordinates

C-40
June 15, 2009 (Page 1 of 2)
1 505292.663 576761.851 3129.341 BM3 504777.850 577130.836 3131.724 BM
6 504839.447 576173.757 3132.528 BM Date: 6/15/20097 504914.967 577217.878 3129.652 CONC Time: 8:15 AM8 505153.520 577203.211 3128.975 CONC Operators: JL9 505185.580 576722.842 3128.733 CP WD
101 504802.956 576938.397 3129.664 RBS RR102 504851.085 576924.742 3129.625 RBS103 504899.177 576911.113 3129.721 RBS Temp: 83° F104 504946.963 576897.272 3129.793 WELL TS_Temp: 88° F105 505018.145 576877.933 3128.807 RBS Condition: Clear106 505046.468 576868.454 3128.698 RBS Humidity: 68%107 505066.229 576864.574 3128.494 RBS Press: 29.65"108 505113.862 576849.570 3128.614 RBS Wind: 3 mph SE
109 505161.787 576835.737 3128.030 RBS110 505210.059 576822.529 3128.486 RBS111 505253.495 576811.376 3128.650 CONC112 505305.992 576794.693 3127.566 RBS113 505356.504 576763.946 3128.681 CONC114 505407.475 576725.421 3132.099 CONC201 504857.875 576820.108 3129.649 RBS202 504878.632 576865.627 3129.929 CONC203 504919.350 576956.752 3129.190 RBS204 504939.839 577002.545 3129.066 RBS301 505016.728 576773.451 3128.955 RBS302 505031.704 576820.793 3128.742 RBS303 505061.320 576916.282 3128.671 RBS
304 505075.976 576963.877 3129.153 RBS401 505143.905 576789.016 3128.242 RBS402 505179.418 576882.476 3127.930 RBS N E Elev.
Data Collection Information
Difference Between 6/15/09 Stakeout and 5/27/09 Base Coordinates

C-41
June 15, 2009 (Page 2 of 2)
304 505075.976 576963.877 3129.153 RBS401 505143.905 576789.016 3128.242 RBS402 505179.418 576882.476 3127.930 RBS N E Elev.
5001 505292.707 576761.878 3129.368 0.044 0.027 0.0275006 504839.443 576173.746 3132.480 -0.004 -0.011 -0.0485007 504914.962 577217.907 3129.656 -0.005 0.029 0.0045008 505153.513 577203.242 3128.997 -0.007 0.031 0.0225009 505185.620 576722.863 3128.765 0.040 0.021 0.0325101 504802.960 576938.384 3129.662 0.004 -0.013 -0.0025102 504851.097 576924.726 3129.630 0.012 -0.016 0.0055103 504899.185 576911.118 3129.730 0.008 0.005 0.0095104 504946.951 576897.239 3129.805 -0.012 -0.033 0.0125105 505018.176 576877.965 3128.825 0.031 0.032 0.0185106 505046.496 576868.466 3128.717 0.028 0.012 0.0195107 505066.261 576864.597 3128.504 0.032 0.023 0.0105108 505113.899 576849.573 3128.637 0.037 0.003 0.0235109 505161.823 576835.782 3128.058 0.036 0.045 0.0285110 505210.097 576822.551 3128.542 0.038 0.022 0.0565111 505253.557 576811.434 3128.671 0.062 0.058 0.0215112 505306.028 576794.762 3127.610 0.036 0.069 0.0445113 505356.553 576764.015 3128.714 0.049 0.069 0.0335114 505407.500 576725.468 3132.154 0.025 0.047 0.0555201 504857.889 576820.100 3129.673 0.014 -0.008 0.0245202 504878.667 576865.606 3129.951 0.035 -0.021 0.0225203 504919.368 576956.762 3129.206 0.018 0.010 0.0165204 504939.841 577002.551 3129.072 0.002 0.006 0.0065301 505016.774 576773.477 3128.972 0.046 0.026 0.0175302 505031.706 576820.832 3128.742 0.002 0.039 0.0005303 505061.349 576916.282 3128.679 0.029 0.000 0.0085304 505075.998 576963.887 3129.166 0.022 0.010 0.0135401 505143.941 576789.042 3128.268 0.036 0.026 0.0265402 505179.453 576882.517 3127.947 0.035 0.041 0.017
0.024 0.019 0.018 Avg-0.012 -0.033 -0.048 Min0.062 0.069 0.056 Max
Difference Between 6/15/09 Stakeout and 5/27/09 Base Coordinates

C-42
June 16, 2009 (Page 1 of 2)
1 505292.663 576761.851 3129.341 BM3 504777.850 577130.836 3131.724 BM
6 504839.447 576173.757 3132.528 BM Date: 6/16/20097 504914.967 577217.878 3129.652 CONC Time: 8:15 AM8 505153.520 577203.211 3128.975 CONC Operators: JL9 505185.580 576722.842 3128.733 CP WD
101 504802.956 576938.397 3129.664 RBS RR102 504851.085 576924.742 3129.625 RBS CB103 504899.177 576911.113 3129.721 RBS Temp: 88° F104 504946.963 576897.272 3129.793 WELL TS_Temp: 90° F105 505018.145 576877.933 3128.807 RBS Condition: Clear106 505046.468 576868.454 3128.698 RBS Humidity: 23%107 505066.229 576864.574 3128.494 RBS Press: 29.62"108 505113.862 576849.570 3128.614 RBS Wind: calm
109 505161.787 576835.737 3128.030 RBS110 505210.059 576822.529 3128.486 RBS111 505253.495 576811.376 3128.650 CONC112 505305.992 576794.693 3127.566 RBS113 505356.504 576763.946 3128.681 CONC114 505407.475 576725.421 3132.099 CONC201 504857.875 576820.108 3129.649 RBS202 504878.632 576865.627 3129.929 CONC203 504919.350 576956.752 3129.190 RBS204 504939.839 577002.545 3129.066 RBS301 505016.728 576773.451 3128.955 RBS302 505031.704 576820.793 3128.742 RBS303 505061.320 576916.282 3128.671 RBS304 505075.976 576963.877 3129.153 RBS401 505143.905 576789.016 3128.242 RBS402 505179.418 576882.476 3127.930 RBS N E Elev.
Data Collection Information
Difference Between 6/16/09 Stakeout and 5/27/09 Base Coordinates

C-43
June 16, 2009 (Page 2 of 2)
304 505075.976 576963.877 3129.153 RBS401 505143.905 576789.016 3128.242 RBS402 505179.418 576882.476 3127.930 RBS N E Elev.
5001 505292.699 576761.850 3129.362 0.036 -0.001 0.0215008 505153.528 577203.213 3128.982 0.008 0.002 0.0075009 505185.603 576722.833 3128.764 0.023 -0.009 0.0315101 504802.961 576938.395 3129.657 0.005 -0.002 -0.0075102 504851.090 576924.740 3129.636 0.005 -0.002 0.0115103 504899.192 576911.111 3129.734 0.015 -0.002 0.0135104 504947.002 576897.271 3129.810 0.039 -0.001 0.0175105 505018.176 576877.945 3128.829 0.031 0.012 0.0225106 505046.501 576868.466 3128.719 0.033 0.012 0.0215107 505066.252 576864.589 3128.506 0.023 0.015 0.0125108 505113.896 576849.563 3128.632 0.034 -0.007 0.0185109 505161.801 576835.755 3128.051 0.014 0.018 0.0215110 505210.075 576822.520 3128.535 0.016 -0.009 0.0495111 505253.520 576811.399 3128.671 0.025 0.023 0.0215112 505306.003 576794.724 3127.621 0.011 0.031 0.0555113 505356.517 576763.968 3128.717 0.013 0.022 0.0365114 505407.479 576725.438 3132.130 0.004 0.017 0.0315201 504857.869 576820.095 3129.659 -0.006 -0.013 0.0105202 504878.653 576865.590 3129.946 0.021 -0.037 0.0175203 504919.374 576956.762 3129.208 0.024 0.010 0.0185204 504939.847 577002.552 3129.077 0.008 0.007 0.0115301 505016.762 576773.481 3128.979 0.034 0.030 0.0245302 505031.703 576820.817 3128.760 -0.001 0.024 0.0185303 505061.345 576916.285 3128.675 0.025 0.003 0.0045304 505075.983 576963.882 3129.165 0.007 0.005 0.0125401 505143.922 576789.030 3128.255 0.017 0.014 0.0135402 505179.440 576882.507 3127.946 0.022 0.031 0.016
0.018 0.007 0.019 Avg-0.006 -0.037 -0.007 Min0.039 0.031 0.055 Max
Difference Between 6/16/09 Stakeout and 5/27/09 Base Coordinates

C-44
June 17, 2009 (Page 1 of 2)
1 505292.663 576761.851 3129.341 BM3 504777.850 577130.836 3131.724 BM
6 504839.447 576173.757 3132.528 BM Date: 6/17/20097 504914.967 577217.878 3129.652 CONC Time: 8:05 AM8 505153.520 577203.211 3128.975 CONC Operators: JL9 505185.580 576722.842 3128.733 CP CB
101 504802.956 576938.397 3129.664 RBS102 504851.085 576924.742 3129.625 RBS103 504899.177 576911.113 3129.721 RBS Temp: 77° F104 504946.963 576897.272 3129.793 WELL TS_Temp: 80° F105 505018.145 576877.933 3128.807 RBS Condition: Cloudy106 505046.468 576868.454 3128.698 RBS Humidity: 50%107 505066.229 576864.574 3128.494 RBS Press: 29.62"108 505113.862 576849.570 3128.614 RBS Wind: calm
109 505161.787 576835.737 3128.030 RBS110 505210.059 576822.529 3128.486 RBS111 505253.495 576811.376 3128.650 CONC112 505305.992 576794.693 3127.566 RBS113 505356.504 576763.946 3128.681 CONC114 505407.475 576725.421 3132.099 CONC201 504857.875 576820.108 3129.649 RBS202 504878.632 576865.627 3129.929 CONC203 504919.350 576956.752 3129.190 RBS204 504939.839 577002.545 3129.066 RBS301 505016.728 576773.451 3128.955 RBS302 505031.704 576820.793 3128.742 RBS303 505061.320 576916.282 3128.671 RBS
304 505075.976 576963.877 3129.153 RBS401 505143.905 576789.016 3128.242 RBS402 505179.418 576882.476 3127.930 RBS N E Elev.
Data Collection Information
Difference Between 6/17/09 Stakeout and 5/27/09 Base Coordinates

C-45
June 17, 2009 (Page 2 of 2)
304 505075.976 576963.877 3129.153 RBS401 505143.905 576789.016 3128.242 RBS402 505179.418 576882.476 3127.930 RBS N E Elev.
5001 505292.678 576761.865 3129.358 0.015 0.014 0.0175006 504839.452 576173.751 3132.552 0.005 -0.006 0.0245007 504914.967 577217.887 3129.650 0.000 0.009 -0.0025008 505153.510 577203.227 3128.978 -0.010 0.016 0.0035009 505185.578 576722.842 3128.755 -0.002 0.000 0.0225101 504802.960 576938.395 3129.651 0.004 -0.002 -0.0135102 504851.087 576924.750 3129.624 0.002 0.008 -0.0015103 504899.181 576911.128 3129.726 0.004 0.015 0.0055104 504946.973 576897.280 3129.802 0.010 0.008 0.0095105 505018.156 576877.967 3128.829 0.011 0.034 0.0225106 505046.480 576868.451 3128.718 0.012 -0.003 0.0205107 505066.233 576864.591 3128.500 0.004 0.017 0.0065108 505113.874 576849.552 3128.630 0.012 -0.018 0.0165109 505161.791 576835.750 3128.048 0.004 0.013 0.0185110 505210.043 576822.510 3128.529 -0.016 -0.019 0.0435111 505253.494 576811.386 3128.660 -0.001 0.010 0.0105112 505305.986 576794.717 3127.614 -0.006 0.024 0.0485113 505356.496 576763.945 3128.714 -0.008 -0.001 0.0335114 505407.466 576725.408 3132.149 -0.009 -0.013 0.0505201 504857.874 576820.096 3129.647 -0.001 -0.012 -0.0025202 504878.649 576865.600 3129.935 0.017 -0.027 0.0065203 504919.342 576956.769 3129.200 -0.008 0.017 0.0105204 504939.827 577002.545 3129.070 -0.012 0.000 0.0045301 505016.735 576773.469 3128.973 0.007 0.018 0.0185302 505031.686 576820.810 3128.750 -0.018 0.017 0.0085303 505061.330 576916.275 3128.680 0.010 -0.007 0.0095304 505075.974 576963.876 3129.170 -0.002 -0.001 0.0175401 505143.912 576789.012 3128.256 0.007 -0.004 0.0145402 505179.425 576882.492 3127.942 0.007 0.016 0.012
0.001 0.004 0.015 Avg-0.018 -0.027 -0.013 Min0.017 0.034 0.050 Max
Difference Between 6/17/09 Stakeout and 5/27/09 Base Coordinates

C-46
June 18, 2009 (Page 1 of 2)
1 505292.663 576761.851 3129.341 BM3 504777.850 577130.836 3131.724 BM
6 504839.447 576173.757 3132.528 BM Date: 6/18/20097 504914.967 577217.878 3129.652 CONC Time: 8:15 AM8 505153.520 577203.211 3128.975 CONC Operators: JL9 505185.580 576722.842 3128.733 CP CB
101 504802.956 576938.397 3129.664 RBS102 504851.085 576924.742 3129.625 RBS103 504899.177 576911.113 3129.721 RBS Temp: 74° F104 504946.963 576897.272 3129.793 WELL TS_Temp: 83° F105 505018.145 576877.933 3128.807 RBS Condition: Cloudy106 505046.468 576868.454 3128.698 RBS Humidity: 71%107 505066.229 576864.574 3128.494 RBS Press: 29.63"108 505113.862 576849.570 3128.614 RBS Wind: calm
109 505161.787 576835.737 3128.030 RBS110 505210.059 576822.529 3128.486 RBS111 505253.495 576811.376 3128.650 CONC112 505305.992 576794.693 3127.566 RBS113 505356.504 576763.946 3128.681 CONC114 505407.475 576725.421 3132.099 CONC201 504857.875 576820.108 3129.649 RBS202 504878.632 576865.627 3129.929 CONC203 504919.350 576956.752 3129.190 RBS204 504939.839 577002.545 3129.066 RBS301 505016.728 576773.451 3128.955 RBS302 505031.704 576820.793 3128.742 RBS303 505061.320 576916.282 3128.671 RBS
304 505075.976 576963.877 3129.153 RBS401 505143.905 576789.016 3128.242 RBS402 505179.418 576882.476 3127.930 RBS N E Elev.
Data Collection Information
Difference Between 6/18/09 Stakeout and 5/27/09 Base Coordinates

C-47
June 18, 2009 (Page 2 of 2)
304 505075.976 576963.877 3129.153 RBS401 505143.905 576789.016 3128.242 RBS402 505179.418 576882.476 3127.930 RBS N E Elev.
5001 505292.718 576761.920 3129.359 0.055 0.069 0.0185006 504839.457 576173.751 3132.638 0.010 -0.006 0.1105009 505185.592 576722.843 3128.734 0.012 0.001 0.0015101 504802.951 576938.389 3129.655 -0.005 -0.008 -0.0095102 504851.081 576924.748 3129.625 -0.004 0.006 0.0005103 504899.168 576911.121 3129.728 -0.009 0.008 0.0075104 504946.973 576897.275 3129.805 0.010 0.003 0.0125105 505018.147 576877.952 3128.822 0.002 0.019 0.0155106 505046.489 576868.461 3128.723 0.021 0.007 0.0255107 505066.251 576864.588 3128.506 0.022 0.014 0.0125108 505113.880 576849.552 3128.629 0.018 -0.018 0.0155109 505161.794 576835.754 3128.051 0.007 0.017 0.0215110 505210.061 576822.510 3128.532 0.002 -0.019 0.0465111 505253.504 576811.393 3128.653 0.009 0.017 0.0035112 505305.999 576794.709 3127.600 0.007 0.016 0.0345113 505356.519 576763.962 3128.714 0.015 0.016 0.0335114 505407.475 576725.423 3132.133 0.000 0.002 0.0345201 504857.876 576820.087 3129.662 0.001 -0.021 0.0135202 504878.654 576865.591 3129.946 0.022 -0.036 0.0175203 504919.360 576956.770 3129.206 0.010 0.018 0.0165204 504939.831 577002.557 3129.073 -0.008 0.012 0.0075301 505016.753 576773.476 3128.983 0.025 0.025 0.0285302 505031.696 576820.818 3128.761 -0.008 0.025 0.0195303 505061.344 576916.293 3128.683 0.024 0.011 0.0125304 505075.987 576963.890 3129.169 0.011 0.013 0.0165401 505143.928 576789.044 3128.266 0.023 0.028 0.0245402 505179.440 576882.507 3127.947 0.022 0.031 0.017
0.011 0.009 0.020 Avg-0.009 -0.036 -0.009 Min0.055 0.069 0.110 Max
Difference Between 6/18/09 Stakeout and 5/27/09 Base Coordinates

C-48
June 19, 2009 (Page 1 of 2)
1 505292.663 576761.851 3129.341 BM3 504777.850 577130.836 3131.724 BM
6 504839.447 576173.757 3132.528 BM Date: 6/19/20097 504914.967 577217.878 3129.652 CONC Time: 8:00 AM8 505153.520 577203.211 3128.975 CONC Operators: JL9 505185.580 576722.842 3128.733 CP WD
101 504802.956 576938.397 3129.664 RBS102 504851.085 576924.742 3129.625 RBS103 504899.177 576911.113 3129.721 RBS Temp: 70° F104 504946.963 576897.272 3129.793 WELL TS_Temp: 72° F105 505018.145 576877.933 3128.807 RBS Condition: Cloudy106 505046.468 576868.454 3128.698 RBS Humidity: 88%107 505066.229 576864.574 3128.494 RBS Press: 29.68"108 505113.862 576849.570 3128.614 RBS Wind: slight breeze
109 505161.787 576835.737 3128.030 RBS110 505210.059 576822.529 3128.486 RBS111 505253.495 576811.376 3128.650 CONC112 505305.992 576794.693 3127.566 RBS113 505356.504 576763.946 3128.681 CONC114 505407.475 576725.421 3132.099 CONC201 504857.875 576820.108 3129.649 RBS202 504878.632 576865.627 3129.929 CONC203 504919.350 576956.752 3129.190 RBS204 504939.839 577002.545 3129.066 RBS301 505016.728 576773.451 3128.955 RBS302 505031.704 576820.793 3128.742 RBS303 505061.320 576916.282 3128.671 RBS
304 505075.976 576963.877 3129.153 RBS401 505143.905 576789.016 3128.242 RBS402 505179.418 576882.476 3127.930 RBS N E Elev.
Data Collection Information
Difference Between 6/19/09 Stakeout and 5/27/09 Base Coordinates

C-49
June 19, 2009 (Page 2 of 2)
304 505075.976 576963.877 3129.153 RBS401 505143.905 576789.016 3128.242 RBS402 505179.418 576882.476 3127.930 RBS N E Elev.
5001 505292.677 576761.862 3129.349 0.014 0.011 0.0085006 504839.447 576173.751 3132.555 0.000 -0.006 0.0275007 504914.969 577217.896 3129.648 0.002 0.018 -0.0045008 505153.509 577203.238 3128.978 -0.011 0.027 0.0035009 505185.581 576722.831 3128.758 0.001 -0.011 0.0255101 504802.954 576938.414 3129.644 -0.002 0.017 -0.0205102 504851.084 576924.732 3129.617 -0.001 -0.010 -0.0085103 504899.169 576911.115 3129.717 -0.008 0.002 -0.0045104 504946.967 576897.263 3129.798 0.004 -0.009 0.0055105 505018.158 576877.955 3128.816 0.013 0.022 0.0095106 505046.491 576868.461 3128.716 0.023 0.007 0.0185107 505066.236 576864.570 3128.492 0.007 -0.004 -0.0025108 505113.883 576849.547 3128.621 0.021 -0.023 0.0075109 505161.792 576835.750 3128.044 0.005 0.013 0.0145110 505210.046 576822.505 3128.527 -0.013 -0.024 0.0415111 505253.509 576811.390 3128.656 0.014 0.014 0.0065112 505305.985 576794.703 3127.597 -0.007 0.010 0.0315113 505356.508 576763.953 3128.707 0.004 0.007 0.0265114 505407.464 576725.413 3132.137 -0.011 -0.008 0.0385201 504857.879 576820.087 3129.647 0.004 -0.021 -0.0025202 504878.642 576865.591 3129.936 0.010 -0.036 0.0075203 504919.350 576956.767 3129.198 0.000 0.015 0.0085204 504939.843 577002.546 3129.066 0.004 0.001 0.0005301 505016.749 576773.466 3128.971 0.021 0.015 0.0165302 505031.685 576820.814 3128.746 -0.019 0.021 0.0045303 505061.331 576916.283 3128.677 0.011 0.001 0.0065304 505075.972 576963.881 3129.162 -0.004 0.004 0.0095401 505143.911 576789.017 3128.255 0.006 0.001 0.0135402 505179.432 576882.501 3127.935 0.014 0.025 0.005
0.004 0.003 0.010 Avg-0.019 -0.036 -0.020 Min0.023 0.027 0.041 Max
Difference Between 6/19/09 Stakeout and 5/27/09 Base Coordinates

D-1
APPENDIX D
TIME-SERIES SUBSIDENCE GRAPHS
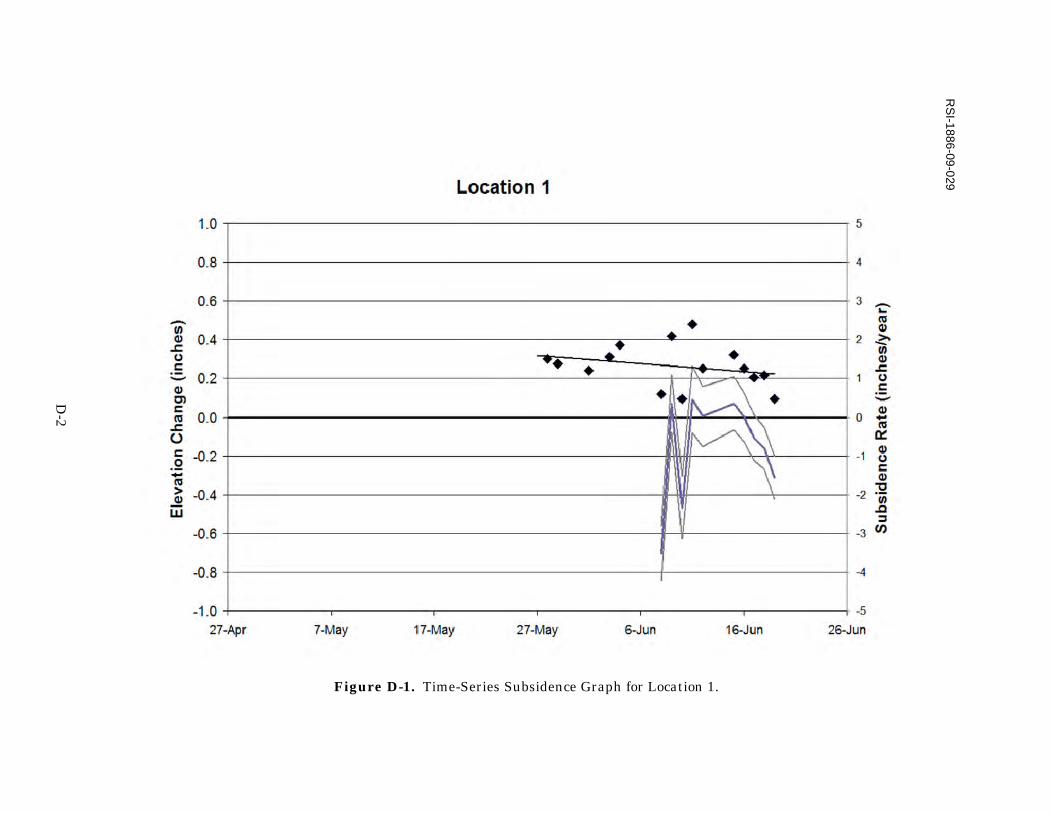
Figure D-1. Time-Series Subsidence Graph for Location 1.
RS
I-1886-09-029
D-2
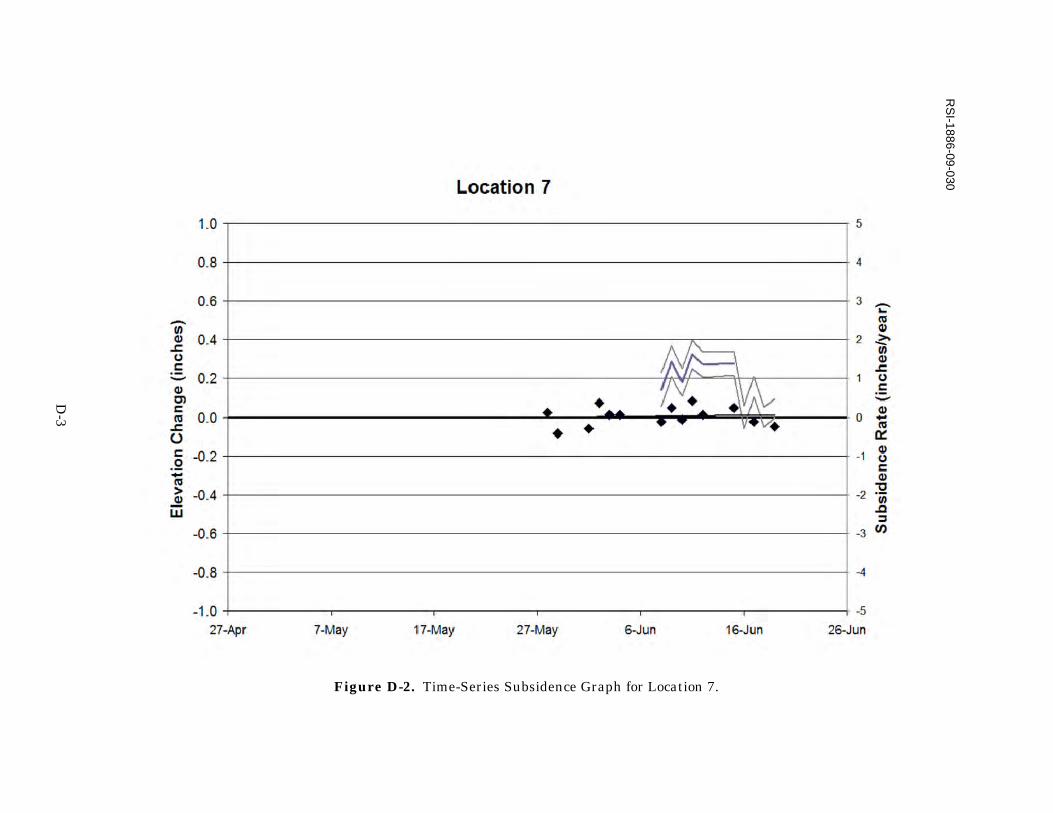
Figure D-2. Time-Series Subsidence Graph for Location 7.
RS
I-1886-09-030
D-3

Figure D-3. Time-Series Subsidence Graph for Location 8.
RS
I-1886-09-031
D-4

Figure D-4. Time-Series Subsidence Graph for Location 9.
RS
I-1886-09-032
D-5

Figure D-5. Time-Series Subsidence Graph for Location 101.
RS
I-1886-09-033
D-6

Figure D-6. Time-Series Subsidence Graph for Location 102.
RS
I-1886-09-034
D-7

Figure D-7. Time-Series Subsidence Graph for Location 103.
RS
I-1886-09-035
D-8

Figure D-8. Time-Series Subsidence Graph for Location 104.
RS
I-1886-09-036
D-9

Figure D-9. Time-Series Subsidence Graph for Location 105.
RS
I-1886-09-037
D-10

Figure D-10. Time-Series Subsidence Graph for Location 106.
RS
I-1886-09-038
D-11

Figure D-11. Time-Series Subsidence Graph for Location 107.
RS
I-1886-09-039
D-12

Figure D-12. Time-Series Subsidence Graph for Location 108.
RS
I-1886-09-040
D-13

Figure D-13. Time-Series Subsidence Graph for Location 109.
RS
I-1886-09-041
D-14

Figure D-14. Time-Series Subsidence Graph for Location 110.
RS
I-1886-09-042
D-15

Figure D-15. Time-Series Subsidence Graph for Location 111.
RS
I-1886-09-043
D-16

Figure D-16. Time-Series Subsidence Graph for Location 112.
RS
I-1886-09-044
D-17
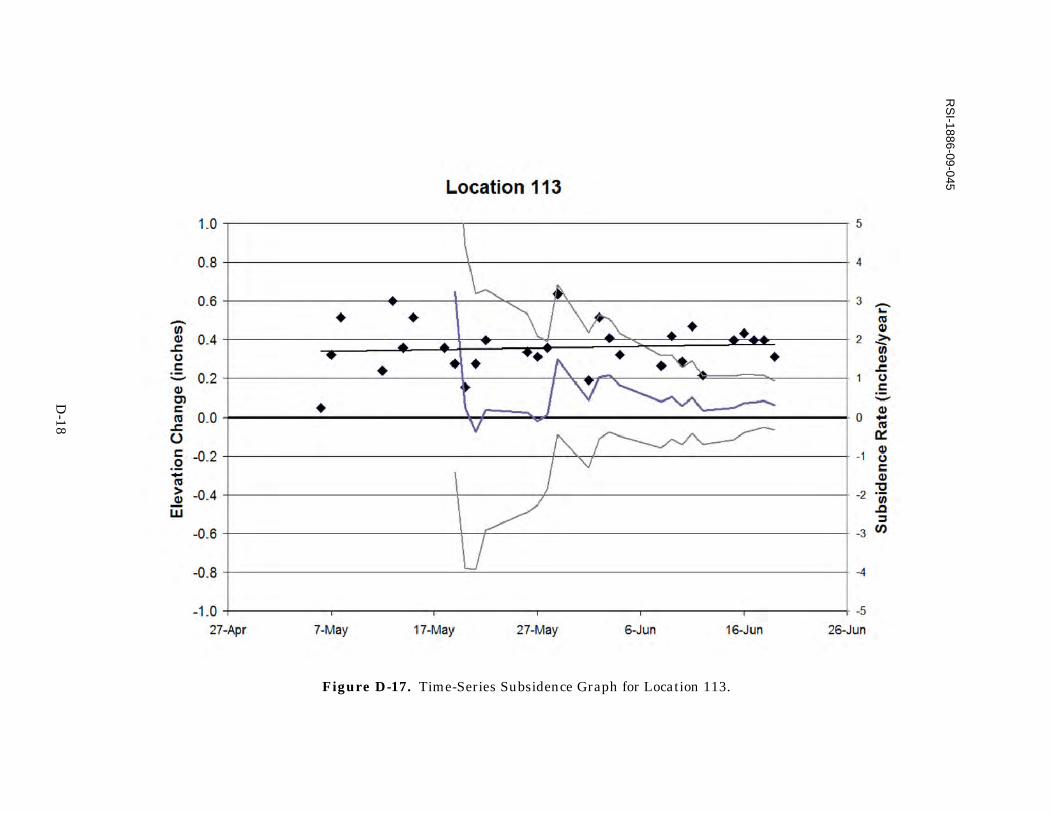
Figure D-17. Time-Series Subsidence Graph for Location 113.
RS
I-1886-09-045
D-18

Figure D-18. Time-Series Subsidence Graph for Location 114.
RS
I-1886-09-046
D-19

Figure D-19. Time-Series Subsidence Graph for Location 201.
RS
I-1886-09-047
D-20

Figure D-20. Time-Series Subsidence Graph for Location 202.
RS
I-1886-09-048
D-21

Figure D-21. Time-Series Subsidence Graph for Location 203.
RS
I-1886-09-049
D-22

Figure D-22. Time-Series Subsidence Graph for Location 204.
RS
I-1886-09-050
D-23

Figure D-23. Time-Series Subsidence Graph for Location 301.
RS
I-1886-09-051
D-24

Figure D-24. Time-Series Subsidence Graph for Location 302.
RS
I-1886-09-052
D-25

Figure D-25. Time-Series Subsidence Graph for Location 303.
RS
I-1886-09-053
D-26

Figure D-26. Time-Series Subsidence Graph for Location 304.
RS
I-1886-09-054
D-27

Figure D-27. Time-Series Subsidence Graph for Location 401.
RS
I-1886-09-055
D-28

Figure D-28. Time-Series Subsidence Graph for Location 402.
RS
I-1886-09-056
D-29

E-1
APPENDIX E
STANDARD OPERATING PROCEDURES FOR THE I&W BRINE CAVERN SITE DATA COLLECTION

E-2
APPENDIX E STANDARD OPERATING PROCEDURES
FOR THE I&W BRINE CAVERN SITE DATA COLLECTION
This Standard Operating Procedure (SOP) outlines the procedure for conducting a survey at the I&W Brine site in Carlsbad, New Mexico. The survey involves the use of a TOPCON GTS-9003A robotic total station.
• Atmospheric Data. Before arriving at the site, record the current weather conditions including: barometric pressure, cloud cover, temperature, wind speed, and relative humidity.
• Safety Meeting. Conduct a safety meeting before any work is done.
• Backsight Setup. The backsight location is on a square concrete slab below the hollow sign at the northern end of Western Commerce Bank, which is on the south side of the irrigation canal and on the east side of Highway 62/180.
a. Take out the wooden tri-pod and unscrew the plate cap.
b. Set up the tri-pod with the longer leg pointing toward the north.
c. Get the tri-pod surface plate as level as possible using the hand level. When adjusting a leg on the tri-pod, place a foot on the leg platform to keep it securely placed in the ground. Look down through the top to get a rough sight of the screw over the point.
d. Open the grey box and take out the level pad, prism, and red indicator.
e. Zero the level pad by turning the black screws so that they line up with the groove. This allows for maximum range of adjustment.
f. Screw the red indicator on top of the prism and screw the prism on top of the level pad.
g. Screw the level pad onto the tri-pod.
h. Look through the sight to see if the level pad is directly over the point. If it is not, use the leveling screws to point the sight at the pin in the concrete. Use the screws on the level pad for aiming only, not for leveling.
i. After the level pad is sighted in on the center of the pin, use the bubble on the level pad to level the pad by adjusting the length of the tri-pod legs. Using the legs to level the pad keeps the system sighted in on the pin by moving it in an arc over the point.

E-3
j. Once the bubble is in the center of the eye, look through the sight to check that the level pad is directly over the point. Commonly, it is slightly off. If so, loosen the tri-pod screw securing the level pad to the tri-pod and carefully slide the level pad so it is centered over the point then retighten the tri-pod screw. Be sure the level pad is seated entirely on the platform and not hanging off. If it is hanging off, the tri-pod should be moved and readjusted accordingly.
k. Loosen the gold set screw to turn the prism toward where the total station will be set up. The white lines on top of the prism should point toward the total station location. The total station will be set up on the canal road on the north side of the canal.
l. Remove the Velcro prism mask. Make sure that the prism is clean. If it has any fingerprints or dirt on it, use the wet wipes found in the total station box (yellow box) to clean it off. Do not use a dry rag or Windex to clean the prism.
m. Measure the height of the prism using the carpenter’s ruler. Measuring with tenths of a foot, place one end of the ruler on the point and measure to the middle of the prism (where white cross hairs meet in the prism). The ruler will not be exactly vertical. Have two people measure from different sides.
n. When both people agree on the measurement, the person recording the measurement in the book subtracts 0.01 foot from the agreed measurement to account for the arc in the ruler during the measurement.

E-4
o. Place two cones next to tri-pod for better visibility.
• Survey Sign. Drive down the road on the north side of the canal and stop at the gate on the southwest corner of the property to set up the orange survey sign. If the sign is rolled up, unroll it and bend the arm to fit into the plastic ends.
• Total Station Instrument Setup. The total station will be located near the southeast corner of the property on the canal road. A pin will be located in a piece of concrete on the road next to the corner fence post. (Try not to drive over the pin)
a. Place the remaining orange cones in front of the vehicle across the canal road.
b. Set up the fiberglass tri-pod with the longer leg pointing toward the north.

E-5
c. Get the tri-pod as level as possible using the hand level. When adjusting a leg on the tri-pod, place a foot on the leg platform to keep it securely placed in the ground.
d. Open the yellow box and take out the robotic total station and screw it onto the top of the tri-pod.
e. Zero the total station pad by turning the black screws so that they line up with the groove. This allows for maximum range of adjustment.
f. Look through the sight to see if the total station is directly over the point. If it is not, use the leveling screws to point the sight at the pin in the concrete. Use the screws on the level pad for aiming only, not for leveling.
g. After the level pad is sighted in on the pin, use the circular bubble on the level pad to level the pad by adjusting the length of the tri-pod legs. Using the legs to level the pad keeps the system sighted in on the pin by moving it in an arc over the point.
h. Once the bubble is in the center of the eye, look through the sight to check that the level pad is directly over the point. Commonly, it is slightly off. If so, loosen the tri-pod screw securing the instrument to the tri-pod and carefully slide the instrument so it is centered over the point then retighten the tri-pod screw. Be sure the level pad is seated entirely on the platform and not hanging off. If it is hanging off, the tri-pod should be moved and readjusted accordingly.
i. Once the total station has been leveled using the circular level, use the straight line level to make more precise adjustments. Line up the level with two screw posts and use the black screws to bring the bubble to the center. Next, rotate the instrument and line up the level using one previous screw post and the third. Use the black screw on the third post to bring the bubble to the center. Next, rotate the instrument back to the first two screw posts and check the level. Then, check the level from each of the three sides.

E-6
j. Turn on the total station by pressing the green power button on the right side of the unit for about 2 seconds. Once the unit is booted up, pres the “Star” key. This will bring up the entry screen. Select the button on the far right of the middle row on the screen. This will bring up the computer leveling system. The level is measured in degrees, minutes, and seconds. Use the black screws to adjust for level. The measurements need to be less than 30”, but it should be less than 10”. (The computer leveling system is very sensitive so adjusting the screws slightly will give noticeable results.)
k. Raise the antenna on the total station.
• Job Setup.
a. Take the hand-eld unit (TOPCON FC-2500) out of the grey box and turn it on.

E-7
b. Double-click on the Topcon program on the desktop of the unit.
c. The first thing that will come up is a menu to open a job. Click ‘New’ at the bottom. The job name format is “IW_date of survey”;.e.g.:, IW_061109.
d. Type in ALL three of the user’s initials for the ‘created by’ value.
e. Click ‘Next’ though the following screens (nothing should change). Click ‘Finish’ at the top.
f. Go back to the total station.
g. Press the ‘Star’ key.
h. There will be 11 selections. Click on the bottom left button [PPM]. This is where the daily atmospheric conditions are input.
i. Press ‘Enter’ and then put in the average temperature that is expected during the survey (it will most likely not be the same temperature that was recorded at the beginning of the day). Record this temperature in the orange logbook. Press ‘Enter’ and then put in the atmospheric pressure that was recorded earlier. Then press ‘Enter’ again to complete the data input.
j. Press the ‘Esc’ key.
k. Measure the height of the total station using the carpenter’s ruler. Measuring with tenths of a foot, place one end of the ruler on the point and measure to the middle of the scope. There are lines on either side of the unit to define the location of the middle of the scope. The ruler will not be exactly vertical. Have two people measure from different sides.
l. When both people agree on the measurement, the person recording the measurement in the book subtracts 0.01 foot from the agreed measurement to account for the arc in the ruler during the measurement.

E-8
m. Manually sight in the total station onto the backsight prism. The knobs on the right side of the unit are the adjustment knobs. They are electronic and not mechanical adjustments.
n. On the screen with the 11 boxes, select the box that is second over from the top left (looks like a crosshair) which will collimate the instrument. This will shoot the backsight automatically. The instrument will beep when it is done and return to the main menu.
• Survey. Now the control of the instrument is going to be turned over to the hand-held unit, which will record the survey measurements.
a. Take out the mobile tri-pod. Take the prism and locator unit (RC-3) out of the yellow box. Put the grey battery in the locator unit. Attach the locator unit to the top of the prism and screw the prism onto the top of the mobile tri-pod. The mobile tri-pod will blow over in high winds, so be careful.
b. Push the green ‘Power’ button on the locator unit to turn it on.
c. From the total station, double-click ‘Standard Measurement’ from the desktop screen.
d. Click on ‘PROG’. Next, click the ‘Ext.Link’ button in the bottom left corner of the screen. Next, click ‘Execute’. The screen will say that it is being remotely controlled. The hand-held unit should make a cool sound after it connects.
e. The user should notice a screen pop up on the hand-held unit prompting for selection of a Bluetooth device. Highlight the item called ‘RC-3R….’ and click ‘Select’. After a few seconds, the screen will disappear and the Bluetooth connection should be enabled. An icon on the upper right part of the screen will help to verify.
f. From the main menu on the hand-held unit, go to ‘Import’, then ‘From Job’, highlight the ‘BASE_IW2’ dataset and click ‘Select’. Fill the box next to ‘Code Library’. Click ‘Finish’. It should import 6 codes and 30 points. Then click ‘Close’.
g. Go to ‘Setup’, then ‘Backsight’.
h. Go to ‘From List’ which is an icon on the right of the screen. The location of the occupy point is point ‘3’; highlight it and select ‘OK’.
i. Input the height of the instrument (total station) that was measured when it was set up.
j. Input the height of the rod (backsight) that was measured when it was set up. Check the box next to ‘Fixed HR at BS’.
k. The location of the backsight point is point ‘6’; select it the same way point 3 was selected.

E-9
l. Check box ‘Measure distance to BS’.
m. Click ‘HC set’ in the bottom right corner. The distance should be very close to 959.070. Click ‘Accept’.
n. Go back to ‘BS Setup’ tab and click on the ‘Check BS’ button. This will measure the error for the instrument. Click ‘Accept’. The error should not be more/less than about ±0.020. Click ‘Close’ at the top right corner.
o. Shoot the backsight as a stakeout point. Go to ‘Stake’, then ‘Points’, and manually select the backsight point as point 6 from the list. Set the rod height to the recorded height of the backsight. Click ‘Stakeout’. Click ‘Store’, then click ‘Next Pt’. Close out of Stake and return to the main job menu.
p. From the main job menu on the hand-held unit, go to ‘Stake’, then ‘Points’ and be sure to select point ‘101’ if it does not default to it. Change the rod height to 6.0 foot and click ‘Stakeout’. The hand-held unit will display distance measurements of how close the locator unit is to the reference point. Walk to point 101.
q. Make sure that the locator unit on the mobile tri-pod is set to Channel 1 by pressing the blue button once. Immediately after pressing the channel button, press the large orange button to signal the instrument. The locator unit should be aimed as close as possible to directly at the instrument. This allows clearest communication between the two devices. When a link between the devices is established, the locator unit will beep a couple times and the hand-held unit will confirm by displaying the distance measurements to the reference point of the baseline survey (BASE_IW2). The total station follows the location of the prism optically. Do not break the line of sight between the total station and the prism, if possible. The line of sight will be broken at a few places along the survey; to restore communication between the devices, follow the steps in (p).

E-10
r. Place the point of the rod on the dimple in the rebar stake or cap. Level the rod using the bubble and adjusting the legs for support.
s. Observe the difference measurements. If the differences are more than about 0.050, then the backsight needs to be shot again (steps g through m for Survey). If, during any part of the survey, large difference values are observed and you think the backsight is off, close out of ‘Stake’ and click ‘Setup’, then ‘Backsight’. Leaving the original inputs alone, check the box at the bottom that reads ‘Turn to BS’ and click ‘Check BS’ to recheck the difference values (Do not click ‘HC Set’ as this will reset the backsight information to a new reading which will void all survey data collected). Rarely, the instrument will focus on a shiny object other than the backsight. If this is apparent, the instrument will need to be collimated again (steps m and n under Job Setup).
t. When the rod is level and the difference values look reasonable, click ‘Store’, then click ‘Next Point’. The hand-held unit should make a cool noise. Verify that the next point the instrument is referencing is the next point you are walking toward.
u. For the point at the Eugenie 1 well (104), the rod needs to be removed from the leg supports. Set the rod tip in the dimple on the bottom of the well casing and align it so that the leveling bubble is against the well casing.

E-11
v. All rod heights are 6.0 foot except for point 114. The prism is taken off of the rod and placed directly on the wall in the outlined circle. Change the rod height to 0.25 foot. After the point is stored, be sure to change the rod height back to 6.0 foot.
w. Point 1 (the rail) is shot as a stakeout and as a survey point. To shoot the point as a survey point, close out of the stakeout mode, click on ‘Survey’, then ‘Topo’. Manually change the point number to 1 and choose ‘BM’ from the drop-down menu. Click ‘Accept’. Fill the button for ‘Store As Check Point?’ and click ‘OK’.

E-12
x. Power off the locator unit.
y. Close out of ‘Survey’ and click ‘Setup’, then ‘Backsight’. Leaving the original inputs alone, check the box at the bottom that reads ‘Turn to BS’ and click ‘Check BS’. Verify that the difference values are not too large.
z. The survey is now complete. Power off the equipment and pack it back in the cases and put the tri-pods and cones back in the vehicle.

F-1
APPENDIX F
HEALTH AND SAFETY PLAN FOR THE I&W BRINE CAVERN SITE

HEALTH AND SAFETY PLAN
FOR THE
I & W BRINE CAVERN SITE
3005 S. CANAL STREET,
CARLSBAD, EDDY COUNTY, NEW MEXICO
prepared for
NEW MEXICO OIL CONSERVATION DIVISION
1220 South St. Francis Drive Santa Fe, New Mexico 87505
prepared by
RESPEC
5971 Jefferson NE, Suite 101
Albuquerque, New Mexico 87109
May 2009

i
CONTENTS
1.0 SAFETY POLICY ............................................................................................... 1
2.0 SITE INFORMATION SUMMARY ...................................................................... 1
3.0 RESPONSIBLE PERSONS LIST ....................................................................... 2
4.0 PERSONNEL TRAINING AND EQUIPMENT .................................................... 3
5.0 SITE AND VICINITY HAZARDS......................................................................... 5
5.1 Danger of Imminent Collapse....................................................................... 5
5.1.1 Early Warning System and Evacuation Plan...................................... 5
5.2 Underground Pipelines and Other Utilities ................................................... 5
5.3 Proximity to Busy Highways......................................................................... 6
5.4 Moving Vehicles On-Site.............................................................................. 6
5.5 Open Tanks ................................................................................................. 6
5.6 Natural Hazards ........................................................................................... 6
6.0 EMERGENCY INFORMATION .......................................................................... 7
7.0 DRUG AND ALCOHOL POLICY ....................................................................... 8
8.0 DISCIPLINARY ACTIONS ................................................................................. 9
APPENDIX A. DAILY PERSONNEL SITE SAFETY FORM .................................... A-1
APPENDIX B. SIGNATURES OF AUTHORS.......................................................... B-1
LIST OF FIGURES
Figure 1. Site Diagram
Figure 2. Vicinity Map
Figure 3. Expected Sinkhole Limit Figure 4. Driving Route From the I & W Brine Cavern Site to the Carlsbad
Medical Center Figure 5. Driving Route From the I & W Brine Cavern Site to the Carlsbad
Fire Department

1
1.0 SAFETY POLICY
RESPEC’s policy is to prevent injuries and illnesses at all locations of responsibility, including off-site operations. Work should be conducted in such a manner that workers and other people are protected and the environment is not harmed. Safety is an integral part of each job, not a stand-alone program.
RESPEC has a high level of commitment to the health and safety of our personnel
and everyone else on project work sites. Safety is the first priority for everyone involved in each project. Our goal is to complete the project successfully, without a lost-time accident or a near-miss. For the years 2006 through 2008, our workers’ compensation experience modifier was 0.79, 0.82, and 0.87, respectively.
2.0 SITE INFORMATION SUMMARY
We have designed this Health and Safety Plan (HASP) for the project at the I & W Brine Cavern site in Carlsbad, New Mexico. The project site consists of a 3.27-acre property containing a tank battery and several accessory buildings (see Figure 1. Site Diagram). The east and west sides of the property are partially fenced. There are technical reasons to believe that the collapse of the cavern underlying the site may be imminent.
The site is located at 3005 South Canal Street, near the inverted Y formed where
U.S. Highway 285 and U.S. Highway 62 meet in Carlsbad, Eddy County, New Mexico (see Figure 2. Vicinity Map). The surface landowner of record is I & W Inc. This landowner evacuated the site in April 2009.
RESPEC’s tasks at the project site are as follows:
1. Install an early warning system at the site to monitor subsidence and provide appropriate alarms of imminent cavern collapse.
2. Characterize the shape and volume of the brine cavern.
3. Mitigate cavern collapse.

2
3.0 RESPONSIBLE PERSONS LIST
Client:
Mr. Jim Griswold New Mexico Oil Conservation Division (OCD) 1220 South St. Francis Drive Santa Fe, NM 87505 Office telephone number: (505) 476-3465 Cell phone number: (505) 301-5398 Project Manager:
Dave Henard RESPEC Water & Natural Resources 5971 Jefferson NE, Suite 101 Albuquerque, NM 87109 Office telephone number: (505) 268-2661 Cell phone number: (505) 660-4853
Site Health and Safety Officer:
Raul Rascon RESPEC Engineering 302 North Canal Street, Suite C Carlsbad, NM 88221-2261 Office telephone number: (575) 302-3009 Cell phone number: (575) 706-1571
Site Engineer:
Wes DeYonge RESPEC Engineering 302 North Canal Street, Suite C Carlsbad, NM 88221-2261 Office telephone number: (575) 885-1583 Cell phone number: (575) 706-2959

3
Other Responsible Persons:
Leo Van Sambeek RESPEC Engineering 3824 Jet Drive Rapid City, SD 57703 Office telephone number: (605) 394-6457 Cell phone number: (605) 484-2516 Bill Goodman RESPEC Engineering 3302 Heirloom Rose Place Oviedo, FL 32766 Office telephone number: (315) 573-6366 Cell phone number: (315) 573-6366 Angus Robb RESPEC Professional Associate 5971 Jefferson NE, Suite 101 Albuquerque, NM 87109 Office telephone number: (505) 268-2661 Cell phone number: (505) 379-2072 Michael Wallace RESPEC Water & Natural Resources 5971 Jefferson NE, Suite 101 Albuquerque, NM 87109 Office telephone number: (505) 268-2661
4.0 PERSONNEL TRAINING AND EQUIPMENT
Identifying potential job hazards before the project starts is vital to the execution of a successful safety program. Knowing what hazards exist helps workers to avoid injuries. Taking proper precautions can help workers avoid or lessen injury. The purpose of this

4
Health and Safety Plan is to make all personnel aware of hazards so that they may take necessary precautions.
Therefore, before working at the I & W site, all project personnel, including
subcontractors, must become familiar with this HASP. All project personnel will be required to sign and acknowledge that they have a clear understanding of the HASP and must sign the Daily Personnel Site Safety Form, which is included in Appendix A. In addition, all site personnel must meet OSHA requirements as set forth in 29 CFR 1910.120.
Project personnel must attend tailgate safety meetings before starting work each day.
Because safety is everyone’s responsibility, all on-site personnel will be given an opportunity to discuss any hazards encountered on the job and to ask questions about proper procedure for dealing with and/or reporting them. Typical topics for tailgate meetings include falling objects, pinch points, overhead power lines, tripping hazards, and the buddy system, as well as hazards and precautions detailed below. The Site Health and Safety Officer will maintain on-site all records of health and safety training for site personnel.
While workers should always be encouraged to use the buddy system to help each
other avoid injury, each worker must also be made aware of the notification requirement when he or she is the only worker on-site. In that case, the worker must notify the Site Health and Safety Officer by cell phone upon entering and upon leaving the site. If the Site Health and Safety Officer is the sole person on-site, he must notify the Site Engineer by cell phone upon entering and upon leaving the site.
Level D personnel protective equipment (PPE) will be required throughout the I & W
Brine Cavern project. Level D protective equipment includes long pants, safety boots, safety glasses, gloves, and a hard hat. This level of PPE is “selected when no respiratory protection and minimal skin protection is required, and the atmosphere contains no known hazard and work functions preclude splashes, immersion, or the potential for unexpected inhalation of, or contact with, hazardous levels of any chemicals” (SEL, AEL 2002, 2003, 2004).

5
5.0 SITE AND VICINITY HAZARDS
5.1 DANGER OF IMMINENT COLLAPSE
The most obvious on-site hazard is the danger of cavern collapse. For this reason, the site will be completely enclosed by a security fence, and there will be only one gate, which will be located on the north side of the property (see Figure 1. Site Diagram). Only authorized personnel engaged in legitimate activities of this project will be allowed on-site, and only essential vehicles will be admitted to the work area. On-site parking will be provided on the east side of the property and will be appropriately delineated by flags and orange traffic cones and is also indicated on Figure 1. Site Diagram.
5.1.1 Early Warning System and Evacuation Plan
Before any other work at the site commences, an early warning system must be installed. This system will monitor subsidence and give appropriate alarms in the event of ground movement. The Site Health and Safety Officer must make workers aware of the location and function of all components of the system and tell workers what types of alarms to expect.
In the event of an alarm from the early warning system or any other indication of
ground movement, workers in the potential danger zone (see Figure 3. Expected Sinkhole Limit) will immediately evacuate to the on-site parking area. After all on-site personnel have been accounted for, they will exit the site. At a predetermined off-site location, they will be given further instructions by the Site Health and Safety Officer or his representative.
The possibility of a cavern collapse has required a detailed plan for evacuating the
entire vicinity of the site. The Site Health and Safety Officer has a copy of this plan, which is maintained by Eddy County Emergency Management. The contact person in that office is Joel Arnwine, who can be reached at 885-3581 (general office number), 628-5450 (direct office number), or 361-3404 (cell phone number).
5.2 UNDERGROUND PIPELINES AND OTHER UTILITIES
In the area in which the I & W Brine Cavern site is located, operators of digging or drilling machinery run the risk of encountering underground utilities. Puncturing pressurized gas lines or severing electrical cables could result in loss of life in addition to loss of service to utility customers. Therefore, the Site Health and Safety Officer or

6
his representative must contact New Mexico One Call for a clearance before any digging or drilling is done on-site or in the vicinity. RESPEC will maintain a New Mexico One Call log to track telephone calls and faxed messages from utility companies.
5.3 PROXIMITY TO BUSY HIGHWAYS
The site is bordered on its north side by U.S. Highway 285. Due care must be exercised when entering or exiting the site. Special care must be taken when crossing U.S. Highway 285 or other adjacent highways on foot for surveying or other purposes.
5.4 MOVING VEHICLES ON-SITE
Vehicles as well as pedestrians may be moving on-site at any time. Due to the congested nature of the on-site parking area, both drivers and pedestrians must exercise great caution, especially when a vehicle is backing up.
5.5 OPEN TANKS
The many on-site storage tanks present a special hazard. Workers must not enter tanks through open manways or any other openings because of the possible presence of residual fumes or other harmful elements.
5.6 NATURAL HAZARDS
Numerous natural hazards may be encountered at the site or in the vicinity. The following list comprises the more common natural hazards identified in the area.
Black widow spiders, hornets, bees, fire ants, scorpions, and rattlesnakes are
native to the region. To avoid the bites or stings, workers must wear leather gloves when handling debris or inspecting equipment. Ant piles, hornet/bee nests, and venomous reptiles must be avoided, and workers should use the buddy system to help each other watch for these hazards. Any worker who has received a venomous bite or sting should be observed closely for signs of a severe reaction, and if necessary, emergency medical personnel should be summoned.
Lightning, hail, rain, sun exposure, high heat, and humidity levels are common
in the area. All workers must pay attention to weather forecasts. Afternoon thunderstorms are common and bring strong winds, hail, heavy rain, and lightning.

7
Heavy equipment must be evacuated, work stopped, and shelter taken when storms approach.
Strong levels of sunlight, high temperatures, and high humidity levels
(especially in the excavation area) can lead to sunburn, heat stress, heat exhaustion, and heatstroke. Long-sleeve shirts and sunscreen should be worn to minimize exposure to direct sunlight. Water and electrolytes should be ingested continuously throughout the day. Cool-down breaks should be taken in an air-conditioned heavy equipment/vehicle/office at least once per hour for fifteen minutes. Workers should check each other for signs of heat exposure (muscle cramps, heat rash, clumsiness, excessive sweating, redness in the face, chills, nausea, vomiting, shaking, or unconsciousness).
Heatstroke is a life-threatening emergency. In the event of heatstroke, emergency
medical personnel must be summoned and the affected person must be removed from any heat source. The affected person’s body temperature must be reduced by any means necessary.
Water, ice, and first aid equipment will be kept in the Site Health and Safety Officer’s marked vehicle.
6.0 EMERGENCY INFORMATION
An ABC fire extinguisher, a first aid kit, and an eyewash station will also be maintained in the Site Safety Officer’s marked vehicle. Additional safety equipment (hard hats, safety glasses, leather and latex gloves, and ear protection, etc.) will be provided to workers if such equipment becomes lost or damaged during the workday.
In the event of overt personnel exposure (i.e., skin contact, inhalation, or ingestion of
a harmful substance), personal injury, or any severe illness, the victim will be transported to and treated at the Carlsbad Medical Center. For any emergency, call 911.
The addresses and non-emergency telephone numbers for the Carlsbad Medical
Center and the Carlsbad Fire Department are given on page 8 of this HASP.

8
Closest Hospital with Emergency Room:
Carlsbad Medical Center 2430 W. Pierce St. Carlsbad, NM 88220
Emergency Room telephone number: (575) 887-4121 Administration telephone number: (575) 887-4100
Figure 4 shows the driving route from the I & W Brine Cavern site to the Carlsbad Medical Center.
Carlsbad Fire Department:
409 S. Halagueno St. Carlsbad, NM 88220 Telephone number: (575) 885-3125
Figure 5 shows the driving route from the I & W Brine Cavern site to the
Carlsbad Fire Department.
7.0 DRUG AND ALCOHOL POLICY
RESPEC requires its employees, professional associates, and subcontractors to be free from the influence of drugs or alcohol at any workplace where a RESPEC project is in progress and to abide by all federal, state, and local laws concerning the possession of distribution of controlled substances. The company’s policy on drugs and alcohol is stated below.
RESPEC adopted a drug-free workplace policy in 1991 to establish reasonable
measures to ensure that employee drug or alcohol use does not jeopardize the success of our operations or otherwise affect the company, its employees, or its customers. It is unlawful for any employee engaged in the performance of work to manufacture, distribute, dispense, possess, or use a controlled substance in the workplace. Any employee who is convicted of a violation of a criminal drug law statute occurring in the workplace or who admits in a court of law to the commission of such a criminal drug law violation, whether or not such an admission results in a conviction, may be subject to appropriate disciplinary action, up to and including termination. In addition, the

9
employee may be required to participate satisfactorily in a drug abuse assistance or rehabilitation program. For purposes of this policy, the workplace includes any approved location where work assignments are performed by the employee. As a condition of employment, each employee agrees to abide by the terms of this policy. Furthermore, the hiring of all new employees is contingent upon their passing a drug screening test. Any employee or subcontractor employee on this project reporting to work intoxicated or apparently under the influence of intoxicants or drugs will not be permitted on the work site. These individuals will be tested for substance abuse and transported to their residence. A positive test for a controlled substance will result in termination from the project.
8.0 DISCIPLINARY ACTIONS
Project personnel will be issued written warnings for violations of the established rules and regulations for safely conducting work under this project. Persons with repeated violations, continual disregard for the health and safety rules, or flagrant serious violations will be dismissed from the project. Personnel will be notified of a one-year probationary period with the issuance of their second violation warning. If an additional warning occurs during the probationary period, the individual will be dismissed from the project.

Figure 1. Site DiagramLEGEND Gate
Parking Area

Figure 2. Vicinity Map

Figure 3

A-1
APPENDIX A
DAILY PERSONNEL SITE SAFETY FORM

DAILY PERSONNEL SITE SAFETY FORM
All persons signing below testify that they have read the Health and Safety Plan for the I & W Brine Cavern Site
and have attended the Daily Site Safety Meeting.
Signature and Printed Name Company Date
Safety topics for __________________ (today’s date):
_______________________________________________ __________________________________________
_______________________________________________ __________________________________________
_______________________________________________ __________________________________________
_______________________________________________ __________________________________________

B-1
APPENDIX B
SIGNATURES OF AUTHORS
This Health and Safety Plan was prepared by the undersigned.
David A. Henard, Project Manager (Certified per 29 CFR 1910.120) Angus Robb, Professional Associate Mining Engineer (Certified per 29 CFR 1910.120)

G-1
APPENDIX G
BRINE WELL CHRONOLOGY REPORT

G-2
APPENDIX G BRINE WELL CHRONOLOGY REPORT
July 16, 2008: • The Oil Conservation Division (OCD) receives a telephone call from the operator of Jim’s
Water Service reporting the “disappearance” of its brine well. The Jim’s Water Service brine well (BW-005) is located on state trust land approximately 17.3 miles southeast of Artesia, 400 feet north of Hagerman Road (CR 217) and 2.4 miles southwest of State Highway 360.
• The OCD dispatches staff members to the site.
• Eddy County shuts down CR 217.
July 17, 2008: • OCD staff establishes a mobile incident command center at the Jim’s Water Service site.
(The OCD, the Eddy County Office of Emergency Management, the State Land Office and the Bureau of Land Management maintain the mobile incident command center at the site until July 24, 2008, when a fence is installed around the sinkhole and CR 217 is re-opened.) As of July 17, 2008, the sinkhole is approximately 200 feet across and an unknown depth; it more than doubled its size in the first 24-hours after the initial collapse. (The sinkhole continues to grow. As of April 30, 2009 it was approximately 400 feet across and approximately 120 feet deep.)
July 18, 2008: • OCD staff goes to I&W brine well site (BW-006) to review the sonar logs and evaluate the
brine well system. The I&W site is located within the city limits of Carlsbad, between US 285 and US 180/62 where those highways meet at a “Y”-shaped intersection. Two wells are located on the I&W brine well site: the Eugenie #001 and the Eugenie #002. The Eugenie #001 is operational; the Eugenie #002 was plugged in January 2000 after failing an integrity test. The OCD staff’s initial review of the available sonar logs indicates a large roof to the cavern.
• OCD staff speaks by phone with a karst expert from the Bureau of Land Management, who recommends that the OCD require I&W to close its brine well because if it collapsed the impact on the Carlsbad Irrigation District canal would be catastrophic.
• OCD staff recommends to I&W that it shut in its remaining brine well based on the risk to the public and the environment.

G-3
July 22, 2008: • OCD staff telephones I&W in the morning to require I&W to shut in the Eugenie #001
brine well.
• In a second telephone conversation with I&W, OCD staff indicate that the OCD will pursue its available remedies if I&W does not voluntarily shut in its brine well.
• During a third telephone call, I&W informs OCD staff that it shut in production at noon. OCD staff instruct I&W to submit plugging procedures for the Eugenie #001.
July 23, 2008: • Energy, Minerals and Natural Resources Department (EMNRD) Cabinet Secretary
Joanna Prukop directs the OCD to take the following actions regarding brine wells in New Mexico:
1. Evaluate rules concerning brine wells;
2. Conduct an internal audit of OCD records on all existing brine wells;
3. Conduct inspections of all existing brine wells;
4. Continue monitoring the collapse of the Jim’s Water Service brine well, and ensure that a protective fence is installed with “keep out” signs; and
5. Work with the Bureau of Land Management, the State Land Office, the New Mexico Bureau of Geology and Mineral Resources, and the National Cave and Karst Research Institute to assess horizontal and vertical movements to project any future subsidence at the Jim’s Water Service site.
August 1, 2008: • OCD staff sends a “Brine Well Information Request” form to all brine well operators in
New Mexico requiring the operators to provide detailed information about their operations, including information on siting, well construction, operations history, monitoring and an estimate of the total volume of brine produced and the volume of the cavern.
October 31, 2008: • I&W plugs the Eugenie #001.
November 3, 2008: • At approximately 11:30 a.m. employees at the Loco Hills Water Disposal Company
observe cracks in the earth at the site -- an early indication of a pending collapse -- and call the OCD to report the cracks. The Loco Hills Water Disposal Company brine well site (BW-021) is located on state trust land 150 feet from County Road 217 near Loco Hills.

G-4
The well was plugged on June 19, 2008, after it failed a mechanical integrity test on June 18, 2008.
• At approximately 1:30 p.m. the Loco Hills Water Disposal Company brine well collapses. The operator reports a sinkhole approximately 50 feet across and approximately 30 feet deep. Local, county, and state officials are notified and County Road 217 is closed.
• The OCD dispatches staff to the site to set up a mobile incident command center. (OCD staff remain on site until November 8, 2008, when Southwest Safety Specialists, a consultant for Loco Hills Water Disposal Company, assumes incident command of the site.)
November 11, 2008: • The operator completes the installation of a barbed-wire fence at the Loco Hills Water
Disposal sinkhole. As of this date, the sinkhole measures 195 feet across.
November 14, 2008: • Secretary Joanna Prukop issues a six month moratorium on new brine wells in
geologically sensitive areas, and directs the OCD to work with the Environmental Protection Agency, other states, technical experts, and oil and gas industry representatives to examine the causes of the collapses, and provide the Secretary with a report and recommendations by May 1, 2009.
January 29, 2009: • The OCD establishes an internal policy regarding applications for permits to drill wells
located within a one-half mile radius of the I&W brine well facility. District II, which would receive such applications, is to contact the OCD’s Environmental Bureau in Santa Fe upon receipt of the application and the District Supervisor and the Environmental Bureau are to evaluate the application and make a joint decision on whether to approve it.
March 9, 2009: • OCD staff estimate the cavern diameter at the I&W brine well site to be greater than 400
feet. The calculation is based on the amount of brine produced at the facility according to available production records.
March 11, 2009: • OCD staff visits the I&W facility to request that it cease its trucking operations on the
site, be careful of any fluid discharges on the site, and submit the contingency plan required by its permit.

G-5
March 26–27, 2009: • The OCD hosts a Brine Well Work Group attended by OCD technical staff, the Bureau of
Land Management, the State Land Office, the New Mexico Bureau of Geology and Mineral Resources, and the National Cave & Karst Research Institute to discuss effective tools for evaluating the potential for collapse of historic closed as well as presently operational brine wells and LPG storage caverns in New Mexico. The group also discusses siting, construction and operational criteria for future operations. Some participants express significant concern that the I&W brine well “could” or “will” collapse because it is similar in geology and production life to the two wells that already collapsed. Participants discuss the dangers posed by the collapse of a well located in a developed area of the city of Carlsbad.
April 1, 2009: • OCD staff brief Director Fesmire and Secretary Prukop on the I&W brine well situation.
• OCD staff contact the I&W plant manager by phone to request that I&W cease operations at the site immediately, and request that I&W’s owners call the OCD.
April 2, 2009: • EMNRD/OCD briefs Department of Homeland Security and Emergency Management on
the I&W brine well situation.
• OCD staff continue to speak by phone with available I&W employees, requesting that I&W cease all operations on the site, including the operation of its trucking business, for safety reasons. OCD staff continue to request to speak with the owners of I&W.
• The OCD submits a purchase order request to retain RESPEC, Inc. (RESPEC) to provide technical advice on the I&W brine well situation.
April 3, 2009: • EMNRD/OCD staff conduct a briefing in Santa Fe on the I&W brine well situation. Santa
Fe staff members of the Department of Homeland Security and Emergency Management, the Department of Public Safety, the New Mexico Department of Transportation, and the New Mexico Environment Department attend; representatives of the Eddy County Office of Emergency Management participate by telephone.
• OCD staff call I&W and learn that I&W has retained Hinkle, Hensley, Shanor and Martin, LLP of Roswell as legal counsel.
• OCD legal staff calls counsel for I&W and request that I&W cease operations on the site for safety reasons, and inform counsel that the OCD will take legal action if it cannot obtain voluntary cooperation from I&W.

G-6
• Counsel for I&W responds that I&W will not voluntarily comply with OCD’s request that it cease operations on the site, and that OCD will have to obtain an injunction.
• Counsel for I&W faxes letter to the OCD describing the OCD’s actions as a “taking” of property, and requesting notice of any planned legal action against I&W.
• OCD legal staff calls counsel for I&W to arrange face-to-face meeting with I&W and its counsel to discuss the situation at counsel’s offices in Roswell for the next business day, Monday, April 6, 2009.
April 6, 2009: • OCD Director Mark Fesmire and staff meet with I&W and its legal counsel in Roswell to
brief them on the situation and again request that I&W cease all operations at the site. The OCD informs I&W that it has set aside $130,000 for technical consultants and equipment; I&W suggests that the OCD buy its property for $130,000.
April 9, 2009: • OCD legal staff faxes a letter to counsel for I&W reiterating concerns raised at the April
6, 2009, meeting, and asking that I&W “voluntarily take the following precautions to reduce risk to life and property at I&W’s facility and at neighboring locations”: cease truck traffic at the facility; remove the contents of tanks at the facility, especially tanks containing hazardous substances such as propane; restrict public access to the facility; and cooperate with monitoring.
• The OCD and RESPEC meet in Carlsbad with the Department of Homeland Security and Emergency Management, the Department of Transportation, the National Cave and Karst Research Institute, the Department of Energy, the Bureau of Land Management, the Eddy County Office of Emergency Management, fire and police officials from Carlsbad, representatives from the Carlsbad Irrigation District and local elected officials to brief them on the situation at the I&W facility and prepare an action plan in the event the I&W brine well collapses. A representative of I&W and its counsel attend the meeting.
April 14, 2009: • Counsel for an adjacent property owner contacts OCD by e-mail for information on the
I&W situation.
April 15, 2009: • OCD staff contacts counsel for the adjacent property owner by telephone to discuss the
I&W situation. Counsel informs OCD that trucking operations at the I&W site continue unabated.

G-7
April 17, 2009: • An OCD inspector verifies that activity continues at the I&W site.
• RESPEC submits two documents: “Preliminary Survey of Potential Geophysical Methods for the I & W, Inc. Brine Cavern Project” and “Monitoring and Early-Warning System for Carlsbad I&W, Inc. Brine Operation” to address OCD’s request for recommendations on how to conduct a survey of the brine well cavern and how to provide an early warning system and subsidence monitoring system for the brine well cavern.
• Counsel for I&W informs the OCD in a telephone conversation that I&W will move its operations off the site, but cannot provide timeline for the move.
April 21, 2009: • In a telephone conversation between counsel for the OCD and I&W, the OCD requires
that I&W take the following actions by April 22, 2009: confirm that it has terminated operations on site; provide a schedule for removing any equipment or supplies it intends to remove; provide a schedule for emptying or removing the propane and diesel tanks; and provide a schedule for installing a fence. The OCD stresses that the scheduled actions need to be completed before the OCD and its consultants can install a monitoring system at the site.
April 22, 2009: • I&W’s counsel e-mails a status report to the OCD stating: I&W’s trucks will be off site by
the close of business that day; I&W plans to continue using its maintenance shop and offices until they can be relocated to a suitable facility; the brine tanks have been drained but a full water tank remains on site, and the propane and diesel tanks contain fuel; I&W will continue the weekly monitoring previously required by the OCD and will provide copies of those reports. The e-mail does not provide a schedule for accomplishing these actions.
April 23, 2009: • The OCD legal staff faxes a demand letter to I&W requiring that it take the following
actions: execute and deliver an access agreement to allow the OCD and its consultants access to the site to conduct investigations and monitoring; empty and/or then remove the propane and diesel tanks from the site; recover any equipment I&W intends to remove from the facility; cease operations including truck repair and office activities; install a fence around the facility sufficient to prevent public access; and provide monitoring data previously promised to the OCD. The letter requires a response from I&W by Monday, April 27, 2009, or the OCD will file an injunction in district court seeking an order requiring I&W to take the described actions.

G-8
April 24, 2009: • OCD legal staff is in contact with Eddy County, the City of Carlsbad, the Carlsbad
Irrigation District, and the New Mexico Department of Transportation, and the New Mexico Department of Homeland Security and Emergency Management regarding whether they will join in a lawsuit for injunctive relief seeking an order requiring I&W to cease all uses of the site immediately, in the event that I&W does not voluntarily comply with the OCD’s requests.
• OCD legal staff communicates by telephone with counsel for I&W who indicates that I&W will comply with most but not all of OCD’s requests. The remaining issue is the continued use of the I&W site by I&W for truck maintenance and repair and for office services.
April 27, 2009: • Counsel for I&W informs OCD legal staff that I&W has agreed to cease all of its
operations on its site, and comply with the balance of the requests in the April 23, 2009 demand letter, including fencing off the site to protect the public from accessing the site and allowing OCD technicians access to the site to begin installing monitoring equipment. At this point the injunctive relief issues become moot.
April 28, 2009: • OCD, the Eddy County Office of Emergency Management and the New Mexico
Department of Homeland Security and Emergency Management host an informational public meeting at the P.R. Leyva Middle School located at 800 West Church Street in Carlsbad.
• Counsel for I&W provides the OCD with a re-drafted, signed, access agreement.
April 29, 2009: • RESPEC begins installing monitoring points at the I&W site as part of a surface
subsidence monitoring system. A theodolite will be used to survey the monitoring points to detect movement.
• OCD staff meet with owners of the properties on either side of the I&W site.
• I&W informs the OCD that it plans to remove the above-ground tanks at its facility using a heavy crane.
April 30, 2009: • RESPEC continues to install monitoring points for the surface subsidence monitoring
system.

G-9
• OCD staff informs I&W that it does not recommend the use of heavy equipment to remove the above-grade tanks; I&W decides against removing the above-grade tanks.
May 1, 2009: • The OCD Environmental Bureau provides Secretary Prukop with a draft of its “Brine
Well Collapse Evaluation Report” regarding the two collapses that have occurred, and recommending changes to its brine well program.
• RESPEC completes the installation of monitoring points for the surface subsidence monitoring system.
May 4, 2009: • The theodolite for the surface subsidence monitoring system is on the I&W site. The
manufacturer begins training RESPEC personnel in its use.
May 5, 2009: • The manufacturer completes training RESPEC personnel on the use of the theodolite.
• RESPEC conducts an initial survey of the monitoring points for the surface subsidence monitoring system.
May 6, 2009: • RESPEC begins surveys of the monitoring points for the surface subsidence monitoring
system. Surveys will be done each business day.
May 8, 2009: • RESPEC begins submitting daily progress reports to the OCD.
• The OCD establishes its web page for brine well issues.
May 11, 2009: • RESPEC submits a health and safety plan to the OCD for use by personnel acting under
RESPEC’s scope of work at the I&W site.
• I&W calls the OCD to report that it has fenced the property.
May 12, 2009: • OCD personnel from the OCD’s District II office in Artesia visit the I&W facility and
confirm that the fence has been installed.
• RESPEC establishes additional surface monitor points adjacent to Eugenie #1 and Eugenie #2 for the surface subsidence monitoring system.

G-10
May 20, 2009: • RESPEC completes its preliminary review of the subsidence monitoring survey data and
determines that the systemic elevation measurement accuracy is approximately 0.002 ft/day.
May 21, 2009: • RESPEC installs the initial group of surface tiltmeter plates. Surface tiltmeters measure
movement along the horizontal axis. The surface tiltmeter locations include offsite monitor locations adjacent to the I&W site at the feed store and the church, and a control point in the median of US 285. RESPEC contacted the landowners and gained access approval prior to entering the properties.
May 22, 2009: • RESPEC gauges the two existing ground water monitor wells located adjacent to the
Eugenie #2 well to determine a base-line depth to groundwater.
May 27, 2009: • RESPEC re-surveys all existing surface monitor points including the benchmark to re-
establish coordinates for surface subsidence monitoring.
May 28, 2009: • RESPEC installs the final group of surface tiltmeter plates.
May 29, 2009: • RESPEC begins monitoring the 13 surface tiltmeters located on and off site.
June 6, 2009: • RESPEC drills three boreholes for borehole tiltmeters, which are used to measure
movement along the vertical axis.
June 10, 2009: • RESPEC installs temporary field office on site for storage of equipment.

H-1
APPENDIX H
EMAIL REGARDING IRRIGATION IMPACTS FOLLOWING COLLAPSE AT THE I&W BRINE CAVERN SITE

H-2
APPENDIX H EMAIL REGARDING IRRIGATION IMPACTS
FOLLOWING COLLAPSE AT THE I&W BRINE CAVERN SITE
----- Original Message ----- From: Dudley C. Jones To: Steven Hernandez Sent: Friday, May 29, 2009 12:49 PM Subject: Re: Brine Well Steve, Here is what I sent to Brian James this morning. I will follow up with a note that we are monitoring he canal. Mr. James, In response to the e-mail note you sent recently, the Board of Directors of CID wishes to convey the following regarding the statement " It would also be useful to know if there is anything that can be accomplished to try to minimize the impact of any collapse on your farmers." Here are some useful facts: the farm area served below the potential canal impact zone represents 23069 acres (92% of the whole CID) of agricultural land. The annual economic impact to these potentially affected farmers is approximately $100.73 million. This does not include the residual impact to other area business and industry to which the farmers are patrons. Some preemptive measures considered by the Board would involve the relocation of the Canal south of the immediate area of the potential sink hole. Relocation would involve land acquisition, engineering plans, construction, water delivery contingency plans and of course, funding. Another measure considered is to backfill and support the potential sink hole to avert a collapse. It appears there are very few, if any, viable and speedy options. It would also seem that time is of the essence if a collapse is eminent and every valid option should be considered. Please keep us updated. Sincerely, Dudley Jones Manager CID
I-1
APPENDIX I
HYDROGEOLOGIC ANALYSIS OF THE I&W BRINE CAVERN SITE

I-2
APPENDIX I HYDROGEOLOGIC ANALYSIS
OF THE I&W BRINE CAVERN SITE
I.1 SUMMARY
A hydrogeologic evaluation was performed of the I&W brine cavern site in Carlsbad, New Mexico. This evaluation addressed the site conditions with respect to the quantities of fresh water in the immediate locale over time and with respect to options to control that fresh water in response to possible changes in the condition of the brine cavern, including the potential for sinkhole formation.
The evaluation concludes that fresh water can be prevented from reaching the cavern or
sinkhole. This would be accomplished through termination or rerouting of irrigation flow through the Southern Main Canal, if necessary, and through a groundwater dewatering (pumping) activity applied to the aquifers that overlie the site.
If the dewatering activity is performed when irrigation in the area is not active, then
proactive mitigation operations can proceed with minimal disruption to the sizeable irrigation operations in the area. If sinkhole development occurs before any mitigation, then dewatering and canal closure/rerouting will be essential to control and minimize subsequent growth of the sinkhole and to allow for remedial actions.
I.2 GROUNDWATER AND SURFACE WATER INTERACTIONS
When fresh water comes into contact with geologic salt and moves through a salt cavern, the cavern will grow according to the amount of salt removed as brine. If a sinkhole were to form, there is potential for additional salt dissolution and, therefore, further collapse or sinkhole expansion, if fresh water circulates through it. This appears to be the case for the sinkholes at sites BW-5 and BW-21. Both are growing over time, apparently caused by groundwater flow through or along the Salado Formation.
Sinkholes are ubiquitous in the landscape of southeastern New Mexico primarily because of
collapse of karst caverns within the extensive evaporate formations near the land surface. These karst caverns are almost always formed because of natural dissolution of limestone, halite and/or other evaporites by circulating fresh water. The formation of karst caverns was more widespread in the Pleistocene period when precipitation was more abundant, average temperatures were cooler, and fresh water could percolate through to the aquifer systems and cause dissolution of evaporate minerals [Bachman, 1990].

I-3
Nash Draw, just east of Carlsbad, is an example of a large-scale solution collapse feature in the same Permian formations that relate to the BW-6 site. Nash Draw was created by extensive dissolution of the Salado halite formation during the Mid-Pleistocene period. The feature is approximately 16 miles long by 6 miles wide and several hundred feet deep. It is relevant that the Salado is the same formation that was recently mined at the BW-6 site [Bachman, 1990].
In modern, more arid times in this region, fresh water is not typically as abundant.
Therefore, solution-caused sinkhole development and expansion are not as frequent or as extensive as in the past. However, the potential for sinkhole expansion beyond that from an initial collapse is further compounded for the case of BW-6 because of its proximity both to surface water canals (the Southern Main Canal) and to abundant groundwater from both the local alluvial aquifer, the nearby Capitan Reef Aquifer, and the Rustler Aquifer. In the event of a sinkhole at BW-6, if fresh water were to reach the exposed salt cavern, then potential exists for sweeping brine to the southeast according to the hydraulic gradient. That, in turn, creates the potential for additional surface collapse growth in that direction.
I.3 HYDROGEOGRAPHIC SETTING
The regional hydrogeology has been investigated by several authors over the past 100 years. The principal documents relied upon in this report are reports by Bjorkland and Motts [1959], Richey et al. [1985], Hiss [1976], Bachman [1990], and Barroll et al [2004]. Many other studies and alternate sources of information are available and, where necessary, have also been sourced in this report.
The Carlsbad area and part of its hydrogeographic setting are displayed in Figure I-1.
Within Figure I-1, the I&W site is depicted by the two small red dots near the center. The merger of the two highways and the Southern Main Canal are shown as red and white lines, respectively. The New Mexico State Engineer’s Office online water rights database (2009) was used to display all registered water wells within 6 miles of the site, as indicated by the red box. A complete listing of each well is included in Appendix J. The blue lines of the figure represent the outline of the Capitan Reef Aquifer in that area. The Pecos River and one of its reservoirs (Avalon) are also shown in cyan in Figure I-1. The river generally follows in a north-to-south direction within this image domain.
The Capitan Reef is an ancient carbonate formation of Permian age. As the figure inset
shows, it is hundreds of miles long (extending into Texas) and typically 12 miles wide. The thickness varies but ranges from 1,000 to 2,000 feet. The Capitan Reef outcrops just west and south of Carlsbad and comprises the principal outcrop of the Guadalupe Mountains [Hiss, 1976]. It is depicted and described in this report because it is a major contributor of fresh water to the locality of concern.

I-4
RSI-1886-09-059
Figure I-1 Hydrogeographic Information Pertaining to the BW-6 Site.

I-5
Hydrogeographic Information Pertaining to the BW-6 Site. Because of the karst nature of the entire Gaudalupe Mountains, including that of the reef,
but also of the Permian sediments that abut the reef to the west, the Capitan Reef serves as a vast groundwater conduit. The highly permeable Capitan Reef is considered to capture over 800 square miles of upland Guadalupe Watershed (Figure I-2) and conducts the recharged groundwater underneath the town of Carlsbad and on to the east. Much, but not all, of the recharged water is retrieved by wells to the west of Carlsbad (completed into the reef) for the water needs of the city.
The actual BW-6 cavern is situated under an alluvial aquifer, which is shown in Figure I-3.
The alluvial aquifer receives recharge principally from the Capitan Reef and the Pecos River. This aquifer is of variable thickness and extent but reaches a thickness of approximately 176 feet at the site. The BW-6 site is approximately 1.5 miles south of the border of the Capitan Aquifer. Although the site is within the city limits of Carlsbad, which is served by a water supply system that taps into the Capitan Reef, there are numerous additional water supply wells which are completed in the alluvial aquifer, as suggested in Figure I-1. These wells are primarily used as supplemental sources of irrigation water for farmers in the area.
Note that extensive irrigation in the Carlsbad area (Figure I-4) is primarily fed by surface
water diversions from the Avalon Reservoir. The diversions are routed to the irrigated acreage through a network of canals and lateral ditches. Farming irrigation practices and water transport through unlined canals and ditches cause significant recharge to the alluvial aquifer, in addition to the recharge to that aquifer from the Capitan Reef.
As part of the irrigation network, the Southern Main Canal is the primary canal from the
Avalon Reservoir. This canal serves over 90 percent of the irrigated acreage in the Carlsbad Irrigation District. It also passes over the footprint of the BW-6 cavern site.
The interplay of water between the Pecos River (including the Avalon Reservoir) and its
irrigation diversions, the Capitan Reef aquifer, and the alluvial aquifer, is complex. To better understand and administer the water rights of the area, the New Mexico State Engineer’s Office and the Interstate Stream Commission produced a calibrated groundwater flow model in 2004 [Barroll et al., 2004]. The model covers the BW-6 site and also captures to a great extent the integrated and interrelated effects of the Capitan Reef, the alluvial aquifer, the Pecos River, and the irrigation patterns over time. The model is typically referred to in this report as the SEO model or the SEO 2004 model.
The combination of features just described creates a unique environment of abundant fresh
water from both ground and surface sources in the area that immediately overlies the BW-6 site. This is a departure from the previous two sinkhole sites that have been described earlier.

I-6
RSI-1886-09-061
Figure I-2. Watersheds That Capture Recharge to the Capitan Reef Aquifer.

I-7
RSI-1886-09-062
Figure I-3. Alluvial Aquifer and Other Related Features in the Carlsbad Area. BW-6 locations shown approximately by red dot (adapted from Barroll et al. [2004]).

I-8
RSI-1886-09-063
Figure I-4. Carlsbad Irrigation District Irrigation System (From Barroll et al. [2004]).

I-9
Those two sites are relatively “starved” of fresh water and therefore, sinkhole expansion at those sites will be slow. The BW-6 site will not be “starved” of fresh water should a sinkhole form. Therefore, there is less impediment to future sinkhole growth from that site.
An additional aquifer likely underlies the Alluvial Aquifer and overlies the Salado Formation
at the site. This aquifer is probably composed of the carbonate members of the Permian Rustler Formation and is simply termed here as the Rustler Aquifer. The aquifer may be laterally extensive, as indicated in Plate 3 of Richey [1985], but is expected to thin significantly as it approaches the Capitan Reef. The Rustler Aquifer is approximately 20 feet thick at the site. This aquifer is not utilized by any known users in the Carlsbad area, because of the relatively poor quality of the water and the availability of better water sources in the area. For these reasons, the SEO 2004 model study does not include the Rustler Aquifer. Although the level of total dissolved solids (TDS) found in the Rustler Aquifer in that area is likely high, the quality of the water is still sufficiently fresh to readily dissolve salt. Therefore, this aquifer is also of concern regarding the potential for sinkhole development and growth at the BW-6 site. Impermeable anhydrite units separate the Alluvial Aquifer from the Rustler Aquifer and also separate the Rustler Aquifer from the Salado Formation.
In summary, to this point in the appendix it has been shown that the BW-6 site is uniquely
positioned with regard to sources of fresh water, both from a surface water canal and two groundwater sources. Fresh water can accelerate the growth of a sinkhole (should one form) and, therefore, is a source of additional concern.
I.4 SCENARIOS
Three future scenarios are evaluated in this report with regard to the future hydrogeologic conditions of the IW-6 site. These are:
1. Scenario 1: No action is taken and no collapse ensues.
2. Scenario 2: No preemptive action is taken. A sinkhole event eventually occurs and a mitigation is subsequently implemented.
3. Scenario 3: A preemptive mitigation is implemented. No or minimal collapse follows.
I.4.1 Scenario 1: No Action Is Taken and No Collapse Ensues
As described earlier in this report, the diameter/height (D/H) ratio is believed to already exceed the safety factor. Moreover, sinkhole formation in the area has been ubiquitous over time and throughout the region dominated by Permian strata. Therefore, this scenario is given a relatively low probability.

I-10
I.4.2 Scenario 2: No Preemptive Action Is Taken
Once a sinkhole event has transpired, fresh water from the upper two aquifers (and if in season, from the irrigation canal) will pour into the resulting cavity, filling it to the level of the potentiometric surface. Currently, that level, which fluctuates, is approximately 3,077 feet above sea level (or 49.5 feet below the land surface).
As fresh water comes into contact with the Salado salt layers, the salt will dissolve and the
extent of the cavity will increase to a certain extent. That extent may be limited if water cannot continue to flow through the subsurface past the salt. In that case, although the zone of dissolved salt would initially widen somewhat, the initially fresh water would reach salt saturation. The resulting brine would no longer act to dissolve any salt it came into contact with. Under these conditions, the resulting brine-filled sinkhole, although large and fairly deep, would not continue to grow at a significant rate. However, the hole would still be in contact with the two aquifers, and fresh groundwater (and during irrigation season, fresh surface water) would continue to circulate past the hole footprint. This dynamic would continuously sweep brine away from the hole and would result in brine contamination of the aquifers and the surface water. Moreover, as brine was swept out past the hole profile, fresh water would replace it, contributing to additional dissolution of the exposed halite. As the halite continued to dissolve, further sinkhole expansion would occur. The direction of sinkhole expansion would largely follow the prevailing groundwater flow gradients, which are naturally directed to the southeast.
This process of continual dissolution and sinkhole expansion would be more aggressive if
there were a permeable unit directly overlying the Salado Formation. Some references, including Bjorkland and Motts [1959], allude to such a unit. Moreover, it is reasonable to believe that some collapse of the Lower Rustler Formation may have already occurred along the cavern crown (ceiling of the cavern). This sort of collapse might have been facilitated by adjacent fresh groundwater circluation. Under these conditions, fresh water would be able to continuously spread across and over a broad surface of the Salado Formation. The increased surface area of contact would facilitate more rapid and more extensive dissolution of the Salado halite. The resulting sinkhole development would be correspondingly more extensive and rapid.
The prevailing direction of groundwater flow in the Alluvium Aquifer is toward the Pecos
River; that applies from both sides of the Pecos. In other words, the portion of the Alluvium aquifer to the east of the Pecos River has groundwater flow gradients directed toward the west, and the portion of the Alluvial Aquifer to the west of the Pecos River has groundwater gradients directed to the east.
That pattern of groundwater flow would likely be similar, but subdued, for the deeper
Rustler Aquifer and the potential aquifer directly overlying the Salado Formation. Plate 3 of Richey et al. [1985] indicates groundwater flow from the Rustler Aquifer that supports this conception.
I-11
Under this scenario of recharge from two aquifers, it would be essential to create a water-free zone around the sinkhole at the earliest opportunity. Removing the capacity for fresh water to flow into the sinkhole will be an essential tool to halt further sinkhole growth. It would also facilitate the means to fill the hole with the proper geologic materials. Refilling the hole properly would restore the land surface close to the desired original condition and would help prevent or minimize further sinkhole formation and/or subsidence at that site. A groundwater modeling analysis of aquifer dewatering at the site, through a network of pumping wells, is documented in a subsequent section.
I.4.3 Scenario 3: A preemptive mitigation is implemented
In this scenario, material of some form is injected into the cavern (as liquid is removed) to fill and stabilize the cavern area. Because of the potential risk of sinkhole collapse under this or any additional restoration scenario, it is recommended that aquifer dewatering be conducted. Dewatering of the aquifer around the site before any remedial activity will reduce the consequences of any inadvertent collapse. The dewatering model analysis is documented in the following section.
I.5 DEWATERING ANALYSIS
The SEO 2004 model [Barroll et al., 2004] offered a useful starting point for the dewatering simulation exercise. This model contained most of the hydrogeologic features of interest to such a study. In addition, the model had undergone extensive history matching, which significantly adds to its reliability. Perhaps most important, the model conceptually captured, to a great extent, the interrelationships of flow that occur between surface waters, the Capitan Aquifer and the Alluvial Aquifer. This is critical to any dewatering model because the BW-6 site is situated at a location where all of these factors converge. The grid of the SEO 2004 model is shown in Figure I-5.
The dewatering model was primarily geared to evaluate the feasibility of draining the aquifers around the cavern zone over a period of only several months. It also allowed for determining the extents and magnitudes of the resulting lowered piezometric surfaces, including the water table, over time. This information allows for the determination of impacts of lowered water levels on wells in the immediate area.
In building the new dewatering simulation, some aspects of the original model were discarded to facilitate more timely results. Notably, the original model simulated approximately 60 years of groundwater flow. For the purposes of the new simulation, only the initial steady-state stress period, followed by the first several time steps (each 30 days in length, were utilized. This use of early time steps is an acceptable conservatism, because water levels were generally higher then, and a higher water table creates slightly more difficult dewatering challenges.
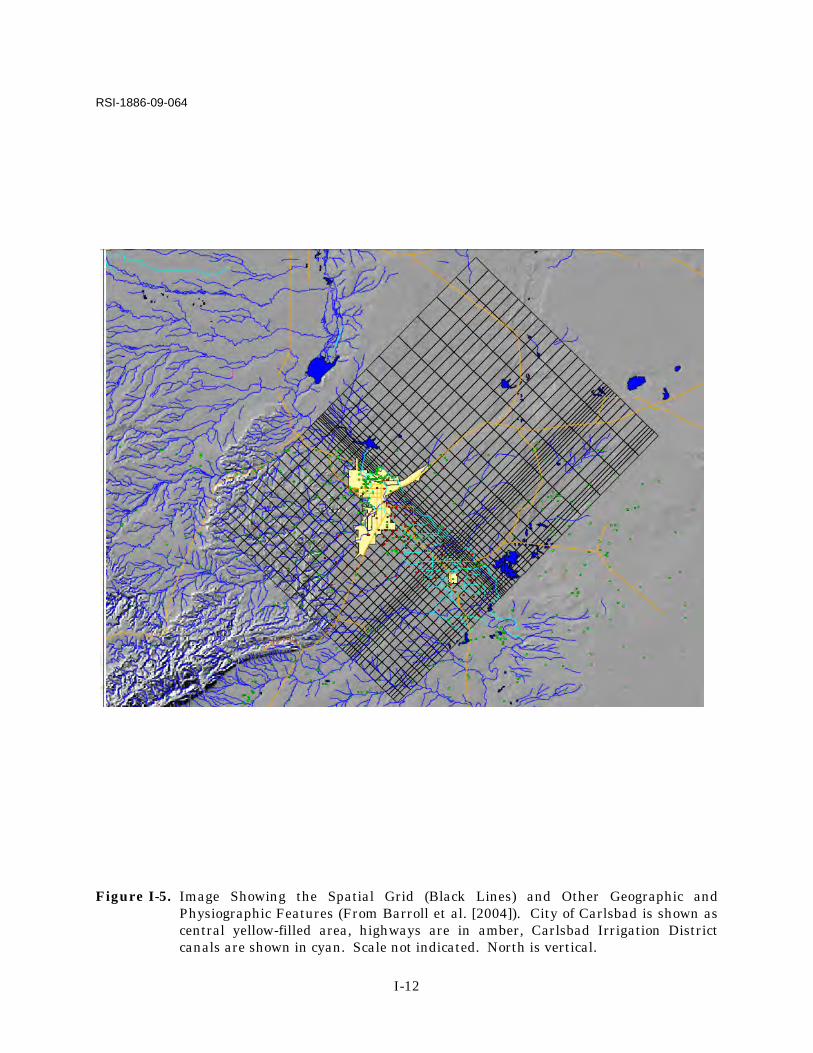
I-12
RSI-1886-09-064
Figure I-5. Image Showing the Spatial Grid (Black Lines) and Other Geographic and Physiographic Features (From Barroll et al. [2004]). City of Carlsbad is shown as central yellow-filled area, highways are in amber, Carlsbad Irrigation District canals are shown in cyan. Scale not indicated. North is vertical.

I-13
In building the new dewatering simulation, additional features were added to the original model. In addition to the simulation of a ring of pumping wells around the site and selected numerical grid refinement in that area of the model, a zone was added to represent the Rustler Aquifer. As noted previously, the original model did not incorporate the Rustler Aquifer because it was not and is not a source of active groundwater use. However, for the current concern, the Rustler Aquifer would be a source of relatively fresh water to the cavern site. This addition of the Rustler zone to the SEO model, entirely within Layer 2, is illustrated in Figure I-6. Note that since the Rustler Aquifer abuts the Capitan Reef Aquifer to the south, they are simulated within the same layer.
The Rustler Aquifer was given a thickness of 25 feet and a hydraulic conductivity of
approximately .3 foot per day, which according to Table 2.2 of Freeze and Cherry [1979], is in line with the high range of hydraulic conductivities for limestones and dolomites. This leads to a transmissivity for the Rustler Aquifer equal to 7.1 feet2/day.
Other than the simulation of four wells at the BW-6 site, no boundary conditions are
assigned to the Rustler Aquifer, nor are any leakance assigned into or out of the unit. Rather, the Rustler Aquifer is simulated to receive all of its recharge from the Capitan Reef Aquifer.
The SEO model simulated the Southern Main Canal indirectly through the use of a recharge
factor, and the recharge was unmodified in the dewatering simulations. This conservatism assumes that even if the canal were rerouted, it would still likely reside fairly nearby and continue to recharge the underlying aquifer.
A network of wells surrounding the BW-6 site is simulated to pump groundwater from both
the Alluvial Aquifer and the Rustler Aquifer. A trial-and-error process was used to develop an optimal configuration of well locations and pumping rates for this purpose. Figures I-7 and I-8 illustrate the resulting well layouts for the Alluvial and Rustler units, respectively.
As discussed previously, the dewatering model employed 1-month time periods. Wells were
turned on at the first time step and run for a 5-month time frame. Rather than specify pumping rates from each well for each time period, the pumping was simulated by assigned heads at each well point. The heads were assigned to a level at or below the bottom elevation of the layer at each well location. This had the effect of approximating an actual float-based pumping system, in which pumps only operate when a certain water level is exceeded. By running the model in this manner, and then reviewing the associated cell-by-cell output data, the pumping rates for each well at each time step can be determined as a model output.
The values of assigned head and associated conductance were varied by a trial-and-error procedure until the desired approximate drawdown levels were reached. Given that there is approximately 140 feet of saturated sediments in the alluvial aquifer, a drawdown approaching
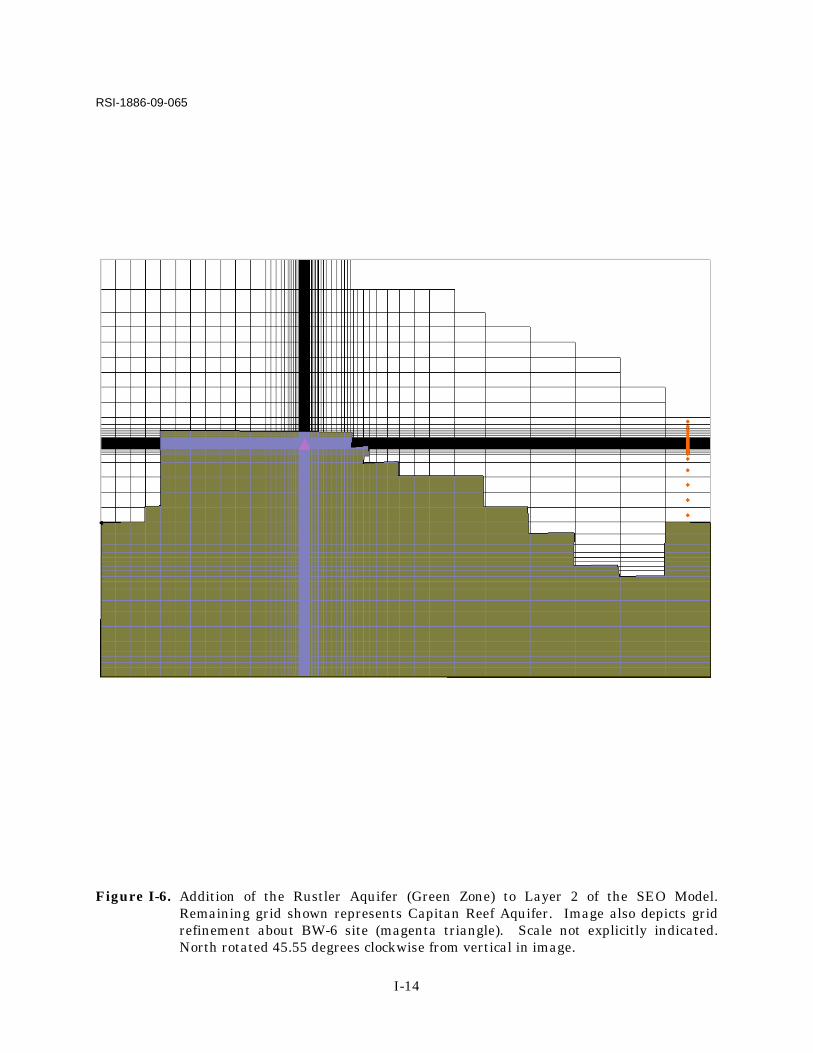
I-14
RSI-1886-09-065
Figure I-6. Addition of the Rustler Aquifer (Green Zone) to Layer 2 of the SEO Model. Remaining grid shown represents Capitan Reef Aquifer. Image also depicts grid refinement about BW-6 site (magenta triangle). Scale not explicitly indicated. North rotated 45.55 degrees clockwise from vertical in image.

I-15
RSI-1877-09-066
Figure I-7. Well Positions (Green Triangles) Assigned to Alluvial Aquifer. Scale not explicitly indicated. North rotated 45.55 degrees clockwise from vertical in image.
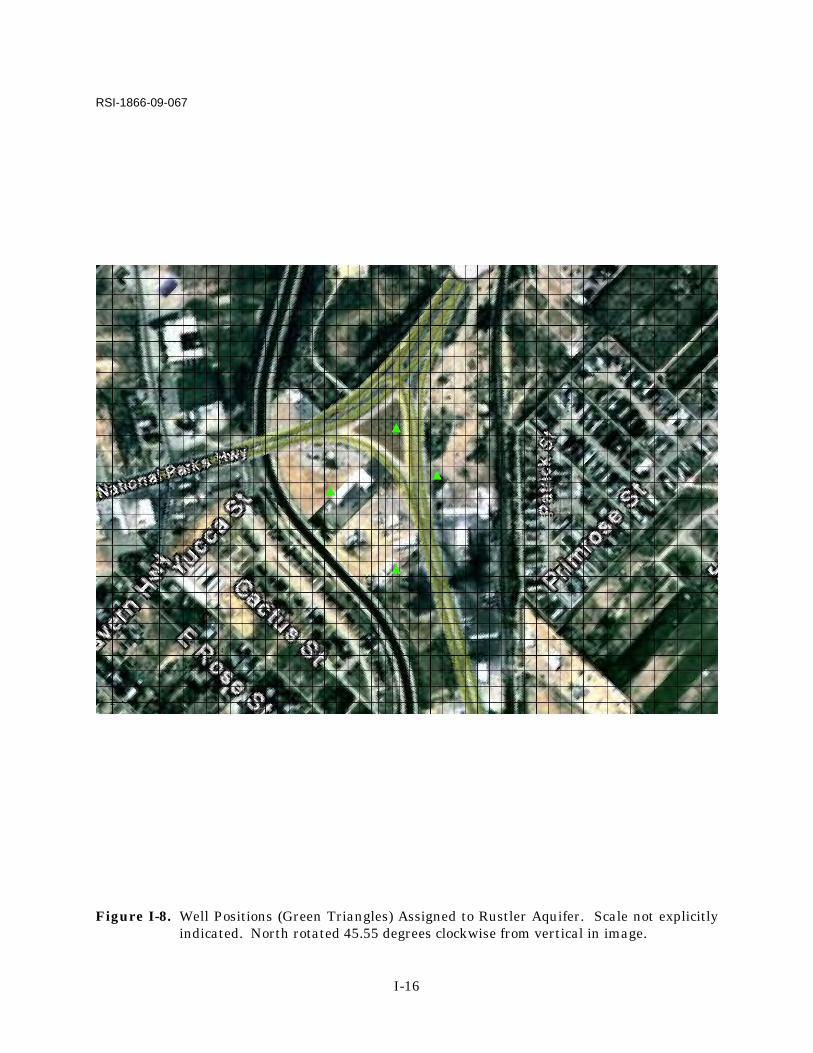
I-16
RSI-1866-09-067
Figure I-8. Well Positions (Green Triangles) Assigned to Rustler Aquifer. Scale not explicitly indicated. North rotated 45.55 degrees clockwise from vertical in image.

I-17
that goal was sought. Given the expected level of the Rustler Aquifer, within the overall Rustler Formation at approximately 2,670 feet above sea level, a drawdown approaching 400 feet was sought in that unit. In the process of developing these models, it was also assumed that these drawdowns are soft targets. Supplemental pumping can be added if needed during the actual development of the well field. In fact, the pumping levels at many time steps are too high for single wells. For those cases, approximately three or four wells might be distributed along the perimeter of the site to represent each model well. In other words, the model is intended to approximate a more detailed pumping scheme that would need to be more fully developed should dewatering be further considered.
Table I-1 provides summary information on the well pumping schedule for each layer.
Figures I-9 and I-10 show drawdown levels in the Alluvial and Rustler Aquifers after 5 months of pumping according to the schedule in Table I-1, respectively. In Figure I-9, BW-6 wells are shown in red, pumping wells are shown as green triangles, New Mexico SEO database wells are indicated as dark blue dots; database identification numbers are included. North is also roated 45.55 degrees clockwise from vertical in the image of Figure I-9. All wells are included in the single table of Appendix J. In Figures I-10 and I-11, contour coverage is limited for viewing, the scale is not shown, and north is rotated 45.55 degrees clockwise from vertical in the image. Pumping wells are shown as green triangles in both figures. The maximum drawdown in Figure I-10 is approximately 250 feet and in Figure I-11, the maximum drawdown is approximately 140 feet.
The drawdown results give an indication that a well design can be configured to dewater
both aquifers. Although the drawdowns shown do not indicate full attainment of drawdown goals, the results fall within an acceptable range of general values, giving confidence to the assessment that dewatering is achievable within a reasonable time frame. Figure I-11 shows the drawdowns in the Alluvial Aquifer after only 3 months of pumping are also significant. If a denser well network were applied, it is anticipated that the drawdown goals in both aquifers could be achieved in a 2- or 3-month period, rather than 5 months shown.
The model indicates that recovery of the aquifers is initially rapid, but large areas still show
an average 10 feet of drawdown several months after wells have been shut off. This may be an artifact of other recharge and well assignments within the dynamic base model for that time period. Typically, water levels would recover in approximately 4 to 6 months following a pumping period of that length.
The table results indicate that approximately 4,500 acre-feet would be withdrawn from the alluvial aquifer over a 3-month period to achieve the dewatering goal. In addition, a small amount (14 acre-feet) would be removed from the Rustler Aquifer over the same time period. If dewatering continued, if only at a maintenance level, for an additional 2 months, a total of approximately 9,900 acre-feet would be removed from the system (both aquifers) over that period.

I-18
Table I-1. Simulated Pumping Schedules for Alluvial and Rustler Wells (Page 1 of 2)
Time Step
End of Step
(days)
Well I.D.
Average Pumping
Rate (gpm)
Monthly Average Total
Discharge Rate (cfs)
Total Cumulative
Outflow From Day 1 (acre feet)
Total Cumulative
Outflow From Day 1
(gallons)
LAYER 1 (Alluvial Aquifer)
2 30 3511 1,604
3519 1,607
4018 1,577
4030 1,565
4425 1,670
4436 1,617 21.5 1,278.0 416,439,262.0
3 30 3511 4,001
3519 4,072
4018 3,843
4030 3,901
4425 4,170
4436 4,063 53.6 4,466.8 1,455,471,078.6
4 30 3511 3,504
3519 3,597
4018 3,299
4030 3,402
4425 3,705
4436 3,604 47.0 7,265.7 2,367,441,668.6
5 30 3511 3,281
3519 3,386
4018 2,926
4030 3,036
4425 3,498
4436 3,406 43.5 9,855.3 3,211,235,976.3
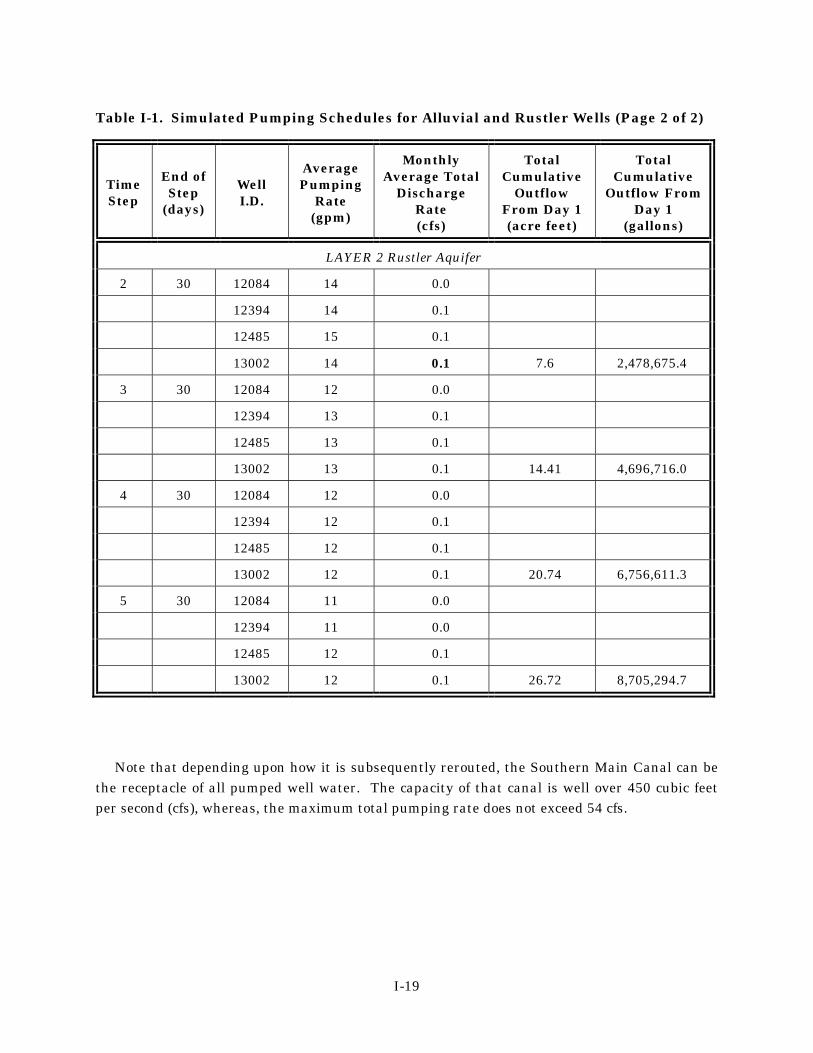
I-19
Table I-1. Simulated Pumping Schedules for Alluvial and Rustler Wells (Page 2 of 2)
Time Step
End of Step
(days)
Well I.D.
Average Pumping
Rate (gpm)
Monthly Average Total
Discharge Rate (cfs)
Total Cumulative
Outflow From Day 1 (acre feet)
Total Cumulative
Outflow From Day 1
(gallons)
LAYER 2 Rustler Aquifer
2 30 12084 14 0.0
12394 14 0.1
12485 15 0.1
13002 14 0.1 7.6 2,478,675.4
3 30 12084 12 0.0
12394 13 0.1
12485 13 0.1
13002 13 0.1 14.41 4,696,716.0
4 30 12084 12 0.0
12394 12 0.1
12485 12 0.1
13002 12 0.1 20.74 6,756,611.3
5 30 12084 11 0.0
12394 11 0.0
12485 12 0.1
13002 12 0.1 26.72 8,705,294.7
Note that depending upon how it is subsequently rerouted, the Southern Main Canal can be
the receptacle of all pumped well water. The capacity of that canal is well over 450 cubic feet per second (cfs), whereas, the maximum total pumping rate does not exceed 54 cfs.

I-20
RSI-1886-09-068
Figure I-9. Drawdowns (in Feet) Within Alluvial Aquifer After 5 Months of Pumping According to the Simulated Pumping Schedule.

I-21
RSI-1886-09-069
Figure I-10. Drawdowns (in Feet) Within Rustler Aquifer After 5 Months of Pumping According to the Simulated Pumping Schedule.

I-22
RSI-1886-09-060
Figure I-11. Drawdowns (in Feet) Within Alluvial Aquifer After 3 Months of Pumping According to the Simulated Pumping Schedule.

I-23
I.6 REFERENCES AND OTHER DOCUMENTS REVIEWED
Bachman, G. O., 1990. “Evaporite Karst in the Pecos Drainage, Southeastern New Mexico,” Geological and Hydrological Studies of Evaporites in the Northern Delaware Basin for the Waste Isolation Pilot Plant (WIPP), New Mexico, D. W. Powers, R. M. Holt, R. L. Beauheim, and N. Rempe (eds.), Geological Society of America Fieldtrip Guidebook 14, pp. 181–186. Barroll, P., D. Jordan, and G. Ruskauff, 2004. The Carlsbad Area Groundwater Flow Model, prepared by New Mexico Office of the State Engineer, Santa Fe, NM, and Intera, Inc., Carlsbad, NM, p. 307. Bjorklund, L. J. and W. S. Motts, 1959. Geology and Water Resources of the Carlsbad Area, Eddy County, New Mexico, U.S. Geological Survey Open-File Report 59-9, prepared by the U.S. Geological Survey, in cooperation with the New Mexico State Engineer, Santa Fe, NM, p. 322. Freeze, A. R. and J. A. Cherry, 1979. Groundwater, Prentice Hall, Inc., Upper Saddle River, New Jersey. Hiss, W. L., 1976. Thickness of the Permian Guadalupian Capitan Aquifer, Southeast New Mexico and West Texas, Resource Map 6, New Mexico Bureau of Mines and Mineral Resources Resource Map, one sheet, scale 1:510,000. Richey, S. F., J. G. Wells, and K. T. Stephens, 1985. “Geohydrology of the Delaware Basin and Vicinity, Texas and New Mexico,” U.S. Geological Survey Water-Resources Investigations 84-4077.

J-1
APPENDIX J
WATER WELLS WITHIN 6 MILES OF THE I&W BRINE FACILITY

New Mexico Office of the State EngineerWater Column/Average Depth to Water
(In feet)
(quarters are 1=NW 2=NE 3=SW 4=SE)
(NAD83 UTM in meters)(quarters are smallest to largest)
64
Sub
basin XCountyWater
Column
Q
YDepthWaterPOD Number 416
Q
RngUse TwsSecDepth
Well
Q
Distance
1 57339227ELE 22SDOMC 00611 171 1803584092*3 137
1 57339227EED 22SDOMC 00611 RPR 17 60 1251 1853584092*3 137
2 57379727EED 22SIRRC 01275 17 45 1601 2053584100*3 417
4 57379927EED 22SIRRC 01578 17 55 1701 2253583692*3 473
2 57389827EED 22SDOMC 01953 17 42 40823584001*3 495
4 57379427EED 22SDOMC 00153 173 1403584307*1 524
1 57339627EED 22SIRRC 00066 201 1603583277*1 678
1 57339627EED 22SDOMC 00067 201 2253583277*1 678
1 57339627EED 22SIRRC 00067 201 2253583277*1 678
1 57359627EED 22SIRRC 00130 202 1203583277*1 704
1 57358727EED 22SDOMC 00663 17 30 854 1153584711*1 777
4 57399427EED 22SDOMC 01056 17 45 702 1153584507*1 807
2 57309327EED 22SDOMC 00040 19 1003583175*2 840
2 57309327EED 22SDOMC 00042 19 1003583175*2 840
3 57268327EED 22SDOMC 00013 18 1503584396*2 846
2 57379227EED 22SDOMC 00526 173 3253584716*1 853
3 57419927EED 22SDOMC 00322 173 703584313*2 870
3 57258227EED 22SSANC 00978 18 68 1323 2003584295*2 890
57251527EED 22SDOMC 00012 18 1503584168* 915
2 57390227EED 22SDOMC 01768 20 1043583186*1 915
3 57420427EED 22SEXPC 02922 17 48 1523 2003583502*4 918
2 57318327EED 22SSTKC 03162 182 423584909*2 979
1 57420627EED 22SIRRC 00292 201 1833583293*2 1039
3 57439927EED 22SDOMC 01504 17 45 204 653584313*2 1056
3 57339827EED 22SDOMC 00147 201 533582872*1 1083
1 57419727EED 22SIRRC 02239 17 34 1163 1503584721*2 1101
2 57399227EED 22SDOMC 00148 172 403584916*1 1126
2 57399227EED 22SDOMC 00640 17 34 262 603584916*1 1126
3 57358527EED 22SIRRC 00091 084 3003585121*3 1179
43Page 1 of6/12/09 4:19 PM WATER COLUMN/ AVERAGEDEPTH TO WATER
*UTM location was derived from PLSS - see Help

(In feet)
(quarters are 1=NW 2=NE 3=SW 4=SE)
(NAD83 UTM in meters)(quarters are smallest to largest)
64
Sub
basin XCountyWater
Column
Q
YDepthWaterPOD Number 416
Q
RngUse TwsSecDepth
Well
Q
Distance
4 57318127EED 22SIRRC 00020 074 503585119*4 1185
4 57309427EED 22SIRRC 00621 19 2653582771*2 1224
1 57429827EED 22SDOMC 00239 17 3003584822*2 1244
1 57419727EED 22SDOMC 00813 17 28 281 563584921*2 1249
4 57460427EED 22SDOMC 00480 173 2003584318*2 1252
3 57339827EED 22SDOMC 00278 203 803582672*1 1283
4 57399027EED 22SDOMC 00360 084 1253585125*3 1308
4 57399027EED 22SIRRC 00360 084 1253585125*3 1308
4 57399027EED 22SDOMC 03170 084 1003585125*3 1308
3 57338527EED 22SDOMC 02525 08 17 321 493585321*3 1366
3 57338527EED 22SDOMC 03117 081 4003585321*3 1366
3 57338527EED 22SPROC 03117 081 4003585321*3 1366
3 57358527EED 22SDOMC 03086 08 38 1252 1633585321*3 1377
2 57237727EED 22SSTKC 03293 POD1 182 2503584904*1 1399
3 57419527EED 22SIRRC 00360 A 083 903585129*4 1415
4 57480927EED 22SDOMC 00726 172 703583706*4 1425
4 57480427EED 22SDOMC 00357 17 50 1204 1703584318*2 1445
57451027EED 22SDOMC 00628 20 80 951753582987*2 1469
4 57399027EED 22SSTKC 02858 082 1003585325*3 1489
4 57399027EED 22SDOMC 02885 08 17 302 473585325*3 1489
3 57277727EED 22SDOMC 02709 07 28 332 613585318*4 1500
3 57258927EED 22SDOMC 00017 193 1253582669*2 1523
1 57338227EED 22SIRRC 00444 083 903585522*3 1567
1 57338227EED 22SIRRC 01621 08 24 583 823585522*3 1567
1 57338227EED 22SSTKC 02618 08 20 213 413585522*3 1567
3 57500927EED 22SDOMC 01407 163 863584324*1 1645
57251627EED 22SDOMC 00033 19 853582546* 1666
3 57500927EED 22SIRRC 00102 16 70 941 1643584524*1 1701
3 57500927EED 22SDOMC 01545 161 903584524*1 1701
1 57419227EED 22SDOMC 03084 08 14 983 1123585532*4 1762
1 57500727EED 22SDOMC 00267 163 3584730*1 1779
1 57267627EED 22SDOMC 00271 07 30 811113585617*4 1814
43Page 2 of6/12/09 4:19 PM WATER COLUMN/ AVERAGEDEPTH TO WATER
*UTM location was derived from PLSS - see Help
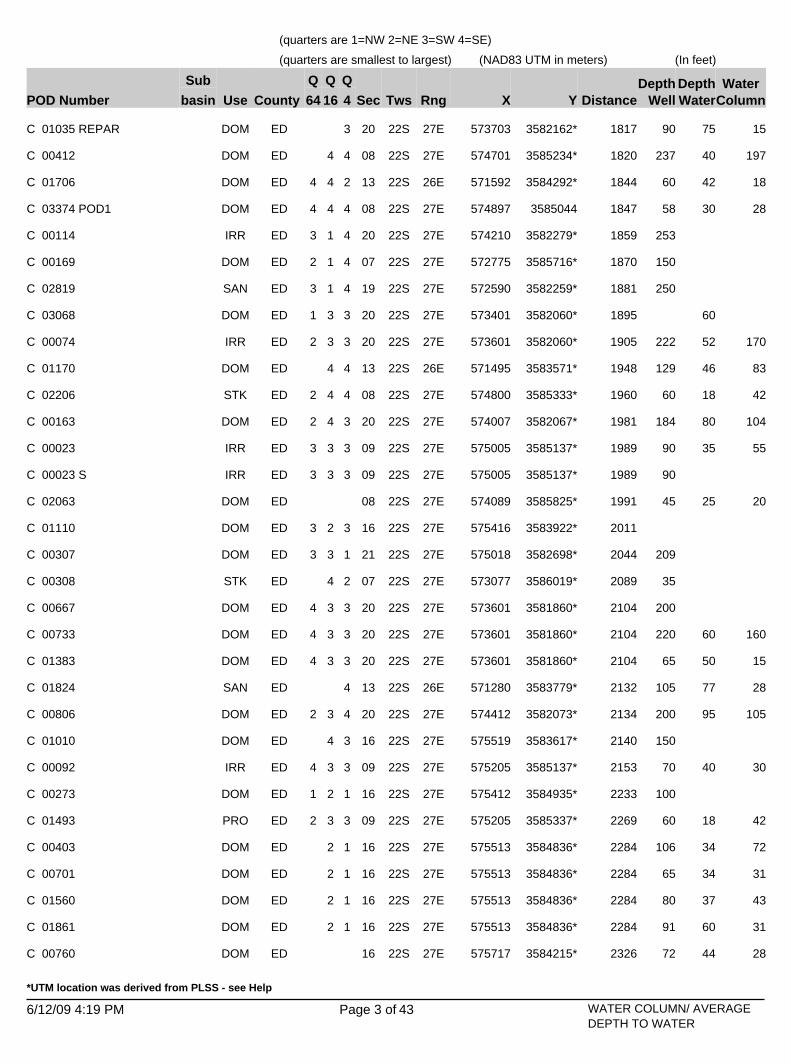
(In feet)
(quarters are 1=NW 2=NE 3=SW 4=SE)
(NAD83 UTM in meters)(quarters are smallest to largest)
64
Sub
basin XCountyWater
Column
Q
YDepthWaterPOD Number 416
Q
RngUse TwsSecDepth
Well
Q
Distance
57370327EED 22SDOMC 01035 REPAR 20 75 15903582162*3 1817
4 57470127EED 22SDOMC 00412 08 40 1972373585234*4 1820
4 57159226EED 22SDOMC 01706 13 42 184 603584292*2 1844
4 57489727EED 22SDOMC 03374 POD1 08 30 284 5835850444 1847
1 57421027EED 22SIRRC 00114 203 2533582279*4 1859
1 57277527EED 22SDOMC 00169 072 1503585716*4 1870
1 57259027EED 22SSANC 02819 193 2503582259*4 1881
3 57340127EED 22SDOMC 03068 20 601 3582060*3 1895
3 57360127EED 22SIRRC 00074 20 52 1702 2223582060*3 1905
4 57149526EED 22SDOMC 01170 13 46 831293583571*4 1948
4 57480027EED 22SSTKC 02206 08 18 422 603585333*4 1960
4 57400727EED 22SDOMC 00163 20 80 1042 1843582067*3 1981
3 57500527EED 22SIRRC 00023 09 35 553 903585137*3 1989
3 57500527EED 22SIRRC 00023 S 093 903585137*3 1989
57408927EED 22SDOMC 02063 08 25 20453585825* 1991
2 57541627EED 22SDOMC 01110 163 3583922*3 2011
3 57501827EED 22SDOMC 00307 213 2093582698*1 2044
4 57307727EED 22SSTKC 00308 07 353586019*2 2089
3 57360127EED 22SDOMC 00667 204 2003581860*3 2104
3 57360127EED 22SDOMC 00733 20 60 1604 2203581860*3 2104
3 57360127EED 22SDOMC 01383 20 50 154 653581860*3 2104
57128026EED 22SSANC 01824 13 77 281053583779*4 2132
3 57441227EED 22SDOMC 00806 20 95 1052 2003582073*4 2134
4 57551927EED 22SDOMC 01010 16 1503583617*3 2140
3 57520527EED 22SIRRC 00092 09 40 304 703585137*3 2153
2 57541227EED 22SDOMC 00273 161 1003584935*1 2233
3 57520527EED 22SPROC 01493 09 18 422 603585337*3 2269
2 57551327EED 22SDOMC 00403 16 34 721063584836*1 2284
2 57551327EED 22SDOMC 00701 16 34 31653584836*1 2284
2 57551327EED 22SDOMC 01560 16 37 43803584836*1 2284
2 57551327EED 22SDOMC 01861 16 60 31913584836*1 2284
57571727EED 22SDOMC 00760 16 44 28723584215* 2326
43Page 3 of6/12/09 4:19 PM WATER COLUMN/ AVERAGEDEPTH TO WATER
*UTM location was derived from PLSS - see Help

(In feet)
(quarters are 1=NW 2=NE 3=SW 4=SE)
(NAD83 UTM in meters)(quarters are smallest to largest)
64
Sub
basin XCountyWater
Column
Q
YDepthWaterPOD Number 416
Q
RngUse TwsSecDepth
Well
Q
Distance
1 57181127EED 22SDOMC 03164 19 87 433 1303582254*3 2331
3 57107826EED 22SDOMC 00385 13 55 40953584396*2 2368
2 57561227EED 22SDOMC 00693 16 34 362 703584935*1 2414
3 57097726EED 22SDOMC 00740 13 40 611 1013584495*2 2487
3 57097726EED 22SDOMC 00808 131 2003584495*2 2487
4 57561027EED 22SDOMC 02915 094 1003585141*3 2503
57085026EED 22SDOMC 00099 13 180 -301503584194* 2566
57085026EED 22SDOMC 00457 13 43 22653584194* 2566
57085026EED 22SDOMC 00777 13 50 25753584194* 2566
57085026EED 22SDOMC 00812 13 3303584194* 2566
57085026EED 22SDOMC 00823 13 40 41813584194* 2566
57085026EED 22SDOMC 01984 13 65 30953584194* 2566
2 57401027EED 22SPROC 03130 294 1623581461*1 2566
57210227EED 22SSTKC 01625 07 28 8363586207*1 2601
1 57581727EED 22SDOMC 01097 16 38 1171 1553584940*2 2605
2 57216727EED 22SDOMC 00049 073 803586303*1 2654
1 57591827EED 22SDOMC 01853 16 42 13553584841*2 2664
1 57118226EED 22SDOMC 03156 24 94 762 1703582467*4 2675
3 57519927EED 22SDOMC 03038 09 15 274 423585947*1 2680
4 57076226EED 22SDOMC 01617 13 64 562 1203584498*1 2698
3 57582827EED 22SIRRC 00747 21 85 633 1483582709*2 2724
2 57076126EED 22SDOMC 01484 13 65 254 903584706*1 2748
4 57066326EED 22SDOMC 01342 13 58 17753584399*1 2777
3 57581527EED 22SDOMC 02899 09 22 111 333585346*4 2782
2 57076126EED 22SDOMC 01381 13 37 232 603584906*1 2809
3 57591627EED 22SDOMC 02374 09 15 39543585247*4 2823
3 57591627EED 22SDOMC 02379 09 20 35553585247*4 2823
3 57591627EED 22SDOMC 03029 09 17 28453585247*4 2823
4 57310427EED 22SIRRC 00451 30 130 1262563581143*2 2828
4 57056226EED 22SDOMC 01438 13 50 01 503583683*3 2855
2 57066226EED 22SDOMC 00265 13 3584807*1 2872
2 57066226EED 22SDOMC 01323 13 140 501903584807*1 2872
43Page 4 of6/12/09 4:19 PM WATER COLUMN/ AVERAGEDEPTH TO WATER
*UTM location was derived from PLSS - see Help

(In feet)
(quarters are 1=NW 2=NE 3=SW 4=SE)
(NAD83 UTM in meters)(quarters are smallest to largest)
64
Sub
basin XCountyWater
Column
Q
YDepthWaterPOD Number 416
Q
RngUse TwsSecDepth
Well
Q
Distance
2 57066226EED 22SDOMC 01652 13 34 8423584807*1 2872
2 57066226EED 22SDOMC 01759 13 46 20663584807*1 2872
2 57066226EED 22SDOMC 01762 13 203 572603584807*1 2872
2 57066226EED 22SDOMC 02305 13 603584807*1 2872
1 57581327EED 22SDOMC 00805 093 2503585552*4 2889
1 57581327EED 22SDOMC 03243 093 2503585552*4 2889
57085826EED 22SDOMC 00845 24 1503582581* 2893
4 57562827EED 22SIRRC 00016 212 1673582091*3 2901
3 57340727EED 22SDOMC 02598 293 2503581048*1 2907
57212127EED 22SDOMC 01086 30 140 602003581328*1 2924
2 57160126EED 22SDOMC 00245 252 2503581642*2 2933
1 57583027EED 22SDOMC 02961 21 70 803 1503582303*4 2934
2 57056126EED 22SDOMC 00992 13 35 203 553584706*1 2941
2 57056126EED 22SDOMC 00992 REPAR 13 75 153 903584706*1 2941
57044826EED 22SDOMC 01070 13 1033583792*3 2961
57044826EED 22SDOMC 01072 13 50 30803583792*3 2961
57044826EED 22SDOMC 01276 13 33 17503583792*3 2961
57044826EED 22SDOMC 01541 13 62 23853583792*3 2961
57044826EED 22SDOMC 01542 13 51 29803583792*3 2961
57044826EED 22SDOMC 02666 13 18 15333583792*3 2961
570508DOMC 01490 38 8463584594 2966
1 57181627EED 22SDOMC 01691 30 68 1423 2103581434*1 2979
4 57219627EED 22SSTKC 03157 30 100 731 1733581231*1 2980
2 57056126EED 22SDOMC 01058 13 54 1111 1653584906*1 2998
2 57056126EED 22SDOMC 01061 131 2253584906*1 2998
2 57056126EED 22SDOMC 01461 13 32 181 503584906*1 2998
2 57056126EED 22SDOMC 01559 13 45 1001 1453584906*1 2998
2 57056126EED 22SDOMC 02910 13 90 401 1303584906*1 2998
1 57603027EED 22SDOMC 03083 212 2003582503*4 2999
4 57216427EED 22SDOMC 02593 06 15 853 1003586697*3 3009
4 57066226EED 22SDOMC 01950 12 42 1081503585215*3 3018
57044926EED 22SDOMC 00177 13 60 611213584603*1 3026
43Page 5 of6/12/09 4:19 PM WATER COLUMN/ AVERAGEDEPTH TO WATER
*UTM location was derived from PLSS - see Help

(In feet)
(quarters are 1=NW 2=NE 3=SW 4=SE)
(NAD83 UTM in meters)(quarters are smallest to largest)
64
Sub
basin XCountyWater
Column
Q
YDepthWaterPOD Number 416
Q
RngUse TwsSecDepth
Well
Q
Distance
57044926EED 22SDOMC 00274 13 1003584603*1 3026
57044926EED 22SDOMC 00407 13 40 23633584603*1 3026
57044926EED 22SDOMC 01036 13 40 20603584603*1 3026
57044926EED 22SDOMC 01074 13 50 1582083584603*1 3026
57044926EED 22SDOMC 01132 13 38 20583584603*1 3026
57044926EED 22SDOMC 01198 13 34 19533584603*1 3026
57044926EED 22SDOMC 01495 13 54 26803584603*1 3026
57044926EED 22SDOMC 01510 13 40 43833584603*1 3026
57044926EED 22SDOMC 01679 13 59 711303584603*1 3026
57044926EED 22SDOMC 01711 13 40 25653584603*1 3026
57044926EED 22SDOMC 01714 13 45 841293584603*1 3026
57044926EED 22SDOMC 01725 13 38 20583584603*1 3026
57044926EED 22SDOMC 01732 13 49 31803584603*1 3026
57044926EED 22SDOMC 01742 13 47 14613584603*1 3026
57044926EED 22SDOMC 01798 13 54 16703584603*1 3026
57044926EED 22SDOMC 01834 13 3584603*1 3026
57044926EED 22SDOMC 01915 13 1003584603*1 3026
57044926EED 22SDOMC 01945 13 2003584603*1 3026
57044926EED 22SDOMC 01999 13 66 1592253584603*1 3026
4 57562827EED 22SIRRC 00027 214 1663581891*3 3033
3 57034626EED 22SIRRC 00073 13 60 482 1083583690*3 3070
4 57056126EED 22SDOMC 01631 12 38 273 653585114*3 3071
4 57472427EED 22SDOMC 02648 29 66 1342003581168*2 3083
4 57472427EED 22SPROC 02648 29 66 1342003581168*2 3083
57411727ECH 22SEXPC 00745 29 2503580940* 3097
3 57034726EED 22SDOMC 01577 13 48 252 733584501*1 3106
3 57034726EED 22SDOMC 01588 13 45 552 1003584501*1 3106
3 57034726EED 22SDOMC 01931 13 40 252 653584501*1 3106
2 57320727EED 22SDOMC 03123 302 1593580836*4 3125
2 57381527EED 22SDOMC 00597 29 90 501 1403580848*3 3133
3 57502827EED 22SDOMC 02787 281 1703581274*1 3133
1 57034726EED 22SDOMC 01540 13 45 314 763584707*1 3149
43Page 6 of6/12/09 4:19 PM WATER COLUMN/ AVERAGEDEPTH TO WATER
*UTM location was derived from PLSS - see Help

(In feet)
(quarters are 1=NW 2=NE 3=SW 4=SE)
(NAD83 UTM in meters)(quarters are smallest to largest)
64
Sub
basin XCountyWater
Column
Q
YDepthWaterPOD Number 416
Q
RngUse TwsSecDepth
Well
Q
Distance
1 57034726EED 22SDOMC 01942 13 45 214 663584707*1 3149
4 57056126EED 22SIRRC 00499 121 1803585314*3 3152
1 57024726EED 22SDOMC 01029 13 52 861383583997*3 3158
1 57024726EED 22SDOMC 01049 13 52 30823583997*3 3158
1 57024726EED 22SDOMC 01400 13 52 17693583997*3 3158
1 57024726EED 22SDOMC 01883 13 1703583997*3 3158
1 57024726EED 22SDOMC 01921 13 54 37913583997*3 3158
1 57024726EED 22SDOMC 02013 13 160 902503583997*3 3158
1 57024726EED 22SDOMC 02026 13 863583997*3 3158
1 57024726EED 22SDOMC 02175 13 42 851273583997*3 3158
57085126EED 22SDOMC 00439 12 40 44843585817* 3160
57085126EED 22SDOMC 00545 12 46 14603585817* 3160
57085126EED 22SDOMC 00596 12 40 721123585817* 3160
57085126EED 22SDOMC 00839 12 40 1101503585817* 3160
57085126EED 22SDOMC 00841 12 35 25603585817* 3160
57085126EED 22SDOMC 01374 1 12 32 28603585817* 3160
2 57623427EED 22SDOMC 02558 21 36 191 553582509*4 3177
3 57024726EED 22SDOMC 01173 13 55 38933583591*3 3178
3 57024726EED 22SDOMC 01975 13 45 47923583591*3 3178
1 57337227EED 22SDOMC 00783 05 73 623 1353587136*3 3181
1 57280327EED 22SDOMC 02409 30 90 1012 1913580831*4 3181
3 57024826EED 22SIRRC 00372 13 53 1191723584402*1 3188
3 57024826EED 22SPROC 00372 13 53 1191723584402*1 3188
3 57024826EED 22SDOMC 01636 13 75 251003584402*1 3188
3 57024826EED 22SDOMC 01654 13 1803584402*1 3188
1 57034726EED 22SDOMC 00685 13 38 142 523584907*1 3202
1 57034726EED 22SDOMC 01066 13 50 2372 2873584907*1 3202
1 57034726EED 22SDOMC 02956 13 41 152 563584907*1 3202
1 57034726EED 22SDOMC 03111 132 2003584907*1 3202
1 57351127EED 22SIRRC 00062 29 2703580743*3 3213
4 57482327EED 22SDOMC 02631 29 69 274 963581067*2 3217
4 57642127EED 22SIRRC 00021 A 09 40 1564 1963585150*4 3244
43Page 7 of6/12/09 4:19 PM WATER COLUMN/ AVERAGEDEPTH TO WATER
*UTM location was derived from PLSS - see Help

(In feet)
(quarters are 1=NW 2=NE 3=SW 4=SE)
(NAD83 UTM in meters)(quarters are smallest to largest)
64
Sub
basin XCountyWater
Column
Q
YDepthWaterPOD Number 416
Q
RngUse TwsSecDepth
Well
Q
Distance
2 57138526EED 22SDOMC 02263 12 14 61 203586506*2 3253
1 57014626EED 22SDOMC 01050 13 52 521 1043584096*3 3262
1 57014626EED 22SDOMC 01051 13 54 761 1303584096*3 3262
1 57014626EED 22SDOMC 01052 13 52 581 1103584096*3 3262
1 57024826EED 22SDOMC 01065 13 2153584808*1 3270
1 57024826EED 22SDOMC 01402 13 52 1732253584808*1 3270
1 57024826EED 22SDOMC 01673 13 50 1201703584808*1 3270
1 57024826EED 22SDOMC 01917 13 1503584808*1 3270
1 57024826EXX 22SDOMC 02303 13 1003584808*1 3270
2 57623427EED 22SDOMC 03080 213 2003582309*4 3273
3 57014726EED 22SDOMC 01491 13 43 373 803584301*1 3276
3 57014726EED 22SDOMC 01926 133 2003584301*1 3276
3 57014726EED 22SDOMC 02058 13 85 203 1053584301*1 3276
3 57014626EED 22SDOMC 00590 13 65 1513 2163583490*3 3292
3 57014626EED 22SDOMC 01390 133 1253583490*3 3292
3 57014626EED 22SIRRC 01390 133 1253583490*3 3292
3 57014626EED 22SDOMC 01628 13 40 303 703583490*3 3292
3 57014626EED 22SDOMC 02589 13 58 133 713583490*3 3292
57044926EED 22SDOMC 01115 12 37 19563585415*3 3296
57044926EED 22SDOMC 01229 12 38 17553585415*3 3296
57044926EED 22SDOMC 01319 12 40 12523585415*3 3296
57044926EED 22SDOMC 01338 12 26 53793585415*3 3296
57044926EED 22SDOMC 01784 12 40 20603585415*3 3296
57044926EED 22SDOMC 01860 12 31 49803585415*3 3296
57044926EED 22SIRRC 02196 12 1123585415*3 3296
3 57014726EED 22SDOMC 01480 13 65 1491 2143584501*1 3303
3 57502827EED 22SIRRC 00014 S 283 2053581074*1 3306
2 57633527EED 22SDOMC 02259 21 45 15603582410*4 3312
1 57662827EED 22SIRRC 00576 15 184 -653 1193584749*1 3319
1 57583427EED 22SIRRC 02117 28 60 901 1503581691*2 3320
2 57320727EED 22SDOMC 01356 30 130 804 2103580636*4 3324
1 57108826EED 22SDOMC 00568 25 3003581550*2 3339
43Page 8 of6/12/09 4:19 PM WATER COLUMN/ AVERAGEDEPTH TO WATER
*UTM location was derived from PLSS - see Help
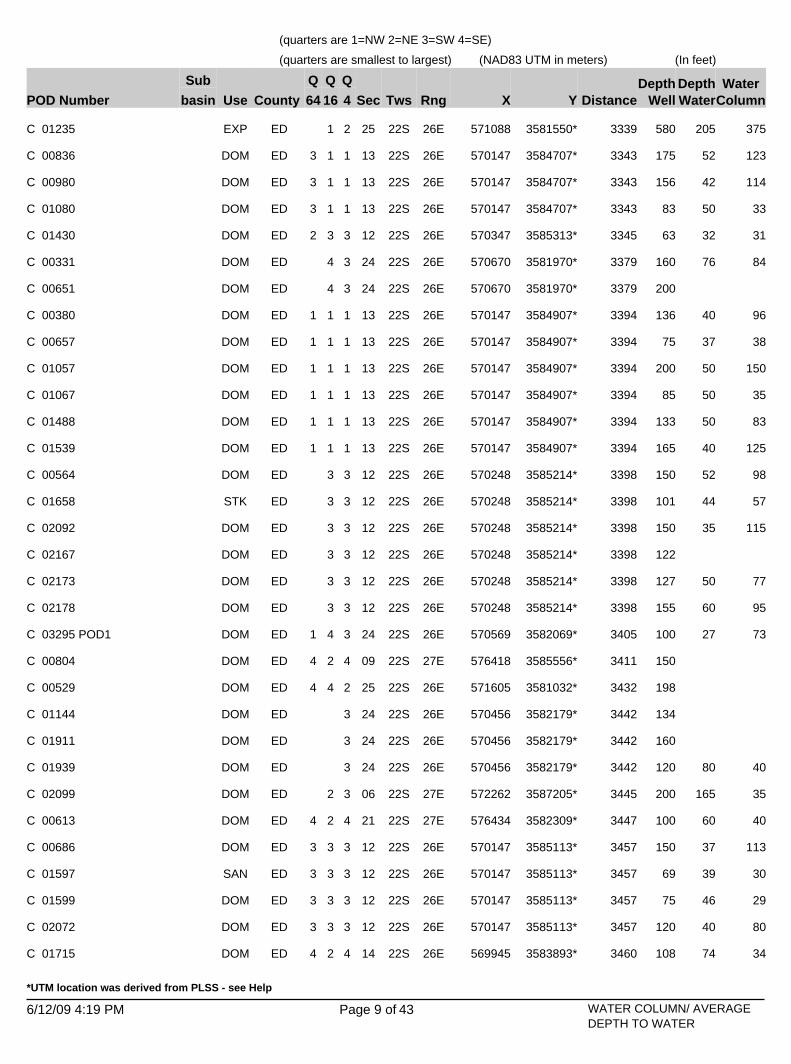
(In feet)
(quarters are 1=NW 2=NE 3=SW 4=SE)
(NAD83 UTM in meters)(quarters are smallest to largest)
64
Sub
basin XCountyWater
Column
Q
YDepthWaterPOD Number 416
Q
RngUse TwsSecDepth
Well
Q
Distance
1 57108826EED 22SEXPC 01235 25 205 3755803581550*2 3339
1 57014726EED 22SDOMC 00836 13 52 1233 1753584707*1 3343
1 57014726EED 22SDOMC 00980 13 42 1143 1563584707*1 3343
1 57014726EED 22SDOMC 01080 13 50 333 833584707*1 3343
3 57034726EED 22SDOMC 01430 12 32 312 633585313*3 3345
4 57067026EED 22SDOMC 00331 24 76 841603581970*3 3379
4 57067026EED 22SDOMC 00651 24 2003581970*3 3379
1 57014726EED 22SDOMC 00380 13 40 961 1363584907*1 3394
1 57014726EED 22SDOMC 00657 13 37 381 753584907*1 3394
1 57014726EED 22SDOMC 01057 13 50 1501 2003584907*1 3394
1 57014726EED 22SDOMC 01067 13 50 351 853584907*1 3394
1 57014726EED 22SDOMC 01488 13 50 831 1333584907*1 3394
1 57014726EED 22SDOMC 01539 13 40 1251 1653584907*1 3394
3 57024826EED 22SDOMC 00564 12 52 981503585214*3 3398
3 57024826EED 22SSTKC 01658 12 44 571013585214*3 3398
3 57024826EED 22SDOMC 02092 12 35 1151503585214*3 3398
3 57024826EED 22SDOMC 02167 12 1223585214*3 3398
3 57024826EED 22SDOMC 02173 12 50 771273585214*3 3398
3 57024826EED 22SDOMC 02178 12 60 951553585214*3 3398
4 57056926EED 22SDOMC 03295 POD1 24 27 731 1003582069*3 3405
2 57641827EED 22SDOMC 00804 094 1503585556*4 3411
4 57160526EED 22SDOMC 00529 254 1983581032*2 3432
57045626EED 22SDOMC 01144 24 1343582179*3 3442
57045626EED 22SDOMC 01911 24 1603582179*3 3442
57045626EED 22SDOMC 01939 24 80 401203582179*3 3442
2 57226227EED 22SDOMC 02099 06 165 352003587205*3 3445
2 57643427EED 22SDOMC 00613 21 60 404 1003582309*4 3447
3 57014726EED 22SDOMC 00686 12 37 1133 1503585113*3 3457
3 57014726EED 22SSANC 01597 12 39 303 693585113*3 3457
3 57014726EED 22SDOMC 01599 12 46 293 753585113*3 3457
3 57014726EED 22SDOMC 02072 12 40 803 1203585113*3 3457
2 56994526EED 22SDOMC 01715 14 74 344 1083583893*4 3460
43Page 9 of6/12/09 4:19 PM WATER COLUMN/ AVERAGEDEPTH TO WATER
*UTM location was derived from PLSS - see Help

(In feet)
(quarters are 1=NW 2=NE 3=SW 4=SE)
(NAD83 UTM in meters)(quarters are smallest to largest)
64
Sub
basin XCountyWater
Column
Q
YDepthWaterPOD Number 416
Q
RngUse TwsSecDepth
Well
Q
Distance
2 56994526EED 22SDOMC 01791 14 65 304 953583893*4 3460
2 56994526EED 22SDOMC 01795 14 63 304 933583893*4 3460
2 56994526EED 22SDOMC 01908 14 68 1524 2203583893*4 3460
2 56994526EED 22SDOMC 01996 14 66 1754 2413583893*4 3460
4 56994626EED 22SDOMC 00285 14 20 604 803584298*2 3475
4 56994626EED 22SDOMC 01659 14 30 704 1003584298*2 3475
4 56994626EED 22SDOMC 02138 14 80 104 903584298*2 3475
4 56994626EED 22SDOMC 02544 14 52 484 1003584298*2 3475
1 57035126EED 22SDOMC 01269 244 1503582280*3 3483
4 56994426EED 22SDOMC 00330 14 80 1224 2023583488*4 3492
2 57077226EED 22SDOMC 00452 252 3003581657*1 3494
2 57077226EED 22SDOMC 00666 25 92 882 1803581657*1 3494
2 57077226EED 22SDOMC 02328 REPAR 25 92 2932 3853581657*1 3494
4 57543227EED 22SDOMC 03288 POD1 283 2003581079*1 3518
2 56994526EED 22SDOMC 00671 23 67 262 933583284*2 3524
4 57140526EED 22SIRRC 00193 A 25 190 903 2803581032*2 3541
4 57301027EED 22SIRRC 00031 C 30 172 321 2043580430*4 3547
57249827EED 22SDOMC 00514 06 503587396* 3558
1 57024826EED 22SDOMC 00771 12 43 621053585620*3 3569
2 57216127EED 22SMULC 03007 06 11 281 393587304*3 3572
4 56984526EED 22SDOMC 01334 14 80 701503583589*4 3578
4 56984526EED 22SDOMC 01890 14 66 20863583589*4 3578
3 57035426EED 22SDOMC 00199 242 1343582077*3 3582
2 56994726EED 22SDOMC 01818 14 31 1892 2203584904*2 3585
2 56994726EED 22SIRRC 01849 142 3584904*2 3585
3 57336927EED 22SDOMC 00717 05 32 283 603587548*1 3593
3 57422327EED 22SDOMC 02667 29 81 471 1283580448*4 3601
3 57583527EED 22SIRRC 00056 281 983581284*2 3610
1 57663927EED 22SDOMC 00614 22 60 353 953582314*3 3626
2 57077226EED 22SDOMC 00735 25 118 204 1383581457*1 3629
2 57077226EED 22SDOMC 00878 25 90 354 1253581457*1 3629
2 57077226EED 22SDOMC 00956 25 86 394 1253581457*1 3629
43Page 10 of6/12/09 4:19 PM WATER COLUMN/ AVERAGEDEPTH TO WATER
*UTM location was derived from PLSS - see Help

(In feet)
(quarters are 1=NW 2=NE 3=SW 4=SE)
(NAD83 UTM in meters)(quarters are smallest to largest)
64
Sub
basin XCountyWater
Column
Q
YDepthWaterPOD Number 416
Q
RngUse TwsSecDepth
Well
Q
Distance
2 56984626EED 22SDOMC 00672 23 1303583185*2 3641
2 56984626EED 22SDOMC 02078 23 75 1001753583185*2 3641
2 56984626EED 22SDOMC 02121 23 90 361263583185*2 3641
2 56984626EED 22SDOMC 02635 23 92 181103583185*2 3641
3 57109126EED 22SDOMC 01369 25 158 121703581140*2 3644
3 57109126EED 22SPROC 01459 25 190 152053581140*2 3644
4 56994826EED 22SDOMC 01556 11 61 894 1503585109*4 3644
2 57057226EED 22SDOMC 00226 251 2303581657*1 3647
2 57057226EED 22SDOMC 00358 25 81 1081 1893581657*1 3647
2 56984826EED 22SDOMC 01966 14 3584805*2 3657
3 57119026EED 22SDOMC 01372 25 195 154 2103581039*2 3661
2 56974526EED 22SDOMC 00879 14 80 401 1203584093*4 3662
2 56974526EED 22SDOMC 01032 14 70 1101 1803584093*4 3662
1 57674027EED 22SDOMC 02512 22 57 851423582415*3 3673
4 56974626EED 22SDOMC 01907 143 1503584298*2 3675
3 57097226EED 22SDOMC 01735 01 37 133 503586714*4 3678
4 56974426EED 22SDOMC 02222 14 95 723 1673583488*4 3690
3 57682627EED 22SDOMC 00160 10 40 452 853585355*3 3696
4 56974626EED 22SMULC 02079 14 57 1551 2123584498*2 3699
1 57014726EED 22SIRRC 00133 12 45 141 593585719*3 3704
1 57014726EED 22SDOMC 01413 12 45 161 613585719*3 3704
1 57014726EED 22SDOMC 01468 12 43 1051 1483585719*3 3704
1 57014726EED 22SDOMC 01855 12 36 241 603585719*3 3704
1 57014726EED 22SDOMC 02381 12 50 1001 1503585719*3 3704
4 56994826EED 22SDOMC 00118 112 703585309*4 3712
4 56994826EED 22SDOMC 00865 11 40 932 1333585309*4 3712
4 56994826EED 22SDOMC 00893 11 46 952 1413585309*4 3712
4 56994826EED 22SDOMC 01171 11 46 832 1293585309*4 3712
4 56994826EED 22SDOMC 01850 11 50 1002 1503585309*4 3712
4 57321027EED 22SDOMC 01184 30 131 134 1443580230*4 3730
2 56974726EED 22SIRRC 01874 14 90 703 1603584704*2 3733
4 56984726EED 22SDOMC 01600 23 45 851303582782*2 3746
43Page 11 of6/12/09 4:19 PM WATER COLUMN/ AVERAGEDEPTH TO WATER
*UTM location was derived from PLSS - see Help
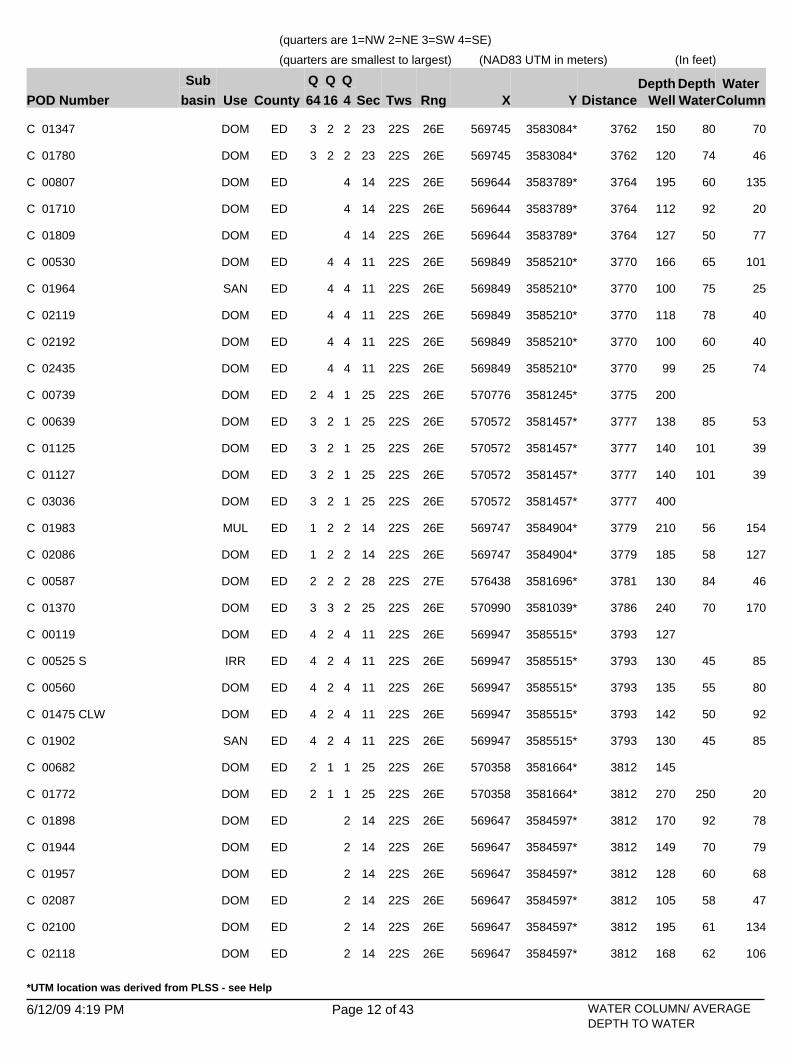
(In feet)
(quarters are 1=NW 2=NE 3=SW 4=SE)
(NAD83 UTM in meters)(quarters are smallest to largest)
64
Sub
basin XCountyWater
Column
Q
YDepthWaterPOD Number 416
Q
RngUse TwsSecDepth
Well
Q
Distance
2 56974526EED 22SDOMC 01347 23 80 703 1503583084*2 3762
2 56974526EED 22SDOMC 01780 23 74 463 1203583084*2 3762
56964426EED 22SDOMC 00807 14 60 1351953583789*4 3764
56964426EED 22SDOMC 01710 14 92 201123583789*4 3764
56964426EED 22SDOMC 01809 14 50 771273583789*4 3764
4 56984926EED 22SDOMC 00530 11 65 1011663585210*4 3770
4 56984926EED 22SSANC 01964 11 75 251003585210*4 3770
4 56984926EED 22SDOMC 02119 11 78 401183585210*4 3770
4 56984926EED 22SDOMC 02192 11 60 401003585210*4 3770
4 56984926EED 22SDOMC 02435 11 25 74993585210*4 3770
4 57077626EED 22SDOMC 00739 252 2003581245*1 3775
2 57057226EED 22SDOMC 00639 25 85 533 1383581457*1 3777
2 57057226EED 22SDOMC 01125 25 101 393 1403581457*1 3777
2 57057226EED 22SDOMC 01127 25 101 393 1403581457*1 3777
2 57057226EED 22SDOMC 03036 253 4003581457*1 3777
2 56974726EED 22SMULC 01983 14 56 1541 2103584904*2 3779
2 56974726EED 22SDOMC 02086 14 58 1271 1853584904*2 3779
2 57643827EED 22SDOMC 00587 28 84 462 1303581696*2 3781
3 57099026EED 22SDOMC 01370 25 70 1703 2403581039*2 3786
2 56994726EED 22SDOMC 00119 114 1273585515*4 3793
2 56994726EED 22SIRRC 00525 S 11 45 854 1303585515*4 3793
2 56994726EED 22SDOMC 00560 11 55 804 1353585515*4 3793
2 56994726EED 22SDOMC 01475 CLW 11 50 924 1423585515*4 3793
2 56994726EED 22SSANC 01902 11 45 854 1303585515*4 3793
1 57035826EED 22SDOMC 00682 252 1453581664*1 3812
1 57035826EED 22SDOMC 01772 25 250 202 2703581664*1 3812
56964726EED 22SDOMC 01898 14 92 781703584597*2 3812
56964726EED 22SDOMC 01944 14 70 791493584597*2 3812
56964726EED 22SDOMC 01957 14 60 681283584597*2 3812
56964726EED 22SDOMC 02087 14 58 471053584597*2 3812
56964726EED 22SDOMC 02100 14 61 1341953584597*2 3812
56964726EED 22SDOMC 02118 14 62 1061683584597*2 3812
43Page 12 of6/12/09 4:19 PM WATER COLUMN/ AVERAGEDEPTH TO WATER
*UTM location was derived from PLSS - see Help

(In feet)
(quarters are 1=NW 2=NE 3=SW 4=SE)
(NAD83 UTM in meters)(quarters are smallest to largest)
64
Sub
basin XCountyWater
Column
Q
YDepthWaterPOD Number 416
Q
RngUse TwsSecDepth
Well
Q
Distance
56964726EED 22SDOMC 02457 14 65 951603584597*2 3812
3 57664127EED 22SIRRC 00009 22 100 653 1653581908*3 3829
57692827EED 22SDOMC 00849 10 2003585457*3 3829
4 56974826EED 22SDOMC 01751 11 60 503 1103585109*4 3834
2 57713427EED 22SDOMC 00284 15 20 1101303584856*1 3836
3 57015426EED 22SDOMC 01425 243 1423581877*3 3858
3 57015426EED 22SDOMC 01471 24 75 453 1203581877*3 3858
2 57543427EED 22SIRRC 00014 283 2023580672*3 3859
3 56954226EED 22SDOMC 01518 14 165 352 2003583687*4 3872
4 57723527EED 22SIRRC 00576 S 15 48 1242 1723584550*1 3875
4 57723527EED 22SPROC 00576 S 15 48 1242 1723584550*1 3875
2 56994726EED 22SDOMC 00220 112 1253585715*4 3880
2 56994726EED 22SIRRC 00724 11 41 172 583585715*4 3880
2 56994726EED 22SDOMC 01412 11 44 882 1323585715*4 3880
56964626EED 22SDOMC 00762 23 90 411313582980*2 3883
56964626EED 22SDOMC 01467 23 100 1092093582980*2 3883
56964626EED 22SDOMC 01846 23 60 1151753582980*2 3883
4 57462827EED 22SSTKC 00559 293 2003580255*4 3896
3 56954526EED 22SDOMC 01909 14 65 1002 1653584495*2 3897
4 56974826EED 22SIRRC 00630 11 11 741 853585309*4 3899
4 56974826EED 22SDOMC 00837 11 46 1231 1693585309*4 3899
4 56974826EED 22SDOMC 02128 11 60 401 1003585309*4 3899
3 57014826EED 22SDOMC 03099 121 2003586125*1 3913
4 57067726EED 22SDOMC 00324 25 96 1042003581146*1 3915
4 57057626EED 22SDOMC 00244 25 96 1541 2503581245*1 3917
4 57057626EED 22SMULC 00334 25 78 2221 3003581245*1 3917
4 57057626EED 22SDOMC 01193 25 110 101 1203581245*1 3917
1 56954326EED 22SDOMC 01335 23 90 222 1123583282*2 3920
57087126EED 22SDOMC 00761 25 186 342203580963* 3920
57087126EED 22SDOMC 00826 25 2003580963* 3920
57087126EED 22SDOMC 01739 25 90 701603580963* 3920
4 57077626EED 22SIRRC 00225 254 2353581045*1 3921
43Page 13 of6/12/09 4:19 PM WATER COLUMN/ AVERAGEDEPTH TO WATER
*UTM location was derived from PLSS - see Help

(In feet)
(quarters are 1=NW 2=NE 3=SW 4=SE)
(NAD83 UTM in meters)(quarters are smallest to largest)
64
Sub
basin XCountyWater
Column
Q
YDepthWaterPOD Number 416
Q
RngUse TwsSecDepth
Well
Q
Distance
4 57077626EED 22SDOMC 00435 25 134 194 1533581045*1 3921
4 57077626EED 22SDOMC 01075 25 90 284 1183581045*1 3921
2 56984826EED 22SDOMC 00290 11 603585616*4 3925
2 56984826EED 22SDOMC 01785 11 40 56963585616*4 3925
57046426EED 22SDOMC 00789 25 3003581353*1 3926
57046426EED 22SDOMC 00937 25 132 722043581353*1 3926
57046426EED 22SDOMC 01024 25 95 351303581353*1 3926
57046426EED 22SDOMC 01135 25 120 201403581353*1 3926
57046426EED 22SDOMC 01141 25 140 782183581353*1 3926
57046426EED 22SDOMC 01439 25 100 401403581353*1 3926
57046426EED 22SDOMC 02102 25 115 201353581353*1 3926
57046426EED 22SDOMC 02328 25 92 2933853581353*1 3926
57046426EED 22SDOMC 02540 25 4003581353*1 3926
1 56954726EED 22SDOMC 02055 14 66 884 1543584700*2 3929
2 57321327EED 22SIRRC 00228 S 31 145 802 2253580025*2 3934
2 57321327EED 22SDOMC 00249 312 2003580025*2 3934
2 57321327EED 22SDOMC 01037 31 109 322 1413580025*2 3934
1 57025926EED 22SDOMC 00968 25 86 421283581565*1 3950
1 56954326EED 22SDOMC 02732 23 105 654 1703583082*2 3959
1 56954726EED 22SDOMC 02125 14 60 652 1253584900*2 3972
1 57015826EED 22SDOMC 00338 251 1193581664*1 3973
1 57015826EED 22SDOMC 02156 25 45 551 1003581664*1 3973
1 57015826EED 22SDOMC 02450 251 1353581664*1 3973
1 57015826EED 22SDOMC 02938 251 4003581664*1 3973
2 56974726EED 22SDOMC 02556 113 1123585515*4 3976
4 57076026EED 22SIRRC 02378 012 3586925*3 3977
3 56944326EED 22SDOMC 01358 14 82 1252073583588*4 3978
4 56994626EED 22SDOMC 01123 11 60 1254 1853585922*2 3979
1 57034926EED 22SIRRC 01287 12 20 1862 2063586530*1 3996
1 57422527EED 22SDOMC 03028 32 89 1281 2173580043*2 3997
3 56954426EED 22SDOMC 01410 23 80 602 1403582878*2 4008
1 57025026EED 22SDOMC 00534 12 42 20623586431*1 4010
43Page 14 of6/12/09 4:19 PM WATER COLUMN/ AVERAGEDEPTH TO WATER
*UTM location was derived from PLSS - see Help

(In feet)
(quarters are 1=NW 2=NE 3=SW 4=SE)
(NAD83 UTM in meters)(quarters are smallest to largest)
64
Sub
basin XCountyWater
Column
Q
YDepthWaterPOD Number 416
Q
RngUse TwsSecDepth
Well
Q
Distance
57129826EED 22SDOMC 00198 25 145 151603580540*4 4012
57129826EED 22SDOMC 00401 RPR 25 180 702503580540*4 4012
57129826EED 22SDOMC 01013 25 2453580540*4 4012
57129826EED 22SDOMC 01149 25 170 752453580540*4 4012
3 56954826EED 22SDOMC 00729 11 16 764 923585104*4 4024
3 56954826EED 22SDOMC 00835 11 55 984 1533585104*4 4024
3 56954826EED 22SDOMC 01030 11 54 564 1103585104*4 4024
3 56954826EED 22SDOMC 01419 11 56 564 1123585104*4 4024
3 56954826EED 22SDOMC 01740 11 57 1754 2323585104*4 4024
3 56954826EED 22SDOMC 01792 11 23 574 803585104*4 4024
1 56944426EED 22SDOMC 01778 23 73 471203583183*2 4035
1 56944426EED 22SDOMC 01804 23 90 641543583183*2 4035
1 56944426EED 22SDOMC 01894 23 95 251203583183*2 4035
1 56944426EED 22SDOMC 01933 23 103 671703583183*2 4035
1 56944426EED 22SDOMC 02023 23 82 371193583183*2 4035
1 56944426EED 22SDOMC 02376 23 90 201103583183*2 4035
1 57744327EED 22SIRRC 02242 15 22 1281 1503584150*4 4042
1 57442527EED 22SDOMC 02590 32 114 1862 3003580043*2 4042
1 56944826EED 22SDOMC 01848 14 75 751503584801*2 4046
4 57141126EED 22SDOMC 00167 251 2103580427*4 4052
4 57141126EED 22SDOMC 00902 251 3053580427*4 4052
3 57744127EED 22SIRRC 00700 153 1323584355*2 4055
4 57057626EED 22SDOMC 00090 253 653581045*1 4058
4 57057626EED 22SDOMC 00579 25 109 183 1273581045*1 4058
4 57057626EED 22SDOMC 00763 25 99 313 1303581045*1 4058
4 57057626EED 22SDOMC 01196 253 1753581045*1 4058
2 56974726EED 22SDOMC 01167 11 60 1071 1673585715*4 4059
2 56974726EED 22SDOMC 02147 11 50 751 1253585715*4 4059
1 57664327EED 22SIRRC 00150 273 803581501*1 4062
57209027EED 22SIRRC 00248 06 18 6243587802*1 4065
3 56954426EED 22SDOMC 01981 23 80 304 1103582678*2 4066
3 57036226EED 22SDOMC 00325 25 68 702 1383581251*1 4070
43Page 15 of6/12/09 4:19 PM WATER COLUMN/ AVERAGEDEPTH TO WATER
*UTM location was derived from PLSS - see Help

(In feet)
(quarters are 1=NW 2=NE 3=SW 4=SE)
(NAD83 UTM in meters)(quarters are smallest to largest)
64
Sub
basin XCountyWater
Column
Q
YDepthWaterPOD Number 416
Q
RngUse TwsSecDepth
Well
Q
Distance
3 57036226EED 22SDOMC 00553 25 90 502 1403581251*1 4070
3 57036226EED 22SDOMC 01681 25 60 902 1503581251*1 4070
1 57583727EED 22SDOMC 00695 283 2003580677*4 4081
3 56934226EED 22SDOMC 01054 14 90 703 1603583487*4 4089
1 57015826EED 22SDOMC 00723 25 87 413 1283581464*1 4092
1 57015826EED 22SDOMC 01076 25 69 413 1103581464*1 4092
3 56934526EED 22SDOMC 00445 141 1503584495*2 4095
3 56934526EED 22SIRRC 00446 14 85 1211 2063584495*2 4095
3 56934526EED 22SDOMC 00730 141 723584495*2 4095
3 56934526EED 22SDOMC 01980 14 77 541 1313584495*2 4095
4 56984726EED 22SDOMC 00238 11 3586023*2 4115
4 56984726EED 22SDOMC 00253 11 1203586023*2 4115
1 56934326EED 22SDOMC 00742 231 3003583282*2 4117
1 56934326ECH 22SDOMC 00867 23 104 1251 2293583282*2 4117
1 57341727EED 22SIRRC 00062 A-S 32 100 1003 2003579830*1 4125
1 56934726EED 22SIRRC 00113 & C-446-S 14 30 1373 1673584700*2 4125
1 56934726EED 22SIRRC 00446 & C-113-S 14 30 1373 1673584700*2 4125
1 56934726EED 22SDOMC 00872 14 81 493 1303584700*2 4125
3 56948926EED 22SDOMC 03398 POD1 11 68 662 13435852574 4126
3 56944526EED 22SDOMC 01514 23 80 341143582779*2 4130
3 56944526EED 22SDOMC 01666 23 90 311213582779*2 4130
3 56944526EED 22SDOMC 02035 23 75 301053582779*2 4130
3 56947926EED 22SDOMC 03399 POD1 11 40 1082 14835852424 4131
1 56954526EED 22SDOMC 01769 23 75 262 1013582473*4 4134
4 57563627EED 22SDOMC 00828 282 2003580466*3 4141
56926426EED 22SDOMC 02087 CLW 14 54 1061603584188* 4147
56926426EED 22SDOMC 02104 14 71 731443584188* 4147
2 57301327EED 22SDOMC 02624 31 75 1453 2203579825*2 4148
3 56944926EED 22SDOMC 02098 11 58 781363585205*4 4148
1 57014926EED 22SIRRC 00182 121 1303586530*1 4151
1 57014926EED 22SIRRC 00503 121 1293586530*1 4151
3 57119626EED 22SDOMC 00737 252 3003580438*4 4153
43Page 16 of6/12/09 4:19 PM WATER COLUMN/ AVERAGEDEPTH TO WATER
*UTM location was derived from PLSS - see Help

(In feet)
(quarters are 1=NW 2=NE 3=SW 4=SE)
(NAD83 UTM in meters)(quarters are smallest to largest)
64
Sub
basin XCountyWater
Column
Q
YDepthWaterPOD Number 416
Q
RngUse TwsSecDepth
Well
Q
Distance
2 57483027EED 22SDOMC 03085 32 82 732 1553580049*2 4157
1 56934726EED 22SDOMC 01511 14 82 651 1473584900*2 4166
1 57422527EED 22SDOMC 03030 32 53 473 1003579843*2 4192
3 57036226EED 22SDOMC 01121 25 102 234 1253581051*1 4206
3 57743727EED 22SIRRC 00744 103 1753585166*4 4209
1 56954526EED 22SDOMC 01698 23 77 764 1533582273*4 4210
3 57016226EED 22SIRRC 00223 251 3003581251*1 4222
1 57503427EED 22SDOMC 02207 331 1603580055*1 4226
1 57503427EED 22SDOMC 02996 33 62 581 1203580055*1 4226
4 57141126EED 22SMULC 00277 25 147 1183 2653580227*4 4227
4 57141126EED 22SDOMC 01153 253 2903580227*4 4227
1 56954626EED 22SDOMC 00569 11 60 1402 2003585711*4 4239
1 56954626EED 22SDOMC 00602 11 55 602 1153585711*4 4239
2 57056526EED 22SIRRC 01571 01 48 823 1303587120*3 4252
3 56934426EED 22SDOMC 00402 23 78 523 1303582678*2 4257
4 57641227EED 22SIRRC 00589 042 3586974*4 4261
4 57641227EED 22SPROC 00589 042 3586974*4 4261
1 56944626EED 22SDOMC 01752 23 120 141343582374*4 4263
1 56944626EED 22SDOMC 01918 23 79 461253582374*4 4263
1 56944626EED 22SDOMC 02068 23 95 631583582374*4 4263
1 56944626EED 22SDOMC 02088 23 80 301103582374*4 4263
4 56915026EED 22SDOMC 02085 14 90 804 1703584292*1 4268
57045126EED 22SIRRC 01770 01 2453587038*3 4269
3 56934826EED 22SDOMC 00126 AD 11 60 901 1503585304*4 4275
3 56934826EED 22SIRRC 00126 AD 11 60 901 1503585304*4 4275
3 56934826EED 22SDOMC 02014 11 87 91 963585304*4 4275
3 56934826EED 22SDOMC 02187 11 80 671 1473585304*4 4275
3 56934826EED 22SDOMC 02194 11 25 651 903585304*4 4275
2 57704827EED 22SDOMC 00901 27 40 1531 1933581707*1 4280
1 56944726EED 22SMULC 02028 11 65 25903585612*4 4290
1 56944726EED 22SDOMC 02062 11 983585612*4 4290
1 57523427EED 22SDOMC 02978 332 1303580055*1 4307
43Page 17 of6/12/09 4:19 PM WATER COLUMN/ AVERAGEDEPTH TO WATER
*UTM location was derived from PLSS - see Help

(In feet)
(quarters are 1=NW 2=NE 3=SW 4=SE)
(NAD83 UTM in meters)(quarters are smallest to largest)
64
Sub
basin XCountyWater
Column
Q
YDepthWaterPOD Number 416
Q
RngUse TwsSecDepth
Well
Q
Distance
2 57644227EED 22SDOMC 02979 282 2003580882*4 4320
1 56934526EED 22SDOMC 01796 23 94 311 1253582473*4 4322
1 57188727EED 22SDOMC 01790 06 17 42593588005*1 4325
2 57624227EED 22SIRRC 01829 283 1253580682*4 4331
1 56934626EED 22SDOMC 02513 11 40 853 1253585511*4 4347
1 56934626EED 22SDOMC 03044 113 1603585511*4 4347
3 57016226EED 22SDOMC 00482 253 1523581051*1 4353
3 57016226EXX 22SDOMC 00482 CLW 253 1523581051*1 4353
2 56974626EED 22SIRRC 00131 113 1263586328*2 4361
2 57650827EED 22SDOMC 03392 POD1 28 70 602 13035808864 4364
56924226EED 22SDOMC 01764 23 72 501223582563* 4389
1 56934526EED 22SDOMC 01876 23 100 353 1353582273*4 4394
3 57422727EED 22SDOMC 02487 32 70 801 1503579637*2 4395
3 57763727EED 22SDOMC 00780 104 2003585166*4 4401
3 57261327EED 22SIRRC 00228 311 2103579617*2 4409
1 56934626EED 22SDOMC 00583 11 50 721 1223585711*4 4422
3 56944726EED 22SSTKC 00405 23 135 251603581969*4 4428
1 57182927EED 22SSTKC 03161 313 2003579813*1 4431
2 57724827EED 22SDOMC 00588 272 2003581707*1 4452
2 56895126EED 22SIRRC 00149 14 101 241 1253584089*3 4456
4 56914926EED 22SDOMC 02630 11 80 702 1503585299*3 4463
2 57644227EED 22SDOMC 03064 28 70 554 1253580682*4 4464
2 57644227EED 22SPROC 03064 28 70 554 1253580682*4 4464
4 56895026EED 22SDOMC 01044 14 105 493 1543584292*1 4467
4 56895026EED 22SDOMC 01799 14 102 253 1273584292*1 4467
4 56895026EED 22SDOMC 02015 14 160 153 1753584292*1 4467
3 56934626EED 22SDOMC 01309 23 80 201 1003582068*4 4476
4 56895026EED 22SDOMC 00847 14 85 851 1703584492*1 4487
4 56895026EED 22SDOMC 01005 14 90 1471 2373584492*1 4487
3 57346427EED 21SDOMC 02009 32 32 18503588465*3 4510
4 56905026EED 22SDOMC 00715 11 108 441523585200*3 4529
4 56905026EED 22SDOMC 01444 11 83 501333585200*3 4529
43Page 18 of6/12/09 4:19 PM WATER COLUMN/ AVERAGEDEPTH TO WATER
*UTM location was derived from PLSS - see Help

(In feet)
(quarters are 1=NW 2=NE 3=SW 4=SE)
(NAD83 UTM in meters)(quarters are smallest to largest)
64
Sub
basin XCountyWater
Column
Q
YDepthWaterPOD Number 416
Q
RngUse TwsSecDepth
Well
Q
Distance
4 56905026EED 22SIRRC 01444 11 83 501333585200*3 4529
4 56905026EED 22SMULC 01941 11 71 25963585200*3 4529
4 56905026EED 22SDOMC 02610 11 80 781583585200*3 4529
2 57158226EED 22SDOMC 02672 01 21 92 303588105*2 4532
2 56914626EED 22SIRRC 00047 114 1403585507*3 4532
2 56914626EED 22SMULC 00047 114 1403585507*3 4532
2 56914626EED 22SDOMC 01557 11 60 704 1303585507*3 4532
2 56914626EED 22SMULC 02390 114 1303585507*3 4532
4 56984626EED 22SDOMC 01178 02 80 7873586835*4 4578
3 57198327EED 21SDOMC 02646 31 13 124 253588308*3 4579
4 57076926EED 22SDOMC 03090 012 953587715*1 4591
3 57422727EED 22SDOMC 00204 323 1703579437*2 4592
3 57422727EED 22SIRRC 00204 323 1703579437*2 4592
3 57422727EED 22SDOMC 00619 323 2503579437*2 4592
3 57422727EED 22SDOMC 02383 323 1753579437*2 4592
4 56894926EED 22SDOMC 02403 11 97 573 1543585099*3 4600
3 57503527EED 22SIRRC 00193 331 1903579649*1 4604
3 57503527EED 22SMDWC 00193 331 1903579649*1 4604
2 56914626EED 22SDOMC 01782 11 61 392 1003585707*3 4605
2 56914626EED 22SDOMC 02547 11 58 692 1273585707*3 4605
4 57473227EED 22SDOMC 02262 32 60 681283579544*2 4606
4 57634527EED 22SDOMC 01744 28 100 401403580377*4 4630
3 57442727EED 22SIRRC 00343 324 2003579437*2 4632
3 57178327EED 21SDOMC 00344 31 17 1633 1803588308*3 4645
4 56894926EED 22SDOMC 03280 111 1753585299*3 4654
4 56894926EED 22SDOLC 03336 POD1 11 79 511 1303585299*3 4654
2 56904726EED 22SDOMC 01401 11 66 23893585608*3 4660
2 56904726EED 22SDOMC 01729 11 69 561253585608*3 4660
2 56904726EED 22SDOMC 01813 11 70 301003585608*3 4660
4 57725027EED 22SIRRC 00572 27 90 82 983581301*1 4672
2 56903026EED 22SDOMC 03367 POD1 11 80 601 14035856413 4688
1 56934326EED 22SDOMC 02852 11 80 573 1373586325*2 4702
43Page 19 of6/12/09 4:19 PM WATER COLUMN/ AVERAGEDEPTH TO WATER
*UTM location was derived from PLSS - see Help

(In feet)
(quarters are 1=NW 2=NE 3=SW 4=SE)
(NAD83 UTM in meters)(quarters are smallest to largest)
64
Sub
basin XCountyWater
Column
Q
YDepthWaterPOD Number 416
Q
RngUse TwsSecDepth
Well
Q
Distance
57691927EED 22SDOMC 00479 03 2003587082*3 4703
1 57117826EED 22SDOMC 00339 012 1903588107*2 4711
1 56933126EED 22SSTKC 03370 POD1 11 92 582 15035863343 4718
2 56894626EED 22SSANC 01899 11 77 153 923585507*3 4721
2 56894626EED 22SDOMC 02105 11 75 503 1253585507*3 4721
2 56894626EED 22SDOMC 02454 11 69 303 993585507*3 4721
2 56894626EED 22SDOMC 02585 11 90 603 1503585507*3 4721
2 56894626EED 22SDOMC 02586 11 90 603 1503585507*3 4721
57254027EED 22SDOMC 02229 31 2003579307* 4727
1 57342327EED 22SDOMC 03179 321 2003579219*3 4736
2 57321927EED 22SDOMC 03279 POD1 312 2503579216*4 4742
4 56914226EED 22SDOMC 00848 23 72 704 1423581864*3 4748
2 57301927EED 22SDOMC 03078 31 60 701 1303579216*4 4754
4 57644427EED 22SIRRC 00015 284 2003580276*4 4771
4 57644427EED 22SDOMC 02149 28 62 574 1193580276*4 4771
56885126EED 22SDOMC 02204 11 85 601453585397*3 4776
3 56874926EED 22SDOMC 00558 23 74 662 1403582872*1 4780
2 56894626EED 22SDOMC 00047 C 11 60 301 903585707*3 4790
2 56894626EED 22SMDWC 00047 C 11 60 301 903585707*3 4790
2 56894626EED 22SDOMC 00495 11 80 441 1243585707*3 4790
2 56894626EED 22SDOMC 02886 11 70 651 1353585707*3 4790
2 56894626EED 22SDOMC 02957 11 70 601 1303585707*3 4790
3 57503527EED 22SDOMC 03012 333 2503579449*1 4791
3 56874926EED 22SMULC 00728 11 72 784 1503585095*3 4793
1 57423027EED 22SDOMC 02841 321 1503579231*4 4795
1 57097826EED 22SDOMC 00252 011 753588107*2 4809
2 57295627EED 21SDOMC 01021 31 12 2433 2553588750*4 4815
3 57026326EED 22SDOMC 00142 01 523587621*1 4828
2 56975226EED 22SDOMC 00088 023 953587126*4 4837
2 56914626EED 22SDOMC 01811 262 2503581656*1 4839
57447627EED 21SDOMC 02193 32 15 40553588675*4 4839
3 56945626EED 22SDOMC 01506 26 3303581151*2 4843
43Page 20 of6/12/09 4:19 PM WATER COLUMN/ AVERAGEDEPTH TO WATER
*UTM location was derived from PLSS - see Help
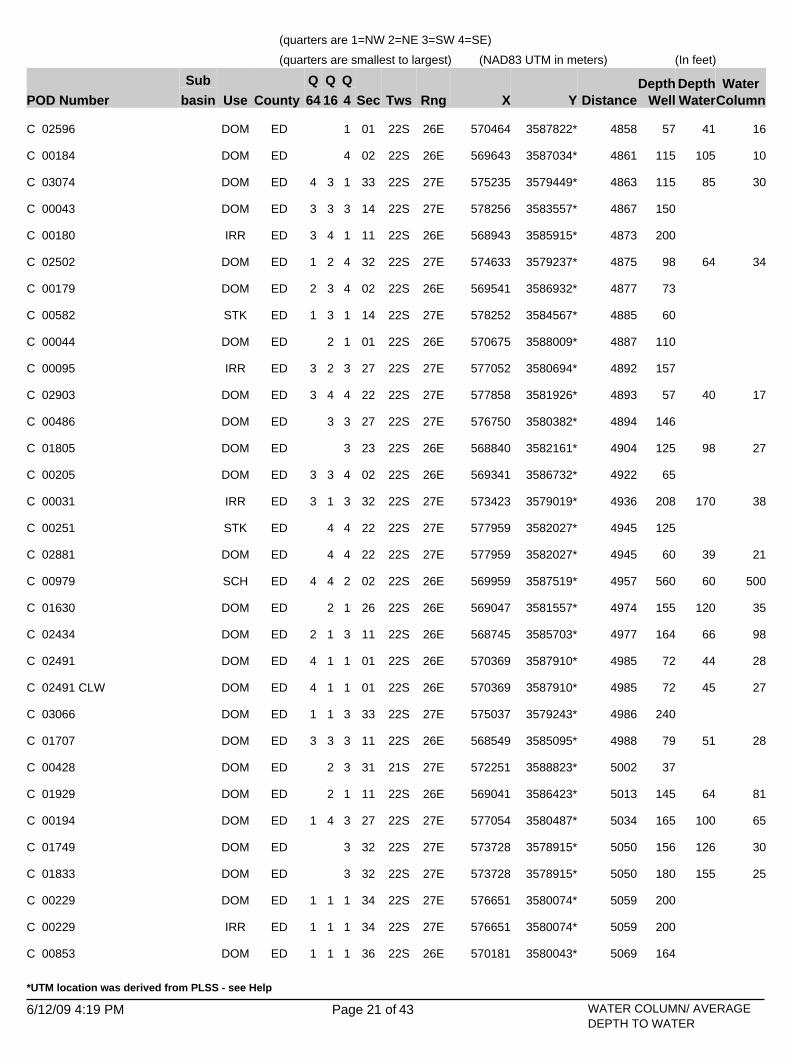
(In feet)
(quarters are 1=NW 2=NE 3=SW 4=SE)
(NAD83 UTM in meters)(quarters are smallest to largest)
64
Sub
basin XCountyWater
Column
Q
YDepthWaterPOD Number 416
Q
RngUse TwsSecDepth
Well
Q
Distance
57046426EED 22SDOMC 02596 01 41 16573587822*1 4858
56964326EED 22SDOMC 00184 02 105 101153587034*4 4861
3 57523527EED 22SDOMC 03074 33 85 304 1153579449*1 4863
3 57825627EED 22SDOMC 00043 143 1503583557*3 4867
4 56894326EED 22SIRRC 00180 113 2003585915*1 4873
2 57463327EED 22SDOMC 02502 32 64 341 983579237*4 4875
3 56954126EED 22SDOMC 00179 022 733586932*4 4877
3 57825227EED 22SSTKC 00582 141 603584567*1 4885
2 57067526EED 22SDOMC 00044 01 1103588009*1 4887
2 57705227EED 22SIRRC 00095 273 1573580694*3 4892
4 57785827EED 22SDOMC 02903 22 40 173 573581926*4 4893
3 57675027EED 22SDOMC 00486 27 1463580382*3 4894
56884026EED 22SDOMC 01805 23 98 271253582161*3 4904
3 56934126EED 22SDOMC 00205 023 653586732*4 4922
1 57342327EED 22SIRRC 00031 32 170 383 2083579019*3 4936
4 57795927EED 22SSTKC 00251 22 1253582027*4 4945
4 57795927EED 22SDOMC 02881 22 39 21603582027*4 4945
4 56995926EED 22SSCHC 00979 02 60 5004 5603587519*2 4957
2 56904726EED 22SDOMC 01630 26 120 351553581557*1 4974
1 56874526EED 22SDOMC 02434 11 66 982 1643585703*3 4977
1 57036926EED 22SDOMC 02491 01 44 284 723587910*1 4985
1 57036926EED 22SDOMC 02491 CLW 01 45 274 723587910*1 4985
1 57503727EED 22SDOMC 03066 331 2403579243*3 4986
3 56854926EED 22SDOMC 01707 11 51 283 793585095*3 4988
2 57225127EED 21SDOMC 00428 31 373588823*3 5002
2 56904126EED 22SDOMC 01929 11 64 811453586423*1 5013
4 57705427EED 22SDOMC 00194 27 100 651 1653580487*3 5034
57372827EED 22SDOMC 01749 32 126 301563578915*3 5050
57372827EED 22SDOMC 01833 32 155 251803578915*3 5050
1 57665127EED 22SDOMC 00229 341 2003580074*1 5059
1 57665127EED 22SIRRC 00229 341 2003580074*1 5059
1 57018126EED 22SDOMC 00853 361 1643580043*1 5069
43Page 21 of6/12/09 4:19 PM WATER COLUMN/ AVERAGEDEPTH TO WATER
*UTM location was derived from PLSS - see Help

(In feet)
(quarters are 1=NW 2=NE 3=SW 4=SE)
(NAD83 UTM in meters)(quarters are smallest to largest)
64
Sub
basin XCountyWater
Column
Q
YDepthWaterPOD Number 416
Q
RngUse TwsSecDepth
Well
Q
Distance
1 57018126EED 22SMUNC 00853 361 1643580043*1 5069
1 57018126EED 22SDOMC 00854 361 1663580043*1 5069
1 57018126EED 22SMUNC 00854 361 1663580043*1 5069
2 57235027EED 21SDOMC 00681 31 18 262 443588922*3 5077
3 57836127EED 22SDOMC 01776 23 40 1171573582846*1 5078
4 56913726EED 22SDOMC 00018 024 1023586730*3 5090
4 56913726EED 22SIRRC 00086 02 68 324 1003586730*3 5090
3 57584427EED 22SIRRC 00191 333 2003579458*2 5115
1 57826227EED 22SDOMC 01713 23 46 553 1013582339*3 5118
57248727EED 21SDOMC 00592 31 15 851003589012* 5139
57248727EED 21SDOMC 00593 31 2503589012* 5139
57248727EED 21SDOMC 00594 31 2503589012* 5139
57248727EED 21SDOMC 00782 31 18 24423589012* 5139
2 56894026EED 22SDOMC 00411 111 1343586522*1 5150
57406727EED 21SDOMC 00197 32 3003589068* 5155
57406727EED 21SDOMC 00751 32 15 3103253589068* 5155
57406727EED 21SDOMC 00772 32 3503589068* 5155
2 57806027EED 22SDOMC 00532 272 903581720*2 5163
57574227EED 22SDOMC 02122 33 80 1402203579340* 5172
57574227EED 22SDOMC 02230 33 90 1702603579340* 5172
57574227EED 22SDOMC 02233 33 1253579340* 5172
57574227EED 22SDOMC 02449 33 70 2303003579340* 5172
3 57826427EED 22SIRRC 01242 23 40 1151 1553582133*3 5189
1 56874226EED 22SDOMC 01053 26 71 1022 1733581654*1 5199
4 56913726EED 22SDOMC 00011 022 1223586930*3 5202
2 56997926EED 22SMUNC 00852 352 2003580038*2 5203
3 57604427EED 22SIRRC 00215 33 150 304 1803579458*2 5214
4 56903826EED 22SMULC 00362 02 1003586831*3 5228
4 56975926EED 22SDOMC 01131 021 1003587719*2 5240
3 57352727EED 22SDOMC 02124 32 60 1351953578714*3 5242
1 57523727EED 22SDOMC 03013 33 63 554 1183579043*3 5242
4 56893726EED 22SDOMC 00116 023 1003586730*3 5259
43Page 22 of6/12/09 4:19 PM WATER COLUMN/ AVERAGEDEPTH TO WATER
*UTM location was derived from PLSS - see Help

(In feet)
(quarters are 1=NW 2=NE 3=SW 4=SE)
(NAD83 UTM in meters)(quarters are smallest to largest)
64
Sub
basin XCountyWater
Column
Q
YDepthWaterPOD Number 416
Q
RngUse TwsSecDepth
Well
Q
Distance
4 57463527EED 22SDOMC 03070 321 2503578830*4 5270
4 57635027EED 22SDOMC 02392 33 48 1021503579564*2 5287
4 57060326EED 22SDOMC 01018 36 115 103 1253579422*1 5329
1 56864326EED 22SDOMC 01535 26 1503581555*1 5332
1 56864326EED 22SDOMC 01863 26 103 341373581555*1 5332
1 57826627EED 22SIRRC 00077 26 40 781 1183581726*1 5347
2 56834326EED 22SDOMC 03296 POD1 10 90 372 1273585692*4 5351
4 57866627EED 22SCOMC 00231 A 23 45 1331 1783582951*1 5355
4 57866627EED 22SCOMC 03063 23 40 1231 1633582951*1 5355
4 57866627EED 22SEXPC 03063 23 40 1231 1633582951*1 5355
3 57503827EED 22SDOMC 02696 33 71 531 1243578836*3 5373
2 56986826EED 22SDOMC 01204 02 65 651303588009*2 5380
56965926EED 22SDOMC 00189 02 1153587819*2 5381
3 57356127EED 21SDOMC 00561 32 11 3292 3403589368*1 5415
56923726EED 22SDOMC 00045 02 1253587432* 5427
56923726EED 22SDOMC 00820 02 43 17603587432* 5427
3 56873326EED 22SDOMC 00404 02 80 444 1243586728*3 5432
1 57594727EED 22SDOMC 02533 33 2003579153*4 5433
4 57463527EED 22SDOMC 02970 32 71 673 1383578630*4 5465
4 57157826EED 21SDOMC 00483 36 40 604 1003589117*2 5475
2 57786327EED 22SDAIC 03062 27 100 503 1503580706*4 5516
2 57786327EED 22SPROC 03062 27 100 503 1503580706*4 5516
3 56864726EED 22SDOMC 01243 26 15 1852003581149*1 5523
4 56997426EED 21SDOMC 01014 35 49 614 1103588301*4 5537
2 57796427EED 22SSTKC 00467 27 74 1262003580807*4 5540
3 57177827EED 21SDOMC 00591 311 2003589313*1 5599
3 57177827EED 21SDOMC 00598 311 1003589313*1 5599
3 57177827EED 21SDOMC 00707 31 6 191 253589313*1 5599
3 57177827EED 21SDOMC 00710 31 5 271 323589313*1 5599
1 57746227EED 22SDOMC 00653 34 80 401 1203580087*2 5605
3 56853326EED 22SDOMC 00776 023 1013586728*3 5605
1 57275127EED 21SDOMC 00487 314 2153589531*2 5614
43Page 23 of6/12/09 4:19 PM WATER COLUMN/ AVERAGEDEPTH TO WATER
*UTM location was derived from PLSS - see Help

(In feet)
(quarters are 1=NW 2=NE 3=SW 4=SE)
(NAD83 UTM in meters)(quarters are smallest to largest)
64
Sub
basin XCountyWater
Column
Q
YDepthWaterPOD Number 416
Q
RngUse TwsSecDepth
Well
Q
Distance
3 57523827EED 22SDOMC 02412 33 64 1874 2513578636*3 5625
3 57523827EED 22SDOMC 02433 33 64 324 963578636*3 5625
57088026EED 21SDOMC 00051 36 1843589008* 5648
57088026EED 21SDOMC 00203 36 3503589008* 5648
57088026EED 21SDOMC 00250 36 1203589008* 5648
57088026EED 21SDOMC 00543 36 1503589008* 5648
4 56905926EED 22SDOMC 01655 26 4003580343*3 5651
56803726EED 22SDOMC 01133 22 76 1482243582149*4 5663
2 57625127EED 22SIRRC 00644 333 1903579056*4 5665
4 56987526EED 21SDOMC 02641 35 1303588402*4 5677
2 57806327EED 22SSTKC 00562 274 1503580706*4 5679
4 56904826EED 22SDOMC 01641 02 1783587617*1 5691
4 57877127EED 22SSTKC 01273 23 50 1001503582040*3 5697
2 57214927EED 21SDOMC 02215 313 303589521*1 5705
2 57305627EED 21SDOMC 00089 31 2753589651*2 5706
1 57665727EED 22SDOMC 03212 341 2503579261*3 5710
1 57346127EED 21SIRRC 00064 A 32 15 80953589670*1 5715
1 57346127EED 21SDOMC 01252 32 17 2432603589670*1 5715
1 57197527EED 21SDOMC 02447 31 23 184 413589511*1 5737
4 57564327EED 22SDOMC 03274 POD1 33 81 494 1303578641*3 5766
4 56833426EED 22SDOMC 01314 03 65 304 953586714*4 5772
4 56833426EED 22SDOMC 03014 034 1003586714*4 5772
3 56959026EED 22SDOMC 01601 35 57 372 943579619*2 5775
1 57282427EED 23SIRRC 00028 064 2003578207*2 5777
4 57796627EED 22SDOMC 02488 27 38 38763580401*4 5782
1 57423627EED 23SDOMC 01976 053 2503578224*2 5790
1 57423627EED 23SDOMC 03093 053 2503578224*2 5790
3 56793926EED 22SDOMC 03305 POD1 10 95 754 1703585887*2 5797
2 57315527EED 21SDOMC 01126 31 30 2302 2603589750*2 5800
2 57315527EED 21SDOMC 01128 31 19 2842 3033589750*2 5800
2 57315527EED 21SDOMC 02900 312 953589750*2 5800
1 57262427EED 23SIRRC 00028 S 06 190 413 2313578207*2 5800
43Page 24 of6/12/09 4:19 PM WATER COLUMN/ AVERAGEDEPTH TO WATER
*UTM location was derived from PLSS - see Help

(In feet)
(quarters are 1=NW 2=NE 3=SW 4=SE)
(NAD83 UTM in meters)(quarters are smallest to largest)
64
Sub
basin XCountyWater
Column
Q
YDepthWaterPOD Number 416
Q
RngUse TwsSecDepth
Well
Q
Distance
2 56915426EED 22SSTKC 02875 02 154 3064 4603587902*1 5800
2 57295527EED 21SCOMC 01134 311 2753589750*2 5812
2 57295527EED 21SIRRC 01134 311 2753589750*2 5812
1 57275127EED 21SCOMC 01045 312 3073589731*2 5812
1 57336027EED 21SDOMC 01581 321 403589769*1 5814
1 57336027EED 21SPROC 02788 32 15 151 303589769*1 5814
1 57356027EED 21SIRRC 00106 322 1053589769*1 5816
1 57826927EED 22SIRRC 00078 263 1803580712*3 5845
571559DOMC 00217 POD2 19 26453589506 5850
2 56754926EED 22SSTKC 00811 152 4433584055*3 5856
2 57157726EED 21SDOMC 00217 364 1403589520*2 5857
1 57187627EED 21SDOMC 01073 31 40 1301703589612*1 5859
1 57187627EED 21SDOMC 01838 31 30 10403589612*1 5859
2 57234927EED 21SDOMC 02209 31 22 1802 2023589721*1 5861
57128126EED 21SDOMC 02595 36 26 29553589424*2 5866
57293227EED 23SDOMC 00624 06 3003578106*2 5868
1 57416827EED 21SDOMC 00337 321 3183589780*2 5874
1 57665727EED 22SIRRC 00287 343 3579061*3 5875
3 57746527EED 22SIRRC 00030 S 34 69 1311 2003579680*2 5895
2 57214927EED 21SDOMC 02640 31 15 271 423589721*1 5901
1 57436827EED 21SDOMC 00660 32 14 3112 3253589780*2 5904
1 57436827EED 21SDOMC 00732 322 503589780*2 5904
3 56947326EED 21SDOMC 00787 35 24 60843588399*4 5933
2 57706227EED 22SIRRC 00030 34 50 1551 2053579267*3 5945
2 57457327EED 21SDOMC 02385 321 1003589785*2 5945
2 57457327EED 21SDOMC 02998 321 483589785*2 5945
56804226EED 22SDOMC 01465 27 96 201163581339*2 5967
56804226EED 22SDOMC 02168 27 140 662063581339*2 5967
4 57077826EED 21SDOMC 02642 362 753589327*1 5979
1 57177527EED 21SIRRC 00026 311 1903589711*1 5982
2 57477327EED 21SDOMC 00566 32 18 3052 3233589785*2 5988
2 57477327EED 21SCOMC 00632 32 30 2402 2703589785*2 5988
43Page 25 of6/12/09 4:19 PM WATER COLUMN/ AVERAGEDEPTH TO WATER
*UTM location was derived from PLSS - see Help
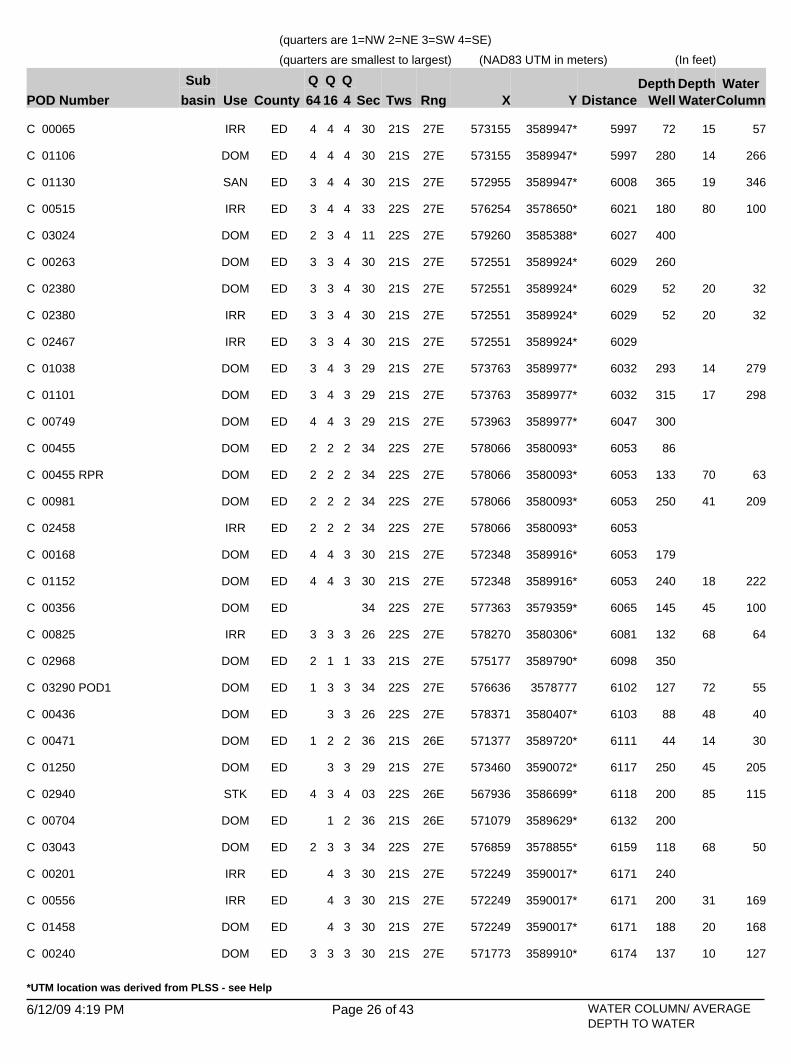
(In feet)
(quarters are 1=NW 2=NE 3=SW 4=SE)
(NAD83 UTM in meters)(quarters are smallest to largest)
64
Sub
basin XCountyWater
Column
Q
YDepthWaterPOD Number 416
Q
RngUse TwsSecDepth
Well
Q
Distance
4 57315527EED 21SIRRC 00065 30 15 574 723589947*4 5997
4 57315527EED 21SDOMC 01106 30 14 2664 2803589947*4 5997
4 57295527EED 21SSANC 01130 30 19 3463 3653589947*4 6008
4 57625427EED 22SIRRC 00515 33 80 1003 1803578650*4 6021
3 57926027EED 22SDOMC 03024 112 4003585388*4 6027
3 57255127EED 21SDOMC 00263 303 2603589924*4 6029
3 57255127EED 21SDOMC 02380 30 20 323 523589924*4 6029
3 57255127EED 21SIRRC 02380 30 20 323 523589924*4 6029
3 57255127EED 21SIRRC 02467 303 3589924*4 6029
4 57376327EED 21SDOMC 01038 29 14 2793 2933589977*3 6032
4 57376327EED 21SDOMC 01101 29 17 2983 3153589977*3 6032
4 57396327EED 21SDOMC 00749 294 3003589977*3 6047
2 57806627EED 22SDOMC 00455 342 863580093*2 6053
2 57806627EED 22SDOMC 00455 RPR 34 70 632 1333580093*2 6053
2 57806627EED 22SDOMC 00981 34 41 2092 2503580093*2 6053
2 57806627EED 22SIRRC 02458 342 3580093*2 6053
4 57234827EED 21SDOMC 00168 304 1793589916*3 6053
4 57234827EED 21SDOMC 01152 30 18 2224 2403589916*3 6053
57736327EED 22SDOMC 00356 34 45 1001453579359* 6065
3 57827027EED 22SIRRC 00825 26 68 643 1323580306*3 6081
1 57517727EED 21SDOMC 02968 332 3503589790*1 6098
3 57663627EED 22SDOMC 03290 POD1 34 72 551 12735787773 6102
3 57837127EED 22SDOMC 00436 26 48 40883580407*3 6103
2 57137726EED 21SDOMC 00471 36 14 301 443589720*2 6111
3 57346027EED 21SDOMC 01250 29 45 2052503590072*3 6117
3 56793626EED 22SSTKC 02940 03 85 1154 2003586699*4 6118
1 57107926EED 21SDOMC 00704 36 2003589629*2 6132
3 57685927EED 22SDOMC 03043 34 68 502 1183578855*3 6159
4 57224927EED 21SIRRC 00201 30 2403590017*3 6171
4 57224927EED 21SIRRC 00556 30 31 1692003590017*3 6171
4 57224927EED 21SDOMC 01458 30 20 1681883590017*3 6171
3 57177327EED 21SDOMC 00240 30 10 1273 1373589910*3 6174
43Page 26 of6/12/09 4:19 PM WATER COLUMN/ AVERAGEDEPTH TO WATER
*UTM location was derived from PLSS - see Help
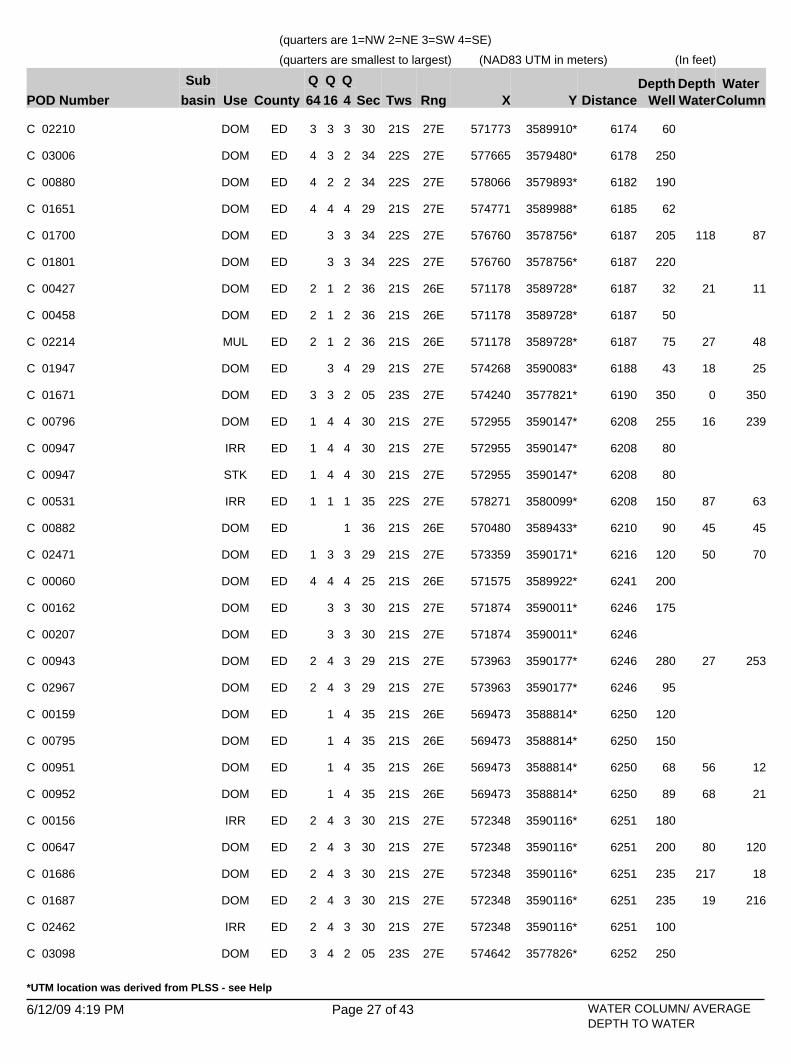
(In feet)
(quarters are 1=NW 2=NE 3=SW 4=SE)
(NAD83 UTM in meters)(quarters are smallest to largest)
64
Sub
basin XCountyWater
Column
Q
YDepthWaterPOD Number 416
Q
RngUse TwsSecDepth
Well
Q
Distance
3 57177327EED 21SDOMC 02210 303 603589910*3 6174
3 57766527EED 22SDOMC 03006 344 2503579480*2 6178
2 57806627EED 22SDOMC 00880 344 1903579893*2 6182
4 57477127EED 21SDOMC 01651 294 623589988*4 6185
3 57676027EED 22SDOMC 01700 34 118 872053578756*3 6187
3 57676027EED 22SDOMC 01801 34 2203578756*3 6187
1 57117826EED 21SDOMC 00427 36 21 112 323589728*2 6187
1 57117826EED 21SDOMC 00458 362 503589728*2 6187
1 57117826EED 21SMULC 02214 36 27 482 753589728*2 6187
3 57426827EED 21SDOMC 01947 29 18 25433590083*4 6188
3 57424027EED 23SDOMC 01671 05 0 3503 3503577821*2 6190
4 57295527EED 21SDOMC 00796 30 16 2391 2553590147*4 6208
4 57295527EED 21SIRRC 00947 301 803590147*4 6208
4 57295527EED 21SSTKC 00947 301 803590147*4 6208
1 57827127EED 22SIRRC 00531 35 87 631 1503580099*1 6208
57048026EED 21SDOMC 00882 36 45 45903589433*1 6210
3 57335927EED 21SDOMC 02471 29 50 701 1203590171*3 6216
4 57157526EED 21SDOMC 00060 254 2003589922*4 6241
3 57187427EED 21SDOMC 00162 30 1753590011*3 6246
3 57187427EED 21SDOMC 00207 30 3590011*3 6246
4 57396327EED 21SDOMC 00943 29 27 2532 2803590177*3 6246
4 57396327EED 21SDOMC 02967 292 953590177*3 6246
1 56947326EED 21SDOMC 00159 35 1203588814*4 6250
1 56947326EED 21SDOMC 00795 35 1503588814*4 6250
1 56947326EED 21SDOMC 00951 35 56 12683588814*4 6250
1 56947326EED 21SDOMC 00952 35 68 21893588814*4 6250
4 57234827EED 21SIRRC 00156 302 1803590116*3 6251
4 57234827EED 21SDOMC 00647 30 80 1202 2003590116*3 6251
4 57234827EED 21SDOMC 01686 30 217 182 2353590116*3 6251
4 57234827EED 21SDOMC 01687 30 19 2162 2353590116*3 6251
4 57234827EED 21SIRRC 02462 302 1003590116*3 6251
4 57464227EED 23SDOMC 03098 053 2503577826*2 6252
43Page 27 of6/12/09 4:19 PM WATER COLUMN/ AVERAGEDEPTH TO WATER
*UTM location was derived from PLSS - see Help

(In feet)
(quarters are 1=NW 2=NE 3=SW 4=SE)
(NAD83 UTM in meters)(quarters are smallest to largest)
64
Sub
basin XCountyWater
Column
Q
YDepthWaterPOD Number 416
Q
RngUse TwsSecDepth
Well
Q
Distance
56723526EED 22SDOMC 01513 22 90 661563582937*1 6253
4 57467227EED 21SDOMC 01650 29 453590089*4 6263
1 56957226EED 21SIRRC 02889 352 763588913*4 6266
3 57416727EED 21SIRRC 00222 291 2973590182*4 6273
3 57416727EED 21SIRRC 00767 29 26 1241 1503590182*4 6273
4 57484227EED 23SDOMC 01670 054 3853577826*2 6295
57285327EED 21SIRRC 00129 30 3003590226*4 6295
57285327EED 21SDOMC 01188 30 16 2612773590226*4 6295
3 56773626EED 22SDOMC 00691 033 1503586699*4 6298
3 56773626EED 22SDOMC 01913 033 2803586699*4 6298
3 57436727EED 21SDOMC 00673 29 30 2792 3093590182*4 6300
4 57137526EED 21SDOMC 00275 25 15 1963 2113589922*4 6302
4 57786827EED 22SDOMC 03201 343 2503579486*2 6315
3 57197327EED 21SDOMC 01373 30 26 1142 1403590110*3 6319
4 56977526EED 21SDOMC 00939 35 50 603 1103589129*2 6320
56804726EED 22SSTKC 01445 27 367 223893580529*4 6359
3 57507627EED 21SDOMC 00188 28 2803590094*3 6362
3 57177327EED 21SDOMC 00378 30 15 3351 3503590110*3 6367
2 56916426EED 21SDOMC 00955 35 68 324 1003588708*3 6370
3 57117726EED 21SDOMC 00345 254 503589934*4 6380
3 57117726EED 21SDOMC 01034 254 703589934*4 6380
4 57477127EED 21SCOMC 00652 292 4583590188*4 6380
4 57477127EED 21SIRRC 00652 292 4583590188*4 6380
4 57477127EED 21SDOMC 02645 29 45 1502 1953590188*4 6380
4 57477127EED 21SDOMC 02831 292 1203590188*4 6380
4 57477127EED 21SDOMC 02837 29 155 242 1793590188*4 6380
1 56937226EED 21SDOMC 00266 351 1003588913*4 6391
1 56937226EED 21SDOMC 00784 351 1183588913*4 6391
1 57666127EED 23SDOMC 01973 03 90 371 1273578453*1 6393
57207527EED 21SDOMC 00218 30 1703590212*3 6396
1 56793926EED 22SDOMC 00840 03 90 1482 2383587301*4 6408
1 56793926EED 22SDOMC 01912 032 1503587301*4 6408
43Page 28 of6/12/09 4:19 PM WATER COLUMN/ AVERAGEDEPTH TO WATER
*UTM location was derived from PLSS - see Help

(In feet)
(quarters are 1=NW 2=NE 3=SW 4=SE)
(NAD83 UTM in meters)(quarters are smallest to largest)
64
Sub
basin XCountyWater
Column
Q
YDepthWaterPOD Number 416
Q
RngUse TwsSecDepth
Well
Q
Distance
2 57295227EED 21SDOMC 00661 30 10 1903 2003590354*4 6415
2 57295227EED 21SDOMC 02526 30 14 273 413590354*4 6415
1 57335527EED 21SDOMC 01068 29 20 3303 3503590373*3 6418
1 57335527EED 21SDOMC 01068 REPAR 293 3590373*3 6418
1 57335527EED 21SDOMC 02530 29 17 133 303590373*3 6418
1 57355527EED 21SIRRC 00634 29 17 1054 1223590373*3 6419
1 57355527EED 21SDOMC 03335 POD1 29 31 1944 2253590373*3 6419
3 57497527EED 21SDOMC 01875 28 40 1301 1703590193*3 6432
2 57375927EED 21SDOMC 03171 POD1 29 31 693 1003590379*3 6433
4 57706427EED 22SIRRC 01172 343 2203578661*3 6435
2 57234627EED 21SDOMC 02917 304 1003590325*3 6457
4 57806827EED 22SSANC 02342 344 1103579486*2 6458
4 57806827EED 22SDOMC 03073 34 122 284 1503579486*2 6458
2 57787027EED 22SIRRC 00171 34 21 1771 1983579279*4 6465
4 56753726EED 22SIRRC 00493 034 1653586684*3 6471
1 56773926EED 22SDOMC 00659 03 78 593 1373587101*4 6480
1 56773926EED 22SDOMC 00790 03 70 703 1403587101*4 6480
1 56773926EED 22SDOMC 00964 03 78 623 1403587101*4 6480
4 56977526EED 21SSANC 00670 35 65 351 1003589329*2 6485
4 56977526EED 21SDOMC 00705 35 62 161 783589329*2 6485
4 56977526EED 21SDOMC 01440 35 51 171 683589329*2 6485
2 57484627EED 23SDOMC 03190 052 2003577624*4 6492
1 57434527EED 23SDOMC 00296 05 2253577519*4 6504
1 57345627EED 21SDOMC 01155 29 22 2682903590474*3 6519
1 57987427EED 22SDOMC 01722 13 64 1163 1803584794*1 6523
56925426EED 21SDOMC 00603 35 57 15723588988* 6523
56925426EED 21SDOMC 00604 35 69 21903588988* 6523
56925426EED 21SDOMC 00646 35 60 20803588988* 6523
56925426EED 21SDOMC 00769 35 51 14653588988* 6523
56925426EED 21SDOMC 00801 35 90 401303588988* 6523
56925426EED 21SDOMC 02051 35 65 21863588988* 6523
56925426EED 21SIRRC 02051 35 65 21863588988* 6523
43Page 29 of6/12/09 4:19 PM WATER COLUMN/ AVERAGEDEPTH TO WATER
*UTM location was derived from PLSS - see Help

(In feet)
(quarters are 1=NW 2=NE 3=SW 4=SE)
(NAD83 UTM in meters)(quarters are smallest to largest)
64
Sub
basin XCountyWater
Column
Q
YDepthWaterPOD Number 416
Q
RngUse TwsSecDepth
Well
Q
Distance
56925426EED 21SDOMC 02224 35 1503588988* 6523
1 57265027EED 21SDOMC 01210 30 26 34603590436*4 6524
1 57676227EED 23SDOMC 01971 03 145 191643578354*1 6529
1 57676227EED 23SDOMC 01989 03 88 801683578354*1 6529
1 57676227EED 23SDOMC 02146 03 125 01253578354*1 6529
1 57676227EED 23SDOMC 02148 03 70 551253578354*1 6529
1 57676227EED 23SDOMC 02150 03 70 551253578354*1 6529
1 57676227EED 23SDOMC 02154 03 70 551253578354*1 6529
1 57676227EED 23SDOMC 02166 03 75 651403578354*1 6529
1 57676227EED 23SDOMC 02324 03 75 501253578354*1 6529
2 57948227EED 22SIRRC 00282 26 50 753 1253581546*2 6537
2 57948227EED 22SSTKC 00282 26 50 753 1253581546*2 6537
2 57386027ELE 21SDOMC 01321 29 60 2102703590480*3 6540
2 57386027EED 21SDOMC 01755 29 17 3033203590480*3 6540
2 57386027EED 21SDOMC 02045 29 29 51803590480*3 6540
4 57077926EED 21SDOMC 00858 A 254 1403589946*3 6541
4 57077926EED 21SIRRC 00858 A 254 1403589946*3 6541
4 57077926EED 21SIRRC 00858 C 25 24 824 1063589946*3 6541
4 57077926EED 21SIRRC 02211 25 254 3589946*3 6541
3 56937226EED 21SDOMC 00884 353 803589127*2 6558
3 56937226EED 21SDOMC 00884 RPR 35 70 353 1053589127*2 6558
3 56937226EED 21SDOMC 01567 35 106 03 1063589127*2 6558
1 57177027EED 21SDOMC 00638 30 27 233 503590315*3 6566
1 57177027EED 21SDOMC 00844 303 2303590315*3 6566
1 57177027EED 21SDOMC 01016 30 25 1903 2153590315*3 6566
4 57887527EED 22SIRRC 00410 26 50 1004 1503580313*3 6571
2 57224727EED 21SDOMC 00797 30 3503590426*3 6573
2 57224727EED 21SDOMC 01026 30 17 1731903590426*3 6573
1 57997927EED 22SDOMC 01677 13 20 36563584084*3 6575
1 57997927EED 22SPROC 01677 13 20 36563584084*3 6575
3 56947326EED 21SDOMC 00794 35 70 351053589228*2 6577
3 56947326EED 21SDOMC 01201 35 65 401053589228*2 6577
43Page 30 of6/12/09 4:19 PM WATER COLUMN/ AVERAGEDEPTH TO WATER
*UTM location was derived from PLSS - see Help

(In feet)
(quarters are 1=NW 2=NE 3=SW 4=SE)
(NAD83 UTM in meters)(quarters are smallest to largest)
64
Sub
basin XCountyWater
Column
Q
YDepthWaterPOD Number 416
Q
RngUse TwsSecDepth
Well
Q
Distance
3 57998127EED 22SDOMC 00971 13 18 42603583679*3 6581
3 57987227EED 22SDOMC 01088 12 36 283 643585199*3 6585
3 57997727EED 22SDOMC 01590 13 40 601003584489*1 6593
2 57958327EED 22SDOMC 02587 26 12 59713581647*2 6595
3 56957226EED 21SDOMC 01482 35 75 202 953589327*2 6599
3 56957226EED 21SDOMC 01496 35 52 182 703589327*2 6599
3 56957226EED 21SDOMC 01622 35 58 372 953589327*2 6599
3 56957226EED 21SDOMC 01629 35 50 252 753589327*2 6599
3 57827227EED 22SSANC 01523 35 60 583 1183579492*1 6603
3 57837327EED 22SIRRC 01312 35 65 1382033579593*1 6611
1 57335527EED 21SDOMC 00606 29 8 2441 2523590573*3 6618
1 57355527EED 21SDOMC 02592 292 1503590573*3 6619
3 57587627EED 21SDOMC 02170 28 16 2372533590100*4 6623
3 56794326EED 22SIRRC 00905 032 3293587702*2 6623
3 56794326EED 22SSUBC 00905 032 3293587702*2 6623
4 57057926EED 21SDOMC 00858 B 25 26 743 1003589946*3 6624
4 57057926EED 21SIRRC 00858 B 25 26 743 1003589946*3 6624
56967426EED 21SDOMC 01081 35 60 1001603589429*2 6624
2 57157226EED 21SIRRC 00842 254 1203590329*4 6632
2 57375927EED 21SDOMC 00552 29 24 2161 2403590579*3 6633
2 57375927EED 21SPROC 00552 29 24 2161 2403590579*3 6633
1 57254927EED 21SDOMC 00718 30 15 1901 2053590535*4 6635
1 57254927EED 21SDOMC 00922 30 12 2531 2653590535*4 6635
1 57187127EED 21SDOMC 02133 30 29 1061353590416*3 6640
2 57395927EED 21SDOMC 00655 292 2003590579*3 6647
2 57395927EED 21SDOMC 00688 29 31 592 903590579*3 6647
3 56784426EED 22SDOMC 02181 03 160 402003587603*2 6650
3 56784426EED 22SDOMC 02465 03 142 531953587603*2 6650
3 56784426EED 22SDOMC 02466 03 131 692003587603*2 6650
2 57234627EED 21SDOMC 01591 30 20 802 1003590525*3 6654
1 57516927EED 21SDOMC 01318 28 40 124 523590397*3 6679
4 56916726EED 21SDOMC 01434 35 75 274 1023589125*1 6685
43Page 31 of6/12/09 4:19 PM WATER COLUMN/ AVERAGEDEPTH TO WATER
*UTM location was derived from PLSS - see Help

(In feet)
(quarters are 1=NW 2=NE 3=SW 4=SE)
(NAD83 UTM in meters)(quarters are smallest to largest)
64
Sub
basin XCountyWater
Column
Q
YDepthWaterPOD Number 416
Q
RngUse TwsSecDepth
Well
Q
Distance
2 57214627EED 21SDOMC 02399 30 18 821 1003590525*3 6689
2 57214627EED 21SDOMC 02907 30 14 381 523590525*3 6689
2 57214627EED 21SDOMC 02936 30 143 71 1503590525*3 6689
56764226EED 22SDOMC 00280 03 140 201603587374* 6700
56764226EED 22SDOMC 00799 03 82 231053587374* 6700
56764226EED 22SDOMC 00822 03 2753587374* 6700
56764226EED 22SDOMC 00831 03 2003587374* 6700
4 57944227EED 22SDOMC 02127 02 30 1303 16035868884 6711
4 57944227EED 22SPROC 02127 02 30 1303 16035868884 6711
1 57197027EED 21SIRRC 00208 30 14 2562 2703590515*3 6715
1 57197027EED 21SMULC 00208 30 14 2562 2703590515*3 6715
1 57197027EED 21SDOMC 02729 30 27 142 413590515*3 6715
3 56937226EED 21SDOMC 00617 35 85 181 1033589327*2 6717
57247727EED 21SIRRC 00046 30 1853590614* 6723
57247727EED 21SDOMC 00112 30 10 1741843590614* 6723
57247727EED 21SDOMC 00460 30 29 34633590614* 6723
57247727EED 21SDOMC 00600 30 15 2883033590614* 6723
57247727EED 21SIRRC 00636 30 25 1091343590614* 6723
57247727EED 21SDOMC 00727 30 2003590614* 6723
57247727EED 21SDOMC 00798 30 17 2833003590614* 6723
57247727EED 21SDOMC 00838 30 3590614* 6723
57247727EED 21SDOMC 00859 30 17 1191363590614* 6723
57247727EED 21SDOMC 00909 30 29 981273590614* 6723
57247727EED 21SDOMC 01040 30 19 2823013590614* 6723
2 56997626EED 21SDOMC 00746 352 803589751*2 6734
57455027EED 23SDOMC 02710 05 72 1282003577318*4 6735
3 57666327EED 23SDOMC 00546 03 1231 3578051*1 6743
1 57507027EED 21SMULC 00925 28 46 2543003590498*3 6751
1 57507027EED 21SDOMC 02554 28 1803590498*3 6751
57406327EED 21SIRRC 00096 29 913590675* 6752
57406327EED 21SDOMC 00741 29 20 2803003590675* 6752
57406327EED 21SDOMC 00779 29 18 2292473590675* 6752
43Page 32 of6/12/09 4:19 PM WATER COLUMN/ AVERAGEDEPTH TO WATER
*UTM location was derived from PLSS - see Help

(In feet)
(quarters are 1=NW 2=NE 3=SW 4=SE)
(NAD83 UTM in meters)(quarters are smallest to largest)
64
Sub
basin XCountyWater
Column
Q
YDepthWaterPOD Number 416
Q
RngUse TwsSecDepth
Well
Q
Distance
57406327EED 21SDOMC 00781 29 29 2733023590675* 6752
57406327EED 21SDOMC 00888 29 12 2582703590675* 6752
57406327EED 21SDOMC 01096 29 17 2893063590675* 6752
57406327EED 21SDOMC 01709 29 15 27423590675* 6752
2 56753226EED 22SDOMC 02082 03 80 702 1503587290*3 6753
1 57177027EED 21SDOMC 00846 30 23 2181 2413590515*3 6760
1 57177027EED 21SSTKC 01509 30 43 301 733590515*3 6760
4 57315027EED 21SIRRC 01175 30 19 814 1003590761*2 6810
58017827EED 22SDOMC 00627 13 1003584690*1 6812
3 57335227EED 21SDOMC 01069 29 20 3353 3553590775*1 6820
3 57335227EED 21SDOMC 01248 29 19 2213 2403590775*1 6820
4 57295027EED 21SDOMC 03065 30 12 353 473590761*2 6821
3 57355227EED 21SDOMC 00725 29 22 2004 2223590775*1 6821
3 57355227EED 21SDOMC 00734 294 2303590775*1 6821
2 57157226EED 21SDOMC 01500 25 15 252 403590529*4 6824
4 57645927EED 23SDOMC 00281 044 1503577846*2 6829
4 57645927EED 23SDOMC 00400 044 1453577846*2 6829
1 57747027EED 23SDOMC 02977 03 125 541 1793578466*2 6830
2 56733226EED 22SDOMC 00694 033 1933587090*3 6834
4 57464927EED 23SDOMC 03273 POD1 051 2003577221*4 6847
4 57234427EED 21SDOMC 00702 30 15 3154 3303590734*1 6861
4 56752726EED 22SDOMC 02559 034 2503587496*1 6862
1 57827227EED 22SSTKC 00680 35 46 1043 1503579085*3 6885
4 57214427EED 21SDOMC 00999 30 22 263 483590734*1 6895
4 57214427EED 21SDOMC 01006 30 17 2483 2653590734*1 6895
4 57807127EED 22SSANC 03061 342 2003578873*4 6899
4 57305127EED 21SDOMC 01157 30 17 2752923590862*2 6916
4 57305127EED 21SDOMC 02217 30 17 2532703590862*2 6916
3 57196827EED 21SIRRC 00522 30 33 674 1003590721*1 6916
3 57345327EED 21SIRRC 01047 29 256 322883590876*1 6921
3 57345327EED 21SDOMC 01662 29 403590876*1 6921
1 56947326EED 21SDOMC 01584 35 20 801003589657*2 6926
43Page 33 of6/12/09 4:19 PM WATER COLUMN/ AVERAGEDEPTH TO WATER
*UTM location was derived from PLSS - see Help

(In feet)
(quarters are 1=NW 2=NE 3=SW 4=SE)
(NAD83 UTM in meters)(quarters are smallest to largest)
64
Sub
basin XCountyWater
Column
Q
YDepthWaterPOD Number 416
Q
RngUse TwsSecDepth
Well
Q
Distance
3 57505127EED 23SIRRC 00109 04 120 481 1683577226*3 6927
3 57505127EED 23SDOMC 03056 04 31 291 603577226*3 6927
4 57385627EED 21SDOMC 01653 29 20 40603590882*1 6941
4 57234127EED 23SDOMC 02151 06 130 661963577095*3 6942
58017427EED 22SDOMC 02529 12 51 621133585501*3 6943
3 56876226EED 21SDOMC 00359 35 135 204 1553589123*1 6947
1 56957226EED 21SDOMC 00886 352 1003589756*2 6952
571767STKC 01409 30 22523590719* 6960
3 57176827EED 21SDOMC 02208 303 1503590721*1 6961
4 57475027EED 23SDOMC 00323 05 2003577122*4 6964
4 57475027EED 23SDOMC 02711 05 75 951703577122*4 6964
4 57475027EED 23SDOMC 03020 05 135 411763577122*4 6964
1 57908127EED 22SSTKC 00778 353 1003579914*2 6967
1 57998927EED 22SDOMC 02499 25 35 651003581653*1 6974
4 57224527EED 21SDOMC 00202 30 2003590835*1 6977
4 57224527EED 21SDOMC 01357 30 16 3944103590835*1 6977
2 57072426EED 23SDOMC 01985 01 185 312163577479*3 7009
4 57315027EED 21SDOMC 00668 30 12 2682 2803590961*2 7010
4 57315027EED 21SIRRC 01165 30 26 1542 1803590961*2 7010
3 57335227EED 21SDOMC 01174 29 27 2531 2803590975*1 7020
3 57335227EED 21SDOMC 01299 29 23 2611 2843590975*1 7020
1 57097426EED 21SDOMC 00676 251 403590542*4 7021
4 57156926EED 21SDOMC 00786 25 41 174 583590735*2 7024
3 57186927EED 21SDOMC 01499 30 26 781043590822*1 7036
2 57867727EED 22SIRRC 00586 351 2543579293*3 7037
3 57254727EED 21SDOMC 00814 30 17 191 363590947*2 7044
3 57254727EED 21SDOMC 00866 30 16 2241 2403590947*2 7044
4 57234427EED 21SIRRC 01550 302 2003590934*1 7059
4 57234427EED 21SDOMC 02839 302 2003590934*1 7059
2 57787227EED 23SDOMC 03115 031 1753578472*2 7072
4 57716827EED 23SDOMC 01203 03 35 651003577958*1 7079
4 58048227EED 22SDOMC 02579 134 1503584394*1 7090
43Page 34 of6/12/09 4:19 PM WATER COLUMN/ AVERAGEDEPTH TO WATER
*UTM location was derived from PLSS - see Help

(In feet)
(quarters are 1=NW 2=NE 3=SW 4=SE)
(NAD83 UTM in meters)(quarters are smallest to largest)
64
Sub
basin XCountyWater
Column
Q
YDepthWaterPOD Number 416
Q
RngUse TwsSecDepth
Well
Q
Distance
4 57214427EED 21SIRRC 00221 301 2823590934*1 7092
4 57214427EED 21SDOMC 00719 30 30 1401 1703590934*1 7092
4 57214427EED 21SIRRC 00719 30 30 1401 1703590934*1 7092
4 57214427EED 21SDOMC 03088 301 2003590934*1 7092
1 57767027EED 23SDOMC 00743 03 60 654 1253578266*2 7110
3 57196827EED 21SDOMC 00595 30 24 1862 2103590921*1 7112
4 57147026EED 21SDOMC 01020 25 2303590836*2 7147
4 57147026EED 21SDOMC 01042 25 2403590836*2 7147
4 57147026EED 21SPROC 01042 25 2403590836*2 7147
4 57147026EED 21SDOMC 01043 25 2403590836*2 7147
4 57147026EED 21SDOMC 01094 25 3590836*2 7147
4 57147026EED 21SDOMC 01095 25 3590836*2 7147
4 57147026EED 21SDOMC 01177 25 32 1121443590836*2 7147
4 57147026EED 21SDOMC 01284 25 1653590836*2 7147
4 57147026EED 21SDOMC 01645 25 30 731033590836*2 7147
4 57147026EED 21SDOMC 02404 25 25 1511763590836*2 7147
4 57147026EED 21SDOMC 02634 25 40 901303590836*2 7147
2 56907126EED 21SIRRC 00915 35 77 20973589650*1 7156
2 57384827EED 23SDOMC 02510 08 350 01 3503576806*1 7162
57857527EED 22SDOMC 01761 35 85 501353578980*3 7174
2 56917026EED 21SDOMC 00970 35 70 202 903589749*1 7176
2 57404827EED 23SDOMC 02508 082 2503576806*1 7177
1 57686527EED 23SIRRC 00071 032 2053577649*3 7192
57207027EED 21SDOMC 02327 30 1003591023*1 7192
3 57908227EED 22SIRRC 00210 353 2113579508*2 7211
2 57797327EED 23SDOMC 02226 03 70 651353578373*2 7212
4 57156926EED 21SDOMC 00930 252 3590935*2 7217
4 57156926EED 21SDOMC 00995 252 3590935*2 7217
4 57156926EED 21SDOMC 01308 252 3590935*2 7217
2 56742326EED 22SDOMC 01208 03 160 151753587996*1 7219
1 57334927EED 21SDOMC 01553 293 843591177*1 7222
1 57334927EED 21SDOMC 01649 29 25 633 883591177*1 7222
43Page 35 of6/12/09 4:19 PM WATER COLUMN/ AVERAGEDEPTH TO WATER
*UTM location was derived from PLSS - see Help

(In feet)
(quarters are 1=NW 2=NE 3=SW 4=SE)
(NAD83 UTM in meters)(quarters are smallest to largest)
64
Sub
basin XCountyWater
Column
Q
YDepthWaterPOD Number 416
Q
RngUse TwsSecDepth
Well
Q
Distance
1 57989027EED 22SIRRC 00393 25 30 1703 2003580742*3 7237
1 57354727EED 23SMULC 00711 08 1003576702*1 7254
4 57082226EED 23SDOMC 02080 01 190 502 2403577175*3 7255
4 57082226EED 23SDOMC 02081 01 190 502 2403577175*3 7255
4 57082226EED 23SDOMC 03118 01 210 502 2603577175*3 7255
4 57136926EED 21SDOMC 01220 25 16 1521 1683590935*2 7270
1 56692526EED 22SDOMC 00697 03 40 1121 1523587280*3 7283
1 57999127EED 22SDOMC 01060 25 1203580843*3 7284
56721326EED 22SDOMC 02176 03 146 211673587792*1 7284
2 57214327EED 21SDOMC 00976 30 25 1303 1553591135*1 7290
2 57214327EED 21SDOMC 01664 30 29 1073 1363591135*1 7290
1 57345027EED 21SDOMC 01644 29 35 31663591278*1 7323
4 57062226EED 23SDOMC 02429 01 140 1601 3003577175*3 7328
1 57264627EED 21SDOMC 02075 30 22 2652873591246*2 7330
1 57264627EED 21SDOMC 02075 RPR 30 22 781003591246*2 7330
1 57264627EED 21SDOMC 02135 30 21 941153591246*2 7330
57737027EED 23SDOMC 00283 03 60 481083577750* 7363
3 56691126EED 22SDOMC 00196 033 3003587490*1 7393
3 56691126EED 22SDOMC 01534 03 20 273 473587490*1 7393
3 56691126EED 22SDOMC 03017 03 70 1603 2303587490*1 7393
2 57314727EED 21SDOMC 03018 302 2503591361*2 7410
4 56650526EED 22SDOMC 02914 04 130 553 1853586668*4 7414
2 57294727EED 21SIRRC 01189 30 26 741 1003591361*2 7420
1 57334927EED 21SDOMC 00654 291 2503591377*1 7422
4 57067426EED 21SIRRC 01422 25 49 4154643590864*1 7429
1 57186627EED 21SDOMC 01868 30 25 70953591227*1 7433
1 57186627EED 21SDOMC 02164 30 35 651003591227*1 7433
1 57186627EED 21SDOMC 02591 30 23 1071303591227*1 7433
1 57186627EED 21SDOMC 02673 30 23 1271503591227*1 7433
4 57082226EED 23SDOMC 01665 014 2783576975*3 7442
1 57847427EED 23SDOMC 02897 02 68 1002 1683578478*1 7462
57375127EED 23SDOMC 01071 08 95 1842793576499*1 7464
43Page 36 of6/12/09 4:19 PM WATER COLUMN/ AVERAGEDEPTH TO WATER
*UTM location was derived from PLSS - see Help
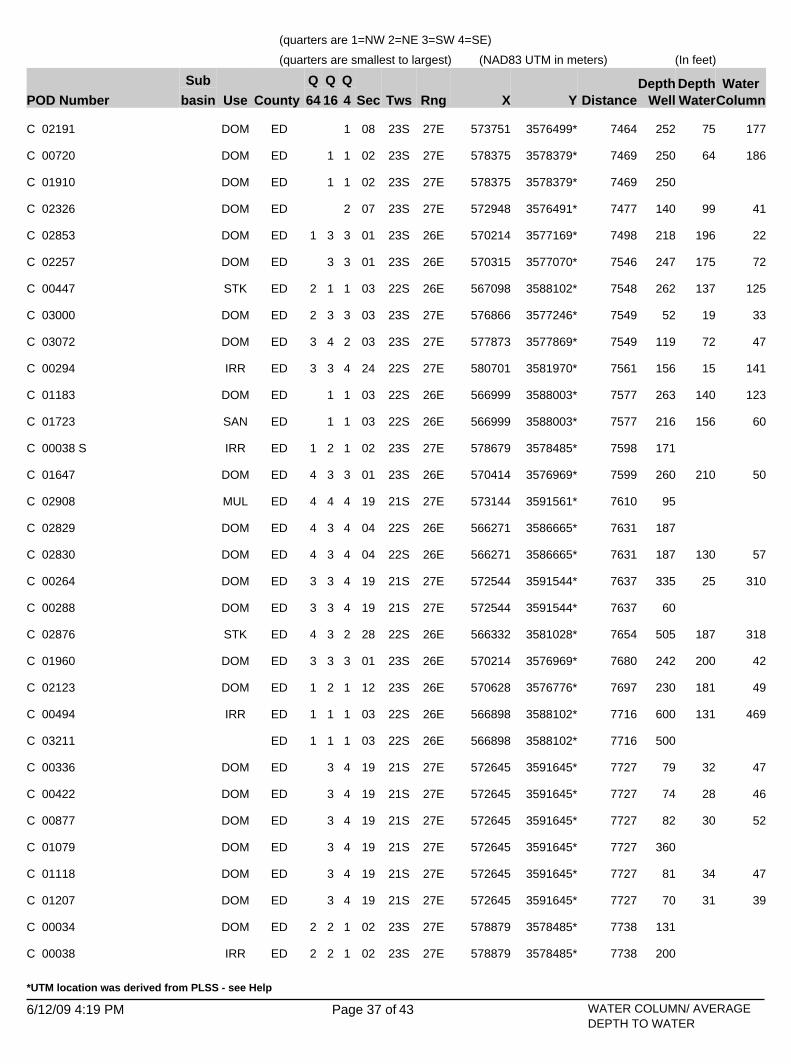
(In feet)
(quarters are 1=NW 2=NE 3=SW 4=SE)
(NAD83 UTM in meters)(quarters are smallest to largest)
64
Sub
basin XCountyWater
Column
Q
YDepthWaterPOD Number 416
Q
RngUse TwsSecDepth
Well
Q
Distance
57375127EED 23SDOMC 02191 08 75 1772523576499*1 7464
1 57837527EED 23SDOMC 00720 02 64 1862503578379*1 7469
1 57837527EED 23SDOMC 01910 02 2503578379*1 7469
57294827EED 23SDOMC 02326 07 99 411403576491*2 7477
3 57021426EED 23SDOMC 02853 01 196 221 2183577169*3 7498
3 57031526EED 23SDOMC 02257 01 175 722473577070*3 7546
1 56709826EED 22SSTKC 00447 03 137 1252 2623588102*1 7548
3 57686627EED 23SDOMC 03000 03 19 332 523577246*3 7549
4 57787327EED 23SDOMC 03072 03 72 473 1193577869*2 7549
3 58070127EED 22SIRRC 00294 24 15 1413 1563581970*4 7561
1 56699926EED 22SDOMC 01183 03 140 1232633588003*1 7577
1 56699926EED 22SSANC 01723 03 156 602163588003*1 7577
2 57867927EED 23SIRRC 00038 S 021 1713578485*1 7598
3 57041426EED 23SDOMC 01647 01 210 504 2603576969*3 7599
4 57314427EED 21SMULC 02908 194 953591561*4 7610
3 56627126EED 22SDOMC 02829 044 1873586665*4 7631
3 56627126EED 22SDOMC 02830 04 130 574 1873586665*4 7631
3 57254427EED 21SDOMC 00264 19 25 3103 3353591544*4 7637
3 57254427EED 21SDOMC 00288 193 603591544*4 7637
3 56633226EED 22SSTKC 02876 28 187 3184 5053581028*2 7654
3 57021426EED 23SDOMC 01960 01 200 423 2423576969*3 7680
2 57062826EED 23SDOMC 02123 12 181 491 2303576776*1 7697
1 56689826EED 22SIRRC 00494 03 131 4691 6003588102*1 7716
1 56689826EED 22SC 03211 031 5003588102*1 7716
3 57264527EED 21SDOMC 00336 19 32 47793591645*4 7727
3 57264527EED 21SDOMC 00422 19 28 46743591645*4 7727
3 57264527EED 21SDOMC 00877 19 30 52823591645*4 7727
3 57264527EED 21SDOMC 01079 19 3603591645*4 7727
3 57264527EED 21SDOMC 01118 19 34 47813591645*4 7727
3 57264527EED 21SDOMC 01207 19 31 39703591645*4 7727
2 57887927EED 23SDOMC 00034 022 1313578485*1 7738
2 57887927EED 23SIRRC 00038 022 2003578485*1 7738
43Page 37 of6/12/09 4:19 PM WATER COLUMN/ AVERAGEDEPTH TO WATER
*UTM location was derived from PLSS - see Help

(In feet)
(quarters are 1=NW 2=NE 3=SW 4=SE)
(NAD83 UTM in meters)(quarters are smallest to largest)
64
Sub
basin XCountyWater
Column
Q
YDepthWaterPOD Number 416
Q
RngUse TwsSecDepth
Well
Q
Distance
3 58090127EED 22SDOMC 02470 24 374 3581970*4 7754
3 58090127EED 22SPROC 02470 24 374 3581970*4 7754
3 58090127EED 22SDOMC 02470 CLW 24 36 314 673581970*4 7754
2 57072926EED 23SDOMC 01903 12 235 152503576677*1 7754
2 57072926EED 23SDOMC 02041 12 184 412253576677*1 7754
2 57072926EED 23SDOMC 02225 12 2653576677*1 7754
3 57344927EED 23SC 03089 083 2503576197*1 7758
58059527EED 22SDOMC 00279 25 48 1121603581040* 7758
2 57948727EED 22SIRRC 00093 353 2003579109*4 7776
3 57827527EED 23SDOMC 03120 023 2403577875*1 7789
3 57827527EED 23SDOMC 03133 023 2003577875*1 7789
3 57827527EED 23SDOMC 03136 023 2003577875*1 7789
3 57274427EED 21SDOMC 00721 19 55 192 743591744*4 7816
3 56607126EED 22SIRRC 00158 043 3573586665*4 7818
3 57254427EED 21SDOMC 00132 191 343591744*4 7836
3 57254427EED 21SDOMC 00237 19 20 851 1053591744*4 7836
3 57254427EED 21SDOMC 00243 191 3591744*4 7836
3 57254427EED 21SDOMC 00448 19 137 1251 2623591744*4 7836
3 57254427EED 21SDOMC 00722 19 28 191 473591744*4 7836
3 57254427EED 21SDOMC 00775 19 20 421 623591744*4 7836
3 57254427EED 21SDOMC 00914 191 3591744*4 7836
3 57989227EED 22SIRRC 00870 36 50 1503 2003579523*1 7856
1 57022026EED 23SDOMC 03009 12 199 331 2323576773*1 7856
2 57062826EED 23SSTKC 01904 123 2503576576*1 7884
3 56607126EED 22SMULC 03215 04 165 501 2153586865*4 7890
3 57196227EED 21SDOMC 01441 19 34 1412 1753591731*3 7908
57284627EED 21SDOMC 01159 19 31 4014323591846*4 7910
3 57847527EED 23SDOMC 02995 02 65 244 893577875*1 7916
1 57827527EED 23SIRRC 00567 02 90 841 1743577672*3 7949
3 56627626EED 22SMULC 02952 04 117 1224 2393587479*2 7952
1 57042026EED 23SDOMC 01812 12 238 244 2623576573*1 7962
1 56607326EED 22SDOMC 02651 04 130 1203 2503587072*4 7967
43Page 38 of6/12/09 4:19 PM WATER COLUMN/ AVERAGEDEPTH TO WATER
*UTM location was derived from PLSS - see Help

(In feet)
(quarters are 1=NW 2=NE 3=SW 4=SE)
(NAD83 UTM in meters)(quarters are smallest to largest)
64
Sub
basin XCountyWater
Column
Q
YDepthWaterPOD Number 416
Q
RngUse TwsSecDepth
Well
Q
Distance
56637826EED 22SDOMC 00186 04 80 1242043587781*2 8001
3 57495027EED 21SDOMC 01449 21 75 331 1083591807*3 8002
4 56668226EED 21SDOMC 02692 33 85 1154 2003588307*4 8008
1 57274127EED 21SIRRC 00227 194 4353591961*4 8033
1 57274127EED 21SDOMC 01520 19 70 04 703591961*4 8033
1 57022026EED 23SDOMC 01674 12 207 83 2153576573*1 8039
1 56607326EED 22SDOMC 03039 041 2503587272*4 8047
1 56607326EED 22SPROC 03039 041 2503587272*4 8047
1 56607326EED 22SEXPC 03209 041 5003587272*4 8047
1 56607326EED 22SEXPC 03210 041 5003587272*4 8047
1 57254127EED 21SDOMC 00164 193 3753591961*4 8052
1 57254127EED 21SDOMC 00242 19 27 523 793591961*4 8052
1 57254127EED 21SDOMC 00554 19 38 223 603591961*4 8052
1 57254127EED 21SDOMC 00714 19 32 183 503591961*4 8052
3 58070527EED 22SIRRC 00770 S 251 2103580551*4 8054
3 58070527EED 22SPROC 00770 S 251 2103580551*4 8054
4 57136426EED 21SIRRC 00166 241 2143591748*4 8055
2 56648826EED 22SDOMC 03054 041 4003588097*2 8062
4 57063326EED 23SDOMC 02071 121 4003576378*1 8068
4 56668226EED 21SDOMC 02906 332 2503588507*4 8119
3 57103926EED 23SDOMC 01678 123 3403576179*2 8127
3 57103926EED 23SDOMC 01920 123 1833576179*2 8127
1 57902927ECH 21SDOMC 00297 35 30 1001 1303589833*2 8135
3 58070527EED 22SIRRC 00770 25 44 1563 2003580351*4 8141
3 57042626EED 23SDOMC 01922 12 220 502 2703576377*1 8142
1 57264227EED 21SDOMC 00871 19 33 62953592062*4 8142
1 57264227EED 21SDOMC 01046 19 32 3283603592062*4 8142
1 57264227EED 21SDOMC 01199 19 57 3323893592062*4 8142
1 57264227EED 21SDOMC 02049 19 58 27853592062*4 8142
56599826EED 22SDOMC 00421 04 180 812613587349* 8147
2 57164926EED 23SSTKC 03010 12 130 102 1403575978*4 8167
2 57305027EED 23SDOMC 01632 07 100 733 1733575789*4 8173
43Page 39 of6/12/09 4:19 PM WATER COLUMN/ AVERAGEDEPTH TO WATER
*UTM location was derived from PLSS - see Help

(In feet)
(quarters are 1=NW 2=NE 3=SW 4=SE)
(NAD83 UTM in meters)(quarters are smallest to largest)
64
Sub
basin XCountyWater
Column
Q
YDepthWaterPOD Number 416
Q
RngUse TwsSecDepth
Well
Q
Distance
1 57747627EED 23SDOMC 00607 101 2003576858*2 8181
2 57405427EED 23SDOMC 02824 084 4003575798*3 8182
4 57968827EED 22SIRRC 00286 354 1503578702*4 8189
4 57968827EED 22SIRRC 00496 354 2253578702*4 8189
3 57667327EED 23SDOMC 00068 101 1753576441*1 8193
3 57667327EED 23SIRRC 00068 101 1753576441*1 8193
2 58130927EED 22SDOMC 02536 25 20 1002 1203581772*2 8199
1 57195627ECH 23SDOMC 01847 07 2433575878*3 8205
3 57022626EED 23SDOMC 02053 12 215 531 2683576377*1 8217
1 57274127EED 21SDOMC 01280 19 58 422 1003592161*4 8232
1 57254127EED 21SDOMC 01119 19 42 631 1053592161*4 8251
2 57136126EED 21SIRRC 00165 243 3203591952*4 8254
4 57076726EED 21SDOMC 02689 242 1003591780*3 8257
3 57827627EED 23SDOMC 00549 02 65 851 1503577270*3 8271
2 57155026EED 23SDOMC 02448 12 127 131403575879*4 8286
4 57001826EED 23SDOMC 01866 11 212 332 2453576371*2 8305
2 56666426EED 22SDOMC 01192 33 1003579084*4 8316
2 56568026EED 22SDOMC 02509 04 158 423 2003587065*3 8327
57246627EED 21SDOMC 00440 19 29 41703592235* 8333
57246627EED 21SDOMC 00637 19 29 711003592235* 8333
57246627EED 21SDOMC 00722 A 19 803592235* 8333
3 57027026EED 21SDOMC 02468 24 125 351603591698*3 8353
57216027EED 23SEXPC 02300 07 4023575676*3 8372
4 56981826EED 23SDOMC 02153 11 200 751 2753576371*2 8389
3 57022626EED 23SDOMC 02000 12 230 313 2613576177*1 8402
3 57022626EED 23SSTKC 03304 POD1 12 200 573 2573576177*1 8402
3 57827627EED 23SIRRC 00295 02 54 1403 1943577070*3 8433
2 58040127EED 22SSTKC 01286 REPAR 36 60 1502103579227*3 8443
3 56628026EED 21SDOMC 03134 33 120 1972 3173588503*4 8452
2 57968927EED 23SDOMC 00620 02 60 364 963578299*2 8454
1 57989527EED 23SIRRC 00192 01 60 571 1173578507*1 8473
4 57213627EED 21SDOMC 02177 19 70 3753 4453592358*1 8498
43Page 40 of6/12/09 4:19 PM WATER COLUMN/ AVERAGEDEPTH TO WATER
*UTM location was derived from PLSS - see Help

(In feet)
(quarters are 1=NW 2=NE 3=SW 4=SE)
(NAD83 UTM in meters)(quarters are smallest to largest)
64
Sub
basin XCountyWater
Column
Q
YDepthWaterPOD Number 416
Q
RngUse TwsSecDepth
Well
Q
Distance
1 57043226EED 23SDOMC 01919 122 2503575981*3 8510
1 57043226EED 23SDOMC 02089 12 199 632 2623575981*3 8510
3 57175827EED 21SDOMC 01685 19 59 563 1153592339*1 8544
1 57606927EED 23SIRRC 00195 09 83 454 1283575827*4 8553
4 57943227EED 21SDOMC 00468 263 803590041*4 8565
4 57943227EED 21SIRRC 00468 263 803590041*4 8565
56806526EED 23SDOMC 02264 03 2603577254*4 8568
56806526EED 23SDOMC 02382 03 248 402883577254*4 8568
56806526EED 23SDOMC 02393 03 245 452903577254*4 8568
2 57083826EED 23SDOMC 01806 124 2603575780*3 8568
4 57325227EED 23SSANC 01618 074 2503575384*4 8572
3 56614926EED 22SDOMC 02964 333 3193579390*2 8572
3 56940926EED 23SDOMC 01310 11 220 301 2503576366*2 8576
4 57305227EED 23SDOMC 03005 07 100 403 1403575384*4 8578
1 57023226EED 23SDOMC 02061 12 220 561 2763575981*3 8582
4 57223727EED 21SDOMC 02177 PLG. 19 2003592459*1 8583
4 57155826EED 21SDOMC 00713 24 43 1374 1803592357*2 8602
3 57265027EED 23SSTKC 03301 POD1 073 3753575380*4 8608
3 56951026EED 23SDOMC 01548 11 2503576267*2 8618
3 56951026EED 23SDOMC 01708 11 236 392753576267*2 8618
3 56951026EED 23SDOMC 01843 11 217 352523576267*2 8618
3 57185927EED 21SDOMC 01393 19 72 4094813592440*1 8624
1 57687727EED 23SIRRC 00508 S 10 28 2062 2343576039*3 8643
2 57626427EED 21SSTKC 00206 21 1503592118*4 8649
1 56854426EED 21SDOMC 00658 263 2003591169*1 8698
4 57943227EED 21SDOMC 01835 26 5 531 583590241*4 8708
2 57616327EED 21SSTKC 00061 211 1503592217*4 8710
1 56864526EED 21SDOMC 00687 26 5003591270*1 8727
1 56864526EED 21SDOMC 00895 26 40 811213591270*1 8727
57891427EED 21SDOMC 00973 26 32 48803590731* 8732
3 57989727EED 23SDOMC 00041 011 753578104*1 8739
3 57989727EED 23SPROC 00041 011 753578104*1 8739
43Page 41 of6/12/09 4:19 PM WATER COLUMN/ AVERAGEDEPTH TO WATER
*UTM location was derived from PLSS - see Help

(In feet)
(quarters are 1=NW 2=NE 3=SW 4=SE)
(NAD83 UTM in meters)(quarters are smallest to largest)
64
Sub
basin XCountyWater
Column
Q
YDepthWaterPOD Number 416
Q
RngUse TwsSecDepth
Well
Q
Distance
3 57989727EED 23SIRRC 00459 01 42 1381 1803578104*1 8739
3 57175827EED 21SDOMC 01389 19 60 421 1023592539*1 8740
1 57828227EED 23SIRRC 00766 11 22 1773 1993576672*1 8765
2 57305327EED 23SDOMC 03075 181 3003575181*2 8781
3 56538126EED 22SDOMC 02504 04 155 552103587570*1 8800
3 56538126EED 22SEXPC 02532 04 3003587570*1 8800
3 56538126EED 22SDOMC 02603 04 124 1222463587570*1 8800
1 58220628EED 22SPROC 01508 181 1803584195*4 8804
2 57942927EED 21SIRRC 00047 EXPL 263 4903590444*4 8854
56931026EED 23SDOMC 01635 11 205 502553576050* 8902
58222028EED 22SDOMC 00642 19 2003582687* 8905
3 58065927EED 21SDOMC 00699 363 1103589248*2 8979
3 56554326EED 22SMULC 02822 332 3003579584*1 8995
1 57748727EED 23SIRRC 00508 103 1903575855*4 9070
4 56590126EED 21SSANC 02730 33 52 2284 2803589113*1 9105
1 56527226EED 22SDOMC 02136 04 175 431 2183588081*1 9119
3 58085927EED 21SDOMC 00698 364 1103589248*2 9142
2 57084526EED 23SDOMC 03096 132 2503575177*1 9143
3 57921827EED 21SDOMC 00047 A 26 70 202 903591043*2 9166
3 57921827EED 21SIRRC 00047 A 26 70 202 903591043*2 9166
3 57921827EED 21SDOMC 01349 26 45 3502 3953591043*2 9166
2 57064526EED 23SDOMC 01642 131 3033575177*1 9201
2 57064526EED 23SDOMC 02205 13 210 301 2403575177*1 9201
1 56793526EED 21SDOMC 03052 272 2003591362*2 9207
4 56580226EED 21SDOMC 02437 33 163 572203589214*1 9244
4 56813126EED 21SDOMC 03047 223 2003591568*4 9261
1 58090927EED 23SDOMC 00921 01 31 1192 1503578526*2 9261
2 57074626EED 23SDOMC 01765 13 3503575078*1 9266
2 57074626EED 23SDOMC 02444 13 177 732503575078*1 9266
1 56873326EED 21SDOMC 02994 23 34 3034 3373591975*3 9281
4 58044627EED 21SIRRC 00858 254 3043590051*3 9313
3 58172128EED 22SEXPC 02840 312 2203579758*1 9315
43Page 42 of6/12/09 4:19 PM WATER COLUMN/ AVERAGEDEPTH TO WATER
*UTM location was derived from PLSS - see Help

(In feet)
(quarters are 1=NW 2=NE 3=SW 4=SE)
(NAD83 UTM in meters)(quarters are smallest to largest)
64
Sub
basin XCountyWater
Column
Q
YDepthWaterPOD Number 416
Q
RngUse TwsSecDepth
Well
Q
Distance
2 56423026EED 22SSTKC 01404 1 20 220 302503582306*3 9322
1 57024026EED 23SDOMC 01867 13 212 381 2503575179*1 9329
1 57024026EED 23SDOMC 02260 13 218 291 2473575179*1 9329
3 58165928EED 22SDOMC 03040 31 42 304 7235796031 9330
3 58165928EED 22SPROC 03040 31 42 304 7235796031 9330
3 58071027EED 23SIRRC 00171 A 011 2003578123*2 9347
1 57034126EED 23SDOMC 01851 13 207 512583575080*1 9389
2 57959827EED 23SDOMC 00696 11 2003576791*2 9469
3 58071027EED 23SIRRC 00144 01 60 1403 2003577923*2 9473
2 56832726EED 21SDOMC 03048 224 2003591972*4 9489
2 56571426EED 21SDOMC 02966 333 2503589521*1 9493
1 56528026EED 21SSTKC 01380 331 2303588902*3 9512
1 57024026EED 23SDOMC 02537 13 210 703 2803574979*1 9517
57054426EED 23SDOMC 02059 13 190 922823574875*1 9520
57054426EED 23SDOMC 02485 13 190 602503574875*1 9520
1 56853326EED 21SDOMC 00615 23 36 171 533592175*3 9555
4 57064626EED 23SDOMC 01968 13 200 471 2473574771*1 9589
2 57718927EED 23SDOMC 00623 15 2003575142*1 9591
2 57003226EED 23SDOMC 03275 144 4003574970*2 9597
1 58071227EED 23SDOMC 02895 011 2503577719*4 9606
1 56382626EED 22SSTKC 01404 RPR 20 256 02563583097*1 9617
0
367Maximum Depth:
Minimum Depth:
68 Average Depth to Water:
Record Count: 1,362
UTMNAD83 Radius Search (in meters):
Easting (X): Northing (Y): Radius:3583955 9656573405
feet
feet
feet
WATER COLUMN/ AVERAGEDEPTH TO WATER
6/12/09 4:19 PM
The data is furnished by the NMOSE/ISC and is accepted by the recipient with the expressed understanding that the OSE/ISC make no warranties,expressed or implied, concerning the accuracy, completeness, reliability, usability, or suitability for any particular purpose of the data.
43Page 43 of
*UTM location was derived from PLSS - see Help