Embed Size (px)
Citation preview
May 01, 2017
Monday, May 1, 2017
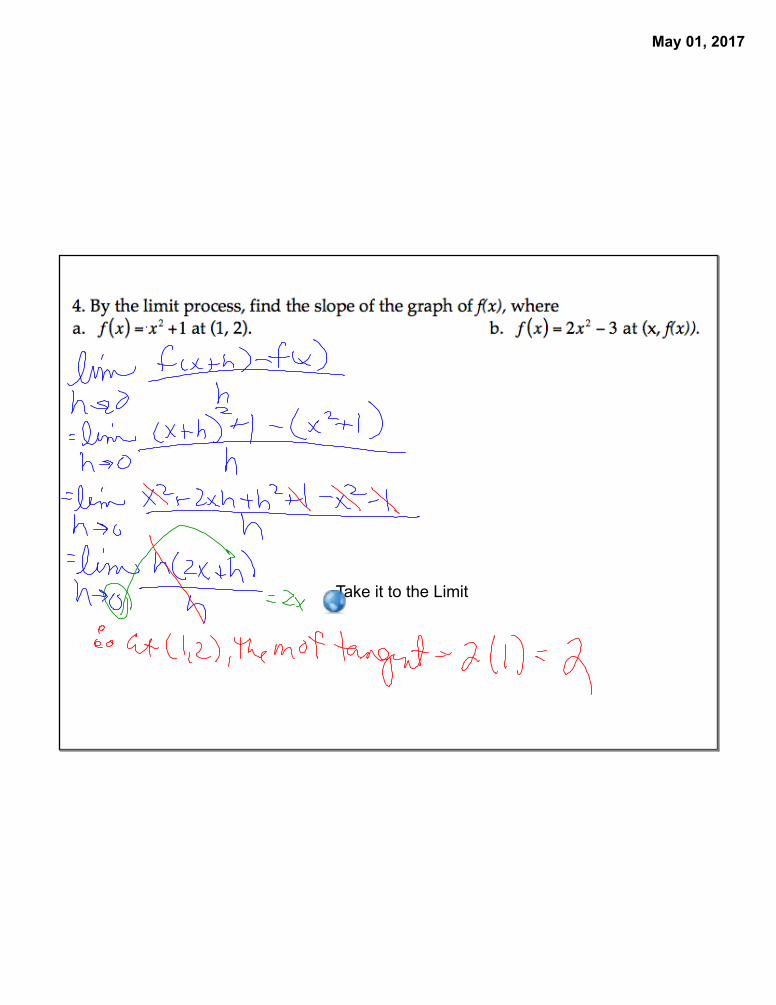
1. HW Qs?2. Warm-up3. Tangent Lines4. Assignment:
Finish Sec. 11.3
HAPPY MONDAY!!
May 01, 2017
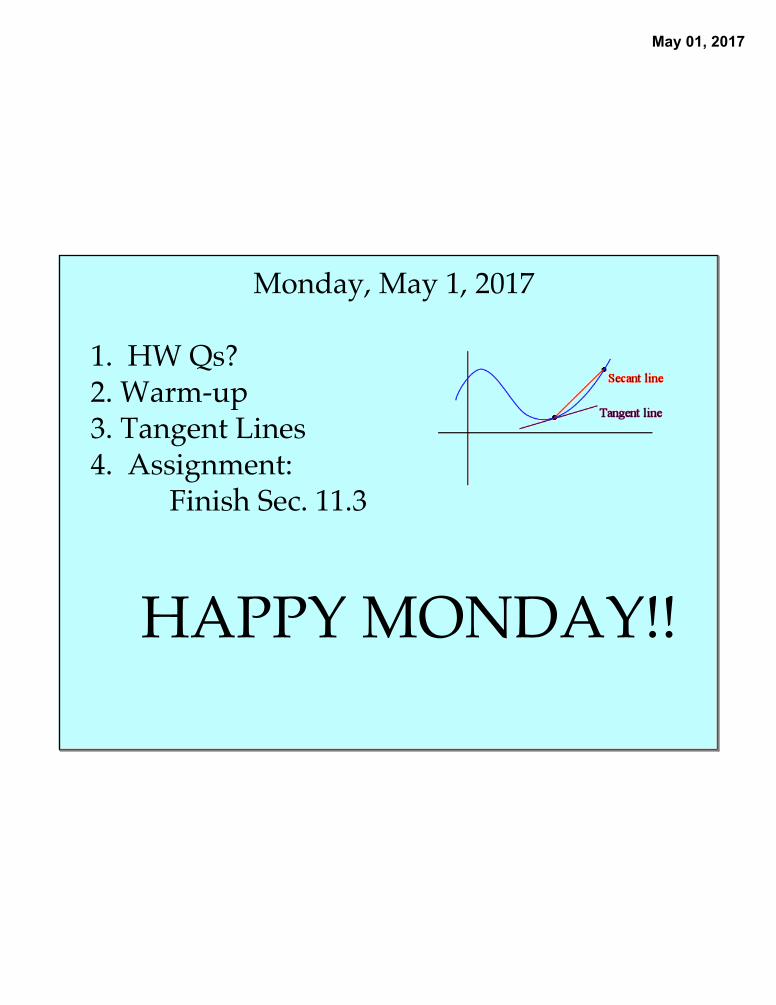
Homework handout...Qs?
May 01, 2017
May 01, 2017
May 01, 2017

May 01, 2017
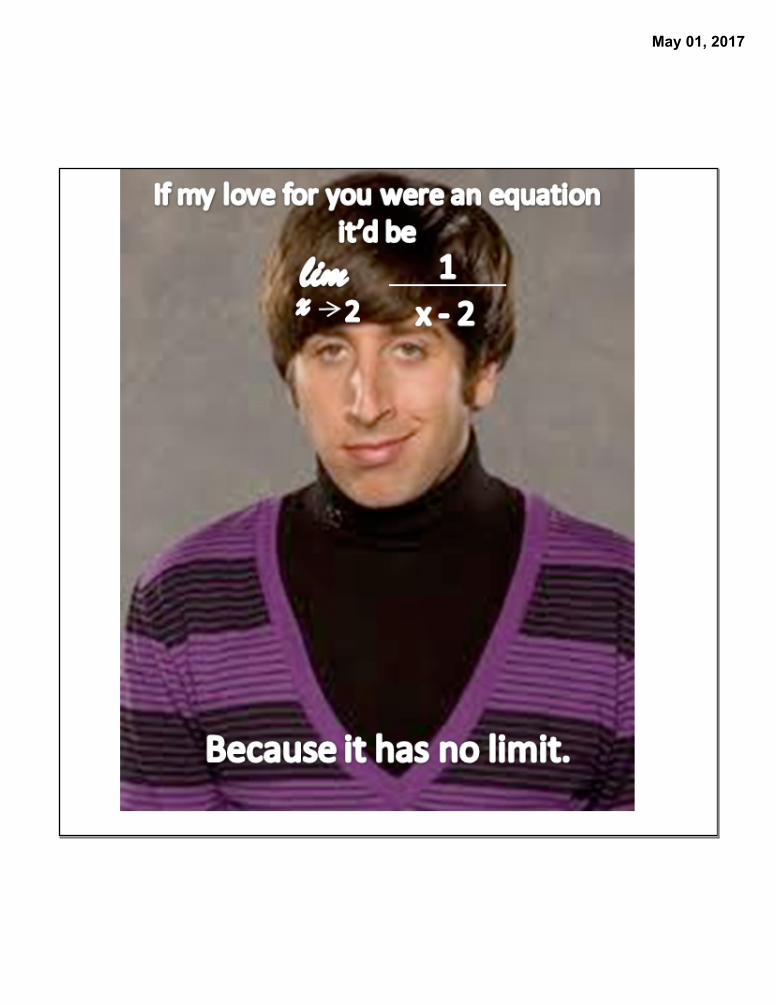
LIMITS....
May 01, 2017
May 01, 2017
May 01, 2017
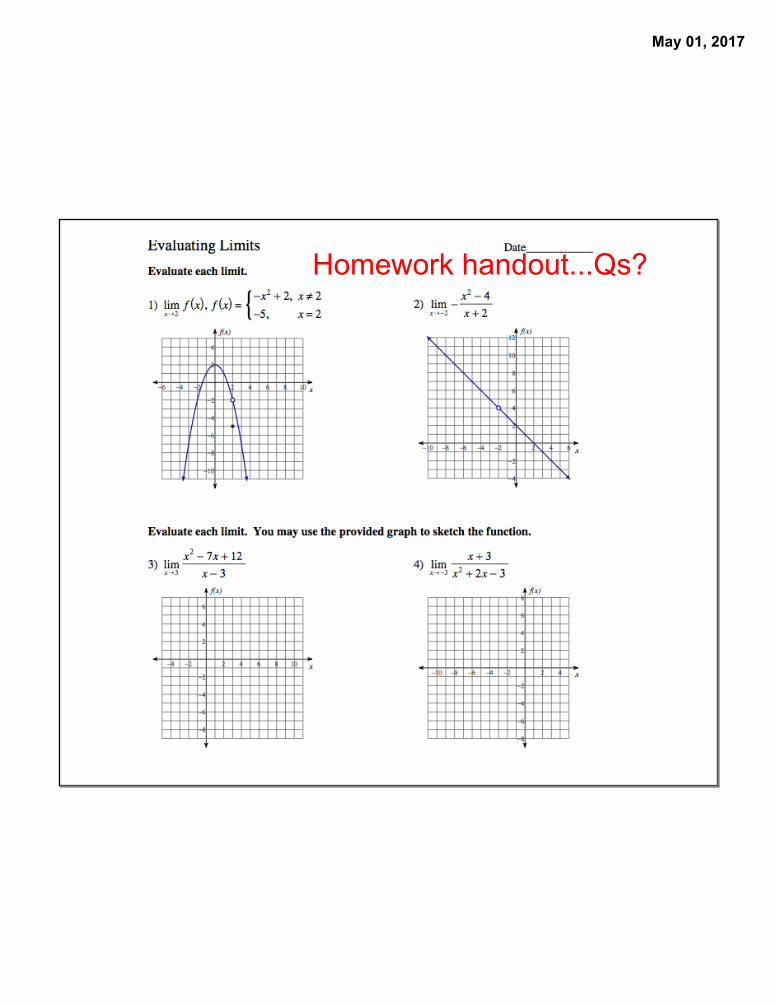
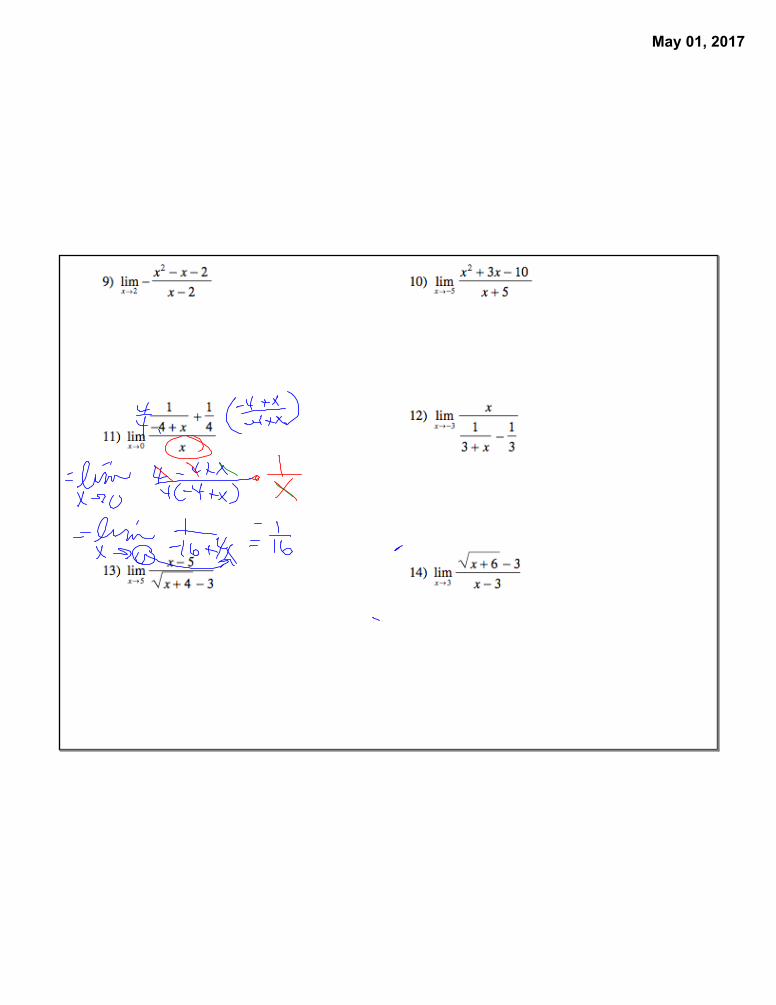
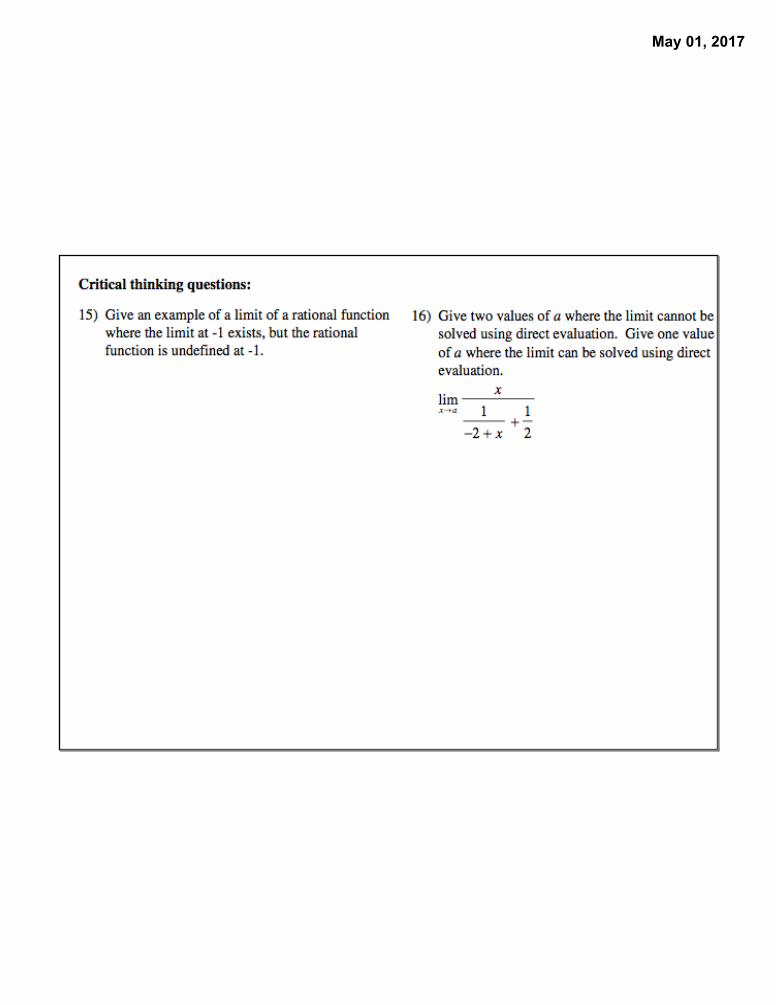
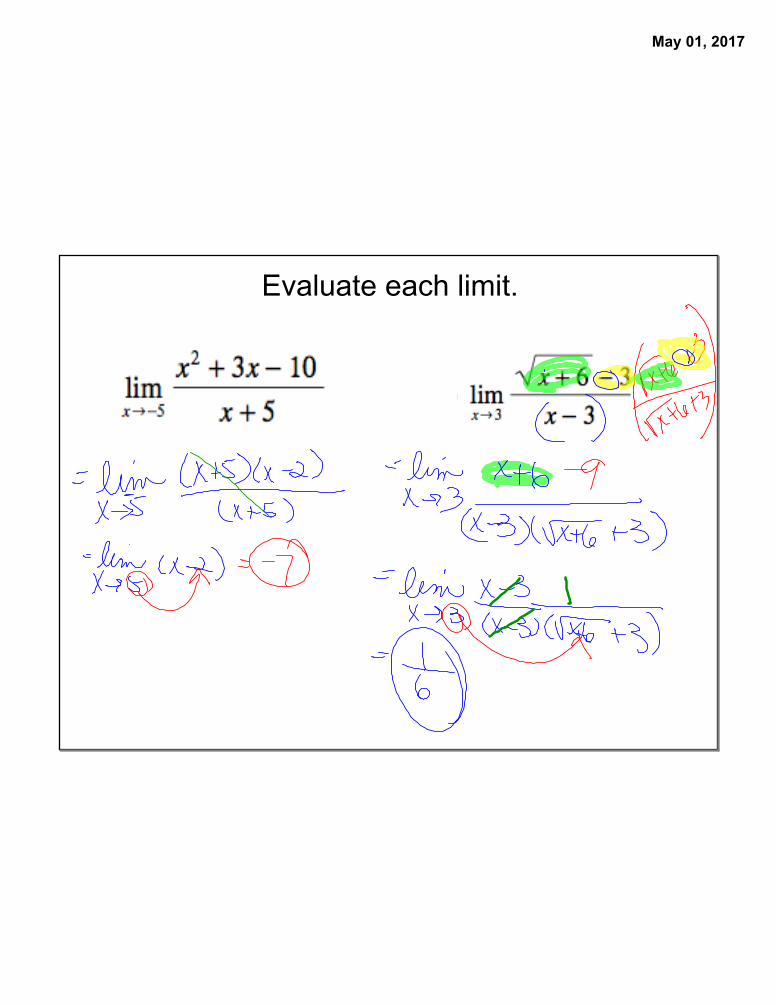
Evaluate each limit.
May 01, 2017
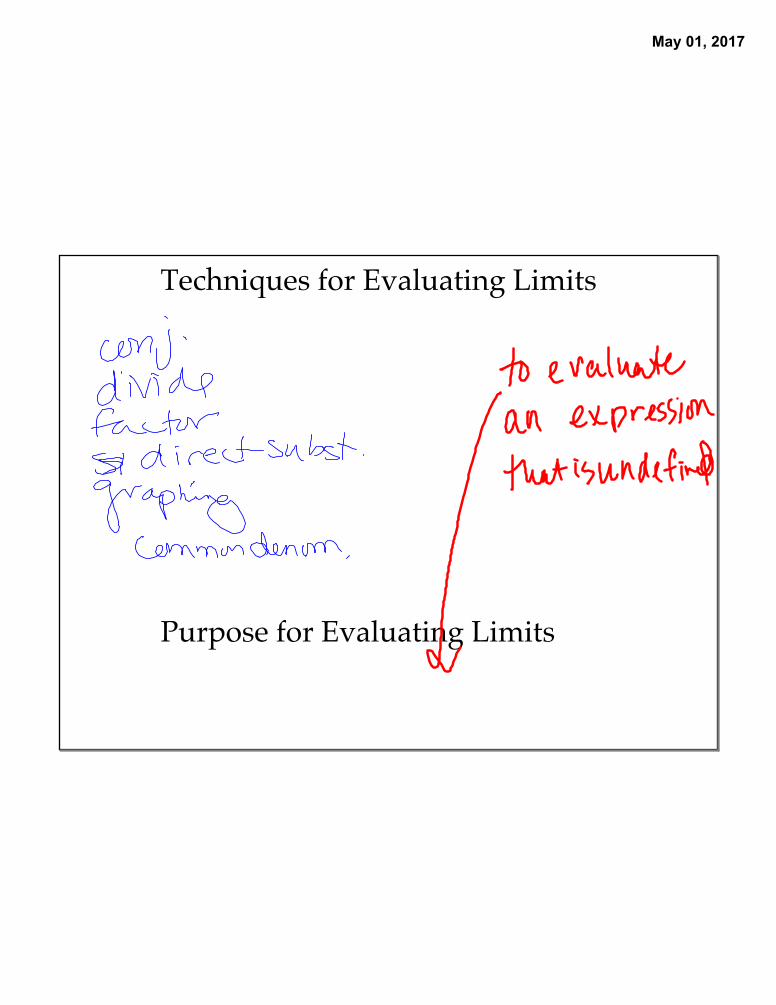
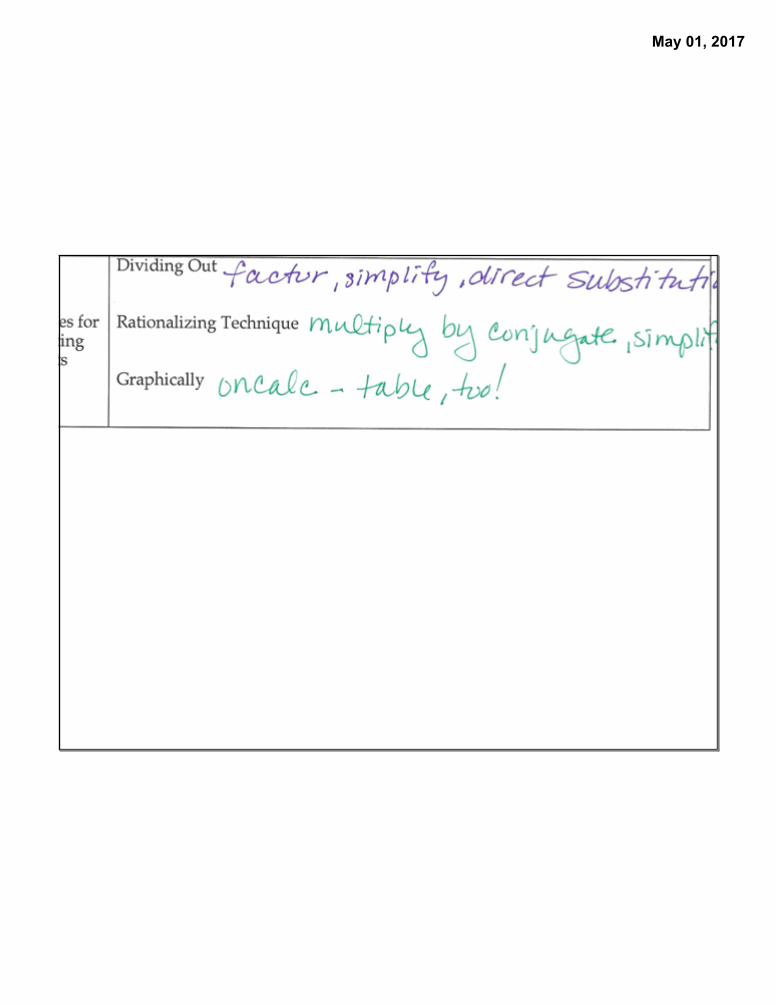
Techniques for Evaluating Limits
Purpose for Evaluating Limits
May 01, 2017
May 01, 2017
May 01, 2017
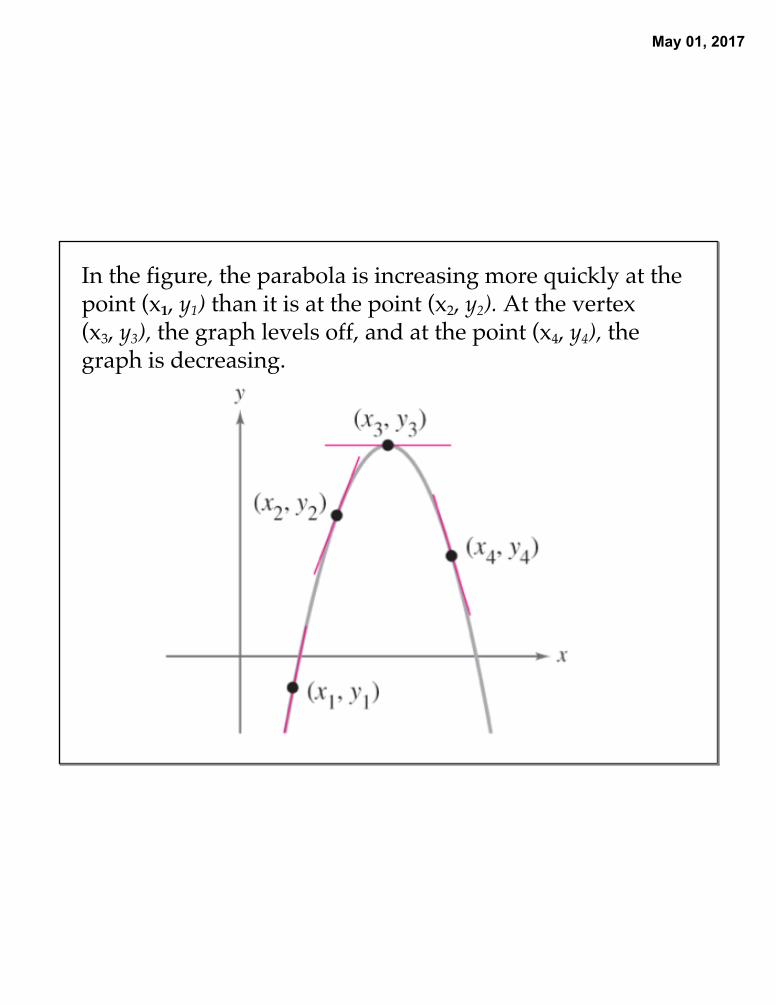
In the figure, the parabola is increasing more quickly at the point (x1, y1) than it is at the point (x2, y2). At the vertex (x3, y3), the graph levels off, and at the point (x4, y4), the graph is decreasing.
May 01, 2017
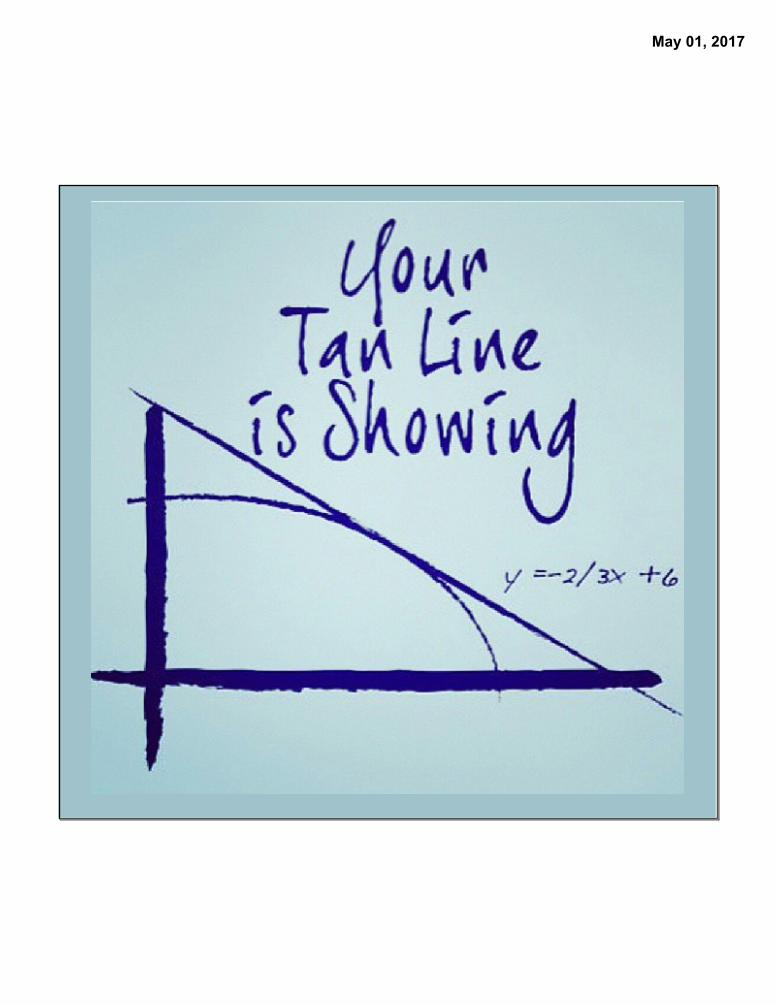
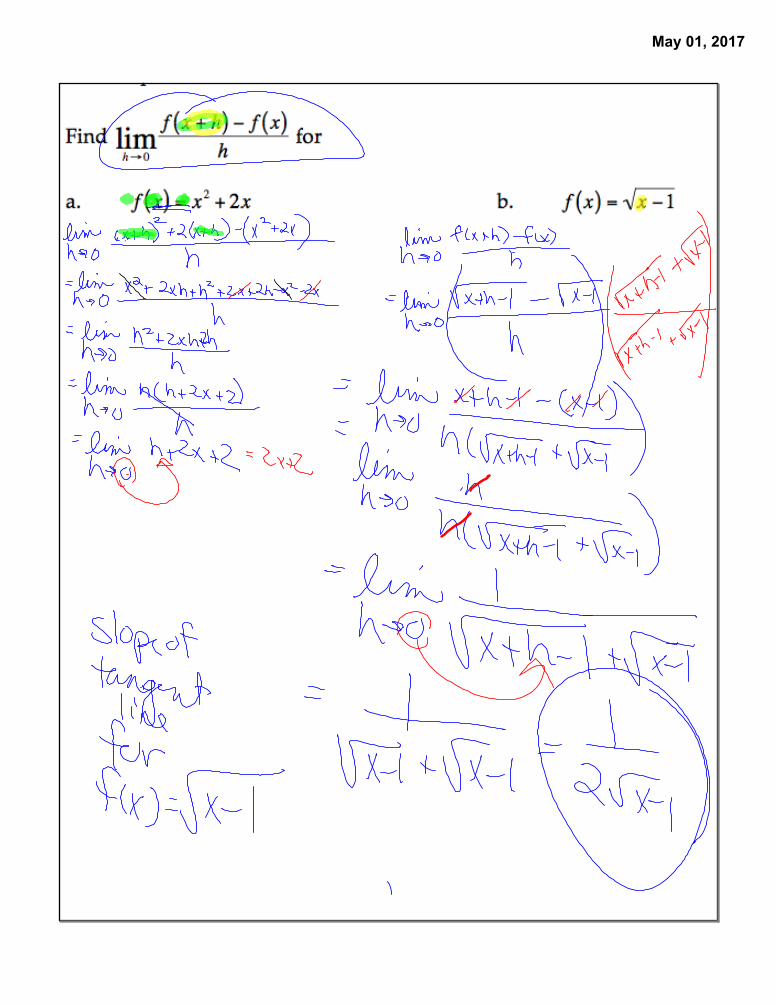
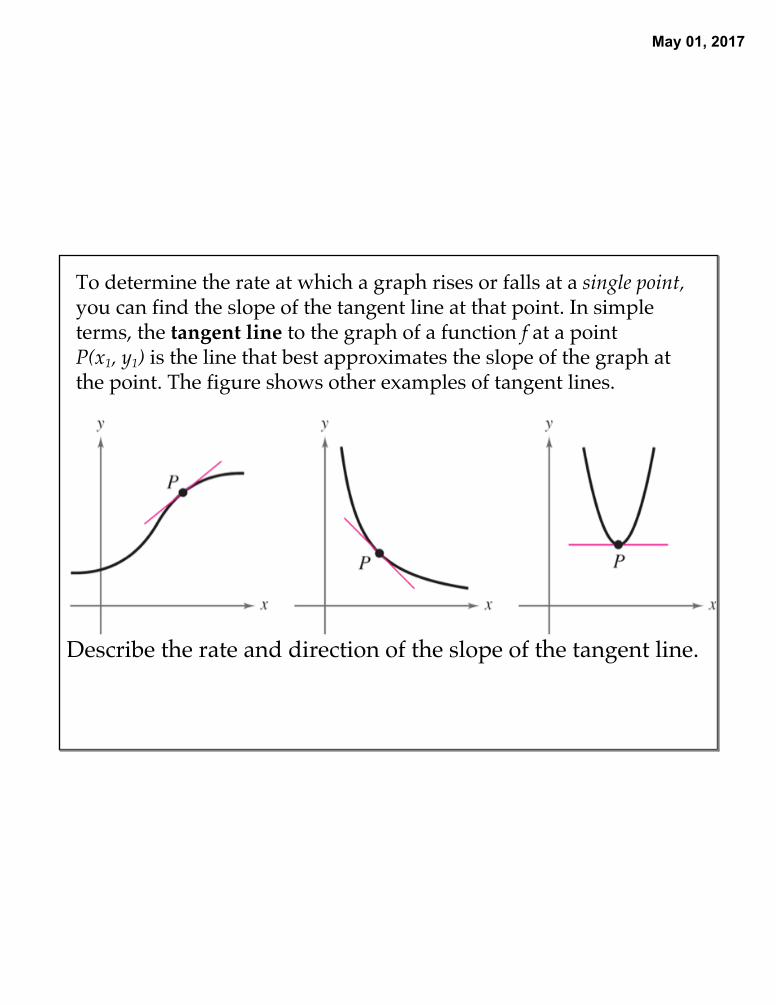
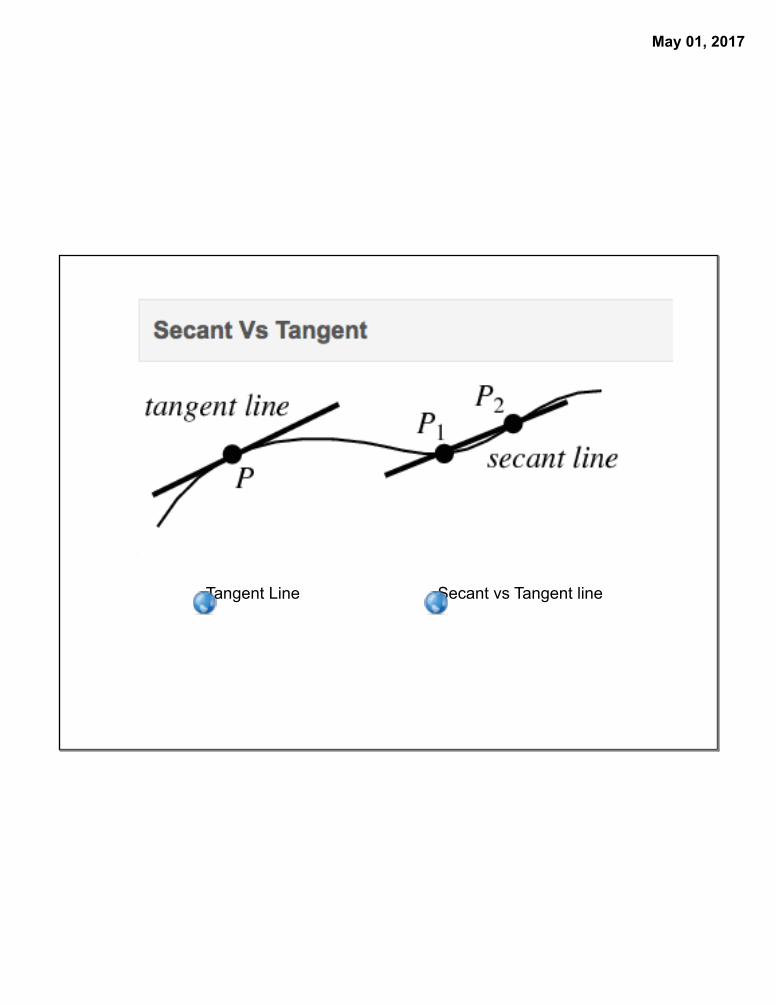
To determine the rate at which a graph rises or falls at a single point, you can find the slope of the tangent line at that point. In simple terms, the tangent line to the graph of a function f at a point P(x1, y1) is the line that best approximates the slope of the graph at the point. The figure shows other examples of tangent lines.
Describe the rate and direction of the slope of the tangent line.
May 01, 2017
May 01, 2017
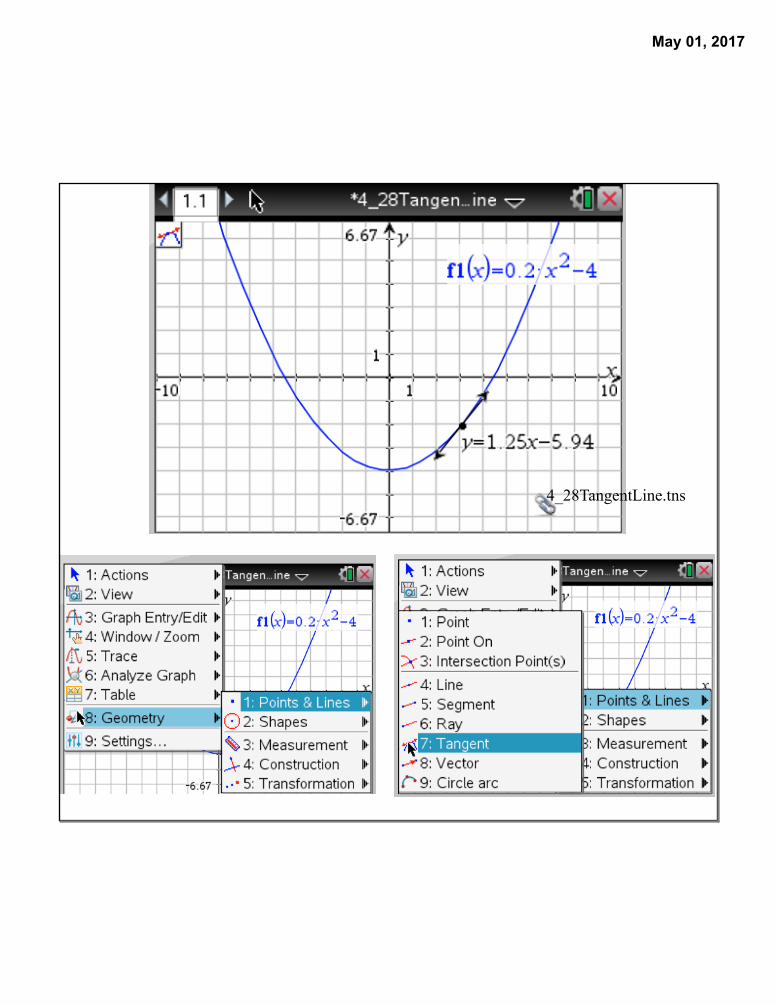
4_28TangentLine.tns
May 01, 2017
Tangent Line Secant vs Tangent line
May 01, 2017
May 01, 2017
May 01, 2017