Embed Size (px)
Citation preview
--
402 SCIENCE October 14, 1949, Vol. 110 -
Hydrolysis of Adenosine Triphosphate by Trichloracetic Acid1
Adolph Bernhard and Louis Rosenbloom
Achelis Laboratories of the Lenox Hill Hospital, New York Ci ty
In the determination of adenosine triphosphatase ac-tivity, the usual procedure utilizes addition of trichlor-xcctic acid for precipitation of the protein and stopping of the enzyme action. The estimation of inorganic phos- phorus is then done on the filtrate. I n determining de- phosphorylation of an adenosine triphosphate substrate by human serum (2 ) , we had oecnsion to leave the tri- ehloracetic acid filtrates overnight in the icebox. Subse-quent estimations of these same filtrates for inorganic phosphorus revealed values which were much higher than those previously obtained. Our interest in this casual observation led us to undertake an investigation of this phenomenon.
Experimentally, a solution of sodium adenosine tri-phosphate2 in veronal-HC1 buffer a t p H 8.9, in a concen-
TABLE 1
Time in hr Control
Sample Preparation 2 4 24
pg I'/nil
1 Na-ATP 1 mg in 1 ml of 4.1 6.3 8.1 27.3 veronal-HC1 buffer, pH 8.0, room temperature
2 Do., in icebox 4.1 5.1 5.8 10.3
3 Na-ATP 1mg in 1ml 4.4 5.5 7.0 H,O, room temperature
4 no. 2.4 6.8 8.4
tration of 1 mg in 1 ml of buffer was used. Filtrates were prepared in the following manner: to each 2.5-ml portion of the buffered Na-ATP solution 0.5 ml of water (instead of serum) and 5 ml of 8% trichloracetic acid was addcd, and the resulting solution was well mixed and then filtered. The inorgahic phosphorus was determined on 4 ml of the filtrate by the method of Fiske and Sub- barow (1). Srtffieient filtrate was made to insure dupli- cate estimations of inorganic phosphorus s t the end of khe various time periods. The results are recorded in Table 1.
I n order to obviate the possible effect of the buffer solubion employed, an aqueous solution of Na-ATP in the same concentration was prepared and treated in the same manner as described above. These results are also shown in Table 1.
I t is evident that there is a definite increase in in- organic phosphorus when adenosine triphosphate in tri-
1 Aided by a grant from the Frederick IZolh Fund. "he tetra sodium salt of adenosine triphosphate. 3H,O
was obtained from Rohrn & Haas, Philadelphia, Pennsylvania.
chloracetic acid is allowed to stand a t either room or ice- box temperature. No such change takes place when solu- tions of adenosine triphosphate without addition of tri- chloracetic acid are allowed to remain for the same periods of time. Trichloracetic acid filtrates prepared from serum alone do not hydrolyze under similar con-ditions of time and temperature.
The results indicate that spontaneous hydrolysis of adenosine triphosphate by trichloracetic acid does occur. I t is essential that determinations of inorganic phos- phorus be made under identical conditions in order to avoid errors due to such hydrolysis.
References 1. FISKE,C. H. and SUBBAROW, J . biol. Chem., 1025. 66.Y.
375. 2. MEISIWK,A. J. clin. Invest., 1948, 27, 263
Differ,entiation of Aragonite from Calcite by Differential Thermal Analysis
George T. Faust
U . S. Geological Survey, Washington, D. C.'
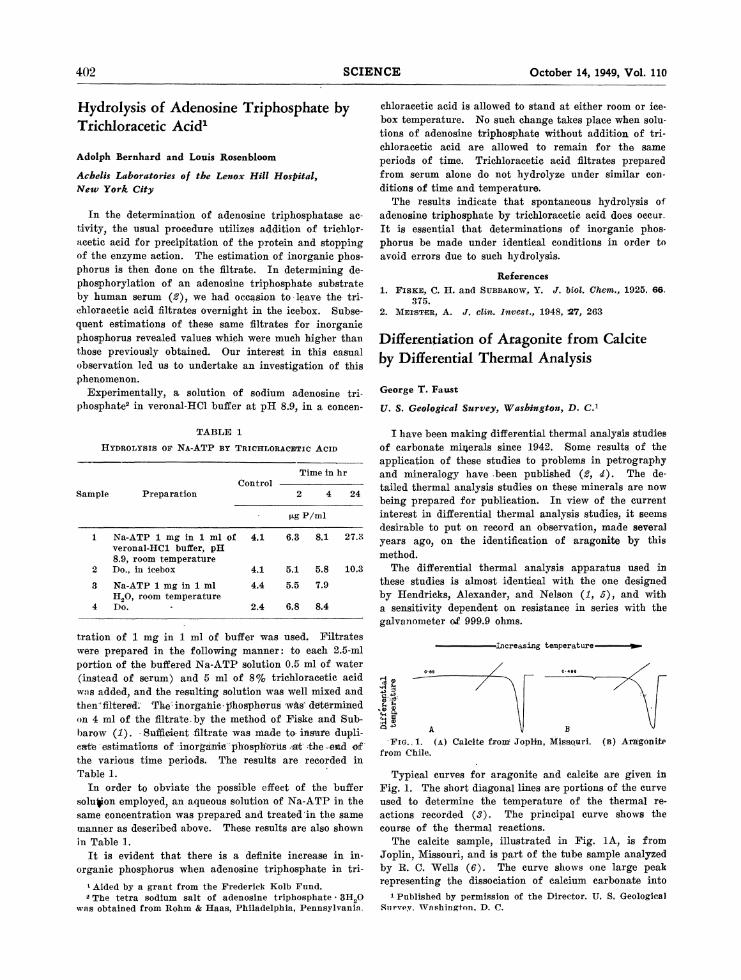
I have been making differential thermal analysis studies of carbonate miqerals since 1942. Some results of the application of these studies to problems in petrography and mineralogy have been published (2 , 4). The de-tailed thermal analysis studies on these minerals are now being prepared for publication. I n view of the current interest in differential thermal analysis studies, i t seems desirable to put on record an observation, made several years ago, on the identification of aragonite by this method.
The differential thermal analysis apparatus used in these studies is almost identical with the one designed by Hendricks, Alexander, and Nelson (1, 5), and with a sensitivity dependent on resistance in series with the galvanometer of 999.9 ohms.
Increasing temperature-
FIG.1. ( A ) Calcite from Joplin, Missouri. ( B ) Aragonite froin Chilt..
Typical curves for aragonite and calcite are given in Fig. 1. The short diagonal lines are portions of the curve used to determine the temperature of the thermal re-actions recorded ( 3 ) . The principal curve shows the course of the thermal reactions.
The calcite sample, illustrated in Fig. lA , is from Joplin, Blissouri, and is part of the tube sample analyzed by R. C. Wells (6). The curve shows one large peak representing the dissociation of calcium carbonate into
1 Published by permission of the Director. U. S. Geological R I I I . v ~ ~ .IVnshinglon. D. C .