Embed Size (px)
Citation preview
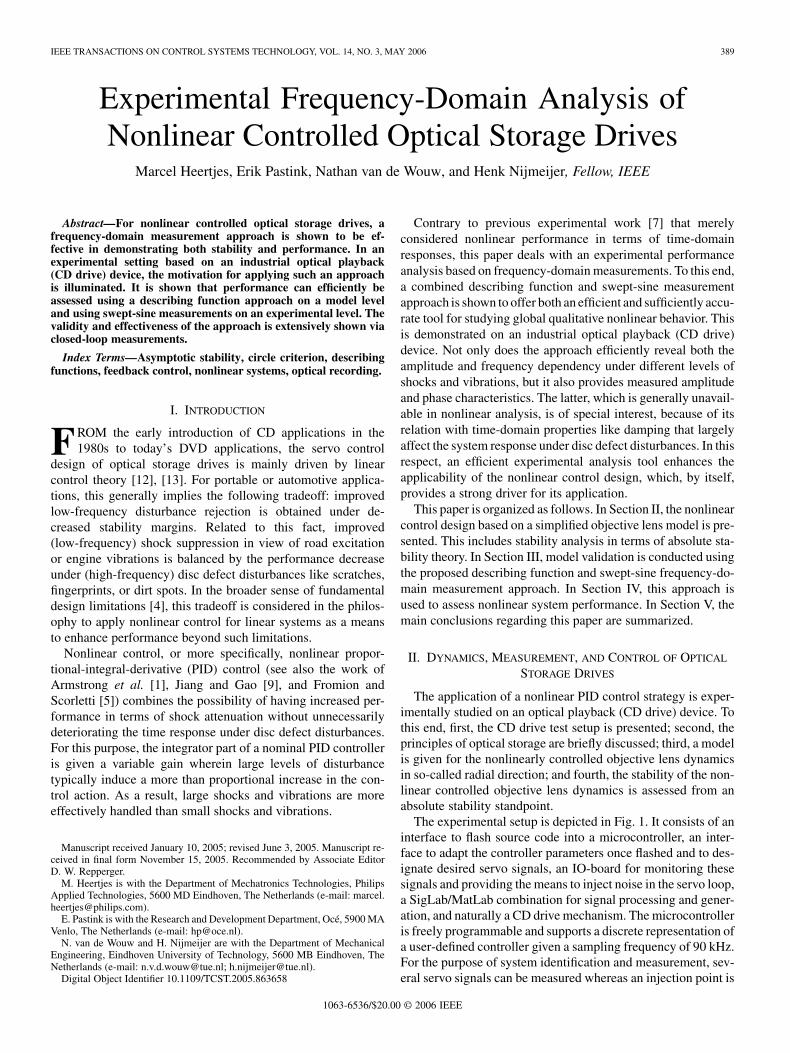
IEEE TRANSACTIONS ON CONTROL SYSTEMS TECHNOLOGY, VOL. 14, NO. 3, MAY 2006 389
Experimental Frequency-Domain Analysis ofNonlinear Controlled Optical Storage Drives
Marcel Heertjes, Erik Pastink, Nathan van de Wouw, and Henk Nijmeijer, Fellow, IEEE
Abstract—For nonlinear controlled optical storage drives, afrequency-domain measurement approach is shown to be ef-fective in demonstrating both stability and performance. In anexperimental setting based on an industrial optical playback(CD drive) device, the motivation for applying such an approachis illuminated. It is shown that performance can efficiently beassessed using a describing function approach on a model leveland using swept-sine measurements on an experimental level. Thevalidity and effectiveness of the approach is extensively shown viaclosed-loop measurements.
Index Terms—Asymptotic stability, circle criterion, describingfunctions, feedback control, nonlinear systems, optical recording.
I. INTRODUCTION
FROM the early introduction of CD applications in the1980s to today’s DVD applications, the servo control
design of optical storage drives is mainly driven by linearcontrol theory [12], [13]. For portable or automotive applica-tions, this generally implies the following tradeoff: improvedlow-frequency disturbance rejection is obtained under de-creased stability margins. Related to this fact, improved(low-frequency) shock suppression in view of road excitationor engine vibrations is balanced by the performance decreaseunder (high-frequency) disc defect disturbances like scratches,fingerprints, or dirt spots. In the broader sense of fundamentaldesign limitations [4], this tradeoff is considered in the philos-ophy to apply nonlinear control for linear systems as a meansto enhance performance beyond such limitations.
Nonlinear control, or more specifically, nonlinear propor-tional-integral-derivative (PID) control (see also the work ofArmstrong et al. [1], Jiang and Gao [9], and Fromion andScorletti [5]) combines the possibility of having increased per-formance in terms of shock attenuation without unnecessarilydeteriorating the time response under disc defect disturbances.For this purpose, the integrator part of a nominal PID controlleris given a variable gain wherein large levels of disturbancetypically induce a more than proportional increase in the con-trol action. As a result, large shocks and vibrations are moreeffectively handled than small shocks and vibrations.
Manuscript received January 10, 2005; revised June 3, 2005. Manuscript re-ceived in final form November 15, 2005. Recommended by Associate EditorD. W. Repperger.
M. Heertjes is with the Department of Mechatronics Technologies, PhilipsApplied Technologies, 5600 MD Eindhoven, The Netherlands (e-mail: [email protected]).
E. Pastink is with the Research and Development Department, Océ, 5900 MAVenlo, The Netherlands (e-mail: [email protected]).
N. van de Wouw and H. Nijmeijer are with the Department of MechanicalEngineering, Eindhoven University of Technology, 5600 MB Eindhoven, TheNetherlands (e-mail: [email protected]; [email protected]).
Digital Object Identifier 10.1109/TCST.2005.863658
Contrary to previous experimental work [7] that merelyconsidered nonlinear performance in terms of time-domainresponses, this paper deals with an experimental performanceanalysis based on frequency-domain measurements. To this end,a combined describing function and swept-sine measurementapproach is shown to offer both an efficient and sufficiently accu-rate tool for studying global qualitative nonlinear behavior. Thisis demonstrated on an industrial optical playback (CD drive)device. Not only does the approach efficiently reveal both theamplitude and frequency dependency under different levels ofshocks and vibrations, but it also provides measured amplitudeand phase characteristics. The latter, which is generally unavail-able in nonlinear analysis, is of special interest, because of itsrelation with time-domain properties like damping that largelyaffect the system response under disc defect disturbances. In thisrespect, an efficient experimental analysis tool enhances theapplicability of the nonlinear control design, which, by itself,provides a strong driver for its application.
This paper is organized as follows. In Section II, the nonlinearcontrol design based on a simplified objective lens model is pre-sented. This includes stability analysis in terms of absolute sta-bility theory. In Section III, model validation is conducted usingthe proposed describing function and swept-sine frequency-do-main measurement approach. In Section IV, this approach isused to assess nonlinear system performance. In Section V, themain conclusions regarding this paper are summarized.
II. DYNAMICS, MEASUREMENT, AND CONTROL OF OPTICAL
STORAGE DRIVES
The application of a nonlinear PID control strategy is exper-imentally studied on an optical playback (CD drive) device. Tothis end, first, the CD drive test setup is presented; second, theprinciples of optical storage are briefly discussed; third, a modelis given for the nonlinearly controlled objective lens dynamicsin so-called radial direction; and fourth, the stability of the non-linear controlled objective lens dynamics is assessed from anabsolute stability standpoint.
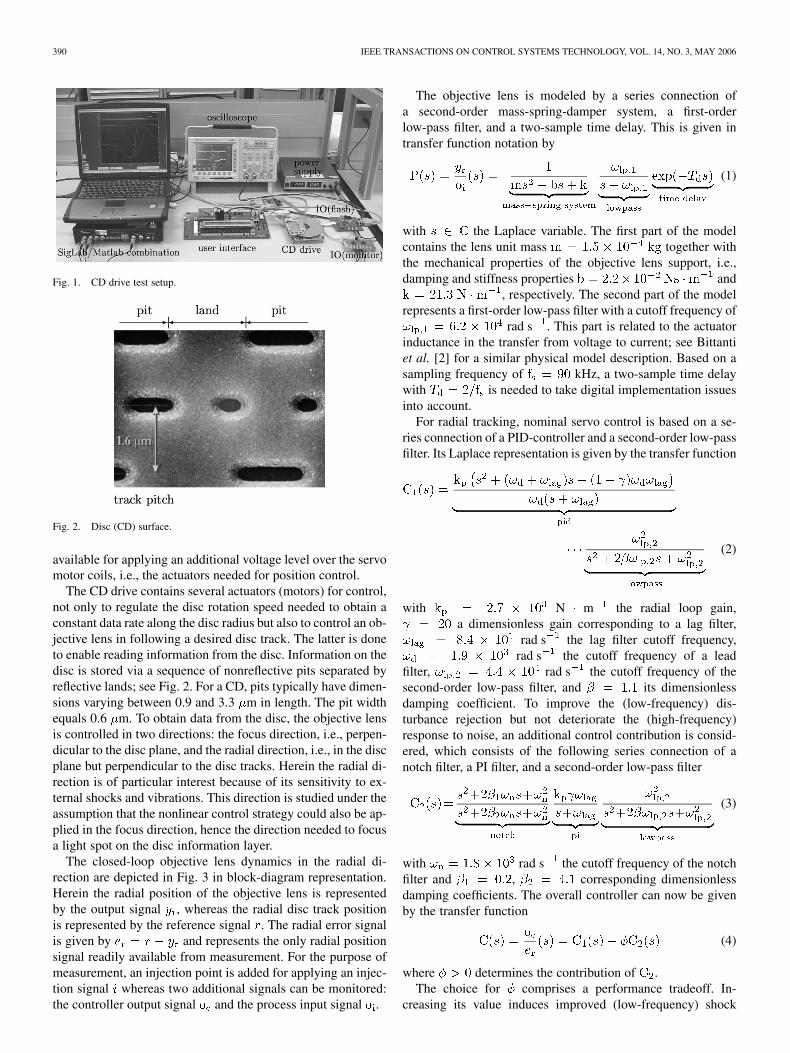
The experimental setup is depicted in Fig. 1. It consists of aninterface to flash source code into a microcontroller, an inter-face to adapt the controller parameters once flashed and to des-ignate desired servo signals, an IO-board for monitoring thesesignals and providing the means to inject noise in the servo loop,a SigLab/MatLab combination for signal processing and gener-ation, and naturally a CD drive mechanism. The microcontrolleris freely programmable and supports a discrete representation ofa user-defined controller given a sampling frequency of 90 kHz.For the purpose of system identification and measurement, sev-eral servo signals can be measured whereas an injection point is
1063-6536/$20.00 © 2006 IEEE
390 IEEE TRANSACTIONS ON CONTROL SYSTEMS TECHNOLOGY, VOL. 14, NO. 3, MAY 2006
Fig. 1. CD drive test setup.
Fig. 2. Disc (CD) surface.
available for applying an additional voltage level over the servomotor coils, i.e., the actuators needed for position control.
The CD drive contains several actuators (motors) for control,not only to regulate the disc rotation speed needed to obtain aconstant data rate along the disc radius but also to control an ob-jective lens in following a desired disc track. The latter is doneto enable reading information from the disc. Information on thedisc is stored via a sequence of nonreflective pits separated byreflective lands; see Fig. 2. For a CD, pits typically have dimen-sions varying between 0.9 and 3.3 m in length. The pit widthequals 0.6 m. To obtain data from the disc, the objective lensis controlled in two directions: the focus direction, i.e., perpen-dicular to the disc plane, and the radial direction, i.e., in the discplane but perpendicular to the disc tracks. Herein the radial di-rection is of particular interest because of its sensitivity to ex-ternal shocks and vibrations. This direction is studied under theassumption that the nonlinear control strategy could also be ap-plied in the focus direction, hence the direction needed to focusa light spot on the disc information layer.
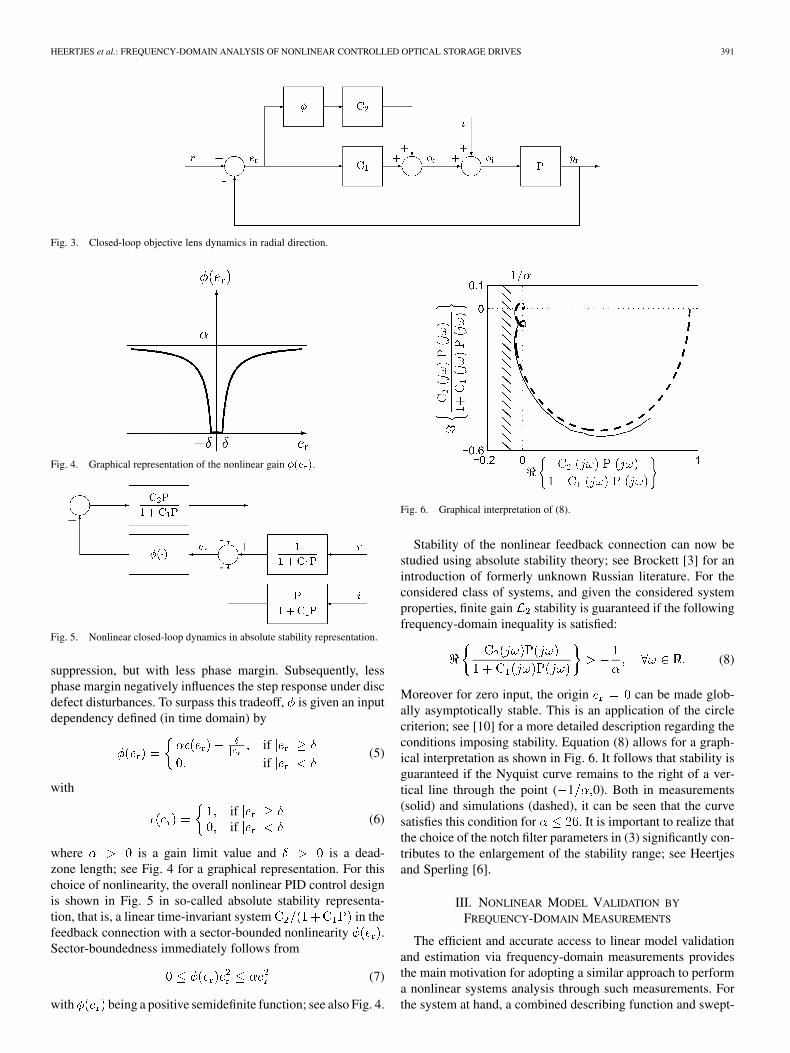
The closed-loop objective lens dynamics in the radial di-rection are depicted in Fig. 3 in block-diagram representation.Herein the radial position of the objective lens is representedby the output signal , whereas the radial disc track positionis represented by the reference signal . The radial error signalis given by and represents the only radial positionsignal readily available from measurement. For the purpose ofmeasurement, an injection point is added for applying an injec-tion signal whereas two additional signals can be monitored:the controller output signal and the process input signal .
The objective lens is modeled by a series connection ofa second-order mass-spring-damper system, a first-orderlow-pass filter, and a two-sample time delay. This is given intransfer function notation by
(1)
with the Laplace variable. The first part of the modelcontains the lens unit mass together withthe mechanical properties of the objective lens support, i.e.,damping and stiffness properties and
, respectively. The second part of the modelrepresents a first-order low-pass filter with a cutoff frequency of
rad s . This part is related to the actuatorinductance in the transfer from voltage to current; see Bittantiet al. [2] for a similar physical model description. Based on asampling frequency of kHz, a two-sample time delaywith is needed to take digital implementation issuesinto account.
For radial tracking, nominal servo control is based on a se-ries connection of a PID-controller and a second-order low-passfilter. Its Laplace representation is given by the transfer function
(2)
with N m the radial loop gain,a dimensionless gain corresponding to a lag filter,
rad s the lag filter cutoff frequency,rad s the cutoff frequency of a lead
filter, rad s the cutoff frequency of thesecond-order low-pass filter, and its dimensionlessdamping coefficient. To improve the (low-frequency) dis-turbance rejection but not deteriorate the (high-frequency)response to noise, an additional control contribution is consid-ered, which consists of the following series connection of anotch filter, a PI filter, and a second-order low-pass filter
(3)
with rad s the cutoff frequency of the notchfilter and , corresponding dimensionlessdamping coefficients. The overall controller can now be givenby the transfer function
(4)
where determines the contribution of .The choice for comprises a performance tradeoff. In-
creasing its value induces improved (low-frequency) shock
HEERTJES et al.: FREQUENCY-DOMAIN ANALYSIS OF NONLINEAR CONTROLLED OPTICAL STORAGE DRIVES 391
Fig. 3. Closed-loop objective lens dynamics in radial direction.
Fig. 4. Graphical representation of the nonlinear gain �(e ).
Fig. 5. Nonlinear closed-loop dynamics in absolute stability representation.
suppression, but with less phase margin. Subsequently, lessphase margin negatively influences the step response under discdefect disturbances. To surpass this tradeoff, is given an inputdependency defined (in time domain) by
ifif
(5)
with
ifif
(6)
where is a gain limit value and is a dead-zone length; see Fig. 4 for a graphical representation. For thischoice of nonlinearity, the overall nonlinear PID control designis shown in Fig. 5 in so-called absolute stability representa-tion, that is, a linear time-invariant system in thefeedback connection with a sector-bounded nonlinearity .Sector-boundedness immediately follows from
(7)
with being a positive semidefinite function; see also Fig. 4.
Fig. 6. Graphical interpretation of (8).
Stability of the nonlinear feedback connection can now bestudied using absolute stability theory; see Brockett [3] for anintroduction of formerly unknown Russian literature. For theconsidered class of systems, and given the considered systemproperties, finite gain stability is guaranteed if the followingfrequency-domain inequality is satisfied:
(8)
Moreover for zero input, the origin can be made glob-ally asymptotically stable. This is an application of the circlecriterion; see [10] for a more detailed description regarding theconditions imposing stability. Equation (8) allows for a graph-ical interpretation as shown in Fig. 6. It follows that stability isguaranteed if the Nyquist curve remains to the right of a ver-tical line through the point ( 1 0). Both in measurements(solid) and simulations (dashed), it can be seen that the curvesatisfies this condition for . It is important to realize thatthe choice of the notch filter parameters in (3) significantly con-tributes to the enlargement of the stability range; see Heertjesand Sperling [6].
III. NONLINEAR MODEL VALIDATION BY
FREQUENCY-DOMAIN MEASUREMENTS
The efficient and accurate access to linear model validationand estimation via frequency-domain measurements providesthe main motivation for adopting a similar approach to performa nonlinear systems analysis through such measurements. Forthe system at hand, a combined describing function and swept-
392 IEEE TRANSACTIONS ON CONTROL SYSTEMS TECHNOLOGY, VOL. 14, NO. 3, MAY 2006
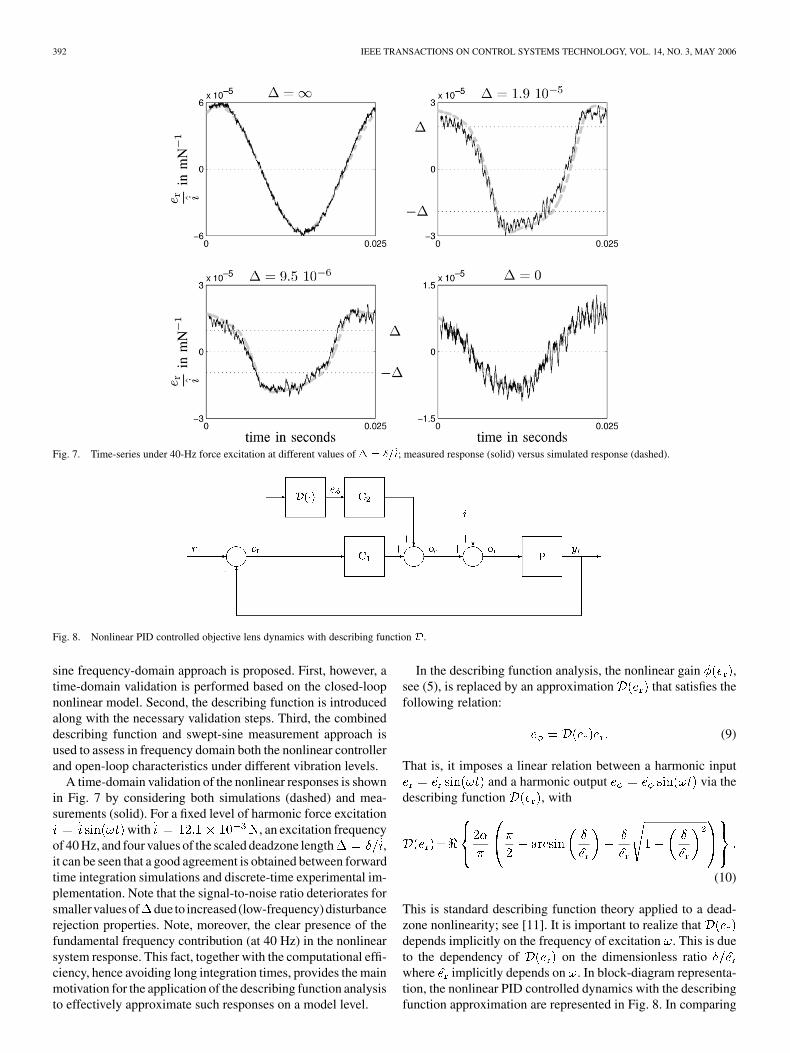
Fig. 7. Time-series under 40-Hz force excitation at different values of � = �=̂i; measured response (solid) versus simulated response (dashed).
Fig. 8. Nonlinear PID controlled objective lens dynamics with describing function D.
sine frequency-domain approach is proposed. First, however, atime-domain validation is performed based on the closed-loopnonlinear model. Second, the describing function is introducedalong with the necessary validation steps. Third, the combineddescribing function and swept-sine measurement approach isused to assess in frequency domain both the nonlinear controllerand open-loop characteristics under different vibration levels.
A time-domain validation of the nonlinear responses is shownin Fig. 7 by considering both simulations (dashed) and mea-surements (solid). For a fixed level of harmonic force excitation
with , an excitation frequencyof 40 Hz, and four values of the scaled deadzone length ,it can be seen that a good agreement is obtained between forwardtime integration simulations and discrete-time experimental im-plementation. Note that the signal-to-noise ratio deteriorates forsmallervaluesof due to increased (low-frequency) disturbancerejection properties. Note, moreover, the clear presence of thefundamental frequency contribution (at 40 Hz) in the nonlinearsystem response. This fact, together with the computational effi-ciency, hence avoiding long integration times, provides the mainmotivation for the application of the describing function analysisto effectively approximate such responses on a model level.
In the describing function analysis, the nonlinear gain ,see (5), is replaced by an approximation that satisfies thefollowing relation:
(9)
That is, it imposes a linear relation between a harmonic inputand a harmonic output via the
describing function , with
(10)
This is standard describing function theory applied to a dead-zone nonlinearity; see [11]. It is important to realize thatdepends implicitly on the frequency of excitation . This is dueto the dependency of on the dimensionless ratiowhere implicitly depends on . In block-diagram representa-tion, the nonlinear PID controlled dynamics with the describingfunction approximation are represented in Fig. 8. In comparing
HEERTJES et al.: FREQUENCY-DOMAIN ANALYSIS OF NONLINEAR CONTROLLED OPTICAL STORAGE DRIVES 393
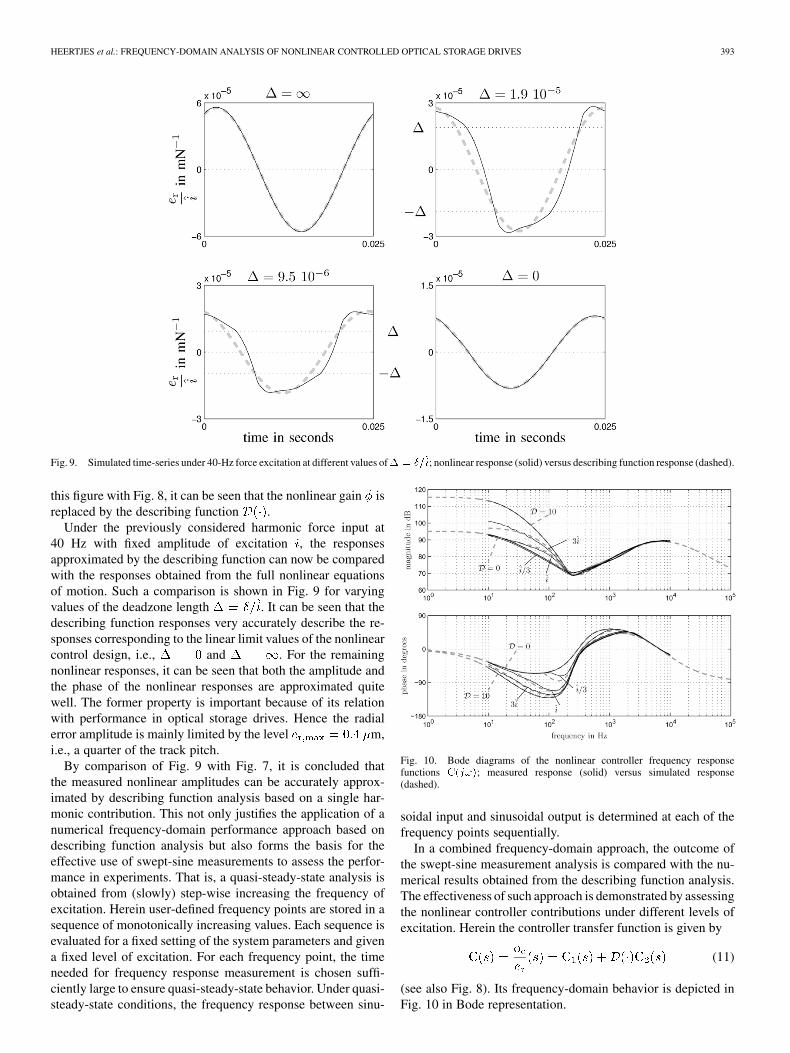
Fig. 9. Simulated time-series under 40-Hz force excitation at different values of� = �=̂i; nonlinear response (solid) versus describing function response (dashed).
this figure with Fig. 8, it can be seen that the nonlinear gain isreplaced by the describing function .
Under the previously considered harmonic force input at40 Hz with fixed amplitude of excitation , the responsesapproximated by the describing function can now be comparedwith the responses obtained from the full nonlinear equationsof motion. Such a comparison is shown in Fig. 9 for varyingvalues of the deadzone length . It can be seen that thedescribing function responses very accurately describe the re-sponses corresponding to the linear limit values of the nonlinearcontrol design, i.e., and . For the remainingnonlinear responses, it can be seen that both the amplitude andthe phase of the nonlinear responses are approximated quitewell. The former property is important because of its relationwith performance in optical storage drives. Hence the radialerror amplitude is mainly limited by the level m,i.e., a quarter of the track pitch.
By comparison of Fig. 9 with Fig. 7, it is concluded thatthe measured nonlinear amplitudes can be accurately approx-imated by describing function analysis based on a single har-monic contribution. This not only justifies the application of anumerical frequency-domain performance approach based ondescribing function analysis but also forms the basis for theeffective use of swept-sine measurements to assess the perfor-mance in experiments. That is, a quasi-steady-state analysis isobtained from (slowly) step-wise increasing the frequency ofexcitation. Herein user-defined frequency points are stored in asequence of monotonically increasing values. Each sequence isevaluated for a fixed setting of the system parameters and givena fixed level of excitation. For each frequency point, the timeneeded for frequency response measurement is chosen suffi-ciently large to ensure quasi-steady-state behavior. Under quasi-steady-state conditions, the frequency response between sinu-
Fig. 10. Bode diagrams of the nonlinear controller frequency responsefunctions C(j!); measured response (solid) versus simulated response(dashed).
soidal input and sinusoidal output is determined at each of thefrequency points sequentially.
In a combined frequency-domain approach, the outcome ofthe swept-sine measurement analysis is compared with the nu-merical results obtained from the describing function analysis.The effectiveness of such approach is demonstrated by assessingthe nonlinear controller contributions under different levels ofexcitation. Herein the controller transfer function is given by
(11)
(see also Fig. 8). Its frequency-domain behavior is depicted inFig. 10 in Bode representation.
394 IEEE TRANSACTIONS ON CONTROL SYSTEMS TECHNOLOGY, VOL. 14, NO. 3, MAY 2006
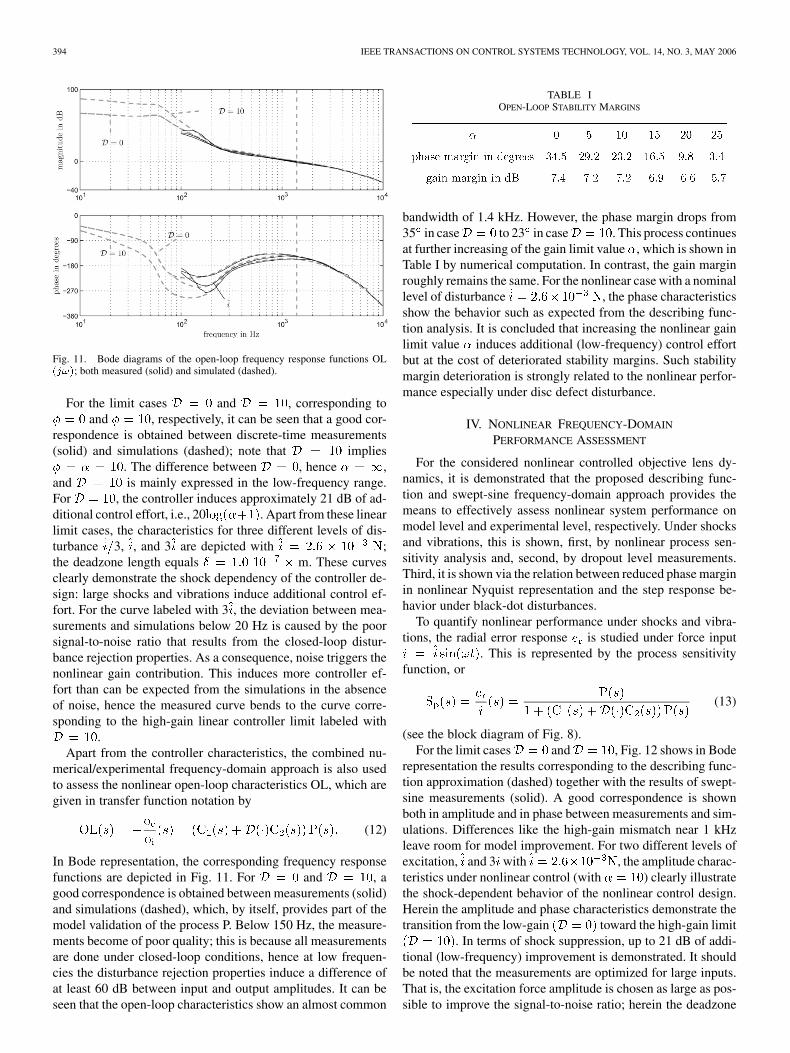
Fig. 11. Bode diagrams of the open-loop frequency response functions OL(j!); both measured (solid) and simulated (dashed).
For the limit cases and , corresponding toand , respectively, it can be seen that a good cor-
respondence is obtained between discrete-time measurements(solid) and simulations (dashed); note that implies
. The difference between , hence ,and is mainly expressed in the low-frequency range.For , the controller induces approximately 21 dB of ad-ditional control effort, i.e., 20 . Apart from these linearlimit cases, the characteristics for three different levels of dis-turbance 3, , and 3 are depicted with ;the deadzone length equals m. These curvesclearly demonstrate the shock dependency of the controller de-sign: large shocks and vibrations induce additional control ef-fort. For the curve labeled with 3 , the deviation between mea-surements and simulations below 20 Hz is caused by the poorsignal-to-noise ratio that results from the closed-loop distur-bance rejection properties. As a consequence, noise triggers thenonlinear gain contribution. This induces more controller ef-fort than can be expected from the simulations in the absenceof noise, hence the measured curve bends to the curve corre-sponding to the high-gain linear controller limit labeled with
.Apart from the controller characteristics, the combined nu-
merical/experimental frequency-domain approach is also usedto assess the nonlinear open-loop characteristics OL, which aregiven in transfer function notation by
(12)
In Bode representation, the corresponding frequency responsefunctions are depicted in Fig. 11. For and , agood correspondence is obtained between measurements (solid)and simulations (dashed), which, by itself, provides part of themodel validation of the process P. Below 150 Hz, the measure-ments become of poor quality; this is because all measurementsare done under closed-loop conditions, hence at low frequen-cies the disturbance rejection properties induce a difference ofat least 60 dB between input and output amplitudes. It can beseen that the open-loop characteristics show an almost common
TABLE IOPEN-LOOP STABILITY MARGINS
bandwidth of 1.4 kHz. However, the phase margin drops from35 in case to 23 in case . This process continuesat further increasing of the gain limit value , which is shown inTable I by numerical computation. In contrast, the gain marginroughly remains the same. For the nonlinear case with a nominallevel of disturbance , the phase characteristicsshow the behavior such as expected from the describing func-tion analysis. It is concluded that increasing the nonlinear gainlimit value induces additional (low-frequency) control effortbut at the cost of deteriorated stability margins. Such stabilitymargin deterioration is strongly related to the nonlinear perfor-mance especially under disc defect disturbance.
IV. NONLINEAR FREQUENCY-DOMAIN
PERFORMANCE ASSESSMENT
For the considered nonlinear controlled objective lens dy-namics, it is demonstrated that the proposed describing func-tion and swept-sine frequency-domain approach provides themeans to effectively assess nonlinear system performance onmodel level and experimental level, respectively. Under shocksand vibrations, this is shown, first, by nonlinear process sen-sitivity analysis and, second, by dropout level measurements.Third, it is shown via the relation between reduced phase marginin nonlinear Nyquist representation and the step response be-havior under black-dot disturbances.
To quantify nonlinear performance under shocks and vibra-tions, the radial error response is studied under force input
. This is represented by the process sensitivityfunction, or
(13)
(see the block diagram of Fig. 8).For the limit cases and , Fig. 12 shows in Bode
representation the results corresponding to the describing func-tion approximation (dashed) together with the results of swept-sine measurements (solid). A good correspondence is shownboth in amplitude and in phase between measurements and sim-ulations. Differences like the high-gain mismatch near 1 kHzleave room for model improvement. For two different levels ofexcitation, and 3 with , the amplitude charac-teristics under nonlinear control (with ) clearly illustratethe shock-dependent behavior of the nonlinear control design.Herein the amplitude and phase characteristics demonstrate thetransition from the low-gain toward the high-gain limit
. In terms of shock suppression, up to 21 dB of addi-tional (low-frequency) improvement is demonstrated. It shouldbe noted that the measurements are optimized for large inputs.That is, the excitation force amplitude is chosen as large as pos-sible to improve the signal-to-noise ratio; herein the deadzone
HEERTJES et al.: FREQUENCY-DOMAIN ANALYSIS OF NONLINEAR CONTROLLED OPTICAL STORAGE DRIVES 395
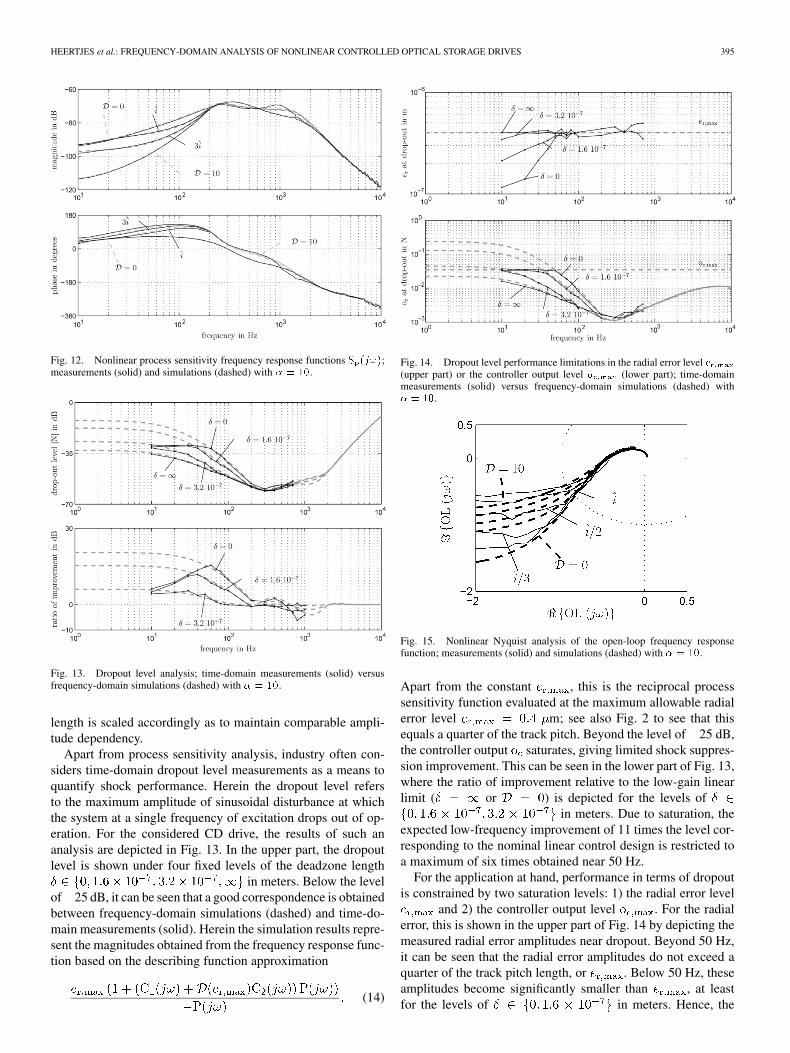
Fig. 12. Nonlinear process sensitivity frequency response functions S (j!);measurements (solid) and simulations (dashed) with � = 10.
Fig. 13. Dropout level analysis; time-domain measurements (solid) versusfrequency-domain simulations (dashed) with � = 10.
length is scaled accordingly as to maintain comparable ampli-tude dependency.
Apart from process sensitivity analysis, industry often con-siders time-domain dropout level measurements as a means toquantify shock performance. Herein the dropout level refersto the maximum amplitude of sinusoidal disturbance at whichthe system at a single frequency of excitation drops out of op-eration. For the considered CD drive, the results of such ananalysis are depicted in Fig. 13. In the upper part, the dropoutlevel is shown under four fixed levels of the deadzone length
in meters. Below the levelof 25 dB, it can be seen that a good correspondence is obtainedbetween frequency-domain simulations (dashed) and time-do-main measurements (solid). Herein the simulation results repre-sent the magnitudes obtained from the frequency response func-tion based on the describing function approximation
(14)
Fig. 14. Dropout level performance limitations in the radial error level e(upper part) or the controller output level o (lower part); time-domainmeasurements (solid) versus frequency-domain simulations (dashed) with� = 10.
Fig. 15. Nonlinear Nyquist analysis of the open-loop frequency responsefunction; measurements (solid) and simulations (dashed) with � = 10.
Apart from the constant , this is the reciprocal processsensitivity function evaluated at the maximum allowable radialerror level m; see also Fig. 2 to see that thisequals a quarter of the track pitch. Beyond the level of 25 dB,the controller output saturates, giving limited shock suppres-sion improvement. This can be seen in the lower part of Fig. 13,where the ratio of improvement relative to the low-gain linearlimit ( or ) is depicted for the levels of
in meters. Due to saturation, theexpected low-frequency improvement of 11 times the level cor-responding to the nominal linear control design is restricted toa maximum of six times obtained near 50 Hz.
For the application at hand, performance in terms of dropoutis constrained by two saturation levels: 1) the radial error level
and 2) the controller output level . For the radialerror, this is shown in the upper part of Fig. 14 by depicting themeasured radial error amplitudes near dropout. Beyond 50 Hz,it can be seen that the radial error amplitudes do not exceed aquarter of the track pitch length, or . Below 50 Hz, theseamplitudes become significantly smaller than , at leastfor the levels of in meters. Hence, the

396 IEEE TRANSACTIONS ON CONTROL SYSTEMS TECHNOLOGY, VOL. 14, NO. 3, MAY 2006
Fig. 16. Time responses under black-dot disturbances.
radial error levels are no longer solely responsible for dropout,which is now also due to saturation in the controller output ;saturation in the controller output induces higher harmonics forwhich the controlled system at the given level of excitation istoo sensitive. This is clearly shown in the lower part of Fig. 14,where the measured time-domain controller output amplitudesnear dropout are depicted together with the controller frequencyresponse functions evaluated at the constant radial error level
, or
(15)
It can be seen that below 50 Hz, the amplitudes are restrictedby the level mN. At this level, equals 1.6 V,which represents the maximum attainable voltage at which theintegrated controller circuits operate.
In addition to shocks and vibrations, performance under discdefect disturbance, which is related to reduced phase margins,can be studied using the Nyquist representation of Fig. 15. Herethe open-loop frequency response functions related to (12) aredepicted at three different levels of excitation, i.e., the nominallevel , 2, and 3. Additionally, the limitcases and are shown. The Nyquist represen-tation emphasizes the differences between measurements andsimulations by considering both mismatches in phase as wellas in the amplitude characteristics. Nevertheless, the transitionfrom the low-gain toward the high-gain limitis clearly shown in terms of reduced phase margins. It shouldbe noted that the curves correspond to sufficiently large levelsof excitation, the kind of excitation that normally would inducesignificant additional controller effort, hence (low-frequency)shock suppression. For the given nonlinear control design, it canbe seen that the gain margins remain largely unaffected; see alsoTable I.
In terms of performance, deteriorated phase margins causedeteriorated time responses under disc defect disturbance.This is demonstrated in experiments in Fig. 16 for an 800 mblack-dot disturbance; see Helvoirt et al. [8] for other typesof disc defect disturbance and their characteristics. Along theblack dot, light is no longer reflected from the disc surface suchthat the radial error signal equals zero. As a consequence, astep response can be observed beyond the black dot crossingwhere the radial error signal is fully restored. For and
, it can be seen that differences occur in terms ofdamped natural frequency and damping ratio. This is related to
the most significant closed-loop poles 7.7 10 1.1 10(for the case that ) and 1.4 10 4.0 10 (for thecase that ), respectively, which are obtained from theobjective lens model and which are represented in Fig. 16 by thecorresponding exponential envelopes. The time response undernonlinear control, which is also depicted in Fig. 16, shows thecombined effect of these linear time-domain characteristics.For the considered value m, it can be seen thatthe response tends to the low-gain limit response correspondingto except for large values of the radial error signal. For
m, the response tends more to the casefor large errors (right after the black-dot crossing). As soon asthe radial error signal becomes small enough, a transition isshown toward the low-gain limit response.
In summary, the combined numerical/experimental analysissuch as considered in this section is shown to be both accu-rate and efficient in quantifying nonlinear system performance.Based on a clear interpretation in terms of frequency responsefunctions, it provides a necessary means to quantify the shockdependency of the nonlinear control design in the frequency do-main. It also contributes to the understanding of the time-do-main behavior under disc defect disturbances and allows for aclear physical interpretation of the nonlinear controller’s pos-sibilities and requirements for implementation. This supportsthe choice of nonlinearity in addressing both shock suppres-sion and noise sensitivity along with its ability to enhance per-formance beyond the design limitations otherwise encounteredunder linear control.
V. CONCLUSIONS
For the purpose of model validation, estimation, and per-formance assessment of the considered class of nonlinear con-trolled systems, an efficient and accurate frequency-domain ap-proach is presented. The approach consists of a numerical de-scribing function method in combination with swept-sine mea-surements and is applied to a nonlinear controlled optical play-back (CD drive) device.
The validity of the describing function approximation in as-sessing nonlinear system behavior is studied in the time domain.For the system at hand, a good correspondence is obtained be-tween time-domain measurements obtained from an industrialsetup and the nonlinear responses obtained from numericallysolving the full nonlinear equations of motion. This clearly illus-trates the validity of the simplified objective lens model. In terms
HEERTJES et al.: FREQUENCY-DOMAIN ANALYSIS OF NONLINEAR CONTROLLED OPTICAL STORAGE DRIVES 397
of amplitudes and phases, the simulated nonlinear responsessubsequently show a good correspondence with the approxima-tive harmonic responses obtained from the describing functionanalysis.
In the frequency domain, nonlinear controller and open-loopfrequency response functions together with nonlinear processsensitivities are measured under different levels of excitationand compared with describing function-based simulations. Theresults show a good correspondence between measurements andsimulations, which, subsequently, indicates a proper controllerimplementation. The shock dependency of the control designis demonstrated along with the corresponding deterioration ofphase margins and its relation to deteriorated time responsesunder black-dot disturbances. The results indicate up to 21 dB ofpotentially improved (low-frequency) shock suppression whichis balanced by a phase margin reduction from 35 to 23 .
The effectiveness of the considered frequency-domain ap-proach is given by the possibility to access both amplitude andphase characteristics under different nonlinear settings in atime-efficient manner. This allows for both analysis and finger-printing of the nonlinear system behavior. In case of dropoutlevel measurement analysis, this leads to the conclusion thatperformance is limited either by a maximum radial error levelof a quarter of the track pitch, hence a physical limitation, orby saturation in the controller output level, hence a limitationin the current controller implementation.
REFERENCES
[1] B. Armstrong, D. Neevel, and T. Kusid, “New results in NPID control:tracking, integral control, friction compensation and experimental re-sults,” IEEE Trans. Contr. Syst. Technol., vol. 9, no. 2, pp. 399–406, Mar.2001.
[2] S. Bittanti, F. Dell’Orto, A. Di Carlo, and S. M. Savaresi, “Notch filteringand multirate control for radial tracking in high-speed DVD-players,”IEEE Trans. Consum. Electron., vol. 48, no. 1, pp. 56–62, Feb. 2002.
[3] R. W. Brockett, “The status of stability theory for deterministic systems,”IEEE Trans. Autom. Control, vol. AC-11, no. 3, pp. 596–606, Jul. 1966.
[4] J. Freudenberg, R. Middleton, and A. Stefanopoulou, “A survey of in-herent design limitations,” in Proc. Amer. Control Conf., Chicago, IL,2000, pp. 2987–3001.
[5] V. Fromion and G. Scorletti, “Performance and robustness analysis ofnonlinear closed-loop systems using � analysis: Applications to non-linear PI controllers,” in Proc. 41st IEEE Conf. Decision Control, LasVegas, NV, 2002, pp. 2480–2485.
[6] M. F. Heertjes and F. B. Sperling, “A nonlinear dynamic filter to improvedisturbance rejection in optical storage drives,” in Proc. 42nd Conf. De-cision Control, Maui, HI, 2003, pp. 3426–3430.
[7] M. F. Heertjes and M. Steinbuch, “Stability and performance of a vari-able gain controller with application to a DVD storage drive,” Auto-matica, vol. 40, pp. 591–602, 2004.
[8] J. van Helvoirt, G. A. L. Leenknegt, M. Steinbuch, and H. J. Goossens,“Classifying disc defects in optical disc drives by using time-seriesclustering,” in Proc. Amer. Control Conf., Boston, MA, 2004, pp.3100–3105.
[9] F. Jiang and Z. Gao, “An application of nonlinear PID control to a classof truck ABS problems,” in Proc. 40th IEEE Conf. Decision Control,Orlando, FL, 2001, pp. 516–521.
[10] G. A. Leonov, D. V. Ponomarenko, and V. B. Smirnova, Frequency-Do-main Methods for Nonlinear Analysis—Theory and Applications. Sin-gapore: World Scientific, 1996.
[11] S. Sastry, Nonlinear Systems; Analysis, Stability, and Control. NewYork: Springer-Verlag, 1999.
[12] S. G. Stan, The CD-ROM Drive; a Brief System Description. Dor-drecht, The Netherlands: Kluwer, 1998.
[13] M. Steinbuch and M. L. Norg, “Advanced motion control: An industrialperspective,” Eur. J. Contr., vol. 4, pp. 278–293, 1998.
Marcel Heertjes received the M.Sc. and Ph.D.degrees in mechanical engineering from EindhovenUniversity of Technology, Eindhoven, The Nether-lands, in 1995 and 1999, respectively.
In 2000, he joined Philips Applied Technologies,Eindhoven, where he mainly worked on nonlinearcontrol for improved performance in optical storagedrives with application to the automotive industryand active vibration isolation of metrology frameswithin the semiconductor industry. Since 2005, hehas been subcontracted to ASML, where he works on
iterative learning control of stages. He has published approximately 30 refereedpapers and has received ten patents. His main focus is on the development andapplication of nonlinear control and dynamics in industry.
Erik Pastink was born in Amsterdam, The Nether-lands, in 1978. He received the M.Sc. degree inmechanical engineering (cum laude) from Eind-hoven University of Technology, Eindhoven, TheNetherlands, in 2004.
The work for his thesis, entitled “Stability andPerformance of Variable Gain Controlled OpticalStorage Drives,” was carried out at Philips AppliedTechnologies. Currently, he is a MechatronicsDesign Engineer with the R&D Department, OcéTechnologies, Venlo, The Netherlands.
Mr. Pastink received the Unilever Research Award in 2005 and the RoyalInstitution of Engineers’ Control Award in 2005.
Nathan van de Wouw received the M.Sc. and Ph.D.degrees in mechanical engineering from EindhovenUniversity of Technology, Eindhoven, The Nether-lands, in 1994 and 1999, respectively.
He joined the Philips Centre for IndustrialTechnology, The Netherlands, in 2000 and theNetherlands Organization for Applied ScientificResearch in 2001. In 1999 he joined the Dynamicsand Control group of the Department of MechanicalEngineering, Eindhoven University of Technology,as an Assistant Professor. His current research
interests are the dynamics and control of nonsmooth systems.
Henk Nijmeijer (F’99) received the M.Sc. andPh.D. degrees in mathematics from the Universityof Groningen, Groningen, The Netherlands, in 1979and 1983, respectively.
From 1983 to 2000, he was with the Departmentof Applied Mathematics, University of Twente,Enschede, The Netherlands. Since 1997, he wasalso part-time with the Department of MechanicalEngineering, Eindhoven University of Technology,Eindhoven, The Netherlands. Since 2000, he hasbeen a full Professor at Eindhoven, where he chairs
the Dynamics and Control section. He has published a number of journal andconference papers and several books, including (with A. J. van der Schaft)Nonlinear Dynamical Control Systems (Springer-Verlag, 1990), (with A.Rodriguez) Synchronization of Mechanical Systems (World Scientific, 2003),and (with R. I. Leine) Dynamics and Bifurcations of Non-Smooth MechanicalSystems (Springer-Verlag, 2004). He is Editor-in-Chief of the Journal ofApplied Mathematics, Corresponding Editor of the SIAM Journal on Controland Optimization, and a Board Member of the International Journal of Control,Automatica, European Journal of Control, Journal of Dynamical ControlSystems, SACTA, International Journal of Robust and Nonlinear Control, andJournal of Applied Mathematics and Computer Science.
Prof. Nijmeijer received the Institution of Electrical Engineers Heaviside pre-mium in 1990.