Embed Size (px)
Citation preview
Biophysical Journal Volume 98 February 2010 505–514 505
Immune Response Modeling of Interferon b-Pretreated InfluenzaVirus-Infected Human Dendritic Cells
Liang Qiao,†‡6 Hannah Phipps-Yonas,§{6 Boris Hartmann,†‡ Thomas M. Moran,‡§{ Stuart C. Sealfon,†‡{*and Fernand Hayot†‡
†Department of Neurology, ‡Center for Translational Systems Biology, §Department of Microbiology, and {Center for Investigating ViralImmunity and Antagonism, Department of Microbiology, Mount Sinai School of Medicine, New York, New York
ABSTRACT The pretreatment of human dendritic cells with interferon-b enhances their immune response to influenza virusinfection. We measured the expression levels of several key players in that response over a period of 13 h both during pretreat-ment and after viral infection. Their activation profiles reflect the presence of both negative and positive feedback loops ininterferon induction and interferon signaling pathway. Based on these measurements, we have developed a comprehensivecomputational model of cellular immune response that elucidates its mechanism and its dynamics in interferon-pretreateddendritic cells, and provides insights into the effects of duration and strength of pretreatment.
INTRODUCTION
Dendritic cells (DCs) are essential in the establishment of the
innate immune response and the triggering of adaptive
immunity (1). Activated DCs undergo a process of matura-
tion involving the upregulation of major histocompatibility
complex molecules, secretion of various cytokines and che-
mokines, and migration to draining lymph nodes to activate
T-cells (2).
DCs can detect and respond to viral infection through two
different pathways: a Toll-like-receptor (TLR)-dependent
and a TLR-independent pathway. The TLR-dependent
pathway utilizes TLR 3, 7/8, and 9 to recognize extracellular
or endosomal viral double-stranded RNA, single-stranded
RNA, and CpG DNA, respectively (3). The TLR-indepen-
dent pathway includes melanoma-differentiation-associated
gene-5 and retinoic-acid-inducible gene-I (RIG-I), which
both detect cytoplasmic double-stranded RNA, whereas
RIG-I also recognizes 50-triphosphate RNAs (4,5). Regard-
less of which pathway is followed, DC activation entails
the induction and secretion of type I interferon (IFN), which
plays a key role in the antiviral immune response (6).
Secreted type I IFN activates the janus kinase/signal trans-
ducer and activator of transcription (JAK/STAT) pathway
in the same cell or other cells through an autocrine or a para-
crine loop similar to that described in Shvartsman et al. (7).
The activation of the IFN-signaling pathway establishes an
antiviral state in target cells by inducing the transcription
of numerous IFN-responsive genes (8).
All pathogenic viruses have developed various strategies
to partially block and circumvent the IFN response (9). It
is expected that the innate immune system has similarly
devised mechanisms to overcome viral inhibitory effects.
Submitted June 28, 2009, and accepted for publication October 30, 2009.6Liang Qiao and Hannah Phipps-Yonas contributed equally to this work.
*Correspondence: [email protected]
Editor: Herbert Levine.
� 2010 by the Biophysical Society
0006-3495/10/02/0505/10 $2.00
In vitro experiments have shown that the secretion of type
I IFN from DCs after influenza infection is effectively
blocked by the influenza NS1 protein, a potent IFN antago-
nist (10,11). However, the corresponding immune response
is strong (12), suggesting that the antagonism is somehow
overcome in vivo. This could result from exposure of
immune cells to IFN before virus encounter, which has
been shown to enhance the DC response to virus challenges
(13–16). Moreover, in a mouse model of influenza infection,
we have evidence that monocytes recruited to the site of
infection display an interferon signature before exposure to
virus in the lungs (T. Hermesh, B. Moltedo, T. M. Moran,
and C. B. Lopez, unpublished). It is possible that the inter-
feron may be released by plasmacytoid DCs (pDCs) (16).
A recent study also indicates that cytokines/chemokines
secreted from virus-infected DCs, including type I IFNs,
could induce a primed state among the uninfected DCs
through paracrine signaling, making these DCs more resis-
tant and more responsive to future infection than naıve
DCs (17). Since IFN pretreatment of DCs alone does not
induce IFNs, the enhanced IFN induction in IFN-pretreated
DCs after virus infection must be attributed to the upregula-
tion of one or more IFN-stimulated genes. To elucidate the
mechanisms underlying cellular responses to IFN exposure
and virus infection, we constructed a comprehensive model
of the cellular immune response.
Interferon regulatory factor (IRF) 7 is one of the IFN-
stimulated genes that has been reported as a key regulator
of type I IFN induction in mouse embryonic fibroblasts
and pDCs (18). IRF7 functions as an important component
of the positive feedback loop for virus-triggered type I
IFN induction (19,20). It is induced through the JAK/
STAT pathway upon IFN stimulation (19,21) and activated
through the RIG-I signaling pathway, similar to IRF3
(22). Phosphorylated IRF7 (IRF7P) translocates into the
nucleus in the form of a homodimer or heterodimer with
doi: 10.1016/j.bpj.2009.10.049
506 Qiao et al.
phosphorylated IRF3 (23,24) and enhances both IFN-b and
IFN-a induction (18,19,21,25). We consider the upregula-
tion of IRF7 to be the main cause of enhanced IFN induc-
tion in IFN-pretreated human DCs infected by the influenza
PR8 virus.
The IFN signaling pathway itself has been extensively
studied (see review in Platanias (26)) and modeled (27,28),
but its involvement in the positive feedback, and in particular
the role played by IRF7 in the context of virus-triggered type
I IFN induction, has not been well characterized. Our math-
ematical model integrates IFN-induced IRF7 production and
virus-triggered IFN induction. It encompasses IFN secretion
into extracellular space, receptor activation, and cytoplasmic
and nuclear reactions tied together through feedback loops. It
is the first model—to the best of our knowledge—that
attempts such a comprehensive description of the dynamics
of the immune response. From a methodological standpoint,
the model is distinguished by the fact that its elements are
limited, as much as possible, to those components, proteins
or mRNA, that are actually being measured in IFN-pre-
treated human DCs infected by PR8. We obtained quantita-
tive real-time polymerase chain reaction (qRT-PCR),
enzyme-linked immunosorbent assay (ELISA), and high-
resolution imaging flow cytometry measurements in both
the pretreatment regime and after viral infection over a
time span of 13 h. The corresponding time courses of
multiple key mediating species in the type I IFN induction
loop provide strong constraints on model building. These
constraints are much more stringent than those imposed by
the known monotonously increasing IFN-a/b concentrations,
because some time courses, such as that of nuclear phosphor-
ylated STAT (STATPn), show sizable variations within the
observed time span (see Fig. 2). Our modeling results predict
two important saturation threshold values for in vitro IFN
pretreatment dosage and pretreatment time and provide
insight into the in vivo DC temporal responses to virus
infection.
MATERIALS AND METHODS
Experiments
Isolation and culture of human DCs
Peripheral blood mononuclear cells were isolated by Ficoll density gradient
centrifugation (Histopaque, Sigma Aldrich, St. Louis, MO) from buffy coats
of healthy anonymous human donors (New York Blood Center, New York,
NY). CD14þ cells were immunomagnetically purified using anti-human-
CD14 antibody-labeled magnetic beads and iron-based Midimacs LS
columns (Miltenyi Biotec, Bergisch Gladbach, Germany). After elution
from the columns, CD14þ cells were plated (1 � 106 cells/ml) in DC
medium (RPMI (Invitrogen, Carlsbad, CA), 10% fetal calf serum (HyClone,
Logan, UT) or 4% human serum (Cambrex, East Rutherford, NJ), 100 U/ml
penicillin, and 100 mg/ml streptomycin (Invitrogen)) supplemented with
500 U/ml human granulocyte-macrophage colony-stimulating factor
(Peprotech, Rocky Hill, NJ) and 1000 U/ml human interleukin-4 (IL-4)
(Peprotech). Cells were incubated for 5–6 days at 37�C. Our cultured DCs
were routinely 95–98% positive for CD11c as tested by flow cytometry.
Biophysical Journal 98(4) 505–514
Infection and treatment of DCs
After 5–6 days in culture, the conventional DCs were pretreated for 3 h with
200 U/ml IFN-b (PBL, Piscataway, NJ) or left alone. After 3 h, both non-
treated and IFN-treated cells were spun down and medium was completely
removed. Cells were resuspended in DC media (RPMI (Invitrogen), 4%
human serum (Cambrex), 100 U/ml penicillin, and 100 mg/ml streptomycin
(Invitrogen)) at 1 � 106 cells/ml. The samples were split in two, one of each
sample infected with influenza PR8 virus at a multiplicity of infection of 0.5.
At the time point listed, cells were removed from total samples for qRT-
PCR, ELISA, and high-resolution imaging flow cytometry quantification.
Depending on the experiment, the time points of infection examined were
2 and 1 h before infection, immediately before infection, and either 2, 6,
and 10 h or 2, 4, 6, and 8 h after infection.
Imaging flow cytometry
Cells were fixed in a final concentration of 1.5% paraformaldehyde (Sigma
Aldrich). After fixation, cells were permeabilized with 100% methanol for
15 min at 25�C and washed three times with staining buffer (BD Biosci-
ences, San Jose, CA). Samples were then incubated with monoclonal anti-
bodies against STAT1 and phosphorylated STAT1 (BD, Franklin Lakes,
NJ) and DRAQ-5, a nuclear dye (Biostatus, Shepshed, UK). Cells were
then assayed with the Image Stream 100 (Amnis, Seattle, WA) imaging
flow cytometer. The degree of phosphorylation of STAT1, as well as the
degree of nuclear translocation of STAT1 or phosphorylated STAT1, was
analyzed with the help of the IDEAS software (Amnis). The increase of fluo-
rescence caused by the fluorophore conjugated antibody against phosphory-
lated STAT1 was used as a measurement for the phosphorylation of STAT1.
A normalized Pearson’s correlation of the pixel intensities of the nuclear dye
and STAT1 or phosphorylated STAT1 was used to calculate a translocation
score. The degree of translocation was then calculated by the difference of
the medians of the translocation scores of a specific time point minus the
negative control sample divided by the sum of standard deviations of both
samples.
Capture ELISAs
Supernatants were isolated after cell pelleting, and capture ELISAs for
IFN-a were performed according to the manufacturer’s protocol (PBL).
Plates were read in an ELISA reader from Biotek Instruments, Winooski,
VT. All samples were assayed in duplicate or triplicate.
RNA extraction from human DCs
Samples of at least 0.5 � 106 cells/sample were pelleted, and RNA was iso-
lated and treated with DNase by using an Absolutely RNA RT-PCR micro-
prep kit (Stratagene, La Jolla, CA) according to the manufacturer’s protocol.
RNA was quantified using a Nanodrop spectrophotometer (Nanodrop Tech-
nologies, Wilmington, DE).
Quantitative real-time PCR
qRT-PCR of the extracted RNAs was performed by using a previously pub-
lished SYBR green protocol (11) with an ABI7900 HT thermal cycler by the
Mount Sinai Quantitative PCR Shared Research Facility. Each transcript in
each sample was assayed in triplicate, and the mean cycle threshold was used
to calculate the x-fold change and control changes for each gene. Three
housekeeping genes (actin, Rps11, and tubulin) were used for global
normalization in each experiment. Data validity was determined by
modeling of reaction efficiencies and analysis of measurement precision,
as described previously (11).
MODEL
Our goal is to develop a model of type I IFN induction in
IFN-pretreated DCs after virus infection. Instead of
IRF7
IFNAR
SOCS PTPsTyk2/JAK1*
STATPSTAT
SOCS IRF7
IRF7P
PTPsn
STATP(2)
Virus
IFN-β
IFN-β
IFN-α
IFN-α
IFN-β
IFN-α
RIG-Isignaling
IFN-β(from pretreatment)
Nucleus
Cytoplasm
Media
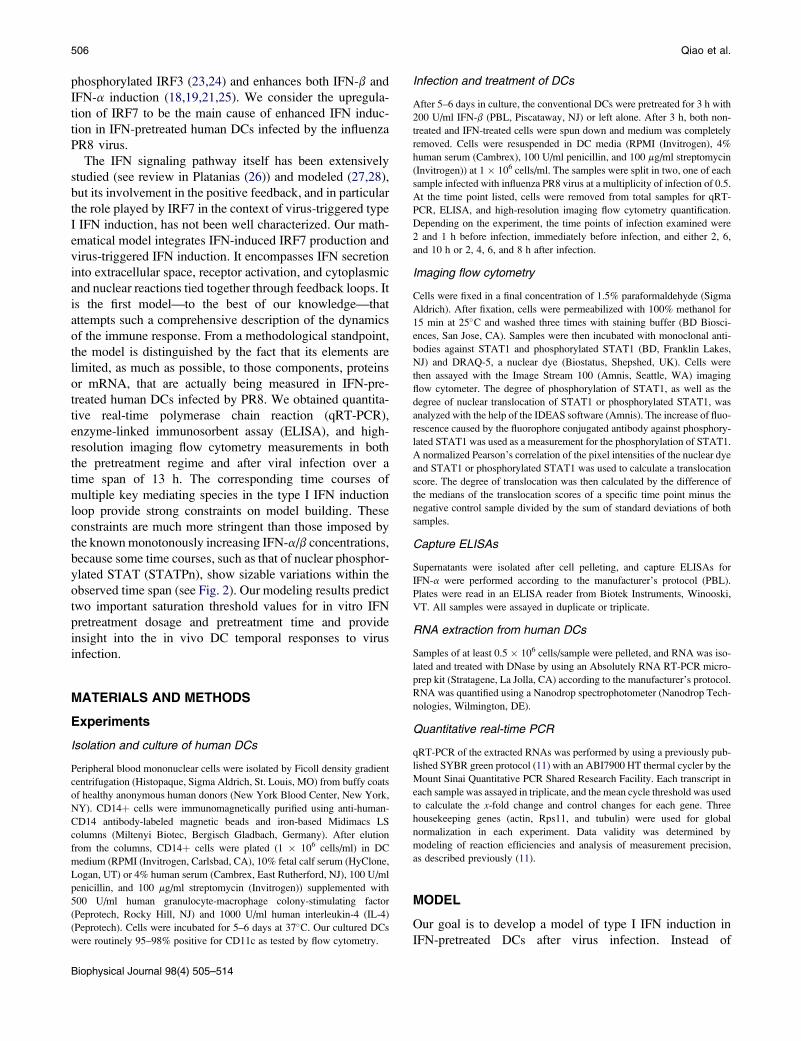
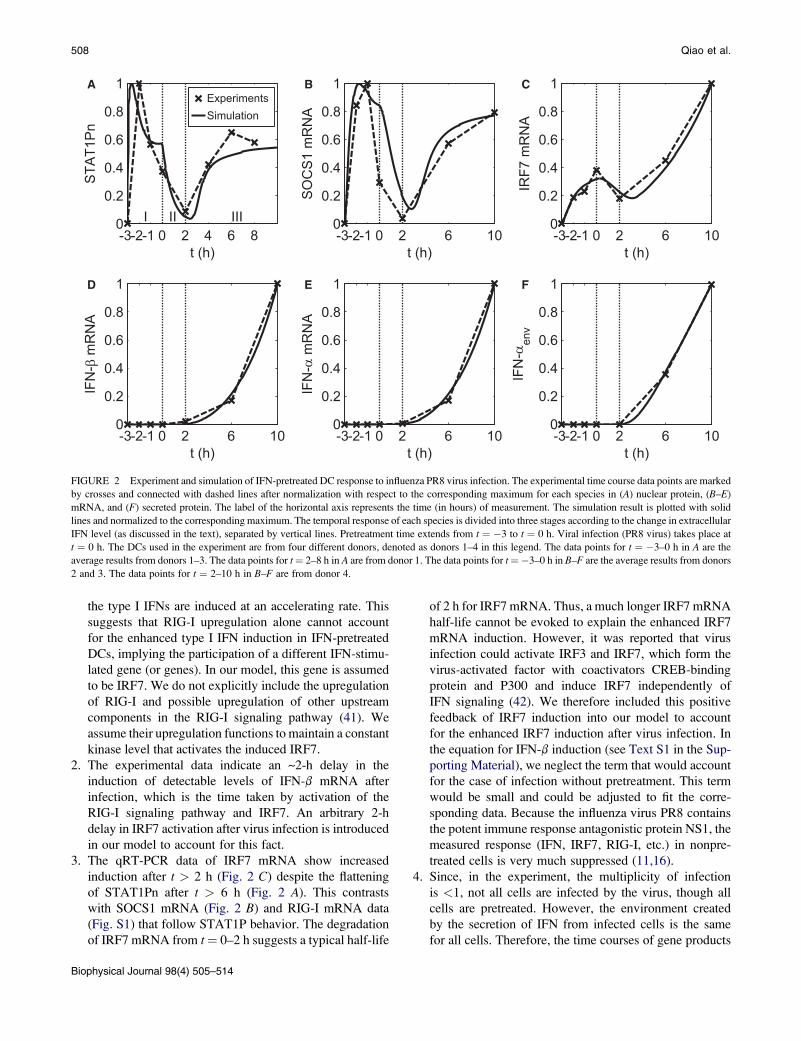
FIGURE 1 Induction of IFNs after virus infection in
IFN-b pretreated human DCs. IFN-b, after binding to
IFNAR, engages the JAK/STAT pathway, leading to
STAT phosphorylation and production of IRF7 and
SOCS. The latter acts back negatively on JAK/STAT
pathway activation. Viral infection is detected by RIG-I
and leads via IRF7 activation to induction and secretion
of IFN-b/a, which bind to IFNAR in a positive feedback
loop. Protein tyrosine phosphatases (PTPs) act in the cyto-
plasm and nucleus.
Immune Response Modeling 507
constructing an extensive model by assembling all the avail-
able information from the literature, we take the approach of
modeling the measured temporal behavior of only a few
known key mediators of the IFN response to virus infection.
The model, with a minimal number of free parameters, aims
to capture the essential characteristics of the experimental
time course data. For simplicity, various assumptions are
made. For example, STAT1 and STAT2 are not differenti-
ated and are modeled as one species denoted STAT.
A detailed discussion of the reaction network and derivation
of the equations for our model can be found in the Support-
ing Material.
As shown in the network in Fig. 1, when DCs are pre-
treated with IFN, IFN binds to the IFN-a/b receptors
(IFNARs) and activates the receptor-associated kinase
JAK1 and Tyk2 (29–31). STATs (STAT1 and STAT2)
are recruited to the activated receptor complex and phos-
phorylated (32). Phosphorylated STAT (STATP) dimers
(including STAT1P homodimer and STAT1P/STAT2P
heterodimer) translocate into the nucleus (29,33,34). The
STATP dimers are subject to dephosphorylation in the
nucleus by protein tyrosine phosphatases (PTPs) (35,36).
Nuclear STATP dimers lead to the induction of suppressor
of cytokine signaling (SOCS) genes (such as SOCS1, medi-
ated through IRF1 (37)). Induced SOCS proteins inhibit the
kinase activity of the receptor complex (e.g., by interacting
with either Tyk2 or IFNAR1 (38)) and negatively regulate
the IFN signaling pathway. IRF7 is induced by the inter-
feron-stimulated gene factor 3 consisting of STAT1P,
STAT2P, and IRF9 (19,21).
When DCs are infected with influenza virus after IFN
pretreatment, its detection by RIG-I triggers the RIG-I
signaling pathway, leading to the activation and subsequent
nuclear translocation of IRF7 (22–24) and other enhanceo-
some components (39). In the nucleus, the activated enhan-
ceosome components bind to the IFN-b promoter in a
cooperative manner to form the enhanceosome, which
promotes the induction of the IFN-b gene (40). IRF7P also
promotes the induction of various IFN-a genes (18,19,25).
Induced IFN-a and IFN-b are secreted in the media and
are capable of binding to the IFN receptors of the same
cell or other cells through an autocrine or a paracrine loop.
The final form of the model (see Text S2 in the Supporting
Material) consists of eight coupled ordinary differential equa-
tions (ODEs) for the eight concentrations STATP(2)n (phos-
phorylated STAT dimer in the nucleus), SOCSm (SOCS
mRNA), IRF7m (IRF7 mRNA), IRF7Pn (phosphorylated
IRF7 in the nucleus), IFN-bm and IFN-benv (IFN-b mRNA
and IFN-b in the environment), and IFN-am and IFN-aenv
(IFN-a mRNA and IFN-a in the environment). These equa-
tions contain 19 parameters, of which 14 are fixed at values
derived from biological considerations and five are used in
fitting the eight model equations to the experimental data
points, of which there are 29. The time courses of six model
concentrations, namely STAT1Pn, SOCS1 mRNA, IRF7
mRNA, IFN-b mRNA, IFN-a mRNA, and IFN-aenv (see
Fig. 2), were directly experimentally measured with seven,
six, six, five, three, and two data points, respectively, available
for parameter estimation. The experimental data of STAT1Pn,
SOCS1 mRNA, and IRF7 mRNA show a rich temporal struc-
ture that constrains the parameters used in the fit.
Some important remarks concerning our model are:
1. Our qRT-PCR data show that RIG-I is upregulated in
a manner similar to that of SOCS1 and IRF7 upon IFN
stimulation (Fig. S1), possibly as a result of shared induc-
tion by a complex associated with phosphorylated STATs.
As RIG-I functions as the viral sensor of the RIG-I
signaling pathway, it is possible that its upregulation could
contribute to the enhanced induction of type I IFNs in IFN-
pretreated DCs. However, data from a separate study on
human DCs (J. Hu and J. Wetmur, unpublished) indicate
that the protein levels of the IFN enhanceosome com-
ponents downstream of RIG-I other than IRF7P (e.g.,
phosphorylated IRF3) do not show significant increase
with RIG-I upregulation after virus infection, whereas
Biophysical Journal 98(4) 505–514
-3-2-1 0 2 4 6 80
0.2
0.4
0.6
0.8
1
I II III
t (h)
STA
T1P
nA
ExperimentsSimulation
-3-2-1 0 2 6 100
0.2
0.4
0.6
0.8
1
t (h)
SO
CS
1 m
RN
A
B
-3-2-1 0 2 6 100
0.2
0.4
0.6
0.8
1
t (h)
IRF7
mR
NA
C
-3-2-1 0 2 6 100
0.2
0.4
0.6
0.8
1
t (h)
IFN
-β m
RN
A
D
-3-2-1 0 2 6 100
0.2
0.4
0.6
0.8
1
t (h)
IFN
-α m
RN
AE
-3-2-1 0 2 6 100
0.2
0.4
0.6
0.8
1
t (h)
IFN
-αen
v
F
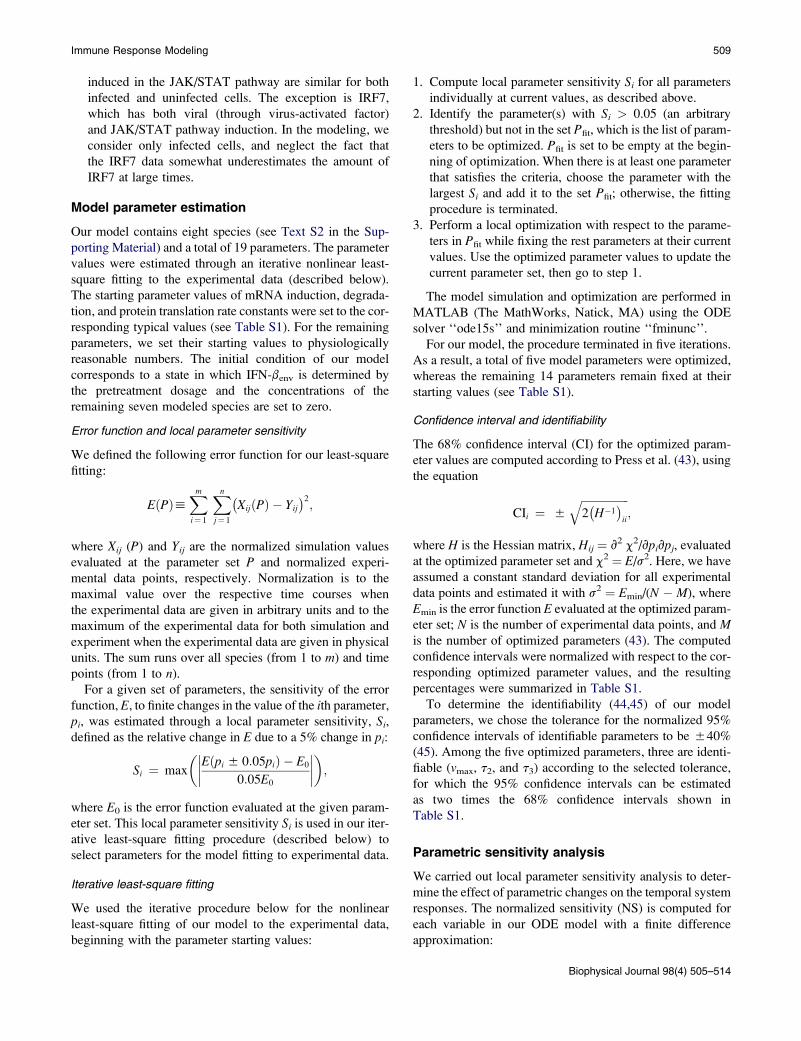
FIGURE 2 Experiment and simulation of IFN-pretreated DC response to influenza PR8 virus infection. The experimental time course data points are marked
by crosses and connected with dashed lines after normalization with respect to the corresponding maximum for each species in (A) nuclear protein, (B–E)
mRNA, and (F) secreted protein. The label of the horizontal axis represents the time (in hours) of measurement. The simulation result is plotted with solid
lines and normalized to the corresponding maximum. The temporal response of each species is divided into three stages according to the change in extracellular
IFN level (as discussed in the text), separated by vertical lines. Pretreatment time extends from t ¼ �3 to t ¼ 0 h. Viral infection (PR8 virus) takes place at
t ¼ 0 h. The DCs used in the experiment are from four different donors, denoted as donors 1–4 in this legend. The data points for t ¼ �3–0 h in A are the
average results from donors 1–3. The data points for t¼ 2–8 h in A are from donor 1. The data points for t¼�3–0 h in B–F are the average results from donors
2 and 3. The data points for t ¼ 2–10 h in B–F are from donor 4.
508 Qiao et al.
the type I IFNs are induced at an accelerating rate. This
suggests that RIG-I upregulation alone cannot account
for the enhanced type I IFN induction in IFN-pretreated
DCs, implying the participation of a different IFN-stimu-
lated gene (or genes). In our model, this gene is assumed
to be IRF7. We do not explicitly include the upregulation
of RIG-I and possible upregulation of other upstream
components in the RIG-I signaling pathway (41). We
assume their upregulation functions to maintain a constant
kinase level that activates the induced IRF7.
2. The experimental data indicate an ~2-h delay in the
induction of detectable levels of IFN-b mRNA after
infection, which is the time taken by activation of the
RIG-I signaling pathway and IRF7. An arbitrary 2-h
delay in IRF7 activation after virus infection is introduced
in our model to account for this fact.
3. The qRT-PCR data of IRF7 mRNA show increased
induction after t > 2 h (Fig. 2 C) despite the flattening
of STAT1Pn after t > 6 h (Fig. 2 A). This contrasts
with SOCS1 mRNA (Fig. 2 B) and RIG-I mRNA data
(Fig. S1) that follow STAT1P behavior. The degradation
of IRF7 mRNA from t¼ 0–2 h suggests a typical half-life
Biophysical Journal 98(4) 505–514
of 2 h for IRF7 mRNA. Thus, a much longer IRF7 mRNA
half-life cannot be evoked to explain the enhanced IRF7
mRNA induction. However, it was reported that virus
infection could activate IRF3 and IRF7, which form the
virus-activated factor with coactivators CREB-binding
protein and P300 and induce IRF7 independently of
IFN signaling (42). We therefore included this positive
feedback of IRF7 induction into our model to account
for the enhanced IRF7 induction after virus infection. In
the equation for IFN-b induction (see Text S1 in the Sup-
porting Material), we neglect the term that would account
for the case of infection without pretreatment. This term
would be small and could be adjusted to fit the corre-
sponding data. Because the influenza virus PR8 contains
the potent immune response antagonistic protein NS1, the
measured response (IFN, IRF7, RIG-I, etc.) in nonpre-
treated cells is very much suppressed (11,16).
4. Since, in the experiment, the multiplicity of infection
is <1, not all cells are infected by the virus, though all
cells are pretreated. However, the environment created
by the secretion of IFN from infected cells is the same
for all cells. Therefore, the time courses of gene products
Immune Response Modeling 509
induced in the JAK/STAT pathway are similar for both
infected and uninfected cells. The exception is IRF7,
which has both viral (through virus-activated factor)
and JAK/STAT pathway induction. In the modeling, we
consider only infected cells, and neglect the fact that
the IRF7 data somewhat underestimates the amount of
IRF7 at large times.
Model parameter estimation
Our model contains eight species (see Text S2 in the Sup-
porting Material) and a total of 19 parameters. The parameter
values were estimated through an iterative nonlinear least-
square fitting to the experimental data (described below).
The starting parameter values of mRNA induction, degrada-
tion, and protein translation rate constants were set to the cor-
responding typical values (see Table S1). For the remaining
parameters, we set their starting values to physiologically
reasonable numbers. The initial condition of our model
corresponds to a state in which IFN-benv is determined by
the pretreatment dosage and the concentrations of the
remaining seven modeled species are set to zero.
Error function and local parameter sensitivity
We defined the following error function for our least-square
fitting:
EðPÞhXm
i¼ 1
Xn
j¼ 1
�XijðPÞ � Yij
�2;
where Xij (P) and Yij are the normalized simulation values
evaluated at the parameter set P and normalized experi-
mental data points, respectively. Normalization is to the
maximal value over the respective time courses when
the experimental data are given in arbitrary units and to the
maximum of the experimental data for both simulation and
experiment when the experimental data are given in physical
units. The sum runs over all species (from 1 to m) and time
points (from 1 to n).
For a given set of parameters, the sensitivity of the error
function, E, to finite changes in the value of the ith parameter,
pi, was estimated through a local parameter sensitivity, Si,
defined as the relative change in E due to a 5% change in pi:
Si ¼ max
�����Eðpi 5 0:05piÞ � E0
0:05E0
�����;
where E0 is the error function evaluated at the given param-
eter set. This local parameter sensitivity Si is used in our iter-
ative least-square fitting procedure (described below) to
select parameters for the model fitting to experimental data.
Iterative least-square fitting
We used the iterative procedure below for the nonlinear
least-square fitting of our model to the experimental data,
beginning with the parameter starting values:
1. Compute local parameter sensitivity Si for all parameters
individually at current values, as described above.
2. Identify the parameter(s) with Si > 0.05 (an arbitrary
threshold) but not in the set Pfit, which is the list of param-
eters to be optimized. Pfit is set to be empty at the begin-
ning of optimization. When there is at least one parameter
that satisfies the criteria, choose the parameter with the
largest Si and add it to the set Pfit; otherwise, the fitting
procedure is terminated.
3. Perform a local optimization with respect to the parame-
ters in Pfit while fixing the rest parameters at their current
values. Use the optimized parameter values to update the
current parameter set, then go to step 1.
The model simulation and optimization are performed in
MATLAB (The MathWorks, Natick, MA) using the ODE
solver ‘‘ode15s’’ and minimization routine ‘‘fminunc’’.
For our model, the procedure terminated in five iterations.
As a result, a total of five model parameters were optimized,
whereas the remaining 14 parameters remain fixed at their
starting values (see Table S1).
Confidence interval and identifiability
The 68% confidence interval (CI) for the optimized param-
eter values are computed according to Press et al. (43), using
the equation
CIi ¼ 5
ffiffiffiffiffiffiffiffiffiffiffiffiffiffiffiffiffi2�H�1
�ii
q;
where H is the Hessian matrix, Hij ¼ v2 c2/vpivpj, evaluated
at the optimized parameter set and c2 ¼ E/s2. Here, we have
assumed a constant standard deviation for all experimental
data points and estimated it with s2 ¼ Emin/(N � M), where
Emin is the error function E evaluated at the optimized param-
eter set; N is the number of experimental data points, and Mis the number of optimized parameters (43). The computed
confidence intervals were normalized with respect to the cor-
responding optimized parameter values, and the resulting
percentages were summarized in Table S1.
To determine the identifiability (44,45) of our model
parameters, we chose the tolerance for the normalized 95%
confidence intervals of identifiable parameters to be 540%
(45). Among the five optimized parameters, three are identi-
fiable (vmax, t2, and t3) according to the selected tolerance,
for which the 95% confidence intervals can be estimated
as two times the 68% confidence intervals shown in
Table S1.
Parametric sensitivity analysis
We carried out local parameter sensitivity analysis to deter-
mine the effect of parametric changes on the temporal system
responses. The normalized sensitivity (NS) is computed for
each variable in our ODE model with a finite difference
approximation:
Biophysical Journal 98(4) 505–514
0 10 20 30 40 500
0.2
0.4
0.6
0.8
1
IFN pretreatment (units/ml)
IFN
-β m
RN
A
A
0.5 h3 h6 h
0.02
(μM
)
B
510 Qiao et al.
NSijðtÞ ¼pj
yi
$vyiðt;PÞ
vpj
zpj
yi
$yi
�t; pj þ Dpj
�� yi
�t; pj
�Dpj
;
where y and p, respectively, denote the system response vari-
ables, namely, the species concentrations and parameters.
The parametric sensitivity analysis result is shown in
Fig. S2 for four species. It shows that the induction of type
I IFNs (Fig. S2 C) is most sensitive to the half-lives of
STATP(2)n t2 and SOCSm t3 (especially ~2–3 h after virus
infection). This heightened sensitivity reflects the impor-
tance of the interplay between STATP and its inhibitor
SOCS for the induction of type I IFNs, as the system mostly
operates in a regime where the binding of the extracellular
IFNs to the receptors quickly reaches saturation due to
a predicted low threshold value (Fig. 3 A).
-3 -2 0 2 4 6 8 100
0.01
t (h)
STA
T1P
n
-3 -2 0 2 4 6 8 100
0.10.2
t (h)
IRF7
Pn
(μM
) 0.5 units/ml5 units/ml50 units/ml
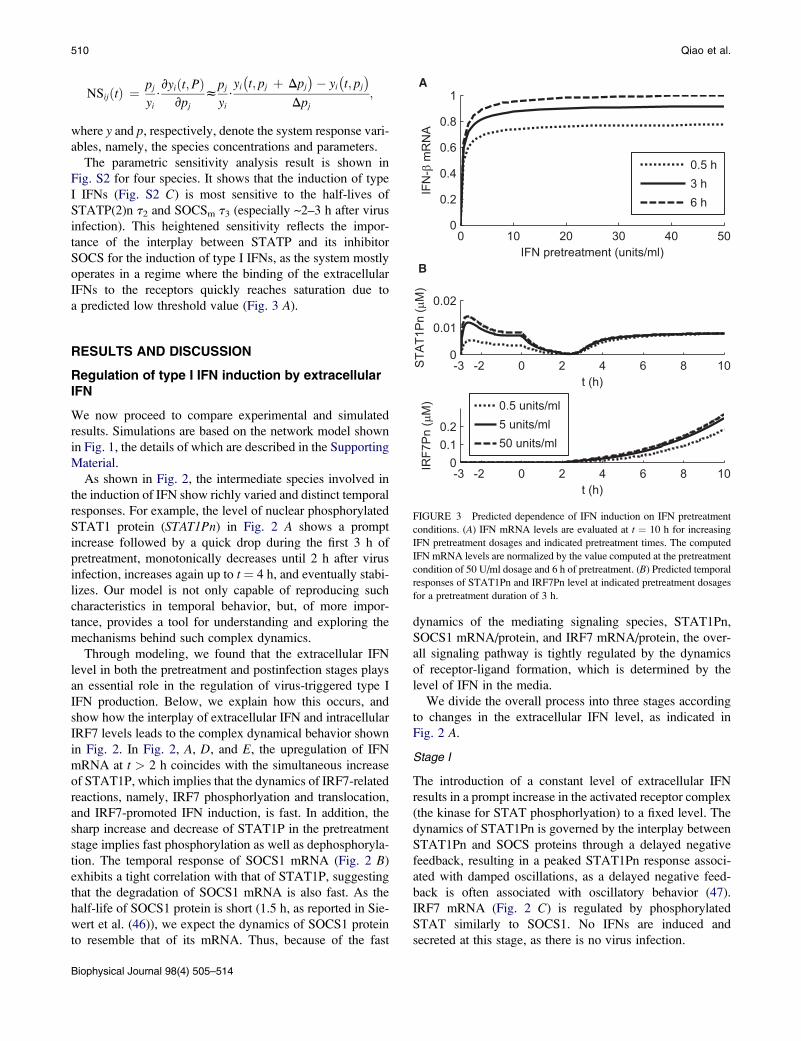
FIGURE 3 Predicted dependence of IFN induction on IFN pretreatment
conditions. (A) IFN mRNA levels are evaluated at t ¼ 10 h for increasing
IFN pretreatment dosages and indicated pretreatment times. The computed
IFN mRNA levels are normalized by the value computed at the pretreatment
condition of 50 U/ml dosage and 6 h of pretreatment. (B) Predicted temporal
responses of STAT1Pn and IRF7Pn level at indicated pretreatment dosages
for a pretreatment duration of 3 h.
RESULTS AND DISCUSSION
Regulation of type I IFN induction by extracellularIFN
We now proceed to compare experimental and simulated
results. Simulations are based on the network model shown
in Fig. 1, the details of which are described in the Supporting
Material.
As shown in Fig. 2, the intermediate species involved in
the induction of IFN show richly varied and distinct temporal
responses. For example, the level of nuclear phosphorylated
STAT1 protein (STAT1Pn) in Fig. 2 A shows a prompt
increase followed by a quick drop during the first 3 h of
pretreatment, monotonically decreases until 2 h after virus
infection, increases again up to t ¼ 4 h, and eventually stabi-
lizes. Our model is not only capable of reproducing such
characteristics in temporal behavior, but, of more impor-
tance, provides a tool for understanding and exploring the
mechanisms behind such complex dynamics.
Through modeling, we found that the extracellular IFN
level in both the pretreatment and postinfection stages plays
an essential role in the regulation of virus-triggered type I
IFN production. Below, we explain how this occurs, and
show how the interplay of extracellular IFN and intracellular
IRF7 levels leads to the complex dynamical behavior shown
in Fig. 2. In Fig. 2, A, D, and E, the upregulation of IFN
mRNA at t > 2 h coincides with the simultaneous increase
of STAT1P, which implies that the dynamics of IRF7-related
reactions, namely, IRF7 phosphorlyation and translocation,
and IRF7-promoted IFN induction, is fast. In addition, the
sharp increase and decrease of STAT1P in the pretreatment
stage implies fast phosphorylation as well as dephosphoryla-
tion. The temporal response of SOCS1 mRNA (Fig. 2 B)
exhibits a tight correlation with that of STAT1P, suggesting
that the degradation of SOCS1 mRNA is also fast. As the
half-life of SOCS1 protein is short (1.5 h, as reported in Sie-
wert et al. (46)), we expect the dynamics of SOCS1 protein
to resemble that of its mRNA. Thus, because of the fast
Biophysical Journal 98(4) 505–514
dynamics of the mediating signaling species, STAT1Pn,
SOCS1 mRNA/protein, and IRF7 mRNA/protein, the over-
all signaling pathway is tightly regulated by the dynamics
of receptor-ligand formation, which is determined by the
level of IFN in the media.
We divide the overall process into three stages according
to changes in the extracellular IFN level, as indicated in
Fig. 2 A.
Stage I
The introduction of a constant level of extracellular IFN
results in a prompt increase in the activated receptor complex
(the kinase for STAT phosphorlyation) to a fixed level. The
dynamics of STAT1Pn is governed by the interplay between
STAT1Pn and SOCS proteins through a delayed negative
feedback, resulting in a peaked STAT1Pn response associ-
ated with damped oscillations, as a delayed negative feed-
back is often associated with oscillatory behavior (47).
IRF7 mRNA (Fig. 2 C) is regulated by phosphorylated
STAT similarly to SOCS1. No IFNs are induced and
secreted at this stage, as there is no virus infection.
Immune Response Modeling 511
Stage II
As IFN in the media is removed at t¼ 0 and virus added, the
STAT1Pn level starts to decline at a faster rate because of the
complete removal of its upstream kinase. Both IRF7 mRNA
and SOCS1 mRNA continue to decrease due to constitutive
degradation as the level of nuclear STAT1Pn decreases.
Even though the cells are already infected by the virus, there
is still no detectable level of IFN-b mRNA, probably due to
the low virus copy number, antagonist activity of the influ-
enza virus, and slow dynamics of enhanceosome assembly
for IFN-b induction.
Stage III
When cell-secreted IFN triggers the IFN signaling pathway
after t > 2 h, the overall dynamics is controlled by the
slow secretion of IFN proteins before the saturation IFN
level is reached (~t ¼ 6 h), when the amount of STATP
levels off. For the period between t ¼ 2 h and t ¼ 6 h, the
temporal responses resemble that of the extracellular IFN
level, i.e., they show a monotonic increase, because the
dynamics of mediating signaling species is fast (as discussed
above) compared to the slow secretion of IFN. After satura-
tion, the dynamics is once again controlled by the interplay
between STAT1Pn and SOCS proteins. IRF7, on the other
hand, keeps increasing because of autoinduction.
Applications of the model
We consider two applications of our model. To identify
optimal conditions leading to maximal IFN response, we
explore the influence of different IFN pretreatment condi-
tions (dosage and duration) on IFN induction. We also simu-
late in vivo induction of IFN in DCs at the site of infection.
Different pretreatment conditions
Fig. 3 A shows that increasing pretreatment dosage or dura-
tion beyond some limits does not prepare a cell to better cope
with viral infection. For fixed pretreatment duration, as
shown in Fig. 3 A, IFN induction increases dramatically
with IFN pretreatment dosage in the low-dosage regime
(<5 U/ml) and quickly becomes insensitive to further
increase in pretreatment dosage. Moreover, for dosages
>5 U/ml, IFN induction is rather insensitive to pretreatment
duration above 0.5 h. One can ask what aspects of the model
determine the shapes in Fig. 3 A. The increase with dosage
(for a given pretreatment time) of the percentage amount
of induced IFN can be traced back to the corresponding
responses of STAT1Pn, for which a strong dependence on
dosage is apparent before infection (Fig. 3 B). This preinfec-
tion dosage dependence of STAT1Pn entrains a correspond-
ing postinfection dependence in nuclear phosphorylated
IRF7 (IRF7Pn) (Fig. 3 B), which ultimately is responsible
for the observed dependence of IFN-b on pretreatment
dosage in Fig. 3 A. Higher pretreatment dosages do not
lead to more induced IFN because the IFN receptors are
already saturated. Our model predicts a threshold value of
~2 U/ml for the binding of extracellular IFN to the IFNAR
complex of a human DC (corresponding to the value of
parameter K1, as described in the Supporting Material),
with a saturation level of ~20 U/ml, 10 times the threshold
value. As with dosage amount, an increase in pretreatment
duration does not lead to significant gains in IFN induction.
Saturation takes place with pretreatment duration as soon as
dosage exceeds 5 U/ml (Fig. 3 A). The reason can again be
traced back to STAT activation. When pretreatment duration
increases, the STAT1Pn peak of Fig. 2 A moves to earlier
times, allowing more time for the induced IRF7 mRNA to
‘‘forget’’ the influence of such initial STAT1Pn temporal
behavior.
It has been shown (16) that extension of the IFN pretreat-
ment time beyond 6 h (such as 12 h) leads to a weak DC
immune response after virus infection, because the pretreated
DCs become resistant to virus infection. Therefore, we
would expect an IFN pretreatment of 6 h with a dosage of
50 U/ml to provide a good estimate of the maximum IFN
response to virus infection, which was used for the scaling
in Fig. 3 A.
In summary, our model predicts two important saturation
threshold values for the influence of IFN pretreatment condi-
tions on the enhancement of IFN induction (Fig. 3 A). For
a pretreatment >3 h, a low pretreatment dosage of 5 U/ml
is enough to provide ~90% of the maximum enhancement
in IFN induction associated with solely increasing IFN
dosage. For a fixed pretreatment dosage >5 U/ml, a pretreat-
ment length of ~3 h is also able to give ~90% of the
maximum in IFN induction.
Simulations for DC in vivo responses to virus infection
The in vivo environment is different from the in vitro exper-
iments discussed above in at least the following aspects: 1),
the priming time of DCs, which is the time the immature
uninfected DC is exposed to IFN, varies among cells; 2),
the IFN in the tissue is not removed after infection; and 3),
the in vivo IFN level at the site of infection is found to
vary much more slowly over time when compared to our
in vitro experiments (T. Hermesh, B. Moltedo, T. M. Moran,
and C. B. Lopez, unpublished). We thus performed simula-
tions with our model to compare IFN responses to virus
infection under in vitro IFN pretreatment and in vivo IFN
priming conditions. As the in vivo extracellular IFN level
increases very slowly, we assumed a constant extracellular
IFN level during the 10-h time span of our simulations.
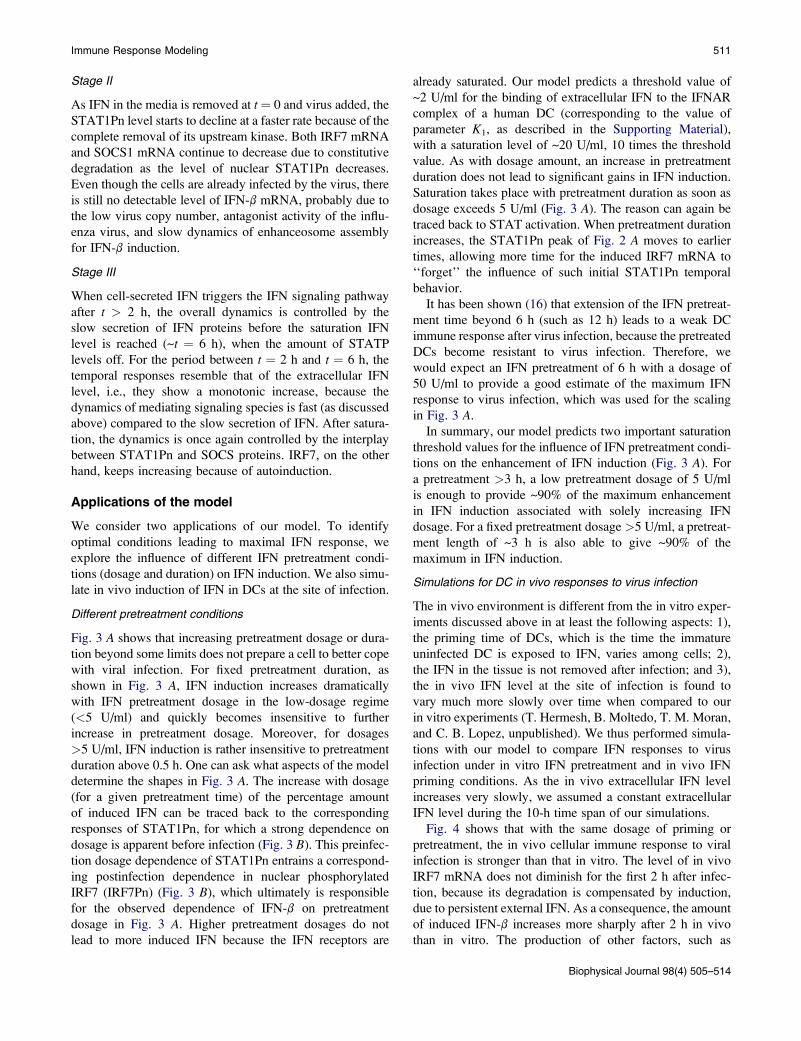
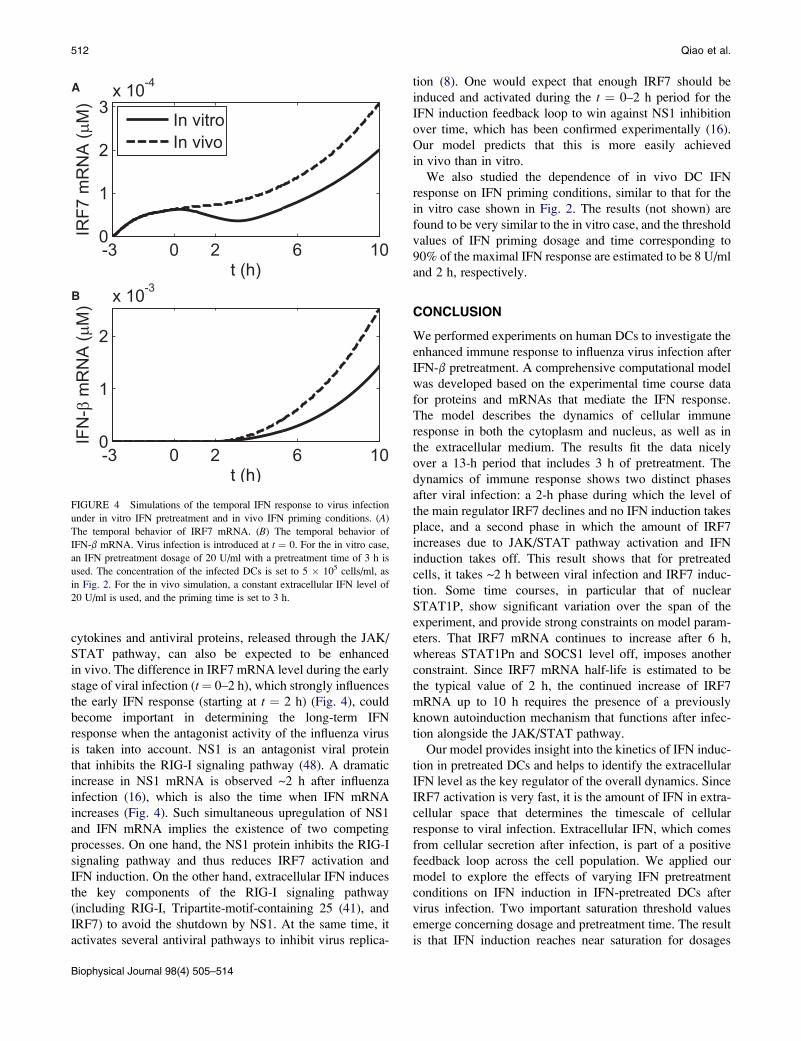
Fig. 4 shows that with the same dosage of priming or
pretreatment, the in vivo cellular immune response to viral
infection is stronger than that in vitro. The level of in vivo
IRF7 mRNA does not diminish for the first 2 h after infec-
tion, because its degradation is compensated by induction,
due to persistent external IFN. As a consequence, the amount
of induced IFN-b increases more sharply after 2 h in vivo
than in vitro. The production of other factors, such as
Biophysical Journal 98(4) 505–514
-3 0 2 6 100
1
2
3x 10⁻⁴
IRF7
mR
NA
(μM
)
t (h)
A
In vitroIn vivo
-3 0 2 6 100
1
2
x 10-3
IFN
-β m
RN
A (μ
M)
t (h)
B
FIGURE 4 Simulations of the temporal IFN response to virus infection
under in vitro IFN pretreatment and in vivo IFN priming conditions. (A)
The temporal behavior of IRF7 mRNA. (B) The temporal behavior of
IFN-b mRNA. Virus infection is introduced at t ¼ 0. For the in vitro case,
an IFN pretreatment dosage of 20 U/ml with a pretreatment time of 3 h is
used. The concentration of the infected DCs is set to 5 � 105 cells/ml, as
in Fig. 2. For the in vivo simulation, a constant extracellular IFN level of
20 U/ml is used, and the priming time is set to 3 h.
512 Qiao et al.
cytokines and antiviral proteins, released through the JAK/
STAT pathway, can also be expected to be enhanced
in vivo. The difference in IRF7 mRNA level during the early
stage of viral infection (t¼ 0–2 h), which strongly influences
the early IFN response (starting at t ¼ 2 h) (Fig. 4), could
become important in determining the long-term IFN
response when the antagonist activity of the influenza virus
is taken into account. NS1 is an antagonist viral protein
that inhibits the RIG-I signaling pathway (48). A dramatic
increase in NS1 mRNA is observed ~2 h after influenza
infection (16), which is also the time when IFN mRNA
increases (Fig. 4). Such simultaneous upregulation of NS1
and IFN mRNA implies the existence of two competing
processes. On one hand, the NS1 protein inhibits the RIG-I
signaling pathway and thus reduces IRF7 activation and
IFN induction. On the other hand, extracellular IFN induces
the key components of the RIG-I signaling pathway
(including RIG-I, Tripartite-motif-containing 25 (41), and
IRF7) to avoid the shutdown by NS1. At the same time, it
activates several antiviral pathways to inhibit virus replica-
Biophysical Journal 98(4) 505–514
tion (8). One would expect that enough IRF7 should be
induced and activated during the t ¼ 0–2 h period for the
IFN induction feedback loop to win against NS1 inhibition
over time, which has been confirmed experimentally (16).
Our model predicts that this is more easily achieved
in vivo than in vitro.
We also studied the dependence of in vivo DC IFN
response on IFN priming conditions, similar to that for the
in vitro case shown in Fig. 2. The results (not shown) are
found to be very similar to the in vitro case, and the threshold
values of IFN priming dosage and time corresponding to
90% of the maximal IFN response are estimated to be 8 U/ml
and 2 h, respectively.
CONCLUSION
We performed experiments on human DCs to investigate the
enhanced immune response to influenza virus infection after
IFN-b pretreatment. A comprehensive computational model
was developed based on the experimental time course data
for proteins and mRNAs that mediate the IFN response.
The model describes the dynamics of cellular immune
response in both the cytoplasm and nucleus, as well as in
the extracellular medium. The results fit the data nicely
over a 13-h period that includes 3 h of pretreatment. The
dynamics of immune response shows two distinct phases
after viral infection: a 2-h phase during which the level of
the main regulator IRF7 declines and no IFN induction takes
place, and a second phase in which the amount of IRF7
increases due to JAK/STAT pathway activation and IFN
induction takes off. This result shows that for pretreated
cells, it takes ~2 h between viral infection and IRF7 induc-
tion. Some time courses, in particular that of nuclear
STAT1P, show significant variation over the span of the
experiment, and provide strong constraints on model param-
eters. That IRF7 mRNA continues to increase after 6 h,
whereas STAT1Pn and SOCS1 level off, imposes another
constraint. Since IRF7 mRNA half-life is estimated to be
the typical value of 2 h, the continued increase of IRF7
mRNA up to 10 h requires the presence of a previously
known autoinduction mechanism that functions after infec-
tion alongside the JAK/STAT pathway.
Our model provides insight into the kinetics of IFN induc-
tion in pretreated DCs and helps to identify the extracellular
IFN level as the key regulator of the overall dynamics. Since
IRF7 activation is very fast, it is the amount of IFN in extra-
cellular space that determines the timescale of cellular
response to viral infection. Extracellular IFN, which comes
from cellular secretion after infection, is part of a positive
feedback loop across the cell population. We applied our
model to explore the effects of varying IFN pretreatment
conditions on IFN induction in IFN-pretreated DCs after
virus infection. Two important saturation threshold values
emerge concerning dosage and pretreatment time. The result
is that IFN induction reaches near saturation for dosages
Immune Response Modeling 513
>5 U/ml and durations >3 h. The model is then extended to
simulate the in vivo IFN induction of DCs at the site of infec-
tion. We found that in the same conditions, IFN mRNA
induction occurs at a faster rate in vivo than in vitro, and is
determined by the level of IRF7 mRNA present in the cell
at the early stages of influenza virus infection. Thus, the
cell is better prepared to combat the virus in vivo than under
similar conditions in vitro.
As a final note, we raise the usual flags of modeling caution,
which arise from the fact that the model describes a limited set
of data over a finite temporal range. From inspection of Fig. 2,
it is clear that the system of components has not reached
steady state at 10 h after infection, since IRF7 and the IFNs
continue to increase. This behavior cannot go on indefinitely,
even though in the model it would. The reason is that for the
sake of keeping the number of parameters small, some of the
reactions are described by equations in which only the linear
part of a saturating Michaelis-Menten expression is retained
(e.g., induction of IFN-a/b mRNA by IRF7Pn). If one were
to extend the model beyond 10 h, some of the equations
would need to be rewritten, at the price of introducing addi-
tional parameters. Moreover, some of the assumptions
made to simplify the model would need to be reevaluated if
new measurements were to appear. The conclusion is that
model methodology—here, the tailoring of model size to
the number of experimental measurements—is more impor-
tant than model details.
SUPPORTING MATERIAL
Model of type I IFN induction in IFN-pretreated human DCs, model equa-
tions, a table, references, and two figures are available at http://www.
biophysj.org/biophysj/supplemental/S0006-3495(09)01723-8.
The authors thank Dr. Yishai Shimoni for discussions.
This work was supported by the National Institute of Allergy and Infectious
Diseases contract HHSN266200500021C, and National Institutes of Health
grants U19 AI62623 and RO1 AI041111.
REFERENCES
1. Trumpfheller, C., J. S. Finke, ., R. M. Steinman. 2006. Intensified andprotective CD4þ T cell immunity in mice with anti-dendritic cell HIVgag fusion antibody vaccine. J. Exp. Med. 203:607–617.
2. Banchereau, J., and R. M. Steinman. 1998. Dendritic cells and thecontrol of immunity. Nature. 392:245–252.
3. Akira, S., and K. Takeda. 2004. Toll-like receptor signalling. Nat. Rev.Immunol. 4:499–511.
4. Takeuchi, O., and S. Akira. 2008. MDA5/RIG-I and virus recognition.Curr. Opin. Immunol. 20:17–22.
5. Myong, S., S. Cui, ., T. Ha. 2009. Cytosolic viral sensor RIG-I isa 50-triphosphate-dependent translocase on double-stranded RNA.Science. 323:1070–1074.
6. Stetson, D. B., and R. Medzhitov. 2006. Type I interferons in hostdefense. Immunity. 25:373–381.
7. Shvartsman, S. Y., M. P. Hagan, ., D. A. Lauffenburger. 2002. Auto-crine loops with positive feedback enable context-dependent cellsignaling. Am. J. Physiol. Cell Physiol. 282:C545–C559.
8. Sadler, A. J., and B. R. G. Williams. 2008. Interferon-inducible antiviraleffectors. Nat. Rev. Immunol. 8:559–568.
9. Haller, O., and F. Weber. 2007. Pathogenic viruses: smart manipulatorsof the interferon system. Curr. Top. Microbiol. Immunol. 316:315–334.
10. Garcıa-Sastre, A., A. Egorov, ., T. Muster. 1998. Influenza A viruslacking the NS1 gene replicates in interferon-deficient systems.Virology. 252:324–330.
11. Fernandez-Sesma, A., S. Marukian, ., T. M. Moran. 2006. Influenzavirus evades innate and adaptive immunity via the NS1 protein. J. Virol.80:6295–6304.
12. Brimnes, M. K., L. Bonifaz, ., T. M. Moran. 2003. Influenza virus-induced dendritic cell maturation is associated with the induction ofstrong T cell immunity to a coadministered, normally nonimmunogenicprotein. J. Exp. Med. 198:133–144.
13. Montoya, M., G. Schiavoni, ., D. F. Tough. 2002. Type I interferonsproduced by dendritic cells promote their phenotypic and functionalactivation. Blood. 99:3263–3271.
14. Pollara, G., M. Jones, ., D. R. Katz. 2004. Herpes simplex virus type-1-induced activation of myeloid dendritic cells: the roles of virus cellinteraction and paracrine type I IFN secretion. J. Immunol. 173:4108–4119.
15. Osterlund, P., V. Veckman, ., I. Julkunen. 2005. Gene expression andantiviral activity of a/b interferons and interleukin-29 in virus-infectedhuman myeloid dendritic cells. J. Virol. 79:9608–9617.
16. Phipps-Yonas, H., J. Seto, ., A. Fernandez-Sesma. 2008. Interferon-b pretreatment of conventional and plasmacytoid human dendritic cellsenhances their activation by influenza virus. PLoS Pathog. 4:e1000193.
17. Borderıa, A. V., B. M. Hartmann, ., S. C. Sealfon. 2008. Antiviral-activated dendritic cells: a paracrine-induced response state. J. Immunol.181:6872–6881.
18. Honda, K., H. Yanai, ., T. Taniguchi. 2005. IRF-7 is the master regu-lator of type-I interferon-dependent immune responses. Nature.434:772–777.
19. Sato, M., N. Hata, ., N. Tanaka. 1998. Positive feedback regulation oftype I IFN genes by the IFN-inducible transcription factor IRF-7. FEBSLett. 441:106–110.
20. Honda, K., H. Yanai, ., T. Taniguchi. 2005. Regulation of the type IIFN induction: a current view. Int. Immunol. 17:1367–1378.
21. Marie, I., J. E. Durbin, and D. E. Levy. 1998. Differential viral inductionof distinct interferon-a genes by positive feedback through interferonregulatory factor-7. EMBO J. 17:6660–6669.
22. Sharma, S., B. R. tenOever, ., J. Hiscott. 2003. Triggering the inter-feron antiviral response through an IKK-related pathway. Science.300:1148–1151.
23. Marie, I., E. Smith, ., D. E. Levy. 2000. Phosphorylation-induceddimerization of interferon regulatory factor 7 unmasks DNA bindingand a bipartite transactivation domain. Mol. Cell. Biol. 20:8803–8814.
24. Lin, R. T., Y. Mamane, and J. Hiscott. 2000. Multiple regulatorydomains control IRF-7 activity in response to virus infection. J. Biol.Chem. 275:34320–34327.
25. Sato, M., H. Suemori, ., T. Taniguchi. 2000. Distinct and essentialroles of transcription factors IRF-3 and IRF-7 in response to virusesfor IFN-a/b gene induction. Immunity. 13:539–548.
26. Platanias, L. C. 2005. Mechanisms of type-I- and type-II-interferon-mediated signalling. Nat. Rev. Immunol. 5:375–386.
27. Yamada, S., S. Shiono, ., A. Yoshimura. 2003. Control mechanism ofJAK/STAT signal transduction pathway. FEBS Lett. 534:190–196.
28. Smieja, J., M. Jamaluddin, ., M. Kimmel. 2008. Model-based analysisof interferon-b induced signaling pathway. Bioinformatics. 24:2363–2369.
29. Darnell, Jr., J. E., I. M. Kerr, and G. R. Stark. 1994. Jak-STAT pathwaysand transcriptional activation in response to IFNs and other extracellularsignaling proteins. Science. 264:1415–1421.
30. Ihle, J. N., and I. M. Kerr. 1995. Jaks and Stats in signaling by the cyto-kine receptor superfamily. Trends Genet. 11:69–74.
Biophysical Journal 98(4) 505–514
514 Qiao et al.
31. Stark, G. R., I. M. Kerr, ., R. D. Schreiber. 1998. How cells respond to
interferons. Annu. Rev. Biochem. 67:227–264.
32. Leung, S., S. A. Qureshi, ., G. R. Stark. 1995. Role of STAT2 in the
a interferon signaling pathway. Mol. Cell. Biol. 15:1312–1317.
33. Decker, T., D. J. Lew, and J. E. Darnell, Jr. 1991. Two distinct a-inter-
feron-dependent signal transduction pathways may contribute to activa-
tion of transcription of the guanylate-binding protein gene. Mol. Cell.Biol. 11:5147–5153.
34. Frahm, T., H. Hauser, and M. Koster. 2006. IFN-type-I-mediated
signaling is regulated by modulation of STAT2 nuclear export. J. CellSci. 119:1092–1104.
35. ten Hoeve, J., M. de Jesus Ibarra-Sanchez, ., K. Shuai. 2002. Identifi-
cation of a nuclear Stat1 protein tyrosine phosphatase. Mol. Cell. Biol.22:5662–5668.
36. Xu, D., and C. K. Qu. 2008. Protein tyrosine phosphatases in the JAK/
STAT pathway. Front. Biosci. 13:4925–4932.
37. Saito, H., Y. Morita, ., T. Kishimoto. 2000. IFN regulatory factor-1-
mediated transcriptional activation of mouse STAT-induced STAT
inhibitor-1 gene promoter by IFN-g. J. Immunol. 164:5833–5843.
38. Fenner, J. E., R. Starr, ., P. J. Hertzog. 2006. Suppressor of cytokine
signaling 1 regulates the immune response to infection by a unique inhi-
bition of type I interferon activity. Nat. Immunol. 7:33–39.
39. Yoneyama, M., and T. Fujita. 2009. RNA recognition and signal trans-
duction by RIG-I-like receptors. Immunol. Rev. 227:54–65.
Biophysical Journal 98(4) 505–514
40. Merika, M., and D. Thanos. 2001. Enhanceosomes. Curr. Opin. Genet.Dev. 11:205–208.
41. Nakasato, N., K. Ikeda, ., S. Inoue. 2006. A ubiquitin E3 ligase Efp isup-regulated by interferons and conjugated with ISG15. Biochem.Biophys. Res. Commun. 351:540–546.
42. Ning, S. B., L. E. Huye, and J. S. Pagano. 2005. Regulation of the tran-scriptional activity of the IRF7 promoter by a pathway independent ofinterferon signaling. J. Biol. Chem. 280:12262–12270.
43. Press, W. H., S. A. Teukolsky, ., B. P. Flannery. 2007. NumericalRecipes: The Art of Scientific Computing, 3rd ed. Cambridge Univer-sity Press, New York.
44. Birtwistle, M. R., M. Hatakeyama, ., B. N. Kholodenko. 2007.Ligand-dependent responses of the ErbB signaling network: experi-mental and modeling analyses. Mol. Syst. Biol. 3:144.
45. Chung, S. W., F. L. Miles, ., B. A. Ogunnaike. 2009. Quantitativemodeling and analysis of the transforming growth factor b signalingpathway. Biophys. J. 96:1733–1750.
46. Siewert, E., W. Muller-Esterl, ., F. Schaper. 1999. Different proteinturnover of interleukin-6-type cytokine signalling components. Eur. J.Biochem. 265:251–257.
47. Novak, B., and J. J. Tyson. 2008. Design principles of biochemicaloscillators. Nat. Rev. Mol. Cell Biol. 9:981–991.
48. Mibayashi, M., L. Martınez-Sobrido, ., A. Garcıa-Sastre. 2007. Inhi-bition of retinoic acid-inducible gene I-mediated induction of b inter-feron by the NS1 protein of influenza A virus. J. Virol. 81:514–524.