Embed Size (px)
Citation preview
Report No: AUS0000289
.
Indonesia
Long-Term Impact Evaluation of Generasi
. May 2018
. URS
.
Pub
lic D
iscl
osur
e A
utho
rized
Pub
lic D
iscl
osur
e A
utho
rized
Pub
lic D
iscl
osur
e A
utho
rized
Pub
lic D
iscl
osur
e A
utho
rized

ii
THE WORLD BANK OFFICE JAKARTA Indonesia Stock Exchange Building Tower II/12th Floor Jl. Jend. Sudirman Kav. 52-53 Jakarta 12910 Tel: (6221) 5299-3000 Fax: (6221) 5299-3111 Website: www.worldbank.org/id
THE WORLD BANK 1818 H Street NW Washington, DC 20433, USA Tel: (202) 458-1876 Fax: (202) 522-1557/1560 Website: www.worldbank.org Printed in May 2018 Long-Term Generasi Impact Evaluation Report is a product of the staff of the World Bank. The findings, interpretations, and conclusions expressed herein do not necessarily reflect the views of the Board of Executive Directors of the World Bank or the Government they represent. The World Bank does not guarantee the accuracy of the data included in this work. The boundaries, colors, denominations, and other information shown on any map in this work do not imply any judgment on the part of the World Bank concerning the legal status of any territory or the endorsement or acceptance of such boundaries. For any questions regarding this report, please contact Audrey Sacks ([email protected]). _____________________________________________________________________________________________
Copyright Statement:
The material in this publication is copyrighted. Copying and/or transmitting portions or all of this work without permission may
be a violation of applicable law. The International Bank for Reconstruction and Development/ The World Bank encourages
dissemination of its work and will normally grant permission to reproduce portions of the work promptly.
For permission to photocopy or reprint any part of this work, please send a request with complete information to the Copyright
Clearance Center, Inc., 222 Rosewood Drive, Danvers, MA 01923, USA, telephone 978-750-8400, fax 978-750-4470,
http://www.copyright.com/.
All other queries on rights and licenses, including subsidiary rights, should be addressed to the Office of the Publisher, The
World Bank, 1818 H Street NW, Washington, DC 20433, USA, fax 202-522-2422, e-mail [email protected].

Acknowledgements Long-Term Generasi Impact Evaluation Report is a product of Social, Urban, Rural and Resilience Global Practice’s team in the World Bank Office Jakarta. Support for this report has been generously provided by the Department of Foreign Affairs and Trade of the Australian Embassy. This paper was prepared by a core team led by Audrey Sacks (Senior Social Development Specialist, GSU03). Benjamin Olken (J-PAL/MIT) and Audrey Sacks were the principal researchers for this study. The core team also consisted of Kelik Endarso (GSUID), Ali Subandoro (HNP), and Robert Wrobel (GSU03). Other members of the research team include Masyhur Hilmy (J-PAL), Donghee Jo (MIT), Natasha Plotkin (University of California, Berkeley), Samuel Solomon (J-PAL), and Juan Tellez (Duke University). The paper was edited by Kelley Friel (Consultant, GSUID). This report was produced under the overall guidance of Kevin Tomlinson (Practice Manager, GSUID) and Susan Wong (Lead Social Development Specialist, GSUSD). Key comments were provided by Deon Filmer (Lead Economist, DECHD), Rema Hanna (Professor, Harvard Kennedy School), Junko Onishi (Senior Social Protection Specialist, GSP), and Emmanuel Skoufias (Lead Economist, GPV).

1
List of Abbreviations BSM Cash Transfer Program for Poor Students (Bantuan Siswa Miskin) CCT Conditional Cash Transfer GoI Government of Indonesia IE Impact Evaluation ITT Intent to Treat JKN National Health Insurance (Jaminan Kesehatan Nasional) KDP Kecamatan Development Project MIS Management Information System MoHA Ministry of Home Affairs MoV Ministry of Villages, Disadvantaged Areas and Transmigration NTT Nusa Tenggara Timur province PAUD Early Child Education and Development PKH Hopeful Family Program (Keluarga Harapan Program) PNPM National Community Empowerment Program – Healthy and Smart Generation
(Program Nasional Pemberdayaan Masyarakat) PMT Supplementary Food STBM Community-Led Total Sanitation (Sanitasi Total Berbasis Masyarakat)
2
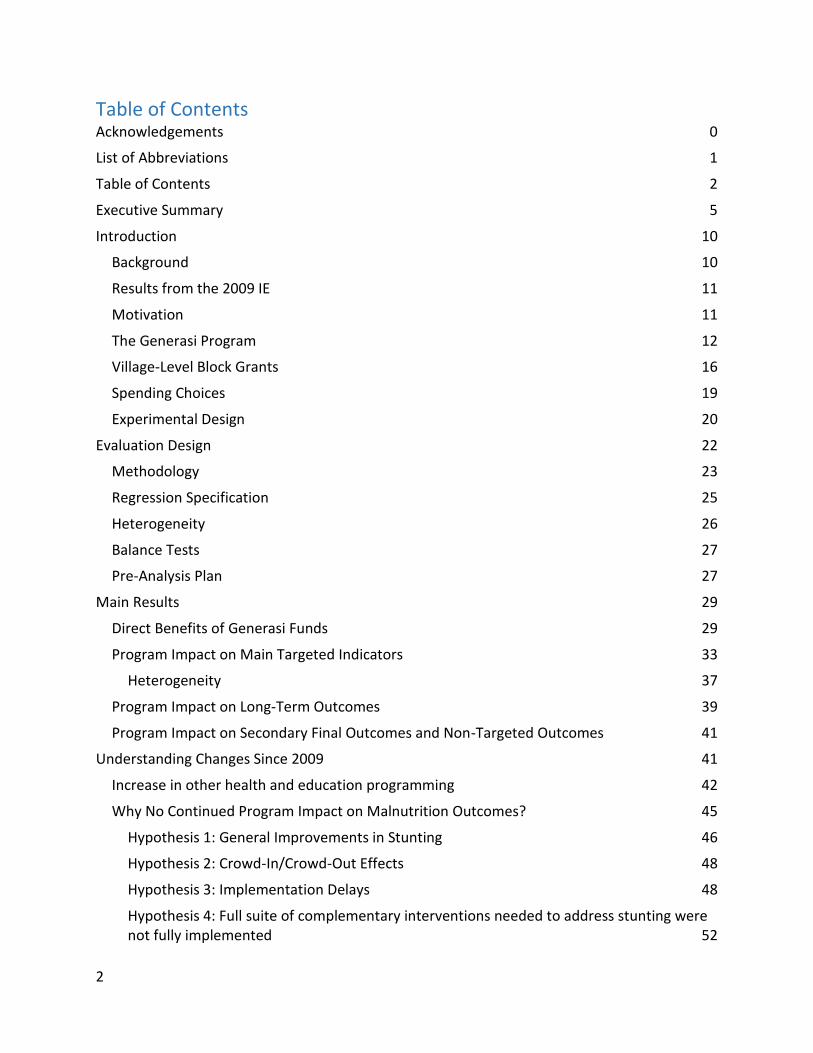
Table of Contents Acknowledgements 0
List of Abbreviations 1
Table of Contents 2
Executive Summary 5
Introduction 10
Background 10
Results from the 2009 IE 11
Motivation 11
The Generasi Program 12
Village-Level Block Grants 16
Spending Choices 19
Experimental Design 20
Evaluation Design 22
Methodology 23
Regression Specification 25
Heterogeneity 26
Balance Tests 27
Pre-Analysis Plan 27
Main Results 29
Direct Benefits of Generasi Funds 29
Program Impact on Main Targeted Indicators 33
Heterogeneity 37
Program Impact on Long-Term Outcomes 39
Program Impact on Secondary Final Outcomes and Non-Targeted Outcomes 41
Understanding Changes Since 2009 41
Increase in other health and education programming 42
Why No Continued Program Impact on Malnutrition Outcomes? 45
Hypothesis 1: General Improvements in Stunting 46
Hypothesis 2: Crowd-In/Crowd-Out Effects 48
Hypothesis 3: Implementation Delays 48
Hypothesis 4: Full suite of complementary interventions needed to address stunting were not fully implemented 52
3
Conclusion 54
Policy Implications 57
References 58
Appendix Tables 61
Appendix Table 1. Questionnaire modules and sample size 61
Appendix Table 2. Direct benefits 62
Appendix Table 3. Direct benefits, provincial breakdown 65
Appendix Table 4. Program impact on main targeted indicators (with and without new indicators) 66
Appendix Table 5. Program impact on main targeted indicators, provincial breakdown 68
Appendix Table 6. Program impact on longer-term outcomes 70
Appendix Table 7. Program impact on longer-term outcomes, provincial breakdown 71
Appendix Table 8. Program impact on main targeted indicators, interactions with pre-period subdistrict level variables, Wave IV 73
Appendix Table 9. Program impact on longer term outcomes, interactions with pre-period subdistrict level variables, Wave IV 74
Appendix Table 10. Results for service provider quantities 75
Appendix Table 11. Results for service provider quality (health and education infrastructure availability) 77
Appendix Table 12. Results for service provider level of effort 79
Appendix Table 13. Results for community efforts at service provision, monitoring, and participation 80
Appendix Table 14. Service prices and supply 82
Appendix Table 15. Main targeted indicators, heterogeneity based on areas most in need 87
Appendix Table 16. Stunting difference-in-differences analysis 89
Annex: Supplementary Material 92
Annex: Table 1. Do attrition rates vary between treatment and control areas? 92
Annex: Table 2. Program impact on main targeted indicators, separated based on 2007-2009 incentive/non-incentive randomization 92
Annex: Table 3. Program impact on longer-term outcomes, , separated based on 2007-2009 incentive/non-incentive randomization 93
Annex: Table 4. Program impact on main targeted indicators limited to repeated cross-section households 93
Annex: Table 5. Program impact on longer-term outcomes limited to repeated cross-section households 94

4
Annex: Figure 1. Visualization of program impact on main targeted indicators showing trends over time and treatment effects 95
Annex: Figure 2. Visualization of program impact on longer-term outcomes showing trends over time and treatment effects 97
5
Executive Summary Indonesia has made remarkable strides in key human development indicators over the past few decades. Primary school enrollment is close to universal for both boys and girls, and the child mortality rate has declined rapidly (World Bank 2017). Nevertheless, infant mortality, child malnutrition, maternal mortality, and educational learning quality have all remained challenges in Indonesia compared to other countries in the region (World Bank 2015). Furthermore, achievements in these indicators reveal large geographical disparities within Indonesia, with poorer outcomes in rural and remote provinces and districts. Improving access to basic quality health and education services is a key component of the country’s overall poverty reduction strategy. In 2007, the Government of Indonesia (GoI) launched two large-scale pilots of programs designed to tackle these issues: 1) conditional cash transfers to households, known as the Hopeful Family Program (Keluarga Harapan Program or PKH), and 2) an incentivized community block grant program, known as the National Community Empowerment Program – Healthy and Smart Generation (Program Nasional Pemberdayaan Masyarakat – Generasi Sehat dan Cerdas, or Generasi). In 2014, the Generasi program was renamed Generasi Sehat Cerdas (“Bright Healthy Generation”) when its administration was transferred from the Ministry of Home Affairs (MoHA) to the Ministry of Villages, Disadvantaged Areas and Transmigration (MoV). These two complementary pilot projects began in six provinces and are designed to target the same health and education indicators. They are consistent with both GoI priorities and the Sustainable Development Goals: to reduce poverty, maternal mortality, and child mortality, and to ensure universal coverage of basic education. The initial PKH locations focused more on supply-side ready areas, including both urban areas and more developed rural areas, while Generasi operated exclusively in rural areas. This study reports on the long-term evaluation of Generasi, conducted nine years after the program’s launch in 2007. Under the Generasi program, treatment villages receive a block grant each year. With the assistance of trained program facilitators and local service delivery workers, villagers undertake a social mapping and participatory planning exercise to decide how best to use these funds to meet 12 education and health targets related to maternal and child health behavior and education behavior. These 12 targets initially related to prenatal and postnatal care, child immunizations, and primary and junior secondary school enrollment and attendance; they were revised slightly in 2010 to accommodate changing local needs. To incentivize communities to focus on the most effective policies, GoI bases the size of the village’s block grant for the subsequent year partly on its performance on each of the targeted indicators. The project therefore applies conditional cash transfer program-style performance incentives at the community level, in a way that gives communities the flexibility to address supply and/or demand constraints. Generasi is the first health and education program in the world to combine community block grants with explicit performance bonuses for communities.
6
To allow for a rigorous, randomized evaluation of Generasi, GoI incorporated random assignment into the selection of Generasi locations (Olken et al. 2011). Within the districts selected by GoI for the program, entire subdistricts (kecamatan) were randomly assigned to either participate in the program or to be in a control group. Each Generasi location was further randomly allocated to one of two versions of the program: 1) an “incentivized” treatment with the pay-for-performance component (treatment A) described above, or 2) an otherwise identical “non-incentivized” treatment without pay-for-performance incentives (treatment B). The randomized assignment of subdistricts into treatment and control has remained remarkably intact after nine years of programming; only a handful of locations originally assigned to the control group have received treatment in the intervening period. This preservation of randomization assignment permits an unusually long-term impact evaluation (IE) of a community-driven development program. With over 2,100 villages randomized to receive either the incentivized or non-incentivized version of the program (plus over 1,000 villages in control subdistricts), and over 1.8 million target beneficiaries in treatment areas, this IE represents one of the largest randomized social experiments ever conducted. In 2009, a rigorous IE using the random assignment found that the program had achieved substantial improvements in health and education targets after 30 months. Generasi had particular success at improving participation in community health posts (posyandu), increasing the frequency of weight checks for infants, and increasing school enrollment rates. It was also found to produce significant long-term reductions in malnutrition rates (2.2 percentage points). Improvements in malnutrition outcomes were especially large in low-performing provinces like Nusa Tenggara Timur (NTT), where underweight rates were reduced by 8.8 percentage points (20% decline compared to control areas) and severe stunting was reduced by 6.6 percentage points (21% decline compared to control). The evaluation further found evidence that making block grants conditional on prior performance yielded significantly faster improvements in health indicators, particularly at 18 months. Both the health and education context in Indonesia as a whole, as well as the Generasi program, have changed substantially since the 2009 IE was conducted. The report documents that Indonesia has made remarkable strides in continuing to improve access to education and basic health. The Generasi program has also undergone significant changes since the 2009 IE, including a revision of the program’s target indicators in 2014 to include nutrition and prenatal counseling and school participation for students with disabilities as well as expanding the performance incentive condition into all Generasi programming areas in 2010. These developments raise questions about the program’s long-term impact as well as its ability to yield improvements on the revised indicators. This document describes the findings from an evaluation carried out in 2016/2017 to determine Generasi’s long-term impact. It represents the fourth and final wave of evaluations; the first three waves were carried out between 2007 and 2010. The baseline survey took place from June to August 2007. The second wave was conducted from October 2008 to January 2009, after 15 to 18 months of Generasi implementation. The third survey was implemented from October 2009 to January 2010 after 27 to 30 months of project implementation. The most
7
recent survey was carried out between October 2016 and February 2017 after nine years of program implementation. Over 46,000 household members, village heads, and school and health facility staff were surveyed in the final round. The main findings of the Generasi IE are as follows.
● Since 2009, the overall health and education environment in Generasi IE districts has improved dramatically, even in control areas. Vital health indicators, such as deliveries attended by a doctor or midwife, have increased substantially since 2009 and now account for over 92% of births in the sample area. Similarly, school participation rates have risen significantly since 2009: enrollment for school years 7–12 was 98% in 2016. These improvements likely reflect both substantial policy changes and improved household incomes throughout Indonesia.
● There is now significantly less room for improvement in many Generasi target areas. For example, Generasi’s impact on reduced malnutrition and school enrollments that were present in Wave III are no longer observed in Wave IV. The IE also documents that there have been substantial improvements in precisely those indicators in both treatment and control areas compared to 2009.
● One of Generasi’s greatest accomplishments is the sustained revitalization of the
posyandu, which was accomplished through program facilitation, community participation, and a targets/incentive system. The posyandu are monthly local health clinics for mothers and children that distribute snacks and vitamin A tablets, measure children’s height and weight, immunize kids, and provide nutrition and health advice. This system has been central to GoI’s efforts to curb infant/child mortality and provide citizens with family planning services since the early 1980s (Leimena 1989). By the late 1990s attendance at posyandu had decreased from 52% to 40% in both urban and rural areas, but with a greater decline in rural ones. Reasons for the decline include a loss of support from NGOs and changing preferences for private providers in Indonesia (Marks 2007). Despite these setbacks, community participation in posyandu activities continues to improve nine years after program implementation. This participation has been sustained in part by communities choosing to allocate portions of their Generasi block grants to fund interventions that incentivize participation at the posyandu, such as providing nutritional supplements to mothers who attend, funding subsidies for pre- and postnatal care, and remunerating posyandu volunteers.
● Specifically, Generasi still helps mobilize community members to attend the posyandu for infant weighing and maternal health and parenting classes. Treatment areas experienced 0.13 more weight checks, on average, for young children in control areas (a 6% increase compared to control areas), as well as a 73% increase (8.5 percentage points) in attendance of parenting classes compared to control areas, particularly among mothers of young children. Prenatal class attendance also increased by eight

8
percentage points (24% increase compared to control areas) in treatment areas. The frequency of prenatal attendances increased by 0.28 classes on average.
● In the lowest-performing districts, Generasi has continued to be effective at
encouraging community members to attend the posyandu and increasing immunizations and vitamin A distribution. Nine years after implementation, treatment areas in the lowest-performing tercile continue to experience a 0.19 increase in weight check frequency. In the same tercile, immunization rates increased by three percentage points (roughly 4% higher than control areas), while vitamin A uptake increased by 0.15 supplements (11% increase compared to control areas).
● Generasi’s initial impact on stunting, concentrated in NTT province, has not been
sustained beyond the 2009 IE. There are four possible reasons for this. First, the overall substantial improvements in stunting in NTT that occurred in both control and treatment areas may have exhausted the 'low-hanging fruit' that Generasi was able to solve in earlier periods. Second, Generasi funding produced crowd-in/crowd-out effects on other program resources that undercut the efficacy of the intervention. Third, implementation issues and delays in the maternal health and parenting classes may have weakened any potentially positive impacts this intervention may have had on behavioral change and malnutrition. Fourth, Generasi’s effects on stunting were limited because the full suite of complementary demand- and supply-side interventions needed to address stunting were not fully implemented.
The evaluation results have three policy implications.1
● Future GoI health-related programming needs to consider how to sustain the posyandu and ensure that mothers continue to bring their children for weight/height measurement, participation in Early Childhood Education (PAUD) programs, and basic maternal and infant health services. An implementation disruption in Generasi programming that occurred in 2015 when the Generasi program transferred from MoHA to MoV, underscores the difficulty of maintaining posyandu participation without incentives. The disruption meant that funding could not be spent on nutritional supplements, which based on qualitative field reports led to a reduction in posyandu attendance. The future of posyandu success depends on villages continuing to support participation in the absence of Generasi. Across Indonesia, village governments could use village law funds to support the posyandu and continue to ensure that posyandu are sufficiently staffed (e.g., at least one per hamlet) and that they are compensated appropriately. The GoI could encourage village governments to use village law funds to support posyandu either by prioritizing it at the central and district levels and/or incentivizing village governments to allocate resources for this purpose.
1 The policy and operational recommendations are elaborated in a complementary report, “Long-Term Generasi
Qualitative Study”.
9
● The results show that Generasi is effective at increasing basic service utilization in poor contexts, where baseline service delivery and health indicator levels are low, but where there are at least some elements of a functioning supply side. Generasi was more effective in 2009, when baseline levels of service delivery were much lower, and even in 2009 it was most effective in those provinces and districts with the lowest levels of baseline service delivery. Today, Generasi remains most effective in improving weight checks, immunizations, and vitamin A in the bottom third of districts in terms of predicted levels of achievement in the absence of the program. This suggests that GoI and other governments worldwide which are trying to accelerate the achievement of basic health and education indicators could consider applying the Generasi model in contexts where baseline levels of health service delivery are low.
● As this IE demonstrates, short– and long-term IEs are essential to ensuring that government programs continue to have an impact as the programs and context change. IEs can also inform governments about how to adjust targets appropriately.

10
Introduction
Background Indonesia has made remarkable strides in key human development Indicators over the past few decades. Primary school enrollment is close to universal for both boys and girls, and the child mortality rate has declined rapidly (World Bank 2006, 2008). Nevertheless, infant and maternal mortality, child malnutrition, junior secondary school enrollment, school transition rates, and learning outcomes are lower in Indonesia than in other countries in the region (World Bank 2006, 2008). Furthermore, there are substantial geographical disparities in these outcomes, with poorer outcomes in rural and remote provinces and districts. In 2007, the Government of Indonesia (GoI) launched two programs designed to tackle these issues: 1) the Hopeful Family Program (Program Keluarga Harapan, PKH), a conditional cash transfer (CCT) to households, and 2) the National Program for Community Empowerment – Healthy and Smart Generation (Program Nasional Pemberdayaan Masyarakat Generasi Sehat dan Cerdas, or PNPM Generasi), known as Generasi, an incentivized community block grant program. In 2014, the Generasi program was renamed Generasi Sehat Cerdas (“Bright Healthy Generation”) when it transferred administration from the Ministry of Home Affairs (MoHA) to the Ministry of Villages, Disadvantaged Areas and Transmigration (MoV). These two pilot projects began in six provinces and were designed to achieve the same objectives and goals2. These goals are consistent with GoI’s priorities and the Sustainable Development Goals: to reduce poverty, maternal mortality, and child mortality, as well as ensure universal coverage of basic education. PKH focused more on supply-side ready areas, including urban areas, while Generasi operated in rural areas. This study reports on the long-term evaluation of Generasi, conducted nine years after the program’s launch in 2007. Generasi differs from conventional CCT programs in that block grants are allocated to communities rather than to individual targeted households. Generasi focuses primarily on rural areas, building on a pre-exist GoI community program known as PNPM Rural. Under Generasi, over 1,600 rural villages received an annual block grant during the first year. Each village can use the grant for any activity that supported one of 12 indicators related to health and education service delivery (such as pre- and postnatal care, childbirth assisted by trained personnel, immunization, school enrollment, and school attendance). To incentivize communities to focus on the most effective policies, GoI bases the size of the village’s grant for the subsequent year partly on its performance on each of the 12 health and education targets. The Generasi project thus applies CCT program-style performance incentives
2 Indonesia is divided into provinces (the highest administrative unit). Below provinces are regencies (generally rural) and cities (generally urban). Regencies and cities are further divided into sub-districts (common in most of Indonesia) and districts (only present in Papua and West Papua). Finally, sub-districts and districts are divided into villages and urban communities. The neighborhoods within villages are called hamlets.

11
to communities, in a way that gives communities the flexibility to address supply and/or demand constraints. To allow for a rigorous, randomized evaluation of Generasi, GoI incorporated random assignment into the selection of Generasi locations. Each Generasi location was further randomly allocated to one of two versions of the program: 1) an “incentivized” treatment with the pay-for-performance component (treatment A) described above, or 2) an otherwise identical “non-incentivized” treatment without pay-for-performance incentives (treatment B). Starting in 2010, however, all Generasi locations shifted to using the incentivized version of the program based on results from the 2008 (18-month) wave of the impact evaluation (IE) (described below), which provided evidence that the incentivized grant model was more effective.
Results from the 2009 IE In 2009, a rigorous randomized IE using data from three survey waves (Wave I at baseline, Wave II 18 months after implementation, and Wave III 30 months after implementation) showed that the Generasi program had produced significant improvements in target health and education indicators (World Bank 2011). Strong improvements were made in the frequency of weight checks for young children, primary school participation rates, and malnutrition rates. Other indicators showed improvement in access to maternal, neonatal, and child health care services, such as an increase in mother and child participation in posyandu activities. Overall, the IE found a substantially positive impact on average across the 12 indicators it was designed to address. These improvements were especially marked in the lowest-performing areas. On average, the program was approximately twice as effective in areas in the 10th percentile of service provision (very low health and education status) at baseline as it was on average. In Nusa Tenggara Timur (NTT) province, for example, Generasi reduced underweight rates by 8.5 percentage points and severe stunting rates by 6.3 percentage points.
Motivation This report discusses the results of an IE of the long-term effects of the Generasi program. Evaluating the impact of programs over the long term is valuable for both policy makers and practitioners, yet long-term evaluations remain infrequent. As Wong (2012) notes, there are few longitudinal IEs in general, and those reviewed in the study measure, on average, only 3.1 years of project interventions. One of the reasons long-run evaluations are so rare is that in many cases, after a few years of implementation, the participating government expands the program into control areas. However, GoI chose to expand the program over time into new provinces rather than to control
12
areas in treatment provinces. This decision created a virtually unprecedented opportunity for a long-run evaluation of Generasi interventions. The current IE measures the effects of Generasi interventions over a comparatively long period of nine years. Using four waves of evaluation data, the report estimates effects over the medium– and long-term and evaluates how programming and intervention impacts have changed over time. Combining the long-term scope of the evaluation with the program’s large scale (a baseline sample of more than 12,000 households, with 1.8 million target beneficiaries in treatment areas), the current evaluation is very rare among both health and education evaluations in developing countries. This evaluation is also applicable to several of GoI’s key policy priorities, the most significant of which is the enactment of the Village Law in 2014, a massive decentralization effort that substantially increases direct transfers to villages.3 The IE will help inform how village governments spend Village Law funds, as well as efforts to align village investments with investments made by other levels of government to address health and education challenges. Further, the Indonesian Ministry of National Development Planning (Bappenas) has been developing a strategy called “Improving Basic Services for the Poor and Vulnerable,” which will focus on enhancing the accountability of public service provision through community participation and engagement. This IE will inform the design of Bappenas’ service delivery programs. In 2017, GoI launched a Presidential National Action Plan for reducing stunting with a multi-sectoral response. Beginning in 2018, the plan directs national ministries to focus their stunting-related programs and activities on 100 districts with a high stunting prevalence and incidence. The IE results will contribute to this program and a related World Bank operation, Investing in Nutrition and Early Years.
The Generasi Program4 Generasi began in mid-2007 in 164 pilot subdistricts spread across five provinces selected by GoI: West Java, East Java, North Sulawesi, Gorontalo, and NTT. By the time of the first IE in 2009, the program was operating in 264 subdistricts across these five provinces. It currently operates across 499 subdistricts in eleven provinces. However, the current report and analysis focuses on the 264 subdistricts considered in the 2009 IE. The Generasi project focuses on 12 indicators of maternal/child health and educational behavior. These indicators are in line with Ministry of Health priorities and protocols and GoI’s constitutional obligation to ensure nine years of basic education for all Indonesian children. GoI chose these indicators to be as similar as possible to the conditions for the individual household
3 Village transfers will be scaled over time. The national government allocated IDR 280 million (US$20,000) in 2015, and district governments are estimated to allocate around IDR 500 million (US$40,000). Each village will receive approximately IDR 1.4 billion (US$122,000) on average each year. 4 Portions of the description of the Generasi program in this section, as well as the experimental and evaluation design sections, draw directly from Olken et al. (2011).

13
CCT program piloted at the same time as Generasi (but in different locations). These 12 indicators relate to seeking health and educational services that are within the direct control of villagers – such as the number of children who receive immunizations, prenatal and postnatal care, and the number of children enrolled and attending school – rather than long-term outcomes, such as test scores or infant mortality. As school enrollment rates improved significantly across control and treatment areas over the past decade, in 2014 Generasi revised its education targets to better focus investments on the neediest populations. The new education targets include participation rates for children with disabilities and transition rates from primary to junior secondary school. In addition, Generasi introduced indicators to measure community participation in enhanced nutrition counseling sessions delivered through the posyandu. Under the Generasi program, all participating villages receive a block grant each year to improve education and maternal and child health. For example these grants can be used for a wide variety of purposes, including hiring extra midwives for the village, subsidizing the costs of prenatal and postnatal care, providing supplementary feeding (PMT), hiring extra teachers, opening a branch school in the village, providing scholarships or school supplies, providing transportation funds for health care or school attendance, improving health or school buildings, or rehabilitating a road to improve access to health and education facilities. Trained facilitators help each village elect an 11-member village management team and select local facilitators and volunteers to decide how to allocate the block grants (see Table 1). Through social mapping and in-depth discussion groups, villagers identify problems and bottlenecks in reaching the indicators. Inter-village meetings and consultation workshops with local health and education service providers allow community leaders to obtain information, technical assistance, and support from the local health and education offices and coordinate the use of Generasi funds with other health and education interventions in the area. Following these discussions, the elected management team makes the final Generasi budget allocation. Table 1 provides descriptive statistics on program facilitators. Most facilitators have a high school or post-diploma level education, with subdistrict facilitators holding much higher education levels than those at the village level. Facilitators have an average of five years of relevant facilitation experience before starting their current post, and those working at the subdistrict level tend to be more experienced. Facilitators also report an average gap of 5.2 months between the departure of a facilitator and the arrival of their replacement. Of facilitators that change jobs, about 16% go on to work as facilitators in other villages, while another 11% work in village administration. Approximately 60% of facilitators pursue other miscellaneous jobs, including entrepreneurship, farming, teaching, and working as posyandu cadres.

14
Table 1 Descriptive statistics, Generasi program facilitators
Facilitator Characteristics:
Characteristic Overall Subdistrict facilitators
Village facilitators
Average age 38.91 38.79 38.93
Educational attainment
SD (elementary school) incomplete
0.11% 0% 0.13%
SD (Islamic elementary school) or equivalent
5.54% 0% 6.76%
SMP (Islamic junior high school) or equivalent
16.09% 0.60% 19.50%
SMA (Islamic senior high school) or equivalent
45.65% 0.60% 55.57%
D1/D2/D3 (diploma) 2.50% 4.22% 2.12%
D4/S1 (post diploma) 29.24% 92.77% 15.25%
S2/S3 (masters) 0.54% 1.81% 0.27%
Not yet/never attended school
0.11% 0% 0.13%
Years of experience 5.02 6.55 4.68
Post-Generasi careers ● 15.6% facilitator elsewhere ● 11.3% village admin. ● 4.2% PNS, 2.1% government ● 0.8% students ● 57.5% other
Average gap between facilitators
5.22 months 5.92 months 5.05 months
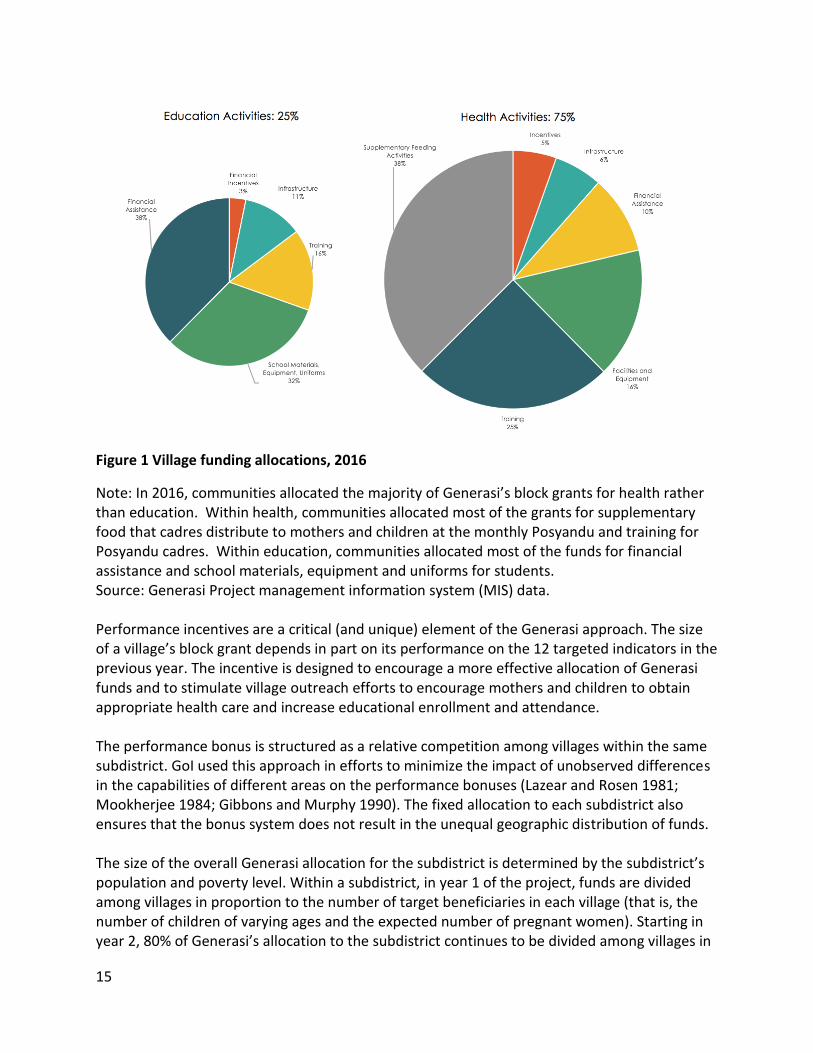
In 2016, communities used the bulk of their block grants for health activities (see Figure 1). Communities chose to use most of their funds allocated to education for “individual goods” such as school materials, equipment and uniforms, and school financial assistance. The majority of health funds were used for PMT and training.
15
Figure 1 Village funding allocations, 2016
Note: In 2016, communities allocated the majority of Generasi’s block grants for health rather than education. Within health, communities allocated most of the grants for supplementary food that cadres distribute to mothers and children at the monthly Posyandu and training for Posyandu cadres. Within education, communities allocated most of the funds for financial assistance and school materials, equipment and uniforms for students. Source: Generasi Project management information system (MIS) data. Performance incentives are a critical (and unique) element of the Generasi approach. The size of a village’s block grant depends in part on its performance on the 12 targeted indicators in the previous year. The incentive is designed to encourage a more effective allocation of Generasi funds and to stimulate village outreach efforts to encourage mothers and children to obtain appropriate health care and increase educational enrollment and attendance. The performance bonus is structured as a relative competition among villages within the same subdistrict. GoI used this approach in efforts to minimize the impact of unobserved differences in the capabilities of different areas on the performance bonuses (Lazear and Rosen 1981; Mookherjee 1984; Gibbons and Murphy 1990). The fixed allocation to each subdistrict also ensures that the bonus system does not result in the unequal geographic distribution of funds. The size of the overall Generasi allocation for the subdistrict is determined by the subdistrict’s population and poverty level. Within a subdistrict, in year 1 of the project, funds are divided among villages in proportion to the number of target beneficiaries in each village (that is, the number of children of varying ages and the expected number of pregnant women). Starting in year 2, 80% of Generasi’s allocation to the subdistrict continues to be divided among villages in
16
proportion to the number of target beneficiaries; the remaining 20% forms a performance bonus pool, to be divided among villages based on their performance on the 12 indicators. Generasi originally included two distinct treatment arms to separate the impact of the performance bonuses from the overall impact of the block grant program. From 2010, all treatment areas received the block grant program with performance bonuses. The performance bonus pool is allocated to villages in proportion to a weighted sum of each village’s performance above a predicted minimum achievement level. Specifically, each village’s share of the performance bonus pool is determined by:
Share of bonusv = 𝑃𝑣
∑ 𝑃𝑗, where 𝑃𝑣 = ∑⌊𝑤𝑖𝑋(𝑦𝑣𝑖 − 𝑚𝑣𝑖)⌋,
where yvi represents village v’s performance on indicator i, wi represents the weight for indicator i, mvi represents the predicted minimum achievement level for village v and indicator i, and Pv is the total number of bonus “points” earned by village v. Generasi uses performance relative to a constant predicted minimum attainment level, rather than improvements over an actual baseline, to avoid the ratchet effect (Weitzman 1980); the minimums, mvi, are determined based on historical national datasets. The Generasi project design built on GoI’s PNPM Rural program, which, along with its predecessor program (Kecamatan Development Project (KDP)), have funded over US$2 billion in local infrastructure and microcredit programs in some 61,000 Indonesian villages over the period from 1998–2014. The Generasi project is implemented by MoV, and is funded through GoI resources and in part by loans from the World Bank and grants from several bilateral donors. Technical assistance and evaluations have been supported by a multi-donor trust fund with contributions from the World Bank, embassies of the Netherlands, Australia, United Kingdom, and Denmark, and the World-Bank-managed Spanish Impact Evaluation Fund. The 2016 Impact Evaluation was supported by the Australian Department of Foreign Affairs and Trade.
Village-Level Block Grants This section describes the allocation of Generasi block grants and how villages have chosen to spend grant funds over time. Unfortunately, while data on the annual block grant allocation and planned expenditures are available at the village-year level, data on actual realized expenditures are only available at the provincial level. Although the IE team expects planned and actual expenditures to correspond closely, there are limited opportunities to analyze village-level expenditures. Overall, annual Generasi allocations have declined steadily over time from a peak in 2009 (see Figure 2). However, yearly allocations ignore the disbursement of multi-year grants, and do not take into account the fact that unspent funds are carried forward into the next programming year.

17
Figure 2 Average block grant size per IE village
Note: Beginning in 2009, there was a steady decline in annual Generasi allocations. This figure does not show the disbursement of multi-year grants, and does not account the fact that unspent funds are carried forward into the next programming year. The disbursements of Generasi block grants are likely to be higher in 2015 and 2016 than what this figure shows. Source: MIS data Data on annual and multi-year planned expenditures for the available time period of 2013–16 show that disbursements increased in 2015 and 2016 (see Figure 3). The sharp increase in 2016 is a function of a programming delay in 2015, which meant some disbursements scheduled for 2015 were held until 2016, as well as a new regulation that pushed villages to spend unused funds by the end of 2016.
18
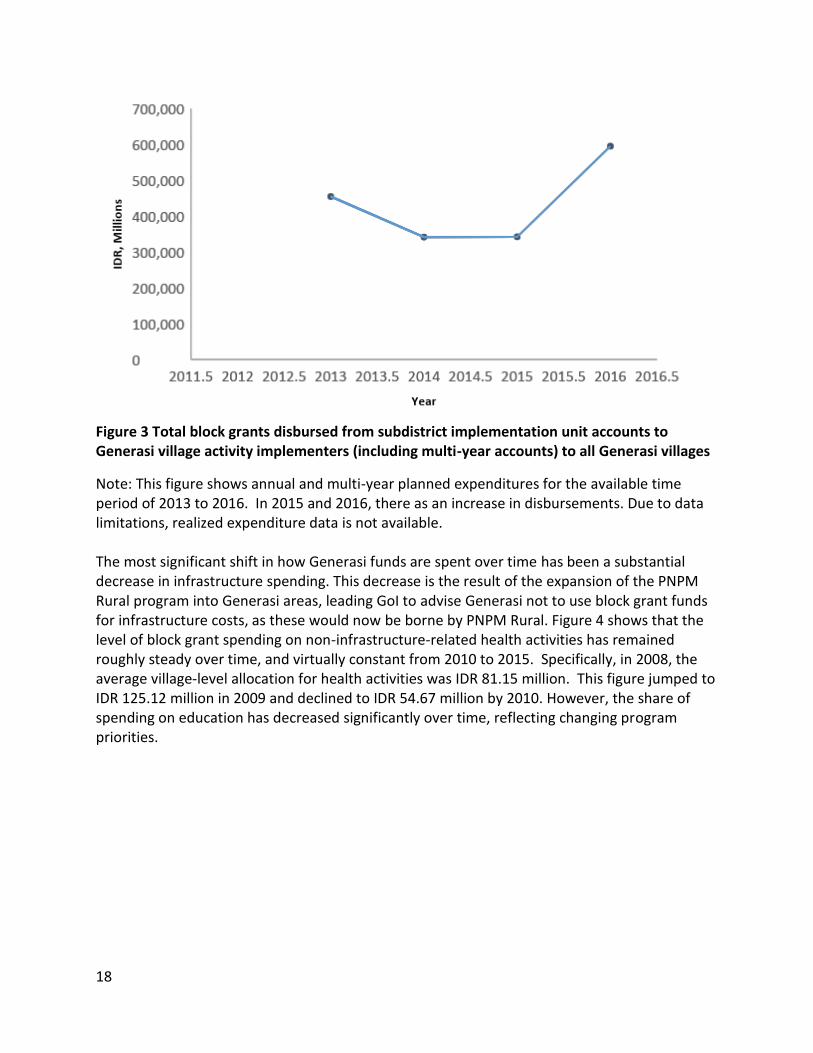
Figure 3 Total block grants disbursed from subdistrict implementation unit accounts to Generasi village activity implementers (including multi-year accounts) to all Generasi villages
Note: This figure shows annual and multi-year planned expenditures for the available time period of 2013 to 2016. In 2015 and 2016, there as an increase in disbursements. Due to data limitations, realized expenditure data is not available. The most significant shift in how Generasi funds are spent over time has been a substantial decrease in infrastructure spending. This decrease is the result of the expansion of the PNPM Rural program into Generasi areas, leading GoI to advise Generasi not to use block grant funds for infrastructure costs, as these would now be borne by PNPM Rural. Figure 4 shows that the level of block grant spending on non-infrastructure-related health activities has remained roughly steady over time, and virtually constant from 2010 to 2015. Specifically, in 2008, the average village-level allocation for health activities was IDR 81.15 million. This figure jumped to IDR 125.12 million in 2009 and declined to IDR 54.67 million by 2010. However, the share of spending on education has decreased significantly over time, reflecting changing program priorities.

19
Figure 4 Average village-level expenditures (excluding infrastructure)
Note: The level of block grant spending on non-infrastructure-related health activities has remained relatively steady over time, and virtually constant from 2010 to 2015. Yet, over time, the share of spending on education has decreased, reflecting changing program priorities.
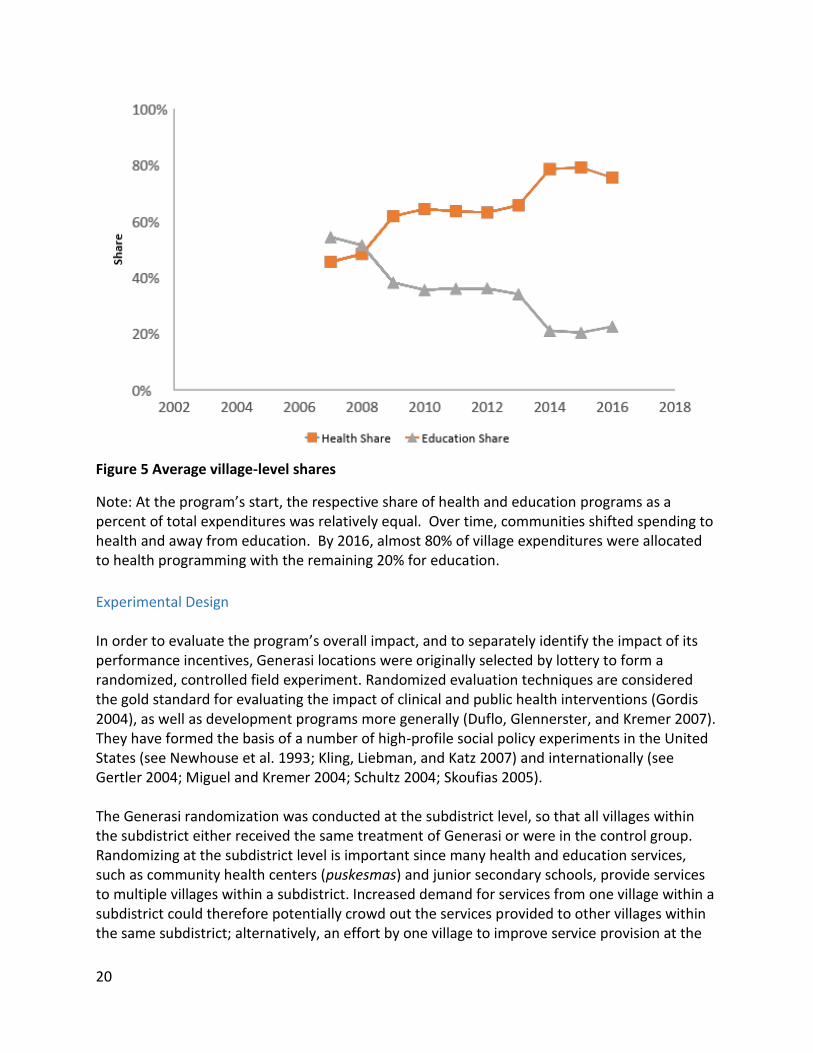
Spending Choices Treatment communities have changed how they allocate funds from the block grants over time to prioritize health interventions over educational ones. Figure 5 demonstrates that the respective share of health and education programs as a percent of total expenditures was relatively similar at the start of the program, but gradually diverges as the share of health expenditures grows rapidly. By 2016, roughly 80% of village expenditures were allocated to health programming, leaving the remaining 20% for education. This shift in spending was partly caused by changing priorities within the national implementing agency, which in turn reflect the dramatic expansion in non-Generasi education expenditures at the national level. As primary and secondary school enrollment rates have improved significantly over the past decade, the Directorate for Village and Community Empowerment reformulated education targets to shift communities’ focus toward identifying and assisting hard-to-reach out-of-school children, including those with disabilities, and to focus on the transition phase from primary to junior secondary school. This resulted in fewer education target indicators and potentially fewer incentives for communities to use the Generasi funds for education-related purposes.
20
Figure 5 Average village-level shares
Note: At the program’s start, the respective share of health and education programs as a percent of total expenditures was relatively equal. Over time, communities shifted spending to health and away from education. By 2016, almost 80% of village expenditures were allocated to health programming with the remaining 20% for education.
Experimental Design In order to evaluate the program’s overall impact, and to separately identify the impact of its performance incentives, Generasi locations were originally selected by lottery to form a randomized, controlled field experiment. Randomized evaluation techniques are considered the gold standard for evaluating the impact of clinical and public health interventions (Gordis 2004), as well as development programs more generally (Duflo, Glennerster, and Kremer 2007). They have formed the basis of a number of high-profile social policy experiments in the United States (see Newhouse et al. 1993; Kling, Liebman, and Katz 2007) and internationally (see Gertler 2004; Miguel and Kremer 2004; Schultz 2004; Skoufias 2005). The Generasi randomization was conducted at the subdistrict level, so that all villages within the subdistrict either received the same treatment of Generasi or were in the control group. Randomizing at the subdistrict level is important since many health and education services, such as community health centers (puskesmas) and junior secondary schools, provide services to multiple villages within a subdistrict. Increased demand for services from one village within a subdistrict could therefore potentially crowd out the services provided to other villages within the same subdistrict; alternatively, an effort by one village to improve service provision at the
21
community health center could also benefit other villages in the same subdistrict. By randomizing at the subdistrict level, so that all villages in the subdistrict receive the same treatment status, the evaluation design ensures that the total net effect of the program is captured, since any within-subdistrict spillovers would also be captured in other treatment villages. This type of cluster-randomized design is common in program evaluations where there might be local spillovers from the treatment (Miguel and Kremer 2004; Olken 2007).
The Generasi locations were selected using the following procedure. First, 300 target subdistricts were identified, targeting poor, rural areas that had an existing community-driven development infrastructure. Each subdistrict was then randomly assigned by computer into one of three equal-sized groups: treatment A, incentivized (100 subdistricts); treatment B, non-incentivized (100 subdistricts); or control (100 subdistricts). Within a subdistrict, all villages received the same treatment. The randomization was stratified by district (kabupaten) to ensure a balanced randomization across the 20 districts in the study. The tests for balance confirm that the three groups of subdistricts appear similar on pre-period characteristics (World Bank 2008). Note that 36 of the 300 subdistricts should not have been included in the randomization, as they were ineligible for Generasi because they had been selected (prior to the randomization) to receive other programs or had had prior implementation problems with previous programs. Since the eligibility decision was made on the basis of lists determined prior to the randomization, and since those lists were obtained for treatment and control areas, ineligible subdistricts in both treatment and control groups were excluded from the main analysis. The 2009 IE relied on the original lottery assignment for its analysis, focusing on the 264 eligible subdistricts and interpreting results as intent-to-treat (ITT) estimates (Imbens and Angrist 1994). The current evaluation focuses on these 264 subdistricts and also interprets results as ITT estimates. Figure 6 depicts the status of treatment assignment in Wave III (2009) and the focus of the current report, Wave IV (2016). At the time of Wave III no subdistrct assigned to the control group incorrectly received treatment. However, 20 villages subdistrct to treatment had still not begun participating in Generasi at the time of the survey. By Wave IV, five control villages were participating in the program, while two of the original 20 subdistrcts that failed to receive treatment began participating. Thus randomization assignment has remained remarkably intact over nine years. Only a handful of the original control subdistrcts gained access to treatment, while two treatment subdistrcts began receiving programming after a delay.
22
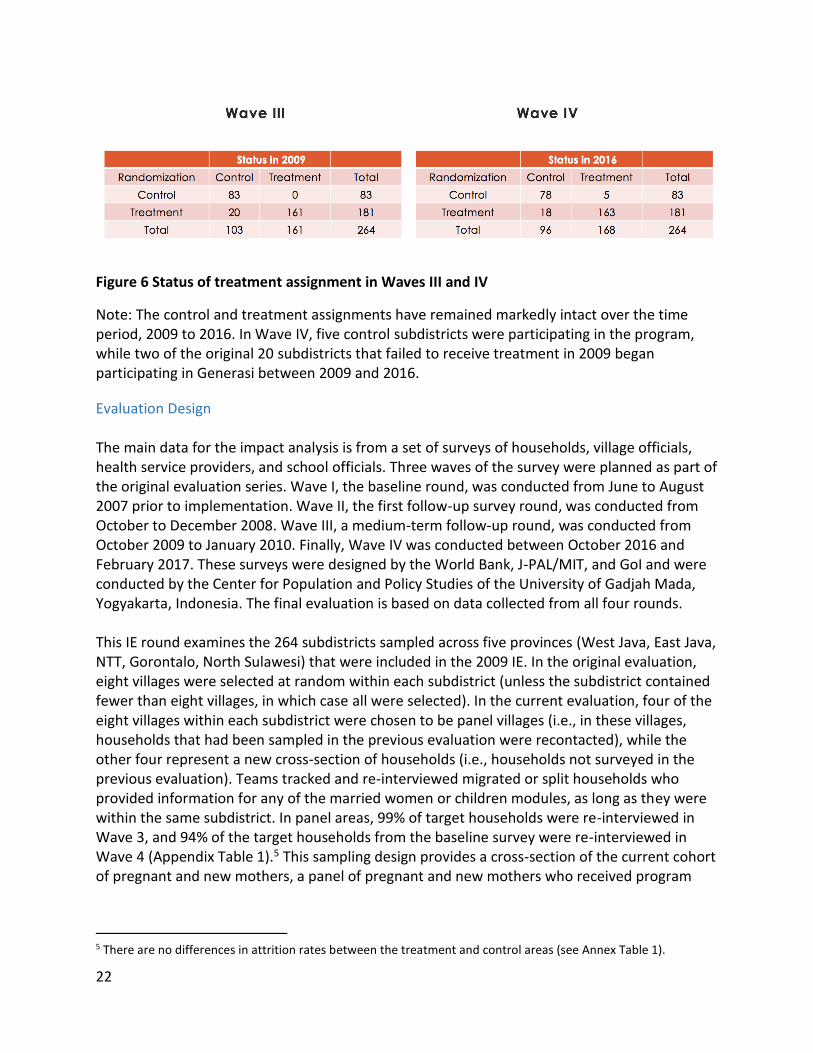
Figure 6 Status of treatment assignment in Waves III and IV
Note: The control and treatment assignments have remained markedly intact over the time period, 2009 to 2016. In Wave IV, five control subdistricts were participating in the program, while two of the original 20 subdistricts that failed to receive treatment in 2009 began participating in Generasi between 2009 and 2016.
Evaluation Design The main data for the impact analysis is from a set of surveys of households, village officials, health service providers, and school officials. Three waves of the survey were planned as part of the original evaluation series. Wave I, the baseline round, was conducted from June to August 2007 prior to implementation. Wave II, the first follow-up survey round, was conducted from October to December 2008. Wave III, a medium-term follow-up round, was conducted from October 2009 to January 2010. Finally, Wave IV was conducted between October 2016 and February 2017. These surveys were designed by the World Bank, J-PAL/MIT, and GoI and were conducted by the Center for Population and Policy Studies of the University of Gadjah Mada, Yogyakarta, Indonesia. The final evaluation is based on data collected from all four rounds. This IE round examines the 264 subdistricts sampled across five provinces (West Java, East Java, NTT, Gorontalo, North Sulawesi) that were included in the 2009 IE. In the original evaluation, eight villages were selected at random within each subdistrict (unless the subdistrict contained fewer than eight villages, in which case all were selected). In the current evaluation, four of the eight villages within each subdistrict were chosen to be panel villages (i.e., in these villages, households that had been sampled in the previous evaluation were recontacted), while the other four represent a new cross-section of households (i.e., households not surveyed in the previous evaluation). Teams tracked and re-interviewed migrated or split households who provided information for any of the married women or children modules, as long as they were within the same subdistrict. In panel areas, 99% of target households were re-interviewed in Wave 3, and 94% of the target households from the baseline survey were re-interviewed in Wave 4 (Appendix Table 1).5 This sampling design provides a cross-section of the current cohort of pregnant and new mothers, a panel of pregnant and new mothers who received program
5 There are no differences in attrition rates between the treatment and control areas (see Annex Table 1).

23
benefits in an earlier pregnancy, and a panel of existing children, as well as new children within the same family. Surveys targeted both beneficiary and provider populations: households, service providers, and governance personnel. The sampling design for households was chosen to ensure adequate coverage in the key Generasi demographic groups: new mothers, children under three, and school-age children. Within each of the new cross-section villages, one hamlet was randomly selected, and a list of all households was obtained from the head of the hamlet. Five households were randomly sampled from that list to be interviewed, stratified to fulfill the following criteria:
● Type 1 (three households): Household with at least one child under age two, a pregnant mother, or a mother who was been pregnant in the last two years;
● Type 2 (one household): Household with at least one child under 15, but not included as Type 1; and
● Type 3 (one household): Household does not fit the criteria of Type 1 or Type 2 households. In the panel villages, households were chosen back in 2007 to have two households with children of Type 1, two households of Type 2, and one household of Type 1 based on the ages of children at that time. All of these households are followed in panel villages.
In addition, in cross-section households, additional households were sampled for a short module that focused on a few key outcomes – underweight, stunting, wasting and infant mortality. Four Type 1 households were selected from the household listing, and all children aged 0–12 in the household at the time had their anthropometric measurements (height and weight) taken. Separate instruments were administered for household heads, pregnant mothers, infants (0–2 years) and young children (6–15 years). For service providers, enumerators collected data from puskesmas workers, midwives, school officials, and health post (posyandu) volunteers. Finally, sampled facilitators include subdistrict heads, village heads (elected by their communities), and programming facilitators. Data from these surveys were supplemented with detailed administrative data from the Generasi project’s internal MIS. This included detailed budget allocations for the block grants, performance data on the Generasi indicators, and data on participation levels in Generasi village meetings. In addition, a joint team comprised of representatives from J-PAL, Kompak, Bappenas, and the World Bank conducted a qualitative study to assess the impact of a program disruption in 2015 on service delivery and target outcomes. This qualitative study allowed the study team to contextualize some of the decision-making and implementation challenges behind the quantitative results.
Methodology This section describes the 12 original target indicators, eight of which are associated with health outcomes and four with education, as well as the revised indicators that followed from

24
the 2014 revision of the program (Figure 7). Target health outcomes consider both health care-related behaviors (e.g., pre- and postnatal care visits) and outcomes (e.g., rate of underweight children in village). Education indicators focus largely on participation, tracking enrollment and attendance rates for primary and junior secondary students. The 2014 revised health indicators track participation rates for pregnant women and male partners in nutrition counseling sessions as well as participation rates for parents of infants in nutrition counseling sessions. The new education indicators include enrollment rates for children at risk of dropping out or not being enrolled in school at all, as well as transition rates from primary to junior secondary school.
Figure 7 Generasi program target indicators
Note: This table shows the 12 original target indicators, eight of which are associated with health outcomes and four with education, as well as the revised indicators that followed from the 2014 program revision.
25
Regression Specification Given that treatment assignment was randomized in the Generasi program, the IE is econometrically straightforward: a comparison of outcomes in treatment and control subdistricts, controlling for outcome levels at baseline. The sample is restricted the 264 subdistricts that were analyzed in the 2009 IE. Following the methodology used in that evaluation, treatment status (GENERASI) is defined here as an indicator variable that takes a value of 1 if the subdistrict was randomized to receive GENERASI. Note that since 2010 all subdistricts assigned to treatment have received the incentivized version of the program, so there is no longer an unconditional grant program to evaluate. As a result, treatment effects reflect differences in outcomes from receiving the performance-incentivized block grants versus being in the control group. 6 Defining treatment status in this way exploits only the variation in program exposure due to chance. This captures the ITT effect of the program, and since the lottery results were very closely followed – they predict true program implementation in 90% of subdistricts in 2016/17 (according to Figure 6 above) – they will be very close to the true effect of the treatment on the treated (Imbens and Angrist 1994). All regression specifications control for the baseline value of the outcome variable. This includes controls for the outcome’s average baseline value for the subdistrict, individual-specific pre-period panel data values for those who have it, and a dummy variable that corresponds to having non-missing pre-period variables. All household survey regressions further include dummies for the three different sample types interacted with whether a household came from a panel or non-panel village. Finally, since many of the indicators for children vary naturally as the child ages, all child-level variables include age dummies. For each indicator of interest, the following regression was run:
(1) where p is a person, d is a district, t is the survey wave (t = 4 in the above regression, for Wave IV), ypdsi4 is the outcome in Wave IV, ⍺d is a district fixed effect, ypdsi1 is the baseline value for individual i (assuming this is a panel household and baseline values are non-missing; 0 otherwise), 1{ypdsi1≠missing} is a dummy for the baseline value being missing, and 𝑦𝑝𝑑𝑠1̅̅ ̅̅ ̅̅ ̅ is the
average baseline value for the subdistrict. SAMPLE includes dummies indicating how the household was sampled interacted with being a panel or cross-section household, and 𝛼𝑝 × 𝑃𝑠
6 We also checked whether there are any differences in achievement of these targets and of final outcomes between the
subdistricts that were initially incentivized, compared to subdistricts that only initially received the block grants without incentives during the period up until 2009. The results do not differ among the subdistricts that were part of one of the two treatment arms between 2007 and 2009. These results are available in Annex Tables 2 and 3.

26
are province-specific dummies for being in the previous KDP sample. Standard errors are clustered at the subdistrict level in all specifications.7 Due to the large number of indicators, in order to calculate joint significance, average standardized effects are calculated for each family of indicators, following Kling, Liebman, and
Katz (2007). Specifically, for each indicator i, define 𝜎𝑖2 to be the variance of i. Equation (1) is
then estimated for each indicator, but the regressions are run jointly, clustering the standard errors by subdistrict to allow for arbitrary correlation among the errors within subdistricts, both between and across indicators. The average standardized effect is then defined as:
∑�̂�𝑖
𝜎𝑖𝑖
Finally, note that all reported p-values are calculated using a randomization inference procedure (Athey and Imbens 2017).
Heterogeneity Part of the analysis will explore the existence of heterogeneous treatment effects based on either pre-existing conditions or province-level differences. This analysis will focus on the ten target health and education indicators (see Table 2, Targets Intermediate Outcomes) as well as the final outcomes detailed above. In order to detect heterogeneous treatment effects related to pre-existing conditions, we generate predicted outcomes in the absence of treatment for both treatment and control areas by regressing outcome indicators on district dummies. We then group districts into terciles of predicted performance and estimate the impact of the program separately for each tercile. We follow Abadie, Chingos, and West (2013) in using a repeated split sample estimation strategy, which yields unbiased heterogeneous treatment effects in this context. This approach allows a proper estimation of whether the program was more effective in areas that would have done worse in the absence of the program, but also allows for the fact that which districts are most in need has changed over the nearly 10 years since the baseline. The IE also explores whether there are heterogeneous effects across the five provinces in the sample by interacting treatment status with an indicator for each of the specified provinces. This analysis is of particular interest to the Ministry of Health, MoV and Bappenas, given that the previous analysis found substantial impacts of Generasi on reducing severe stunting exclusively in NTT.
7 For each regression on the target intermediate and final outcomes, we checked whether the results are consistent with only estimating the models on the households that were newly sampled repeated cross-sections in each survey wave (i.e. dropping panel households). The results do not differ between the models that are estimated on the full dataset and only the cross-sectional data. See Annex Tables 4 and 5.

27
Balance Tests Determining whether randomization was carried out properly is key to drawing inferences about program effects. Balance tests using baseline data for the 12 major indicators and the average standardized effect outcomes were carried out in the 2011 IE and are described more fully in that report (Olken et al. 2011). Results from the balance tests are consistent with a balanced sample of treatment and control groups, and confirm that randomization was indeed carried out properly.
Pre-Analysis Plan All of the analyses presented here (regression specifications, outcome variables, and aggregate effects) follow a plan that was finalized before examining the unblinded Wave IV data.8 In conjunction with GoI, the evaluation team agreed on two sets of primary outcomes for the analysis that were registered in the pre-analysis plan (see Table 2). One set of primary outcomes is composed of the eight original Generasi target health indicators. The second set of primary outcomes is composed of long-term health indicators bearing on malnutrition and cognitive capacity. The rest of the outcome variables are relegated to secondary status. Results using these variables are presented as additional analysis. Table 2 Wave IV indicators
Primary
Secondary
Targets (Intermediate) Outcomes
● Prenatal care (Number of prenatal visits by all moms who gave birth in last 24 months)
● 7 to 12 participation rate (Enrollment dummy for ages 7–12 in school year 2016/2017)
● Delivery (delivery by trained midwife/doctor, for all moms who gave birth in last 24 months)
● 13 to 15 SMP participation rate (Enrollment dummy for ages 13–15 in SMP in school year 2016/2017))
● Postnatal care (number of postnatal visits within 42 days after delivery by all moms who gave birth in last 24 months)
● Iron pills (number of iron tablet sachets during pregnancy for all
8 This hypothesis document was registered with the American Economic Association Social Science Registry
(https://www.socialscienceregistry.org/trials/332) on April 26, 2017 (prior to analyzing any data from this wave separately by treatment and control (i.e., the data was examined without any identifiers marking treatment vs. control areas) and is available upon request.

28
moms who gave birth in last 24 months)
● Immunizations (percent of recommended immunizations up to 11 months, for all kids 23 months old and below)
● Weight checks (number of weight checks in past three months, for all kids below age three, using mom’s recall of # posyandu visits in last three months, but 0 if child was not weighed at last visit)
● Vitamin A (number of vitamin A supplements in past 18 months, for all kids aged six months to two years)
● Underweight (% underweight, weight-for-age less than two standard deviations, all kids below age three)
Targets added in 2014 (not in pre-analysis plan)
● Parenting classes (attendance, frequency, mother with child under five)
● Prenatal (maternal) classes (attendance, women who have been pregnant in the last 24 months)
● School participation rate for children with special needs (enrollment dummy for special needs in school year 2016/2017)
Final Outcomes
● Underweight (weight-for-age less than two standard deviations, all kids below age three)
● Neonatal mortality (death of child aged 0–28 days, all births since 2010)
● Severe underweight (weight-for-age less than three standard deviations, all kids below age three)
● Infant mortality (death of child aged 0–11 months, all births since 2010)
● Wasting (weight-for-height less than two standard deviations, all kids below age three)
● Language score (age-adjusted Z-score)
● Severe wasting (weight-for-age less than three standard
● Math score (age-adjusted Z-score)
29
deviations, all kids below age three)
● Stunting (height-for-age less than two standard deviations, all kids below age three)
● Total test score: sum of language and math score (age-adjusted Z-score)
● Severe stunting (weight-for-age less than three standard deviations, all kids below age three)
● Raven’s test of cognitive ability (cognitive assessment, age-adjusted Z-scores)
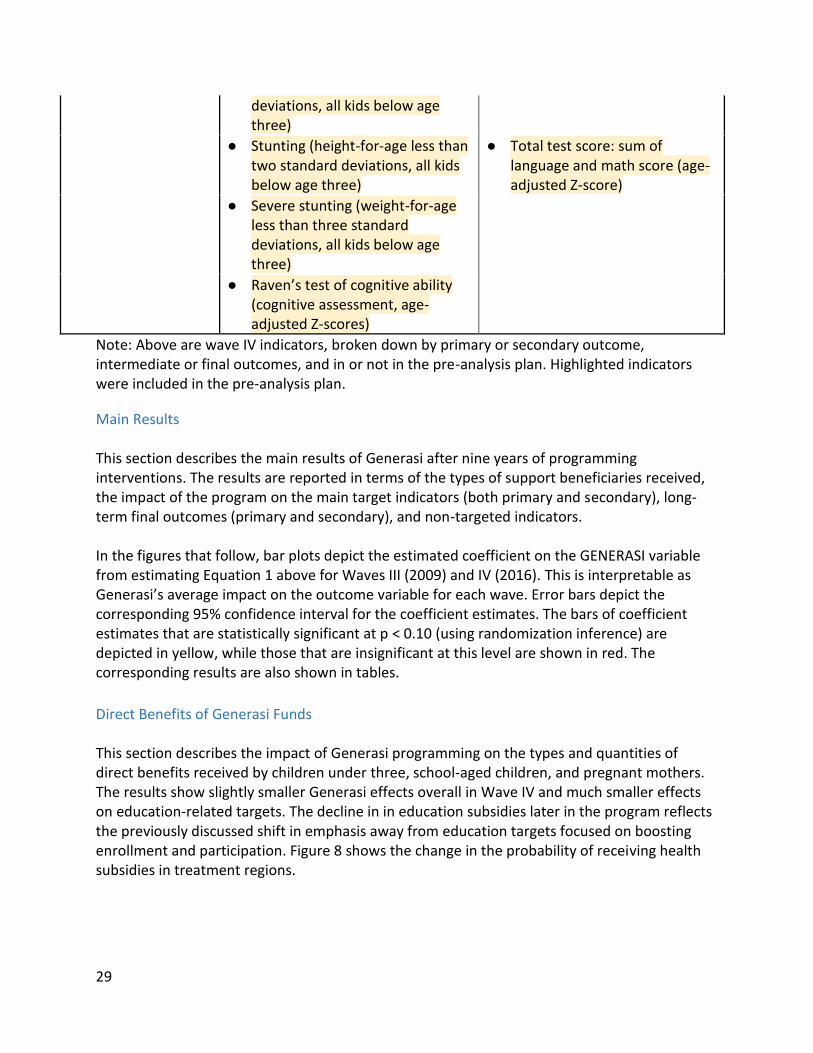
Note: Above are wave IV indicators, broken down by primary or secondary outcome, intermediate or final outcomes, and in or not in the pre-analysis plan. Highlighted indicators were included in the pre-analysis plan.
Main Results This section describes the main results of Generasi after nine years of programming interventions. The results are reported in terms of the types of support beneficiaries received, the impact of the program on the main target indicators (both primary and secondary), long-term final outcomes (primary and secondary), and non-targeted indicators. In the figures that follow, bar plots depict the estimated coefficient on the GENERASI variable from estimating Equation 1 above for Waves III (2009) and IV (2016). This is interpretable as Generasi’s average impact on the outcome variable for each wave. Error bars depict the corresponding 95% confidence interval for the coefficient estimates. The bars of coefficient estimates that are statistically significant at p < 0.10 (using randomization inference) are depicted in yellow, while those that are insignificant at this level are shown in red. The corresponding results are also shown in tables.
Direct Benefits of Generasi Funds This section describes the impact of Generasi programming on the types and quantities of direct benefits received by children under three, school-aged children, and pregnant mothers. The results show slightly smaller Generasi effects overall in Wave IV and much smaller effects on education-related targets. The decline in in education subsidies later in the program reflects the previously discussed shift in emphasis away from education targets focused on boosting enrollment and participation. Figure 8 shows the change in the probability of receiving health subsidies in treatment regions.

30
Figure 8 Impact on health subsidies
Note: This figure shows the amount of health subsidies mothers are receiving for pre – and postnatal care and childbirth. Compared to Wave III, mothers are receiving substantially less health subsides in Wave IV. Households in treatment regions across both waves are significantly more likely to receive health subsidies for pre-/postnatal care and childbirth than control regions, although by Wave IV the effect is substantively smaller, particularly for childbirth. One potential reason for this decrease is the expansion of GoI’s national health insurance program during this time, which led communities to increasingly choose not to spend block grant funds on health-related subsidies. Wave IV demonstrates a significant Generasi effect in communities receiving PMT at the posyandu,9 though the magnitude is half of what was found in Wave III (Figure 9). The effect of Generasi on intensive PMT (receiving supplementary food, or PMT, at least four times a month) decreases substantially from Wave III to Wave IV and is not significantly different from zero. For the new Wave IV indicators (number of days receiving PMT in the past three months for underweight and unrestricted samples) we find a small but significantly positive effect among all children and a larger and significant effect among underweight children.
9 There are two types of PMT: PMT that is distributed at the posayndu, which is often a low nutritional content snack used to incentivize attendance at the posayndu, and nutritious PMT that is distributed at the puskesmas to treat malnutrition.

31
Figure 9 Impact of Generasi on Receipt of PMT
Note: Mothers are receiving more PMT at the posyandu in Genrasi than in control villages although the magnitude is half of what was found in Wave III. By comparison, there are no statistically significant differences in the amount of intensive PMT that households in Generasi and control villages are receiving. There is a small but significant difference in the number of days children (unrestricted sample) receive PMT. The slight decrease in PMT access from Wave III to Wave IV is reflected in expenditure data (Figure 10). Village expenditures for both intensive and non-intensive PMT have declined since 2009 (Wave III).

32
Figure 10 PMT expenditure according to MIS data
Note: The slight decrease in PMT access from Wave III to Wave IV is reflected in this expenditure data. Village expenditures for intensive and non-intensive PMT have declined since 2009 (Wave III). Given the overall shift in programming priorities away from increasing school enrollment and participation rates, it is not surprising to see in Wave IV that Generasi is producing substantially weaker effects on spending geared toward enrollment and participation-boosting activities (Figure 11). Generasi areas are significantly less likely to receive education scholarships than control areas, and the positive effects on reception of uniforms, supplies, and other types of support in Wave III become very small or disappear entirely in Wave IV; the average standardized effects for education direct benefits are not statistically significantly different from zero (see Appendix Table 3).

33
Figure 11 Impact on education benefits
Note: In Wave IV, Generasi is producing substantially weaker effects on spending geared toward school enrollment and participation-boosting activities than what was observed in Wave III. Children in Generasi areas are significantly less likely to receive education scholarships than children in control areas. The positive effects on reception of uniforms, supplies, and other types of support in Wave III are either very small or disappear in Wave IV.
Program Impact on Main Targeted Indicators This section describes the impact on the primary health indicators and secondary education indicators after nine years of program implementation. For each indicator provided to the villagers for improvement, Generasi’s impact is examined on an analogous indicator from the household survey. The average standardized effect is assessed first because, as discussed above, it represents a statistically efficient way of pooling all the effects to maximize statistical power given that there is insufficient statistical power to detect effects on individual indicators. It is important to note that while Generasi may have affected the average of the indicators, this does not mean that it affected all of them individually. Conversely, given that some indicators used in the study have weak statistical power, it is possible that Generasi is affecting more than just the indicators that are individually statistically significant. Overall, improvements on target health indicators in Wave III are found to be broadly similar in magnitude for Wave IV, but often do not reach the same level of statistical significance. Specifically, the program’s average standardized effects (Figure 12) on health are slightly smaller in Wave IV than Wave III and fall just below statistically significant levels – the average standardized effect for health in Wave IV is 0.027 standard-deviation (p-value 0.142), compared to 0.039 in Wave III. There is also a large change in target education indicators from Wave III to Wave IV. While the average standardized effect for education is large and statistically significant in Wave III, the same metric is effectively zero in Wave IV.

34
Figure 12 Average standardized effects
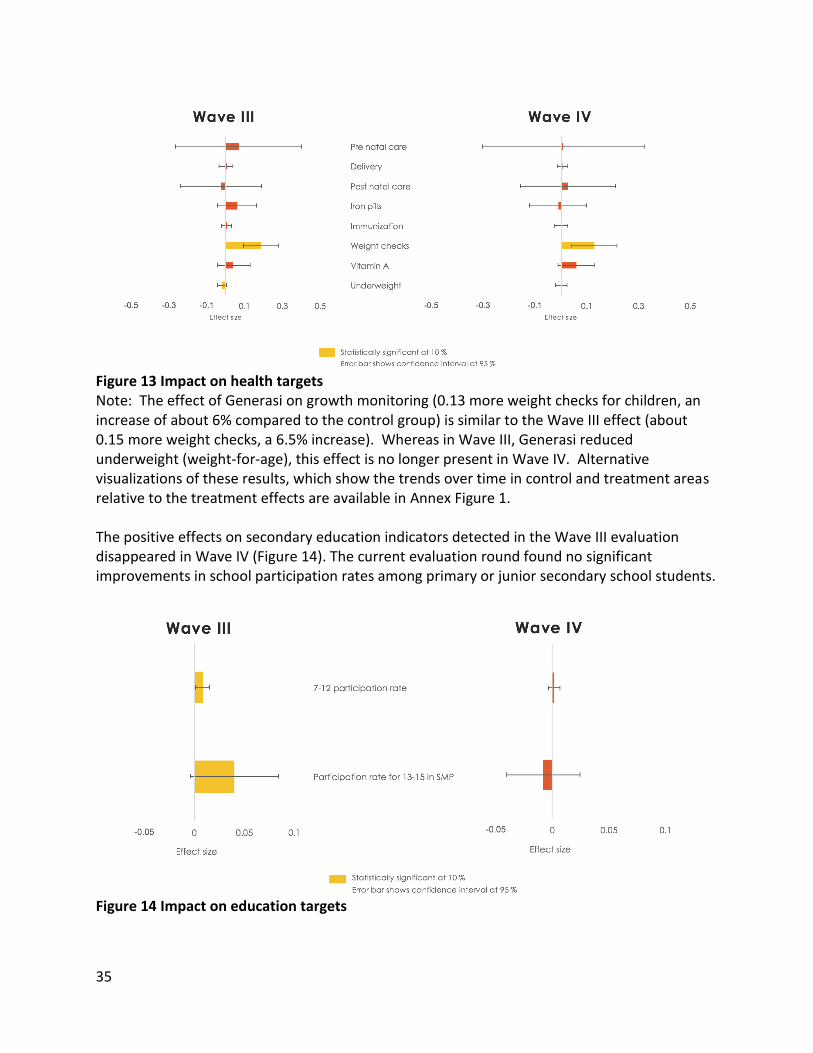
Note: The program’s average standardized effects on health are slightly smaller in Wave IV than Wave III and fall just below statistically significant levels. Whereas the average standardized effect for education is large and statistically significant in Wave III, the same indicator is effectively zero in Wave IV. For the individual target health indicators, there are strong effects on growth monitoring in Wave IV (Figure 13): Generasi led to about 0.13 more weight checks for children, an increase of about 6% compared to the control group. This is similar to the Wave III effect of about 0.15 more weight checks (6.5% increase). The main change, however, is that the reduction in underweight (weight-for-age) that was associated with Generasi in Wave III is no longer present in Wave IV. The indicators that were not found to have significant changes in Wave III (e.g., iron pill uptake) continued to show no significant improvement in Wave IV.
35
Figure 13 Impact on health targets Note: The effect of Generasi on growth monitoring (0.13 more weight checks for children, an increase of about 6% compared to the control group) is similar to the Wave III effect (about 0.15 more weight checks, a 6.5% increase). Whereas in Wave III, Generasi reduced underweight (weight-for-age), this effect is no longer present in Wave IV. Alternative visualizations of these results, which show the trends over time in control and treatment areas relative to the treatment effects are available in Annex Figure 1. The positive effects on secondary education indicators detected in the Wave III evaluation disappeared in Wave IV (Figure 14). The current evaluation round found no significant improvements in school participation rates among primary or junior secondary school students.
Figure 14 Impact on education targets
36
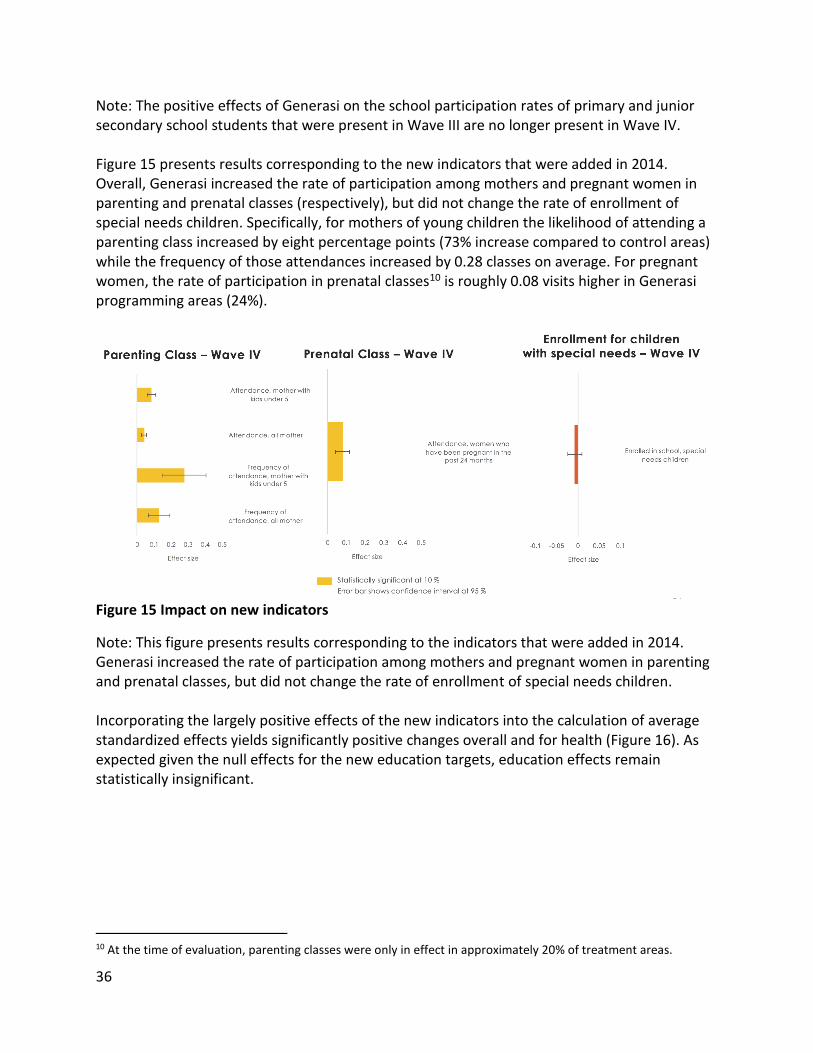
Note: The positive effects of Generasi on the school participation rates of primary and junior secondary school students that were present in Wave III are no longer present in Wave IV. Figure 15 presents results corresponding to the new indicators that were added in 2014. Overall, Generasi increased the rate of participation among mothers and pregnant women in parenting and prenatal classes (respectively), but did not change the rate of enrollment of special needs children. Specifically, for mothers of young children the likelihood of attending a parenting class increased by eight percentage points (73% increase compared to control areas) while the frequency of those attendances increased by 0.28 classes on average. For pregnant women, the rate of participation in prenatal classes10 is roughly 0.08 visits higher in Generasi programming areas (24%).
Figure 15 Impact on new indicators
Note: This figure presents results corresponding to the indicators that were added in 2014. Generasi increased the rate of participation among mothers and pregnant women in parenting and prenatal classes, but did not change the rate of enrollment of special needs children. Incorporating the largely positive effects of the new indicators into the calculation of average standardized effects yields significantly positive changes overall and for health (Figure 16). As expected given the null effects for the new education targets, education effects remain statistically insignificant.
10 At the time of evaluation, parenting classes were only in effect in approximately 20% of treatment areas.
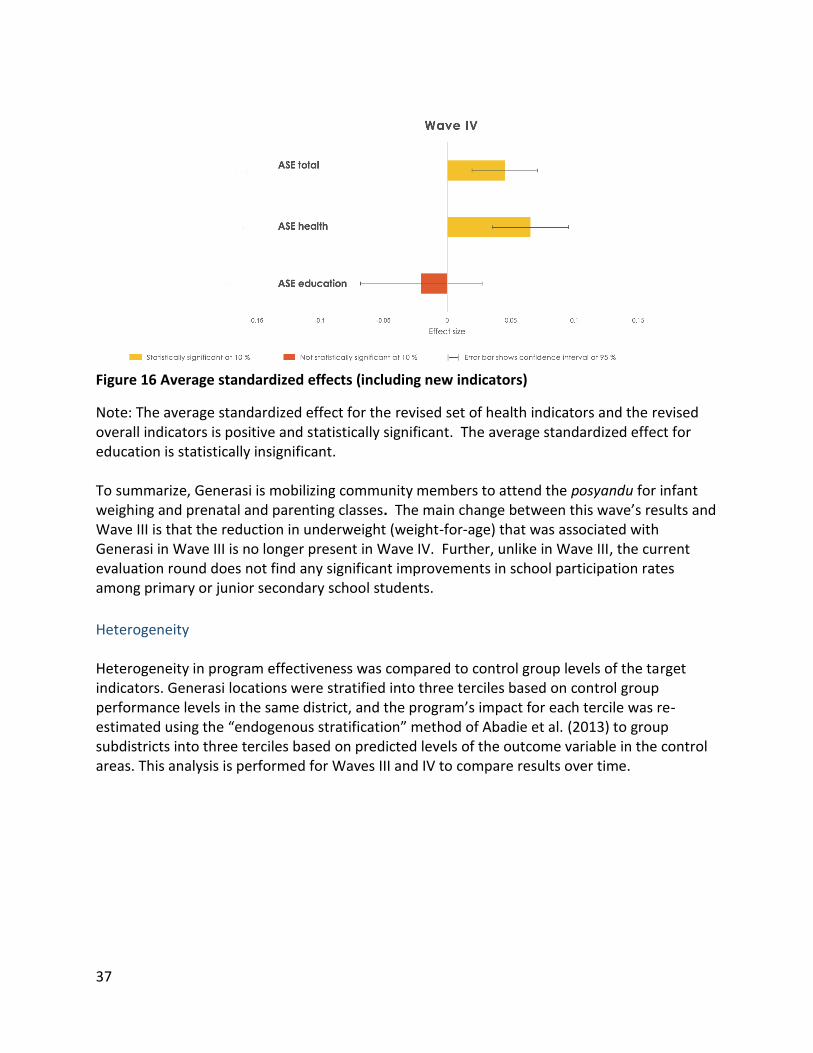
37
Figure 16 Average standardized effects (including new indicators)
Note: The average standardized effect for the revised set of health indicators and the revised overall indicators is positive and statistically significant. The average standardized effect for education is statistically insignificant. To summarize, Generasi is mobilizing community members to attend the posyandu for infant weighing and prenatal and parenting classes. The main change between this wave’s results and Wave III is that the reduction in underweight (weight-for-age) that was associated with Generasi in Wave III is no longer present in Wave IV. Further, unlike in Wave III, the current evaluation round does not find any significant improvements in school participation rates among primary or junior secondary school students.
Heterogeneity Heterogeneity in program effectiveness was compared to control group levels of the target indicators. Generasi locations were stratified into three terciles based on control group performance levels in the same district, and the program’s impact for each tercile was re-estimated using the “endogenous stratification” method of Abadie et al. (2013) to group subdistricts into three terciles based on predicted levels of the outcome variable in the control areas. This analysis is performed for Waves III and IV to compare results over time.

38
Figure 17 Heterogeneity based on areas most in need (weight checks, immunizations, and vitamin A supplements)

39
Note: This figure shows that Generasi is having positive effects on weight checks, immunizations and Vitamin A supplementation in the poorest subdistricts.
There is some evidence that Generasi is more effective areas where needs are greatest (see Appendix Table 15). In particular, for weight checks, immunizations and vitamin A supplementation the largest impacts were found in tercile 1, which is the group of subdistricts predicted to have lowest outcomes, on average (see Figure 17 above). In Wave III, the program was also found to be most effective in improving SD enrollments in the lowest tercile; this effect did not persist in Wave IV.
Program Impact on Long-Term Outcomes This section describes the project’s impact on primary and secondary malnutrition outcomes. Primary indicators of malnutrition included underweight (defined as <-2SD weight-for-age), severe underweight (defined as <-3SD weight-for-age), stunting (defined as <-2SD height-for-age), severe stunting (defined as <-3SD height-for-age), wasting (defined as <-2SD weight-for-height), and severe wasting (defined as <-3SD weight-for-height) all for children under three. They also include the Raven Score, an age-adjusted cognitive assessment test. Overall, the improvements made to malnutrition rates (underweight) in Wave III did not persist in Wave IV (Figure 18). Nor were there improvements in cognitive assessment, based on the Raven score.11
11 With respect to Generasi’s impact on Raven Scores, the null finding may be a function of low statistical power. Improvements in Raven Scores were hypothesized to occur via a reduction in childhood stunting rates, which in turn are thought to affect cognitive outcomes. The estimates for the magnitude of this effect are very small, and unlikely to be detectable given the sample size.

40
Figure 18 Impact on malnutrition outcomes for Generasi IE sample
Note: Generasi’s reduction of underweight that was observed in Wave III is not present in Wave IV. In Wave IV, no effects of Generasi on wasting, stunting or cognitive ability (as measured by the Raven’s test) were observed. Alternative visualizations of the trends over time relative to the treatment effects are available in Annex Figure 2. These outcomes were investigated specifically for NTT province, where the Wave III improvements in malnutrition and stunting were most pronounced. However, Figure 19 shows that the malnutrition indicators appear to have significantly improved in NTT province in Wave IV; if anything, wasting rates appear to have worsened in Generasi programming regions.
Figure 19 Impact on malnutrition outcomes in NTT
Note: Generasi’s reduction of underweight and severe stunting in NTT province that was observed in Wave III is no longer present in Wave IV.
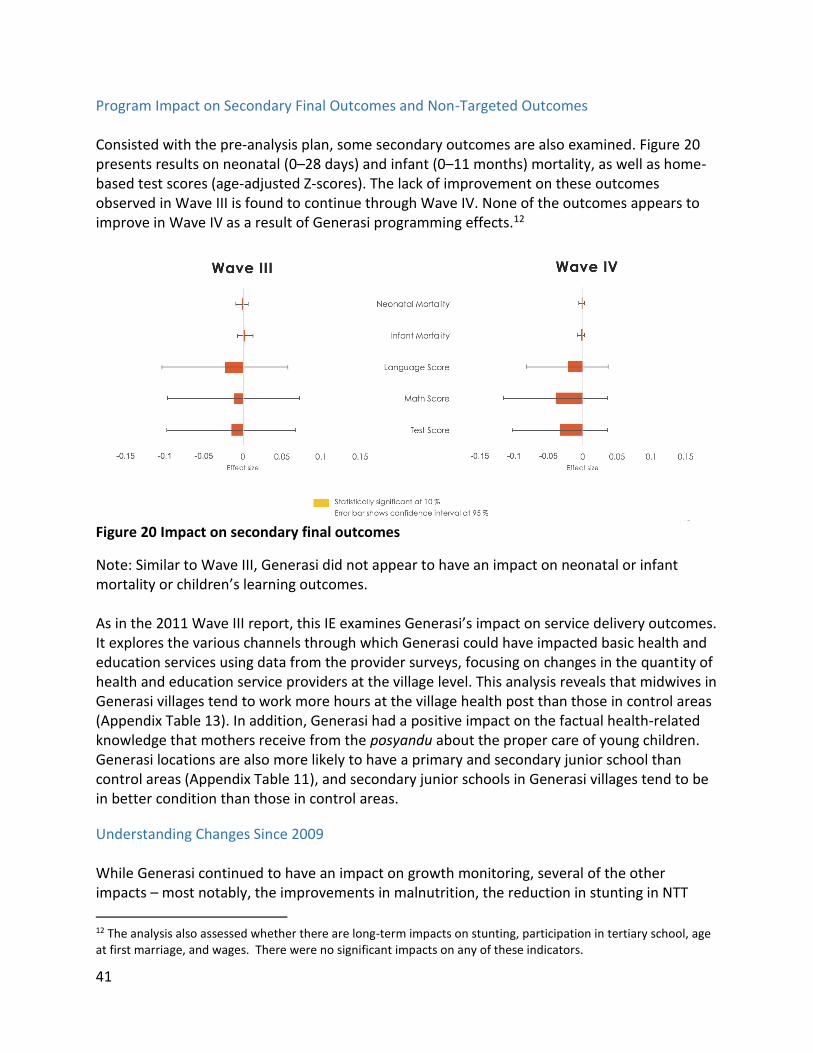
41
Program Impact on Secondary Final Outcomes and Non-Targeted Outcomes Consisted with the pre-analysis plan, some secondary outcomes are also examined. Figure 20 presents results on neonatal (0–28 days) and infant (0–11 months) mortality, as well as home-based test scores (age-adjusted Z-scores). The lack of improvement on these outcomes observed in Wave III is found to continue through Wave IV. None of the outcomes appears to improve in Wave IV as a result of Generasi programming effects.12
Figure 20 Impact on secondary final outcomes
Note: Similar to Wave III, Generasi did not appear to have an impact on neonatal or infant mortality or children’s learning outcomes. As in the 2011 Wave III report, this IE examines Generasi’s impact on service delivery outcomes. It explores the various channels through which Generasi could have impacted basic health and education services using data from the provider surveys, focusing on changes in the quantity of health and education service providers at the village level. This analysis reveals that midwives in Generasi villages tend to work more hours at the village health post than those in control areas (Appendix Table 13). In addition, Generasi had a positive impact on the factual health-related knowledge that mothers receive from the posyandu about the proper care of young children. Generasi locations are also more likely to have a primary and secondary junior school than control areas (Appendix Table 11), and secondary junior schools in Generasi villages tend to be in better condition than those in control areas.
Understanding Changes Since 2009 While Generasi continued to have an impact on growth monitoring, several of the other impacts – most notably, the improvements in malnutrition, the reduction in stunting in NTT
12 The analysis also assessed whether there are long-term impacts on stunting, participation in tertiary school, age at first marriage, and wages. There were no significant impacts on any of these indicators.
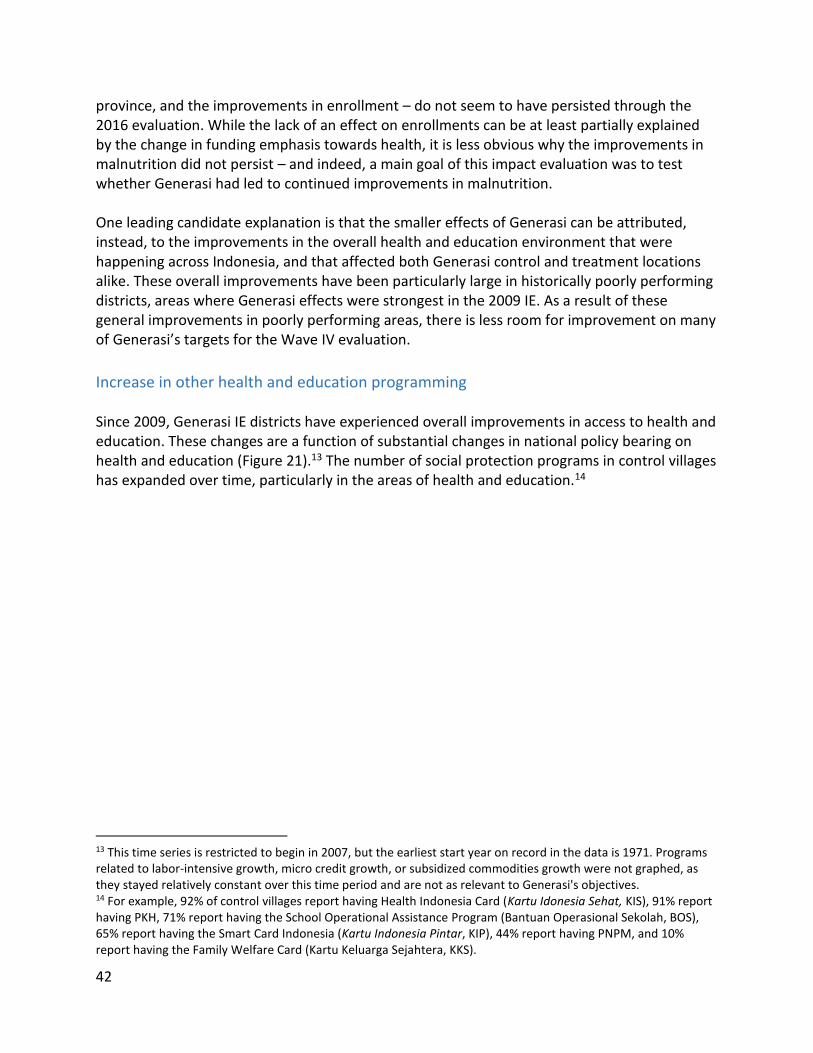
42
province, and the improvements in enrollment – do not seem to have persisted through the 2016 evaluation. While the lack of an effect on enrollments can be at least partially explained by the change in funding emphasis towards health, it is less obvious why the improvements in malnutrition did not persist – and indeed, a main goal of this impact evaluation was to test whether Generasi had led to continued improvements in malnutrition. One leading candidate explanation is that the smaller effects of Generasi can be attributed, instead, to the improvements in the overall health and education environment that were happening across Indonesia, and that affected both Generasi control and treatment locations alike. These overall improvements have been particularly large in historically poorly performing districts, areas where Generasi effects were strongest in the 2009 IE. As a result of these general improvements in poorly performing areas, there is less room for improvement on many of Generasi’s targets for the Wave IV evaluation.
Increase in other health and education programming Since 2009, Generasi IE districts have experienced overall improvements in access to health and education. These changes are a function of substantial changes in national policy bearing on health and education (Figure 21).13 The number of social protection programs in control villages has expanded over time, particularly in the areas of health and education.14
13 This time series is restricted to begin in 2007, but the earliest start year on record in the data is 1971. Programs related to labor-intensive growth, micro credit growth, or subsidized commodities growth were not graphed, as they stayed relatively constant over this time period and are not as relevant to Generasi's objectives. 14 For example, 92% of control villages report having Health Indonesia Card (Kartu Idonesia Sehat, KIS), 91% report having PKH, 71% report having the School Operational Assistance Program (Bantuan Operasional Sekolah, BOS), 65% report having the Smart Card Indonesia (Kartu Indonesia Pintar, KIP), 44% report having PNPM, and 10% report having the Family Welfare Card (Kartu Keluarga Sejahtera, KKS).
43
Figure 21 New social protection programs over time
Note: Since 2007, the number of social protection programs in Generasi IE districts including both treatment and control villages (shows in this figure) has grown substantially. The most significant general policy change is the enactment of the Village Law in 2014, which drastically increased village budgets and the ability of local governments to fund improvements in access to health and education services. The expansion of a subsidized public health insurance program (Jamkesmas) and the launching of an integrated National Health Insurance (JKN) system in 2014 markedly increased citizens’ access to health insurance. By 2017 JKN reached an estimated 70% of the population and aims for full coverage by 2019. With respect to education, a constitutional mandate to allocate 20% of the national budget to education saw a doubling of public education spending between 2001 and 2009. In addition, a cash transfer program for poor students (Bantuan Siskwa Miskin, BSM) aiming to eradicate barriers to access began operations in 2008. By 2014, BSM coverage had expanded from 4.5 million poor students to 11.2 million and the program was upgraded to the Smart Indonesia Program (PIP) to target enrolled students as well as dropouts. These developments in education and health policy may have yielded improvements across Generasi IE locations that decrease the impact of the Generasi program. Congruent with these policy changes, there is evidence of a general trend of improved access to health services in control areas. Figure 22 depicts changes over time of key health indicators in control areas. Deliveries attended by a doctor or midwife, which at baseline were estimated at 70%, rose to a high of 92% by the time of Wave IV. Prenatal care visits also increased, on average, by an extra visit per 24-month period. This general improvement trend renders Generasi treatment effects more difficult to identify.

44
Figure 22 Evolution of control areas over time, key health indicators
Note: Since 2007, there have been improvements in key health indicators. Deliveries attended by a doctor or midwife, which at baseline were estimated at 70%, rose to a high of 92% by the time of Wave IV. Prenatal care visits also increased, on average, by an extra visit per 24-month period. This general improvement in health indicators may make additional marginal improvements from the Generasi program more difficult. There is a similar trend in access to education in control areas over time (Figure 23). Participation rates for both primary and junior secondary children increased substantially, with junior secondary participation rates rising to over 70% from a baseline of 59%. More importantly, the high baseline level in participation outcomes, particularly among primary school-aged children, means that there is little room for improvement moving forward. This dynamic partially motivated the decision to refocus Generasi educational targets away from school participation rates in 2014.

45
Figure 23 Evolution of control areas over time, key education indicators
Note: Since 2007, there have also been major improvements in education access. The baseline for the participation of primary school-aged children was already very high in 2007. The junior secondary participation rates increased to over 70% in 2016 from a baseline of 59%. These shifts, in part, motivated the decision in 2014 to refocus Generasi educational targets away from school participation rates. Overall, these patterns are consistent with the hypothesis that the lack of sustained impact is the result of there being less room for improvement in Generasi IE regions over time. These areas (particularly control regions) have improved their access to health and education, making it difficult for Generasi to continue producing effects in these indicators.
Why No Continued Program Impact on Malnutrition Outcomes? This section explores four possible explanations of why continued sustained improvements in malnutrition outcomes are not observed in Wave IV:
1. The overall substantial improvements in stunting in NTT that occurred in both control and treatment areas may have exhausted the 'low-hanging fruit' that Generasi was able to solve in earlier periods.
2. Generasi funding produced crowd-in/crowd-out effects on other program resources that undercut the efficacy of the intervention.
3. Implementation issues and delays in the maternal health and parenting classes may have weakened any potentially positive impacts this intervention may have had on behavioral change and malnutrition.
4. Generasi’s effects on stunting were limited because the full suite of complementary demand- and supply-side interventions needed to address stunting were not fully implemented.
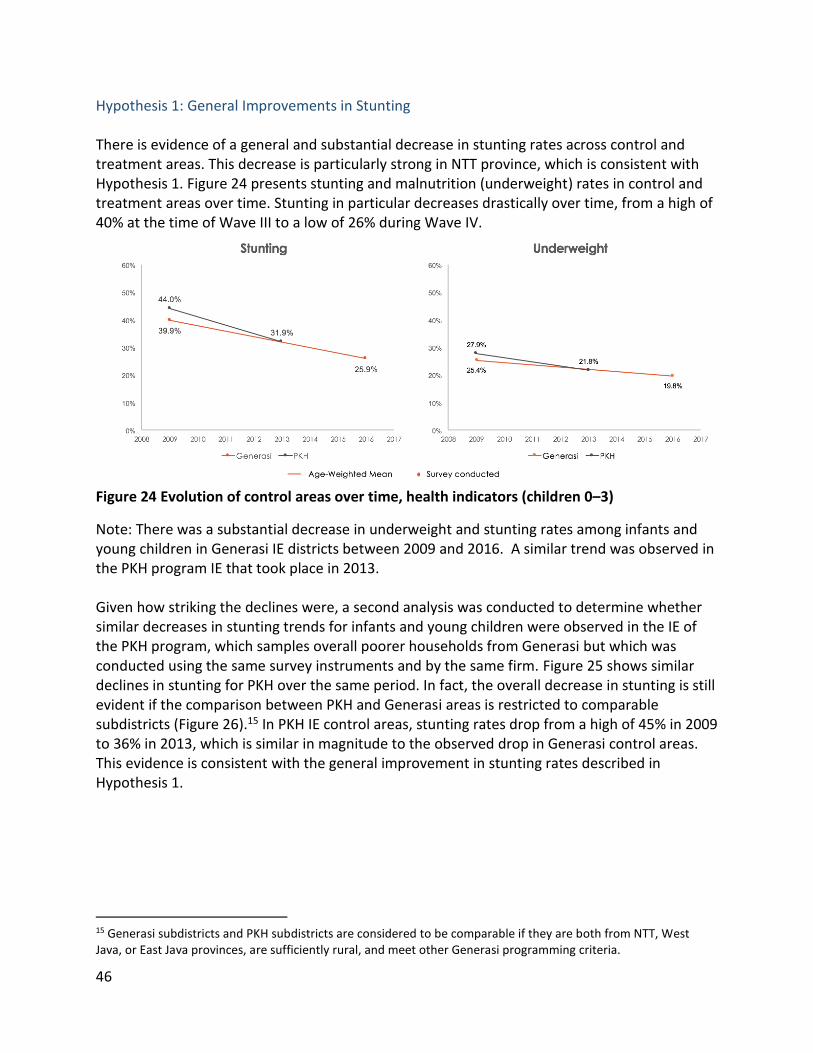
46
Hypothesis 1: General Improvements in Stunting There is evidence of a general and substantial decrease in stunting rates across control and treatment areas. This decrease is particularly strong in NTT province, which is consistent with Hypothesis 1. Figure 24 presents stunting and malnutrition (underweight) rates in control and treatment areas over time. Stunting in particular decreases drastically over time, from a high of 40% at the time of Wave III to a low of 26% during Wave IV.
Figure 24 Evolution of control areas over time, health indicators (children 0–3)
Note: There was a substantial decrease in underweight and stunting rates among infants and young children in Generasi IE districts between 2009 and 2016. A similar trend was observed in the PKH program IE that took place in 2013. Given how striking the declines were, a second analysis was conducted to determine whether similar decreases in stunting trends for infants and young children were observed in the IE of the PKH program, which samples overall poorer households from Generasi but which was conducted using the same survey instruments and by the same firm. Figure 25 shows similar declines in stunting for PKH over the same period. In fact, the overall decrease in stunting is still evident if the comparison between PKH and Generasi areas is restricted to comparable subdistricts (Figure 26).15 In PKH IE control areas, stunting rates drop from a high of 45% in 2009 to 36% in 2013, which is similar in magnitude to the observed drop in Generasi control areas. This evidence is consistent with the general improvement in stunting rates described in Hypothesis 1.
15 Generasi subdistricts and PKH subdistricts are considered to be comparable if they are both from NTT, West Java, or East Java provinces, are sufficiently rural, and meet other Generasi programming criteria.
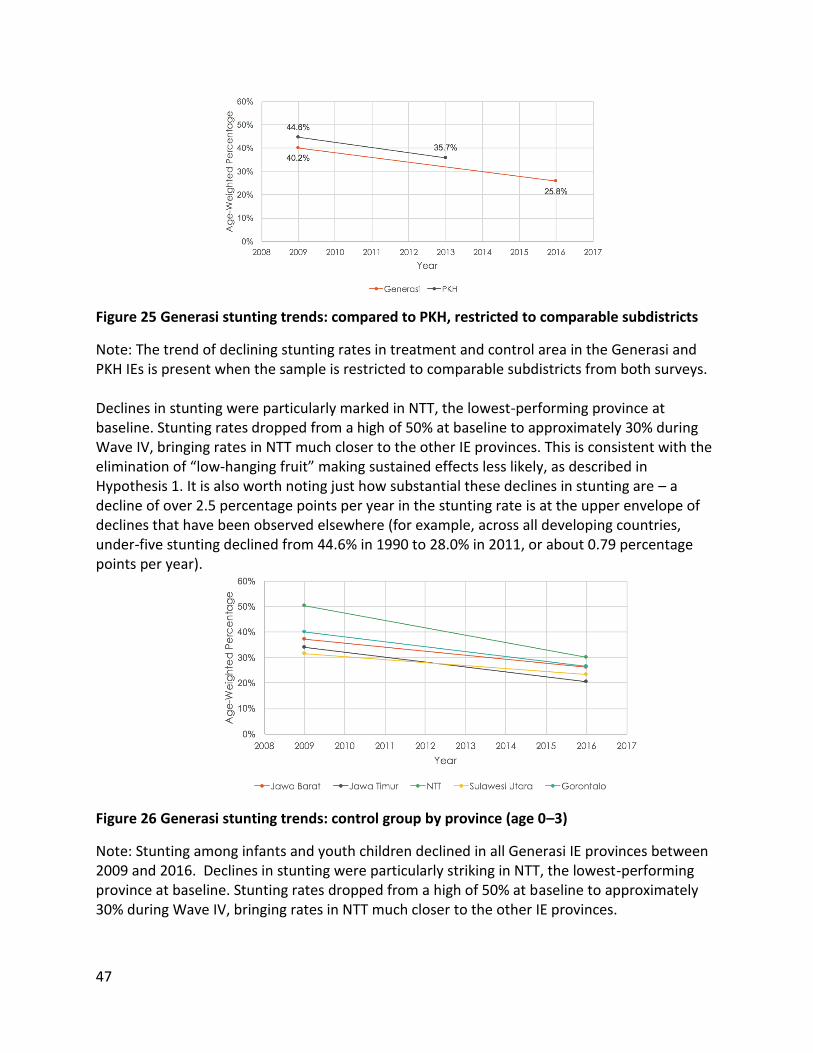
47
Figure 25 Generasi stunting trends: compared to PKH, restricted to comparable subdistricts
Note: The trend of declining stunting rates in treatment and control area in the Generasi and PKH IEs is present when the sample is restricted to comparable subdistricts from both surveys. Declines in stunting were particularly marked in NTT, the lowest-performing province at baseline. Stunting rates dropped from a high of 50% at baseline to approximately 30% during Wave IV, bringing rates in NTT much closer to the other IE provinces. This is consistent with the elimination of “low-hanging fruit” making sustained effects less likely, as described in Hypothesis 1. It is also worth noting just how substantial these declines in stunting are – a decline of over 2.5 percentage points per year in the stunting rate is at the upper envelope of declines that have been observed elsewhere (for example, across all developing countries, under-five stunting declined from 44.6% in 1990 to 28.0% in 2011, or about 0.79 percentage points per year).
Figure 26 Generasi stunting trends: control group by province (age 0–3)
Note: Stunting among infants and youth children declined in all Generasi IE provinces between 2009 and 2016. Declines in stunting were particularly striking in NTT, the lowest-performing province at baseline. Stunting rates dropped from a high of 50% at baseline to approximately 30% during Wave IV, bringing rates in NTT much closer to the other IE provinces.

48
Hypothesis 2: Crowd-In/Crowd-Out Effects This section assesses whether Generasi programming is crowding out resources from other programs in treatment areas, or crowding in resources to control areas, thereby negating any positive impact on the malnutrition, as well as program’s targets. To evaluate this possibility, village-level funding patterns were explored from non-Generasi programs in Generasi IE areas. The analysis finds no evidence that control areas received support from programs that was not also provided to treatment areas. Few statistically significant differences were found in the revenue that puskesmas and schools receive across Generasi IE areas. The differences that were revealed are to be expected, given the large number of tests considered. Overall, no quantitative evidence was found that Generasi is crowding in or crowding out resources from other programs or funding sources. To assess whether there were crowd-in/crowd-out concerns related to the enactment of the Village Law, which resulted in a massive increase in village government budgets, Village Law budget data was collected in order to explore differences in the composition of Village Law expenditures on health and education across control and treatment areas. No significant differences were found in how Generasi and control villages are spending Village Law funds. To conclude, there is no evidence that Generasi is crowding in or crowding out resources from other programs or funding sources. There are no differences in how village governments are allocating Village Law funds
Hypothesis 3: Implementation Delays This section examines Hypothesis 3, which suggests Generasi’s weak long-term impact is a function of implementation delays related to two of the new indicators, participation of pregnant women and male partners in nutrition counseling offered through maternal health classes; and, participation of parents (and/or caregivers) in nutrition counseling offered through classes for infants. With the 2014 revision of program indicators, the Generasi program was attempting to fight malnutrition by improving parental nutrition education. Regardless of whether this strategy works or not, it only would have had the possibility of working if the nutrition education was delivered on time and at scale. Generasi experienced a six-month programming interruption in 2015 as the program transitioned from MoHA to the newly established MoV. Program funds could not be withdrawn during this period, which delayed the implementation of Generasi’s program cycle. In particular, the previously discussed program disruption had negative consequences for the delivery of interventions. To assess the impact of this interruption, a joint team comprised of representatives from J-PAL, Kompak, Bappenas and the World Bank conducted a series of qualitative field missions to Generasi program areas between June and August 2015. The resulting qualitative study revealed that implementation of the new indicators was still very limited due to a lack of understanding from program actors, supply-side problems, and the

49
previously discussed program disruption. Interviews with program facilitators found that some expressed confusion about the new indicators or how to address them, especially the counseling session indicator. Figure 27 depicts the progress in training for various staff in Generasi areas. Programmers intended for training to begin in treatment locations in Semester I (January to June) of 2015; however, due to the disruption training did not begin until at least Semester II (July to December 2015). These delays in training and service delivery may have rendered Generasi effects less likely. While there was an increase in parenting classes, it was delayed and therefore not as effective as it could have been.
Figure 27 Progress in training: cumulative supply in five provinces
Note: In 2014, Generasi introduced targets for participation in maternal health classes and parenting classes. To help communities achieve these targets, the Generasi program had intended to train posyandu cadres in nutrition counselling that would be offered through these classes. While the training was supposed to begin in the first half of 2015, the training did not begin until the second half of 2015. Consequently, the delays in training may have rendered Generasi effects less like likely at the time of the Wave IV survey. The 2015 qualitative study found other evidence that the disruption interfered with the delivery of other activities in Generasi areas beyond the training of health workers and volunteers. In some villages, community health posts stopped providing PMT and experienced drops in attendance. Only a few villages covered PMT activities during this period, and in general local and district government response to the disruption was minimal. Further,

50
transportation subsidies for pregnant women were deferred; reimbursements were given once funding resumed. The joint 2015 qualitative study found that most subdistrict facilitators remained at their posts during the program interruption and shifted their attention to activities that were less funding dependent until the program resumed. Many of the facilitators who did leave accepted other village posts, for example in the village administration. Overall, the study found that program actors were optimistic that their village would reach program targets. To what extent did the disruption of activities affect communities’ achievement of the long-term outcomes? To answer this question, the findings from this 2015 small-N qualitative study were supplemented with quantitative analysis of the household survey. To test whether the disruption produced detrimental effects in Generasi areas, maternal, young child, and infant outcomes were examined before, during, and after the disruption. If the disruption significantly worsened Generasi service delivery and uptake, worse outcomes than comparable populations before or after the disruption should be expected for mothers who were pregnant or gave birth during the disruption, infants aged 0–2 during the disruption, and young children finishing primary school during this time. Figure 28 provides a descriptive representation of this analysis. The graph depicts three-month moving averages for four different maternal outcomes in one-month increments after the disruption. Starting from January 2015, each number on the horizontal axis represents a one-month interval until December 2016. If the disruption had a noticeable impact on the quality of service delivery, a significant change in maternal outcomes should be visible at some point in the time series. However, the four outcomes appear consistent over time.
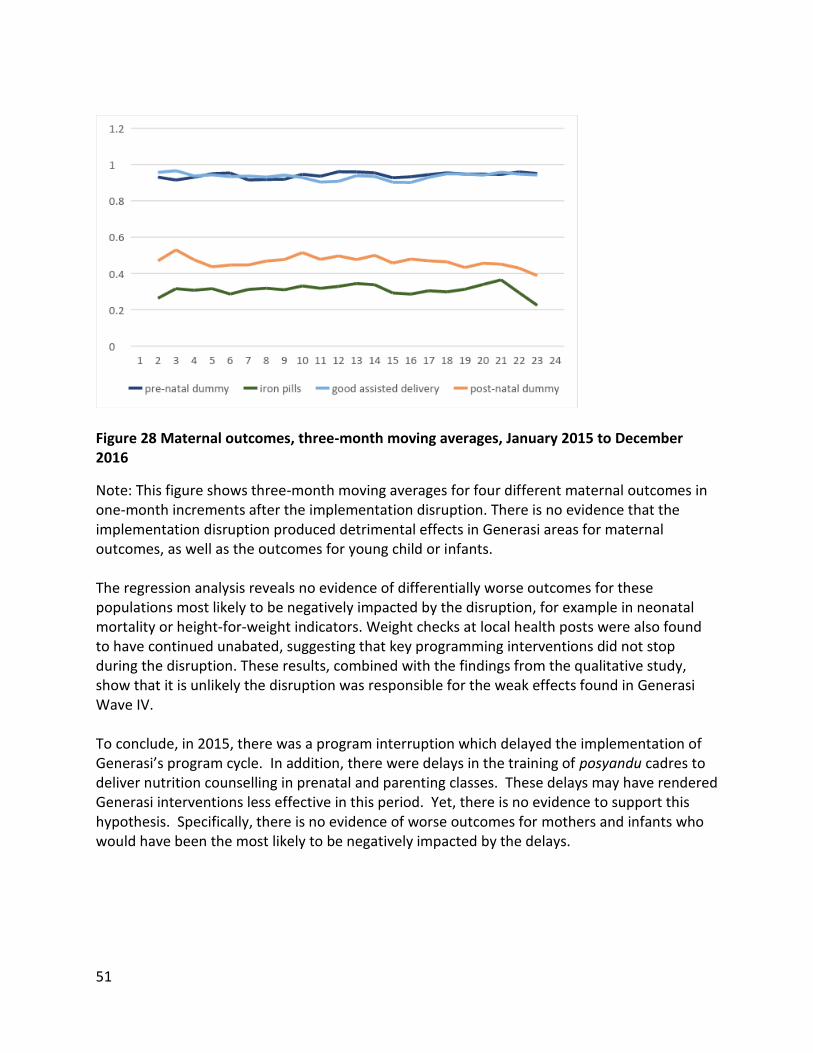
51
Figure 28 Maternal outcomes, three-month moving averages, January 2015 to December 2016
Note: This figure shows three-month moving averages for four different maternal outcomes in one-month increments after the implementation disruption. There is no evidence that the implementation disruption produced detrimental effects in Generasi areas for maternal outcomes, as well as the outcomes for young child or infants. The regression analysis reveals no evidence of differentially worse outcomes for these populations most likely to be negatively impacted by the disruption, for example in neonatal mortality or height-for-weight indicators. Weight checks at local health posts were also found to have continued unabated, suggesting that key programming interventions did not stop during the disruption. These results, combined with the findings from the qualitative study, show that it is unlikely the disruption was responsible for the weak effects found in Generasi Wave IV. To conclude, in 2015, there was a program interruption which delayed the implementation of Generasi’s program cycle. In addition, there were delays in the training of posyandu cadres to deliver nutrition counselling in prenatal and parenting classes. These delays may have rendered Generasi interventions less effective in this period. Yet, there is no evidence to support this hypothesis. Specifically, there is no evidence of worse outcomes for mothers and infants who would have been the most likely to be negatively impacted by the delays.

52
Hypothesis 4: Full suite of complementary interventions needed to address stunting were not fully implemented This section considers evidence to adjudicate Hypothesis 4, which suggests that Generasi’s effects on stunting were limited because the full suite of complementary demand- and supply-side interventions needed to address stunting were not fully implemented. In 2014, there were design changes to Generasi including the addition of targets around participation in prenatal and parenting classes that aimed at changing behaviors around diet diversity during pregnancy, exclusive breastfeeding, complementary feeding and hygiene. Generasi did not invest directly in complementary clean water supply, toilets in houses, and sanitation systems. These types of infrastructure investments were not possible as the GoI was putting less money into the project from 2010 onwards. Within Generasi, infrastructure investments (including in water) mostly ceased. The GoI expected other programs outside of Generasi such as PAMSIMAS and Community-Led Total Sanitation (Sanitasi Total Berbasis Masyarakat, STBM) to invest in water and sanitation infrastructure and behavioral change in Generasi subdistricts. Yet, there is no evidence that these investments systematically took place in Generasi areas to complement Generasi. An analysis of the Generasi IE data did not find any differences in sanitation and water programs between treatment and control areas. This analysis does not, of course, explain the decline in Generasi’s effectiveness from 2009 to 2016. To the extent that other important drivers of stunting are identified, it suggests why the program did not do more overall to reduce stunting, and what other approaches to stunting reduction may be effective. To explore what factors are associated with stunting declines in the data, a difference-in-differences econometric approach was used, with time, province, subdistrict, and age fixed effects, and controls for household assets. This regression takes the following form: 𝑦𝑖𝑎𝑘𝑡 = 𝛽1𝑣𝑎𝑟𝑘𝑡 + 𝛾1𝑆𝐸𝑆𝑘𝑡 + 𝛼𝑡𝑝 + 𝛼𝑘 + 𝛼𝑎 + 𝜀 𝑖𝑎𝑘𝑡
where i is a child, k is a subdistrict, p is a province, t is a survey wave (2009 or 2016), and a is a three-month age group. 𝑣𝑎𝑟 is the explanatory variable and 𝑦𝑖𝑎𝑘𝑡 is the outcome variable, which is a dummy for if child i is stunted or not in wave t, subdistrict k, and age group a. Finally, 𝛽1is the parameter of interest, 𝑆𝐸𝑆𝑘𝑡 is child i’s predicted socioeconomic status index, 𝛼𝑡𝑝 is a
wave-province fixed effect, 𝛼𝑘 is a subdistrict fixed effect, and 𝛼𝑎 is an age fixed effect. Standard errors are clustered at the subdistrict level. This approach effectively regresses changes in stunting rates from 2009 to 2016 on changes in variables related to the child, mother, household, and village environments over the same period. This analysis is performed for over 50 different sets of explanatory variables in order to determine which factors are correlated with the observed decline in stunting between (Wave III) and 2016 (Wave IV). This analysis is not causal, but is meant to provide suggestive evidence of which factors are strongly associated with stunting. Potential explanatory variables are
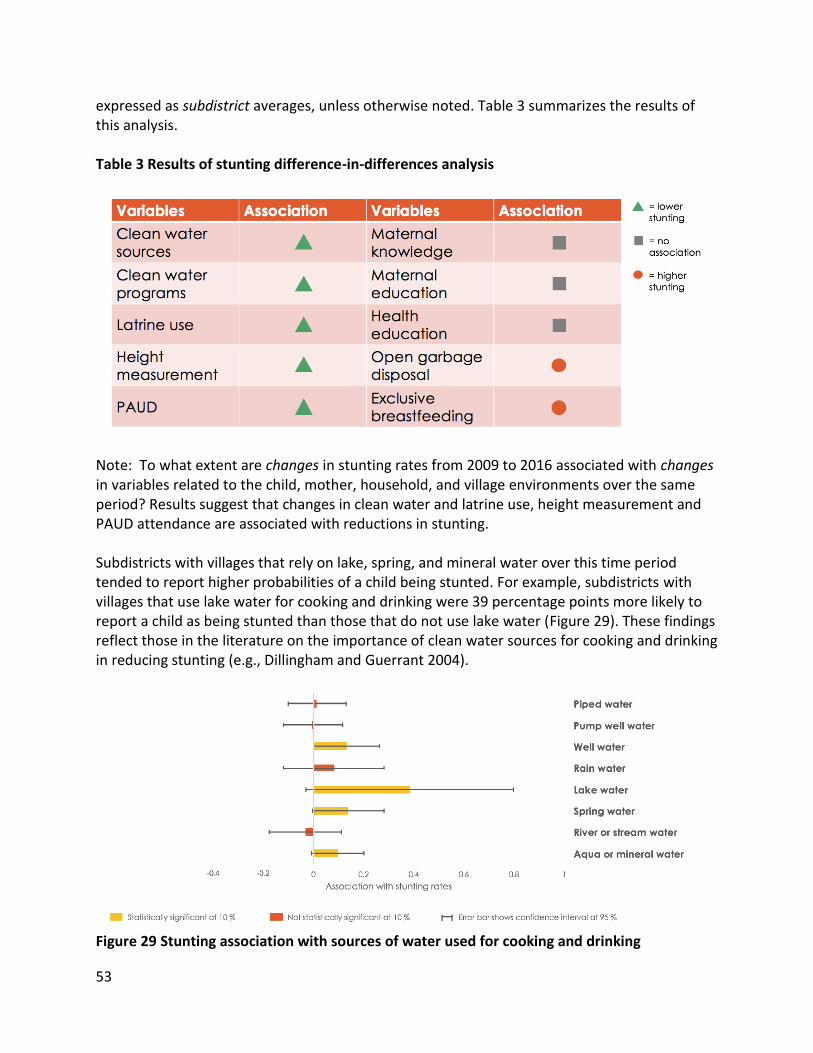
53
expressed as subdistrict averages, unless otherwise noted. Table 3 summarizes the results of this analysis. Table 3 Results of stunting difference-in-differences analysis
Note: To what extent are changes in stunting rates from 2009 to 2016 associated with changes in variables related to the child, mother, household, and village environments over the same period? Results suggest that changes in clean water and latrine use, height measurement and PAUD attendance are associated with reductions in stunting. Subdistricts with villages that rely on lake, spring, and mineral water over this time period tended to report higher probabilities of a child being stunted. For example, subdistricts with villages that use lake water for cooking and drinking were 39 percentage points more likely to report a child as being stunted than those that do not use lake water (Figure 29). These findings reflect those in the literature on the importance of clean water sources for cooking and drinking in reducing stunting (e.g., Dillingham and Guerrant 2004).
Figure 29 Stunting association with sources of water used for cooking and drinking
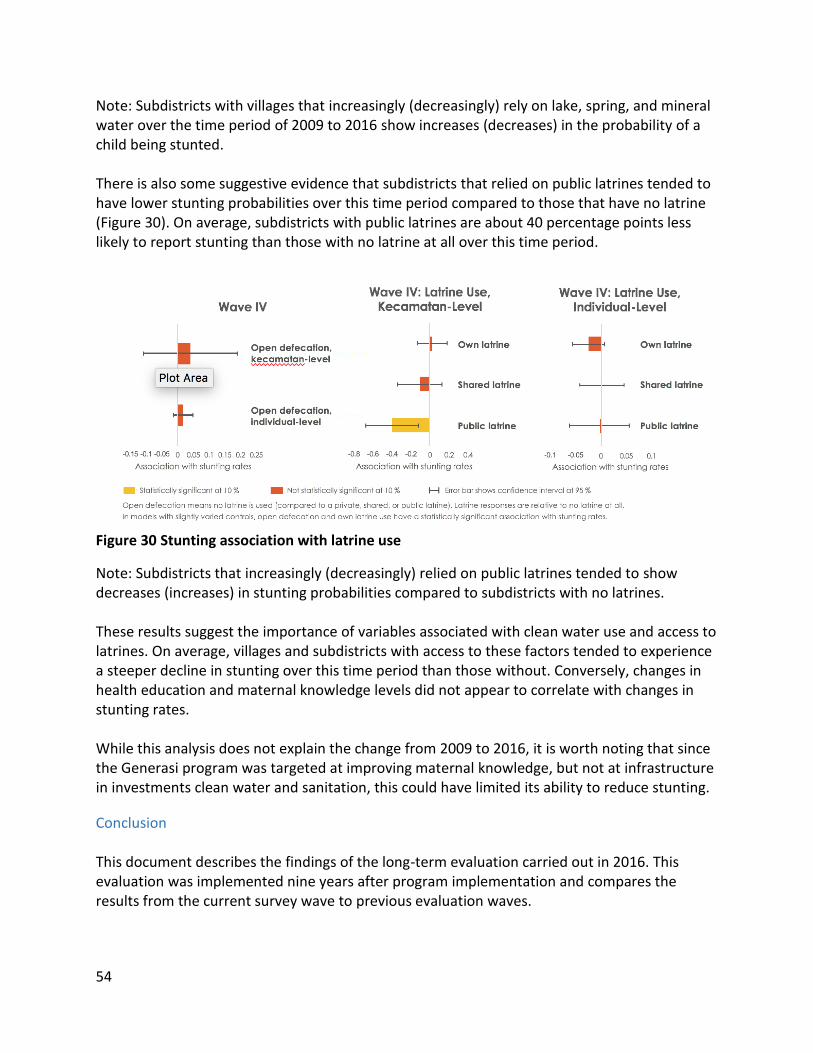
54
Note: Subdistricts with villages that increasingly (decreasingly) rely on lake, spring, and mineral water over the time period of 2009 to 2016 show increases (decreases) in the probability of a child being stunted. There is also some suggestive evidence that subdistricts that relied on public latrines tended to have lower stunting probabilities over this time period compared to those that have no latrine (Figure 30). On average, subdistricts with public latrines are about 40 percentage points less likely to report stunting than those with no latrine at all over this time period.
Figure 30 Stunting association with latrine use
Note: Subdistricts that increasingly (decreasingly) relied on public latrines tended to show decreases (increases) in stunting probabilities compared to subdistricts with no latrines. These results suggest the importance of variables associated with clean water use and access to latrines. On average, villages and subdistricts with access to these factors tended to experience a steeper decline in stunting over this time period than those without. Conversely, changes in health education and maternal knowledge levels did not appear to correlate with changes in stunting rates. While this analysis does not explain the change from 2009 to 2016, it is worth noting that since the Generasi program was targeted at improving maternal knowledge, but not at infrastructure in investments clean water and sanitation, this could have limited its ability to reduce stunting.
Conclusion This document describes the findings of the long-term evaluation carried out in 2016. This evaluation was implemented nine years after program implementation and compares the results from the current survey wave to previous evaluation waves.

55
The main findings of the Generasi IE are as follows.
● Since 2009, the overall health and education environment in Generasi IE districts has improved dramatically, even in control areas. Vital health indicators, such as deliveries attended by a doctor or midwife, have increased substantially since 2009 and now account for over 92% of births in the sample area. Similarly, school participation rates have risen significantly since 2009: enrollment for school years 7–12 was 98% in 2016. These improvements likely reflect both substantial policy changes and improved household incomes throughout Indonesia.
● There is now significantly less room for improvement in many Generasi target areas. For example, Generasi’s impact on reduced malnutrition and school enrollments that were present in Wave III are no longer observed in Wave IV. The IE also documents that there have been substantial improvements in precisely those indicators in both treatment and control areas compared to 2009.
● One of Generasi’s greatest accomplishments is the sustained revitalization of the
posyandu, which was accomplished through program facilitation, community participation, and a targets/incentive system. The posyandu are monthly local health clinics for mothers and children that distribute snacks and vitamin A tablets, measure children’s height and weight, immunize kids, and provide nutrition and health advice. This system has been central to GoI’s efforts to curb infant/child mortality and provide citizens with family planning services since the early 1980s (Leimena 1989). By the late 1990s attendance at posyandu had decreased from 52% to 40% in both urban and rural areas, but with a greater decline in rural ones. Reasons for the decline include a loss of support from NGOs and changing preferences for private providers in Indonesia (Marks 2007). Despite these setbacks, community participation in posyandu activities continues to improve nine years after program implementation. This participation has been sustained in part by communities choosing to allocate portions of their Generasi block grants to fund interventions that incentivize participation at the posyandu, such as providing nutritional supplements to mothers who attend, funding subsidies for pre- and postnatal care, and remunerating posyandu volunteers.
● Specifically, Generasi still helps mobilize community members to attend the posyandu for infant weighing and maternal health and parenting classes. Treatment areas experienced 0.13 more weight checks, on average, for young children in control areas (a 6% increase compared to control areas), as well as a 73% increase (8.5 percentage points) in attendance of parenting classes compared to control areas, particularly among mothers of young children. Prenatal class attendance also increased by eight percentage points (24% increase compared to control areas) in treatment areas. The frequency of prenatal attendances increased by 0.28 classes on average.
● In the lowest-performing districts, Generasi has continued to be effective at
encouraging community members to attend the posyandu and

56
increasing immunizations and vitamin A distribution. Nine years after implementation, treatment areas in the lowest-performing tercile continue to experience a 0.19 increase in weight check frequency. In the same tercile, immunization rates increased by three percentage points (roughly 4% higher than control areas), while vitamin A uptake increased by 0.15 supplements (11% increase compared to control areas).
● Generasi’s initial impact on stunting, concentrated in NTT province, has not been
sustained beyond the 2009 IE. There are four possible reasons for this. First, the overall substantial improvements in stunting in NTT that occurred in both control and treatment areas may have exhausted the 'low-hanging fruit' that Generasi was able to solve in earlier periods. Second, Generasi funding produced crowd-in/crowd-out effects on other program resources that undercut the efficacy of the intervention. Third, implementation issues and delays in the maternal health and parenting classes may have weakened any potentially positive impacts this intervention may have had on behavioral change and malnutrition. Fourth, Generasi’s effects on stunting were limited because the full suite of complementary demand- and supply-side interventions needed to address stunting were not fully implemented.

57
Policy Implications The evaluation results have three policy implications.
● Future GoI health-related programming needs to consider how to sustain the posyandu and ensure that mothers continue to bring their children for weight/height measurement, participation in Early Childhood Education (PAUD) programs, and basic maternal and infant health services. An implementation disruption in Generasi programming that occurred in 2015 when the Generasi program transferred from MoHA to MoV, underscores the difficulty of maintaining posyandu participation without incentives. The disruption meant that funding could not be spent on nutritional supplements, which based on qualitative field reports led to a reduction in posyandu attendance. The future of posyandu success depends on villages continuing to support participation in the absence of Generasi. Across Indonesia, village governments could use village law funds to support the posyandu and continue to ensure that posyandu are sufficiently staffed (e.g., at least one per hamlet) and that they are compensated appropriately. The GoI could encourage village governments to use village law funds to support posyandu either by prioritizing it at the central and district levels and/or incentivizing village governments to allocate resources for this purpose.
● The results show that Generasi is effective at increasing basic service utilization in poor contexts, where baseline service delivery and health indicator levels are low, but where there are at least some elements of a functioning supply side. Generasi was more effective in 2009, when baseline levels of service delivery were much lower, and even in 2009 it was most effective in those provinces and districts with the lowest levels of baseline service delivery. Today, Generasi remains most effective in improving weight checks, immunizations, and vitamin A in the bottom third of districts in terms of predicted levels of achievement in the absence of the program. This suggests that GoI and other governments worldwide which are trying to accelerate the achievement of basic health and education indicators could consider applying the Generasi model in contexts where baseline levels of health service delivery are low.
● As this IE demonstrates, short– and long-term IEs are essential to ensuring that government programs continue to have an impact as the programs and context change. IEs can also inform governments about how to adjust targets appropriately.
58
References Abadie, A., M.M. Chingos, and M.R. West. 2013. Endogenous Stratification in Randomized
Experiments. Cambridge, MA: National Bureau of Economic Research. Athey, S., & Imbens, G. W. 2017. The Econometrics of Randomized Experiments. In Handbook of
Economic Field Experiments (Vol. 1, pp. 73-140). North-Holland. Casey, K., R. Glennerster, and E. Miguel. 2012. “Reshaping Institutions: Evidence on Aid Impacts
Using a Preanalysis Plan.” The Quarterly Journal of Economics 127 (4): 1755–1812. Dangour A.D., Watson L., Cumming O., Boisson S., Che Y., Velleman Y., Cavill S., Allen E., and
Uauy R. 2013. “Interventions to Improve Water Quality and Supply, Sanitation and Hygiene Practices, and their Effects on the Nutritional Status of Children.” Cochrane Database of Systematic Reviews 8.
Dillingham, Rebecca, and Richard L. Guerrant. 2004. "Childhood Stunting: Measuring and
Stemming the Staggering Costs of Inadequate Water and Sanitation." The Lancet 363: 94–95.
Duflo, E., R. Glennerster, and M. Kremer. 2007. “Using Randomization in Development
Economics Research: A Toolkit.” In Handbook of Development Economics, edited by T. P. Schultz and J. Strauss, 3895–62. North Holland: Elsevier Science.
Gertler, P. 2004. “Do Conditional Cash Transfers Improve Child Health? Evidence from
PROGRESA’s Control Randomized Experiment.” American Economic Review 94 (2): 336–41.
Gibbons, R., and K. J. Murphy. 1990. “Relative Performance Evaluation for Chief Executive
Officers.” Industrial and Labor Relations Review 43: 30–51. Gordis, L. 2004. Epidemiology. Philadelphia, PA: W. B. Saunders Company. Holmstrom, B. 1979. “Moral Hazard and Observability.” Bell Journal of Economics 10 (1): 74–91. Humphreys, M., R. Sanchez de la Sierra, and P. Van der Windt. 2013. Fishing, Commitment, and
Communication: A Proposal for Comprehensive Nonbinding Research Registration. Political Analysis 21 (1): 1–20.
Imbens, G., and J. Angrist. 1994. “Identification and Estimation of Local Average Treatment
Effects.” Econometrica 61 (2): 467–76. Kling, J.R., J.B. Liebman, and L.F. Katz. 2007. “Experimental Analysis of Neighborhood Effects.”
Econometrica 75 (1): 83–119.

59
Lazear, E.P., and S. Rosen. 1981. “Rank-Order Tournaments as Optimum Labor Contracts.”
Journal of Political Economy 89: 841–64. Leimena, S. L. 1989. “Posyandu: A Community-Based Vehicle To Improve Child Survival and
Development.” Asia Pacific Journal of Public Health 3 (4): 264–67. Marks, G. C. 2007. “Changing Nutritional Health in South East Asia.” In Health Change in the
Asia-Pacific Region, edited by Ryutaro Ohtsuka, 64–87. Cambridge: Cambridge University Press.
Miguel, E., and M. Kremer. 2004. “Worms: Identifying Impacts on Education and Health in the
Presence of Treatment Externalities.” Econometrica 72: 159–217. Mookherjee, D. 1984. “Optimal Incentive Schemes with Many Agents.” Review of Economic
Studies 51: 433–46. Newhouse J.P., et al. 1993. Free For All? Lessons from the Rand Health Insurance Experiment.
Cambridge, MA: Harvard University Press. Olken, B. A. 2007. “Monitoring Corruption: Evidence from a Field Experiment in Indonesia.”
Quarterly Journal of Economics 115 (2): 200–49. Olken, B. A., J. Onishi, and S. Wong. 2011. “Indonesia PNPM Generasi Program Final Impact
Evaluation Report.” Washington, DC: World Bank. Rawlings, L., and G. Rubio. 2005. “Evaluating the Impact of Conditional Cash Transfer
programs.” The World Bank Research Observer 20 (1): 29–55. Schultz, T. P. 2004. “School Subsidies for the Poor: Evaluating the Mexican Progresa Poverty
Program.” Journal of Development Economics 74 (1): 199–250. Skoufias, E. 2005. “PROGRESA and Its Impacts on the Welfare of Rural Households in Mexico.”
IFPRI Research Report No. 139. Washington, DC: International Food Policy Research Institute.
Strauss, J., K. Beegle, A. Dwiyanto, Y. Herawati, D. Pattinasarany, E. Satriawan,... and F.
Witoelar. 2002. Indonesian Living Standards Three Years after the Crisis: Evidence from the Indonesia Family Life Survey. Santa Monica, CA: RAND Corporation.
Weitzman, M.L. 1980. “The ‘Ratchet Principle’ and Performance Incentives.” Bell Journal of
Economics (The RAND Corporation) 11 (1): 302–308.

60
World Bank. 2006. Making the New Indonesia Work for the Poor. Jakarta, Indonesia and Washington, DC: World Bank.
———. 2008. Investing in Indonesia’s Health: Challenges and Opportunities for Future Public
Spending. Jakarta, Indonesia, and Washington, DC: World Bank. ———. 2011. Indonesia’s Generasi Program Final Impact Evaluation Report. Washington, DC:
World Bank. ———. 2014. Proposed Additional PNPM Support Facility Grant in the Amount of $151.7 Million
USD to the Republic of Indonesia for the National Program for Community Empowerment in Rural Areas Healthy and Bright Generation (PNPM Generasi). Washington, DC: World Bank.
———. 2015. An Unfair Start: How Unequal Opportunities Affect Indonesia’s Children. Jakarta,
Indonesia and Washington, DC: World Bank. ———. 2017. World Development Indicators. Washington, DC: World Bank. Wong, S. 2012. What Have Been the Impacts of World Bank Community-Driven Development
Programs? CDD Impact Evaluation Review and Operational and Research Implications. Washington, DC: World Bank.

61
Appendix Tables
Appendix Table 1. Questionnaire modules and sample size
Module Contents Sample Size
(wave IV)
Percent from 2007
Panel
Panel Response
Rate
Book 1A: Household core (Respondent: female household head or spouse of a male household head)
Household roster, deaths in previous 24 months, household characteristics, migration, water/sanitation, receipt of government poverty programs, participation in non-formal education, consumption, assets, economic shocks, health insurance, morbidity, outpatient care use, social capital, community participation, trust in government
12,377
50% 93.68%
Book 1B: Married women age 16–49 Fertility history, use of health services during pregnancy, opinion on health services, family planning, status of women, health and education knowledge
11,264
Book 1C: Children age 6–15 (Respondent: mother or guardian of the child)
Health of child, school enrollment, attendance, grade repetition, cost of schooling, scholarships, child labor
10,409
Book 1D: Children age < 3 (Respondent: mother or guardian of the child)
Growth monitoring (posyandu), acute child morbidity, immunization records, breastfeeding and nutritional intake, motor development, weight measurement, height measurement
4,604
Home-based tests Test of math and reading skills administered at home (separate test for ages 6–12 and ages 13–15)
7,831
Book 1E: Additional households Household roster, pregnancy record, child (aged 0–12 years) health measurement: weight of mother and child, height of child, upper arm of child and mother, BCG immunization mark
6,908 33% 94.37%
Book 2: Village characteristics (Respondent: village head)
Demography of the village, hamlet information, access to health services and schools, community participation, daily laborer wage rate, poverty eradication programs, water and sanitation, transportation, information media
2,323 50% 99.74%
Book 3: Community health center (puskesmas)
Head of facility background, coverage area, budget, staff roster, time allocation of head doctor and midwife coordinator, service hours, services provided, fee schedule, number of patients per service during the previous month, medical and vaccine stock, data on village health post, direct observation regarding cleanliness
301 100% 100%

62
Book 4: Village midwives Personal background, location of duty, condition of facility, time allocation, income, services provided, fee schedule (public and private), experiences during past three deliveries, number of patients seen per service during the previous month, equipment and tools, medical supplies and stock, village health post management, community meetings, food supplementary program
1,197 50% 74.83%
Book 5: Schools Principal background, principal time allocation, teacher roster, school facilities, teaching hours, enrollment records, attendance records, official test scores, scholarships, fees, budget, direct observation of classrooms, including random check on classroom attendance
3,316 Junior high
schools: 66%,
elementary schools:
50%
Junior high
schools: 96.39%,
elementary schools:
95.65%
Book 6: Village health post cadre (posyandu)
Respondent characteristics, health post characteristics, service providers, cadre roster, tools and equipment, community meetings, family connections, food supplementary programs
2,401 50% 99.41%
Book 7: Sub-district head Respondent characteristics, sub-district information, service delivery problems, community development program, data collection, village law implementation, list of junior high schools
358 New modules
Book 8: Facilitator Respondent characteristics, training, time usage, problems in infrastructure, health, and education, case studies, predecessor information, village performance
1,567
Book US: Anthropometry Child (aged 0–12 years) health measurement: weight of mother and child, height of child, upper arm of child and mother, BCG immunization mark
9,229
Note: About 50 percent of married women and children come from panel households, but the married women and children themselves are not necessarily panel respondents.
Appendix Table 2. Direct benefits
Wave III Wave IV
Generasi effect
Control mean N Generasi effect
Control mean
N
Received scholarship
b 0.014** 0.040 7,168 -0.028* 0.313 8,916
se 0.006 -0.007 0.015 0.464
pval 0.065
Received b 0.077*** 0.011 7,168 0.007* 0.013 8,897

63
uniform
se 0.009 -0.004 0.003 0.114
pval 0.051
Received other school supplies
b
0.061*** 0.011 7,168 0.006 0.022 8,912
se 0.008 -0.004 0.006 0.146
pval 0.273
Received transport subsidy
b
0.006*** 0.005 7,168 -0.003** 0.006 8,916
se 0.001 -0.001 0.002 0.078
pval 0.038
Received other school support
b
0.007** 0.006 7,168 0.002 0.002 8,916
se 0.003 -0.001 0.001 0.045
pval 0.106
Received supp. feeding at school
b
0.004 0.006 7,168 0.001 0.001 8,916
se 0.004 -0.001 0.001 0.030
pval 0.524
Received supp. feeding at posyandu
b
0.190*** 0.457 5,847 0.066*** 0.493 3,969
se 0.021 -0.017 0.021 0.500
pval 0.008
Received intensive supp. feeding
b
0.022*** 0.046 5,844 0.002 0.057 3,969
se 0.008 -0.007 0.010 0.232
pval 0.820
Received health subsidy for pre-/postnatal care
b
0.032*** 0.007 4,063 0.017*** 0.012 4,060
se 0.005 -0.003 0.005 0.110
pval 0.003
Received health subsidy for childbirth
b
0.113*** 0.045 2,511 0.019* 0.047 31,42
se 0.014 -0.008 0.011 0.211

64
pval 0.091
Average standardized effects
b
0.302*** 0.048
se 0.023 0.013
pval 0.331
Average standardized effects, health
b
0.291*** 0.084
se 0.026 0.021
pval 0.311
Average standardized effects, education
b
0.313*** 0.011
se 0.034 0.015
pval 0.487
All outcomes are dummy variables. *statistically significant at 10% level; **statistically significant at 5% level; ***statistically significant at 1% level (this holds for all tables in the appendix.) P-values are randomization inference p-values. This was only done for Wave IV (this holds for all tables in the appendix).

65
Appendix Table 3. Direct benefits, provincial breakdown
Wave III Wave IV
Java Generasi
effect
Sulawesi Generasi
effect
NTT Generasi
effect
Java Generasi
effect
Sulawesi Generasi
effect
NTT Generasi
effect
Received scholarship b 0.015** 0.006 0.021 -0.015 -0.046 -0.051
se 0.006 0.014 0.021 0.019 0.029 0.032
pval 0.440 0.203 0.148
Received uniform b 0.042*** 0.123*** 0.136*** 0.005 0.016 0.008
se 0.007 0.026 0.024 0.004 0.012 0.004
pval 0.298 0.322 0.109
Received other school supplies b 0.039*** 0.083*** 0.103*** 0.006 0.003 0.009
se 0.007 0.021 0.021 0.005 0.011 0.016
pval 0.287 0.812 0.646
Received transport subsidy b 0.005*** 0.015** 0.005** -0.000 -0.003 -0.008**
se 0.002 0.006 0.002 0.001 0.006 0.005
pval 0.754 0.846 0.013
Received other school support b -0.001 0.001 0.029*** 0.003 0.001
se 0.001 0.005 0.009 0.001 0.001
pval 0.134 0.650
Received supp. feeding at school
b 0.001 0.002 0.015 0.000 -0.002 0.004
se 0.001 0.002 0.015 0.000 0.002 0.003
pval 0.462 0.348 0.387
Received supp. feeding at posyandu
b 0.163*** 0.200*** 0.258*** 0.065** 0.048 0.071
se 0.027 0.054 0.037 0.027 0.044 0.049
pval 0.033 0.370 0.203
Received intensive supp. feeding
b 0.021* 0.025** 0.021 0.002 0.000 0.011
se 0.011 0.010 0.017 0.013 0.018 0.020
pval 0.878 0.982 0.614
Received health subsidy for pre-/postnatal care
b 0.031*** 0.029** 0.038*** 0.006 0.018 0.084***
se 0.006 0.012 0.012 0.025 0.014 0.022
pval 0.821 0.383 0.008
Received health subsidy for childbirth
b 0.136*** 0.098*** 0.056*** -0.004 0.028* 0.074***
se 0.020 0.032 0.018 0.015 0.010 0.017
pval 0.776 0.062 0.004
Average standardized effects b 0.259*** 0.239*** 0.383*** 0.027 0.062 0.135

66
se 0.027 0.038 0.042 0.016 0.035 0.033
pval 0.515 0.169 0.587
Average standardized effects, health
b 0.269*** 0.267*** 0.318*** 0.033 0.108** 0.268***
se 0.030 0.052 0.055 0.029 0.047 0.056
pval 0.308 0.045 0.001
Average standardized effects, education
b 0.249*** 0.211*** 0.449*** 0.021 0.003 0.003
se 0.042 0.050 0.069 0.017 0.043 0.037
pval 0.574 0.955 0.974
All outcomes are dummy variables. Treatment effects represent the net effect of Generasi on outcomes in each province, respectively.
Appendix Table 4. Program impact on main targeted indicators (with and without new indicators)
Wave III Wave IV
Generasi effect
Control mean
N Generasi effect
Control mean
N
Number of prenatal visits b 0.068 7.631
3,522 0.011 8.512 4,285
se 0.169 4.220 0.160 4.209
pval 0.951
Delivery by trained midwife b 0.002 0.777 2,582 0.007 0.922 3,279
se 0.019 0.416 0.010 0.268
pval 0.575
Number of postnatal visits b -0.026 1.629 2,583 0.028 1.836 3,279
se 0.109 2.453 0.094 2.289
pval 0.779
Iron tablet sachets b 0.060 1.739 3,471 -0.011 2.173 4,254
se 0.053 1.273 0.056 1.412
pval 0.849
Percent of immunization b 0.002 0.754 2,885 0.002 0.825 3,052
se 0.014 0.287 0.012 0.255
pval 0.888
Number of weight checks b 0.188*** 2.263 4,390 0.129*** 2.270 3,879
se 0.047 1.120 0.045 1.104
pval 0.008
Number vitamin A supplements b 0.041 1.445 2,218 0.060 1.402 2,260
se 0.044 0.954 0.037 0.967
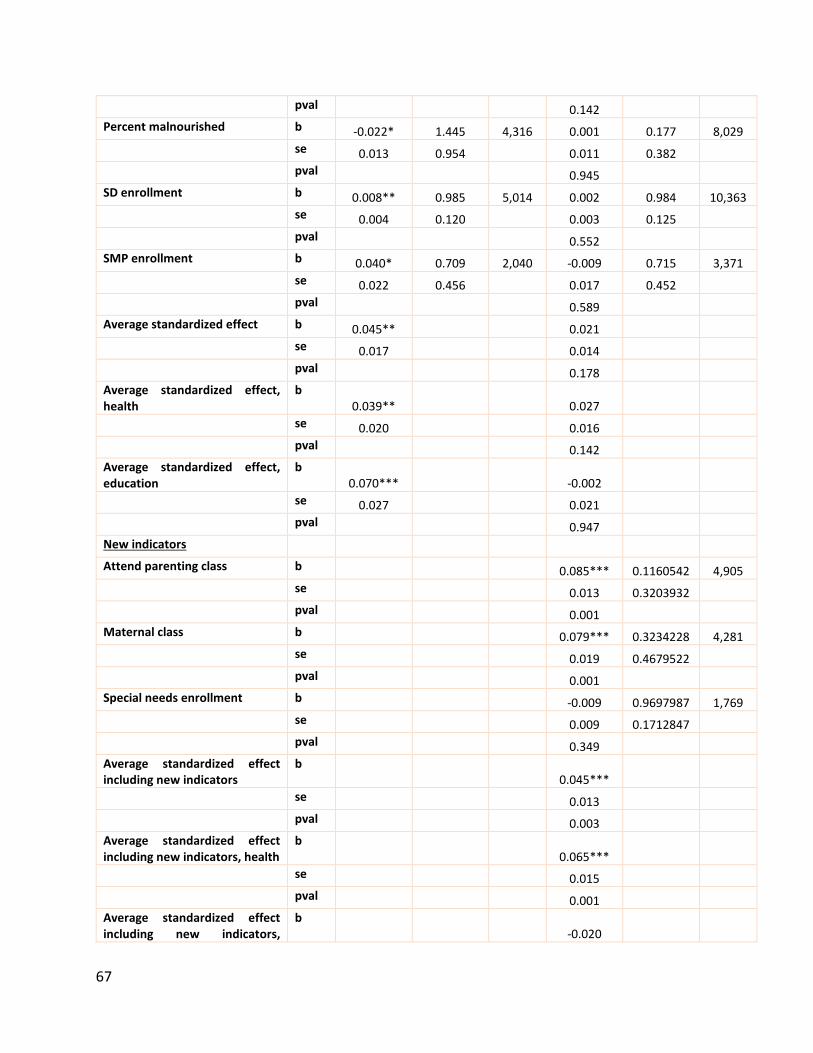
67
pval 0.142
Percent malnourished b -0.022* 1.445 4,316 0.001 0.177 8,029
se 0.013 0.954 0.011 0.382
pval 0.945
SD enrollment b 0.008** 0.985 5,014 0.002 0.984 10,363
se 0.004 0.120 0.003 0.125
pval 0.552
SMP enrollment b 0.040* 0.709 2,040 -0.009 0.715 3,371
se 0.022 0.456 0.017 0.452
pval 0.589
Average standardized effect b 0.045** 0.021
se 0.017 0.014
pval 0.178
Average standardized effect, health
b 0.039** 0.027
se 0.020 0.016
pval 0.142
Average standardized effect, education
b 0.070*** -0.002
se 0.027 0.021
pval 0.947
New indicators
Attend parenting class b 0.085*** 0.1160542 4,905
se 0.013 0.3203932
pval 0.001
Maternal class b 0.079*** 0.3234228 4,281
se 0.019 0.4679522
pval 0.001
Special needs enrollment b -0.009 0.9697987 1,769
se 0.009 0.1712847
pval 0.349
Average standardized effect including new indicators
b 0.045***
se 0.013
pval 0.003
Average standardized effect including new indicators, health
b 0.065***
se 0.015
pval 0.001
Average standardized effect including new indicators,
b -0.020

68
education
se 0.024
pval 0.457
Appendix Table 5. Program impact on main targeted indicators, provincial breakdown
Wave III Wave IV
Java Generasi
effect
Sulawesi Generasi
effect
NTT Generasi
effect
Java Generasi
effect
Sulawesi Generasi
effect
NTT Generasi
effect
Number of prenatal visits b 0.065 0.038 0.077 0.062 -0.057 -0.098
se 0.195 0.409 0.463 0.179 0.485 0.364
pval 0.779 0.936 0.818
Delivery by trained midwife
b 0.020 -0.006 -0.048 0.016 0.003 -0.019
se 0.021 0.039 0.057 0.013 0.021 0.024
pval 0.296 0.934 0.551
Number of postnatal visits
b -0.130 0.102 0.206 0.067 -0.356 0.209
se 0.148 0.200 0.209 0.126 0.197 0.162
pval 0.640 0.133 0.276
Iron tablet sachets b 0.082 -0.012 0.035 -0.023 -0.021 0.037
se 0.067 0.117 0.120 0.072 0.131 0.120
pval 0.746 0.889 0.784
Percent of immunization b -0.010 0.020 0.019 -0.012 -0.016 0.061*
se 0.015 0.038 0.039 0.014 0.029 0.029
pval 0.380 0.674 0.096
Number of weight checks b 0.151*** 0.252* 0.240** 0.127** 0.162 0.107
se 0.058 0.126 0.110 0.060 0.100 0.091
pval 0.044 0.213 0.181
Number vitamin A supplements
b 0.061 0.083 -0.033 0.052 0.043 0.097
se 0.057 0.093 0.104 0.049 0.068 0.083
pval 0.332 0.625 0.292
Percent malnourished b -0.003 -0.017 -0.090*** 0.001 -0.056* 0.041
se 0.015 0.037 0.027 0.011 0.024 0.032
pval 0.918 0.064 0.218
SD enrollment b -0.004 0.010 0.042*** -0.000 -0.002 0.008*
se 0.004 0.012 0.007 0.002 0.012 0.004
pval 0.865 0.895 0.071

69
SMP enrollment b 0.017 0.022 0.085 -0.013 -0.006 -0.003
se 0.026 0.059 0.057 0.021 0.044 0.034
pval 0.509 0.890 0.922
Average standardized effect
b 0.025 0.051 0.083* -0.000 -0.001 0.009
se 0.020 0.047 0.045 0.002 0.012 0.005
pval 0.865 0.910 0.109
Average standardized effect, health
b 0.032 0.051 0.059 -0.013 0.008 0.010
se 0.024 0.051 0.050 0.021 0.050 0.040
pval 0.509 0.871 0.816
Average standardized effect, education
b -0.001 0.051 0.181*** -0.004 -0.002 -0.014
se 0.037 0.061 0.058 0.009 0.030 0.013
pval 0.717 0.949 0.391
New indicators (Wave IV only)
Attend parenting class b 0.075*** 0.097** 0.106***
se 0.017 0.034 0.027
pval 0.001 0.050 0.003
Maternal class b 0.108*** -0.004 0.052
se 0.025 0.041 0.042
pval 0.001 0.922 0.290
Special needs enrollment b -0.004 -0.006 -0.018
se 0.009 0.028 0.010
pval 0.717 0.856 0.107
Average standardized effect including new indicators
b 0.038*** -0.012 0.015
se 0.017 0.037 0.038
pval 0.001 0.900 0.600
Average standardized effect including new indicators, health
b 0.057*** -0.021 0.012
se 0.019 0.038 0.047
pval 0.001 0.600 0.800
Average standardized effect including new indicators, education
b -0.026 0.019 0.026
se 0.026 0.095 0.041
pval 0.700 0.800 0.700
Treatment effects represent the net effect of Generasi on outcomes in each province, respectively.

70
Appendix Table 6. Program impact on longer-term outcomes
Wave III Wave IV
Generasi effect
Control mean
N Generasi effect
Control mean
N
Malnourished b -0.022* 0.228 4,316 0.002 0.177 8,069
se 0.013 0.42 0.011 0.381
pval 0.874
Severely malnourished b -0.015 0.069 4,316 0.000 0.044 8,069
se 0.009 0.253 0.005 0.205
pval 0.930
Wasting b -0.001 0.199 3,897 0.017 0.156 7,925
se 0.015 0.400 0.010 0.363
pval 0.118
Severe wasting b 0.003 0.089 3,897 0.003 0.043 7,925
se 0.010 0.285 0.005 0.202
pval 0.604
Stunting b 0.030* 0.350 3,926 0.000 0.226 7,923
se 0.017 0.477 0.013 0.418
pval 0.961
Severe stunting b 0.006 0.211 3,926 0.004 0.086 7,923
se 0.017 0.409 0.008 0.280
pval 0.691
Mortality 0–28 days b -0.001 0.008 2,572 -0.002 0.017
13,240
se 0.004 0.089 0.002 0.131
pval 0.462
Mortality 0–12 months b -0.001 0.011 3,301 -0.003 0.028
13,240
se 0.004 0.105 0.003 0.164
pval 0.313
Language score 6 to 12 b -0.023 -0.013 4,308 -0.022 0.000 6,734
se 0.041 1.056 0.030 0.999
pval 0.496
Math score 6 to 12 b -0.012 -0.060 3,957 -0.040 0.000 6,733
se 0.043 1.045 0.038 0.999
pval 0.281
Total score 6 to 12 b -0.015 -0.034 3,943 -0.034 0.000 6,733
se 0.042 1.045 0.035 0.999
pval 0.369

71
Raven score 6 to 12 b -0.007 0.000 6,637
se 0.031 0.999
pval 0.813
Average standardized effect b 0.004 -0.010
se 0.017 0.019
pval 0.633
Average standardized effect, health
b 0.003 -0.013
se 0.020 0.018
pval 0.486
Average standardized effect, education
b 0.017 -0.007
se 0.036 0.031
pval 0.815
Appendix Table 7. Program impact on longer-term outcomes, provincial breakdown
Wave III Wave IV
Java Generasi
effect
Sulawesi Generasi
effect
NTT Generasi
effect
Java Generasi
effect
Sulawesi Generasi
effect
NTT Generasi
effect
Malnourished b -0.003 -0.017 -0.090*** 0.002 -0.055* 0.042
se 0.015 0.037 0.027 0.011 0.025 0.032
pval 0.830 0.076 0.205
Severely malnourished b -0.000 -0.026 -0.053* 0.001 -0.009 0.001
se 0.009 0.026 0.028 0.005 0.013 0.016
pval 0.777 0.589 0.960
Wasting b -0.013 0.048 -0.008 0.004 0.015 .057*
se 0.017 0.037 0.038 0.012 0.024 0.027
pval 0.729 0.592 0.063
Severe wasting b -0.002 0.017 0.007 0.003 -0.001 0.007
se 0.013 0.022 0.026 0.007 0.009 0.014
pval 0.589 0.956 0.641
Stunting b 0.051** 0.011 -0.024 0.005 -0.037 0.012
se 0.022 0.043 0.031 0.017 0.035 0.021
pval 0.781 0.336 0.673
Severe stunting b 0.034 -0.016 -0.061** 0.001 -0.004 0.018
se 0.021 0.043 0.031 0.011 0.023 0.016

72
pval 0.925 0.906 0.323
Mortality 0–28 days b 0.000 0.002 -0.010 -0.002 -0.003 -0.001
se 0.004 0.008 0.012 0.003 0.006 0.005
pval 0.552 0.642 0.827
Mortality 0–12 months b 0.003 0.004 0.005 -0.003 -0.009 0.001
se 0.005 0.019 0.013 0.003 0.007 0.007
pval 0.334 0.219 0.943
Language score 6 to 12 b -0.053 -0.032 0.056 -0.019 0.075 -0.088
se 0.051 0.118 0.094 0.033 0.068 0.076
pval 0.585 0.334 0.297
Math score 6 to 12 b -0.011 0.068 -0.086 -0.056 0.031 -0.055
se 0.052 0.095 0.099 0.041 0.091 0.099
pval 0.177 0.772 0.563
Total score 6 to 12 b -0.030 0.033 -0.028 -0.040 0.063 -0.086
se 0.054 0.086 0.082 0.037 0.078 0.094
pval 0.302 0.502 0.378
Raven score 6 to 12 b -0.032 0.050 0.015
se 0.036 0.063 0.076
pval 0.392 0.567 0.846
Average standardized effect
b -0.012 -0.012 0.044 -0.021 0.047 -0.026
se 0.028 0.031 0.031 0.022 0.043 0.046
pval 0.365 0.451 0.620
Average standardized effect, health
b -0.024 -0.007 0.083** -0.009 0.044 -0.066
se 0.027 0.037 0.042 0.020 0.044 0.048
pval 0.669 0.413 0.151
Average standardized effect, education
b 0.007 0.008 0.042 -0.032 0.050 0.015
se 0.047 0.091 0.072 0.036 0.063 0.076
pval 0.404 0.574 0.850
Treatment effects represent the net effect of Generasi on outcomes in each province, respectively.

73
Appendix Table 8. Program impact on main targeted indicators, interactions with pre-period subdistrict level variables, Wave IV
Generasi effect
Interaction with pre-
period level
Generasi at 10th
percentile
Control mean
N
Number of prenatal visits b -0.406*** 0.055 -0.154 8.512 4,285
se 0.506 0.064 0.247 4.209
pval 0.001 0.443 0.551
Delivery by trained midwife b -0.014 0.030 -0.008 0.922 3,279
se 0.034 0.042 0.026 0.268
pval 0.790 0.567 0.806
Number of postnatal visits b -0.035 0.038 -0.020 1.836 3,279
se 0.175 0.103 0.141 2.289
pval 0.734 0.720 0.881
Iron tablet sachets b 0.108 -0.075 0.033 2.173 4,254
se 0.190 0.120 0.083 1.412
pval 0.401 0.572 0.696
Percent of immunization b 0.048 -0.069 0.022 0.825 3,052
se 0.047 0.064 0.025 0.255
pval 0.501 0.326 0.449
Number of weight checks b -0.076 0.097 0.059 2.270 3,879
se 0.204 0.092 0.084 1.104
pval 0.472 0.344 0.525
Number vitamin A supplements b 0.107 -0.031 0.076 1.402 2,260
se 0.136 0.086 0.058 0.967
pval 0.279 0.754 0.233
Percent malnourished b -0.002 0.019 0.005 0.177 8,069
se 0.016 0.098 0.022 0.381
pval 0.986 0.846 0.841
SD enrollment b -0.059 0.064 -0.003 0.985 1,0286
se 0.048 0.051 0.005 0.123
pval 0.301 0.259 0.575
SMP enrollment b -0.049 0.070 -0.029 0.715 3,340
se 0.044 0.066 0.027 0.452
pval 0.511 0.361 0.349
Average standardized effect b 0.050 0.007
se 0.060 0.024
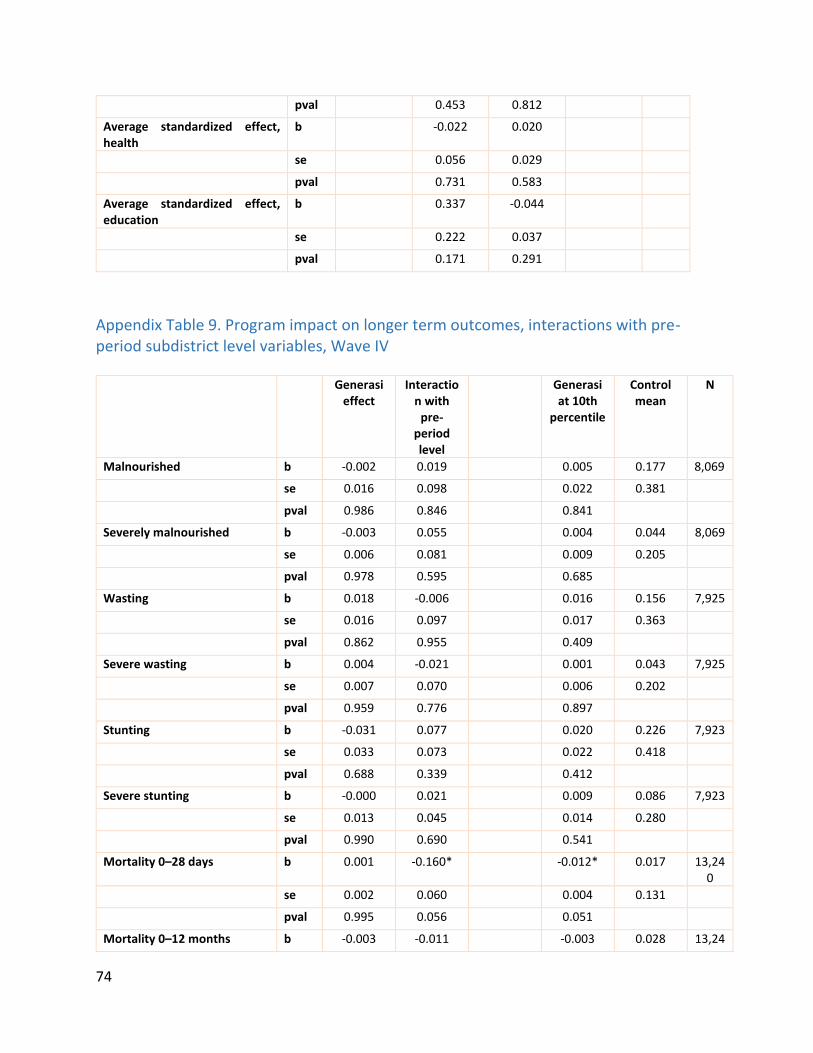
74
pval 0.453 0.812
Average standardized effect, health
b -0.022 0.020
se 0.056 0.029
pval 0.731 0.583
Average standardized effect, education
b 0.337 -0.044
se 0.222 0.037
pval 0.171 0.291
Appendix Table 9. Program impact on longer term outcomes, interactions with pre-period subdistrict level variables, Wave IV
Generasi effect
Interaction with
pre-period level
Generasi at 10th
percentile
Control mean
N
Malnourished b -0.002 0.019 0.005 0.177 8,069
se 0.016 0.098 0.022 0.381
pval 0.986 0.846 0.841
Severely malnourished b -0.003 0.055 0.004 0.044 8,069
se 0.006 0.081 0.009 0.205
pval 0.978 0.595 0.685
Wasting b 0.018 -0.006 0.016 0.156 7,925
se 0.016 0.097 0.017 0.363
pval 0.862 0.955 0.409
Severe wasting b 0.004 -0.021 0.001 0.043 7,925
se 0.007 0.070 0.006 0.202
pval 0.959 0.776 0.897
Stunting b -0.031 0.077 0.020 0.226 7,923
se 0.033 0.073 0.022 0.418
pval 0.688 0.339 0.412
Severe stunting b -0.000 0.021 0.009 0.086 7,923
se 0.013 0.045 0.014 0.280
pval 0.990 0.690 0.541
Mortality 0–28 days b 0.001 -0.160* -0.012* 0.017 13,240
se 0.002 0.060 0.004 0.131
pval 0.995 0.056 0.051
Mortality 0–12 months b -0.003 -0.011 -0.003 0.028 13,24
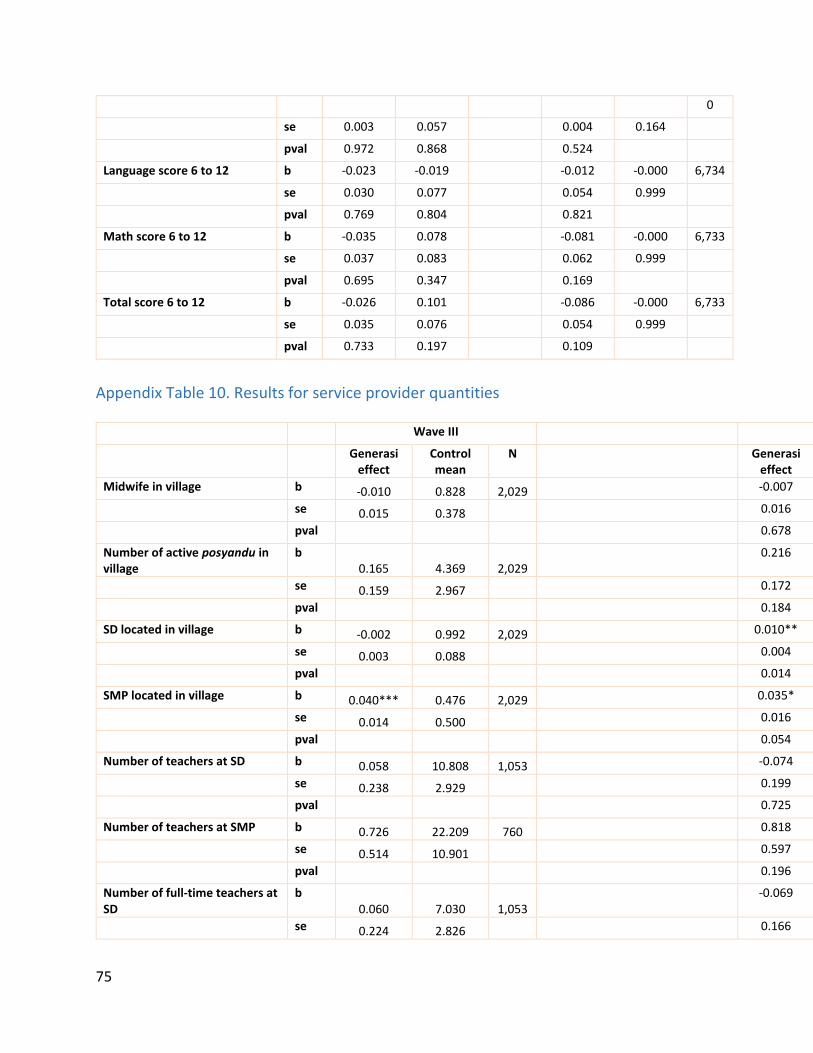
75
0
se 0.003 0.057 0.004 0.164
pval 0.972 0.868 0.524
Language score 6 to 12 b -0.023 -0.019 -0.012 -0.000 6,734
se 0.030 0.077 0.054 0.999
pval 0.769 0.804 0.821
Math score 6 to 12 b -0.035 0.078 -0.081 -0.000 6,733
se 0.037 0.083 0.062 0.999
pval 0.695 0.347 0.169
Total score 6 to 12 b -0.026 0.101 -0.086 -0.000 6,733
se 0.035 0.076 0.054 0.999
pval 0.733 0.197 0.109
Appendix Table 10. Results for service provider quantities
Wave III Wave IV
Generasi effect
Control mean
N Generasi effect
Midwife in village b -0.010 0.828 2,029 -0.007
se 0.015 0.378 0.016
pval 0.678
Number of active posyandu in village
b 0.165 4.369 2,029
0.216
se 0.159 2.967 0.172
pval 0.184
SD located in village b -0.002 0.992 2,029 0.010**
se 0.003 0.088 0.004
pval 0.014
SMP located in village b 0.040*** 0.476 2,029 0.035*
se 0.014 0.500 0.016
pval 0.054
Number of teachers at SD b 0.058 10.808 1,053 -0.074
se 0.238 2.929 0.199
pval 0.725
Number of teachers at SMP b 0.726 22.209 760 0.818
se 0.514 10.901 0.597
pval 0.196
Number of full-time teachers at SD
b 0.060 7.030 1,053
-0.069
se 0.224 2.826 0.166
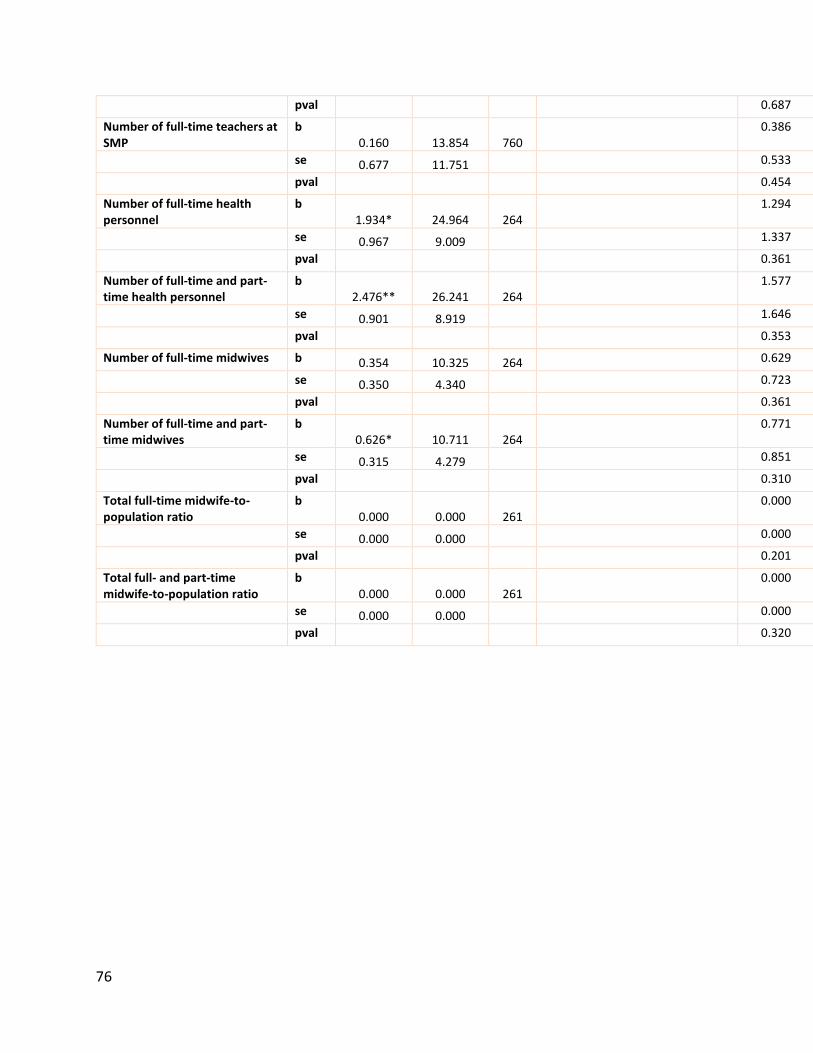
76
pval 0.687
Number of full-time teachers at SMP
b 0.160 13.854 760
0.386
se 0.677 11.751 0.533
pval 0.454
Number of full-time health personnel
b 1.934* 24.964 264
1.294
se 0.967 9.009 1.337
pval 0.361
Number of full-time and part-time health personnel
b 2.476** 26.241 264
1.577
se 0.901 8.919 1.646
pval 0.353
Number of full-time midwives b 0.354 10.325 264 0.629
se 0.350 4.340 0.723
pval 0.361
Number of full-time and part-time midwives
b 0.626* 10.711 264
0.771
se 0.315 4.279 0.851
pval 0.310
Total full-time midwife-to-population ratio
b 0.000 0.000 261
0.000
se 0.000 0.000 0.000
pval 0.201
Total full- and part-time midwife-to-population ratio
b 0.000 0.000 261
0.000
se 0.000 0.000 0.000
pval 0.320
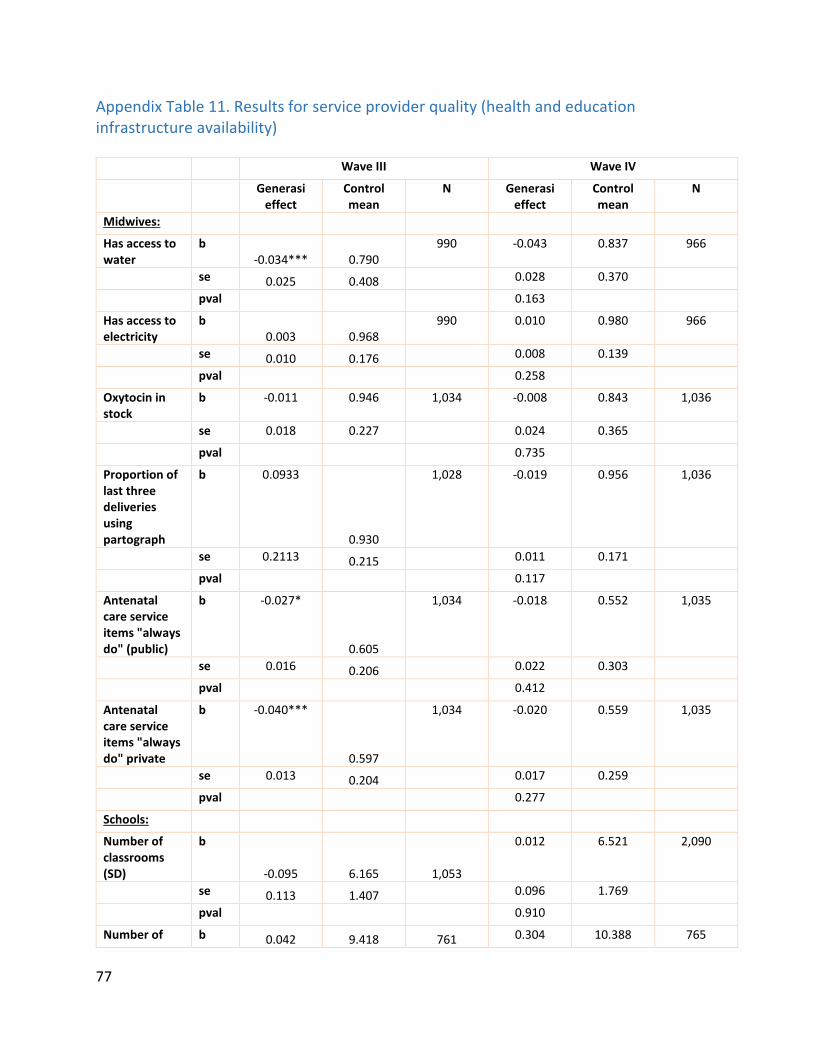
77
Appendix Table 11. Results for service provider quality (health and education infrastructure availability)
Wave III Wave IV
Generasi effect
Control mean
N Generasi effect
Control mean
N
Midwives:
Has access to water
b -0.034*** 0.790
990 -0.043 0.837 966
se 0.025 0.408 0.028 0.370
pval 0.163
Has access to electricity
b 0.003 0.968
990 0.010 0.980 966
se 0.010 0.176 0.008 0.139
pval 0.258
Oxytocin in stock
b -0.011 0.946
1,034 -0.008 0.843 1,036
se 0.018 0.227 0.024 0.365
pval 0.735
Proportion of last three deliveries using partograph
b 0.0933
0.930
1,028 -0.019 0.956 1,036
se 0.2113 0.215 0.011 0.171
pval 0.117
Antenatal care service items "always do" (public)
b -0.027*
0.605
1,034 -0.018 0.552 1,035
se 0.016 0.206 0.022 0.303
pval 0.412
Antenatal care service items "always do" private
b -0.040***
0.597
1,034 -0.020 0.559 1,035
se 0.013 0.204 0.017 0.259
pval 0.277
Schools:
Number of classrooms (SD)
b
-0.095 6.165 1,053
0.012 6.521 2,090
se 0.113 1.407 0.096 1.769
pval 0.910
Number of b 0.042 9.418 761 0.304 10.388 765

78
classrooms (SMP)
se 0.336 6.217 0.393 6.742
pval 0.429
Condition of school building (SD, scale 0–1)
b
-0.019 0.908 1,047
-0.000 0.899 2,082
se 0.012 0.157 0.009 0.153
pval 0.973
Condition of school building (SMP scale 0-1)
b
0.003 0.940 752
0.017* 0.923 758
se 0.009 0.120 0.011 0.133
pval 0.072
Has student latrine (SD)
b 0.006 0.872 1,053
0.002 0.925 2,089
se 0.023 0.335 0.013 0.264
pval 0.880
Has student latrine (SMP)
b -0.012 0.933 761
0.006 0.950 765
se 0.017 0.250 0.016 0.218
pval 0.737
Puskesmas:
Stock out any vaccine last two months
b
-0.020 0.145 260
-0.000 0.146 263
se 0.044 0.354 0.047 0.356
pval 0.998
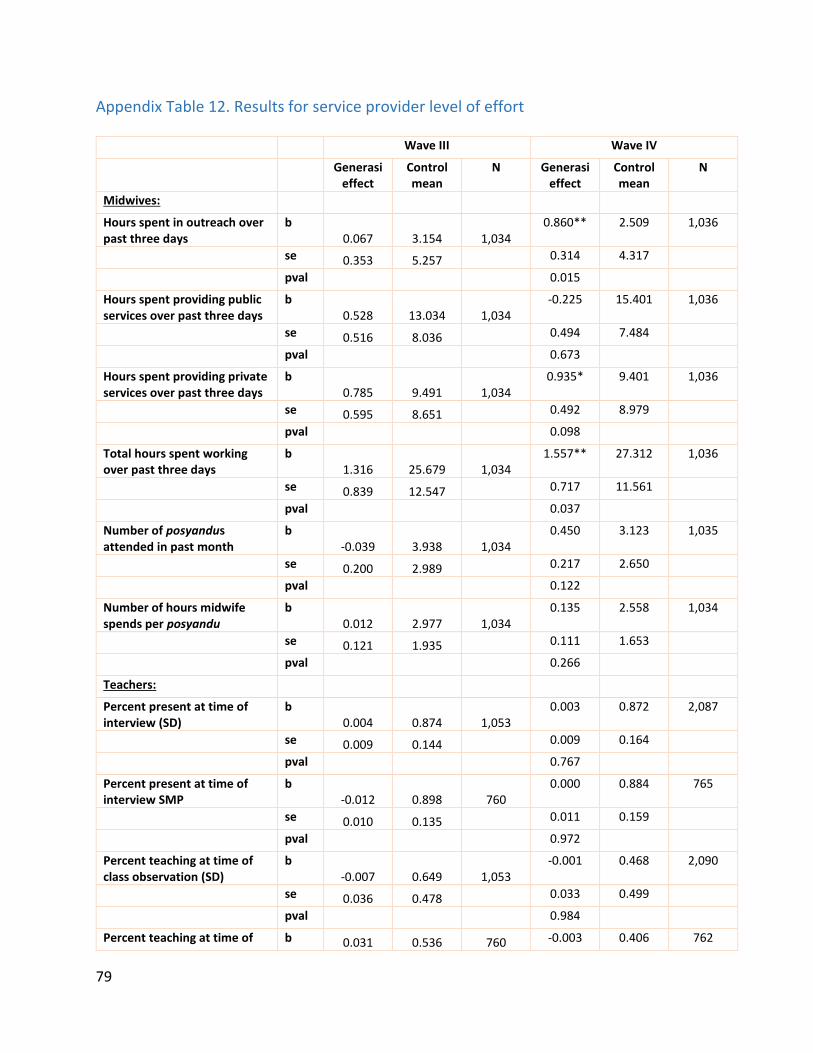
79
Appendix Table 12. Results for service provider level of effort
Wave III Wave IV
Generasi effect
Control mean
N Generasi effect
Control mean
N
Midwives:
Hours spent in outreach over past three days
b 0.067 3.154 1,034
0.860** 2.509 1,036
se 0.353 5.257 0.314 4.317
pval 0.015
Hours spent providing public services over past three days
b 0.528 13.034 1,034
-0.225 15.401 1,036
se 0.516 8.036 0.494 7.484
pval 0.673
Hours spent providing private services over past three days
b 0.785 9.491 1,034
0.935* 9.401 1,036
se 0.595 8.651 0.492 8.979
pval 0.098
Total hours spent working over past three days
b 1.316 25.679 1,034
1.557** 27.312 1,036
se 0.839 12.547 0.717 11.561
pval 0.037
Number of posyandus attended in past month
b -0.039 3.938 1,034
0.450 3.123 1,035
se 0.200 2.989 0.217 2.650
pval 0.122
Number of hours midwife spends per posyandu
b 0.012 2.977 1,034
0.135 2.558 1,034
se 0.121 1.935 0.111 1.653
pval 0.266
Teachers:
Percent present at time of interview (SD)
b 0.004 0.874 1,053
0.003 0.872 2,087
se 0.009 0.144 0.009 0.164
pval 0.767
Percent present at time of interview SMP
b -0.012 0.898 760
0.000 0.884 765
se 0.010 0.135 0.011 0.159
pval 0.972
Percent teaching at time of class observation (SD)
b -0.007 0.649 1,053
-0.001 0.468 2,090
se 0.036 0.478 0.033 0.499
pval 0.984
Percent teaching at time of b 0.031 0.536 760 -0.003 0.406 762

80
class observation (SMP)
se 0.043 0.500 0.042 0.492
pval 0.942
Puskesmas:
Minutes wait at recent health visit
b 2.387 28.034 238
3.678 25.408 243
se 3.712 23.111 3.387 21.833
pval 0.302
Percent of providers present at time of observation
b -0.044* 0.814 264
0.002 0.848 264
se 0.026 0.206 0.023 0.189
pval 0.945
Appendix Table 13. Results for community efforts at service provision, monitoring, and participation
Wave III Wave IV
Generasi Effect
Control Mean
N Generasi Effect
Control Mean
N
Community effort at direct service provision:
Number of posyandus in village b 0.162 4.369 2,029 0.216 4.222 2,133
se 0.161 2.967 0.172 4.569
pval 0.184
Number of posyandu meetings in past year at selected posyandus
b
-0.087 11.812 2,108
0.040 11.917 2,096
se 0.089 1.893 0.043 0.689
pval 0.470
Number of volunteers at selected posyandus
b 0.327** 4.794 2,108
0.156 5.195 2,096
se 0.132 2.061 0.127 2.055
pval 0.310
Community effort at outreach:
Number of sweepings at selected posyandus in last year
b -0.390 6.036 2,108
-0.096 5.715 2,095
se 0.310 6.483 0.242 4.903
pval 0.713
Number of SD school committee meetings with parents in past year
b
-0.063 2.426 1,043
0.018 2.422 2,070
se 0.168 3.116 0.076 1.627
pval 0.845

81
Number of SMP school committee meetings with parents in past year
b
0.212 2.210 753
0.014 2.386 758
se 0.158 1.431 0.094 1.334
pval 0.886
Community effort at monitoring:
Number of SD school committee members
b 0.098 8.445 1,050
0.200 7.746 2,085
se 0.328 3.636 0.227 5.308
pval 0.440
Number of SMP school committee members
b 0.199 7.648 755
0.228 6.504 760
se 0.299 4.616 0.272 3.253
pval 0.426
Number of SD school committee meetings with teacher in past year
b
-0.108 4.181 1,043
0.087 3.625 2,078
se 0.288 5.190 0.157 3.514
pval 0.668
Number of SMP school committee meetings with teacher in past year
b
0.550* 3.555 745
0.179 3.428 758
se 0.292 3.358 0.294 3.223
pval 0.577
Participation in health/education programs:
Participation in meetings about health education
b 0.033* 0.303 4,441
0.106*** 0.303 3,905
se 0.018 0.460 0.022 0.460
pval 0.001
Proportion of kids under three with KIA
b 0.089*** 0.528 4,422
0.003 0.906 3,904
se 0.020 0.499 0.012 0.292
pval 0.824
Proportion of households that think health services improved over last three years
b
0.042*** 0.608 10,74
1
0.001 0.603 11,448
se 0.013 0.488 0.012 0.489
pval 0.953
Proportion of households that think education services improved over last two years
b
0.042*** 0.622 10,74
1
-0.003 0.629 11,448
se 0.013 0.485 0.012 0.483
pval 0.818
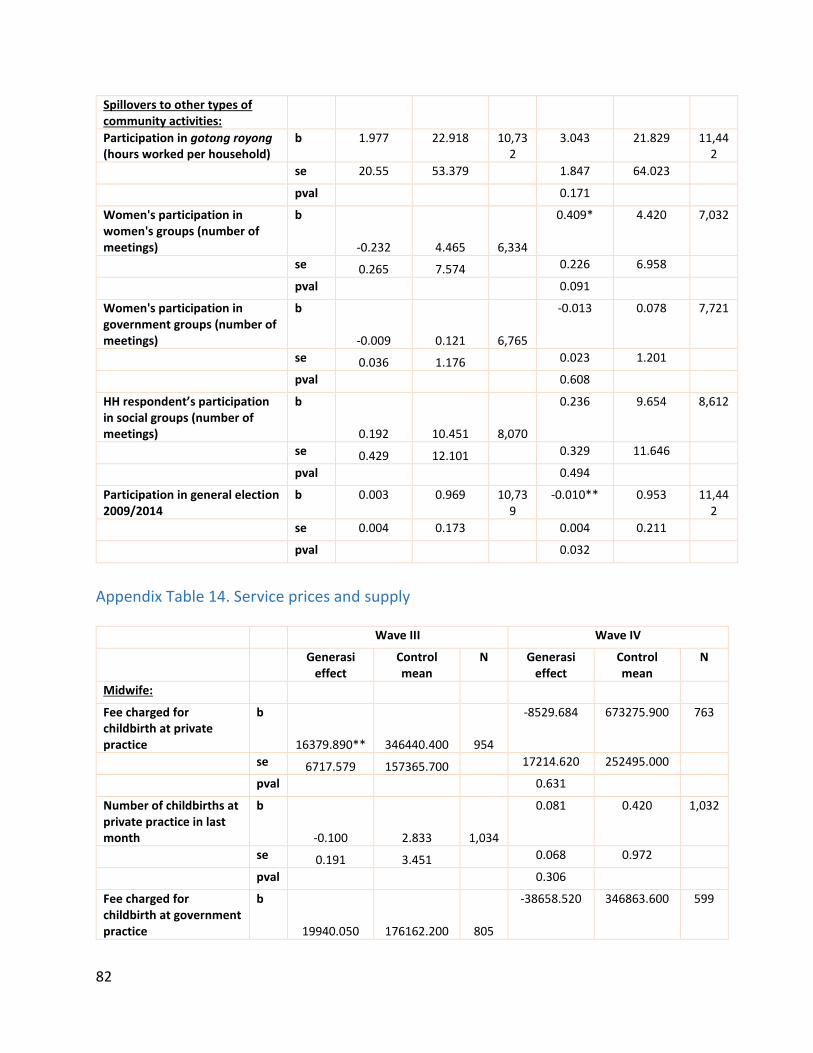
82
Spillovers to other types of community activities:
Participation in gotong royong (hours worked per household)
b 1.977 22.918 10,732
3.043 21.829 11,442
se 20.55 53.379 1.847 64.023
pval 0.171
Women's participation in women's groups (number of meetings)
b
-0.232 4.465 6,334
0.409* 4.420 7,032
se 0.265 7.574 0.226 6.958
pval 0.091
Women's participation in government groups (number of meetings)
b
-0.009 0.121 6,765
-0.013 0.078 7,721
se 0.036 1.176 0.023 1.201
pval 0.608
HH respondent’s participation in social groups (number of meetings)
b
0.192 10.451 8,070
0.236 9.654 8,612
se 0.429 12.101 0.329 11.646
pval 0.494
Participation in general election 2009/2014
b 0.003 0.969 10,739
-0.010** 0.953 11,442
se 0.004 0.173 0.004 0.211
pval 0.032
Appendix Table 14. Service prices and supply
Wave III Wave IV
Generasi effect
Control mean
N Generasi effect
Control mean
N
Midwife:
Fee charged for childbirth at private practice
b
16379.890** 346440.400 954
-8529.684 673275.900 763
se 6717.579 157365.700 17214.620 252495.000
pval 0.631
Number of childbirths at private practice in last month
b
-0.100 2.833 1,034
0.081 0.420 1,032
se 0.191 3.451 0.068 0.972
pval 0.306
Fee charged for childbirth at government practice
b
19940.050 176162.200 805
-38658.520 346863.600 599

83
se 12106.900 168022.200 24713.920 310241.300
pval 0.155
Number of childbirths at government practice in last month
b
1.779** 1.914 1,034
0.009 0.565 1,032
se 0.630 4.595 0.145 2.398
pval 0.943
Fee charged for childbirth (average of private and government)
b
6766.788 314296.100 877
-62251.850* 558133.600 383
se 9785.820 163812.700 32394.570 302356.800
pval 0.075
Total number of childbirths in last month
b 1.688* 4.747 1,034
0.067 0.985 1,032
se 0.661 6.174 0.163 2.692
pval 0.688
Fee paid by mother for normal childbirth
b 196622.200 1600495.000 309
-321209.600 2267676.000 476
se 369278.900 2426973.000 328489.400 3043434.000
pval 0.351
Fee charged for ANC at private practice
b 1834.726 14490.230 961
-1280.638 27010.580 910
se 1267.886 8141.713 1560.514 20973.470
pval 0.575
Number of ANC visits at private practice last month
b
0.011 3.957 1,034
-0.516 3.707 1,032
se 0.342 5.196 0.380 6.230
pval 0.198
Fee charged for ANC at government practice
b -72.889 2457.529 820
771.153 4306.763 662
se 227.355 3289.361 507.245 6722.037
pval 0.179
Number of ANC visits at government practice last month
b
1.877 5.920 1,034
0.536 3.787 1,032
se 1.015 11.659 0.618 7.736
pval 0.466
Fee charged for ANC visit (average of private and government)
b
804.314 8784.846 961
-1689.482 18518.840 910
se 739.996 7429.886 1098.146 15903.330
pval 0.137
Total number of ANC visits last month
b 1.861 9.877 1,034
0.029 7.494 1,032
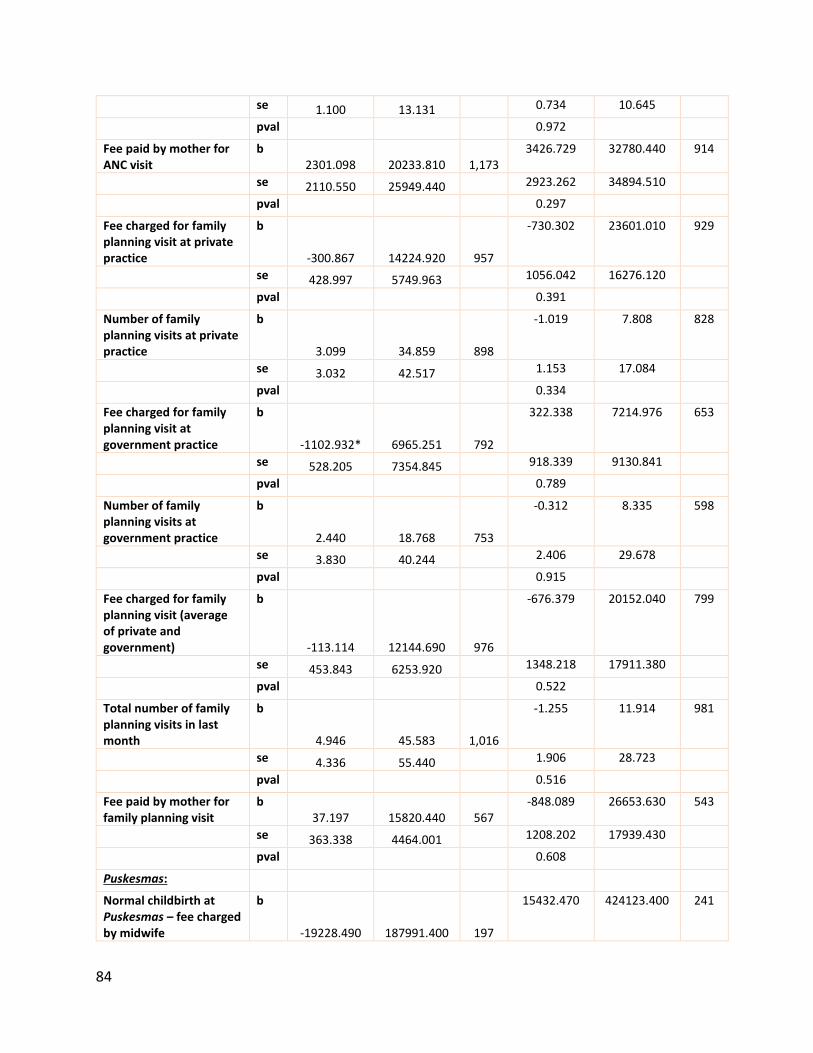
84
se 1.100 13.131 0.734 10.645
pval 0.972
Fee paid by mother for ANC visit
b 2301.098 20233.810 1,173
3426.729 32780.440 914
se 2110.550 25949.440 2923.262 34894.510
pval 0.297
Fee charged for family planning visit at private practice
b
-300.867 14224.920 957
-730.302 23601.010 929
se 428.997 5749.963 1056.042 16276.120
pval 0.391
Number of family planning visits at private practice
b
3.099 34.859 898
-1.019 7.808 828
se 3.032 42.517 1.153 17.084
pval 0.334
Fee charged for family planning visit at government practice
b
-1102.932* 6965.251 792
322.338 7214.976 653
se 528.205 7354.845 918.339 9130.841
pval 0.789
Number of family planning visits at government practice
b
2.440 18.768 753
-0.312 8.335 598
se 3.830 40.244 2.406 29.678
pval 0.915
Fee charged for family planning visit (average of private and government)
b
-113.114 12144.690 976
-676.379 20152.040 799
se 453.843 6253.920 1348.218 17911.380
pval 0.522
Total number of family planning visits in last month
b
4.946 45.583 1,016
-1.255 11.914 981
se 4.336 55.440 1.906 28.723
pval 0.516
Fee paid by mother for family planning visit
b 37.197 15820.440 567
-848.089 26653.630 543
se 363.338 4464.001 1208.202 17939.430
pval 0.608
Puskesmas:
Normal childbirth at Puskesmas – fee charged by midwife
b
-19228.490 187991.400 197
15432.470 424123.400 241

85
se 18394.360 133797.100 31303.010 280562.100
pval 0.623
Normal childbirth at Puskesmas – quantity by midwife
b
-1.987 39.573 262
14.957 43.843 257
se 5.291 44.054 11.262 66.650
pval 0.317
posyandu:
posyandu – fee for visit b -79.335* 282.817 2,073 -32.799 589.482 2,082
se 45.851 1305.231 70.061 1365.238
pval 0.735
posyandu – quantity of kids weighed at last meeting where service was offered
b
11.155*** 40.224 2,075
5.339*** 44.623 2,084
se 1.693 26.624 1.924 29.722
pval 0.007
posyandu – quantity of kids with nutritional supplement at last meeting where service was offered
b
16.330*** 33.372 2,050
4.284** 41.464 2,064
se 1.819 29.626 1.744 31.997
pval 0.025
posyandu – quantity of kids immunized at last meeting where service was offered
b
2.375** 13.071 1,986
-0.579 11.989 2,016
se 1.082 19.735 1.174 24.066
pval 0.646
posyandu – quantity of mothers receiving ANC visits at last meeting where service was offered
b
0.830 5.296 2,044
0.436 4.355 2,061
se 0.714 15.032 0.437 9.581
pval 0.360
posyandu – quantity of mothers receiving iron pills at last meeting where service was offered
b
1.484** 5.330 2,007
0.814 4.690 2,017
se 0.752 15.516 0.571 10.835
pval 0.156
posyandu – quantity of kids receiving vitamin A
b 11.689*** 42.944 1,954
0.510 51.810 1,992
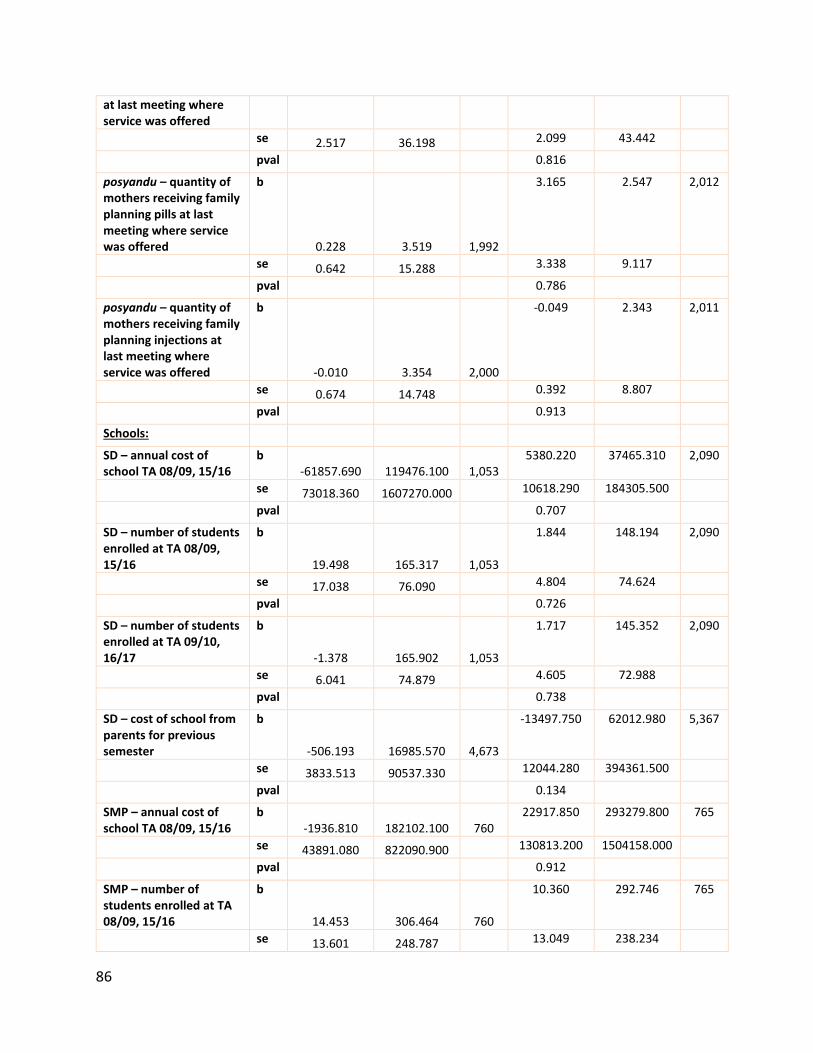
86
at last meeting where service was offered
se 2.517 36.198 2.099 43.442
pval 0.816
posyandu – quantity of mothers receiving family planning pills at last meeting where service was offered
b
0.228 3.519 1,992
3.165 2.547 2,012
se 0.642 15.288 3.338 9.117
pval 0.786
posyandu – quantity of mothers receiving family planning injections at last meeting where service was offered
b
-0.010 3.354 2,000
-0.049 2.343 2,011
se 0.674 14.748 0.392 8.807
pval 0.913
Schools:
SD – annual cost of school TA 08/09, 15/16
b -61857.690 119476.100 1,053
5380.220 37465.310 2,090
se 73018.360 1607270.000 10618.290 184305.500
pval 0.707
SD – number of students enrolled at TA 08/09, 15/16
b
19.498 165.317 1,053
1.844 148.194 2,090
se 17.038 76.090 4.804 74.624
pval 0.726
SD – number of students enrolled at TA 09/10, 16/17
b
-1.378 165.902 1,053
1.717 145.352 2,090
se 6.041 74.879 4.605 72.988
pval 0.738
SD – cost of school from parents for previous semester
b
-506.193 16985.570 4,673
-13497.750 62012.980 5,367
se 3833.513 90537.330 12044.280 394361.500
pval 0.134
SMP – annual cost of school TA 08/09, 15/16
b -1936.810 182102.100 760
22917.850 293279.800 765
se 43891.080 822090.900 130813.200 1504158.000
pval 0.912
SMP – number of students enrolled at TA 08/09, 15/16
b
14.453 306.464 760
10.360 292.746 765
se 13.601 248.787 13.049 238.234

87
pval 0.433
SMP – number of students enrolled at TA 09/10, 16/17
b
9.067 316.377 760
16.524 289.421 765
se 11.980 252.919 11.951 229.536
pval 0.181
SMP – cost of school to parents for previous semester
b
-32695.460* 108210.600 1,774
9364.753 129717.200 1,857
se 17197.480 386334.500 15645.760 277193.900
pval 0.577
Appendix Table 15. Main targeted indicators, heterogeneity based on areas most in need
Group Wave III Wave IV
Number of prenatal visits b 1 -0.071 0.004
se 0.248 0.241
b 2 0.172 0.087
se 0.244 0.212
b 3 0.216 0.119
se 0.313 0.269
Delivery by trained midwife b 1 -0.003 -0.002
se 0.043 0.022
b 2 0.016 0.024*
se 0.031 0.013
b 3 0.032 0.005
se 0.022 0.006
Number of postnatal visits b 1 0.070 -0.000
se 0.141 0.115
b 2 0.142 0.290*
se 0.154 0.150
b 3 -0.359 -0.037
se 0.258 0.261
Iron tablet sachets b 1 0.007 0.023
se 0.073 0.090
b 2 0.084 0.039
se 0.076 0.073
b 3 0.174* -0.062
se 0.098 0.122

88
Percent of immunization b 1 0.012 0.035
se 0.027 0.023
b 2 0.002 -0.012
se 0.023 0.018
b 3 -0.007 -0.013
se 0.020 0.018
Number of weight checks b 1 0.257*** 0.194**
se 0.096 0.084
b 2 0.184*** 0.130**
se 0.071 0.062
b 3 0.139* 0.083
se 0.076 0.074
Number vitamin A supplements b 1 0.151* 0.152**
se 0.082 0.077
b 2 0.029 -0.009
se 0.082 0.053
b 3 0.061 -0.069
se 0.086 0.079
Percent malnourished b 1 -0.014 -0.003
se 0.019 0.018
b 2 0.001 0.007
se 0.018 0.011
b 3 -0.050* 0.009
se 0.027 0.022
SD enrollment b 1 0.014** 0.003
se 0.006 0.005
b 2 0.002 0.001
se 0.003 0.003
b 3 0.001 -0.001
se 0.001 0.001
SMP enrollment b 1 0.036 0.011
se 0.040 0.033
b 2 -0.005 0.010
se 0.036 0.028
b 3 -0.018 -0.035
se 0.042 0.032
Using endogenous stratification, group 1 is defined as those most in need, and group 3 is defined as those least in need.

89
Appendix Table 16. Stunting difference-in-differences analysis
Stunting association N
Water sources used for cooking and drinking in the village
Piped water b 0.014 8,196
se 0.058
Pump well water b -0.001 8,196
se 0.061
Well water b 0.132** 8,196
se 0.067
Rain water b 0.081 8,196
se 0.103
Lake water b 0.385* 8,196
se 0.211
Spring water b 0.138* 8,196
se 0.073
River or stream water b -0.031 8,196
se 0.073
Aqua or mineral water b 0.096* 8,196
se 0.053
How village members dispose of garbage
With a service b -0.138 8,133
se 0.0998
Burning it b 0.106 8,133
se 0.117
Into a river or stream b 0.0415 8,133
se 0.0608
Throwing it into the yard/garden, leaving it to rot b 0.113** 8,133
se 0.0547
Throwing into a hole in the ground and then covering the hole b 0.0108 8,133
se 0.058
Open defecation
Open defecation, subdistrict level b 0.040 9,394
se 0.076
Open defecation, individual level b 0.018 9,394
se 0.016
Open defecation means no latrine is used (compared to a private, shared, or public latrine). In models with slightly varied controls, open defecation has a statistically significant association with stunting rates.

90
Latrine use
Own latrine, subdistrict level b 0.022 9,394
se 0.079
Shared latrine, subdistrict level b -0.109 9,394
se 0.120
Public latrine, subdistrict level b -0.396*** 9,394
se 0.141
Own latrine, individual level b -0.024 9,394
se 0.016
Shared latrine, individual level b 0.002 9,394
se 0.022
Public latrine, individual level b -0.003 9,394
se 0.030
Latrine responses are relative to no latrine at all. In models with slightly varied controls, own latrine use has a statistically significant association with stunting rates.
Participated in clean water program
Participated in Air Bersih programs b -0.128*** 7,937
se 0.045
Height measurement
The height of the child was measured at the last visit to the posyandu, subdistrict level
b -0.091** 9,394
se 0.043
The height of the child was measured at the last visit to the posyandu, individual level
b 0.008 8,222
se 0.012
Attending PAUD
Percent days met over the month, subdistrict level b -0.003*** 3,219
se 0.001
Percent days met over the month, individual level b -0.006 273
se 0.007
Mother's knowledge of how food intake should change under diarrhea
When a baby has diarrhea, they should be given no food b -0.034 9,070
se 0.056
When a baby has diarrhea, they should be given more food than normal
b 0.022 9,070
se 0.014
When a baby has diarrhea, they should be given less food than normal
b 0.015 9,070
se 0.011
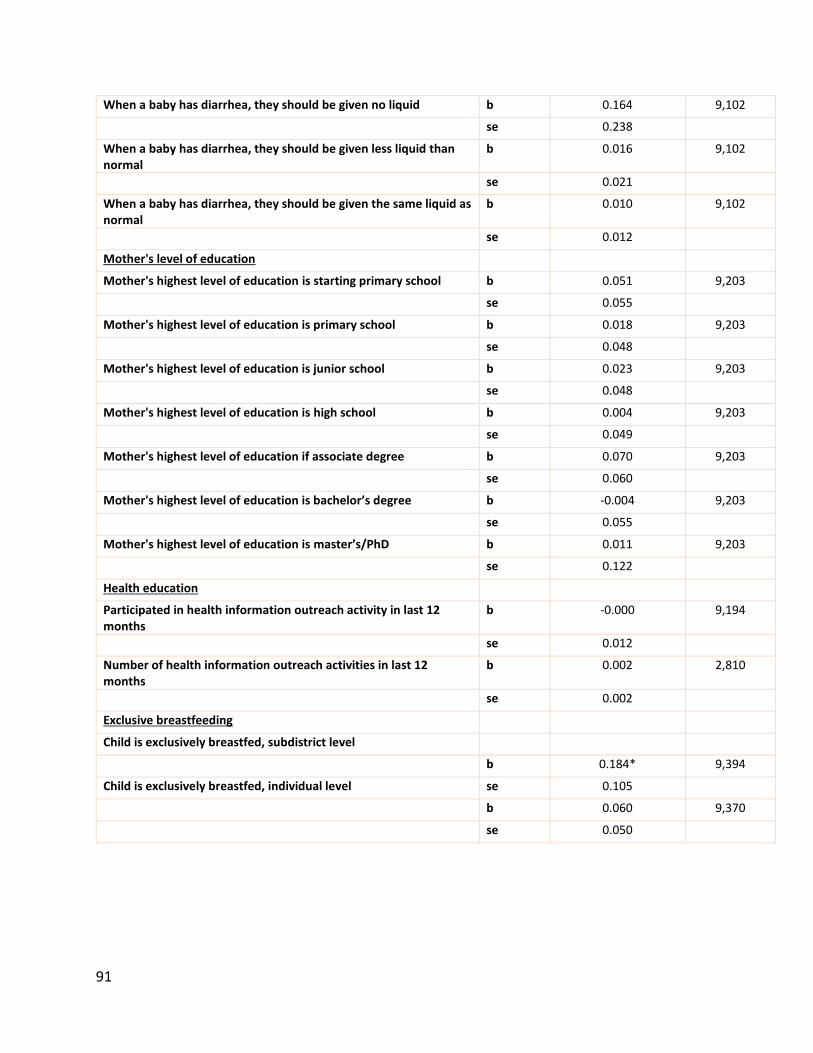
91
When a baby has diarrhea, they should be given no liquid b 0.164 9,102
se 0.238
When a baby has diarrhea, they should be given less liquid than normal
b 0.016 9,102
se 0.021
When a baby has diarrhea, they should be given the same liquid as normal
b 0.010 9,102
se 0.012
Mother's level of education
Mother's highest level of education is starting primary school b 0.051 9,203
se 0.055
Mother's highest level of education is primary school b 0.018 9,203
se 0.048
Mother's highest level of education is junior school b 0.023 9,203
se 0.048
Mother's highest level of education is high school b 0.004 9,203
se 0.049
Mother's highest level of education if associate degree b 0.070 9,203
se 0.060
Mother's highest level of education is bachelor’s degree b -0.004 9,203
se 0.055
Mother's highest level of education is master’s/PhD b 0.011 9,203
se 0.122
Health education
Participated in health information outreach activity in last 12 months
b -0.000 9,194
se 0.012
Number of health information outreach activities in last 12 months
b 0.002 2,810
se 0.002
Exclusive breastfeeding
Child is exclusively breastfed, subdistrict level
b 0.184* 9,394
Child is exclusively breastfed, individual level se 0.105
b 0.060 9,370
se 0.050

92
Annex: Supplementary Material
Annex: Table 1. Do attrition rates vary between treatment and control areas? (1) (2)
Book 1A Book 1E
VARIABLES Found Found
Treatment 0.00351 -0.000397 (0.00763) (0.00802)
Observations 6,045 2,186
Response Rate 0.937 0.944
Robust standard errors in parentheses
*** p<0.01, ** p<0.05, * p<0.1
Dependent variable is a dummy for a baseline household being found in follow-up wave. Same regression specification as for main regressions.
Annex: Table 2. Program impact on main targeted indicators, separated based on 2007-2009 incentive/non-incentive randomization Generasi
Effect Incentive
Effect Total
Generasi Incentive
Effect
Control Mean
N
Number of prenatal visits b 0.086 -0.156 -0.070 8.512 4285
se 0.194 0.184 0.173 4.209
pval 0.61 0.34 0.79
Delivery by trained midwife
b 0.008 -0.003 0.005 0.922 3279
se 0.011 0.014 0.014 0.268
pval 0.49 0.79 0.76
Number of postnatal visits b 0.040 -0.023 0.016 1.836 3279
se 0.108 0.113 0.111 2.289
pval 0.70 0.80 0.90
Iron tablet sachets b 0.036 -0.103 -0.066 2.178 4256
se 0.065 0.066 0.066 1.423
pval 0.55 0.09 0.42
Percent of immunization b 0.005 -0.008 -0.002 0.825 3052
se 0.015 0.015 0.014 0.255
pval 0.66 0.54 0.91
Number of weight checks b 0.146 -0.036 0.109 2.270 3879

93
se 0.049 0.051 0.054 1.104
pval 0.00 0.44 0.10
Number Vitamin A supplements
b 0.066 -0.013 0.053 1.402 2260
se 0.045 0.048 0.043 0.967
pval 0.10 0.78 0.35
Percent underweight b -0.007 0.022 0.015 0.174 7906
se 0.012 0.011 0.012 0.379
pval 0.51 0.04 0.33
Annex: Table 3. Program impact on longer-term outcomes, separated based on 2007-2009 incentive/non-incentive randomization Generasi
Effect Incentive
Effect Total
Generasi Incentive
Effect
Control Mean
N
Underweight b -0.010 0.025 0.015 0.174 8040
se 0.012 0.011 0.012 0.379
pval 0.31 0.01 0.30
Severely underweight b -0.002 0.001 -0.001 0.044 8040
se 0.006 0.005 0.006 0.205
pval 0.81 0.81 0.97
Wasting b 0.014 0.005 0.019 0.156 7895
se 0.012 0.011 0.012 0.363
pval 0.21 0.64 0.24
Severe wasting b 0.004 -0.002 0.003 0.042 7895
se 0.006 0.006 0.006 0.202
pval 0.45 0.73 0.79
Stunting b -0.006 0.011 0.004 0.226 7899
se 0.016 0.017 0.015 0.418
pval 0.57 0.38 0.79
Severe stunting b 0.001 0.003 0.005 0.087 7899
se 0.010 0.011 0.010 0.282
pval 0.91 0.75 0.73
Annex: Table 4. Program impact on main targeted indicators limited to repeated cross-section households Generasi
Effect Control Mean
N
Number of prenatal visits b 0.070 8.564 3291
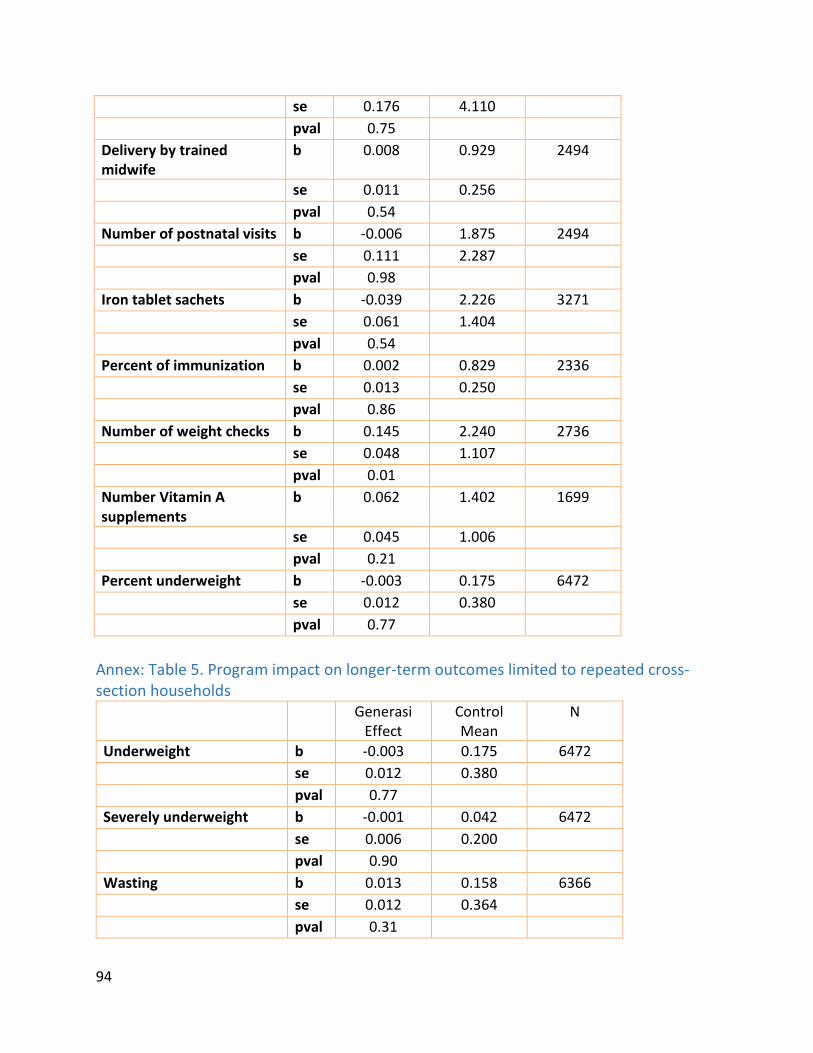
94
se 0.176 4.110
pval 0.75
Delivery by trained midwife
b 0.008 0.929 2494
se 0.011 0.256
pval 0.54
Number of postnatal visits b -0.006 1.875 2494
se 0.111 2.287
pval 0.98
Iron tablet sachets b -0.039 2.226 3271
se 0.061 1.404
pval 0.54
Percent of immunization b 0.002 0.829 2336
se 0.013 0.250
pval 0.86
Number of weight checks b 0.145 2.240 2736
se 0.048 1.107
pval 0.01
Number Vitamin A supplements
b 0.062 1.402 1699
se 0.045 1.006
pval 0.21
Percent underweight b -0.003 0.175 6472
se 0.012 0.380
pval 0.77
Annex: Table 5. Program impact on longer-term outcomes limited to repeated cross-section households
Generasi Effect
Control Mean
N
Underweight b -0.003 0.175 6472 se 0.012 0.380
pval 0.77
Severely underweight b -0.001 0.042 6472 se 0.006 0.200
pval 0.90
Wasting b 0.013 0.158 6366 se 0.012 0.364
pval 0.31

95
Severe wasting b 0.005 0.042 6366 se 0.006 0.200
pval 0.45
Stunting b -0.001 0.216 6357 se 0.014 0.411
pval 0.94
Severe stunting b 0.001 0.084 6357 se 0.009 0.278
pval 0.94
Annex: Figure 1. Visualization of program impact on main targeted indicators showing trends over time and treatment effects
7.607.487.52
8.54
7
8
9
2007 2010 2013 2016
Prenatal Visits
Control Treatment
0.69
0.750.76
0.93
0.6
0.7
0.8
0.9
1.0
2007 2010 2013 2016
Delivery
Control Treatment

96
1.721.74
1.63
1.84
1.2
1.4
1.6
1.8
2.0
2.2
2007 2010 2013 2016
Postnatal visits
Control Treatment
1.59
1.97
1.71
2.18
1.50
1.75
2.00
2.25
2.50
2007 2010 2013 2016
Iron Pills
Control Treatment
0.65
0.69
0.76
0.82
0.6
0.7
0.8
0.9
2007 2010 2013 2016
Immunization
Control Treatment
2.142.182.18
2.27
2.0
2.1
2.2
2.3
2.4
2.5
2007 2010 2013 2016
Times Weighed
Control Treatment
1.531.56
1.45
1.40
1.3
1.4
1.5
1.6
1.7
2007 2010 2013 2016
Vitamin A
Control Treatment
0.17
0.20
0.23
0.18
0.15
0.20
0.25
2007 2010 2013 2016
Underweight
Control Treatment

97
Annex: Figure 2. Visualization of program impact on longer-term outcomes showing trends over time and treatment effects
0.95
0.980.980.98
0.90
0.92
0.94
0.96
0.98
1.00
2007 2010 2013 2016
7-12 Participation Rate
Control Treatment
0.620.66
0.680.72
0.5
0.6
0.7
0.8
0.9
1.0
2007 2010 2013 2016
13-15 Participation Rate in SMP
Control Treatment
0.17
0.20
0.23
0.18
0.15
0.20
0.25
2007 2010 2013 2016
Underweight
Control Treatment
0.050.06
0.07
0.18
0.00
0.05
0.10
0.15
0.20
0.25
2007 2010 2013 2016
Severely Underweight
Control Treatment

98
0.380.36
0.23
0.0
0.1
0.2
0.3
0.4
0.5
2007 2010 2013 2016
Stunting
Control Treatment
0.21 0.21 0.23
0.0
0.1
0.2
0.3
0.4
0.5
2007 2010 2013 2016
Severe Stunting
Control Treatment
0.12
0.200.23
0.0
0.1
0.2
0.3
2007 2010 2013 2016
Wasting
Control Treatment
0.05
0.09
0.23
0.0
0.1
0.2
0.3
2007 2010 2013 2016
Severe Wasting
Control Treatment