Embed Size (px)
Citation preview
IOWA
RATE FILING
Voluntary Market and
Residual Market
Proposed Effective 1/1/2013
11430 Gravois Road, Suite 310, St. Louis, MO 63126 Telephone: (314) 843-4001 Fax: (561) 893-5550 E-mail: [email protected]
Roy Wood State Relations Executive Regulatory Services Division August 9, 2012 Honorable Susan Voss Commissioner of Insurance Iowa Department of Commerce-Insurance Division 330 East Maple Street Des Moines, Iowa 50319 RE: Workers Compensation Rates and Rating Values—Iowa Voluntary Market and
Assigned Risk Market - Effective January 1, 2013. Dear Commissioner Voss: In accordance with the applicable statutes and regulations of the state of Iowa, we are filing for your consideration and approval advisory prospective rates and rating values for the Iowa voluntary and residual markets to be effective January 1, 2013 for new and renewal policies. This filing proposes an overall average increase of 7.9% in voluntary rates and an overall average increase of 7.9% in assigned risk rates. The advisory prospective rates for the voluntary market are used as a basis for rates in the assigned risk market. The following are of special note as a result of item filings approved in Iowa:
1. As a result of Item B-1397, effective January 1, 2008, the experience for Class Codes 7704, 7710, and 7711 is combined to determine a single rate for Class Codes 7710 and 7711.
2. As a result of Item B‐1413, effective January 1, 2011, Class Codes 7600, 7601,
7611, 7612, and 7613 are combined to reflect the final phase of a three‐phase transition program. Class Codes 7601, 7611, 7612, and 7613 are discontinued.
3. As a result of Item B‐1415, effective January 1, 2011, Class Codes 5645 and 5651 are combined to reflect the final phase of a three‐phase transition program. Class Code 5651 is discontinued.
4. As a result of Item E-1402, effective January 1, 2013, the split point for experience rating in this filing was changed from 5,000 to 10,000.
11430 Gravois Road, Suite 310, St. Louis, MO 63126 Telephone: (314) 843-4001 Fax: (314) 842-3188 E-mail: [email protected]
5. As a result of Item R-1405, effective January 1, 2013, the retrospective rating plan parameters were updated.
This filing is made exclusively on behalf of the companies that have given valid consideration for the express purpose of fulfilling regulatory rate or premium filing requirements and other private use of this information. In the enclosed appendix is a list of companies, sorted by group, which as of the time this filing is submitted, are eligible to reference this information. The inclusion of a company on this list merely indicates that the company, or the group to which it belongs, is affiliated with NCCI in this state, or has licensed this information as a non-affiliate, and is not intended to indicate whether the company is currently writing business or is even licensed to write business in this state. Please contact me at (314) 843-4001 or Tony DiDonato at (561) 893-3116 if you have any questions or need any further information. Respectfully submitted, NATIONAL COUNCIL ON COMPENSATION INSURANCE, INC. Filing Prepared by:
Roy O. Wood Tony DiDonato State Relations Executive Director and Senior Actuary Regulatory Service Division Actuarial and Economic Services
© Copyright 2012 National Council on Compensation Insurance, Inc. All Rights Reserved.
Actuarial Certification The information contained in this filing has been prepared under the direction of the undersigned actuary in accordance with applicable Actuarial Standards of Practice as promulgated by the Actuarial Standards Board. The Actuarial Standards Board is vested by the U.S.-based actuarial organizations with the responsibility for promulgating Actuarial Standards of Practice for actuaries providing professional services in the United States. Each of these organizations requires its members, through its Code of Professional Conduct, to observe the Actuarial Standards of Practice when practicing in the United States. Filing Prepared by:
Tony DiDonato, FCAS, MAAA Director and Senior Actuary Actuarial and Economic Services
© Copyright 2012 National Council on Compensation Insurance, Inc. All Rights Reserved These materials are comprised of NCCI actuarial judgment and proprietary and confidential information which are valuable assets of NCCI and are protected by copyright and other intellectual property laws. The uses of these materials are governed by a separate contractual agreement between NCCI and its licensees such as an affiliation agreement between NCCI and an end user. Unless expressly authorized by NCCI, you may not copy, create derivative works (by way of example, create or supplement your own works or other materials), display, perform, or use the materials, in whole or in part, in any media. Such actions taken by you, or by your direction, may be in violation of federal copyright and other commercial laws. NCCI does not permit or agree to such use of its materials. In the event such use is contemplated or desired, please contact NCCI's Legal Department for permission. NCCI MAKES NO REPRESENTATIONS OR WARRANTIES RELATING TO THESE MATERIALS, INCLUDING ANY EXPRESS, STATUTORY OR IMPLIED WARRANTIES INCLUDING THE IMPLIED WARRANTY OF MERCHANTABILITY AND FITNESS FOR A PARTICULAR PURPOSE. ADDITIONALLY, AUTHORIZED END USERS ASSUME RESPONSIBILITY FOR THE USE OF, AND FOR ANY AND ALL RESULTS DERIVED OR OBTAINED THROUGH THE USE OF SUCH MATERIALS.
0
IOWA
WORKERS COMPENSATION FILING – January 1, 2013
© Copyright 2012 National Council on Compensation Insurance, Inc. All Rights Reserved.
Table of Contents
Background and Filing Procedure ......................................................................... 1
Proposed Changes in Voluntary Advisory and Assigned Risk Rate Levels .......... 2
Key Components
Experience ................................................................................................................... 3
Trend ........................................................................................................................... 4
Benefits ...................................................................................................................... 12
Expenses ................................................................................................................... 13
Assigned Risk Market ......................................................................................... 15
Conclusion .......................................................................................................... 17
Exhibits
Exhibit I - Iowa Historical Voluntary Advisory and Assigned Risk Rate Changes ........ 18
Exhibit II - Iowa Written Premium ............................................................................... 19
Exhibit III - Iowa Largest Workers Compensation Writers ........................................... 20
Exhibit IV - Proposed Voluntary Market Advisory Rates and Rating Values ............... 21
Exhibit V - Proposed Assigned Risk Rates and Rating Values ................................... 35
NCCI Key Contacts ............................................................................................. 41
Appendix—Affiliate List ...................................................................................... 42
1
IOWA
WORKERS COMPENSATION FILING – January 1, 2013
© Copyright 2012 National Council on Compensation Insurance, Inc. All Rights Reserved.
Background and Filing Procedure The workers compensation benefit system is designed to cover medical costs associated with workplace injuries, as well as provide wage replacement (indemnity) benefits to injured workers for lost work time. The National Council on Compensation Insurance, Inc. (NCCI) collects an extensive amount of information regarding the workers compensation system in Iowa, and submits proposed voluntary market advisory prospective rates and assigned risk rates for review and approval by the Iowa Commissioner of Insurance. These advisory prospective rates are intended to cover the indemnity and medical benefits provided under the system, as well as the expenses associated with providing these benefits (loss adjustment expenses). They also contemplate other costs associated with providing workers compensation insurance (such as commissions, taxes, etc.). In this filing, NCCI is proposing that the Commissioner of Insurance approve an overall average increase of 7.9% to the current voluntary advisory rates and an overall average increase of 7.9% to the current assigned risk rate level (both in effect since January 1, 2012), and that the new values will become effective on January 1, 2013. This document will explain why these changes are indicated. NCCI separately determines voluntary advisory rates and assigned risk rates for each workers compensation classification. In this filing, the actual change from the current rate is different depending on the classification.
Page 1 of 49
2
IOWA
WORKERS COMPENSATION FILING – January 1, 2013
© Copyright 2012 National Council on Compensation Insurance, Inc. All Rights Reserved.
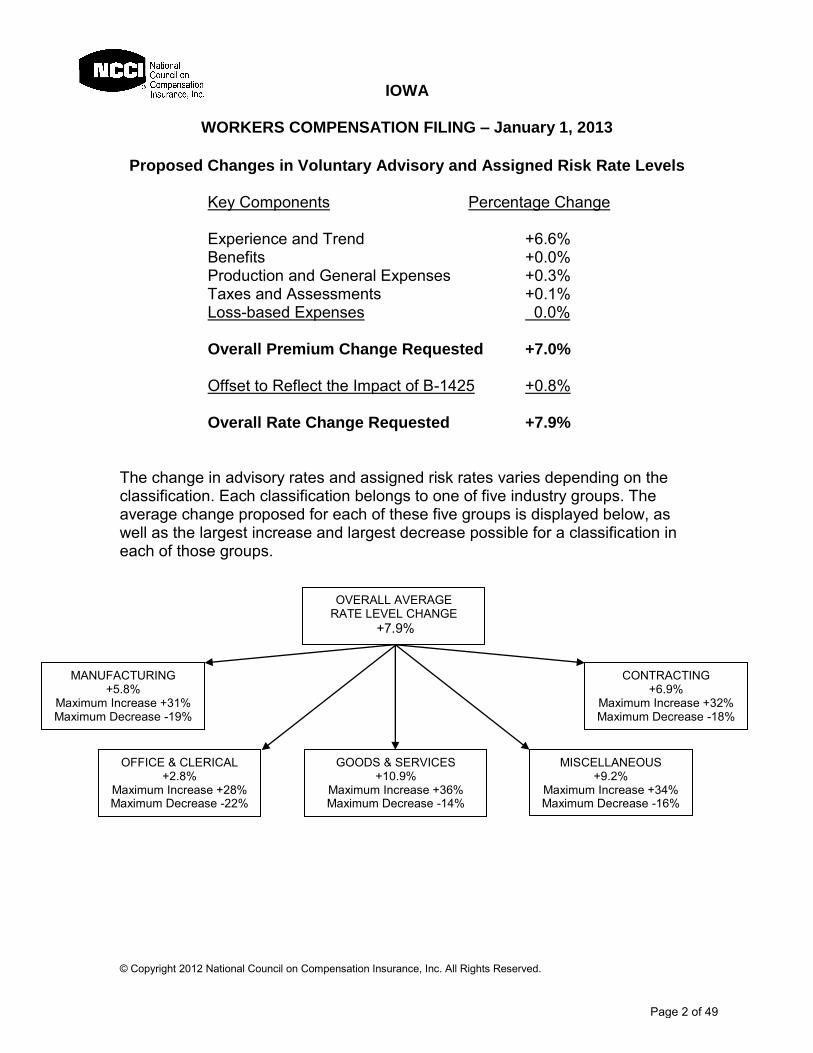
Proposed Changes in Voluntary Advisory and Assigned Risk Rate Levels
Key Components Percentage Change
Experience and Trend +6.6% Benefits +0.0%
Production and General Expenses +0.3% Taxes and Assessments +0.1%
Loss-based Expenses 0.0%
Overall Premium Change Requested +7.0% Offset to Reflect the Impact of B-1425 +0.8%
Overall Rate Change Requested +7.9% The change in advisory rates and assigned risk rates varies depending on the classification. Each classification belongs to one of five industry groups. The average change proposed for each of these five groups is displayed below, as well as the largest increase and largest decrease possible for a classification in each of those groups.
OVERALL AVERAGE RATE LEVEL CHANGE
+7.9%
GOODS & SERVICES +10.9%
Maximum Increase +36% Maximum Decrease -14%
MANUFACTURING +5.8%
Maximum Increase +31% Maximum Decrease -19%
CONTRACTING +6.9%
Maximum Increase +32% Maximum Decrease -18%
MISCELLANEOUS +9.2%
Maximum Increase +34% Maximum Decrease -16%
OFFICE & CLERICAL +2.8%
Maximum Increase +28% Maximum Decrease -22%
Page 2 of 49
3
IOWA
WORKERS COMPENSATION FILING – January 1, 2013
© Copyright 2012 National Council on Compensation Insurance, Inc. All Rights Reserved.
Key Components There are four key components in this filing: experience, trend, benefits, and expenses. They will each be separately discussed. Experience NCCI analyzed the emerging experience of Iowa workers compensation policies in recent years. The primary focus of our analysis was on premiums and losses from policy years 2009 and 2010, evaluated as of December 31, 2011 (a policy year captures the premiums and losses from the block of policies that had effective dates during a given year). The most recently available full policy year is 2010 since the last policy had an effective date of December 31, 2010 and did not expire until December 31, 2011. During this year’s analysis, after reviewing various possible experience periods, the use of the two most recently available full policy years of data was selected as most appropriate in terms of providing balance between stability and responsiveness. Also, the use of the two most recently-available policy years is consistent with filings made in the past several years by NCCI in Iowa. It should be noted that NCCI adjusts (via premium and loss on-level factors) the historical policy year experience to reflect approved rate level changes as well as statutory benefit level changes implemented since that time period. NCCI's standard methodology is to utilize statewide (combined voluntary and assigned risk) market data after it has been adjusted to the current voluntary rate level in the calculation of the overall average rate level change. Different aggregations of limited loss experience were analyzed in preparation of this filing. These were (i) paid losses (benefit amounts already paid by insurers on reported claims) and (ii) the sum of paid losses plus case reserves (paid losses and the amounts set aside to cover future payments on those claims). For use in this filing, NCCI utilized loss development factors based on paid losses. Past filings in Iowa have used either paid losses exclusively or an average of paid and paid plus case experience. Loss development factors are needed since paid losses and case reserve estimates on a given claim change over time until the claim is finally closed. The loss development factors are based on how paid losses and case reserve estimates changed over time for claims from older years. In this filing, NCCI is relying on an average change in estimate over the last three years. This estimate balances stability and responsiveness in the development patterns.
Page 3 of 49
4
IOWA
WORKERS COMPENSATION FILING – January 1, 2013
© Copyright 2012 National Council on Compensation Insurance, Inc. All Rights Reserved.
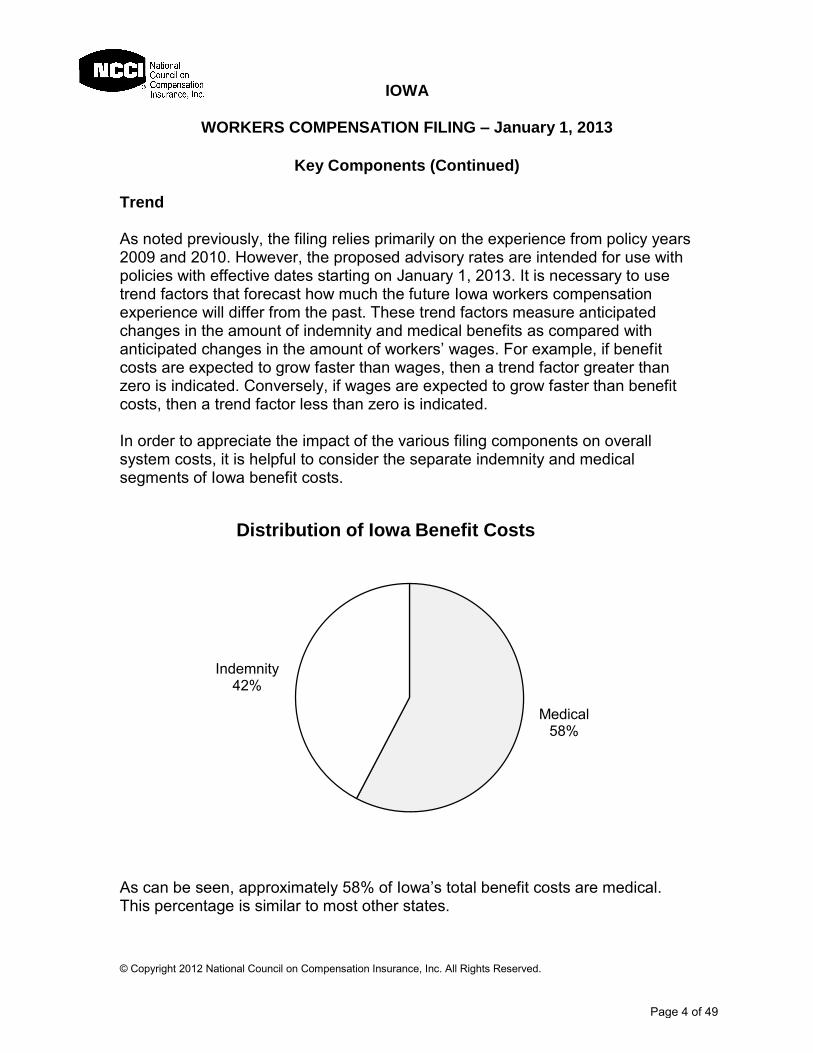
Key Components (Continued) Trend As noted previously, the filing relies primarily on the experience from policy years 2009 and 2010. However, the proposed advisory rates are intended for use with policies with effective dates starting on January 1, 2013. It is necessary to use trend factors that forecast how much the future Iowa workers compensation experience will differ from the past. These trend factors measure anticipated changes in the amount of indemnity and medical benefits as compared with anticipated changes in the amount of workers’ wages. For example, if benefit costs are expected to grow faster than wages, then a trend factor greater than zero is indicated. Conversely, if wages are expected to grow faster than benefit costs, then a trend factor less than zero is indicated. In order to appreciate the impact of the various filing components on overall system costs, it is helpful to consider the separate indemnity and medical segments of Iowa benefit costs.
As can be seen, approximately 58% of Iowa’s total benefit costs are medical. This percentage is similar to most other states.
Medical 58%
Indemnity 42%
Distribution of Iowa Benefit Costs
Page 4 of 49
5
IOWA
WORKERS COMPENSATION FILING – January 1, 2013
© Copyright 2012 National Council on Compensation Insurance, Inc. All Rights Reserved.
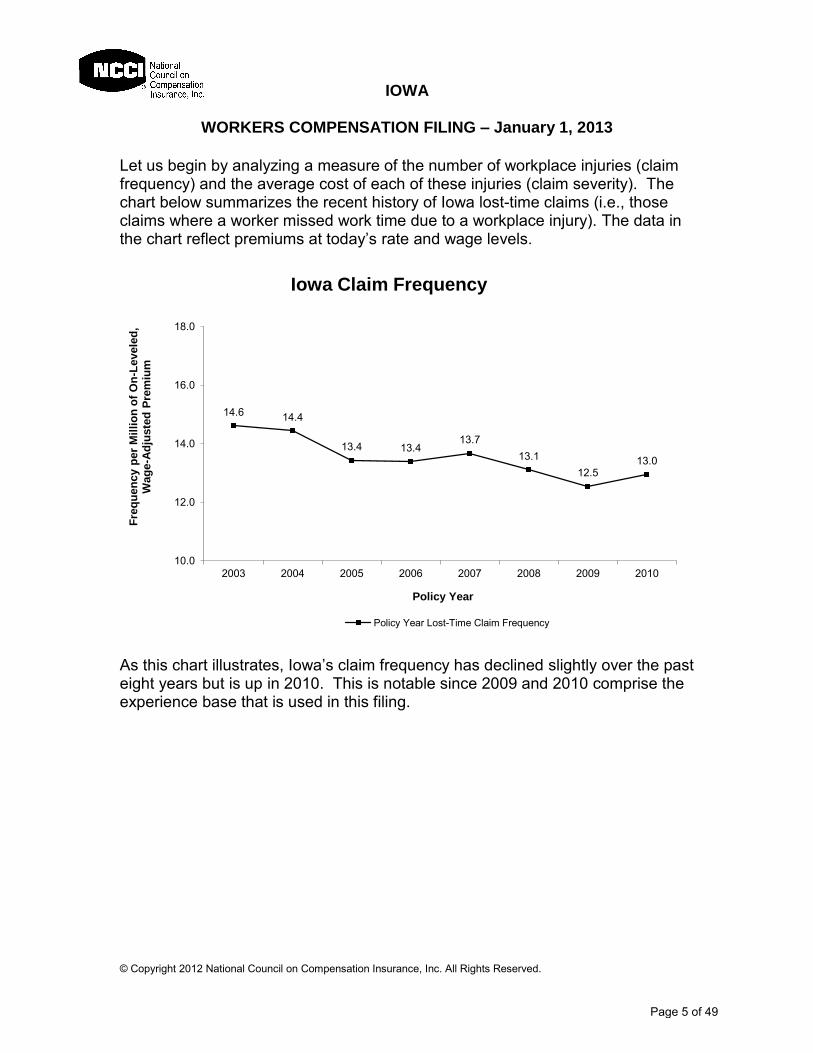
Let us begin by analyzing a measure of the number of workplace injuries (claim frequency) and the average cost of each of these injuries (claim severity). The chart below summarizes the recent history of Iowa lost-time claims (i.e., those claims where a worker missed work time due to a workplace injury). The data in the chart reflect premiums at today’s rate and wage levels.
As this chart illustrates, Iowa’s claim frequency has declined slightly over the past eight years but is up in 2010. This is notable since 2009 and 2010 comprise the experience base that is used in this filing.
14.6 14.4
13.4 13.4 13.7
13.1
12.5 13.0
10.0
12.0
14.0
16.0
18.0
2003 2004 2005 2006 2007 2008 2009 2010
Fre
qu
en
cy p
er
Mil
lio
n o
f O
n-L
evele
d,
W
ag
e-A
dju
ste
d P
rem
ium
Policy Year
Iowa Claim Frequency
Policy Year Lost-Time Claim Frequency
Page 5 of 49
6
IOWA
WORKERS COMPENSATION FILING – January 1, 2013
© Copyright 2012 National Council on Compensation Insurance, Inc. All Rights Reserved.
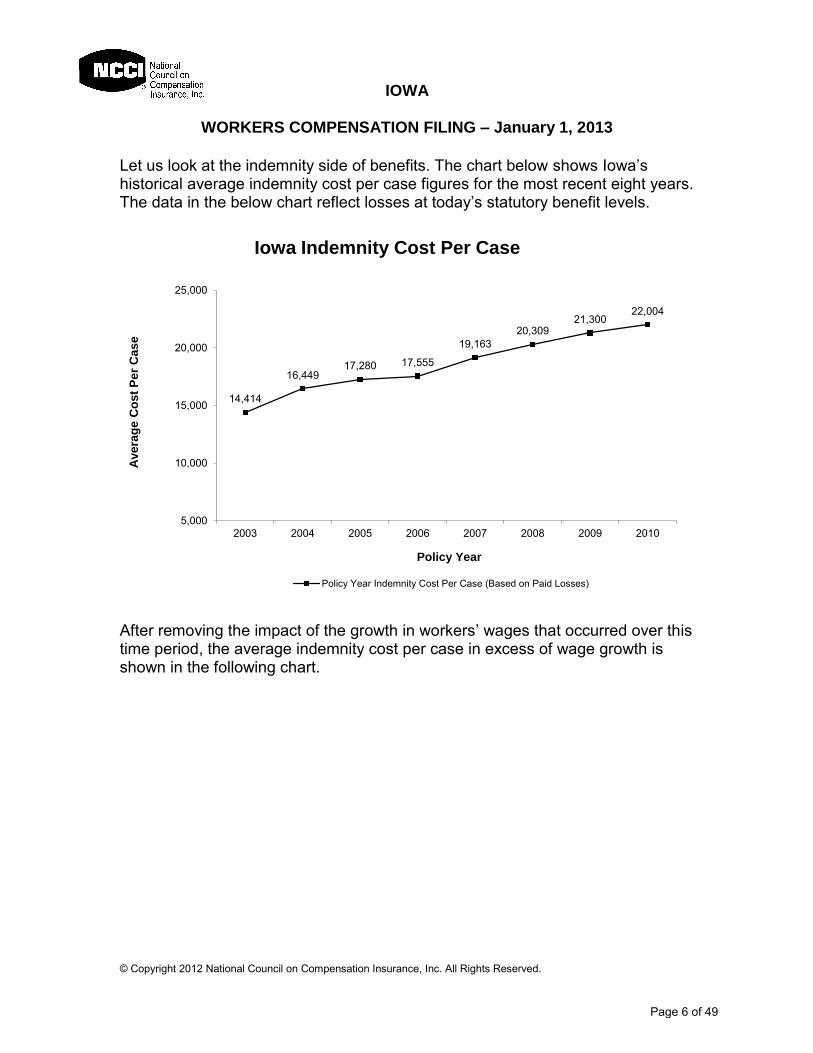
Let us look at the indemnity side of benefits. The chart below shows Iowa’s historical average indemnity cost per case figures for the most recent eight years. The data in the below chart reflect losses at today’s statutory benefit levels.
After removing the impact of the growth in workers’ wages that occurred over this time period, the average indemnity cost per case in excess of wage growth is shown in the following chart.
14,414
16,449 17,280 17,555
19,163
20,309 21,300
22,004
5,000
10,000
15,000
20,000
25,000
2003 2004 2005 2006 2007 2008 2009 2010
Ave
rag
e C
os
t P
er
Ca
se
Policy Year
Iowa Indemnity Cost Per Case
Policy Year Indemnity Cost Per Case (Based on Paid Losses)
Page 6 of 49
7
IOWA
WORKERS COMPENSATION FILING – January 1, 2013
© Copyright 2012 National Council on Compensation Insurance, Inc. All Rights Reserved.
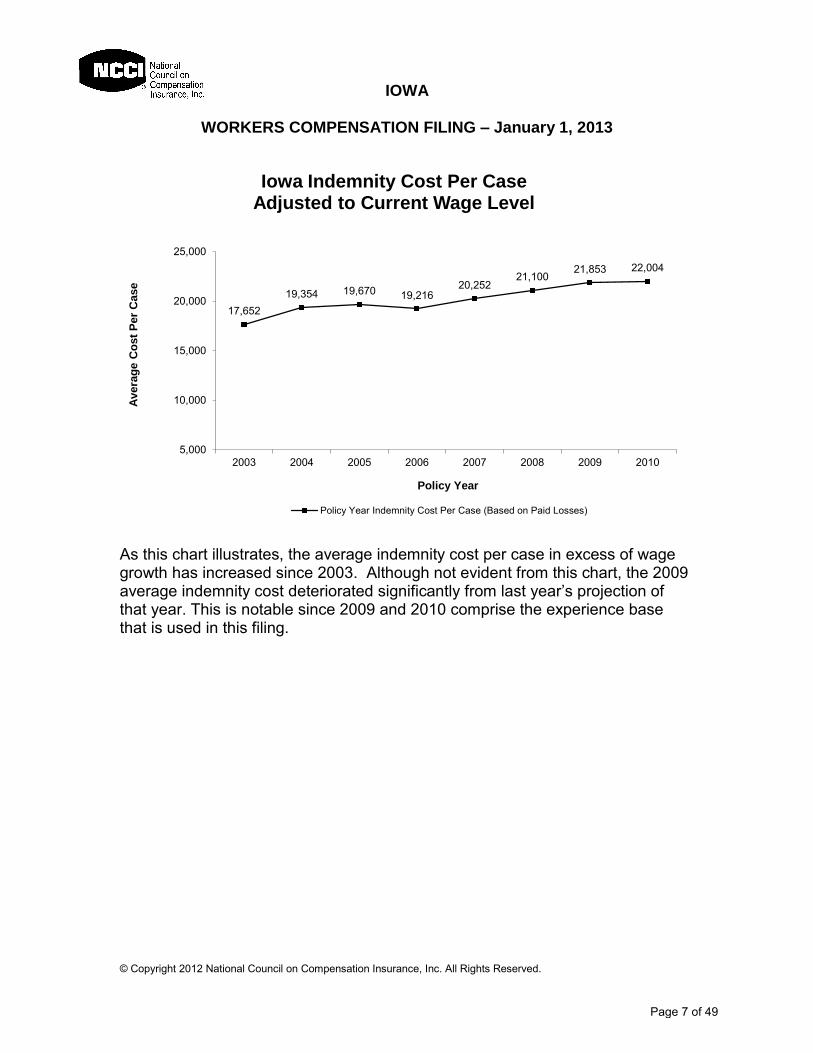
As this chart illustrates, the average indemnity cost per case in excess of wage growth has increased since 2003. Although not evident from this chart, the 2009 average indemnity cost deteriorated significantly from last year’s projection of that year. This is notable since 2009 and 2010 comprise the experience base that is used in this filing.
17,652
19,354 19,670 19,216 20,252
21,100 21,853 22,004
5,000
10,000
15,000
20,000
25,000
2003 2004 2005 2006 2007 2008 2009 2010
Avera
ge C
ost
Per
Case
Policy Year
Iowa Indemnity Cost Per Case Adjusted to Current Wage Level
Policy Year Indemnity Cost Per Case (Based on Paid Losses)
Page 7 of 49
8
IOWA
WORKERS COMPENSATION FILING – January 1, 2013
© Copyright 2012 National Council on Compensation Insurance, Inc. All Rights Reserved.
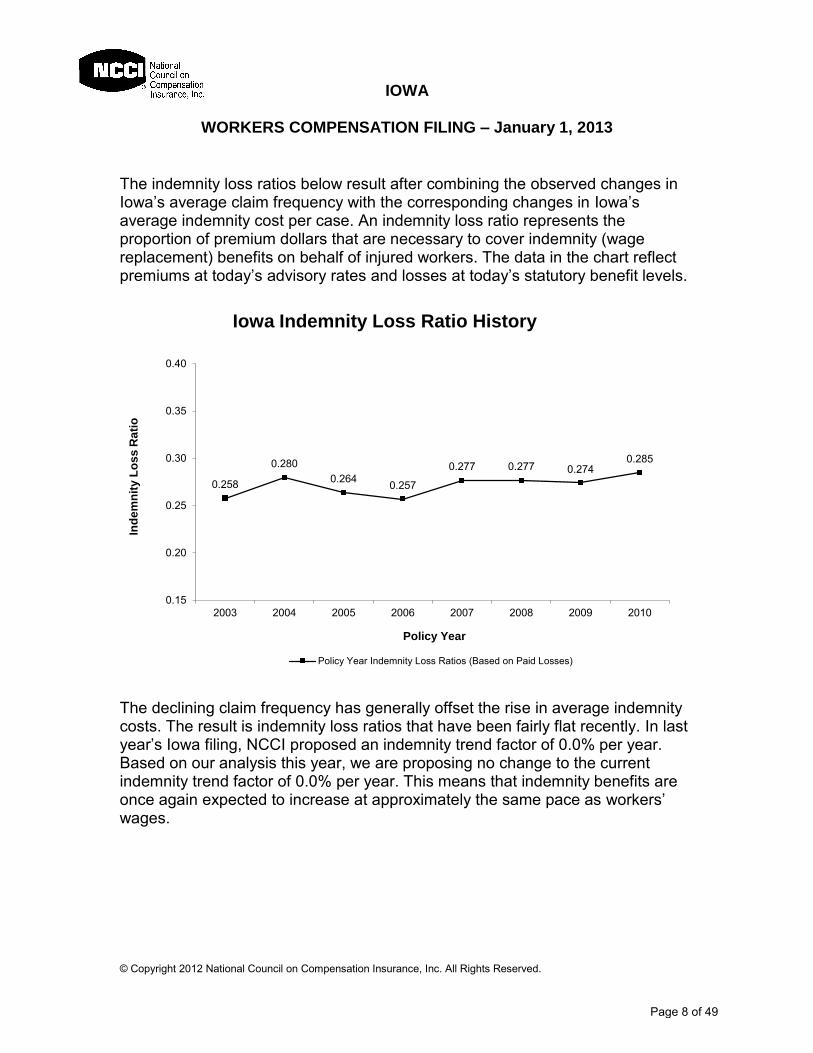
The indemnity loss ratios below result after combining the observed changes in Iowa’s average claim frequency with the corresponding changes in Iowa’s average indemnity cost per case. An indemnity loss ratio represents the proportion of premium dollars that are necessary to cover indemnity (wage replacement) benefits on behalf of injured workers. The data in the chart reflect premiums at today’s advisory rates and losses at today’s statutory benefit levels.
The declining claim frequency has generally offset the rise in average indemnity costs. The result is indemnity loss ratios that have been fairly flat recently. In last year’s Iowa filing, NCCI proposed an indemnity trend factor of 0.0% per year. Based on our analysis this year, we are proposing no change to the current indemnity trend factor of 0.0% per year. This means that indemnity benefits are once again expected to increase at approximately the same pace as workers’ wages.
0.258
0.280
0.264 0.257
0.277 0.277 0.274 0.285
0.15
0.20
0.25
0.30
0.35
0.40
2003 2004 2005 2006 2007 2008 2009 2010
Ind
em
nit
y L
os
s R
ati
o
Policy Year
Iowa Indemnity Loss Ratio History
Policy Year Indemnity Loss Ratios (Based on Paid Losses)
Page 8 of 49
9
IOWA
WORKERS COMPENSATION FILING – January 1, 2013
© Copyright 2012 National Council on Compensation Insurance, Inc. All Rights Reserved.
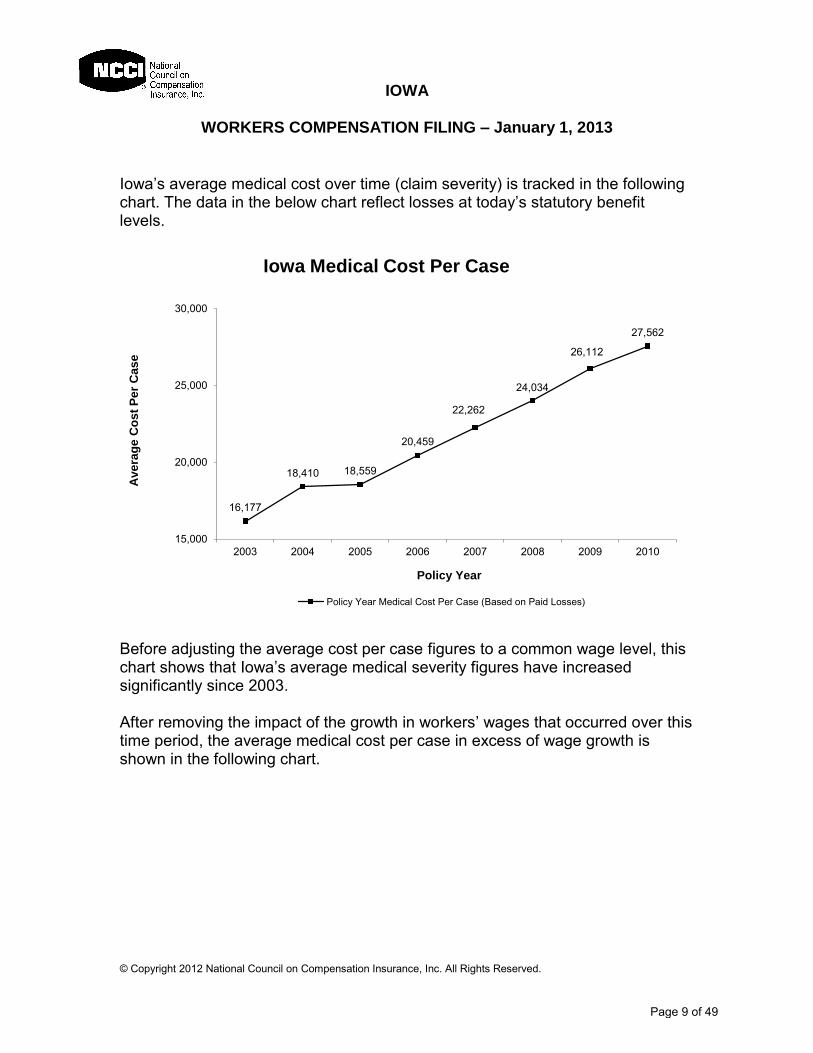
Iowa’s average medical cost over time (claim severity) is tracked in the following chart. The data in the below chart reflect losses at today’s statutory benefit levels.
Before adjusting the average cost per case figures to a common wage level, this chart shows that Iowa’s average medical severity figures have increased significantly since 2003. After removing the impact of the growth in workers’ wages that occurred over this time period, the average medical cost per case in excess of wage growth is shown in the following chart.
16,177
18,410 18,559
20,459
22,262
24,034
26,112
27,562
15,000
20,000
25,000
30,000
2003 2004 2005 2006 2007 2008 2009 2010
Ave
rag
e C
os
t P
er
Ca
se
Policy Year
Iowa Medical Cost Per Case
Policy Year Medical Cost Per Case (Based on Paid Losses)
Page 9 of 49
10
IOWA
WORKERS COMPENSATION FILING – January 1, 2013
© Copyright 2012 National Council on Compensation Insurance, Inc. All Rights Reserved.
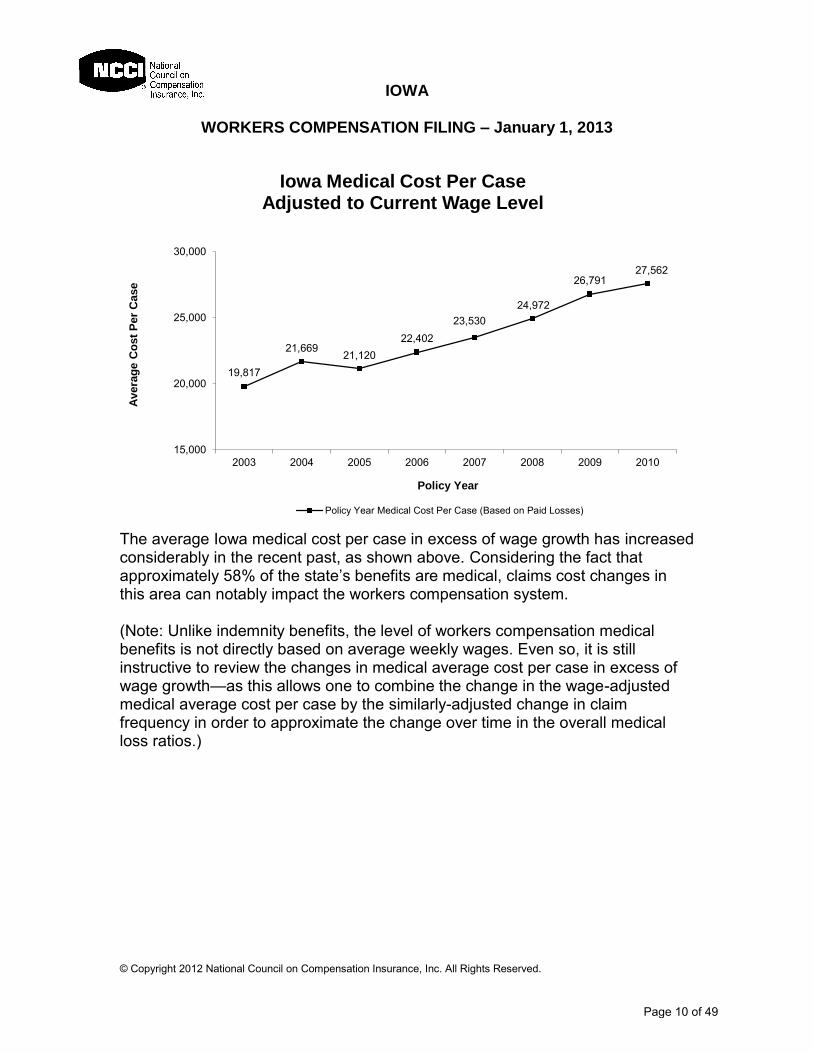
The average Iowa medical cost per case in excess of wage growth has increased considerably in the recent past, as shown above. Considering the fact that approximately 58% of the state’s benefits are medical, claims cost changes in this area can notably impact the workers compensation system. (Note: Unlike indemnity benefits, the level of workers compensation medical benefits is not directly based on average weekly wages. Even so, it is still instructive to review the changes in medical average cost per case in excess of wage growth—as this allows one to combine the change in the wage-adjusted medical average cost per case by the similarly-adjusted change in claim frequency in order to approximate the change over time in the overall medical loss ratios.)
19,817
21,669 21,120
22,402
23,530
24,972
26,791 27,562
15,000
20,000
25,000
30,000
2003 2004 2005 2006 2007 2008 2009 2010
Avera
ge C
ost
Per
Case
Policy Year
Iowa Medical Cost Per Case Adjusted to Current Wage Level
Policy Year Medical Cost Per Case (Based on Paid Losses)
Page 10 of 49
11
IOWA
WORKERS COMPENSATION FILING – January 1, 2013
© Copyright 2012 National Council on Compensation Insurance, Inc. All Rights Reserved.
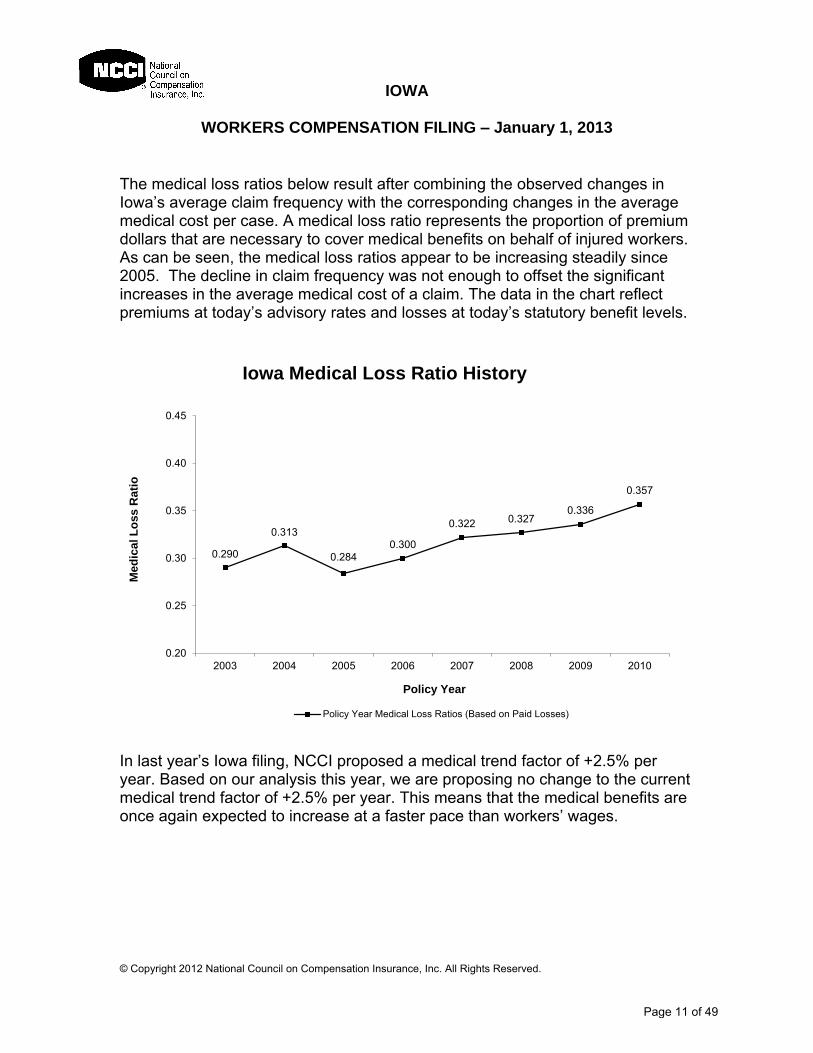
The medical loss ratios below result after combining the observed changes in Iowa’s average claim frequency with the corresponding changes in the average medical cost per case. A medical loss ratio represents the proportion of premium dollars that are necessary to cover medical benefits on behalf of injured workers. As can be seen, the medical loss ratios appear to be increasing steadily since 2005. The decline in claim frequency was not enough to offset the significant increases in the average medical cost of a claim. The data in the chart reflect premiums at today’s advisory rates and losses at today’s statutory benefit levels.
In last year’s Iowa filing, NCCI proposed a medical trend factor of +2.5% per year. Based on our analysis this year, we are proposing no change to the current medical trend factor of +2.5% per year. This means that the medical benefits are once again expected to increase at a faster pace than workers’ wages.
0.290
0.313
0.284
0.300
0.322 0.327 0.336
0.357
0.20
0.25
0.30
0.35
0.40
0.45
2003 2004 2005 2006 2007 2008 2009 2010
Med
ical L
oss R
ati
o
Policy Year
Iowa Medical Loss Ratio History
Policy Year Medical Loss Ratios (Based on Paid Losses)
Page 11 of 49
12
IOWA
WORKERS COMPENSATION FILING – January 1, 2013
© Copyright 2012 National Council on Compensation Insurance, Inc. All Rights Reserved.
Key Components (Continued) Benefits Workers injured in Iowa receive wage replacement (indemnity) benefits at a rate of 80% of their pre-injury weekly wage. These benefits are subject to a weekly minimum and maximum. Each July 1, the minimum and maximum weekly benefits are updated based on Iowa’s most recent state average weekly wage. The latest increase in Iowa’s state average weekly wage is estimated to increase overall system costs by an amount so small it rounds to 0.0%.
Page 12 of 49
13
IOWA
WORKERS COMPENSATION FILING – January 1, 2013
© Copyright 2012 National Council on Compensation Insurance, Inc. All Rights Reserved.
Key Components (Continued) Loss-Based Expenses The proposed advisory rates include a provision for loss adjustment expenses (LAE). LAE is included in the advisory rates by using a ratio of loss adjustment expense dollars to loss dollars (called the LAE provision). After examining LAE indications based on both Iowa-specific data and countrywide data, NCCI is proposing no change to the currently approved overall LAE provision of 16.0% of losses. Loss adjustment expenses in Iowa are relatively stable, and notably lower than the countrywide average. Production and General Expense The proposed rates include a provision for production and general expenses. The latest data from the Insurance Expense Exhibit (which is reported annually by insurers to state insurance departments) is used to derive the Iowa expense provision. The current provision in the rates for production expense is 17.1% of premium. This filing proposes an increase in this provision to 17.2%. The current provision in the rates for general expenses is 4.9% of premium. This filing proposes an increase in this provision to 5.0% of premium. The overall rate change due to the proposed production and general expense provisions is an increase of 0.3%. Premium Taxes and Assessments This filing proposes an increase to the current approved provisions for taxes and assessments. The current provision in the rates for taxes and assessments is 1.8% of premium; the proposed provision is 1.9% of premium. The overall rate increase due to this change is +0.1%.
Page 13 of 49
14
IOWA
WORKERS COMPENSATION FILING – January 1, 2013
© Copyright 2012 National Council on Compensation Insurance, Inc. All Rights Reserved.
Key Components (Continued) Underwriting Contingency Provision By law, Iowa’s rates must be determined such that Iowa’s workers compensation insurers can be expected to earn a return that is adequate, fair and not excessive. Analysis and determination of an underwriting contingencies provision is necessary to ensure this premise is maintained. Current rates contain an underwriting contingency provision of 2.5%. In this filing, NCCI is proposing no change to the currently approved provision.
Offset to Reflect the Impact of B-1425 Item B-1425 reduces the premium charges for Employer’s Liability increased limits. In order to implement those changes in a revenue neutral fashion, the rates must be increased to offset this premium reduction. The amount of this offset is +0.8% in Iowa.
Page 14 of 49
15
IOWA
WORKERS COMPENSATION FILING – January 1, 2013
© Copyright 2012 National Council on Compensation Insurance, Inc. All Rights Reserved.
Assigned Risk Market
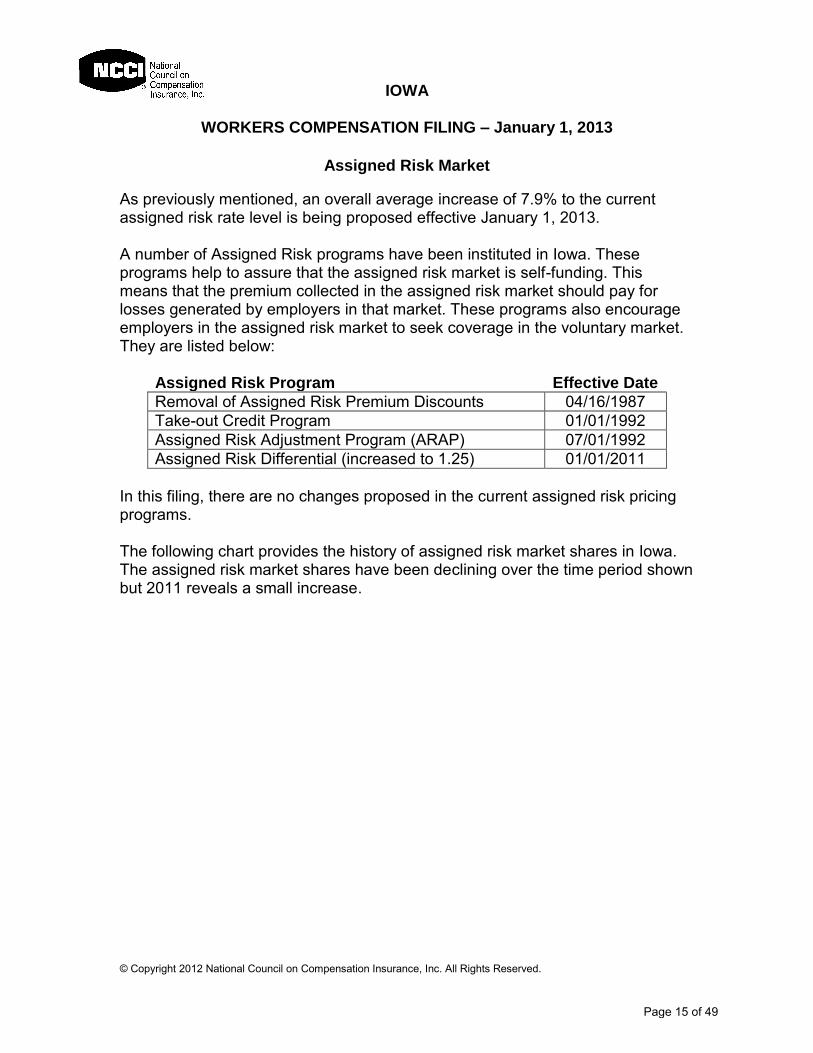
As previously mentioned, an overall average increase of 7.9% to the current assigned risk rate level is being proposed effective January 1, 2013. A number of Assigned Risk programs have been instituted in Iowa. These programs help to assure that the assigned risk market is self-funding. This means that the premium collected in the assigned risk market should pay for losses generated by employers in that market. These programs also encourage employers in the assigned risk market to seek coverage in the voluntary market. They are listed below:
Assigned Risk Program Effective Date
Removal of Assigned Risk Premium Discounts 04/16/1987
Take-out Credit Program 01/01/1992
Assigned Risk Adjustment Program (ARAP) 07/01/1992
Assigned Risk Differential (increased to 1.25) 01/01/2011
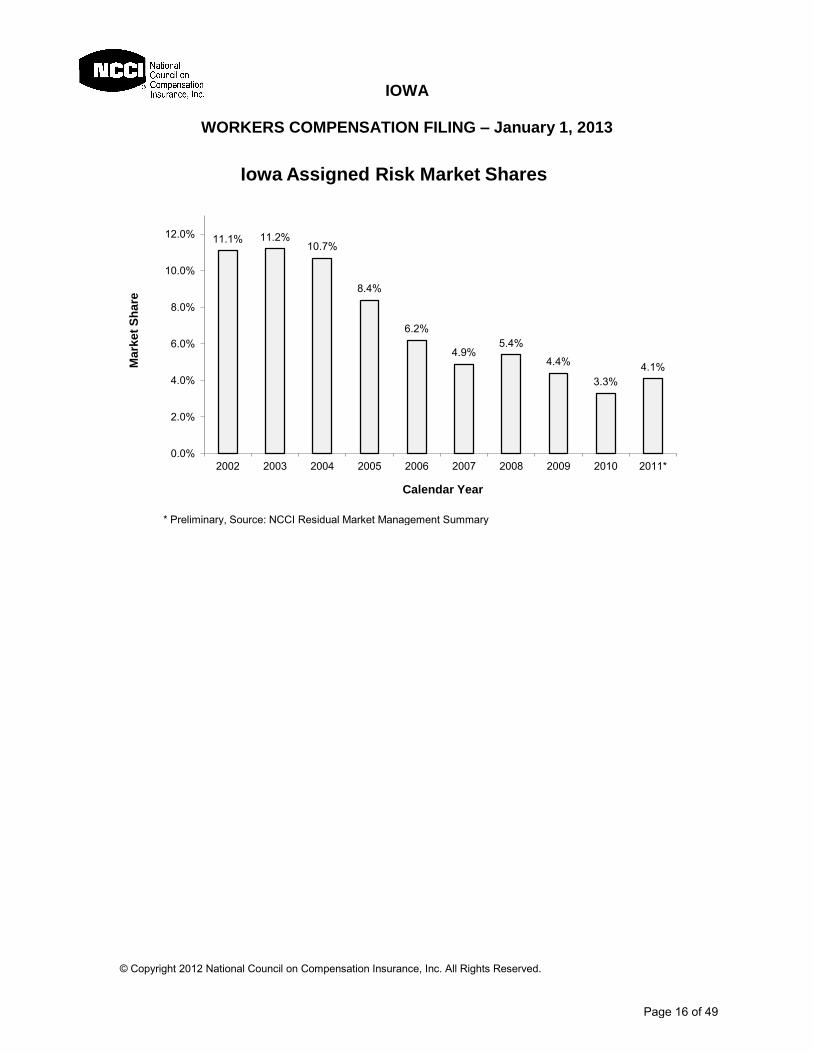
In this filing, there are no changes proposed in the current assigned risk pricing programs. The following chart provides the history of assigned risk market shares in Iowa. The assigned risk market shares have been declining over the time period shown but 2011 reveals a small increase.
Page 15 of 49
16
IOWA
WORKERS COMPENSATION FILING – January 1, 2013
© Copyright 2012 National Council on Compensation Insurance, Inc. All Rights Reserved.
11.1% 11.2% 10.7%
8.4%
6.2%
4.9% 5.4%
4.4%
3.3%
4.1%
0.0%
2.0%
4.0%
6.0%
8.0%
10.0%
12.0%
2002 2003 2004 2005 2006 2007 2008 2009 2010 2011*
Ma
rke
t S
ha
re
Calendar Year
Iowa Assigned Risk Market Shares
* Preliminary, Source: NCCI Residual Market Management Summary
Page 16 of 49
17
IOWA
WORKERS COMPENSATION FILING – January 1, 2013
© Copyright 2012 National Council on Compensation Insurance, Inc. All Rights Reserved.
Conclusion This filing document provides a high-level perspective in support of increasing Iowa’s current voluntary market advisory prospective rate levels and assigned risk rate levels by an average of 7.9%. Here are some of the key observations:
Claim frequency increased in 2010
Average indemnity costs for 2009 deteriorated significantly from last year’s projection of that year.
Medical costs have deteriorated in the last several years, rising significantly more than wages.
The following pages contain additional exhibits that may be of interest, as well as the proposed voluntary market advisory rates, assigned risk rates, and rating values by classification.
Page 17 of 49
18
IOWA
WORKERS COMPENSATION FILING – January 1, 2013
© Copyright 2012 National Council on Compensation Insurance, Inc. All Rights Reserved.
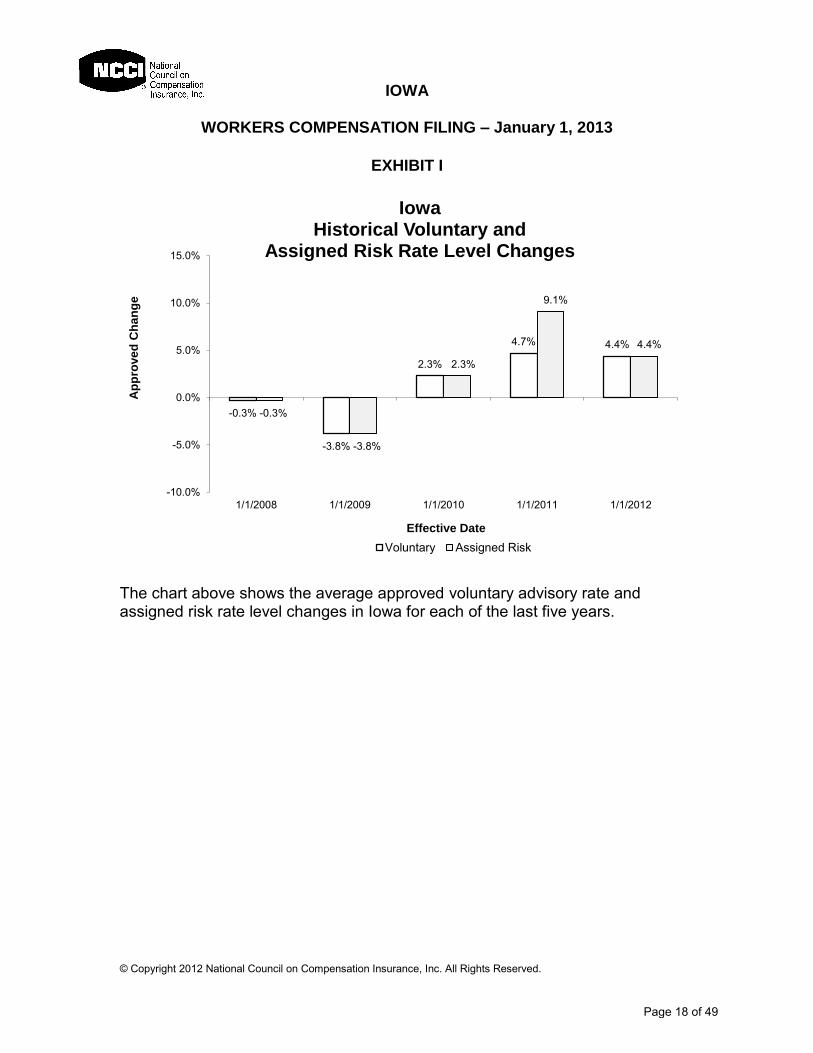
EXHIBIT I
The chart above shows the average approved voluntary advisory rate and assigned risk rate level changes in Iowa for each of the last five years.
-0.3%
-3.8%
2.3%
4.7% 4.4%
-0.3%
-3.8%
2.3%
9.1%
4.4%
-10.0%
-5.0%
0.0%
5.0%
10.0%
15.0%
1/1/2008 1/1/2009 1/1/2010 1/1/2011 1/1/2012
Ap
pro
ve
d C
ha
ng
e
Effective Date
Iowa Historical Voluntary and
Assigned Risk Rate Level Changes
Voluntary Assigned Risk
Page 18 of 49
19
IOWA
WORKERS COMPENSATION FILING – January 1, 2013
© Copyright 2012 National Council on Compensation Insurance, Inc. All Rights Reserved.
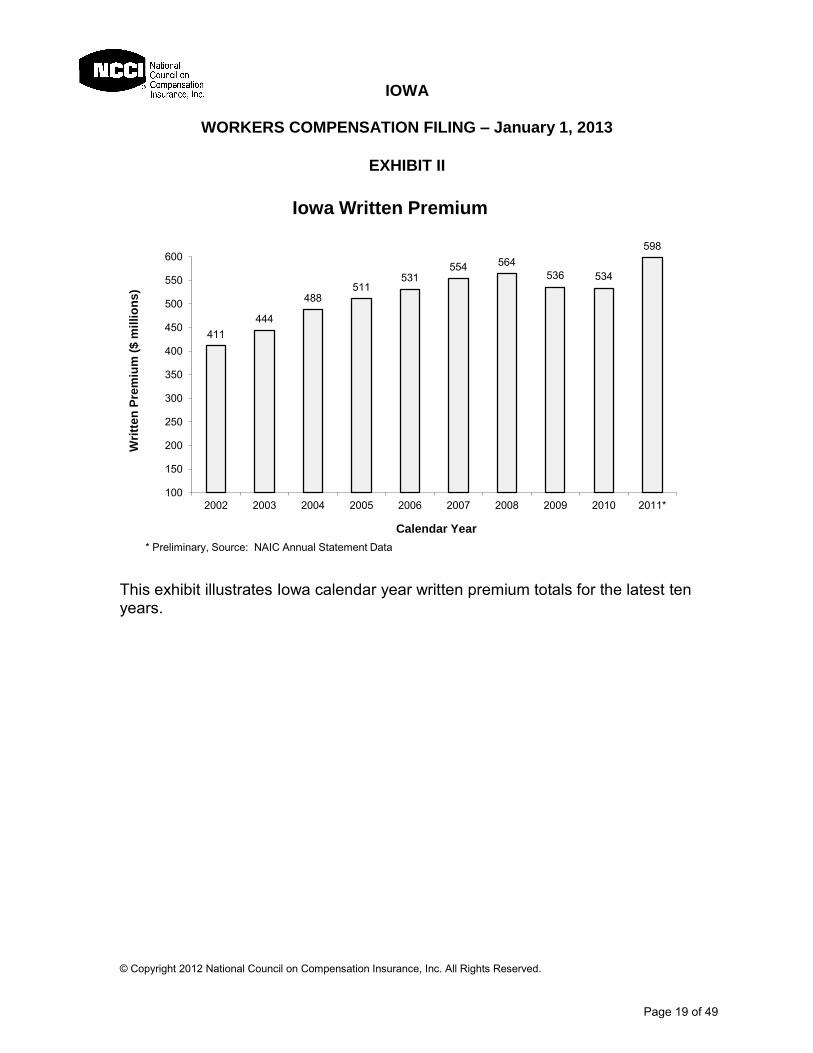
EXHIBIT II
This exhibit illustrates Iowa calendar year written premium totals for the latest ten years.
411
444
488 511
531 554 564
536 534
598
100
150
200
250
300
350
400
450
500
550
600
2002 2003 2004 2005 2006 2007 2008 2009 2010 2011*
Wri
tte
n P
rem
ium
($
mil
lio
ns
)
Calendar Year
Iowa Written Premium
* Preliminary, Source: NAIC Annual Statement Data
Page 19 of 49
20
IOWA
WORKERS COMPENSATION FILING – January 1, 2013
© Copyright 2012 National Council on Compensation Insurance, Inc. All Rights Reserved.
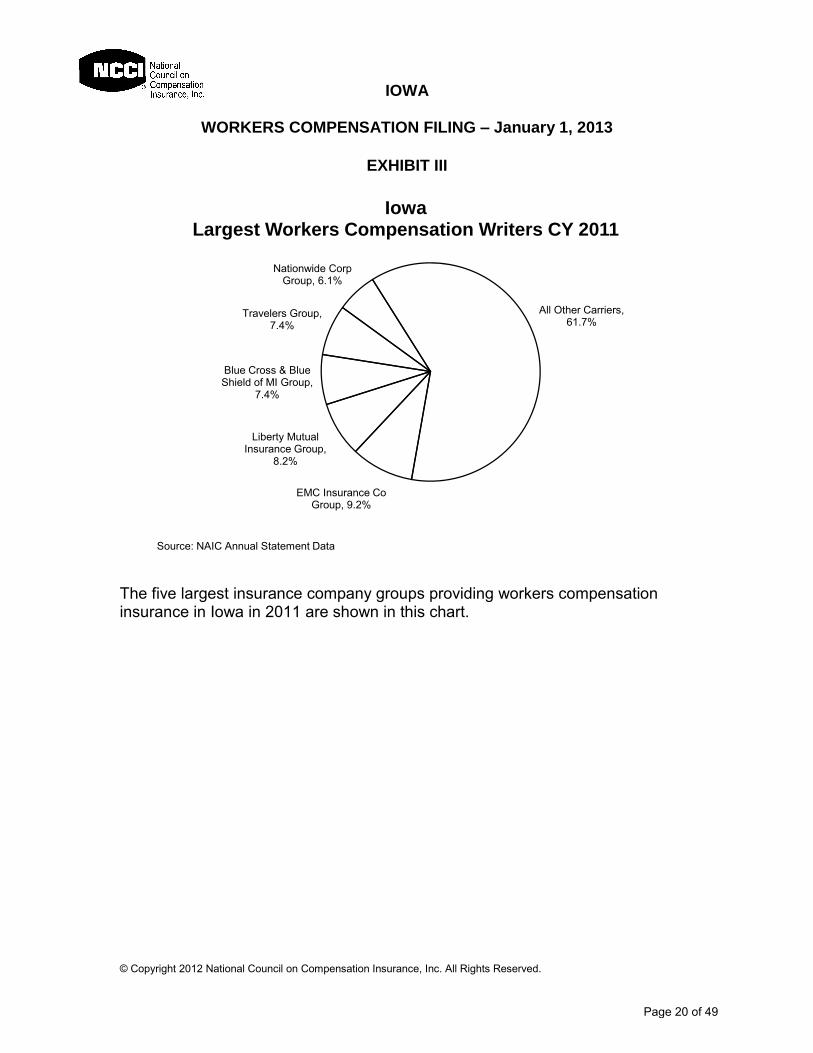
EXHIBIT III
The five largest insurance company groups providing workers compensation insurance in Iowa in 2011 are shown in this chart.
EMC Insurance Co Group, 9.2%
Liberty Mutual Insurance Group,
8.2%
Blue Cross & Blue Shield of MI Group,
7.4%
Travelers Group, 7.4%
Nationwide Corp Group, 6.1%
All Other Carriers, 61.7%
Iowa Largest Workers Compensation Writers CY 2011
Source: NAIC Annual Statement Data
Page 20 of 49
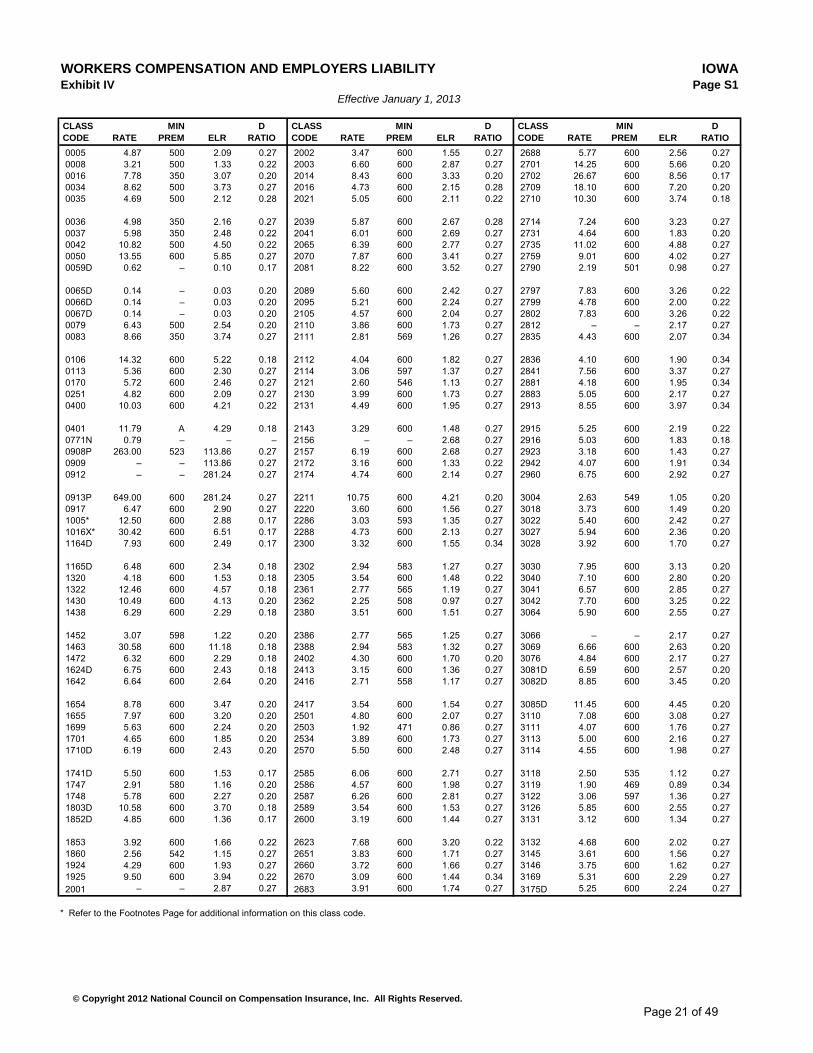
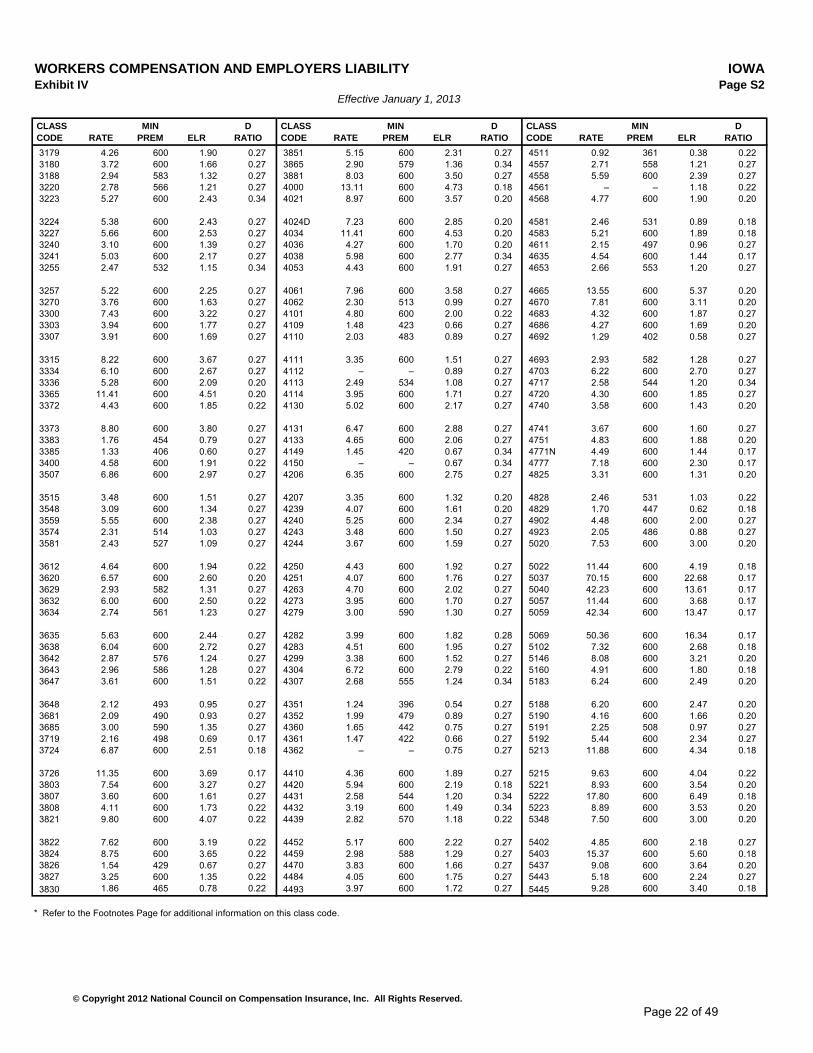
WORKERS COMPENSATION AND EMPLOYERS LIABILITY IOWAExhibit IV Page S1
Effective January 1, 2013
CLASS MIN D CLASS MIN D CLASS MIN D
CODE RATE PREM ELR RATIO CODE RATE PREM ELR RATIO CODE RATE PREM ELR RATIO
0005 4.87 500 2.09 0.27 2002 3.47 600 1.55 0.27 2688 5.77 600 2.56 0.27
0008 3.21 500 1.33 0.22 2003 6.60 600 2.87 0.27 2701 14.25 600 5.66 0.20
0016 7.78 350 3.07 0.20 2014 8.43 600 3.33 0.20 2702 26.67 600 8.56 0.17
0034 8.62 500 3.73 0.27 2016 4.73 600 2.15 0.28 2709 18.10 600 7.20 0.20
0035 4.69 500 2.12 0.28 2021 5.05 600 2.11 0.22 2710 10.30 600 3.74 0.18
0036 4.98 350 2.16 0.27 2039 5.87 600 2.67 0.28 2714 7.24 600 3.23 0.27
0037 5.98 350 2.48 0.22 2041 6.01 600 2.69 0.27 2731 4.64 600 1.83 0.20
0042 10.82 500 4.50 0.22 2065 6.39 600 2.77 0.27 2735 11.02 600 4.88 0.27
0050 13.55 600 5.85 0.27 2070 7.87 600 3.41 0.27 2759 9.01 600 4.02 0.27
0059D 0.62 – 0.10 0.17 2081 8.22 600 3.52 0.27 2790 2.19 501 0.98 0.27
0065D 0.14 – 0.03 0.20 2089 5.60 600 2.42 0.27 2797 7.83 600 3.26 0.22
0066D 0.14 – 0.03 0.20 2095 5.21 600 2.24 0.27 2799 4.78 600 2.00 0.22
0067D 0.14 – 0.03 0.20 2105 4.57 600 2.04 0.27 2802 7.83 600 3.26 0.22
0079 6.43 500 2.54 0.20 2110 3.86 600 1.73 0.27 2812 – – 2.17 0.27
0083 8.66 350 3.74 0.27 2111 2.81 569 1.26 0.27 2835 4.43 600 2.07 0.34
0106 14.32 600 5.22 0.18 2112 4.04 600 1.82 0.27 2836 4.10 600 1.90 0.34
0113 5.36 600 2.30 0.27 2114 3.06 597 1.37 0.27 2841 7.56 600 3.37 0.27
0170 5.72 600 2.46 0.27 2121 2.60 546 1.13 0.27 2881 4.18 600 1.95 0.34
0251 4.82 600 2.09 0.27 2130 3.99 600 1.73 0.27 2883 5.05 600 2.17 0.27
0400 10.03 600 4.21 0.22 2131 4.49 600 1.95 0.27 2913 8.55 600 3.97 0.34
0401 11.79 A 4.29 0.18 2143 3.29 600 1.48 0.27 2915 5.25 600 2.19 0.22
0771N 0.79 – – – 2156 – – 2.68 0.27 2916 5.03 600 1.83 0.18
0908P 263.00 523 113.86 0.27 2157 6.19 600 2.68 0.27 2923 3.18 600 1.43 0.27
0909 – – 113.86 0.27 2172 3.16 600 1.33 0.22 2942 4.07 600 1.91 0.34
0912 – – 281.24 0.27 2174 4.74 600 2.14 0.27 2960 6.75 600 2.92 0.27
0913P 649.00 600 281.24 0.27 2211 10.75 600 4.21 0.20 3004 2.63 549 1.05 0.20
0917 6.47 600 2.90 0.27 2220 3.60 600 1.56 0.27 3018 3.73 600 1.49 0.20
1005* 12.50 600 2.88 0.17 2286 3.03 593 1.35 0.27 3022 5.40 600 2.42 0.27
1016X* 30.42 600 6.51 0.17 2288 4.73 600 2.13 0.27 3027 5.94 600 2.36 0.20
1164D 7.93 600 2.49 0.17 2300 3.32 600 1.55 0.34 3028 3.92 600 1.70 0.27
1165D 6.48 600 2.34 0.18 2302 2.94 583 1.27 0.27 3030 7.95 600 3.13 0.20
1320 4.18 600 1.53 0.18 2305 3.54 600 1.48 0.22 3040 7.10 600 2.80 0.20
1322 12.46 600 4.57 0.18 2361 2.77 565 1.19 0.27 3041 6.57 600 2.85 0.27
1430 10.49 600 4.13 0.20 2362 2.25 508 0.97 0.27 3042 7.70 600 3.25 0.22
1438 6.29 600 2.29 0.18 2380 3.51 600 1.51 0.27 3064 5.90 600 2.55 0.27
1452 3.07 598 1.22 0.20 2386 2.77 565 1.25 0.27 3066 – – 2.17 0.27
1463 30.58 600 11.18 0.18 2388 2.94 583 1.32 0.27 3069 6.66 600 2.63 0.20
1472 6.32 600 2.29 0.18 2402 4.30 600 1.70 0.20 3076 4.84 600 2.17 0.27
1624D 6.75 600 2.43 0.18 2413 3.15 600 1.36 0.27 3081D 6.59 600 2.57 0.20
1642 6.64 600 2.64 0.20 2416 2.71 558 1.17 0.27 3082D 8.85 600 3.45 0.20
1654 8.78 600 3.47 0.20 2417 3.54 600 1.54 0.27 3085D 11.45 600 4.45 0.20
1655 7.97 600 3.20 0.20 2501 4.80 600 2.07 0.27 3110 7.08 600 3.08 0.27
1699 5.63 600 2.24 0.20 2503 1.92 471 0.86 0.27 3111 4.07 600 1.76 0.27
1701 4.65 600 1.85 0.20 2534 3.89 600 1.73 0.27 3113 5.00 600 2.16 0.27
1710D 6.19 600 2.43 0.20 2570 5.50 600 2.48 0.27 3114 4.55 600 1.98 0.27
1741D 5.50 600 1.53 0.17 2585 6.06 600 2.71 0.27 3118 2.50 535 1.12 0.27
1747 2.91 580 1.16 0.20 2586 4.57 600 1.98 0.27 3119 1.90 469 0.89 0.34
1748 5.78 600 2.27 0.20 2587 6.26 600 2.81 0.27 3122 3.06 597 1.36 0.27
1803D 10.58 600 3.70 0.18 2589 3.54 600 1.53 0.27 3126 5.85 600 2.55 0.27
1852D 4.85 600 1.36 0.17 2600 3.19 600 1.44 0.27 3131 3.12 600 1.34 0.27
1853 3.92 600 1.66 0.22 2623 7.68 600 3.20 0.22 3132 4.68 600 2.02 0.27
1860 2.56 542 1.15 0.27 2651 3.83 600 1.71 0.27 3145 3.61 600 1.56 0.27
1924 4.29 600 1.93 0.27 2660 3.72 600 1.66 0.27 3146 3.75 600 1.62 0.27
1925 9.50 600 3.94 0.22 2670 3.09 600 1.44 0.34 3169 5.31 600 2.29 0.27
2001 – – 2.87 0.27 2683 3.91 600 1.74 0.27 3175D 5.25 600 2.24 0.27
* Refer to the Footnotes Page for additional information on this class code.
© Copyright 2012 National Council on Compensation Insurance, Inc. All Rights Reserved.
Page 21 of 49
WORKERS COMPENSATION AND EMPLOYERS LIABILITY IOWAExhibit IV Page S2
Effective January 1, 2013
CLASS MIN D CLASS MIN D CLASS MIN D
CODE RATE PREM ELR RATIO CODE RATE PREM ELR RATIO CODE RATE PREM ELR RATIO
3179 4.26 600 1.90 0.27 3851 5.15 600 2.31 0.27 4511 0.92 361 0.38 0.22
3180 3.72 600 1.66 0.27 3865 2.90 579 1.36 0.34 4557 2.71 558 1.21 0.27
3188 2.94 583 1.32 0.27 3881 8.03 600 3.50 0.27 4558 5.59 600 2.39 0.27
3220 2.78 566 1.21 0.27 4000 13.11 600 4.73 0.18 4561 – – 1.18 0.22
3223 5.27 600 2.43 0.34 4021 8.97 600 3.57 0.20 4568 4.77 600 1.90 0.20
3224 5.38 600 2.43 0.27 4024D 7.23 600 2.85 0.20 4581 2.46 531 0.89 0.18
3227 5.66 600 2.53 0.27 4034 11.41 600 4.53 0.20 4583 5.21 600 1.89 0.18
3240 3.10 600 1.39 0.27 4036 4.27 600 1.70 0.20 4611 2.15 497 0.96 0.27
3241 5.03 600 2.17 0.27 4038 5.98 600 2.77 0.34 4635 4.54 600 1.44 0.17
3255 2.47 532 1.15 0.34 4053 4.43 600 1.91 0.27 4653 2.66 553 1.20 0.27
3257 5.22 600 2.25 0.27 4061 7.96 600 3.58 0.27 4665 13.55 600 5.37 0.20
3270 3.76 600 1.63 0.27 4062 2.30 513 0.99 0.27 4670 7.81 600 3.11 0.20
3300 7.43 600 3.22 0.27 4101 4.80 600 2.00 0.22 4683 4.32 600 1.87 0.27
3303 3.94 600 1.77 0.27 4109 1.48 423 0.66 0.27 4686 4.27 600 1.69 0.20
3307 3.91 600 1.69 0.27 4110 2.03 483 0.89 0.27 4692 1.29 402 0.58 0.27
3315 8.22 600 3.67 0.27 4111 3.35 600 1.51 0.27 4693 2.93 582 1.28 0.27
3334 6.10 600 2.67 0.27 4112 – – 0.89 0.27 4703 6.22 600 2.70 0.27
3336 5.28 600 2.09 0.20 4113 2.49 534 1.08 0.27 4717 2.58 544 1.20 0.34
3365 11.41 600 4.51 0.20 4114 3.95 600 1.71 0.27 4720 4.30 600 1.85 0.27
3372 4.43 600 1.85 0.22 4130 5.02 600 2.17 0.27 4740 3.58 600 1.43 0.20
3373 8.80 600 3.80 0.27 4131 6.47 600 2.88 0.27 4741 3.67 600 1.60 0.27
3383 1.76 454 0.79 0.27 4133 4.65 600 2.06 0.27 4751 4.83 600 1.88 0.20
3385 1.33 406 0.60 0.27 4149 1.45 420 0.67 0.34 4771N 4.49 600 1.44 0.17
3400 4.58 600 1.91 0.22 4150 – – 0.67 0.34 4777 7.18 600 2.30 0.17
3507 6.86 600 2.97 0.27 4206 6.35 600 2.75 0.27 4825 3.31 600 1.31 0.20
3515 3.48 600 1.51 0.27 4207 3.35 600 1.32 0.20 4828 2.46 531 1.03 0.22
3548 3.09 600 1.34 0.27 4239 4.07 600 1.61 0.20 4829 1.70 447 0.62 0.18
3559 5.55 600 2.38 0.27 4240 5.25 600 2.34 0.27 4902 4.48 600 2.00 0.27
3574 2.31 514 1.03 0.27 4243 3.48 600 1.50 0.27 4923 2.05 486 0.88 0.27
3581 2.43 527 1.09 0.27 4244 3.67 600 1.59 0.27 5020 7.53 600 3.00 0.20
3612 4.64 600 1.94 0.22 4250 4.43 600 1.92 0.27 5022 11.44 600 4.19 0.18
3620 6.57 600 2.60 0.20 4251 4.07 600 1.76 0.27 5037 70.15 600 22.68 0.17
3629 2.93 582 1.31 0.27 4263 4.70 600 2.02 0.27 5040 42.23 600 13.61 0.17
3632 6.00 600 2.50 0.22 4273 3.95 600 1.70 0.27 5057 11.44 600 3.68 0.17
3634 2.74 561 1.23 0.27 4279 3.00 590 1.30 0.27 5059 42.34 600 13.47 0.17
3635 5.63 600 2.44 0.27 4282 3.99 600 1.82 0.28 5069 50.36 600 16.34 0.17
3638 6.04 600 2.72 0.27 4283 4.51 600 1.95 0.27 5102 7.32 600 2.68 0.18
3642 2.87 576 1.24 0.27 4299 3.38 600 1.52 0.27 5146 8.08 600 3.21 0.20
3643 2.96 586 1.28 0.27 4304 6.72 600 2.79 0.22 5160 4.91 600 1.80 0.18
3647 3.61 600 1.51 0.22 4307 2.68 555 1.24 0.34 5183 6.24 600 2.49 0.20
3648 2.12 493 0.95 0.27 4351 1.24 396 0.54 0.27 5188 6.20 600 2.47 0.20
3681 2.09 490 0.93 0.27 4352 1.99 479 0.89 0.27 5190 4.16 600 1.66 0.20
3685 3.00 590 1.35 0.27 4360 1.65 442 0.75 0.27 5191 2.25 508 0.97 0.27
3719 2.16 498 0.69 0.17 4361 1.47 422 0.66 0.27 5192 5.44 600 2.34 0.27
3724 6.87 600 2.51 0.18 4362 – – 0.75 0.27 5213 11.88 600 4.34 0.18
3726 11.35 600 3.69 0.17 4410 4.36 600 1.89 0.27 5215 9.63 600 4.04 0.22
3803 7.54 600 3.27 0.27 4420 5.94 600 2.19 0.18 5221 8.93 600 3.54 0.20
3807 3.60 600 1.61 0.27 4431 2.58 544 1.20 0.34 5222 17.80 600 6.49 0.18
3808 4.11 600 1.73 0.22 4432 3.19 600 1.49 0.34 5223 8.89 600 3.53 0.20
3821 9.80 600 4.07 0.22 4439 2.82 570 1.18 0.22 5348 7.50 600 3.00 0.20
3822 7.62 600 3.19 0.22 4452 5.17 600 2.22 0.27 5402 4.85 600 2.18 0.27
3824 8.75 600 3.65 0.22 4459 2.98 588 1.29 0.27 5403 15.37 600 5.60 0.18
3826 1.54 429 0.67 0.27 4470 3.83 600 1.66 0.27 5437 9.08 600 3.64 0.20
3827 3.25 600 1.35 0.22 4484 4.05 600 1.75 0.27 5443 5.18 600 2.24 0.27
3830 1.86 465 0.78 0.22 4493 3.97 600 1.72 0.27 5445 9.28 600 3.40 0.18
* Refer to the Footnotes Page for additional information on this class code.
© Copyright 2012 National Council on Compensation Insurance, Inc. All Rights Reserved.
Page 22 of 49
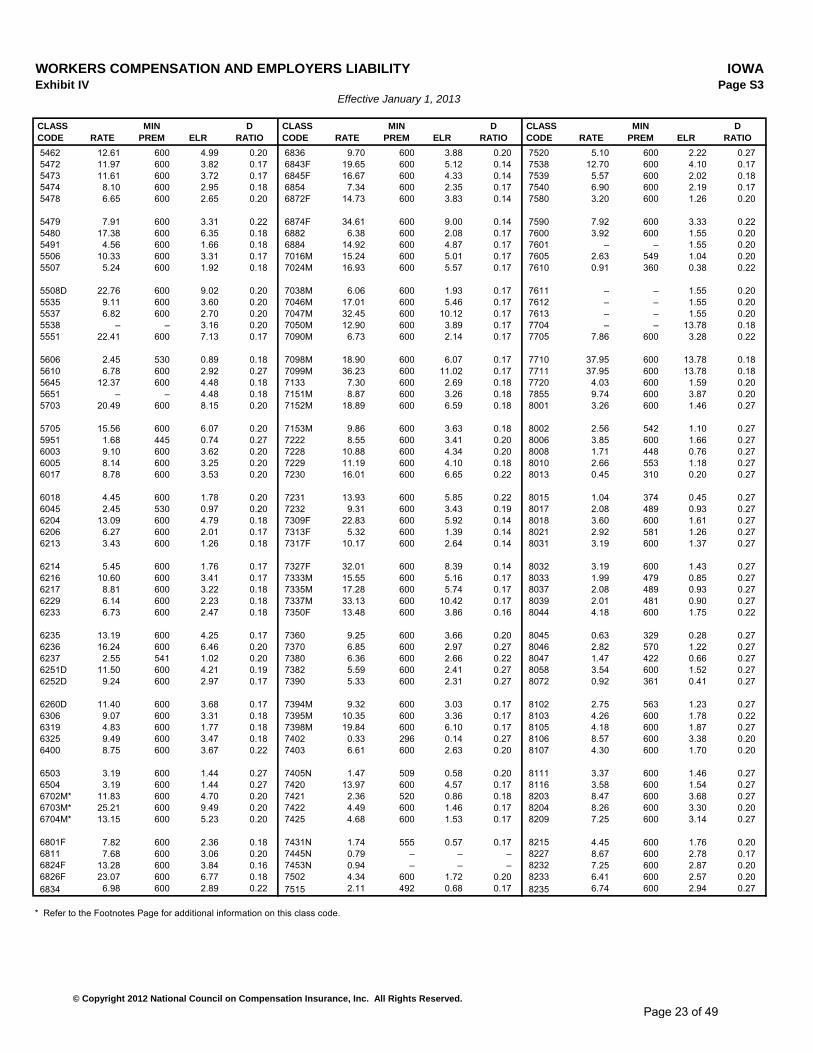
WORKERS COMPENSATION AND EMPLOYERS LIABILITY IOWAExhibit IV Page S3
Effective January 1, 2013
CLASS MIN D CLASS MIN D CLASS MIN D
CODE RATE PREM ELR RATIO CODE RATE PREM ELR RATIO CODE RATE PREM ELR RATIO
5462 12.61 600 4.99 0.20 6836 9.70 600 3.88 0.20 7520 5.10 600 2.22 0.27
5472 11.97 600 3.82 0.17 6843F 19.65 600 5.12 0.14 7538 12.70 600 4.10 0.17
5473 11.61 600 3.72 0.17 6845F 16.67 600 4.33 0.14 7539 5.57 600 2.02 0.18
5474 8.10 600 2.95 0.18 6854 7.34 600 2.35 0.17 7540 6.90 600 2.19 0.17
5478 6.65 600 2.65 0.20 6872F 14.73 600 3.83 0.14 7580 3.20 600 1.26 0.20
5479 7.91 600 3.31 0.22 6874F 34.61 600 9.00 0.14 7590 7.92 600 3.33 0.22
5480 17.38 600 6.35 0.18 6882 6.38 600 2.08 0.17 7600 3.92 600 1.55 0.20
5491 4.56 600 1.66 0.18 6884 14.92 600 4.87 0.17 7601 – – 1.55 0.20
5506 10.33 600 3.31 0.17 7016M 15.24 600 5.01 0.17 7605 2.63 549 1.04 0.20
5507 5.24 600 1.92 0.18 7024M 16.93 600 5.57 0.17 7610 0.91 360 0.38 0.22
5508D 22.76 600 9.02 0.20 7038M 6.06 600 1.93 0.17 7611 – – 1.55 0.20
5535 9.11 600 3.60 0.20 7046M 17.01 600 5.46 0.17 7612 – – 1.55 0.20
5537 6.82 600 2.70 0.20 7047M 32.45 600 10.12 0.17 7613 – – 1.55 0.20
5538 – – 3.16 0.20 7050M 12.90 600 3.89 0.17 7704 – – 13.78 0.18
5551 22.41 600 7.13 0.17 7090M 6.73 600 2.14 0.17 7705 7.86 600 3.28 0.22
5606 2.45 530 0.89 0.18 7098M 18.90 600 6.07 0.17 7710 37.95 600 13.78 0.18
5610 6.78 600 2.92 0.27 7099M 36.23 600 11.02 0.17 7711 37.95 600 13.78 0.18
5645 12.37 600 4.48 0.18 7133 7.30 600 2.69 0.18 7720 4.03 600 1.59 0.20
5651 – – 4.48 0.18 7151M 8.87 600 3.26 0.18 7855 9.74 600 3.87 0.20
5703 20.49 600 8.15 0.20 7152M 18.89 600 6.59 0.18 8001 3.26 600 1.46 0.27
5705 15.56 600 6.07 0.20 7153M 9.86 600 3.63 0.18 8002 2.56 542 1.10 0.27
5951 1.68 445 0.74 0.27 7222 8.55 600 3.41 0.20 8006 3.85 600 1.66 0.27
6003 9.10 600 3.62 0.20 7228 10.88 600 4.34 0.20 8008 1.71 448 0.76 0.27
6005 8.14 600 3.25 0.20 7229 11.19 600 4.10 0.18 8010 2.66 553 1.18 0.27
6017 8.78 600 3.53 0.20 7230 16.01 600 6.65 0.22 8013 0.45 310 0.20 0.27
6018 4.45 600 1.78 0.20 7231 13.93 600 5.85 0.22 8015 1.04 374 0.45 0.27
6045 2.45 530 0.97 0.20 7232 9.31 600 3.43 0.19 8017 2.08 489 0.93 0.27
6204 13.09 600 4.79 0.18 7309F 22.83 600 5.92 0.14 8018 3.60 600 1.61 0.27
6206 6.27 600 2.01 0.17 7313F 5.32 600 1.39 0.14 8021 2.92 581 1.26 0.27
6213 3.43 600 1.26 0.18 7317F 10.17 600 2.64 0.14 8031 3.19 600 1.37 0.27
6214 5.45 600 1.76 0.17 7327F 32.01 600 8.39 0.14 8032 3.19 600 1.43 0.27
6216 10.60 600 3.41 0.17 7333M 15.55 600 5.16 0.17 8033 1.99 479 0.85 0.27
6217 8.81 600 3.22 0.18 7335M 17.28 600 5.74 0.17 8037 2.08 489 0.93 0.27
6229 6.14 600 2.23 0.18 7337M 33.13 600 10.42 0.17 8039 2.01 481 0.90 0.27
6233 6.73 600 2.47 0.18 7350F 13.48 600 3.86 0.16 8044 4.18 600 1.75 0.22
6235 13.19 600 4.25 0.17 7360 9.25 600 3.66 0.20 8045 0.63 329 0.28 0.27
6236 16.24 600 6.46 0.20 7370 6.85 600 2.97 0.27 8046 2.82 570 1.22 0.27
6237 2.55 541 1.02 0.20 7380 6.36 600 2.66 0.22 8047 1.47 422 0.66 0.27
6251D 11.50 600 4.21 0.19 7382 5.59 600 2.41 0.27 8058 3.54 600 1.52 0.27
6252D 9.24 600 2.97 0.17 7390 5.33 600 2.31 0.27 8072 0.92 361 0.41 0.27
6260D 11.40 600 3.68 0.17 7394M 9.32 600 3.03 0.17 8102 2.75 563 1.23 0.27
6306 9.07 600 3.31 0.18 7395M 10.35 600 3.36 0.17 8103 4.26 600 1.78 0.22
6319 4.83 600 1.77 0.18 7398M 19.84 600 6.10 0.17 8105 4.18 600 1.87 0.27
6325 9.49 600 3.47 0.18 7402 0.33 296 0.14 0.27 8106 8.57 600 3.38 0.20
6400 8.75 600 3.67 0.22 7403 6.61 600 2.63 0.20 8107 4.30 600 1.70 0.20
6503 3.19 600 1.44 0.27 7405N 1.47 509 0.58 0.20 8111 3.37 600 1.46 0.27
6504 3.19 600 1.44 0.27 7420 13.97 600 4.57 0.17 8116 3.58 600 1.54 0.27
6702M* 11.83 600 4.70 0.20 7421 2.36 520 0.86 0.18 8203 8.47 600 3.68 0.27
6703M* 25.21 600 9.49 0.20 7422 4.49 600 1.46 0.17 8204 8.26 600 3.30 0.20
6704M* 13.15 600 5.23 0.20 7425 4.68 600 1.53 0.17 8209 7.25 600 3.14 0.27
6801F 7.82 600 2.36 0.18 7431N 1.74 555 0.57 0.17 8215 4.45 600 1.76 0.20
6811 7.68 600 3.06 0.20 7445N 0.79 – – – 8227 8.67 600 2.78 0.17
6824F 13.28 600 3.84 0.16 7453N 0.94 – – – 8232 7.25 600 2.87 0.20
6826F 23.07 600 6.77 0.18 7502 4.34 600 1.72 0.20 8233 6.41 600 2.57 0.20
6834 6.98 600 2.89 0.22 7515 2.11 492 0.68 0.17 8235 6.74 600 2.94 0.27
* Refer to the Footnotes Page for additional information on this class code.
© Copyright 2012 National Council on Compensation Insurance, Inc. All Rights Reserved.
Page 23 of 49
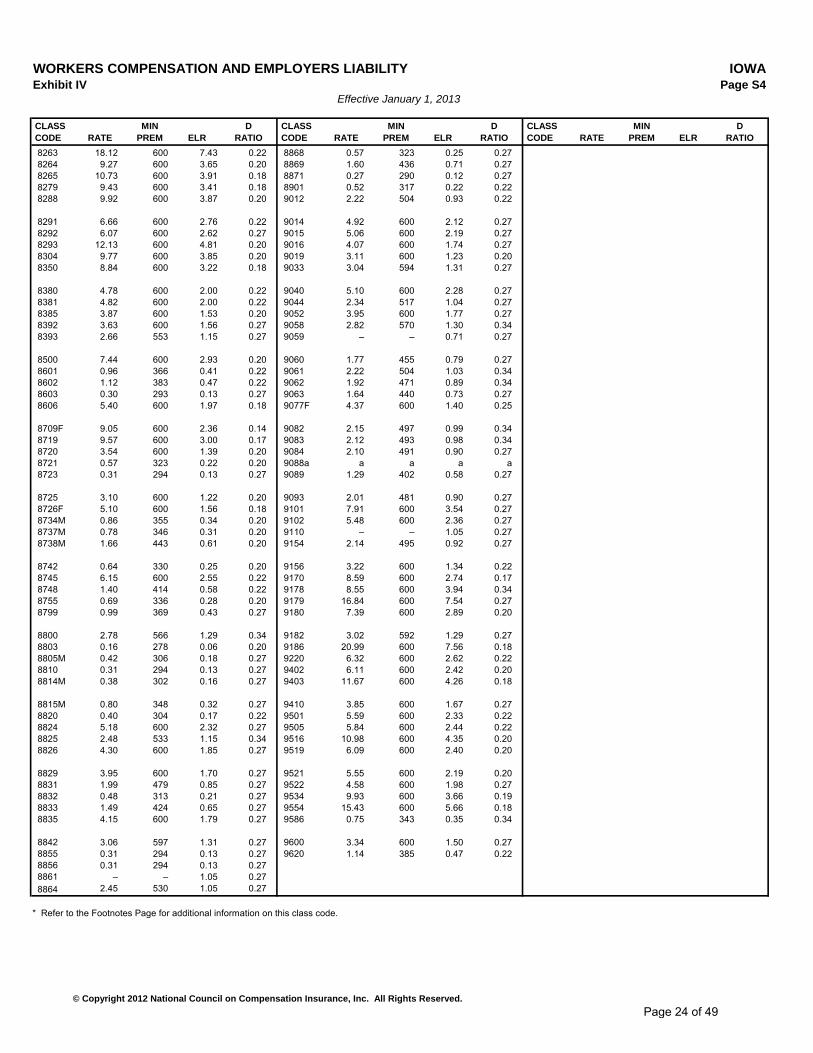
WORKERS COMPENSATION AND EMPLOYERS LIABILITY IOWAExhibit IV Page S4
Effective January 1, 2013
CLASS MIN D CLASS MIN D CLASS MIN D
CODE RATE PREM ELR RATIO CODE RATE PREM ELR RATIO CODE RATE PREM ELR RATIO
8263 18.12 600 7.43 0.22 8868 0.57 323 0.25 0.27
8264 9.27 600 3.65 0.20 8869 1.60 436 0.71 0.27
8265 10.73 600 3.91 0.18 8871 0.27 290 0.12 0.27
8279 9.43 600 3.41 0.18 8901 0.52 317 0.22 0.22
8288 9.92 600 3.87 0.20 9012 2.22 504 0.93 0.22
8291 6.66 600 2.76 0.22 9014 4.92 600 2.12 0.27
8292 6.07 600 2.62 0.27 9015 5.06 600 2.19 0.27
8293 12.13 600 4.81 0.20 9016 4.07 600 1.74 0.27
8304 9.77 600 3.85 0.20 9019 3.11 600 1.23 0.20
8350 8.84 600 3.22 0.18 9033 3.04 594 1.31 0.27
8380 4.78 600 2.00 0.22 9040 5.10 600 2.28 0.27
8381 4.82 600 2.00 0.22 9044 2.34 517 1.04 0.27
8385 3.87 600 1.53 0.20 9052 3.95 600 1.77 0.27
8392 3.63 600 1.56 0.27 9058 2.82 570 1.30 0.34
8393 2.66 553 1.15 0.27 9059 – – 0.71 0.27
8500 7.44 600 2.93 0.20 9060 1.77 455 0.79 0.27
8601 0.96 366 0.41 0.22 9061 2.22 504 1.03 0.34
8602 1.12 383 0.47 0.22 9062 1.92 471 0.89 0.34
8603 0.30 293 0.13 0.27 9063 1.64 440 0.73 0.27
8606 5.40 600 1.97 0.18 9077F 4.37 600 1.40 0.25
8709F 9.05 600 2.36 0.14 9082 2.15 497 0.99 0.34
8719 9.57 600 3.00 0.17 9083 2.12 493 0.98 0.34
8720 3.54 600 1.39 0.20 9084 2.10 491 0.90 0.27
8721 0.57 323 0.22 0.20 9088a a a a a
8723 0.31 294 0.13 0.27 9089 1.29 402 0.58 0.27
8725 3.10 600 1.22 0.20 9093 2.01 481 0.90 0.27
8726F 5.10 600 1.56 0.18 9101 7.91 600 3.54 0.27
8734M 0.86 355 0.34 0.20 9102 5.48 600 2.36 0.27
8737M 0.78 346 0.31 0.20 9110 – – 1.05 0.27
8738M 1.66 443 0.61 0.20 9154 2.14 495 0.92 0.27
8742 0.64 330 0.25 0.20 9156 3.22 600 1.34 0.22
8745 6.15 600 2.55 0.22 9170 8.59 600 2.74 0.17
8748 1.40 414 0.58 0.22 9178 8.55 600 3.94 0.34
8755 0.69 336 0.28 0.20 9179 16.84 600 7.54 0.27
8799 0.99 369 0.43 0.27 9180 7.39 600 2.89 0.20
8800 2.78 566 1.29 0.34 9182 3.02 592 1.29 0.27
8803 0.16 278 0.06 0.20 9186 20.99 600 7.56 0.18
8805M 0.42 306 0.18 0.27 9220 6.32 600 2.62 0.22
8810 0.31 294 0.13 0.27 9402 6.11 600 2.42 0.20
8814M 0.38 302 0.16 0.27 9403 11.67 600 4.26 0.18
8815M 0.80 348 0.32 0.27 9410 3.85 600 1.67 0.27
8820 0.40 304 0.17 0.22 9501 5.59 600 2.33 0.22
8824 5.18 600 2.32 0.27 9505 5.84 600 2.44 0.22
8825 2.48 533 1.15 0.34 9516 10.98 600 4.35 0.20
8826 4.30 600 1.85 0.27 9519 6.09 600 2.40 0.20
8829 3.95 600 1.70 0.27 9521 5.55 600 2.19 0.20
8831 1.99 479 0.85 0.27 9522 4.58 600 1.98 0.27
8832 0.48 313 0.21 0.27 9534 9.93 600 3.66 0.19
8833 1.49 424 0.65 0.27 9554 15.43 600 5.66 0.18
8835 4.15 600 1.79 0.27 9586 0.75 343 0.35 0.34
8842 3.06 597 1.31 0.27 9600 3.34 600 1.50 0.27
8855 0.31 294 0.13 0.27 9620 1.14 385 0.47 0.22
8856 0.31 294 0.13 0.27
8861 – – 1.05 0.27
8864 2.45 530 1.05 0.27
* Refer to the Footnotes Page for additional information on this class code.
© Copyright 2012 National Council on Compensation Insurance, Inc. All Rights Reserved.
Page 24 of 49
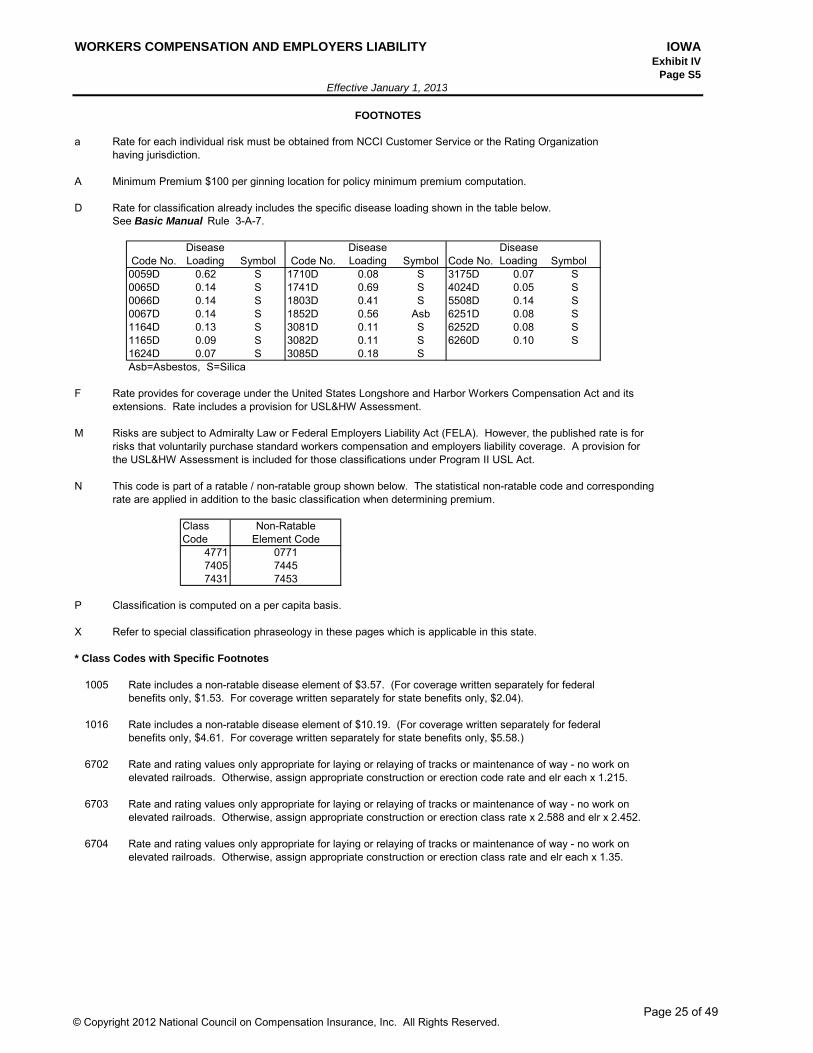
WORKERS COMPENSATION AND EMPLOYERS LIABILITY IOWAExhibit IV
Page S5
Effective January 1, 2013
FOOTNOTES
a Rate for each individual risk must be obtained from NCCI Customer Service or the Rating Organization
having jurisdiction.
A Minimum Premium $100 per ginning location for policy minimum premium computation.
D Rate for classification already includes the specific disease loading shown in the table below.
See Basic Manual Rule 3-A-7.
Code No.
Disease
Loading Symbol Code No.
Disease
Loading Symbol Code No.
Disease
Loading Symbol
0059D 0.62 S 1710D 0.08 S 3175D 0.07 S
0065D 0.14 S 1741D 0.69 S 4024D 0.05 S
0066D 0.14 S 1803D 0.41 S 5508D 0.14 S
0067D 0.14 S 1852D 0.56 Asb 6251D 0.08 S
1164D 0.13 S 3081D 0.11 S 6252D 0.08 S
1165D 0.09 S 3082D 0.11 S 6260D 0.10 S
1624D 0.07 S 3085D 0.18 S
Asb=Asbestos, S=Silica
F Rate provides for coverage under the United States Longshore and Harbor Workers Compensation Act and its
extensions. Rate includes a provision for USL&HW Assessment.
M Risks are subject to Admiralty Law or Federal Employers Liability Act (FELA). However, the published rate is for
risks that voluntarily purchase standard workers compensation and employers liability coverage. A provision for
the USL&HW Assessment is included for those classifications under Program II USL Act.
N This code is part of a ratable / non-ratable group shown below. The statistical non-ratable code and corresponding
rate are applied in addition to the basic classification when determining premium.
Class
Code
4771
7405
7431
P Classification is computed on a per capita basis.
X Refer to special classification phraseology in these pages which is applicable in this state.
* Class Codes with Specific Footnotes
1005 Rate includes a non-ratable disease element of $3.57. (For coverage written separately for federal
benefits only, $1.53. For coverage written separately for state benefits only, $2.04).
1016 Rate includes a non-ratable disease element of $10.19. (For coverage written separately for federal
benefits only, $4.61. For coverage written separately for state benefits only, $5.58.)
6702 Rate and rating values only appropriate for laying or relaying of tracks or maintenance of way - no work on
elevated railroads. Otherwise, assign appropriate construction or erection code rate and elr each x 1.215.
6703 Rate and rating values only appropriate for laying or relaying of tracks or maintenance of way - no work on
elevated railroads. Otherwise, assign appropriate construction or erection class rate x 2.588 and elr x 2.452.
6704 Rate and rating values only appropriate for laying or relaying of tracks or maintenance of way - no work on
elevated railroads. Otherwise, assign appropriate construction or erection class rate and elr each x 1.35.
7445
7453
Non-Ratable
Element Code
0771
© Copyright 2012 National Council on Compensation Insurance, Inc. All Rights Reserved.Page 25 of 49
WORKERS COMPENSATION AND EMPLOYERS LIABILITY IOWAExhibit IV
Page S6
Effective January 1, 2013
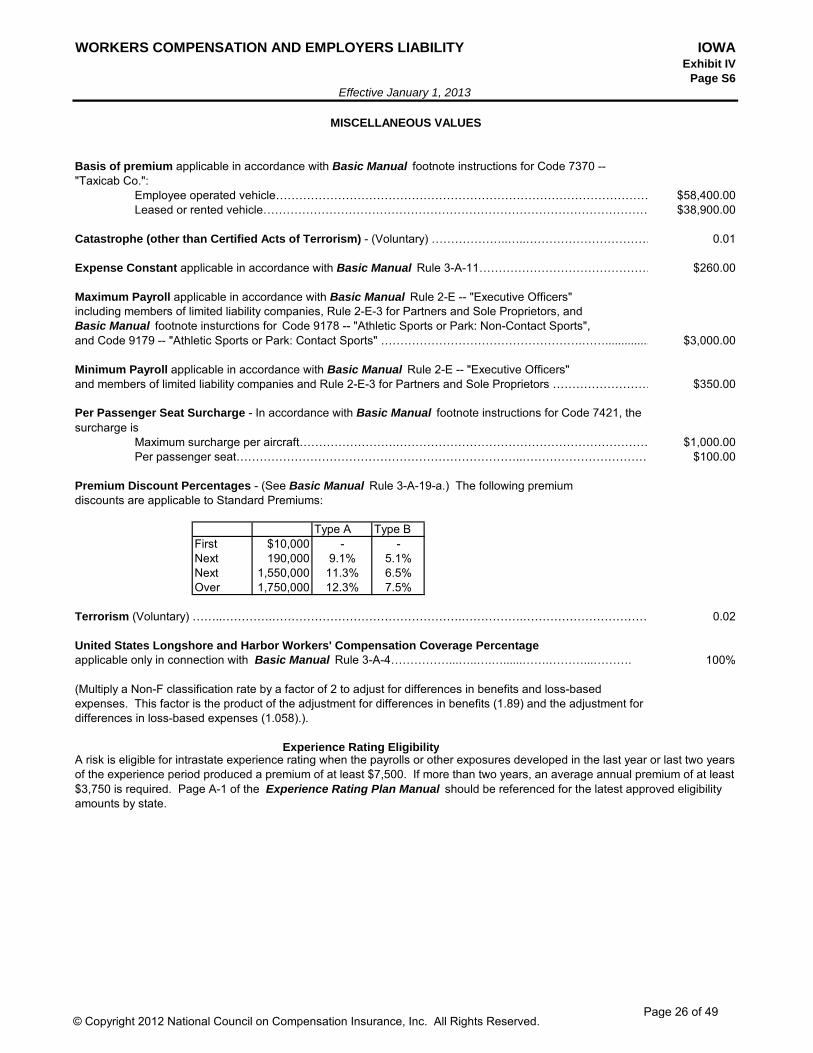
MISCELLANEOUS VALUES
Basis of premium applicable in accordance with Basic Manual footnote instructions for Code 7370 --
"Taxicab Co.":
Employee operated vehicle…………………………………………………………………………………… $58,400.00
Leased or rented vehicle……………………………………………………………………………………… $38,900.00
Catastrophe (other than Certified Acts of Terrorism) - (Voluntary) ………………..…..…………………………… 0.01
Expense Constant applicable in accordance with Basic Manual Rule 3-A-11……………………………………… $260.00
Maximum Payroll applicable in accordance with Basic Manual Rule 2-E -- "Executive Officers"
including members of limited liability companies, Rule 2-E-3 for Partners and Sole Proprietors, and
Basic Manual footnote insturctions for Code 9178 -- "Athletic Sports or Park: Non-Contact Sports",
and Code 9179 -- "Athletic Sports or Park: Contact Sports" …………………………………………….…….............. $3,000.00
Minimum Payroll applicable in accordance with Basic Manual Rule 2-E -- "Executive Officers"
and members of limited liability companies and Rule 2-E-3 for Partners and Sole Proprietors ……………………… $350.00
Maximum surcharge per aircraft…………………….………………………………………………………… $1,000.00
Per passenger seat………………………………………………………………..…………………………… $100.00
Premium Discount Percentages - (See Basic Manual Rule 3-A-19-a.) The following premium
discounts are applicable to Standard Premiums:
Type A Type B
First $10,000 - -
Next 190,000 9.1% 5.1%
Next 1,550,000 11.3% 6.5%
Over 1,750,000 12.3% 7.5%
Terrorism (Voluntary) ……..………….………………………………………….…………….…………………………… 0.02
United States Longshore and Harbor Workers' Compensation Coverage Percentage
applicable only in connection with Basic Manual Rule 3-A-4……………...…..….…......…….………...……….
Experience Rating Eligibility
Per Passenger Seat Surcharge - In accordance with Basic Manual footnote instructions for Code 7421, the
surcharge is
A risk is eligible for intrastate experience rating when the payrolls or other exposures developed in the last year or last two years
of the experience period produced a premium of at least $7,500. If more than two years, an average annual premium of at least
$3,750 is required. Page A-1 of the Experience Rating Plan Manual should be referenced for the latest approved eligibility
amounts by state.
(Multiply a Non-F classification rate by a factor of 2 to adjust for differences in benefits and loss-based
expenses. This factor is the product of the adjustment for differences in benefits (1.89) and the adjustment for
differences in loss-based expenses (1.058).).
100%
© Copyright 2012 National Council on Compensation Insurance, Inc. All Rights Reserved.Page 26 of 49
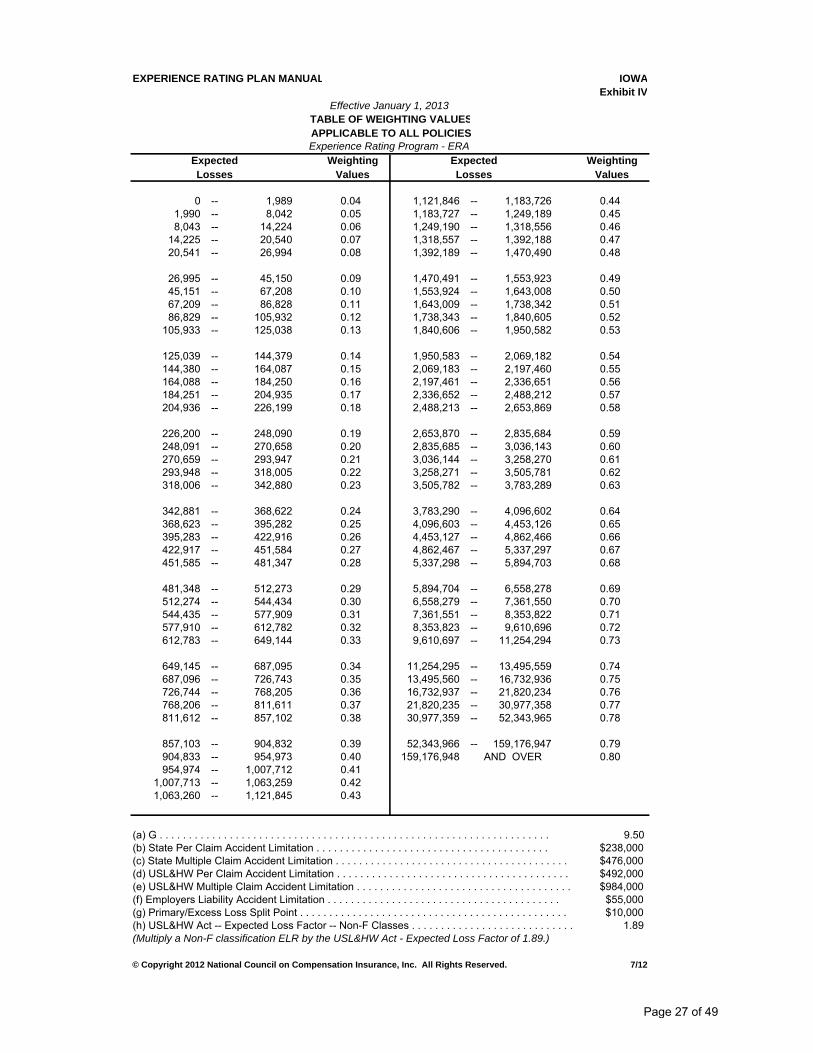
EXPERIENCE RATING PLAN MANUAL IOWA
Exhibit IV
Effective January 1, 2013
TABLE OF WEIGHTING VALUES
APPLICABLE TO ALL POLICIES
Experience Rating Program - ERAExpected Weighting Expected Weighting
Losses Values Losses Values
0 -- 1,989 0.04 1,121,846 -- 1,183,726 0.44
1,990 -- 8,042 0.05 1,183,727 -- 1,249,189 0.45
8,043 -- 14,224 0.06 1,249,190 -- 1,318,556 0.46
14,225 -- 20,540 0.07 1,318,557 -- 1,392,188 0.47
20,541 -- 26,994 0.08 1,392,189 -- 1,470,490 0.48
26,995 -- 45,150 0.09 1,470,491 -- 1,553,923 0.49
45,151 -- 67,208 0.10 1,553,924 -- 1,643,008 0.50
67,209 -- 86,828 0.11 1,643,009 -- 1,738,342 0.51
86,829 -- 105,932 0.12 1,738,343 -- 1,840,605 0.52
105,933 -- 125,038 0.13 1,840,606 -- 1,950,582 0.53
125,039 -- 144,379 0.14 1,950,583 -- 2,069,182 0.54
144,380 -- 164,087 0.15 2,069,183 -- 2,197,460 0.55
164,088 -- 184,250 0.16 2,197,461 -- 2,336,651 0.56
184,251 -- 204,935 0.17 2,336,652 -- 2,488,212 0.57
204,936 -- 226,199 0.18 2,488,213 -- 2,653,869 0.58
226,200 -- 248,090 0.19 2,653,870 -- 2,835,684 0.59
248,091 -- 270,658 0.20 2,835,685 -- 3,036,143 0.60
270,659 -- 293,947 0.21 3,036,144 -- 3,258,270 0.61
293,948 -- 318,005 0.22 3,258,271 -- 3,505,781 0.62
318,006 -- 342,880 0.23 3,505,782 -- 3,783,289 0.63
342,881 -- 368,622 0.24 3,783,290 -- 4,096,602 0.64
368,623 -- 395,282 0.25 4,096,603 -- 4,453,126 0.65
395,283 -- 422,916 0.26 4,453,127 -- 4,862,466 0.66
422,917 -- 451,584 0.27 4,862,467 -- 5,337,297 0.67
451,585 -- 481,347 0.28 5,337,298 -- 5,894,703 0.68
481,348 -- 512,273 0.29 5,894,704 -- 6,558,278 0.69
512,274 -- 544,434 0.30 6,558,279 -- 7,361,550 0.70
544,435 -- 577,909 0.31 7,361,551 -- 8,353,822 0.71
577,910 -- 612,782 0.32 8,353,823 -- 9,610,696 0.72
612,783 -- 649,144 0.33 9,610,697 -- 11,254,294 0.73
649,145 -- 687,095 0.34 11,254,295 -- 13,495,559 0.74
687,096 -- 726,743 0.35 13,495,560 -- 16,732,936 0.75
726,744 -- 768,205 0.36 16,732,937 -- 21,820,234 0.76
768,206 -- 811,611 0.37 21,820,235 -- 30,977,358 0.77
811,612 -- 857,102 0.38 30,977,359 -- 52,343,965 0.78
857,103 -- 904,832 0.39 52,343,966 -- 159,176,947 0.79
904,833 -- 954,973 0.40 159,176,948 AND OVER 0.80
954,974 -- 1,007,712 0.41
1,007,713 -- 1,063,259 0.42
1,063,260 -- 1,121,845 0.43
(a) G . . . . . . . . . . . . . . . . . . . . . . . . . . . . . . . . . . . . . . . . . . . . . . . . . . . . . . . . . . . . . . . . . . . 9.50
(b) State Per Claim Accident Limitation . . . . . . . . . . . . . . . . . . . . . . . . . . . . . . . . . . . . . . . . $238,000
(c) State Multiple Claim Accident Limitation . . . . . . . . . . . . . . . . . . . . . . . . . . . . . . . . . . . . . . . . $476,000
(d) USL&HW Per Claim Accident Limitation . . . . . . . . . . . . . . . . . . . . . . . . . . . . . . . . . . . . . . . . $492,000
(e) USL&HW Multiple Claim Accident Limitation . . . . . . . . . . . . . . . . . . . . . . . . . . . . . . . . . . . . . $984,000
(f) Employers Liability Accident Limitation . . . . . . . . . . . . . . . . . . . . . . . . . . . . . . . . . . . . . . . . $55,000
(g) Primary/Excess Loss Split Point . . . . . . . . . . . . . . . . . . . . . . . . . . . . . . . . . . . . . . . . . . . . . . $10,000
(h) USL&HW Act -- Expected Loss Factor -- Non-F Classes . . . . . . . . . . . . . . . . . . . . . . . . . . . . 1.89
(Multiply a Non-F classification ELR by the USL&HW Act - Expected Loss Factor of 1.89.)
© Copyright 2012 National Council on Compensation Insurance, Inc. All Rights Reserved. 7/12
Page 27 of 49
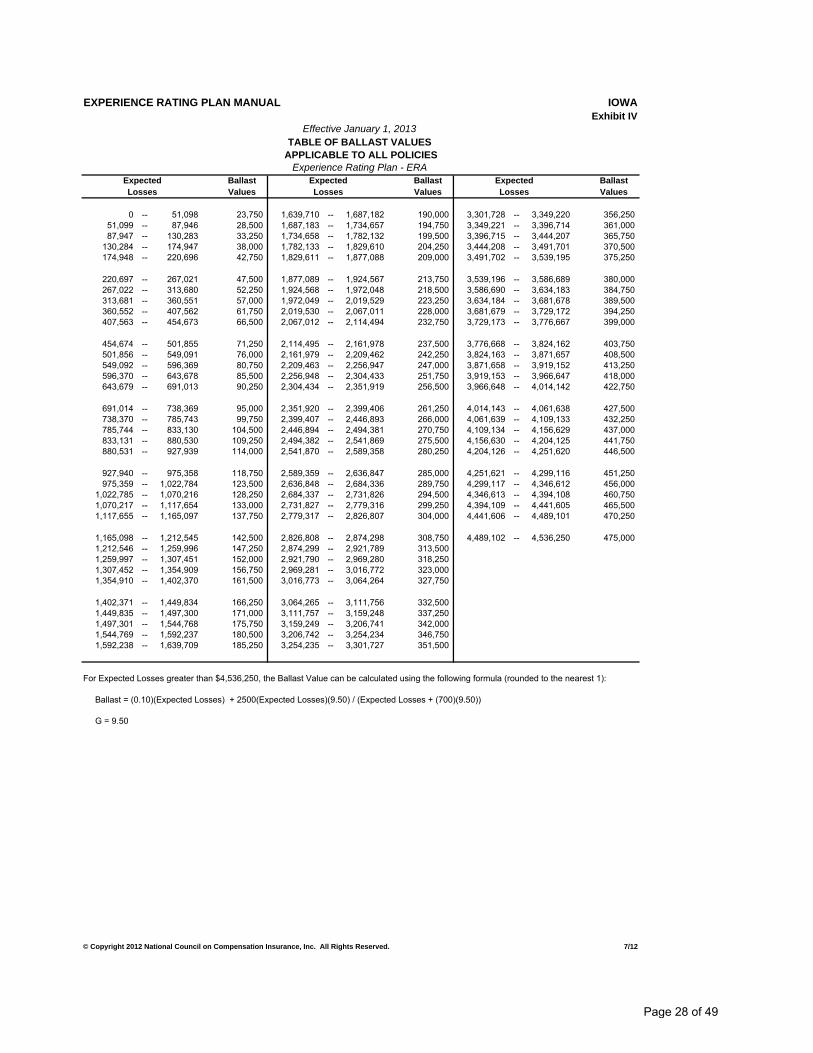
EXPERIENCE RATING PLAN MANUAL IOWA
Exhibit IV
Effective January 1, 2013
TABLE OF BALLAST VALUES
APPLICABLE TO ALL POLICIES
Experience Rating Plan - ERAExpected Ballast Expected Ballast Expected Ballast
Losses Values Losses Values Losses Values
0 -- 51,098 23,750 1,639,710 -- 1,687,182 190,000 3,301,728 -- 3,349,220 356,250
51,099 -- 87,946 28,500 1,687,183 -- 1,734,657 194,750 3,349,221 -- 3,396,714 361,000
87,947 -- 130,283 33,250 1,734,658 -- 1,782,132 199,500 3,396,715 -- 3,444,207 365,750
130,284 -- 174,947 38,000 1,782,133 -- 1,829,610 204,250 3,444,208 -- 3,491,701 370,500
174,948 -- 220,696 42,750 1,829,611 -- 1,877,088 209,000 3,491,702 -- 3,539,195 375,250
220,697 -- 267,021 47,500 1,877,089 -- 1,924,567 213,750 3,539,196 -- 3,586,689 380,000
267,022 -- 313,680 52,250 1,924,568 -- 1,972,048 218,500 3,586,690 -- 3,634,183 384,750
313,681 -- 360,551 57,000 1,972,049 -- 2,019,529 223,250 3,634,184 -- 3,681,678 389,500
360,552 -- 407,562 61,750 2,019,530 -- 2,067,011 228,000 3,681,679 -- 3,729,172 394,250
407,563 -- 454,673 66,500 2,067,012 -- 2,114,494 232,750 3,729,173 -- 3,776,667 399,000
454,674 -- 501,855 71,250 2,114,495 -- 2,161,978 237,500 3,776,668 -- 3,824,162 403,750
501,856 -- 549,091 76,000 2,161,979 -- 2,209,462 242,250 3,824,163 -- 3,871,657 408,500
549,092 -- 596,369 80,750 2,209,463 -- 2,256,947 247,000 3,871,658 -- 3,919,152 413,250
596,370 -- 643,678 85,500 2,256,948 -- 2,304,433 251,750 3,919,153 -- 3,966,647 418,000
643,679 -- 691,013 90,250 2,304,434 -- 2,351,919 256,500 3,966,648 -- 4,014,142 422,750
691,014 -- 738,369 95,000 2,351,920 -- 2,399,406 261,250 4,014,143 -- 4,061,638 427,500
738,370 -- 785,743 99,750 2,399,407 -- 2,446,893 266,000 4,061,639 -- 4,109,133 432,250
785,744 -- 833,130 104,500 2,446,894 -- 2,494,381 270,750 4,109,134 -- 4,156,629 437,000
833,131 -- 880,530 109,250 2,494,382 -- 2,541,869 275,500 4,156,630 -- 4,204,125 441,750
880,531 -- 927,939 114,000 2,541,870 -- 2,589,358 280,250 4,204,126 -- 4,251,620 446,500
927,940 -- 975,358 118,750 2,589,359 -- 2,636,847 285,000 4,251,621 -- 4,299,116 451,250
975,359 -- 1,022,784 123,500 2,636,848 -- 2,684,336 289,750 4,299,117 -- 4,346,612 456,000
1,022,785 -- 1,070,216 128,250 2,684,337 -- 2,731,826 294,500 4,346,613 -- 4,394,108 460,750
1,070,217 -- 1,117,654 133,000 2,731,827 -- 2,779,316 299,250 4,394,109 -- 4,441,605 465,500
1,117,655 -- 1,165,097 137,750 2,779,317 -- 2,826,807 304,000 4,441,606 -- 4,489,101 470,250
1,165,098 -- 1,212,545 142,500 2,826,808 -- 2,874,298 308,750 4,489,102 -- 4,536,250 475,000
1,212,546 -- 1,259,996 147,250 2,874,299 -- 2,921,789 313,500
1,259,997 -- 1,307,451 152,000 2,921,790 -- 2,969,280 318,250
1,307,452 -- 1,354,909 156,750 2,969,281 -- 3,016,772 323,000
1,354,910 -- 1,402,370 161,500 3,016,773 -- 3,064,264 327,750
1,402,371 -- 1,449,834 166,250 3,064,265 -- 3,111,756 332,500
1,449,835 -- 1,497,300 171,000 3,111,757 -- 3,159,248 337,250
1,497,301 -- 1,544,768 175,750 3,159,249 -- 3,206,741 342,000
1,544,769 -- 1,592,237 180,500 3,206,742 -- 3,254,234 346,750
1,592,238 -- 1,639,709 185,250 3,254,235 -- 3,301,727 351,500
For Expected Losses greater than $4,536,250, the Ballast Value can be calculated using the following formula (rounded to the nearest 1):
Ballast = (0.10)(Expected Losses) + 2500(Expected Losses)(9.50) / (Expected Losses + (700)(9.50))
G = 9.50
© Copyright 2012 National Council on Compensation Insurance, Inc. All Rights Reserved. 7/12
Page 28 of 49
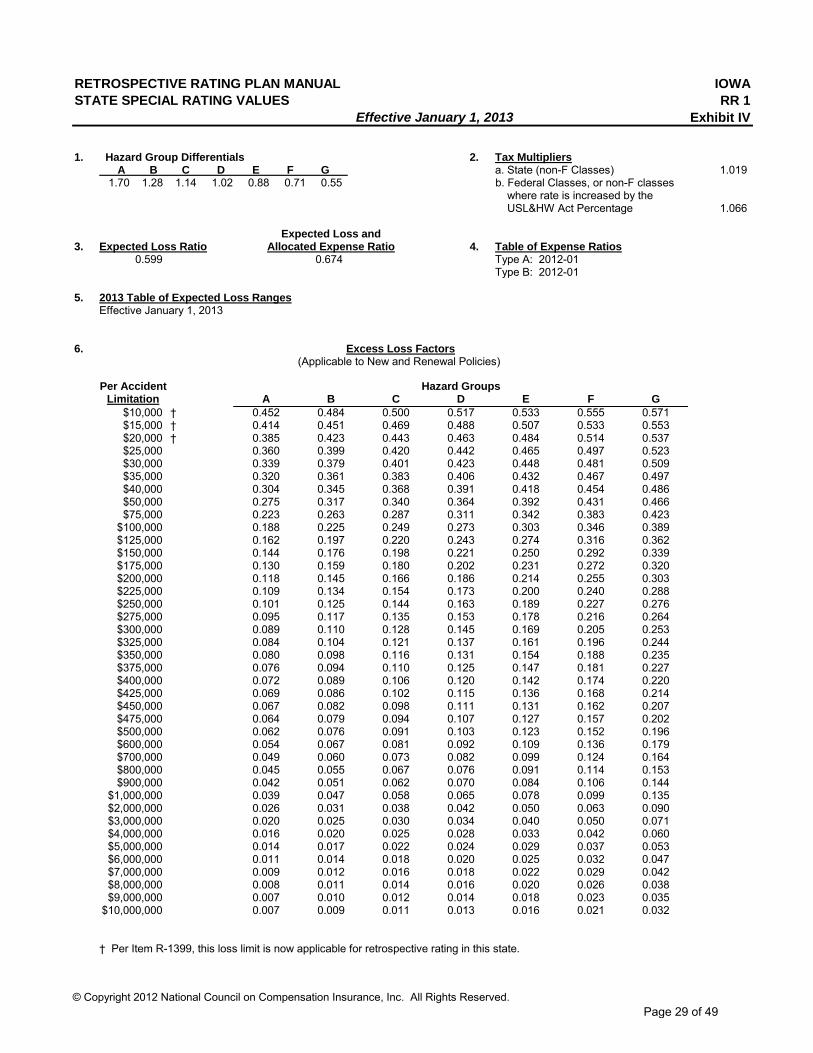
RETROSPECTIVE RATING PLAN MANUAL IOWA
STATE SPECIAL RATING VALUES RR 1
Effective January 1, 2013 Exhibit IV
1. Hazard Group Differentials 2. Tax Multipliers A B C D E F G a. State (non-F Classes) 1.019 1.70 1.28 1.14 1.02 0.88 0.71 0.55 b. Federal Classes, or non-F classes
where rate is increased by the USL&HW Act Percentage 1.066
Expected Loss and3. Expected Loss Ratio Allocated Expense Ratio 4. Table of Expense Ratios
0.599 0.674 Type A: 2012-01Type B: 2012-01
5. 2013 Table of Expected Loss RangesEffective January 1, 2013
6. Excess Loss Factors (Applicable to New and Renewal Policies)
Per Accident Hazard GroupsLimitation A B C D E F G
$10,000 † 0.452 0.484 0.500 0.517 0.533 0.555 0.571$15,000 † 0.414 0.451 0.469 0.488 0.507 0.533 0.553$20,000 † 0.385 0.423 0.443 0.463 0.484 0.514 0.537$25,000 0.360 0.399 0.420 0.442 0.465 0.497 0.523$30,000 0.339 0.379 0.401 0.423 0.448 0.481 0.509$35,000 0.320 0.361 0.383 0.406 0.432 0.467 0.497$40,000 0.304 0.345 0.368 0.391 0.418 0.454 0.486$50,000 0.275 0.317 0.340 0.364 0.392 0.431 0.466$75,000 0.223 0.263 0.287 0.311 0.342 0.383 0.423
$100,000 0.188 0.225 0.249 0.273 0.303 0.346 0.389$125,000 0.162 0.197 0.220 0.243 0.274 0.316 0.362$150,000 0.144 0.176 0.198 0.221 0.250 0.292 0.339$175,000 0.130 0.159 0.180 0.202 0.231 0.272 0.320$200,000 0.118 0.145 0.166 0.186 0.214 0.255 0.303$225,000 0.109 0.134 0.154 0.173 0.200 0.240 0.288$250,000 0.101 0.125 0.144 0.163 0.189 0.227 0.276$275,000 0.095 0.117 0.135 0.153 0.178 0.216 0.264$300,000 0.089 0.110 0.128 0.145 0.169 0.205 0.253$325,000 0.084 0.104 0.121 0.137 0.161 0.196 0.244$350,000 0.080 0.098 0.116 0.131 0.154 0.188 0.235$375,000 0.076 0.094 0.110 0.125 0.147 0.181 0.227$400,000 0.072 0.089 0.106 0.120 0.142 0.174 0.220$425,000 0.069 0.086 0.102 0.115 0.136 0.168 0.214$450,000 0.067 0.082 0.098 0.111 0.131 0.162 0.207$475,000 0.064 0.079 0.094 0.107 0.127 0.157 0.202$500,000 0.062 0.076 0.091 0.103 0.123 0.152 0.196$600,000 0.054 0.067 0.081 0.092 0.109 0.136 0.179$700,000 0.049 0.060 0.073 0.082 0.099 0.124 0.164$800,000 0.045 0.055 0.067 0.076 0.091 0.114 0.153$900,000 0.042 0.051 0.062 0.070 0.084 0.106 0.144
$1,000,000 0.039 0.047 0.058 0.065 0.078 0.099 0.135$2,000,000 0.026 0.031 0.038 0.042 0.050 0.063 0.090$3,000,000 0.020 0.025 0.030 0.034 0.040 0.050 0.071$4,000,000 0.016 0.020 0.025 0.028 0.033 0.042 0.060$5,000,000 0.014 0.017 0.022 0.024 0.029 0.037 0.053$6,000,000 0.011 0.014 0.018 0.020 0.025 0.032 0.047$7,000,000 0.009 0.012 0.016 0.018 0.022 0.029 0.042$8,000,000 0.008 0.011 0.014 0.016 0.020 0.026 0.038$9,000,000 0.007 0.010 0.012 0.014 0.018 0.023 0.035
$10,000,000 0.007 0.009 0.011 0.013 0.016 0.021 0.032
† Per Item R-1399, this loss limit is now applicable for retrospective rating in this state.
© Copyright 2012 National Council on Compensation Insurance, Inc. All Rights Reserved.
Page 29 of 49
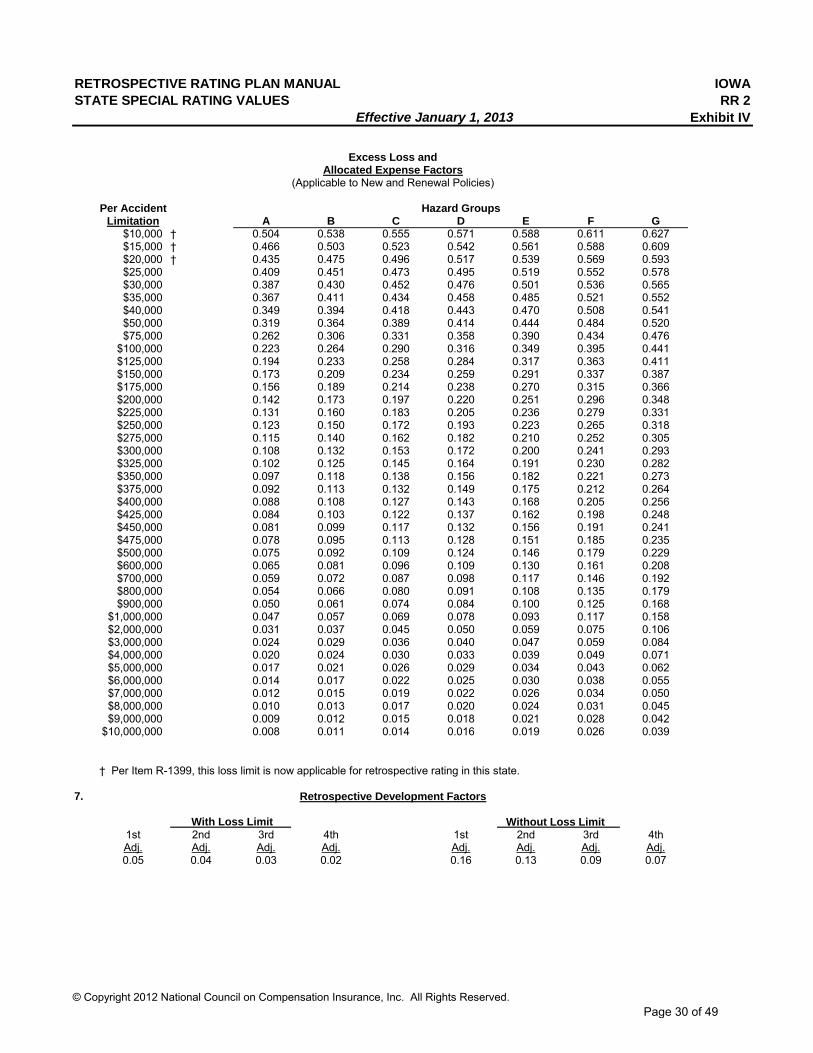
RETROSPECTIVE RATING PLAN MANUAL IOWA
STATE SPECIAL RATING VALUES RR 2
Effective January 1, 2013 Exhibit IV
Excess Loss andAllocated Expense Factors
(Applicable to New and Renewal Policies)
Per Accident Hazard GroupsLimitation A B C D E F G
$10,000 † 0.504 0.538 0.555 0.571 0.588 0.611 0.627$15,000 † 0.466 0.503 0.523 0.542 0.561 0.588 0.609$20,000 † 0.435 0.475 0.496 0.517 0.539 0.569 0.593$25,000 0.409 0.451 0.473 0.495 0.519 0.552 0.578$30,000 0.387 0.430 0.452 0.476 0.501 0.536 0.565$35,000 0.367 0.411 0.434 0.458 0.485 0.521 0.552$40,000 0.349 0.394 0.418 0.443 0.470 0.508 0.541$50,000 0.319 0.364 0.389 0.414 0.444 0.484 0.520$75,000 0.262 0.306 0.331 0.358 0.390 0.434 0.476
$100,000 0.223 0.264 0.290 0.316 0.349 0.395 0.441$125,000 0.194 0.233 0.258 0.284 0.317 0.363 0.411$150,000 0.173 0.209 0.234 0.259 0.291 0.337 0.387$175,000 0.156 0.189 0.214 0.238 0.270 0.315 0.366$200,000 0.142 0.173 0.197 0.220 0.251 0.296 0.348$225,000 0.131 0.160 0.183 0.205 0.236 0.279 0.331$250,000 0.123 0.150 0.172 0.193 0.223 0.265 0.318$275,000 0.115 0.140 0.162 0.182 0.210 0.252 0.305$300,000 0.108 0.132 0.153 0.172 0.200 0.241 0.293$325,000 0.102 0.125 0.145 0.164 0.191 0.230 0.282$350,000 0.097 0.118 0.138 0.156 0.182 0.221 0.273$375,000 0.092 0.113 0.132 0.149 0.175 0.212 0.264$400,000 0.088 0.108 0.127 0.143 0.168 0.205 0.256$425,000 0.084 0.103 0.122 0.137 0.162 0.198 0.248$450,000 0.081 0.099 0.117 0.132 0.156 0.191 0.241$475,000 0.078 0.095 0.113 0.128 0.151 0.185 0.235$500,000 0.075 0.092 0.109 0.124 0.146 0.179 0.229$600,000 0.065 0.081 0.096 0.109 0.130 0.161 0.208$700,000 0.059 0.072 0.087 0.098 0.117 0.146 0.192$800,000 0.054 0.066 0.080 0.091 0.108 0.135 0.179$900,000 0.050 0.061 0.074 0.084 0.100 0.125 0.168
$1,000,000 0.047 0.057 0.069 0.078 0.093 0.117 0.158$2,000,000 0.031 0.037 0.045 0.050 0.059 0.075 0.106$3,000,000 0.024 0.029 0.036 0.040 0.047 0.059 0.084$4,000,000 0.020 0.024 0.030 0.033 0.039 0.049 0.071$5,000,000 0.017 0.021 0.026 0.029 0.034 0.043 0.062$6,000,000 0.014 0.017 0.022 0.025 0.030 0.038 0.055$7,000,000 0.012 0.015 0.019 0.022 0.026 0.034 0.050$8,000,000 0.010 0.013 0.017 0.020 0.024 0.031 0.045$9,000,000 0.009 0.012 0.015 0.018 0.021 0.028 0.042
$10,000,000 0.008 0.011 0.014 0.016 0.019 0.026 0.039
† Per Item R-1399, this loss limit is now applicable for retrospective rating in this state.
7.
With Loss Limit Without Loss Limit 1st 2nd 3rd 4th 1st 2nd 3rd 4thAdj. Adj. Adj. Adj. Adj. Adj. Adj. Adj.0.05 0.04 0.03 0.02 0.16 0.13 0.09 0.07
Retrospective Development Factors
© Copyright 2012 National Council on Compensation Insurance, Inc. All Rights Reserved.
Page 30 of 49
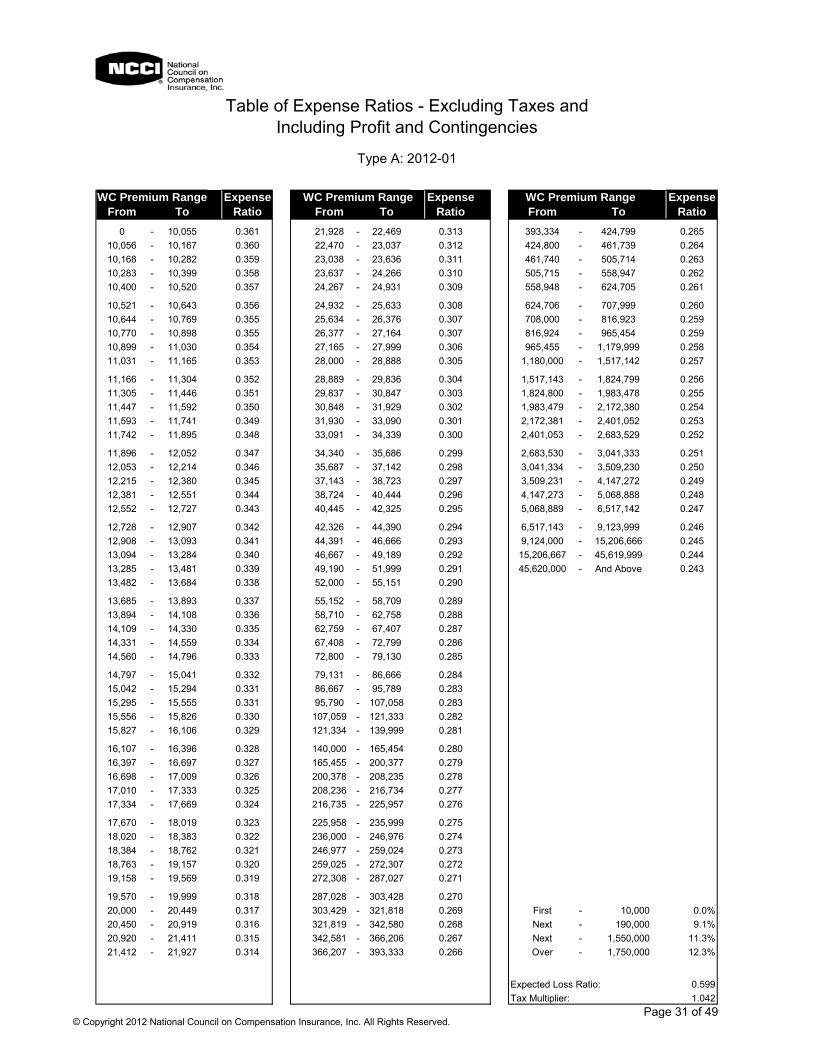
Table of Expense Ratios - Excluding Taxes and
Including Profit and Contingencies
Type A: 2012-01
WC Premium Range Expense WC Premium Range Expense WC Premium Range Expense
From To Ratio From To Ratio From To Ratio
0 - 10,055 0.361 21,928 - 22,469 0.313 393,334 - 424,799 0.265
10,056 - 10,167 0.360 22,470 - 23,037 0.312 424,800 - 461,739 0.264
10,168 - 10,282 0.359 23,038 - 23,636 0.311 461,740 - 505,714 0.263
10,283 - 10,399 0.358 23,637 - 24,266 0.310 505,715 - 558,947 0.262
10,400 - 10,520 0.357 24,267 - 24,931 0.309 558,948 - 624,705 0.261
10,521 - 10,643 0.356 24,932 - 25,633 0.308 624,706 - 707,999 0.260
10,644 - 10,769 0.355 25,634 - 26,376 0.307 708,000 - 816,923 0.259
10,770 - 10,898 0.355 26,377 - 27,164 0.307 816,924 - 965,454 0.259
10,899 - 11,030 0.354 27,165 - 27,999 0.306 965,455 - 1,179,999 0.258
11,031 - 11,165 0.353 28,000 - 28,888 0.305 1,180,000 - 1,517,142 0.257
11,166 - 11,304 0.352 28,889 - 29,836 0.304 1,517,143 - 1,824,799 0.256
11,305 - 11,446 0.351 29,837 - 30,847 0.303 1,824,800 - 1,983,478 0.255
11,447 - 11,592 0.350 30,848 - 31,929 0.302 1,983,479 - 2,172,380 0.254
11,593 - 11,741 0.349 31,930 - 33,090 0.301 2,172,381 - 2,401,052 0.253
11,742 - 11,895 0.348 33,091 - 34,339 0.300 2,401,053 - 2,683,529 0.252
11,896 - 12,052 0.347 34,340 - 35,686 0.299 2,683,530 - 3,041,333 0.251
12,053 - 12,214 0.346 35,687 - 37,142 0.298 3,041,334 - 3,509,230 0.250
12,215 - 12,380 0.345 37,143 - 38,723 0.297 3,509,231 - 4,147,272 0.249
12,381 - 12,551 0.344 38,724 - 40,444 0.296 4,147,273 - 5,068,888 0.248
12,552 - 12,727 0.343 40,445 - 42,325 0.295 5,068,889 - 6,517,142 0.247
12,728 - 12,907 0.342 42,326 - 44,390 0.294 6,517,143 - 9,123,999 0.246
12,908 - 13,093 0.341 44,391 - 46,666 0.293 9,124,000 - 15,206,666 0.245
13,094 - 13,284 0.340 46,667 - 49,189 0.292 15,206,667 - 45,619,999 0.244
13,285 - 13,481 0.339 49,190 - 51,999 0.291 45,620,000 - And Above 0.243
13,482 - 13,684 0.338 52,000 - 55,151 0.290
13,685 - 13,893 0.337 55,152 - 58,709 0.289
13,894 - 14,108 0.336 58,710 - 62,758 0.288
14,109 - 14,330 0.335 62,759 - 67,407 0.287
14,331 - 14,559 0.334 67,408 - 72,799 0.286
14,560 - 14,796 0.333 72,800 - 79,130 0.285
14,797 - 15,041 0.332 79,131 - 86,666 0.284
15,042 - 15,294 0.331 86,667 - 95,789 0.283
15,295 - 15,555 0.331 95,790 - 107,058 0.283
15,556 - 15,826 0.330 107,059 - 121,333 0.282
15,827 - 16,106 0.329 121,334 - 139,999 0.281
16,107 - 16,396 0.328 140,000 - 165,454 0.280
16,397 - 16,697 0.327 165,455 - 200,377 0.279
16,698 - 17,009 0.326 200,378 - 208,235 0.278
17,010 - 17,333 0.325 208,236 - 216,734 0.277
17,334 - 17,669 0.324 216,735 - 225,957 0.276
17,670 - 18,019 0.323 225,958 - 235,999 0.275
18,020 - 18,383 0.322 236,000 - 246,976 0.274
18,384 - 18,762 0.321 246,977 - 259,024 0.273
18,763 - 19,157 0.320 259,025 - 272,307 0.272
19,158 - 19,569 0.319 272,308 - 287,027 0.271
19,570 - 19,999 0.318 287,028 - 303,428 0.270
20,000 - 20,449 0.317 303,429 - 321,818 0.269 First - 10,000 0.0%
20,450 - 20,919 0.316 321,819 - 342,580 0.268 Next - 190,000 9.1%
20,920 - 21,411 0.315 342,581 - 366,206 0.267 Next - 1,550,000 11.3%
21,412 - 21,927 0.314 366,207 - 393,333 0.266 Over - 1,750,000 12.3%
Expected Loss Ratio: 0.599
Tax Multiplier: 1.042
© Copyright 2012 National Council on Compensation Insurance, Inc. All Rights Reserved.Page 31 of 49
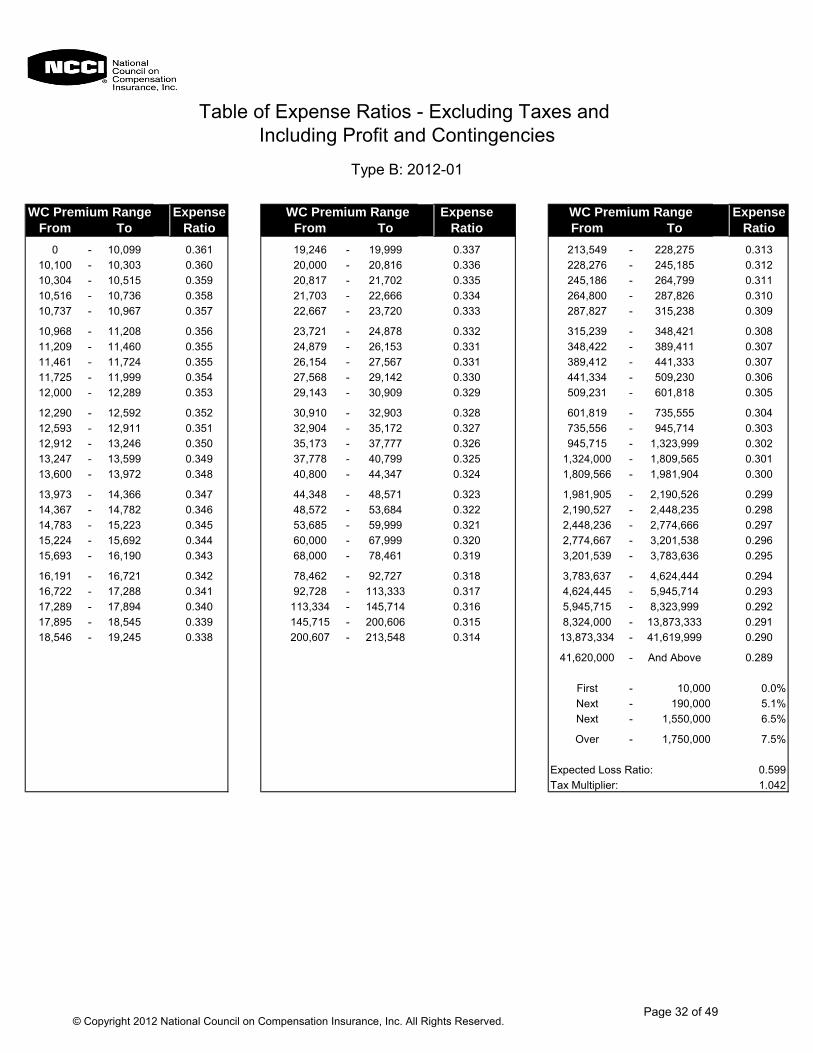
Table of Expense Ratios - Excluding Taxes and
Including Profit and Contingencies
Type B: 2012-01
WC Premium Range Expense WC Premium Range Expense WC Premium Range Expense
From To Ratio From To Ratio From To Ratio
0 - 10,099 0.361 19,246 - 19,999 0.337 213,549 - 228,275 0.313
10,100 - 10,303 0.360 20,000 - 20,816 0.336 228,276 - 245,185 0.312
10,304 - 10,515 0.359 20,817 - 21,702 0.335 245,186 - 264,799 0.311
10,516 - 10,736 0.358 21,703 - 22,666 0.334 264,800 - 287,826 0.310
10,737 - 10,967 0.357 22,667 - 23,720 0.333 287,827 - 315,238 0.309
10,968 - 11,208 0.356 23,721 - 24,878 0.332 315,239 - 348,421 0.308
11,209 - 11,460 0.355 24,879 - 26,153 0.331 348,422 - 389,411 0.307
11,461 - 11,724 0.355 26,154 - 27,567 0.331 389,412 - 441,333 0.307
11,725 - 11,999 0.354 27,568 - 29,142 0.330 441,334 - 509,230 0.306
12,000 - 12,289 0.353 29,143 - 30,909 0.329 509,231 - 601,818 0.305
12,290 - 12,592 0.352 30,910 - 32,903 0.328 601,819 - 735,555 0.304
12,593 - 12,911 0.351 32,904 - 35,172 0.327 735,556 - 945,714 0.303
12,912 - 13,246 0.350 35,173 - 37,777 0.326 945,715 - 1,323,999 0.302
13,247 - 13,599 0.349 37,778 - 40,799 0.325 1,324,000 - 1,809,565 0.301
13,600 - 13,972 0.348 40,800 - 44,347 0.324 1,809,566 - 1,981,904 0.300
13,973 - 14,366 0.347 44,348 - 48,571 0.323 1,981,905 - 2,190,526 0.299
14,367 - 14,782 0.346 48,572 - 53,684 0.322 2,190,527 - 2,448,235 0.298
14,783 - 15,223 0.345 53,685 - 59,999 0.321 2,448,236 - 2,774,666 0.297
15,224 - 15,692 0.344 60,000 - 67,999 0.320 2,774,667 - 3,201,538 0.296
15,693 - 16,190 0.343 68,000 - 78,461 0.319 3,201,539 - 3,783,636 0.295
16,191 - 16,721 0.342 78,462 - 92,727 0.318 3,783,637 - 4,624,444 0.294
16,722 - 17,288 0.341 92,728 - 113,333 0.317 4,624,445 - 5,945,714 0.293
17,289 - 17,894 0.340 113,334 - 145,714 0.316 5,945,715 - 8,323,999 0.292
17,895 - 18,545 0.339 145,715 - 200,606 0.315 8,324,000 - 13,873,333 0.291
18,546 - 19,245 0.338 200,607 - 213,548 0.314 13,873,334 - 41,619,999 0.290
41,620,000 - And Above 0.289
First - 10,000 0.0%
Next - 190,000 5.1%
Next - 1,550,000 6.5%
Over - 1,750,000 7.5%
Expected Loss Ratio: 0.599
Tax Multiplier: 1.042
© Copyright 2012 National Council on Compensation Insurance, Inc. All Rights Reserved.Page 32 of 49
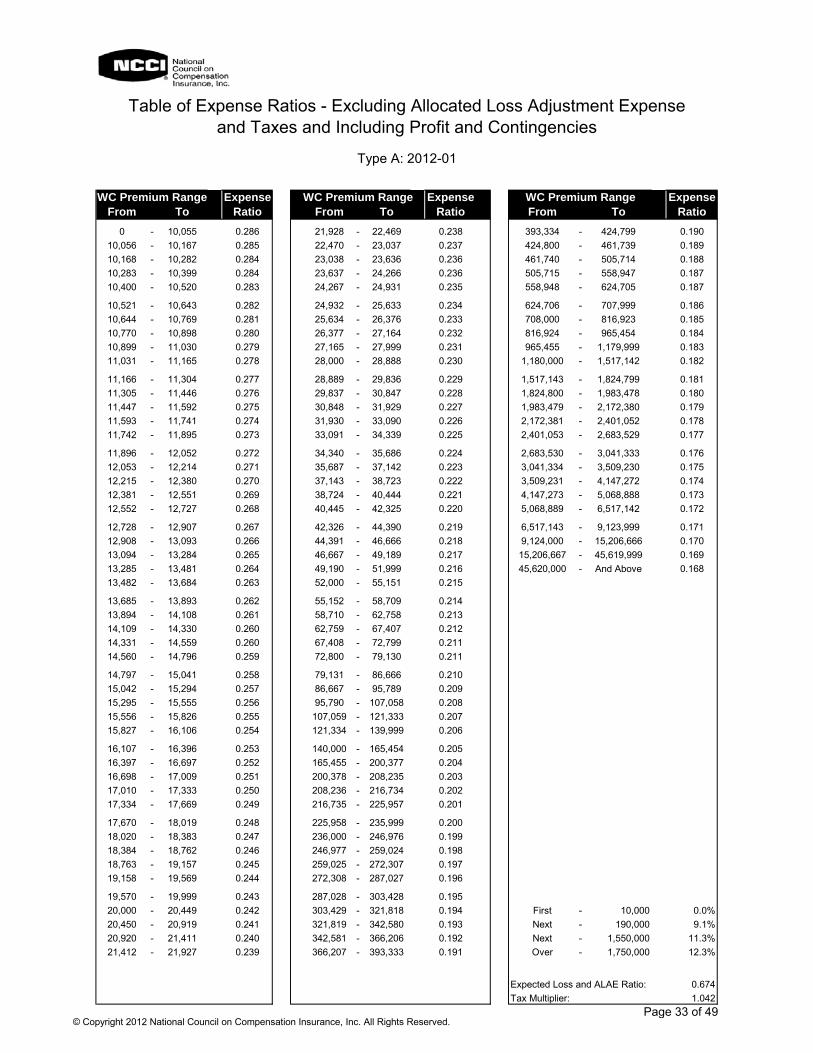
Table of Expense Ratios - Excluding Allocated Loss Adjustment Expense
and Taxes and Including Profit and Contingencies
Type A: 2012-01
WC Premium Range Expense WC Premium Range Expense WC Premium Range Expense
From To Ratio From To Ratio From To Ratio
0 - 10,055 0.286 21,928 - 22,469 0.238 393,334 - 424,799 0.190
10,056 - 10,167 0.285 22,470 - 23,037 0.237 424,800 - 461,739 0.189
10,168 - 10,282 0.284 23,038 - 23,636 0.236 461,740 - 505,714 0.188
10,283 - 10,399 0.284 23,637 - 24,266 0.236 505,715 - 558,947 0.187
10,400 - 10,520 0.283 24,267 - 24,931 0.235 558,948 - 624,705 0.187
10,521 - 10,643 0.282 24,932 - 25,633 0.234 624,706 - 707,999 0.186
10,644 - 10,769 0.281 25,634 - 26,376 0.233 708,000 - 816,923 0.185
10,770 - 10,898 0.280 26,377 - 27,164 0.232 816,924 - 965,454 0.184
10,899 - 11,030 0.279 27,165 - 27,999 0.231 965,455 - 1,179,999 0.183
11,031 - 11,165 0.278 28,000 - 28,888 0.230 1,180,000 - 1,517,142 0.182
11,166 - 11,304 0.277 28,889 - 29,836 0.229 1,517,143 - 1,824,799 0.181
11,305 - 11,446 0.276 29,837 - 30,847 0.228 1,824,800 - 1,983,478 0.180
11,447 - 11,592 0.275 30,848 - 31,929 0.227 1,983,479 - 2,172,380 0.179
11,593 - 11,741 0.274 31,930 - 33,090 0.226 2,172,381 - 2,401,052 0.178
11,742 - 11,895 0.273 33,091 - 34,339 0.225 2,401,053 - 2,683,529 0.177
11,896 - 12,052 0.272 34,340 - 35,686 0.224 2,683,530 - 3,041,333 0.176
12,053 - 12,214 0.271 35,687 - 37,142 0.223 3,041,334 - 3,509,230 0.175
12,215 - 12,380 0.270 37,143 - 38,723 0.222 3,509,231 - 4,147,272 0.174
12,381 - 12,551 0.269 38,724 - 40,444 0.221 4,147,273 - 5,068,888 0.173
12,552 - 12,727 0.268 40,445 - 42,325 0.220 5,068,889 - 6,517,142 0.172
12,728 - 12,907 0.267 42,326 - 44,390 0.219 6,517,143 - 9,123,999 0.171
12,908 - 13,093 0.266 44,391 - 46,666 0.218 9,124,000 - 15,206,666 0.170
13,094 - 13,284 0.265 46,667 - 49,189 0.217 15,206,667 - 45,619,999 0.169
13,285 - 13,481 0.264 49,190 - 51,999 0.216 45,620,000 - And Above 0.168
13,482 - 13,684 0.263 52,000 - 55,151 0.215
13,685 - 13,893 0.262 55,152 - 58,709 0.214
13,894 - 14,108 0.261 58,710 - 62,758 0.213
14,109 - 14,330 0.260 62,759 - 67,407 0.212
14,331 - 14,559 0.260 67,408 - 72,799 0.211
14,560 - 14,796 0.259 72,800 - 79,130 0.211
14,797 - 15,041 0.258 79,131 - 86,666 0.210
15,042 - 15,294 0.257 86,667 - 95,789 0.209
15,295 - 15,555 0.256 95,790 - 107,058 0.208
15,556 - 15,826 0.255 107,059 - 121,333 0.207
15,827 - 16,106 0.254 121,334 - 139,999 0.206
16,107 - 16,396 0.253 140,000 - 165,454 0.205
16,397 - 16,697 0.252 165,455 - 200,377 0.204
16,698 - 17,009 0.251 200,378 - 208,235 0.203
17,010 - 17,333 0.250 208,236 - 216,734 0.202
17,334 - 17,669 0.249 216,735 - 225,957 0.201
17,670 - 18,019 0.248 225,958 - 235,999 0.200
18,020 - 18,383 0.247 236,000 - 246,976 0.199
18,384 - 18,762 0.246 246,977 - 259,024 0.198
18,763 - 19,157 0.245 259,025 - 272,307 0.197
19,158 - 19,569 0.244 272,308 - 287,027 0.196
19,570 - 19,999 0.243 287,028 - 303,428 0.195
20,000 - 20,449 0.242 303,429 - 321,818 0.194 First - 10,000 0.0%
20,450 - 20,919 0.241 321,819 - 342,580 0.193 Next - 190,000 9.1%
20,920 - 21,411 0.240 342,581 - 366,206 0.192 Next - 1,550,000 11.3%
21,412 - 21,927 0.239 366,207 - 393,333 0.191 Over - 1,750,000 12.3%
Expected Loss and ALAE Ratio: 0.674
Tax Multiplier: 1.042
© Copyright 2012 National Council on Compensation Insurance, Inc. All Rights Reserved.Page 33 of 49
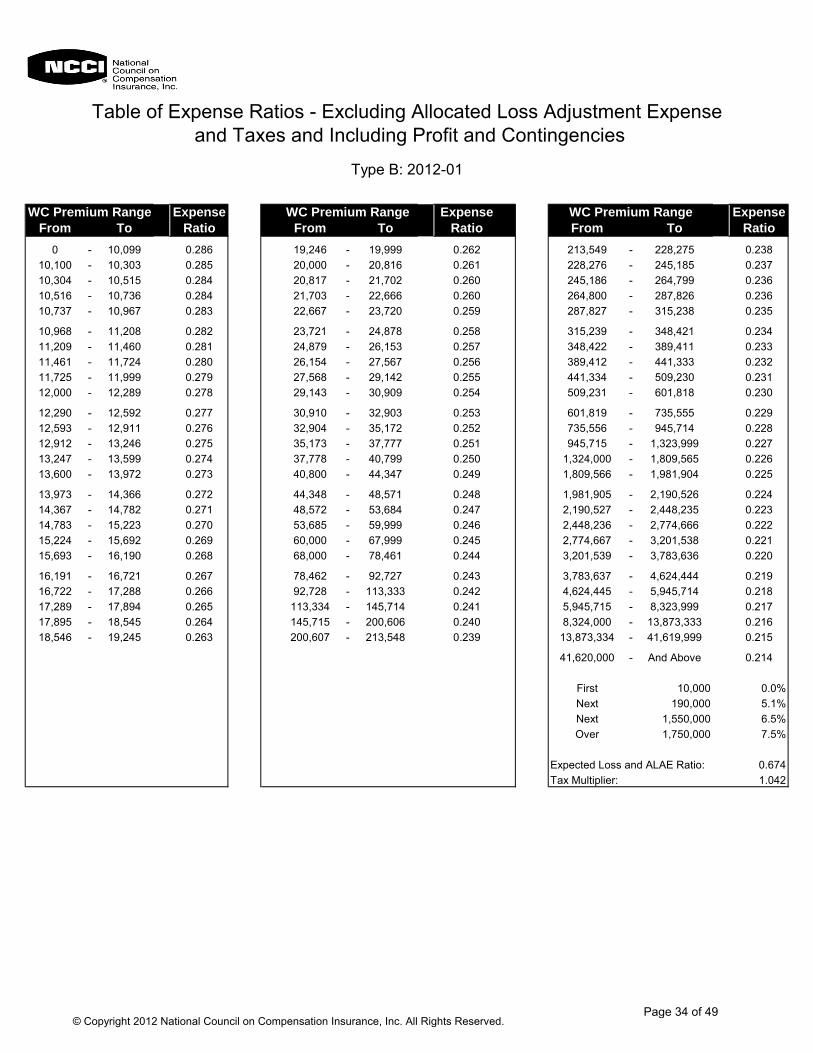
Table of Expense Ratios - Excluding Allocated Loss Adjustment Expense
and Taxes and Including Profit and Contingencies
Type B: 2012-01
WC Premium Range Expense WC Premium Range Expense WC Premium Range Expense
From To Ratio From To Ratio From To Ratio
0 - 10,099 0.286 19,246 - 19,999 0.262 213,549 - 228,275 0.238
10,100 - 10,303 0.285 20,000 - 20,816 0.261 228,276 - 245,185 0.237
10,304 - 10,515 0.284 20,817 - 21,702 0.260 245,186 - 264,799 0.236
10,516 - 10,736 0.284 21,703 - 22,666 0.260 264,800 - 287,826 0.236
10,737 - 10,967 0.283 22,667 - 23,720 0.259 287,827 - 315,238 0.235
10,968 - 11,208 0.282 23,721 - 24,878 0.258 315,239 - 348,421 0.234
11,209 - 11,460 0.281 24,879 - 26,153 0.257 348,422 - 389,411 0.233
11,461 - 11,724 0.280 26,154 - 27,567 0.256 389,412 - 441,333 0.232
11,725 - 11,999 0.279 27,568 - 29,142 0.255 441,334 - 509,230 0.231
12,000 - 12,289 0.278 29,143 - 30,909 0.254 509,231 - 601,818 0.230
12,290 - 12,592 0.277 30,910 - 32,903 0.253 601,819 - 735,555 0.229
12,593 - 12,911 0.276 32,904 - 35,172 0.252 735,556 - 945,714 0.228
12,912 - 13,246 0.275 35,173 - 37,777 0.251 945,715 - 1,323,999 0.227
13,247 - 13,599 0.274 37,778 - 40,799 0.250 1,324,000 - 1,809,565 0.226
13,600 - 13,972 0.273 40,800 - 44,347 0.249 1,809,566 - 1,981,904 0.225
13,973 - 14,366 0.272 44,348 - 48,571 0.248 1,981,905 - 2,190,526 0.224
14,367 - 14,782 0.271 48,572 - 53,684 0.247 2,190,527 - 2,448,235 0.223
14,783 - 15,223 0.270 53,685 - 59,999 0.246 2,448,236 - 2,774,666 0.222
15,224 - 15,692 0.269 60,000 - 67,999 0.245 2,774,667 - 3,201,538 0.221
15,693 - 16,190 0.268 68,000 - 78,461 0.244 3,201,539 - 3,783,636 0.220
16,191 - 16,721 0.267 78,462 - 92,727 0.243 3,783,637 - 4,624,444 0.219
16,722 - 17,288 0.266 92,728 - 113,333 0.242 4,624,445 - 5,945,714 0.218
17,289 - 17,894 0.265 113,334 - 145,714 0.241 5,945,715 - 8,323,999 0.217
17,895 - 18,545 0.264 145,715 - 200,606 0.240 8,324,000 - 13,873,333 0.216
18,546 - 19,245 0.263 200,607 - 213,548 0.239 13,873,334 - 41,619,999 0.215
41,620,000 - And Above 0.214
First 10,000 0.0%
Next 190,000 5.1%
Next 1,550,000 6.5%
Over 1,750,000 7.5%
Expected Loss and ALAE Ratio: 0.674
Tax Multiplier: 1.042
© Copyright 2012 National Council on Compensation Insurance, Inc. All Rights Reserved.Page 34 of 49
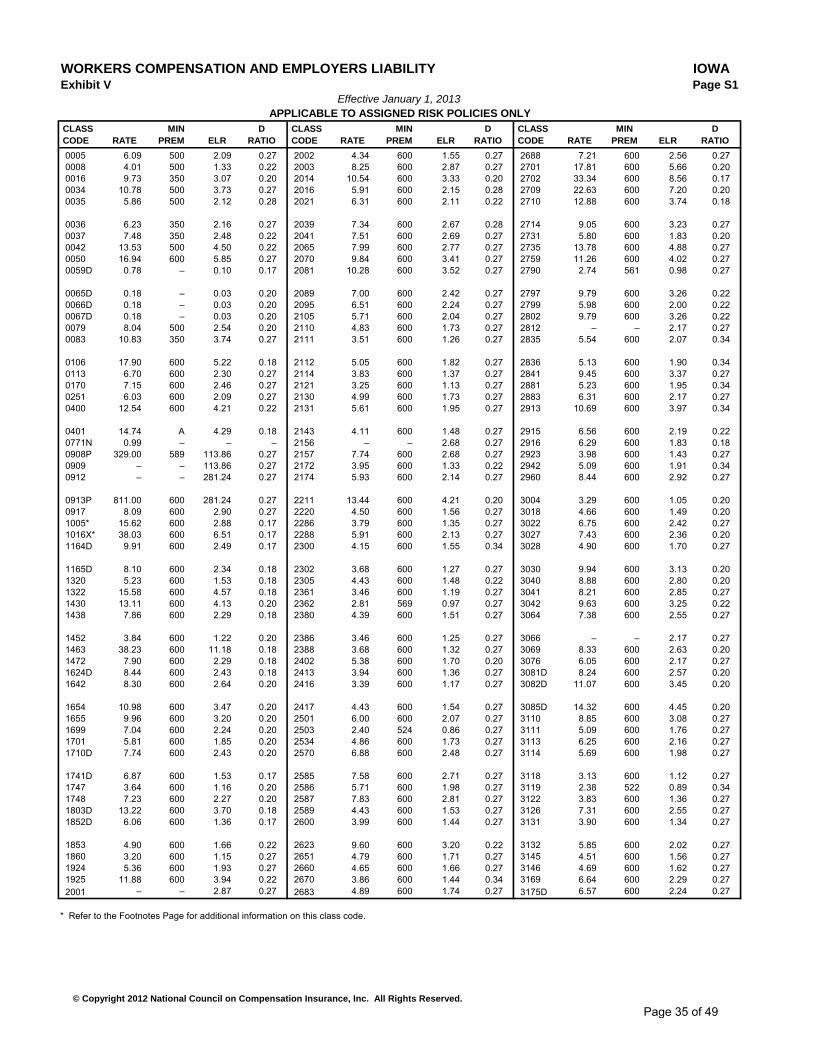
WORKERS COMPENSATION AND EMPLOYERS LIABILITY IOWAExhibit V Page S1
Effective January 1, 2013APPLICABLE TO ASSIGNED RISK POLICIES ONLY
CLASS MIN D CLASS MIN D CLASS MIN D
CODE RATE PREM ELR RATIO CODE RATE PREM ELR RATIO CODE RATE PREM ELR RATIO
0005 6.09 500 2.09 0.27 2002 4.34 600 1.55 0.27 2688 7.21 600 2.56 0.27
0008 4.01 500 1.33 0.22 2003 8.25 600 2.87 0.27 2701 17.81 600 5.66 0.20
0016 9.73 350 3.07 0.20 2014 10.54 600 3.33 0.20 2702 33.34 600 8.56 0.17
0034 10.78 500 3.73 0.27 2016 5.91 600 2.15 0.28 2709 22.63 600 7.20 0.20
0035 5.86 500 2.12 0.28 2021 6.31 600 2.11 0.22 2710 12.88 600 3.74 0.18
0036 6.23 350 2.16 0.27 2039 7.34 600 2.67 0.28 2714 9.05 600 3.23 0.27
0037 7.48 350 2.48 0.22 2041 7.51 600 2.69 0.27 2731 5.80 600 1.83 0.20
0042 13.53 500 4.50 0.22 2065 7.99 600 2.77 0.27 2735 13.78 600 4.88 0.27
0050 16.94 600 5.85 0.27 2070 9.84 600 3.41 0.27 2759 11.26 600 4.02 0.27
0059D 0.78 – 0.10 0.17 2081 10.28 600 3.52 0.27 2790 2.74 561 0.98 0.27
0065D 0.18 – 0.03 0.20 2089 7.00 600 2.42 0.27 2797 9.79 600 3.26 0.22
0066D 0.18 – 0.03 0.20 2095 6.51 600 2.24 0.27 2799 5.98 600 2.00 0.22
0067D 0.18 – 0.03 0.20 2105 5.71 600 2.04 0.27 2802 9.79 600 3.26 0.22
0079 8.04 500 2.54 0.20 2110 4.83 600 1.73 0.27 2812 – – 2.17 0.27
0083 10.83 350 3.74 0.27 2111 3.51 600 1.26 0.27 2835 5.54 600 2.07 0.34
0106 17.90 600 5.22 0.18 2112 5.05 600 1.82 0.27 2836 5.13 600 1.90 0.34
0113 6.70 600 2.30 0.27 2114 3.83 600 1.37 0.27 2841 9.45 600 3.37 0.27
0170 7.15 600 2.46 0.27 2121 3.25 600 1.13 0.27 2881 5.23 600 1.95 0.34
0251 6.03 600 2.09 0.27 2130 4.99 600 1.73 0.27 2883 6.31 600 2.17 0.27
0400 12.54 600 4.21 0.22 2131 5.61 600 1.95 0.27 2913 10.69 600 3.97 0.34
0401 14.74 A 4.29 0.18 2143 4.11 600 1.48 0.27 2915 6.56 600 2.19 0.22
0771N 0.99 – – – 2156 – – 2.68 0.27 2916 6.29 600 1.83 0.18
0908P 329.00 589 113.86 0.27 2157 7.74 600 2.68 0.27 2923 3.98 600 1.43 0.27
0909 – – 113.86 0.27 2172 3.95 600 1.33 0.22 2942 5.09 600 1.91 0.34
0912 – – 281.24 0.27 2174 5.93 600 2.14 0.27 2960 8.44 600 2.92 0.27
0913P 811.00 600 281.24 0.27 2211 13.44 600 4.21 0.20 3004 3.29 600 1.05 0.20
0917 8.09 600 2.90 0.27 2220 4.50 600 1.56 0.27 3018 4.66 600 1.49 0.20
1005* 15.62 600 2.88 0.17 2286 3.79 600 1.35 0.27 3022 6.75 600 2.42 0.27
1016X* 38.03 600 6.51 0.17 2288 5.91 600 2.13 0.27 3027 7.43 600 2.36 0.20
1164D 9.91 600 2.49 0.17 2300 4.15 600 1.55 0.34 3028 4.90 600 1.70 0.27
1165D 8.10 600 2.34 0.18 2302 3.68 600 1.27 0.27 3030 9.94 600 3.13 0.20
1320 5.23 600 1.53 0.18 2305 4.43 600 1.48 0.22 3040 8.88 600 2.80 0.20
1322 15.58 600 4.57 0.18 2361 3.46 600 1.19 0.27 3041 8.21 600 2.85 0.27
1430 13.11 600 4.13 0.20 2362 2.81 569 0.97 0.27 3042 9.63 600 3.25 0.22
1438 7.86 600 2.29 0.18 2380 4.39 600 1.51 0.27 3064 7.38 600 2.55 0.27
1452 3.84 600 1.22 0.20 2386 3.46 600 1.25 0.27 3066 – – 2.17 0.27
1463 38.23 600 11.18 0.18 2388 3.68 600 1.32 0.27 3069 8.33 600 2.63 0.20
1472 7.90 600 2.29 0.18 2402 5.38 600 1.70 0.20 3076 6.05 600 2.17 0.27
1624D 8.44 600 2.43 0.18 2413 3.94 600 1.36 0.27 3081D 8.24 600 2.57 0.20
1642 8.30 600 2.64 0.20 2416 3.39 600 1.17 0.27 3082D 11.07 600 3.45 0.20
1654 10.98 600 3.47 0.20 2417 4.43 600 1.54 0.27 3085D 14.32 600 4.45 0.20
1655 9.96 600 3.20 0.20 2501 6.00 600 2.07 0.27 3110 8.85 600 3.08 0.27
1699 7.04 600 2.24 0.20 2503 2.40 524 0.86 0.27 3111 5.09 600 1.76 0.27
1701 5.81 600 1.85 0.20 2534 4.86 600 1.73 0.27 3113 6.25 600 2.16 0.27
1710D 7.74 600 2.43 0.20 2570 6.88 600 2.48 0.27 3114 5.69 600 1.98 0.27
1741D 6.87 600 1.53 0.17 2585 7.58 600 2.71 0.27 3118 3.13 600 1.12 0.27
1747 3.64 600 1.16 0.20 2586 5.71 600 1.98 0.27 3119 2.38 522 0.89 0.34
1748 7.23 600 2.27 0.20 2587 7.83 600 2.81 0.27 3122 3.83 600 1.36 0.27
1803D 13.22 600 3.70 0.18 2589 4.43 600 1.53 0.27 3126 7.31 600 2.55 0.27
1852D 6.06 600 1.36 0.17 2600 3.99 600 1.44 0.27 3131 3.90 600 1.34 0.27
1853 4.90 600 1.66 0.22 2623 9.60 600 3.20 0.22 3132 5.85 600 2.02 0.27
1860 3.20 600 1.15 0.27 2651 4.79 600 1.71 0.27 3145 4.51 600 1.56 0.27
1924 5.36 600 1.93 0.27 2660 4.65 600 1.66 0.27 3146 4.69 600 1.62 0.27
1925 11.88 600 3.94 0.22 2670 3.86 600 1.44 0.34 3169 6.64 600 2.29 0.27
2001 – – 2.87 0.27 2683 4.89 600 1.74 0.27 3175D 6.57 600 2.24 0.27
* Refer to the Footnotes Page for additional information on this class code.
© Copyright 2012 National Council on Compensation Insurance, Inc. All Rights Reserved.
Page 35 of 49
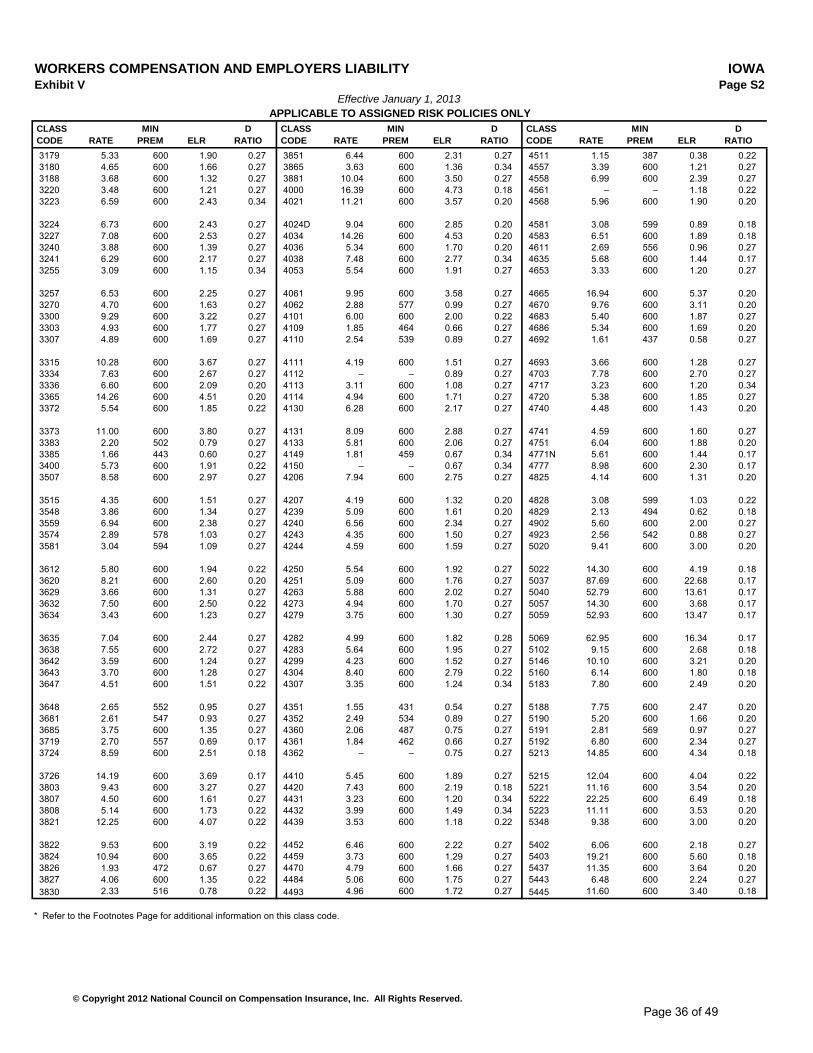
WORKERS COMPENSATION AND EMPLOYERS LIABILITY IOWAExhibit V Page S2
Effective January 1, 2013APPLICABLE TO ASSIGNED RISK POLICIES ONLY
CLASS MIN D CLASS MIN D CLASS MIN D
CODE RATE PREM ELR RATIO CODE RATE PREM ELR RATIO CODE RATE PREM ELR RATIO
3179 5.33 600 1.90 0.27 3851 6.44 600 2.31 0.27 4511 1.15 387 0.38 0.22
3180 4.65 600 1.66 0.27 3865 3.63 600 1.36 0.34 4557 3.39 600 1.21 0.27
3188 3.68 600 1.32 0.27 3881 10.04 600 3.50 0.27 4558 6.99 600 2.39 0.27
3220 3.48 600 1.21 0.27 4000 16.39 600 4.73 0.18 4561 – – 1.18 0.22
3223 6.59 600 2.43 0.34 4021 11.21 600 3.57 0.20 4568 5.96 600 1.90 0.20
3224 6.73 600 2.43 0.27 4024D 9.04 600 2.85 0.20 4581 3.08 599 0.89 0.18
3227 7.08 600 2.53 0.27 4034 14.26 600 4.53 0.20 4583 6.51 600 1.89 0.18
3240 3.88 600 1.39 0.27 4036 5.34 600 1.70 0.20 4611 2.69 556 0.96 0.27
3241 6.29 600 2.17 0.27 4038 7.48 600 2.77 0.34 4635 5.68 600 1.44 0.17
3255 3.09 600 1.15 0.34 4053 5.54 600 1.91 0.27 4653 3.33 600 1.20 0.27
3257 6.53 600 2.25 0.27 4061 9.95 600 3.58 0.27 4665 16.94 600 5.37 0.20
3270 4.70 600 1.63 0.27 4062 2.88 577 0.99 0.27 4670 9.76 600 3.11 0.20
3300 9.29 600 3.22 0.27 4101 6.00 600 2.00 0.22 4683 5.40 600 1.87 0.27
3303 4.93 600 1.77 0.27 4109 1.85 464 0.66 0.27 4686 5.34 600 1.69 0.20
3307 4.89 600 1.69 0.27 4110 2.54 539 0.89 0.27 4692 1.61 437 0.58 0.27
3315 10.28 600 3.67 0.27 4111 4.19 600 1.51 0.27 4693 3.66 600 1.28 0.27
3334 7.63 600 2.67 0.27 4112 – – 0.89 0.27 4703 7.78 600 2.70 0.27
3336 6.60 600 2.09 0.20 4113 3.11 600 1.08 0.27 4717 3.23 600 1.20 0.34
3365 14.26 600 4.51 0.20 4114 4.94 600 1.71 0.27 4720 5.38 600 1.85 0.27
3372 5.54 600 1.85 0.22 4130 6.28 600 2.17 0.27 4740 4.48 600 1.43 0.20
3373 11.00 600 3.80 0.27 4131 8.09 600 2.88 0.27 4741 4.59 600 1.60 0.27
3383 2.20 502 0.79 0.27 4133 5.81 600 2.06 0.27 4751 6.04 600 1.88 0.20
3385 1.66 443 0.60 0.27 4149 1.81 459 0.67 0.34 4771N 5.61 600 1.44 0.17
3400 5.73 600 1.91 0.22 4150 – – 0.67 0.34 4777 8.98 600 2.30 0.17
3507 8.58 600 2.97 0.27 4206 7.94 600 2.75 0.27 4825 4.14 600 1.31 0.20
3515 4.35 600 1.51 0.27 4207 4.19 600 1.32 0.20 4828 3.08 599 1.03 0.22
3548 3.86 600 1.34 0.27 4239 5.09 600 1.61 0.20 4829 2.13 494 0.62 0.18
3559 6.94 600 2.38 0.27 4240 6.56 600 2.34 0.27 4902 5.60 600 2.00 0.27
3574 2.89 578 1.03 0.27 4243 4.35 600 1.50 0.27 4923 2.56 542 0.88 0.27
3581 3.04 594 1.09 0.27 4244 4.59 600 1.59 0.27 5020 9.41 600 3.00 0.20
3612 5.80 600 1.94 0.22 4250 5.54 600 1.92 0.27 5022 14.30 600 4.19 0.18
3620 8.21 600 2.60 0.20 4251 5.09 600 1.76 0.27 5037 87.69 600 22.68 0.17
3629 3.66 600 1.31 0.27 4263 5.88 600 2.02 0.27 5040 52.79 600 13.61 0.17
3632 7.50 600 2.50 0.22 4273 4.94 600 1.70 0.27 5057 14.30 600 3.68 0.17
3634 3.43 600 1.23 0.27 4279 3.75 600 1.30 0.27 5059 52.93 600 13.47 0.17
3635 7.04 600 2.44 0.27 4282 4.99 600 1.82 0.28 5069 62.95 600 16.34 0.17
3638 7.55 600 2.72 0.27 4283 5.64 600 1.95 0.27 5102 9.15 600 2.68 0.18
3642 3.59 600 1.24 0.27 4299 4.23 600 1.52 0.27 5146 10.10 600 3.21 0.20
3643 3.70 600 1.28 0.27 4304 8.40 600 2.79 0.22 5160 6.14 600 1.80 0.18
3647 4.51 600 1.51 0.22 4307 3.35 600 1.24 0.34 5183 7.80 600 2.49 0.20
3648 2.65 552 0.95 0.27 4351 1.55 431 0.54 0.27 5188 7.75 600 2.47 0.20
3681 2.61 547 0.93 0.27 4352 2.49 534 0.89 0.27 5190 5.20 600 1.66 0.20
3685 3.75 600 1.35 0.27 4360 2.06 487 0.75 0.27 5191 2.81 569 0.97 0.27
3719 2.70 557 0.69 0.17 4361 1.84 462 0.66 0.27 5192 6.80 600 2.34 0.27
3724 8.59 600 2.51 0.18 4362 – – 0.75 0.27 5213 14.85 600 4.34 0.18
3726 14.19 600 3.69 0.17 4410 5.45 600 1.89 0.27 5215 12.04 600 4.04 0.22
3803 9.43 600 3.27 0.27 4420 7.43 600 2.19 0.18 5221 11.16 600 3.54 0.20
3807 4.50 600 1.61 0.27 4431 3.23 600 1.20 0.34 5222 22.25 600 6.49 0.18
3808 5.14 600 1.73 0.22 4432 3.99 600 1.49 0.34 5223 11.11 600 3.53 0.20
3821 12.25 600 4.07 0.22 4439 3.53 600 1.18 0.22 5348 9.38 600 3.00 0.20
3822 9.53 600 3.19 0.22 4452 6.46 600 2.22 0.27 5402 6.06 600 2.18 0.27
3824 10.94 600 3.65 0.22 4459 3.73 600 1.29 0.27 5403 19.21 600 5.60 0.18
3826 1.93 472 0.67 0.27 4470 4.79 600 1.66 0.27 5437 11.35 600 3.64 0.20
3827 4.06 600 1.35 0.22 4484 5.06 600 1.75 0.27 5443 6.48 600 2.24 0.27
3830 2.33 516 0.78 0.22 4493 4.96 600 1.72 0.27 5445 11.60 600 3.40 0.18
* Refer to the Footnotes Page for additional information on this class code.
© Copyright 2012 National Council on Compensation Insurance, Inc. All Rights Reserved.
Page 36 of 49
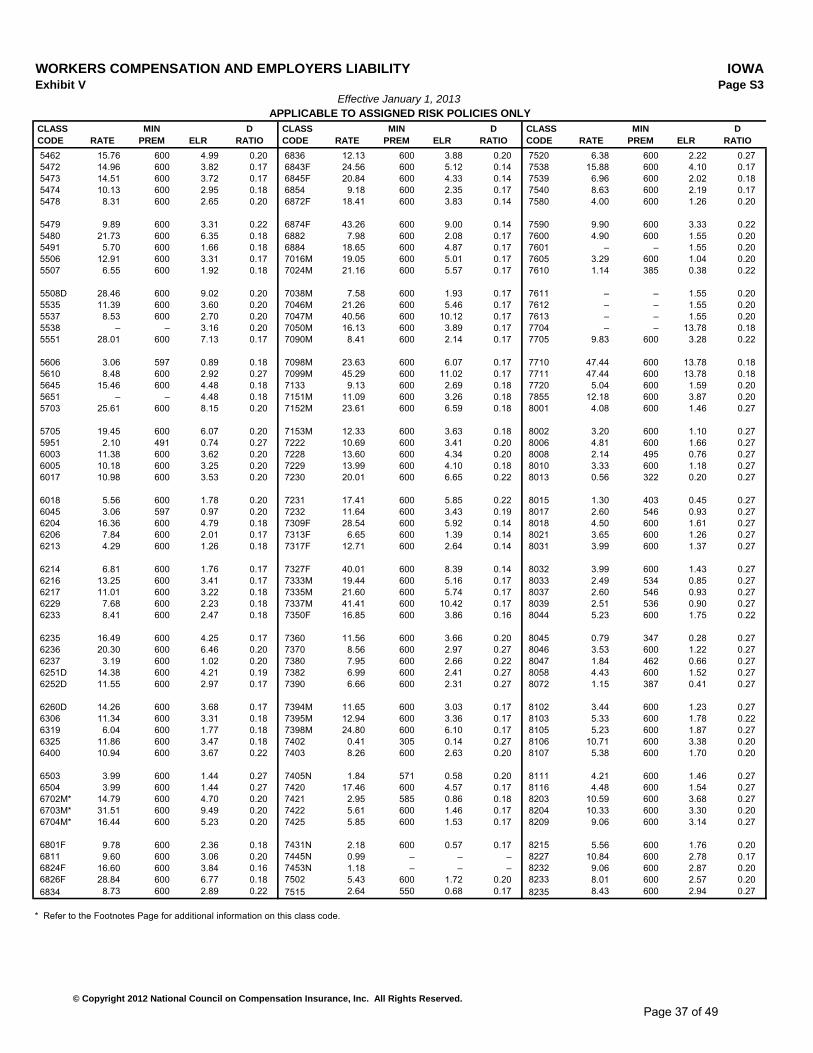
WORKERS COMPENSATION AND EMPLOYERS LIABILITY IOWAExhibit V Page S3
Effective January 1, 2013APPLICABLE TO ASSIGNED RISK POLICIES ONLY
CLASS MIN D CLASS MIN D CLASS MIN D
CODE RATE PREM ELR RATIO CODE RATE PREM ELR RATIO CODE RATE PREM ELR RATIO
5462 15.76 600 4.99 0.20 6836 12.13 600 3.88 0.20 7520 6.38 600 2.22 0.27
5472 14.96 600 3.82 0.17 6843F 24.56 600 5.12 0.14 7538 15.88 600 4.10 0.17
5473 14.51 600 3.72 0.17 6845F 20.84 600 4.33 0.14 7539 6.96 600 2.02 0.18
5474 10.13 600 2.95 0.18 6854 9.18 600 2.35 0.17 7540 8.63 600 2.19 0.17
5478 8.31 600 2.65 0.20 6872F 18.41 600 3.83 0.14 7580 4.00 600 1.26 0.20
5479 9.89 600 3.31 0.22 6874F 43.26 600 9.00 0.14 7590 9.90 600 3.33 0.22
5480 21.73 600 6.35 0.18 6882 7.98 600 2.08 0.17 7600 4.90 600 1.55 0.20
5491 5.70 600 1.66 0.18 6884 18.65 600 4.87 0.17 7601 – – 1.55 0.20
5506 12.91 600 3.31 0.17 7016M 19.05 600 5.01 0.17 7605 3.29 600 1.04 0.20
5507 6.55 600 1.92 0.18 7024M 21.16 600 5.57 0.17 7610 1.14 385 0.38 0.22
5508D 28.46 600 9.02 0.20 7038M 7.58 600 1.93 0.17 7611 – – 1.55 0.20
5535 11.39 600 3.60 0.20 7046M 21.26 600 5.46 0.17 7612 – – 1.55 0.20
5537 8.53 600 2.70 0.20 7047M 40.56 600 10.12 0.17 7613 – – 1.55 0.20
5538 – – 3.16 0.20 7050M 16.13 600 3.89 0.17 7704 – – 13.78 0.18
5551 28.01 600 7.13 0.17 7090M 8.41 600 2.14 0.17 7705 9.83 600 3.28 0.22
5606 3.06 597 0.89 0.18 7098M 23.63 600 6.07 0.17 7710 47.44 600 13.78 0.18
5610 8.48 600 2.92 0.27 7099M 45.29 600 11.02 0.17 7711 47.44 600 13.78 0.18
5645 15.46 600 4.48 0.18 7133 9.13 600 2.69 0.18 7720 5.04 600 1.59 0.20
5651 – – 4.48 0.18 7151M 11.09 600 3.26 0.18 7855 12.18 600 3.87 0.20
5703 25.61 600 8.15 0.20 7152M 23.61 600 6.59 0.18 8001 4.08 600 1.46 0.27
5705 19.45 600 6.07 0.20 7153M 12.33 600 3.63 0.18 8002 3.20 600 1.10 0.27
5951 2.10 491 0.74 0.27 7222 10.69 600 3.41 0.20 8006 4.81 600 1.66 0.27
6003 11.38 600 3.62 0.20 7228 13.60 600 4.34 0.20 8008 2.14 495 0.76 0.27
6005 10.18 600 3.25 0.20 7229 13.99 600 4.10 0.18 8010 3.33 600 1.18 0.27
6017 10.98 600 3.53 0.20 7230 20.01 600 6.65 0.22 8013 0.56 322 0.20 0.27
6018 5.56 600 1.78 0.20 7231 17.41 600 5.85 0.22 8015 1.30 403 0.45 0.27
6045 3.06 597 0.97 0.20 7232 11.64 600 3.43 0.19 8017 2.60 546 0.93 0.27
6204 16.36 600 4.79 0.18 7309F 28.54 600 5.92 0.14 8018 4.50 600 1.61 0.27
6206 7.84 600 2.01 0.17 7313F 6.65 600 1.39 0.14 8021 3.65 600 1.26 0.27
6213 4.29 600 1.26 0.18 7317F 12.71 600 2.64 0.14 8031 3.99 600 1.37 0.27
6214 6.81 600 1.76 0.17 7327F 40.01 600 8.39 0.14 8032 3.99 600 1.43 0.27
6216 13.25 600 3.41 0.17 7333M 19.44 600 5.16 0.17 8033 2.49 534 0.85 0.27
6217 11.01 600 3.22 0.18 7335M 21.60 600 5.74 0.17 8037 2.60 546 0.93 0.27
6229 7.68 600 2.23 0.18 7337M 41.41 600 10.42 0.17 8039 2.51 536 0.90 0.27
6233 8.41 600 2.47 0.18 7350F 16.85 600 3.86 0.16 8044 5.23 600 1.75 0.22
6235 16.49 600 4.25 0.17 7360 11.56 600 3.66 0.20 8045 0.79 347 0.28 0.27
6236 20.30 600 6.46 0.20 7370 8.56 600 2.97 0.27 8046 3.53 600 1.22 0.27
6237 3.19 600 1.02 0.20 7380 7.95 600 2.66 0.22 8047 1.84 462 0.66 0.27
6251D 14.38 600 4.21 0.19 7382 6.99 600 2.41 0.27 8058 4.43 600 1.52 0.27
6252D 11.55 600 2.97 0.17 7390 6.66 600 2.31 0.27 8072 1.15 387 0.41 0.27
6260D 14.26 600 3.68 0.17 7394M 11.65 600 3.03 0.17 8102 3.44 600 1.23 0.27
6306 11.34 600 3.31 0.18 7395M 12.94 600 3.36 0.17 8103 5.33 600 1.78 0.22
6319 6.04 600 1.77 0.18 7398M 24.80 600 6.10 0.17 8105 5.23 600 1.87 0.27
6325 11.86 600 3.47 0.18 7402 0.41 305 0.14 0.27 8106 10.71 600 3.38 0.20
6400 10.94 600 3.67 0.22 7403 8.26 600 2.63 0.20 8107 5.38 600 1.70 0.20
6503 3.99 600 1.44 0.27 7405N 1.84 571 0.58 0.20 8111 4.21 600 1.46 0.27
6504 3.99 600 1.44 0.27 7420 17.46 600 4.57 0.17 8116 4.48 600 1.54 0.27
6702M* 14.79 600 4.70 0.20 7421 2.95 585 0.86 0.18 8203 10.59 600 3.68 0.27
6703M* 31.51 600 9.49 0.20 7422 5.61 600 1.46 0.17 8204 10.33 600 3.30 0.20
6704M* 16.44 600 5.23 0.20 7425 5.85 600 1.53 0.17 8209 9.06 600 3.14 0.27
6801F 9.78 600 2.36 0.18 7431N 2.18 600 0.57 0.17 8215 5.56 600 1.76 0.20
6811 9.60 600 3.06 0.20 7445N 0.99 – – – 8227 10.84 600 2.78 0.17
6824F 16.60 600 3.84 0.16 7453N 1.18 – – – 8232 9.06 600 2.87 0.20
6826F 28.84 600 6.77 0.18 7502 5.43 600 1.72 0.20 8233 8.01 600 2.57 0.20
6834 8.73 600 2.89 0.22 7515 2.64 550 0.68 0.17 8235 8.43 600 2.94 0.27
* Refer to the Footnotes Page for additional information on this class code.
© Copyright 2012 National Council on Compensation Insurance, Inc. All Rights Reserved.
Page 37 of 49
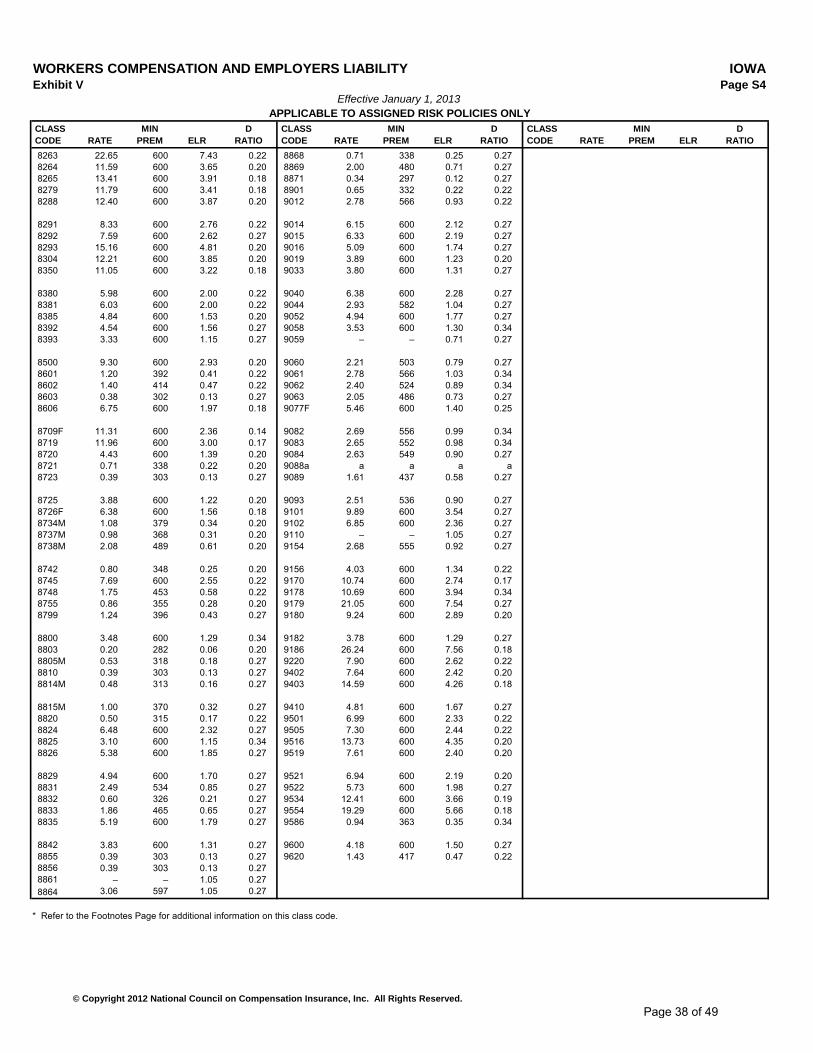
WORKERS COMPENSATION AND EMPLOYERS LIABILITY IOWAExhibit V Page S4
Effective January 1, 2013APPLICABLE TO ASSIGNED RISK POLICIES ONLY
CLASS MIN D CLASS MIN D CLASS MIN D
CODE RATE PREM ELR RATIO CODE RATE PREM ELR RATIO CODE RATE PREM ELR RATIO
8263 22.65 600 7.43 0.22 8868 0.71 338 0.25 0.27
8264 11.59 600 3.65 0.20 8869 2.00 480 0.71 0.27
8265 13.41 600 3.91 0.18 8871 0.34 297 0.12 0.27
8279 11.79 600 3.41 0.18 8901 0.65 332 0.22 0.22
8288 12.40 600 3.87 0.20 9012 2.78 566 0.93 0.22
8291 8.33 600 2.76 0.22 9014 6.15 600 2.12 0.27
8292 7.59 600 2.62 0.27 9015 6.33 600 2.19 0.27
8293 15.16 600 4.81 0.20 9016 5.09 600 1.74 0.27
8304 12.21 600 3.85 0.20 9019 3.89 600 1.23 0.20
8350 11.05 600 3.22 0.18 9033 3.80 600 1.31 0.27
8380 5.98 600 2.00 0.22 9040 6.38 600 2.28 0.27
8381 6.03 600 2.00 0.22 9044 2.93 582 1.04 0.27
8385 4.84 600 1.53 0.20 9052 4.94 600 1.77 0.27
8392 4.54 600 1.56 0.27 9058 3.53 600 1.30 0.34
8393 3.33 600 1.15 0.27 9059 – – 0.71 0.27
8500 9.30 600 2.93 0.20 9060 2.21 503 0.79 0.27
8601 1.20 392 0.41 0.22 9061 2.78 566 1.03 0.34
8602 1.40 414 0.47 0.22 9062 2.40 524 0.89 0.34
8603 0.38 302 0.13 0.27 9063 2.05 486 0.73 0.27
8606 6.75 600 1.97 0.18 9077F 5.46 600 1.40 0.25
8709F 11.31 600 2.36 0.14 9082 2.69 556 0.99 0.34
8719 11.96 600 3.00 0.17 9083 2.65 552 0.98 0.34
8720 4.43 600 1.39 0.20 9084 2.63 549 0.90 0.27
8721 0.71 338 0.22 0.20 9088a a a a a
8723 0.39 303 0.13 0.27 9089 1.61 437 0.58 0.27
8725 3.88 600 1.22 0.20 9093 2.51 536 0.90 0.27
8726F 6.38 600 1.56 0.18 9101 9.89 600 3.54 0.27
8734M 1.08 379 0.34 0.20 9102 6.85 600 2.36 0.27
8737M 0.98 368 0.31 0.20 9110 – – 1.05 0.27
8738M 2.08 489 0.61 0.20 9154 2.68 555 0.92 0.27
8742 0.80 348 0.25 0.20 9156 4.03 600 1.34 0.22
8745 7.69 600 2.55 0.22 9170 10.74 600 2.74 0.17
8748 1.75 453 0.58 0.22 9178 10.69 600 3.94 0.34
8755 0.86 355 0.28 0.20 9179 21.05 600 7.54 0.27
8799 1.24 396 0.43 0.27 9180 9.24 600 2.89 0.20
8800 3.48 600 1.29 0.34 9182 3.78 600 1.29 0.27
8803 0.20 282 0.06 0.20 9186 26.24 600 7.56 0.18
8805M 0.53 318 0.18 0.27 9220 7.90 600 2.62 0.22
8810 0.39 303 0.13 0.27 9402 7.64 600 2.42 0.20
8814M 0.48 313 0.16 0.27 9403 14.59 600 4.26 0.18
8815M 1.00 370 0.32 0.27 9410 4.81 600 1.67 0.27
8820 0.50 315 0.17 0.22 9501 6.99 600 2.33 0.22
8824 6.48 600 2.32 0.27 9505 7.30 600 2.44 0.22
8825 3.10 600 1.15 0.34 9516 13.73 600 4.35 0.20
8826 5.38 600 1.85 0.27 9519 7.61 600 2.40 0.20
8829 4.94 600 1.70 0.27 9521 6.94 600 2.19 0.20
8831 2.49 534 0.85 0.27 9522 5.73 600 1.98 0.27
8832 0.60 326 0.21 0.27 9534 12.41 600 3.66 0.19
8833 1.86 465 0.65 0.27 9554 19.29 600 5.66 0.18
8835 5.19 600 1.79 0.27 9586 0.94 363 0.35 0.34
8842 3.83 600 1.31 0.27 9600 4.18 600 1.50 0.27
8855 0.39 303 0.13 0.27 9620 1.43 417 0.47 0.22
8856 0.39 303 0.13 0.27
8861 – – 1.05 0.27
8864 3.06 597 1.05 0.27
* Refer to the Footnotes Page for additional information on this class code.
© Copyright 2012 National Council on Compensation Insurance, Inc. All Rights Reserved.
Page 38 of 49
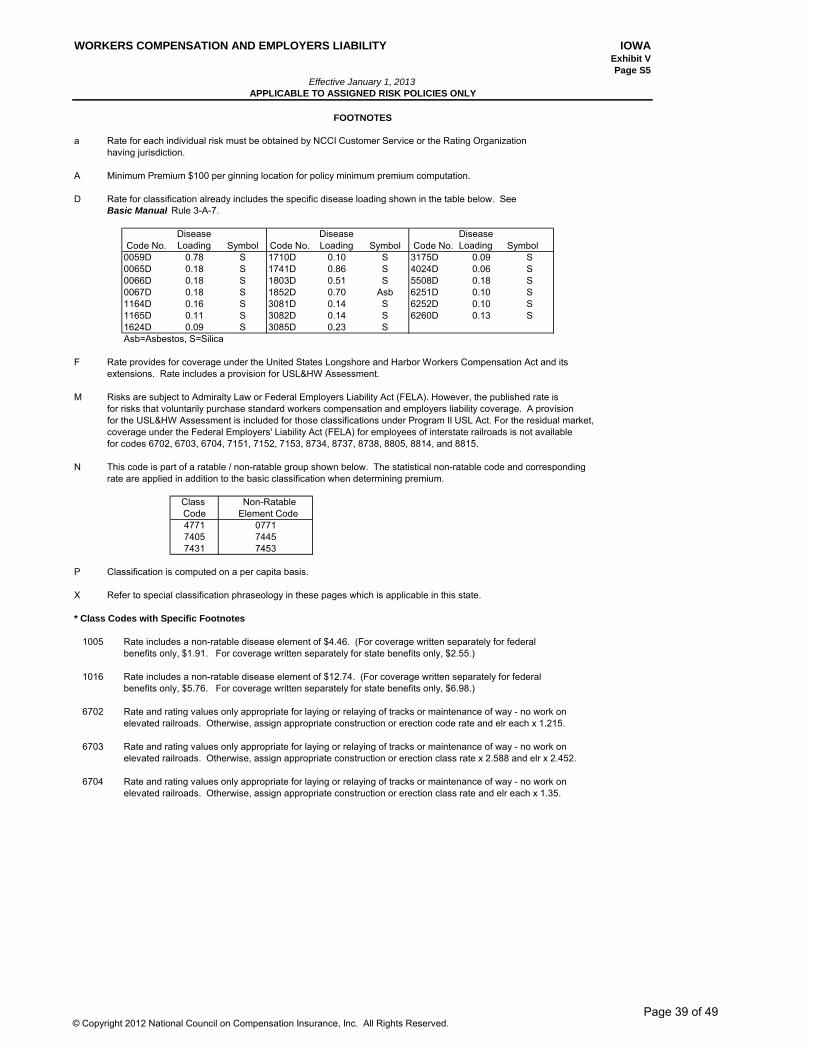
WORKERS COMPENSATION AND EMPLOYERS LIABILITY IOWAExhibit V
Page S5
Effective January 1, 2013APPLICABLE TO ASSIGNED RISK POLICIES ONLY
FOOTNOTES
a Rate for each individual risk must be obtained by NCCI Customer Service or the Rating Organization
having jurisdiction.
A Minimum Premium $100 per ginning location for policy minimum premium computation.
D Rate for classification already includes the specific disease loading shown in the table below. See
Basic Manual Rule 3-A-7.
Code No.
Disease
Loading Symbol Code No.
Disease
Loading Symbol Code No.
Disease
Loading Symbol
0059D 0.78 S 1710D 0.10 S 3175D 0.09 S
0065D 0.18 S 1741D 0.86 S 4024D 0.06 S
0066D 0.18 S 1803D 0.51 S 5508D 0.18 S
0067D 0.18 S 1852D 0.70 Asb 6251D 0.10 S
1164D 0.16 S 3081D 0.14 S 6252D 0.10 S
1165D 0.11 S 3082D 0.14 S 6260D 0.13 S
1624D 0.09 S 3085D 0.23 S
Asb=Asbestos, S=Silica
F Rate provides for coverage under the United States Longshore and Harbor Workers Compensation Act and its
extensions. Rate includes a provision for USL&HW Assessment.
M Risks are subject to Admiralty Law or Federal Employers Liability Act (FELA). However, the published rate is
for risks that voluntarily purchase standard workers compensation and employers liability coverage. A provision
for the USL&HW Assessment is included for those classifications under Program II USL Act. For the residual market,
coverage under the Federal Employers' Liability Act (FELA) for employees of interstate railroads is not available
for codes 6702, 6703, 6704, 7151, 7152, 7153, 8734, 8737, 8738, 8805, 8814, and 8815.
N This code is part of a ratable / non-ratable group shown below. The statistical non-ratable code and corresponding
rate are applied in addition to the basic classification when determining premium.
Class
Code
4771
7405
7431
P Classification is computed on a per capita basis.
X Refer to special classification phraseology in these pages which is applicable in this state.
* Class Codes with Specific Footnotes
1005 Rate includes a non-ratable disease element of $4.46. (For coverage written separately for federal
benefits only, $1.91. For coverage written separately for state benefits only, $2.55.)
1016 Rate includes a non-ratable disease element of $12.74. (For coverage written separately for federal
benefits only, $5.76. For coverage written separately for state benefits only, $6.98.)
6702 Rate and rating values only appropriate for laying or relaying of tracks or maintenance of way - no work on
elevated railroads. Otherwise, assign appropriate construction or erection code rate and elr each x 1.215.
6703 Rate and rating values only appropriate for laying or relaying of tracks or maintenance of way - no work on
elevated railroads. Otherwise, assign appropriate construction or erection class rate x 2.588 and elr x 2.452.
6704 Rate and rating values only appropriate for laying or relaying of tracks or maintenance of way - no work on
elevated railroads. Otherwise, assign appropriate construction or erection class rate and elr each x 1.35.
7445
7453
Non-Ratable
Element Code
0771
© Copyright 2012 National Council on Compensation Insurance, Inc. All Rights Reserved.Page 39 of 49
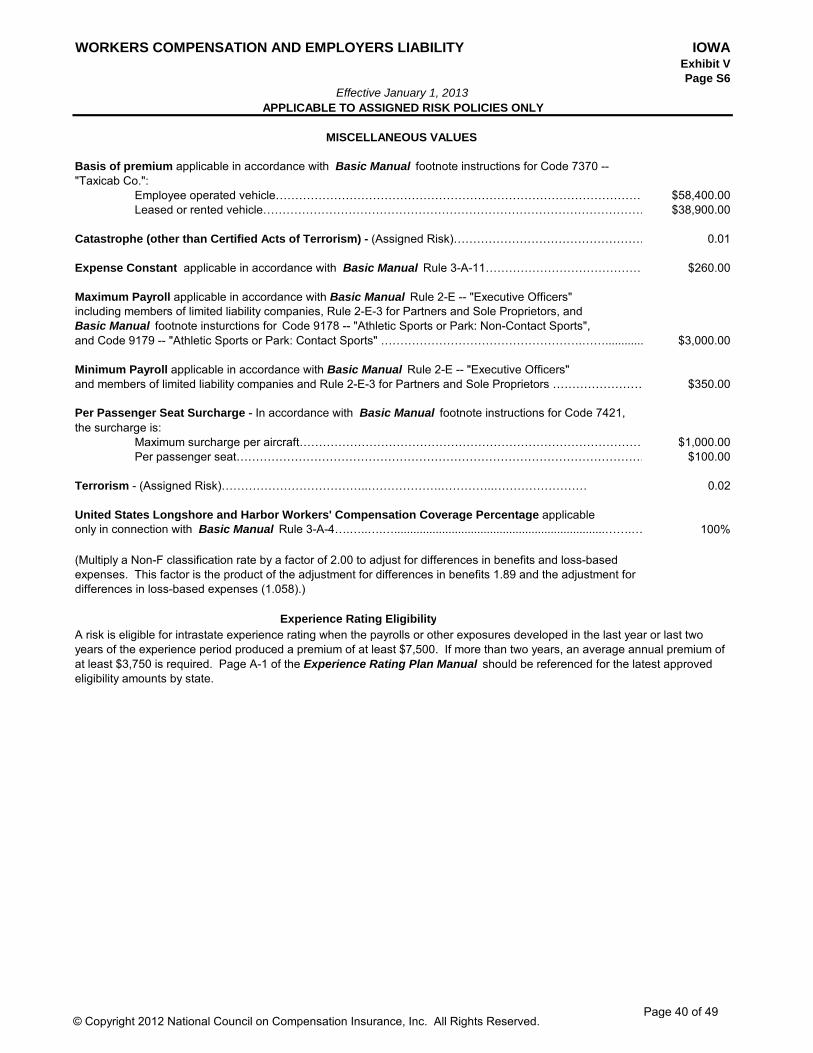
WORKERS COMPENSATION AND EMPLOYERS LIABILITY IOWAExhibit V
Page S6
Effective January 1, 2013APPLICABLE TO ASSIGNED RISK POLICIES ONLY
MISCELLANEOUS VALUES
Basis of premium applicable in accordance with Basic Manual footnote instructions for Code 7370 --
"Taxicab Co.":
Employee operated vehicle…………………………………………………………………………………… $58,400.00
Leased or rented vehicle……………………………………………………………………………………… $38,900.00
Catastrophe (other than Certified Acts of Terrorism) - (Assigned Risk)…………………………………………… 0.01
Expense Constant applicable in accordance with Basic Manual Rule 3-A-11…………………………………… $260.00
Maximum Payroll applicable in accordance with Basic Manual Rule 2-E -- "Executive Officers"
including members of limited liability companies, Rule 2-E-3 for Partners and Sole Proprietors, and
Basic Manual footnote insturctions for Code 9178 -- "Athletic Sports or Park: Non-Contact Sports",
and Code 9179 -- "Athletic Sports or Park: Contact Sports" …………………………………………….……............ $3,000.00
Minimum Payroll applicable in accordance with Basic Manual Rule 2-E -- "Executive Officers"
and members of limited liability companies and Rule 2-E-3 for Partners and Sole Proprietors …………………… $350.00
Maximum surcharge per aircraft……………………………………………………………………………… $1,000.00
Per passenger seat…………………………………………………………………………………………… $100.00
Terrorism - (Assigned Risk)………………………………..……………….…………..…………………… 0.02
United States Longshore and Harbor Workers' Compensation Coverage Percentage applicable
only in connection with Basic Manual Rule 3-A-4….…..….…..................................................................…….… 100%
Experience Rating Eligibility
A risk is eligible for intrastate experience rating when the payrolls or other exposures developed in the last year or last two
years of the experience period produced a premium of at least $7,500. If more than two years, an average annual premium of
at least $3,750 is required. Page A-1 of the Experience Rating Plan Manual should be referenced for the latest approved
eligibility amounts by state.
(Multiply a Non-F classification rate by a factor of 2.00 to adjust for differences in benefits and loss-based
expenses. This factor is the product of the adjustment for differences in benefits 1.89 and the adjustment for
differences in loss-based expenses (1.058).)
Per Passenger Seat Surcharge - In accordance with Basic Manual footnote instructions for Code 7421,
the surcharge is:
© Copyright 2012 National Council on Compensation Insurance, Inc. All Rights Reserved.Page 40 of 49
21
IOWA
WORKERS COMPENSATION FILING – January 1, 2013
© Copyright 2012 National Council on Compensation Insurance, Inc. All Rights Reserved.
NCCI KEY CONTACTS
Roy O. Wood,
State Relations Executive Regulatory Services Division
National Council on Compensation Insurance, Inc. (NCCI) 11430 Gravois Road, Suite 310
St. Louis, MO 63126 Phone (314) 843-4001 Fax (561) 893-5550
Tony DiDonato, FCAS, MAAA Director & Senior Actuary
Actuarial and Economic Services Division National Council on Compensation Insurance, Inc. (NCCI)
901 Peninsula Corporate Circle Boca Raton, Florida 33487-1362
Phone (561) 893-3116 Fax (561) 893-5208
All NCCI employees can be contacted via e-mail using the following format:
First Name_Last [email protected]
Page 41 of 49
22
IOWA
WORKERS COMPENSATION FILING – January 1, 2013
© Copyright 2012 National Council on Compensation Insurance, Inc. All Rights Reserved.
AFFILIATES LIST FOR IOWA A M C O INSURANCE COMPANY ACCIDENT FUND GENERAL INS CO ACCIDENT FUND INS CO OF AMERICA ACCIDENT FUND NATIONAL INS CO ACE AMERICAN INSURANCE COMPANY ACE FIRE UNDERWRITERS INSURANCE COMPANY ACE PROPERTY & CASUALTY INSURANCE COMPANY ACIG INS CO ACUITY A MUTUAL INS COMPANY ADDISON INSURANCE COMPANY ADVANTAGE WC INSURANCE CO AIU INSURANCE CO (NATIONAL UNION FIRE OF PITTS PA) AK NATIONAL INS CO ALLIANZ GLOBAL RISKS US INS CO ALLIED EASTERN IND CO ALLIED PROPERTY AND CASUALTY INS CO ALLMERICA FINANCIAL BENEFIT INS CO AMERICAN ALTERNATIVE INSURANCE CORPORATION AMERICAN AUTOMOBILE INSURANCE CO AMERICAN BUSINESS AND PERSONAL INS MUTUAL INC AMERICAN CASUALTY COMPANY OF READING P A AMERICAN COMPENSATION INS CO AMERICAN ECONOMY INS CO AMERICAN FAMILY HOME INS CO AMERICAN FAMILY MUTUAL INSURANCE CO AMERICAN FIRE AND CASUALTY CO AMERICAN GUARANTEE AND LIABILITY INS CO AMERICAN HOME ASSUR CO-NATIONAL UNION FIRE OF PIT AMERICAN INS CO AMERICAN INTERSTATE INS CO AMERICAN MODERN HOME INS CO AMERICAN NATIONAL PROPERTY AND CASUALTY CO AMERICAN SELECT INS CO AMERICAN STATES INS CO A SAFECO COMPANY AMERICAN ZURICH INS CO AMERISURE INS CO AMERISURE MUTUAL INS CO AMERISURE PARTNERS INS CO AMGUARD INS CO AMTRUST INSURANCE CO OF KS INC ARCH INSURANCE COMPANY ARGONAUT GREAT CENTRAL INS CO ARGONAUT INS CO ARGONAUT MIDWEST INS CO ASSOCIATED INDEMNITY CORP ASSURANCE COMPANY OF AMERICA ATHENA ASSURANCE CO
Page 42 of 49
23
IOWA
WORKERS COMPENSATION FILING – January 1, 2013
© Copyright 2012 National Council on Compensation Insurance, Inc. All Rights Reserved.
ATLANTIC SPECIALTY INS CO (ONEBEACON) ATLANTIC STATES INS CO AUSTIN MUTUAL INSURANCE COMPANY AUTO OWNERS INS CO BADGER MUTUAL INS CO BANKERS STANDARD INS CO BENCHMARK INSURANCE COMPANY BERKLEY NATIONAL INSURANCE COMPANY BERKLEY REGIONAL INS CO BERKSHIRE HATHAWAY HOMESTATE INS CO BITUMINOUS CASUALTY CORP BITUMINOUS FIRE AND MARINE INS CO BROTHERHOOD MUTUAL INS CO CALIFORNIA INSURANCE COMPANY CAMDEN FIRE INS ASSN CAPITOL INDEMNITY CORP CAROLINA CASUALTY INS CO CASTLEPOINT NATIONAL INS CO CENTRE INSURANCE COMPANY CHARTER OAK FIRE INS CO CHARTIS CASUALTY COMPANY CHARTIS PROPERTY CASUALTY COMPANY CHEROKEE INS CO CHUBB INDEMNITY INS CO CHUBB NATIONAL INS CO CHURCH MUTUAL INS CO CINCINNATI CASUALTY COMPANY CINCINNATI INDEMNITY COMPANY CINCINNATI INS CO CLERMONT INS CO COLONIAL AMERICAN CASUALTY & SURETY CO COLUMBIA MUTUAL INSURANCE CO COLUMBIA NATIONAL INS CO COMMERCE AND INDUSTRY INS CO COMPANION PROPERTY AND CASUALTY INS CO CONSOLIDATED INS CO CONTINENTAL CASUALTY CO CONTINENTAL INDEMNITY CO CONTINENTAL INS CO CONTINENTAL WESTERN INSURANCE COMPANY CRUM AND FORSTER INDEMNITY CO DAKOTA TRUCK UNDERWRITERS DALLAS NATIONAL INSURANCE COMPANY DEERFIELD INS CO DEPOSITORS INS CO DIAMOND INS CO DISCOVER PROPERTY & CASUALTY INS CO DONEGAL MUTUAL INS CO EASTERN ADVANTAGE ASSURANCE COMPANY EASTERN ALLIANCE INSURANCE COMPANY ELECTRIC INS CO EMC PROPERTY & CASUALTY COMPANY
Page 43 of 49
24
IOWA
WORKERS COMPENSATION FILING – January 1, 2013
© Copyright 2012 National Council on Compensation Insurance, Inc. All Rights Reserved.
EMCASCO INS CO EMPLOYERS ASSURANCE COMPANY EMPLOYERS FIRE INSURANCE COMPANY EMPLOYERS INS CO OF WAUSAU EMPLOYERS MUTUAL CASUALTY CO EMPLOYERS PREFERRED INS CO EVEREST NATIONAL INS CO EVEREST REINSURANCE CO DIRECT EXECUTIVE RISK INDEMNITY INC EXPLORER INS CO FAIRFIELD INS CO FARM BUREAU PROPERTY CASUALTY INS CO FARMERS CASUALTY INS CO FARMERS INSURANCE EXCHANGE FARMINGTON CASUALTY COMPANY FARMLAND MUTUAL INSURANCE COMPANY FEDERAL INSURANCE COMPANY FEDERATED MUTUAL INS CO FEDERATED RURAL ELECTRIC INS EXCHANGE FEDERATED SERVICE INS CO FIDELITY & DEPOSIT COMPANY OF MARYLAND FIDELITY & GUARANTY INS UNDERWRITERS FIDELITY & GUARANTY INSURANCE CO FIREMANS FUND INSURANCE CO FIREMENS INS CO OF WASHINGTON DC FIRST DAKOTA INDEMNITY CO FIRST LIBERTY INS CORP FIRST NATIONAL INS CO OF AMERICA FIRSTCOMP INSURANCE CO FLORISTS MUTUAL INSURANCE CO FOREMOST INS CO GRAND RAPIDS MICHIGAN GATEWAY INS CO GENERAL CASUALTY COMPANY OF WISCONSIN GENERAL CASUALTY INSURANCE COMPANY GENERAL INS CO OF AMERICA GENESIS INS CO GRANITE STATE INSURANCE COMPANY GRAPHIC ARTS MUTUAL INS CO GREAT AMERICAN ALLIANCE INS CO GREAT AMERICAN ASSURANCE COMPANY GREAT AMERICAN INS CO OF NY GREAT AMERICAN INSURANCE COMPANY GREAT DIVIDE INSURANCE COMPANY GREAT NORTHERN INS CO GREAT WEST CASUALTY COMPANY GREATER NY MUTUAL INS CO GREENWICH INS CO GRINNELL MUTUAL REINSURANCE CO GRINNELL SELECT INS CO GUIDEONE ELITE INS CO GUIDEONE MUTUAL INS CO HAMILTON MUTUAL INS CO
Page 44 of 49
25
IOWA
WORKERS COMPENSATION FILING – January 1, 2013
© Copyright 2012 National Council on Compensation Insurance, Inc. All Rights Reserved.
HANOVER AMERICAN INS CO HANOVER INS CO HARLEYSVILLE INSURANCE COMPANY HARLEYSVILLE LAKE STATES INSURANCE COMPANY HARLEYSVILLE PREFERRED INSURANCE CO HARLEYSVILLE WORCESTER INSURANCE CO HARTFORD ACCIDENT AND INDEMNITY CO HARTFORD CASUALTY INS CO HARTFORD FIRE INSURANCE CO HARTFORD INS CO OF IL HARTFORD INS CO OF MIDWEST HARTFORD INS CO OF THE SOUTHEAST HARTFORD UNDERWRITERS INS CO HASTINGS MUTUAL INS CO HAWKEYE-SECURITY INS CO HDI GERLING AMERICA INSURANCE COMPANY IA AMERICAN INS CO IA LONG TERM CARE RISK MGMT ASSN IA MUTUAL INS CO IL EMCASCO INS CO ILLINOIS CASUALTY COMPANY ILLINOIS NATIONAL INSURANCE COMPANY IMPERIAL CASUALTY AND INDEMNITY COMPANY IMPERIUM INSURANCE COMPANY IMT INS CO INDEMNITY INS CO OF N AMERICA (INA INS) (CT GEN) INDIANA INSURANCE COMPANY INS CO OF NORTH AMERICA INS CO OF THE STATE PA INS CO OF THE WEST INTEGRITY MUTUAL INS CO INTEGRITY PROPERTY & CASUALTY INS CO LAFAYETTE INS CO LAURIER INDEMNITY COMPANY LE MARS INS CO LIBERTY INS CORP LIBERTY INSURANCE UNDERWRITERS INC LIBERTY MUTUAL FIRE INS CO LIBERTY MUTUAL INS CO LM GENERAL INS CO LM INS CORP LM PROPERTY AND CASUALTY INS CO LUMBERMENS UNDERWRITING ALLIANCE MA BAY INS CO MANUFACTURERS ALLIANCE INS CO MARKEL INSURANCE CO MARYLAND CASUALTY COMPANY MEMIC INDEMNITY CO MERIDIAN CITIZENS MUTUAL INSURANCE CO MERIDIAN SECURITY INSURANCE COMPANY MHA INSURANCE COMPANY MI MILLERS MUTUAL INS CO
Page 45 of 49
26
IOWA
WORKERS COMPENSATION FILING – January 1, 2013
© Copyright 2012 National Council on Compensation Insurance, Inc. All Rights Reserved.
MID CENTURY INS CO MIDDLESEX INS CO MIDWEST BUILDERS CASUALTY MUTUAL COMPANY MIDWEST EMPLOYERS CASUALTY CO MIDWEST FAMILY MUTUAL INS CO MIDWEST INS CO MIDWESTERN INDEMNITY CO MILBANK INSURANCE COMPANY MILWAUKEE CASUALTY INSURANCE CO (AMTRUST GROUP) MITSUI SUMITOMO INS CO OF AMERICA MITSUI SUMITOMO INS USA INC MOTORISTS COMMERCIAL MUTUAL INSURANCE COMPANY NATIONAL AMERICAN INS CO NATIONAL CASUALTY CO NATIONAL FARMERS UNION PROP AND CAS CO (QBE) NATIONAL FIRE INS CO OF HARTFORD NATIONAL INTERSTATE INS CO NATIONAL SURETY CORP NATIONAL UNION FIRE INS CO OF PITTSBURG PA NATIONWIDE AGRIBUSINESS INS CO NATIONWIDE MUTUAL FIRE INS CO NATIONWIDE MUTUAL INS CO NETHERLANDS INSURANCE COMPANY NEW HAMPSHIRE INSURANCE COMPANY NEW YORK MARINE & GENERAL INSURANCE CO NIPPONKOA INS CO LIMITED (US BRANCH) NORTH AMERICAN ELITE INSURANCE CO NORTH AMERICAN SPECIALTY INS CO NORTH POINTE INS CO NORTH RIVER INS CO NORTHERN ASSURANCE CO OF AMERICA NORTHERN INSURANCE CO OF N Y NOVA CASUALTY COMPANY OAK RIVER INSURANCE COMPANY OH CASUALTY INS CO OH FARMERS INS CO OHIO SECURITY INS CO OLD REPUBLIC GENERAL INSURANCE CORPORATION OLD REPUBLIC INS CO ONEBEACON AMERICA INS CO ONEBEACON INSURANCE COMPANY OWNERS INSURANCE COMPANY PA MANUFACTURERS ASSN INS CO PA MANUFACTURERS INDEMNITY CO PACIFIC EMPLOYERS INS CO PACIFIC INDEMNITY CO PACIFIC INS CO LTD PARK AVENUE PROPERTY AND CASUALTY INS CO PARTNERS MUTUAL INS CO PATRONS MUTUAL INS CO OF CT PEERLESS INDEMNITY INS CO PEERLESS INSURANCE COMPANY
Page 46 of 49
27
IOWA
WORKERS COMPENSATION FILING – January 1, 2013
© Copyright 2012 National Council on Compensation Insurance, Inc. All Rights Reserved.
PEKIN INS CO PENN MILLERS INS CO PETROLEUM CASUALTY CO PHARMACISTS MUTUAL INS CO PHOENIX INS CO PIONEER SPECIALTY INSURANCE COMPANY PLAZA INSURANCE CO PRAETORIAN INSURANCE COMPANY PREFERRED PROFESSIONAL INSURANCE COMPANY PROPERTY AND CASUALTY INS CO OF HARTFORD PROTECTIVE INS CO QBE INSURANCE CORPORATION REGENT INSURANCE COMPANY REPUBLIC INDEMNITY COMPANY OF AMERICA RIVERPORT INSURANCE COMPANY RLI INSURANCE COMPANY ROCKWOOD CASUALTY INS CO SAFECO INS CO OF AMERICA SAFETY FIRST INS CO SAFETY NATIONAL CASUALTY CORP SEABRIGHT INSURANCE CO SECURA INSURANCE A MUTUAL CO SECURA SUPREME INS CO SECURITY NATIONAL INS CO (AMTRUST GROUP) SELECTIVE INS CO OF SC SELECTIVE INS CO OF THE SOUTHEAST SELECTIVE INSURANCE COMPANY OF AMERICA SELECTIVE WAY INS CO SENECA INSURANCE CO SENTINEL INS CO SENTRY CASUALTY CO SENTRY INSURANCE A MUTUAL CO SENTRY SELECT INSURANCE COMPANY SEQUOIA INSURANCE CO SFM MUTUAL INS CO SFM SELECT INSURANCE COMPANY SOCIETY INSURANCE A MUTUAL COMPANY SOMPO JAPAN INSURANCE CO OF AMERICA SOUTHERN INS CO SPARTA INSURANCE COMPANY ST PAUL FIRE AND MARINE INS CO ST PAUL GUARDIAN INS CO ST PAUL MERCURY INS CO ST PAUL PROTECTIVE INS CO STANDARD FIRE INSURANCE COMPANY STAR INS CO STARNET INSURANCE COMPANY STARR INDEMNITY AND LIABILITY CO STATE AUTO PROPERTY AND CASUALTY INS CO STATE AUTOMOBILE MUTUAL INS CO STATE FARM FIRE AND CASUALTY CO STATE FARM GENERAL INS CO
Page 47 of 49
28
IOWA
WORKERS COMPENSATION FILING – January 1, 2013
© Copyright 2012 National Council on Compensation Insurance, Inc. All Rights Reserved.
STATE NATIONAL INSURANCE COMPANY STONINGTON INS CO SUNZ INSURANCE COMPANY T H E INSURANCE COMPANY TECHNOLOGY INSURANCE CO TNUS INSURANCE CO TOKIO MARINE AMERICA INSURANCE CO TOKIO MARINE AND NICHIDO FIRE INS CO LTD US BRANCH TOWER INS CO OF NY TRANS PACIFIC INS CO TRANSGUARD INS CO OF AMERICA INC TRANSPORTATION INS CO TRAVELERS CASUALTY AND SURETY CO TRAVELERS CASUALTY INS CO OF AMERICA TRAVELERS INDEMNITY CO TRAVELERS INDEMNITY CO OF AMERICA TRAVELERS INDEMNITY CO OF CT TRAVELERS PROPERTY CASUALTY CO OF AMERICA TRI STATE INSURANCE COMPANY OF MINNESOTA TRIANGLE INSURANCE COMPANY INC TRIUMPHE CASUALTY COMPANY TRUCK INSURANCE EXCHANGE TRUMBULL INS CO TWIN CITY FIRE INS CO ULLICO CASUALTY CO UNION INS CO OF PROVIDENCE UNION INSURANCE COMPANY UNITED FIRE AND CASUALTY CO UNITED STATES FIDELITY AND GUARANTY CO UNITED WI INS CO UNIVERSAL UNDERWRITERS INS CO US FIRE INS CO US SPECIALTY INS CO UTICA MUTUAL INS CO VALLEY FORGE INS CO VANLINER INS CO VIGILANT INS CO WADENA INSURANCE COMPANY WAUSAU BUSINESS INSURANCE COMPANY WAUSAU UNDERWRITERS INSURANCE COMPANY WESCO INSURANCE COMPANY (AMTRUST GROUP) WEST AMERICAN INS CO WEST BEND MUTUAL INS CO WESTCHESTER FIRE INSURANCE COMPANY WESTERN AGRICULTURAL INS CO WESTERN NATIONAL MUTUAL INS CO WESTFIELD INS CO WESTFIELD NATIONAL INS CO WESTPORT INSURANCE CORPORATION WILLIAMSBURG NATIONAL INS CO WORK FIRST CASUALTY CO XL INS CO OF NY INC
Page 48 of 49
29
IOWA
WORKERS COMPENSATION FILING – January 1, 2013
© Copyright 2012 National Council on Compensation Insurance, Inc. All Rights Reserved.
XL INSURANCE AMERICA INC XL SPECIALTY INS CO ZENITH INS CO ZNAT INS CO ZURICH AMERICAN INS CO ZURICH AMERICAN INS CO OF IL
Page 49 of 49