Embed Size (px)
Citation preview
2002 NCCI Holdings, Inc.
Analysis of Workers Compensation Loss TrendsUnderstanding and Modeling the Change in Frequency
Recent Research Findings from NCCI
Casualty Loss Reserve Seminar
Casualty Actuarial Society
September 23, 2002
Presented by
Harry Shuford
Chief Economist
2 2002 NCCI Holdings, Inc.
Analysis of Workers Compensation Loss TrendsUnderstanding and Modeling the Change in Frequency
Outline
1. Key Findings
2. Some Insights from the Bureau of Labor Statistics • Trends and Cycles in Workplace Injuries• The 1990’s Were Different• But the US Was Not• Wal-Mart Told Us - It’s Just Business
3. Applying the Knowledge to Support Loss Cost Filings
3 2002 NCCI Holdings, Inc.
Looking at Three Decades of Experience
The key findings include:
Frequency changes are cyclical around a long-term tendency to decline.
Over long periods of time the relative importance of these two factors varies considerably.
4 2002 NCCI Holdings, Inc.
Looking at Three Decades of Experience
The key findings include:
Swings in the business cycle, especially as reflected in changes in employment, are associated with similar swings in frequency –
downward pressure in recession
upward pressure during periods of robust growth.
5 2002 NCCI Holdings, Inc.
Looking at Three Decades of Experience
The key findings include:
The 1990s diverge from earlier periods;
the business cycle effects were present but
were overcome by changes in the workplace as reflected by marked improvements in productivity.
6 2002 NCCI Holdings, Inc.
The Industry Wants to Know:
• What Happened in the 1990s?
• Can It Continue?
• The Approach – Compare Areas with Dramatic Declines vs. Those with Limited Declines and Increases – Identify Key Underlying Differences
• It Didn’t Get Us Very Far!
7 2002 NCCI Holdings, Inc.
It Is Useful to Understand Why It Didn’t Work
Why?
Because the decline has been broad-based –
across industries and occupations and across virtually all injury “demographics” including
age, gender, event, source, body part injured, tenure with employer.
8 2002 NCCI Holdings, Inc.
The key findings include:
In spite of the dramatic declines
There is virtually no change in the relative position of industries and occupations.
In general
The most risky remain the most risky;
The safest are still the safest. Relative shifts from high to lower frequency was not a factor
9 2002 NCCI Holdings, Inc.
Searching for the Factors Driving the Change in Frequencywith Special Interest in the Decline of the 1990s
The key findings include:
In spite of the diverse nature of the decline at least one clear factor stands out
the dramatic decline in back injuries outstrips the declines in all other injury categories.
10 2002 NCCI Holdings, Inc.
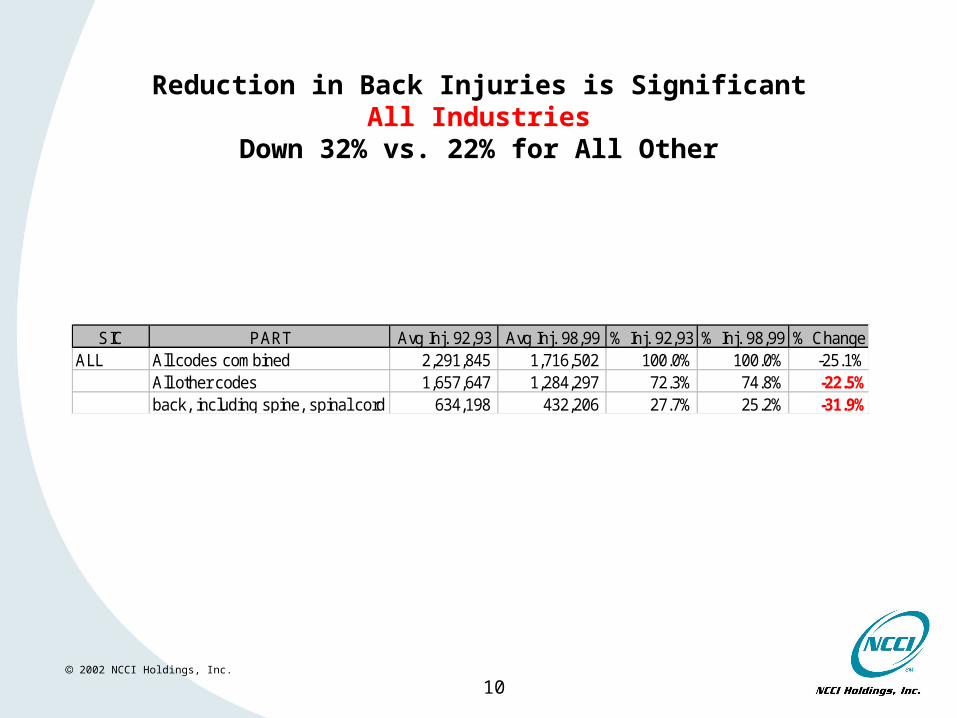
Reduction in Back Injuries is SignificantAll Industries
Down 32% vs. 22% for All Other
SIC PART Avg Inj. 92,93 Avg Inj. 98,99 % Inj. 92,93 % Inj. 98,99 % ChangeALL All codes combined 2,291,845 1,716,502 100.0% 100.0% -25.1%
All other codes 1,657,647 1,284,297 72.3% 74.8% -22.5%back, including spine, spinal cord 634,198 432,206 27.7% 25.2% -31.9%
11 2002 NCCI Holdings, Inc.
Trends and Cycles in Workplace Injury Rates
The Longer Term View
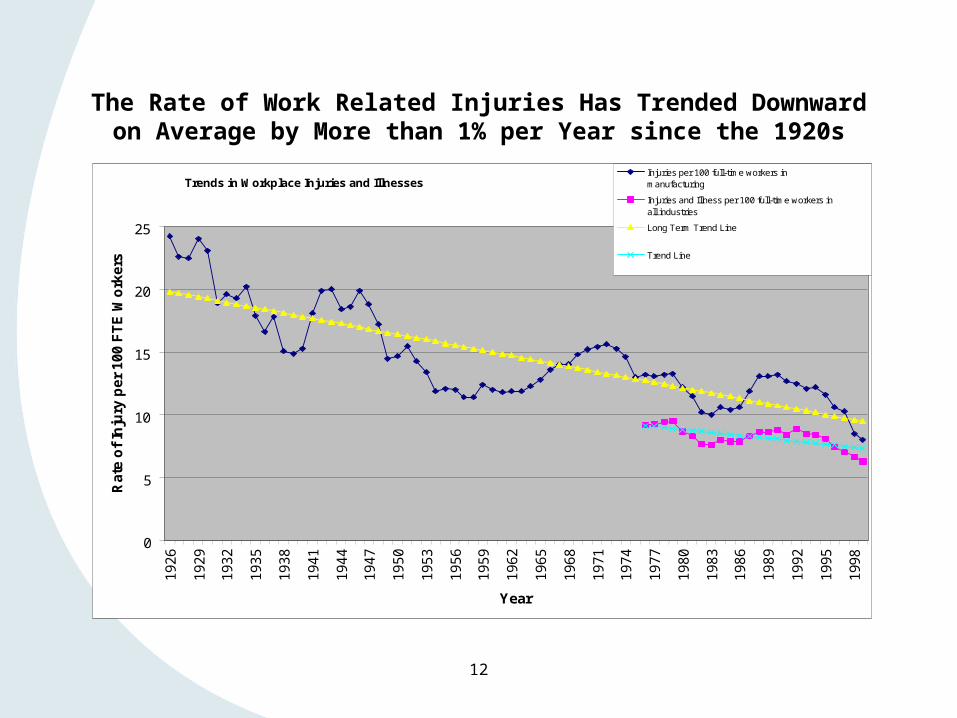
The Rate of Work Related Injuries Has Trended Downwardon Average by More than 1% per Year since the 1920s
Trends in Workplace Injuries and Illnesses
0
5
10
15
20
25
19
26
19
29
19
32
19
35
19
38
19
41
19
44
19
47
19
50
19
53
19
56
19
59
19
62
19
65
19
68
19
71
19
74
19
77
19
80
19
83
19
86
19
89
19
92
19
95
199
8
Year
Ra
te o
f In
jury
per
100 F
TE
Wo
rkers
Injuries per 100 full-time workers in manufacturing Injuries and Illness per 100 full-time workers in all industries Long Term Trend Line
Trend Line
12
13 2002 NCCI Holdings, Inc.
What can explain this tendency for frequency to decline over extended periods of time?
According to the Federal Reserve Bank of Dallas
Competitive labor markets require continuing improvement in working conditions and productivity
Source: “Have a Nice Day”, Annual Report 2000, Federal Reserve Bank of Dallas
14 2002 NCCI Holdings, Inc.
OK – the Long Term Decline Makes Sense
How about Short Term Movements?
________________________________
Frequency Typically Tracks with the Business Cycle
2002 NCCI Holdings, Inc.
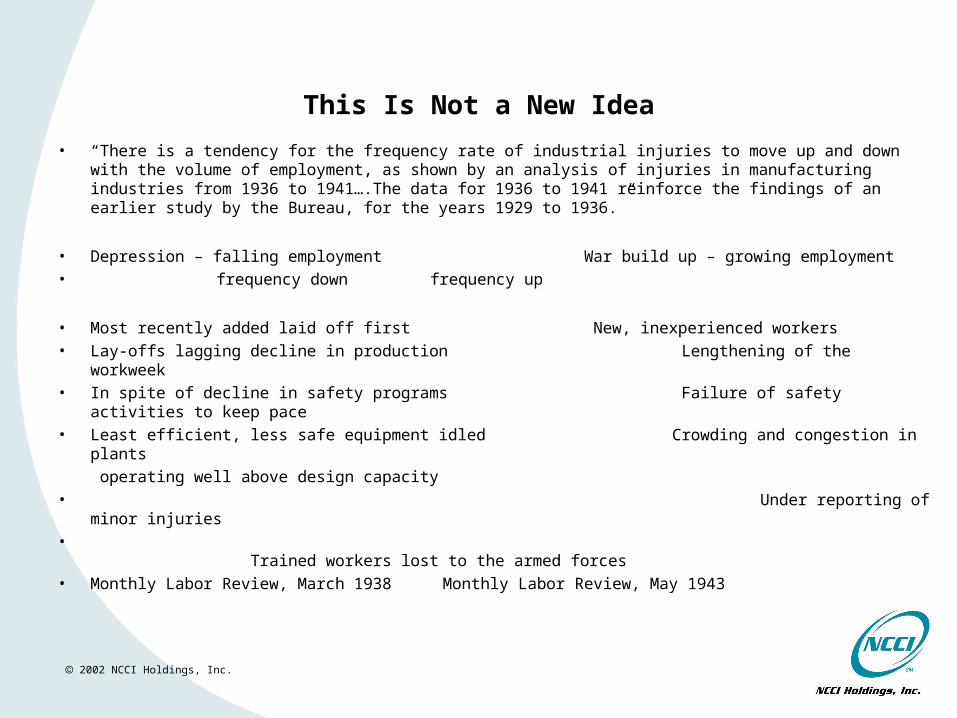
This Is Not a New Idea
• “There is a tendency for the frequency rate of industrial injuries to move up and down with the volume of employment, as shown by an analysis of injuries in manufacturing industries from 1936 to 1941….The data for 1936 to 1941 reinforce the findings of an earlier study by the Bureau, for the years 1929 to 1936.”
• Depression – falling employment War build up – growing employment• frequency down frequency up
• Most recently added laid off first New, inexperienced workers• Lay-offs lagging decline in production Lengthening of the workweek• In spite of decline in safety programs Failure of safety activities to keep pace• Least efficient, less safe equipment idled Crowding and congestion in plants
operating well above design capacity
• Under reporting of minor injuries• Trained workers lost to the armed forces• Monthly Labor Review, March 1938 Monthly Labor Review, May 1943
16 2002 NCCI Holdings, Inc.
Looking at A Quarter Century of Experience
17 2002 NCCI Holdings, Inc.
Frequency Tracks with the Business Cycle
but
The Decline in the 1990s Seems to be Different
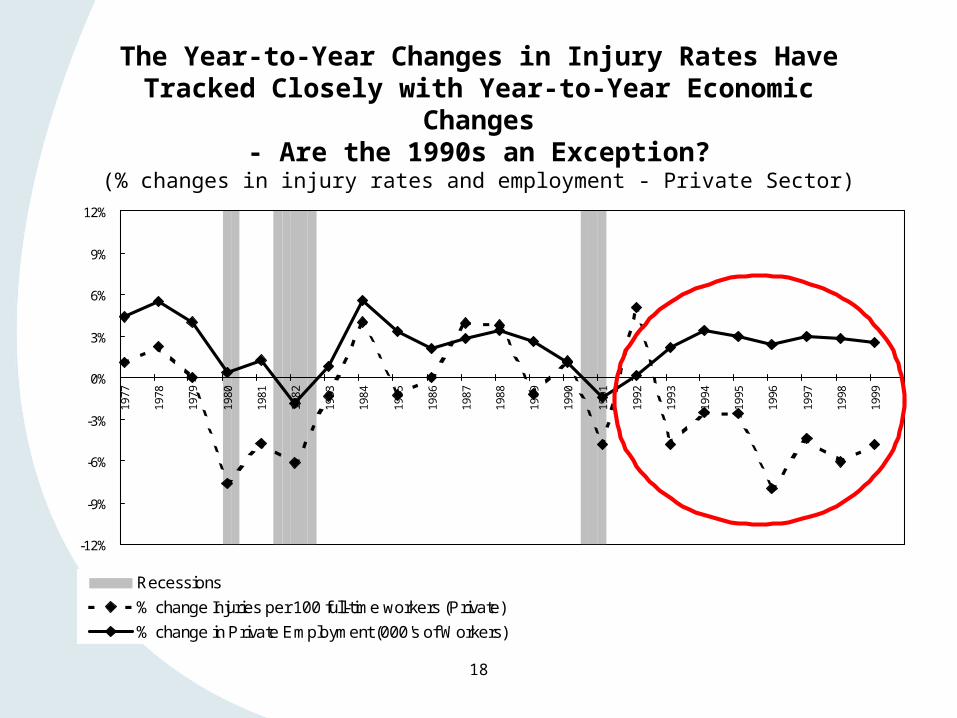
The Year-to-Year Changes in Injury Rates Have Tracked Closely with Year-to-Year Economic Changes
- Are the 1990s an Exception?(% changes in injury rates and employment - Private Sector)
-12%
-9%
-6%
-3%
0%
3%
6%
9%
12%
1977
1978
1979
1980
1981
1982
1983
1984
1985
1986
1987
1988
1989
1990
1991
1992
1993
1994
1995
1996
1997
1998
1999
Recessions
% change Injuries per 100 full-time workers (Private)
% change in Private Employment (000's of Workers)
18

19 2002 NCCI Holdings, Inc.
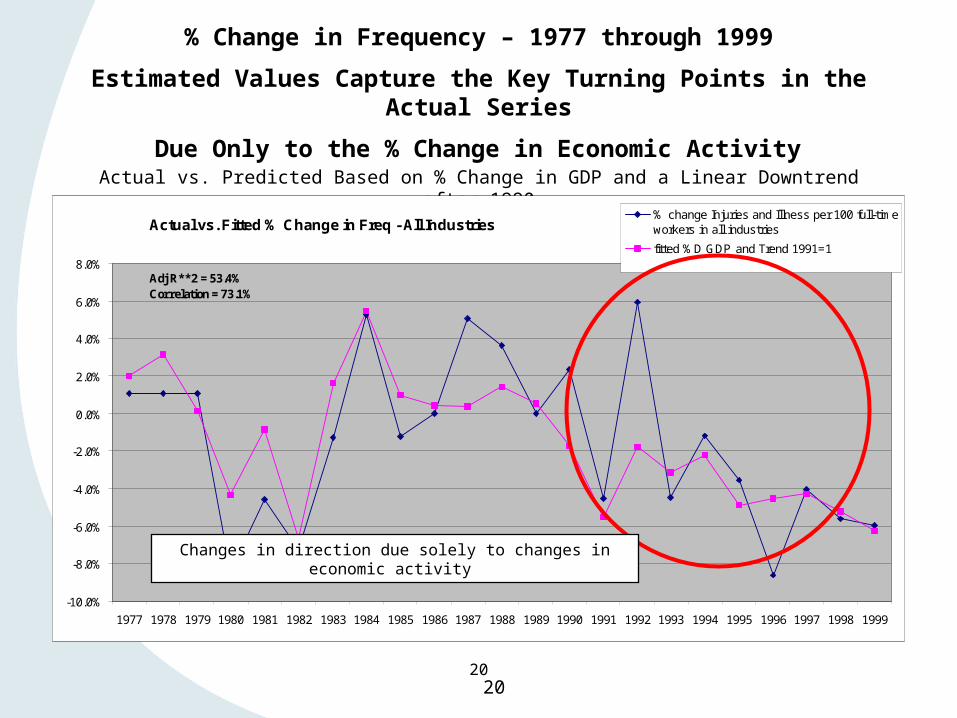
Searching for the Factors Driving the Change in Frequencywith Special Interest in the Decline of the 1990s
The 1990s May Seem Different
but
Frequency Still Tracks with the Business Cycle
when
Combined with a Powerful (Linear) Downtrend
___________________________________________________
A Regression Analysis
20
% Change in Frequency – 1977 through 1999
Estimated Values Capture the Key Turning Points in the Actual Series
Due Only to the % Change in Economic Activity
Actual vs. Predicted Based on % Change in GDP and a Linear Downtrend after 1990
Actual vs. Fitted % Change in Freq - All Industries
-10.0%
-8.0%
-6.0%
-4.0%
-2.0%
0.0%
2.0%
4.0%
6.0%
8.0%
1977 1978 1979 1980 1981 1982 1983 1984 1985 1986 1987 1988 1989 1990 1991 1992 1993 1994 1995 1996 1997 1998 1999
% change Injuries and Illness per 100 full-timeworkers in all industries
fitted %D GDP and Trend 1991=1
Adj R**2 = 53.4%Correlation = 73.1%
20
Changes in direction due solely to changes in economic activity
21 2002 NCCI Holdings, Inc.
Workers Comp Industry Concerns
• What Is the Source of this Downtrend?
• Will the Improvement Hold?
• Will the Decline Actually Reverse?
22 2002 NCCI Holdings, Inc.
Country Wide Experience in the 1990s
A Steady Decline
How Remarkable Is This?

23 2002 NCCI Holdings, Inc.
It’s Remarkable
and
It’s International
24 2002 NCCI Holdings, Inc.
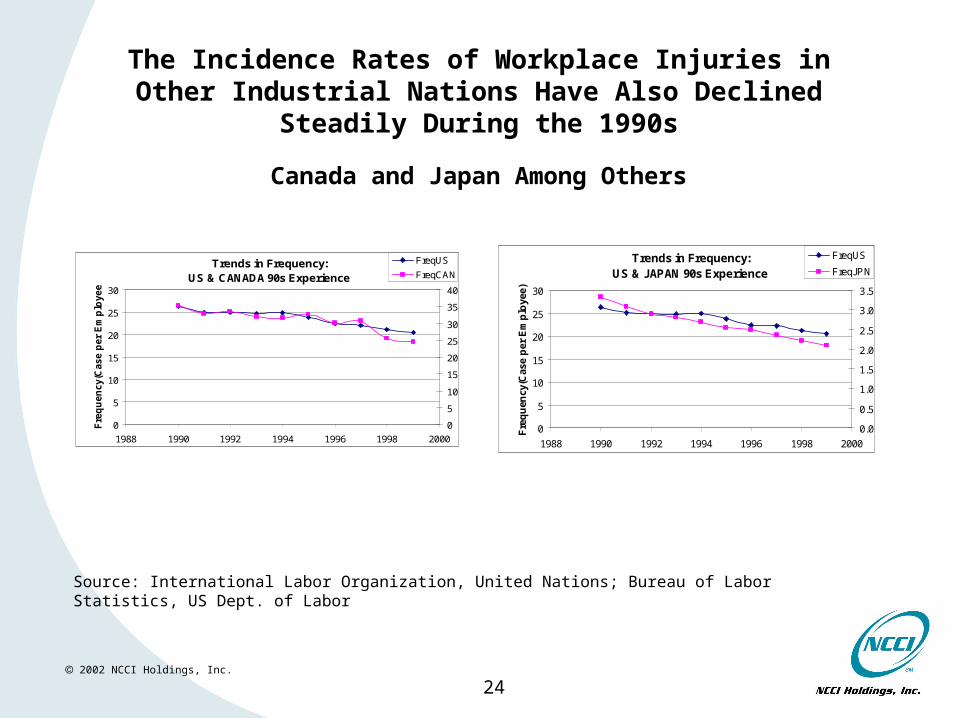
The Incidence Rates of Workplace Injuries in Other Industrial Nations Have Also Declined Steadily During the 1990s
Canada and Japan Among Others
Trends in Frequency: US & JAPAN 90s Experience
0
5
10
15
20
25
30
1988 1990 1992 1994 1996 1998 2000
Fre
qu
ency
(Cas
e p
er E
mp
loye
e)
0.0
0.5
1.0
1.5
2.0
2.5
3.0
3.5
FreqUS
FreqJPNTrends in Frequency:
US & CANADA 90s Experience
0
5
10
15
20
25
30
1988 1990 1992 1994 1996 1998 2000
Fre
qu
en
cy(C
ase p
er
Em
plo
yee)
0
5
10
15
20
25
30
35
40
FreqUS
FreqCAN
Source: International Labor Organization, United Nations; Bureau of Labor Statistics, US Dept. of Labor
25 2002 NCCI Holdings, Inc.
Attention Shoppers
It’s Just Business
And
Wal-Mart Told Us Why
26 2002 NCCI Holdings, Inc.
Enhance Productivity to Compete
• McKinsey on Productivity Growth in the Last Half of the 1990s (NY Times 2/28/02)
• Competition and better management, not simply the spread of computers and the Internet, made the difference. Nowhere was that clearer than in retailing.
• Wal-Mart’s managerial innovations contributed mightily to the big increase in
America productivity in the late 1990s. • Most of the practices aren’t glamorous. • In some cases, not completely filling a pallet with goods can save so much time in
stocking the store that what seems “inefficient” at the warehouse is more productive overall.
• More in The McKinsey Quarterly (www.themckinseyquarterly.com)
27 2002 NCCI Holdings, Inc.
Wal-Mart’s Strategy
According to John Leyenberger, the divisional risk control director at Wal-Mart Stores:
• The decline in injuries is not due to just one thing.
• The Wal-Mart strategy is to minimize the number of times they handle the merchandise in order to increase both efficiency and safety.
28 2002 NCCI Holdings, Inc.
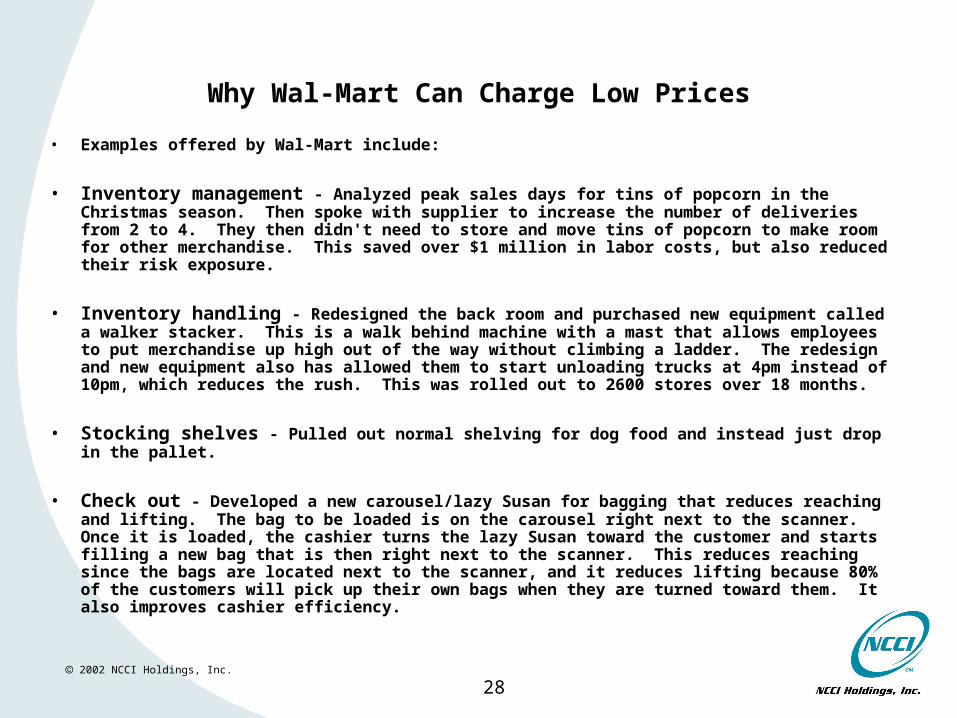
Why Wal-Mart Can Charge Low Prices
• Examples offered by Wal-Mart include:
• Inventory management - Analyzed peak sales days for tins of popcorn in the Christmas season. Then spoke with supplier to increase the number of deliveries from 2 to 4. They then didn't need to store and move tins of popcorn to make room for other merchandise. This saved over $1 million in labor costs, but also reduced their risk exposure.
• Inventory handling - Redesigned the back room and purchased new equipment called a walker stacker. This is a walk behind machine with a mast that allows employees to put merchandise up high out of the way without climbing a ladder. The redesign and new equipment also has allowed them to start unloading trucks at 4pm instead of 10pm, which reduces the rush. This was rolled out to 2600 stores over 18 months.
• Stocking shelves - Pulled out normal shelving for dog food and instead just drop in the pallet.
• Check out - Developed a new carousel/lazy Susan for bagging that reduces reaching and lifting. The bag to be loaded is on the carousel right next to the scanner. Once it is loaded, the cashier turns the lazy Susan toward the customer and starts filling a new bag that is then right next to the scanner. This reduces reaching since the bags are located next to the scanner, and it reduces lifting because 80% of the customers will pick up their own bags when they are turned toward them. It also improves cashier efficiency.
29 2002 NCCI Holdings, Inc.
Applying the Knowledge
Supporting Loss Cost Filings
30 2002 NCCI Holdings, Inc.
States Differ
One Size Doesn’t Fit All
31 2002 NCCI Holdings, Inc.
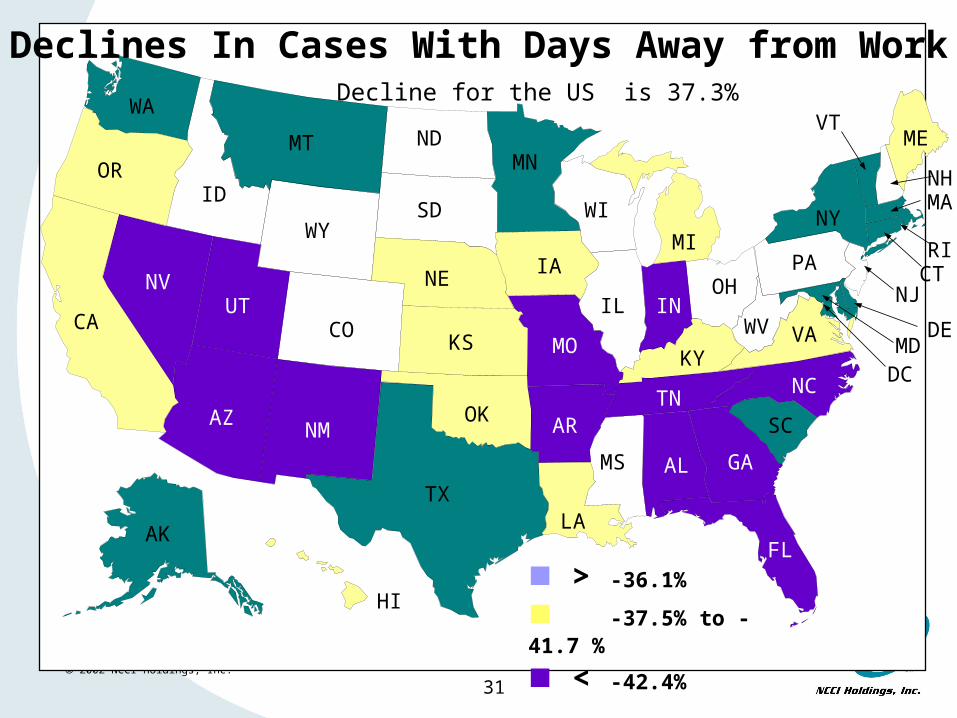
Declines In Cases With Days Away from Work
> -36.1%
< -37.5% to -41.7 %
< -42.4%
Decline for the US is 37.3%
AK
OR
UT
WY
MT
SD
ND
KS
NE
OKNM
MO
AR
LA
MS
KY
TN
AL
FL
WI
INOH
PA
NY
ME
WV
NC
SC
GA
VAIL
MIIA
MN
TX
CO
AZ
ID
NV
CA
WA
NHMA
RICT
NJ
VT
HI
DE
DCMD
32 2002 NCCI Holdings, Inc.
Econometric Analysis of Loss Trends
Factors that Drive the Number of Claims
• Exposure - covered employment
• Long term changes in the nature of work
• Short term surges in employment - the business cycle

33 2002 NCCI Holdings, Inc.
How Well Does This Simple Model Do?
34 2002 NCCI Holdings, Inc.
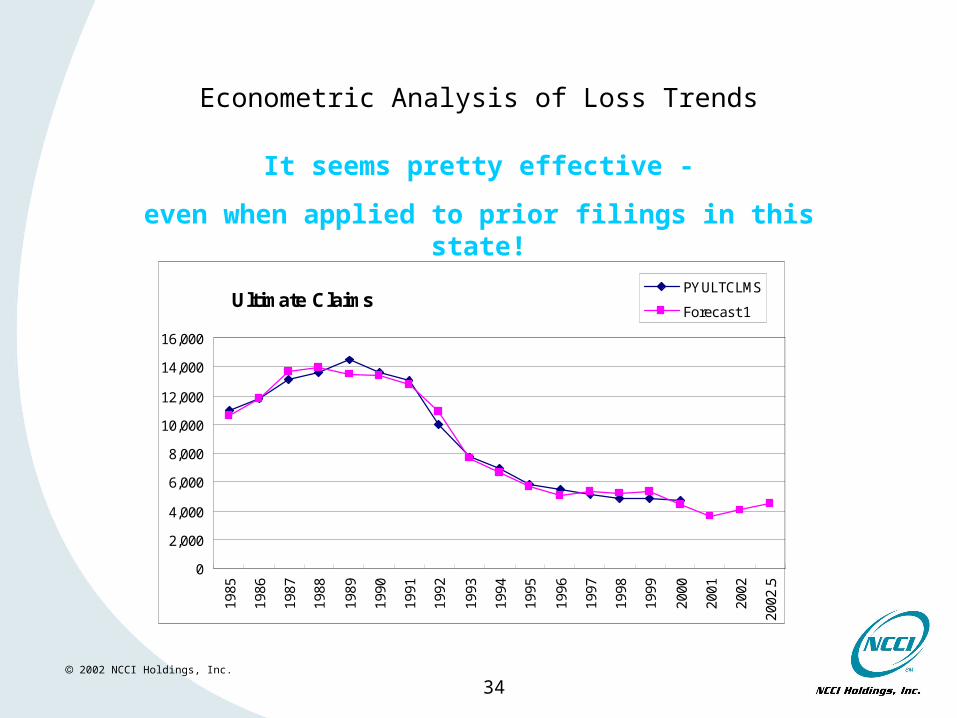
Econometric Analysis of Loss Trends
Ultimate Claims
0
2,000
4,000
6,000
8,000
10,000
12,000
14,000
16,000
1985
1986
1987
1988
1989
1990
1991
1992
1993
1994
1995
1996
1997
1998
1999
2000
2001
2002
2002
.5
PYULTCLMS
Forecast 1
It seems pretty effective -
even when applied to prior filings in this state!
35 2002 NCCI Holdings, Inc.
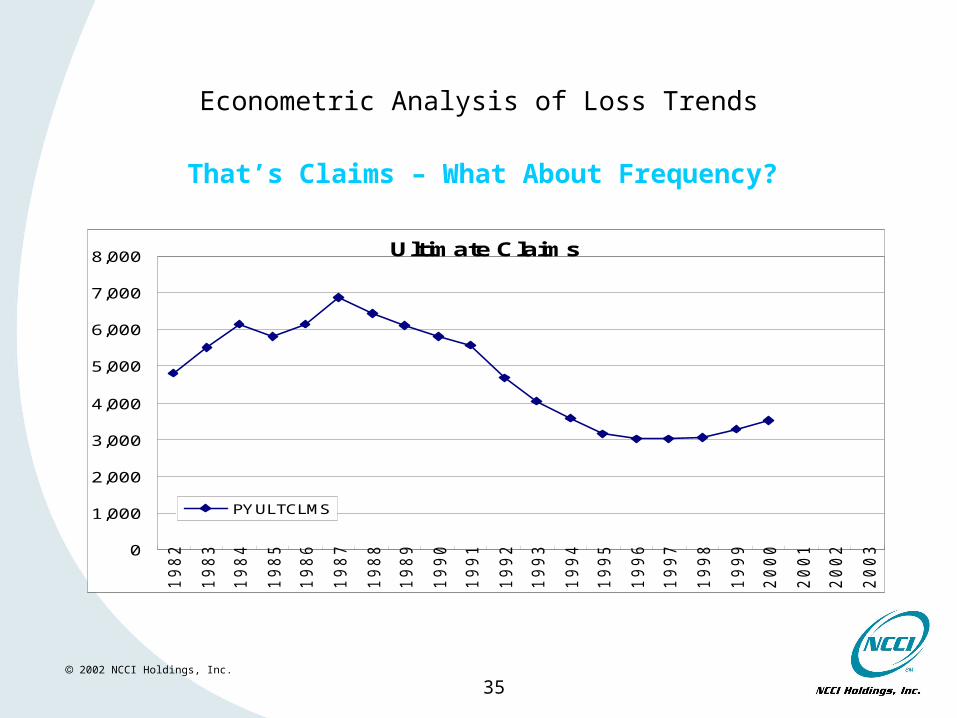
Econometric Analysis of Loss Trends
Ultimate Claims
0
1,000
2,000
3,000
4,000
5,000
6,000
7,000
8,000
1982
1983
1984
1985
1986
1987
1988
1989
1990
1991
1992
1993
1994
1995
1996
1997
1998
1999
2000
2001
2002
2003
PYULTCLMS
That’s Claims – What About Frequency?
36 2002 NCCI Holdings, Inc.
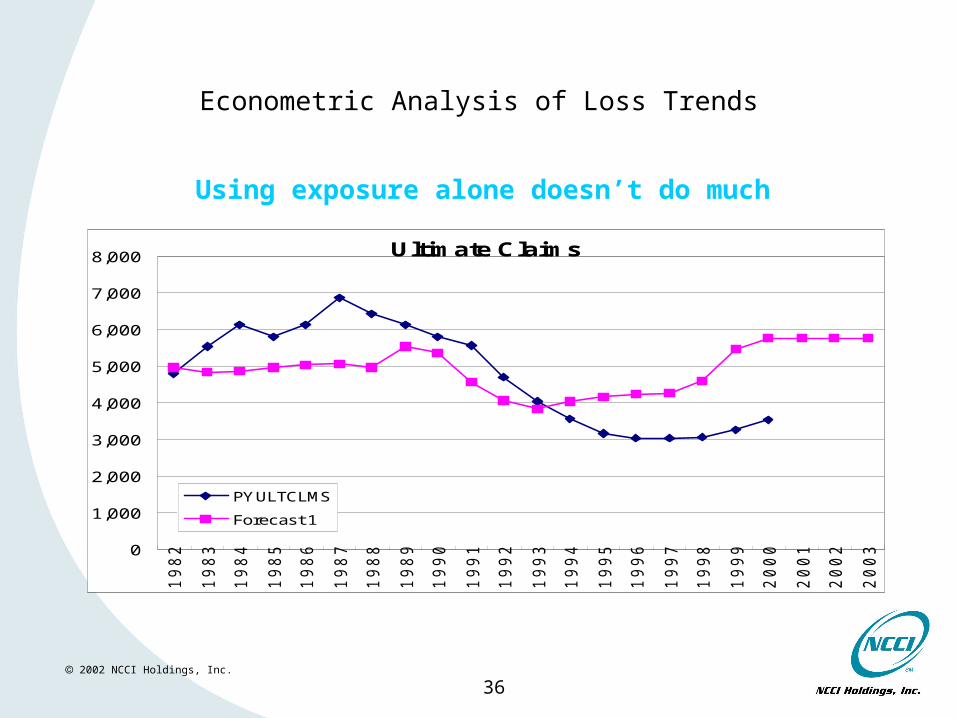
Econometric Analysis of Loss Trends
Ultimate Claims
0
1,000
2,000
3,000
4,000
5,000
6,000
7,000
8,000
1982
1983
1984
1985
1986
1987
1988
1989
1990
1991
1992
1993
1994
1995
1996
1997
1998
1999
2000
2001
2002
2003
PYULTCLMS
Forecast 1
Using exposure alone doesn’t do much
37 2002 NCCI Holdings, Inc.
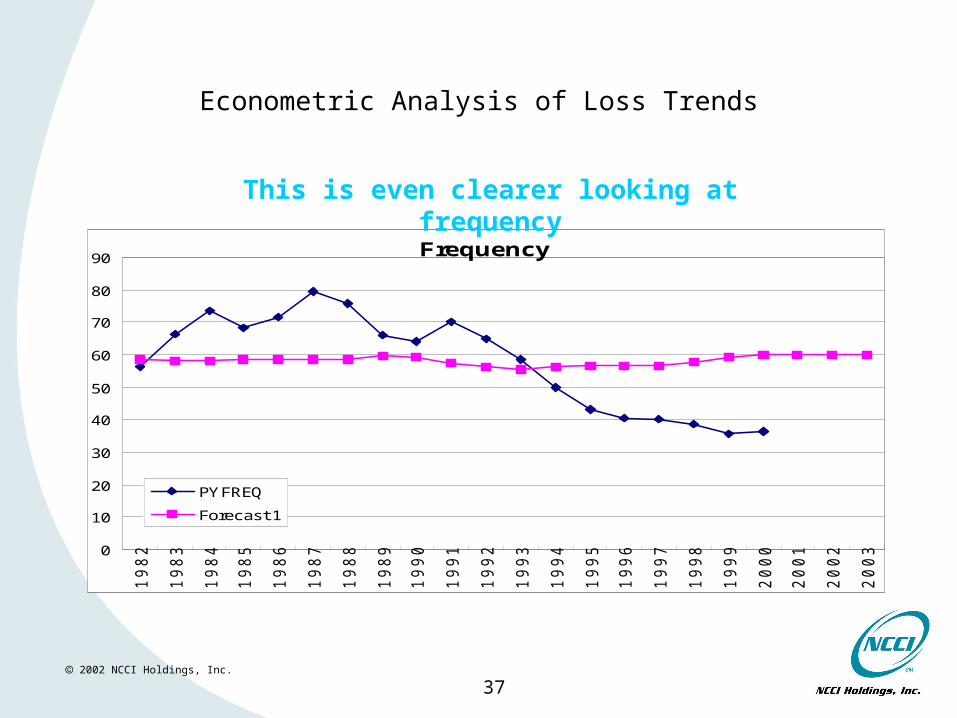
Econometric Analysis of Loss Trends
Frequency
0
10
20
30
40
50
60
70
80
90
1982
1983
1984
1985
1986
1987
1988
1989
1990
1991
1992
1993
1994
1995
1996
1997
1998
1999
2000
2001
2002
2003
PYFREQ
Forecast 1
This is even clearer looking at frequency
38 2002 NCCI Holdings, Inc.
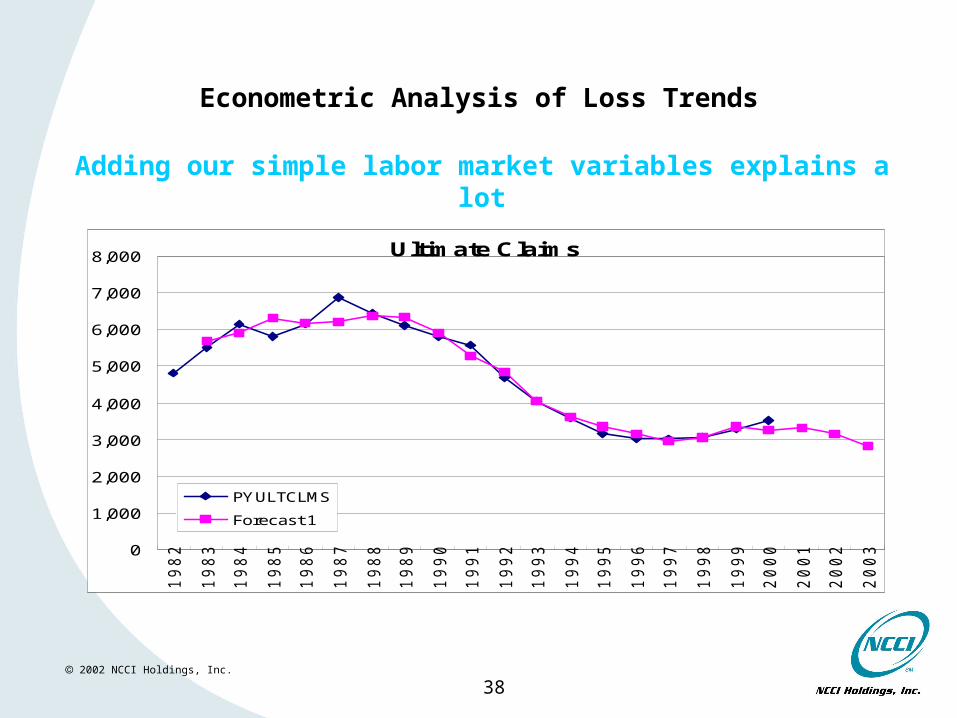
Econometric Analysis of Loss Trends
Ultimate Claims
0
1,000
2,000
3,000
4,000
5,000
6,000
7,000
8,000
1982
1983
1984
1985
1986
1987
1988
1989
1990
1991
1992
1993
1994
1995
1996
1997
1998
1999
2000
2001
2002
2003
PYULTCLMS
Forecast 1
Adding our simple labor market variables explains a lot
39 2002 NCCI Holdings, Inc.
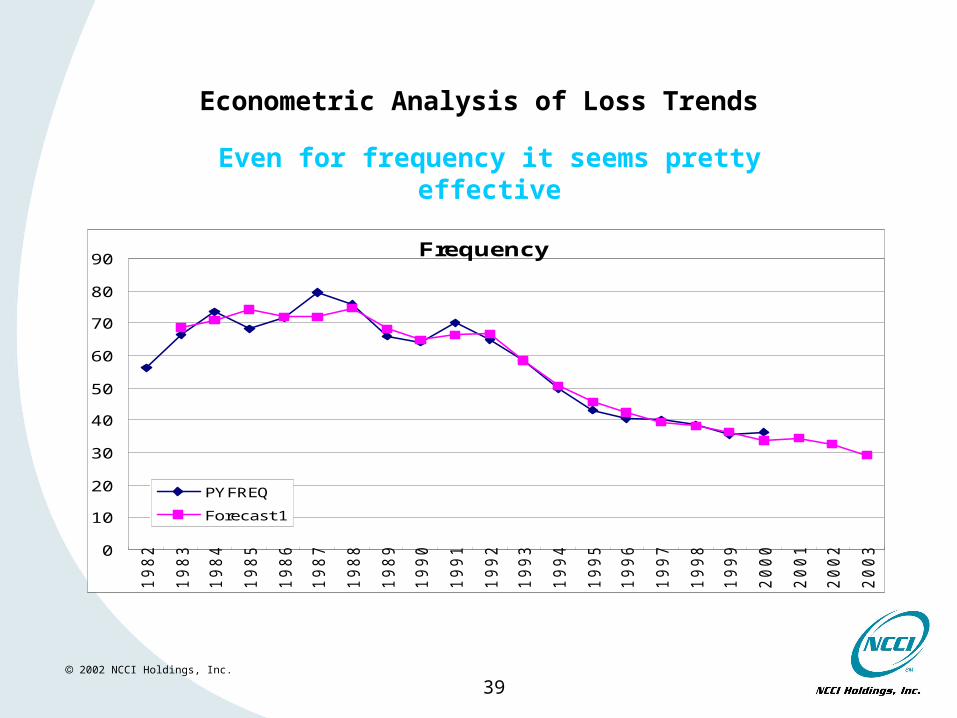
Econometric Analysis of Loss Trends
Frequency
0
10
20
30
40
50
60
70
80
90
1982
1983
1984
1985
1986
1987
1988
1989
1990
1991
1992
1993
1994
1995
1996
1997
1998
1999
2000
2001
2002
2003
PYFREQ
Forecast 1
Even for frequency it seems pretty effective
40 2002 NCCI Holdings, Inc.
Frequency Research at NCCI
• We believe that we have identified key drivers.
• This has helped in the analysis of loss cost trends.
• The research continues.

2002 NCCI Holdings, Inc.
Thank You for the Opportunity to Share This Information
Questions or Comments?