Embed Size (px)
Citation preview

Itaú Unibanco Holding S.A.
Management Discussion & Analysis andComplete Financial Statements
3rd Quarter 2009
Itaú Unibanco
Contents
Management Discussion and Analysis 1
Complete Financial Statements 41
ITAÚ UNIBANCO HOLDING S.A.
INFORMATION ON THE RESULTS FROM JANUARY TO SEPTEMBER 2009
We present below the main results of Itaú Unibanco Holding S.A. (Itaú Unibanco) for the period from January to September 2009. Considering the merger that created Itaú Unibanco at the end of 2008 and aiming at providing a better understanding of the changes in assets, liabilities and results of the new institution, for the effect of comparability, the data related to the period from January to September 2008 takes into consideration the addition of Itaú and Unibanco figures.
1. Net income for the period from January to September 2009 totaled R$ 6.9 billion, with annualized return of 19.8% on average equity (25.5% for the period from January to September 2008). Recurring net income was R$ 7.7 billion, with annualized return of 22.2%. Consolidated stockholders' equity totaled R$ 48.9 billion at the end of September 2009. Basel ratio stood at 16.3% at the end of September, based on economic-financial consolidated.
2. Itaú Unibanco’s preferred shares rose 48.6%, as compared to the quotation of December 31, 2008. The
market value at Stock Exchanges was R$ 161.0 billion at the end of September, which ranked Itaú Unibanco 11th in the global bank ranking.
3. In the period from January to September 2009, Itaú Unibanco paid or provided for taxes and
contributions in the amount of R$ 11.5 billion. The Bank also withheld and passed on taxes, which were directly levied on financial operations, in the amount of R$ 5.7 billion.
4. Consolidated assets totaled R$ 612.4 billion at September 30, 2009 the highest among the private
financial groups of Latin America. The loan portfolio, including endorsements and sureties, totaled R$ 268.7 billion, an increase of 5.5% as compared to September 30, 2008. In Brazil, non-mandatory loans to the individuals segment reached R$ 98.4 billion, with a growth of 6.3%. The large company segment reached R$ 90.3 billion, and the very small, small and middle-market company segment reached R$ 56.7 billion, with an increase of 18.1%.
5. Total free, raised and managed own assets amounted to R$ 832.6 billion, an increase of 8.7% as
compared to September 30, 2008. Technical provisions for insurance, pension plan and capitalization totaled R$ 50.0 billion at the end of September 2009.
6. In the investment banking area, Itaú BBA took part in operations of debentures and promissory notes
that totaled R$ 13.3 billion, and of securitization that totaled R$ 780 million in the period from January to September 2009. These operations assured the leadership in the Anbid ranking regarding the distribution of fixed income in the period from January to September 2009. In capital markets, it coordinated public offerings that totaled R$ 5.3 billion.
7. Itaú Unibanco employed approximately 103 thousand people at the end of September 2009. The
employees' fixed compensation plus charges and benefits totaled R$ 6.3 billion in the period from January to September 2009. In addition, approximately R$ 79 million were invested in education, training and development programs. At present, Itaú Unibanco is in the list comprising the best companies to work of the Great Place to Work Institute (partnership with the Época Magazine) and of FIA/USP (partnership with the Exame/Você S/A magazine).
8. Itaú Unibanco and Porto Seguro entered on August 23, 2009 into an alliance aimed at the unification of
residence and automobile insurance operations for the exclusive offer and distribution of products of these segments to the customers of the Itaú Unibanco branch network in Brazil and Uruguay. The completion of the alliance between Itaú Unibanco and Porto Seguro depends on the approval at the stockholders’ meeting and of the Brazilian Antitrust System (SBDC). On October 16, SUSEP granted prior authorization for the corporate acts related to this alliance.
9. Itaú Unibanco and Tempo Participações signed on September 24, 2009 a Memorandum of
Understanding aimed at transferring 100% of Unibanco Saúde Seguradora’s capital to Tempo. In the coming 90 days, Tempo and Itaú Seguros will sign a definitive documentation detailing the rules outlined in the Memorandum of Understanding. The conclusion of this agreement will depend on the approval of the bodies in charge, including the ANS (Brazilian Health Agency – the health market regulator) and SBDC.
10. Companhia Brasileira de Distribuição (CBD) and Itaú Unibanco concluded on August 28, 2009 the
negotiation related to the company Financeira Itaú CBD S.A. Crédito, Financiamento e Investimento (FIC). The agreement which created FIC was amended, in order to exclude the obligation of exclusivity of Itaú Unibanco. CBD and Itaú Unibanco also agreed to extend the exclusivity granted by CBD to FIC to an additional term of five years for the offer of financial products and services.
11. For the tenth consecutive year, Itaú Unibanco was selected to make up the portfolio of the Dow Jones
Sustainability World Index (DJSI), in its 2009/2010 review, comprising 317 companies of 26 countries. It thus continues to be the only Latin America institution to be included in this index since it was created in 1999. Of the seven Brazilian companies which were selected, three are of the Group: Itaúsa, Itaú Unibanco, and Redecard. In the third quarter, Itaú Unibanco was considered the leader of its sector in Brazil and Latin America, according to the evaluation of The Banker magazine; it received from the Euromoney magazine the award of best bank in Brazil for the 11th time; and it was considered by Guia Exame de Investimentos Pessoais the best bank in investment fund management. Itaú Private Bank was recognized by the Private Banker International (PBI) magazine as the best bank in Latin America.
12. In the period from January to September 2009, social and cultural investments of Itaú Unibanco totaled
R$ 129 million. The Programa de Voluntários (volunteers program) launched the Sábado Voluntário (volunteering Saturday) event. Semana Voluntária (volunteering week) encouraged the volunteer service among employees in the administrative centers. Instituto Unibanco mobilized 35 thousand students, parents and teachers to carry out improvements in 42 schools in São Paulo. In addition to the 48 schools already benefited in Belo Horizonte, Porto Alegre, and São Paulo, the amount of R$ 5.4 million was provided to improve the quality of education in 45 new public schools, thus benefiting 50 thousand students. Instituto Itaú Cultural carried out 314 events in Brazil and 101 in a number of countries between January and September 2009.
The complete financial statements and the Management’s Discussion & Analysis Report of Itaú Unibanco, which present further details on the results for the period, are available on the Itaú Unibanco website (www.itau-unibanco.com/ir).
São Paulo, October 30, 2009. Pedro Moreira Salles Chairman of the Board of Directors
Itaú Unibanco Holding S.A.
Management Discussion & Analysis
3rd Quarter 2009
Management Discussion and Analysis Itaú Unibanco Holding S.A.
Itaú Unibanco
Contents
The tables in this report show the figures in millions. Variations, however, are calculated in units.
Future expectations arising from the reading of this analysis should take into consideration the risks and uncertainties that involve any activities and that are outside the control of the companies of the conglomerate (political and economic changes, volatility in interest and foreign exchange rates, technological changes, inflation, financial disintermediation, competitive pressures on products and prices, and changes in tax legislation).
2
Executive Summary 03
Analysis of Net Income 10
Managerial Financial Margin 11
Results from Loan and Lease Losses 13
Banking Service Fees and Banking Charge Revenues 15
Non-interest Expenses 16
Income Tax and Social Contribution 17
Balance Sheet 18
Balance Sheet by Currency 22
Value at Risk 23
Ownership Structure 24
Pro Forma Financial Statements by Segment 26
Commercial Bank 30
Itaú BBA 31
Consumer Credit 31
Insurance, Pension Plans and Capitalization 32
Report of Independent Accountants 39
Activities Abroad 36
Complete Financial Statements 41
For comparison purposes, we have adjusted the accounting statements (statements of income and balance sheets) for periods before the first quarter of 2009, to include the full consolidation of Redecard.
It should be noted that the information included in this report relating to prior periods has been reclassified for comparison purposes.
Management Discussion and Analysis Itaú Unibanco Holding S.A.
Itaú Unibanco
3
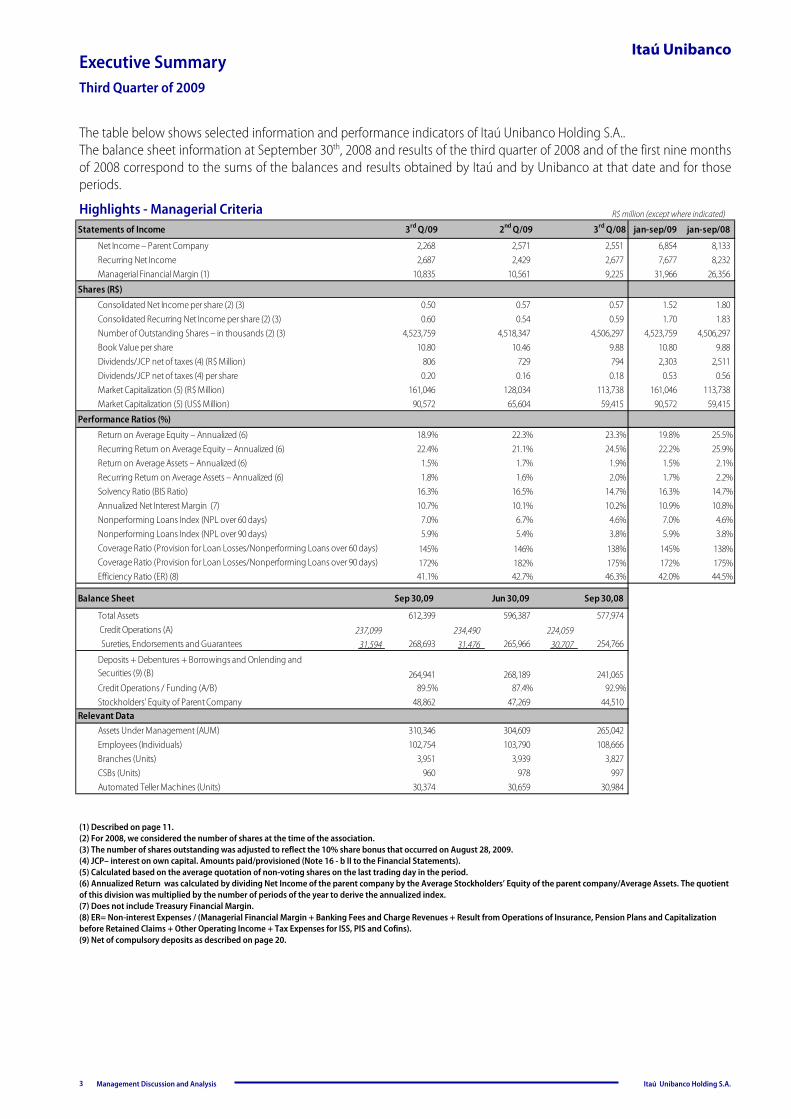
Highlights - Managerial Criteria
Executive Summary Third Quarter of 2009
The table below shows selected information and performance indicators of Itaú Unibanco Holding S.A.. The balance sheet information at September 30th, 2008 and results of the third quarter of 2008 and of the first nine months of 2008 correspond to the sums of the balances and results obtained by Itaú and by Unibanco at that date and for those periods.
(1) Described on page 11. (2) For 2008, we considered the number of shares at the time of the association. (3) The number of shares outstanding was adjusted to reflect the 10% share bonus that occurred on August 28, 2009. (4) JCP– interest on own capital. Amounts paid/provisioned (Note 16 - b II to the Financial Statements). (5) Calculated based on the average quotation of non-voting shares on the last trading day in the period. (6) Annualized Return was calculated by dividing Net Income of the parent company by the Average Stockholders’ Equity of the parent company/Average Assets. The quotient of this division was multiplied by the number of periods of the year to derive the annualized index. (7) Does not include Treasury Financial Margin. (8) ER= Non-interest Expenses / (Managerial Financial Margin + Banking Fees and Charge Revenues + Result from Operations of Insurance, Pension Plans and Capitalization before Retained Claims + Other Operating Income + Tax Expenses for ISS, PIS and Cofins). (9) Net of compulsory deposits as described on page 20.
R$ million (except where indicated)
Statements of Income jan-sep/09 jan-sep/08
Net Income – Parent Company 2,268 2,571 2,551 6,854 8,133Recurring Net Income 2,687 2,429 2,677 7,677 8,232Managerial Financial Margin (1) 10,835 10,561 9,225 31,966 26,356
Shares (R$)
Consolidated Net Income per share (2) (3) 0.50 0.57 0.57 1.52 1.80 Consolidated Recurring Net Income per share (2) (3) 0.60 0.54 0.59 1.70 1.83 Number of Outstanding Shares – in thousands (2) (3) 4,523,759 4,518,347 4,506,297 4,523,759 4,506,297Book Value per share 10.80 10.46 9.88 10.80 9.88Dividends/JCP net of taxes (4) (R$ Million) 806 729 794 2,303 2,511 Dividends/JCP net of taxes (4) per share 0.20 0.16 0.18 0.53 0.56 Market Capitalization (5) (R$ Million) 161,046 128,034 113,738 161,046 113,738 Market Capitalization (5) (US$ Million) 90,572 65,604 59,415 90,572 59,415
Performance Ratios (%)
Return on Average Equity – Annualized (6) 18.9% 22.3% 23.3% 19.8% 25.5%Recurring Return on Average Equity – Annualized (6) 22.4% 21.1% 24.5% 22.2% 25.9%Return on Average Assets – Annualized (6) 1.5% 1.7% 1.9% 1.5% 2.1%Recurring Return on Average Assets – Annualized (6) 1.8% 1.6% 2.0% 1.7% 2.2%Solvency Ratio (BIS Ratio) 16.3% 16.5% 14.7% 16.3% 14.7%Annualized Net Interest Margin (7) 10.7% 10.1% 10.2% 10.9% 10.8%Nonperforming Loans Index (NPL over 60 days) 7.0% 6.7% 4.6% 7.0% 4.6%Nonperforming Loans Index (NPL over 90 days) 5.9% 5.4% 3.8% 5.9% 3.8%Coverage Ratio (Provision for Loan Losses/Nonperforming Loans over 60 days) 145% 146% 138% 145% 138%Coverage Ratio (Provision for Loan Losses/Nonperforming Loans over 90 days) 172% 182% 175% 172% 175%Efficiency Ratio (ER) (8) 41.1% 42.7% 46.3% 42.0% 44.5%
Balance Sheet Sep 30,09 Jun 30,09 Sep 30,08
Total Assets 612,399 596,387 577,974 Credit Operations (A) 237,099 234,490 224,059 Sureties, Endorsements and Guarantees 31,594 268,693 31,476 265,966 30,707 254,766
Deposits + Debentures + Borrowings and Onlending and Securities (9) (B) 264,941 268,189 241,065Credit Operations / Funding (A/B) 89.5% 87.4% 92.9%Stockholders' Equity of Parent Company 48,862 47,269 44,510
Relevant DataAssets Under Management (AUM) 310,346 304,609 265,042Employees (Individuals) 102,754 103,790 108,666Branches (Units) 3,951 3,939 3,827 CSBs (Units) 960 978 997 Automated Teller Machines (Units) 30,374 30,659 30,984
3rd Q/09 2nd Q/09 3rd Q/08
Management Discussion and Analysis Itaú Unibanco Holding S.A.
Itaú Unibanco
Managerial Statement of Income
R$ million
4
Macroeconomic Indices
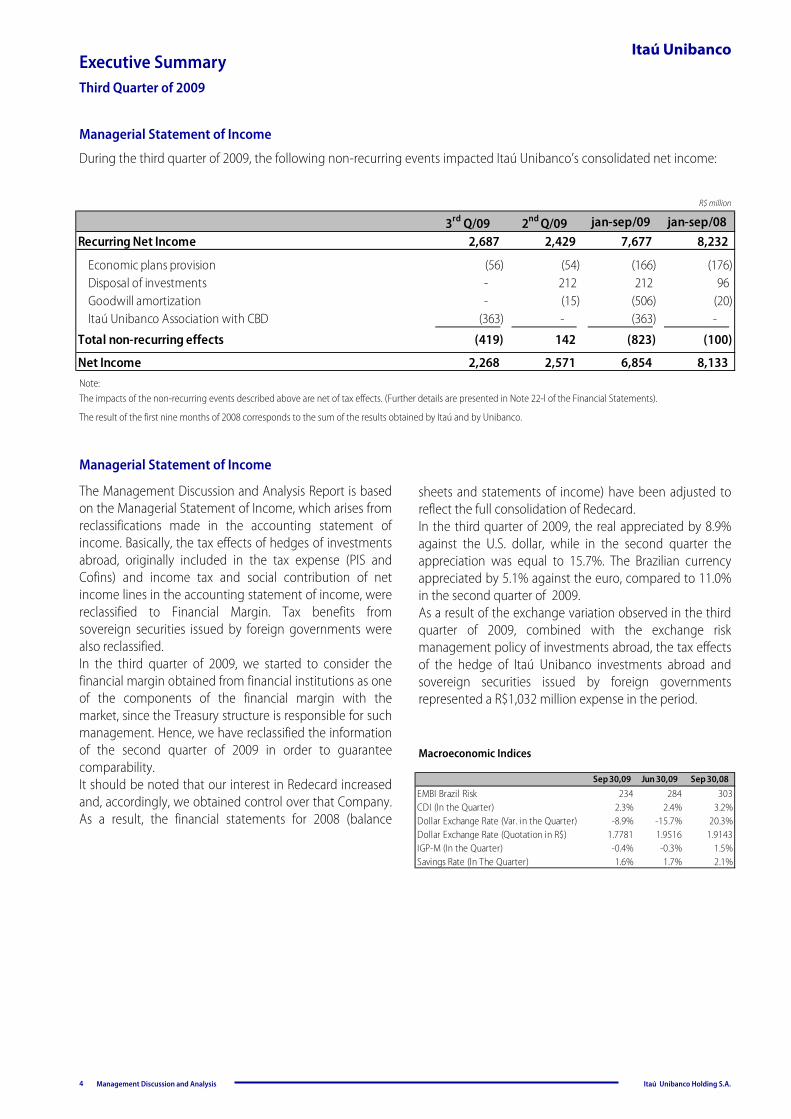
The impacts of the non-recurring events described above are net of tax effects. (Further details are presented in Note 22-l of the Financial Statements). Note:
Executive Summary Third Quarter of 2009
The result of the first nine months of 2008 corresponds to the sum of the results obtained by Itaú and by Unibanco.
Managerial Statement of Income
During the third quarter of 2009, the following non-recurring events impacted Itaú Unibanco’s consolidated net income:
The Management Discussion and Analysis Report is based on the Managerial Statement of Income, which arises from reclassifications made in the accounting statement of income. Basically, the tax effects of hedges of investments abroad, originally included in the tax expense (PIS and Cofins) and income tax and social contribution of net income lines in the accounting statement of income, were reclassified to Financial Margin. Tax benefits from sovereign securities issued by foreign governments were also reclassified. In the third quarter of 2009, we started to consider the financial margin obtained from financial institutions as one of the components of the financial margin with the market, since the Treasury structure is responsible for such management. Hence, we have reclassified the information of the second quarter of 2009 in order to guarantee comparability. It should be noted that our interest in Redecard increased and, accordingly, we obtained control over that Company. As a result, the financial statements for 2008 (balance
sheets and statements of income) have been adjusted to reflect the full consolidation of Redecard. In the third quarter of 2009, the real appreciated by 8.9% against the U.S. dollar, while in the second quarter the appreciation was equal to 15.7%. The Brazilian currency appreciated by 5.1% against the euro, compared to 11.0% in the second quarter of 2009. As a result of the exchange variation observed in the third quarter of 2009, combined with the exchange risk management policy of investments abroad, the tax effects of the hedge of Itaú Unibanco investments abroad and sovereign securities issued by foreign governments represented a R$1,032 million expense in the period.
3rd Q/09 2nd Q/09 jan-sep/09 jan-sep/08Recurring Net Income 2,687 2,429 7,677 8,232
Economic plans provision (56) (54) (166) (176) Disposal of investments - 212 212 96 Goodwill amortization - (15) (506) (20) Itaú Unibanco Association with CBD (363) - (363) -
Total non-recurring effects (419) 142 (823) (100)
Net Income 2,268 2,571 6,854 8,133
Macroeconomic Indices
Sep 30,09 Jun 30,09 Sep 30,08
EMBI Brazil Risk 234 284 303CDI (In the Quarter) 2.3% 2.4% 3.2%Dollar Exchange Rate (Var. in the Quarter) -8.9% -15.7% 20.3%Dollar Exchange Rate (Quotation in R$) 1.7781 1.9516 1.9143IGP-M (In the Quarter) -0.4% -0.3% 1.5%Savings Rate (In The Quarter) 1.6% 1.7% 2.1%
Management Discussion and Analysis Itaú Unibanco Holding S.A.
Itaú Unibanco
Managerial Statement of Income
R$ million
R$ million
5
Executive Summary Third Quarter of 2009
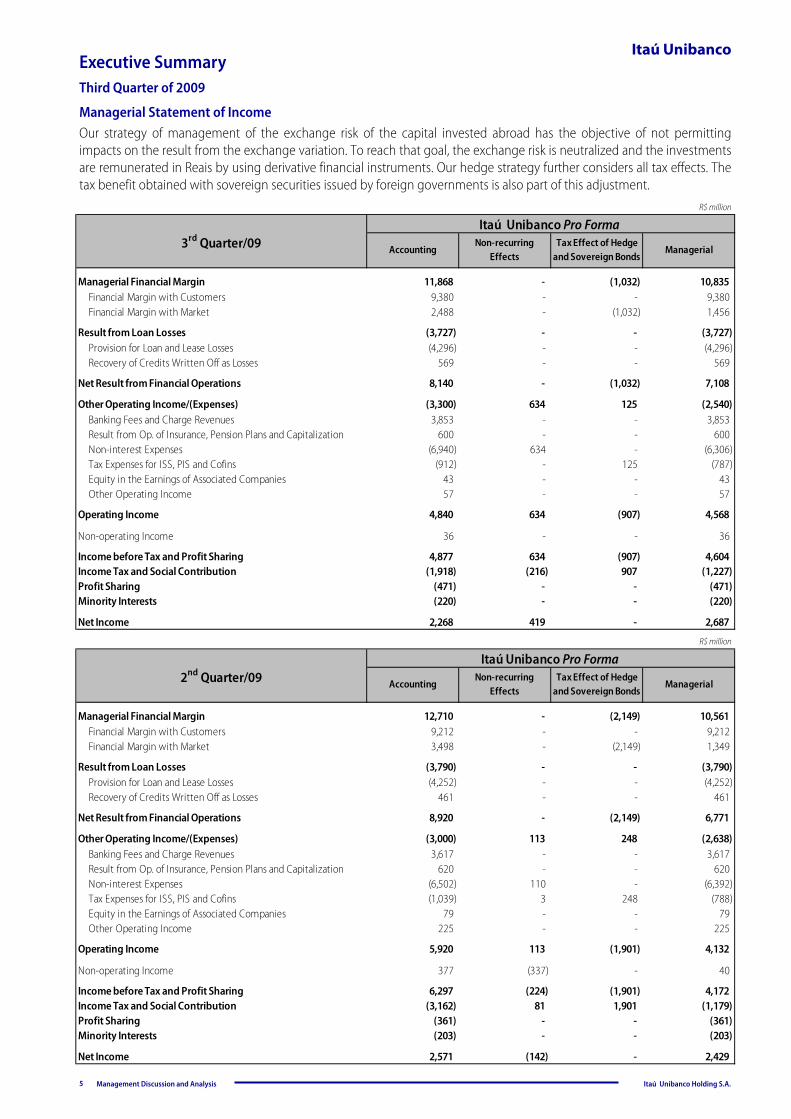
Our strategy of management of the exchange risk of the capital invested abroad has the objective of not permitting impacts on the result from the exchange variation. To reach that goal, the exchange risk is neutralized and the investments are remunerated in Reais by using derivative financial instruments. Our hedge strategy further considers all tax effects. The tax benefit obtained with sovereign securities issued by foreign governments is also part of this adjustment.
Managerial Financial Margin 11,868 - (1,032) 10,835 Financial Margin with Customers 9,380 - - 9,380 Financial Margin with Market 2,488 - (1,032) 1,456
Result from Loan Losses (3,727) - - (3,727) Provision for Loan and Lease Losses (4,296) - - (4,296) Recovery of Credits Written Off as Losses 569 - - 569
Net Result from Financial Operations 8,140 - (1,032) 7,108
Other Operating Income/(Expenses) (3,300) 634 125 (2,540) Banking Fees and Charge Revenues 3,853 - - 3,853 Result from Op. of Insurance, Pension Plans and Capitalization 600 - - 600 Non-interest Expenses (6,940) 634 - (6,306) Tax Expenses for ISS, PIS and Cofins (912) - 125 (787) Equity in the Earnings of Associated Companies 43 - - 43 Other Operating Income 57 - - 57
Operating Income 4,840 634 (907) 4,568
Non-operating Income 36 - - 36
Income before Tax and Profit Sharing 4,877 634 (907) 4,604 Income Tax and Social Contribution (1,918) (216) 907 (1,227) Profit Sharing (471) - - (471) Minority Interests (220) - - (220)
Net Income 2,268 419 - 2,687
3rd Quarter/09 AccountingNon-recurring
EffectsManagerial
Itaú Unibanco Pro FormaTax Effect of Hedge
and Sovereign Bonds
Managerial Financial Margin 12,710 - (2,149) 10,561 Financial Margin with Customers 9,212 - - 9,212 Financial Margin with Market 3,498 - (2,149) 1,349
Result from Loan Losses (3,790) - - (3,790) Provision for Loan and Lease Losses (4,252) - - (4,252) Recovery of Credits Written Off as Losses 461 - - 461
Net Result from Financial Operations 8,920 - (2,149) 6,771
Other Operating Income/(Expenses) (3,000) 113 248 (2,638) Banking Fees and Charge Revenues 3,617 - - 3,617 Result from Op. of Insurance, Pension Plans and Capitalization 620 - - 620 Non-interest Expenses (6,502) 110 - (6,392) Tax Expenses for ISS, PIS and Cofins (1,039) 3 248 (788) Equity in the Earnings of Associated Companies 79 - - 79 Other Operating Income 225 - - 225
Operating Income 5,920 113 (1,901) 4,132
Non-operating Income 377 (337) - 40
Income before Tax and Profit Sharing 6,297 (224) (1,901) 4,172 Income Tax and Social Contribution (3,162) 81 1,901 (1,179) Profit Sharing (361) - - (361) Minority Interests (203) - - (203)
Net Income 2,571 (142) - 2,429
2nd Quarter/09Itaú Unibanco Pro Forma
AccountingNon-recurring
EffectsTax Effect of Hedge
and Sovereign BondsManagerial
Management Discussion and Analysis Itaú Unibanco Holding S.A.
Itaú Unibanco
7,422 7,822 8,186 8,6819,416 9,241 9,212 9,380
544499 1,329 1,349 1,456
7,9588,319
8,8129,225
9,91510,561 10,835
536496
627
10,570
4th Q/07 1st Q/08 2nd Q/08 3rd Q/08 4th Q/08 1st Q/09 2nd Q/09 3rd Q/09
41.0
41.1
48.8
54.3
52.3
42.5
37.3
166.7
177.0
190.0
205.9
217.7
220.4
223.4
231.4
36.3 202.9
218.0
231.1
254.8
271.9
272.7
266.0
268.7
Dec/07
Mar/08
Jun/08
Sep/08
Dec/08
Mar/09
Jun/09
Sep/09
Executive Summary
Loan Portfolio (*) R$ billion
(*) Includes endorsements and sureties.
Foreign Currency Local Currency
R$ million
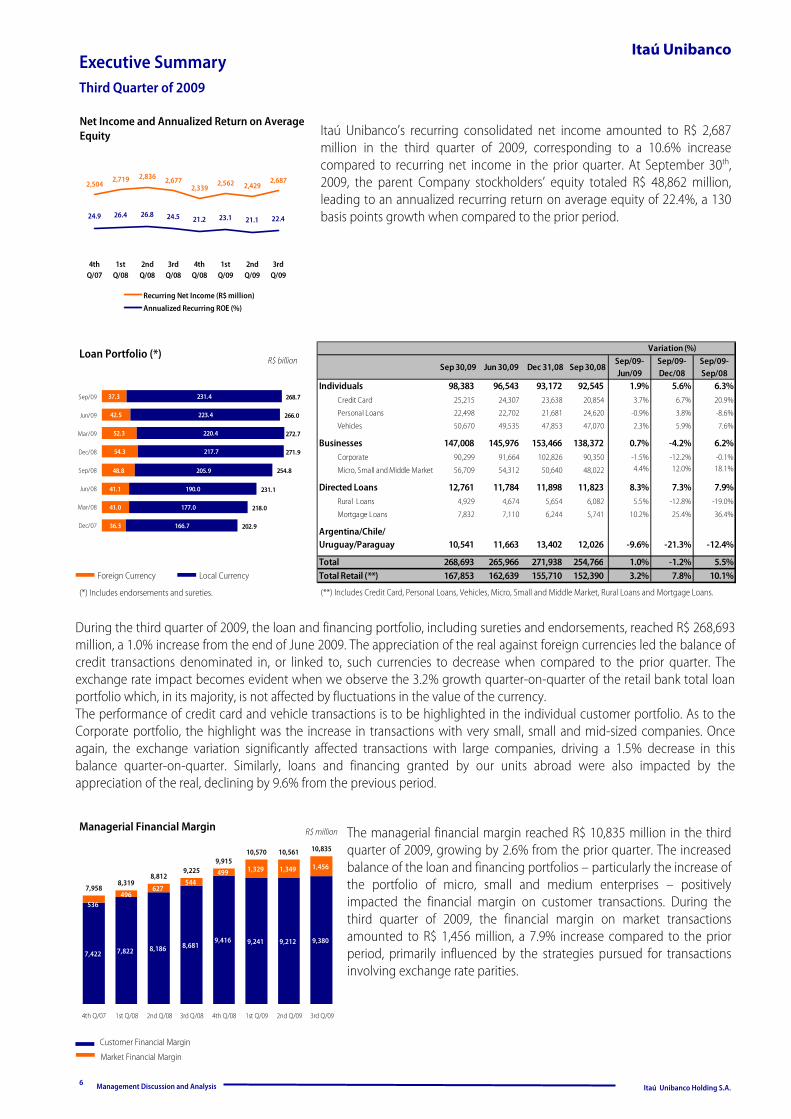
Itaú Unibanco’s recurring consolidated net income amounted to R$ 2,687 million in the third quarter of 2009, corresponding to a 10.6% increase compared to recurring net income in the prior quarter. At September 30th, 2009, the parent Company stockholders’ equity totaled R$ 48,862 million, leading to an annualized recurring return on average equity of 22.4%, a 130 basis points growth when compared to the prior period.
During the third quarter of 2009, the loan and financing portfolio, including sureties and endorsements, reached R$ 268,693 million, a 1.0% increase from the end of June 2009. The appreciation of the real against foreign currencies led the balance of credit transactions denominated in, or linked to, such currencies to decrease when compared to the prior quarter. The exchange rate impact becomes evident when we observe the 3.2% growth quarter-on-quarter of the retail bank total loan portfolio which, in its majority, is not affected by fluctuations in the value of the currency. The performance of credit card and vehicle transactions is to be highlighted in the individual customer portfolio. As to the Corporate portfolio, the highlight was the increase in transactions with very small, small and mid-sized companies. Once again, the exchange variation significantly affected transactions with large companies, driving a 1.5% decrease in this balance quarter-on-quarter. Similarly, loans and financing granted by our units abroad were also impacted by the appreciation of the real, declining by 9.6% from the previous period.
Third Quarter of 2009
Managerial Financial Margin
Customer Financial Margin
Market Financial Margin
R$ million
6
Net Income and Annualized Return on Average Equity
The managerial financial margin reached R$ 10,835 million in the third quarter of 2009, growing by 2.6% from the prior quarter. The increased balance of the loan and financing portfolios – particularly the increase of the portfolio of micro, small and medium enterprises – positively impacted the financial margin on customer transactions. During the third quarter of 2009, the financial margin on market transactions amounted to R$ 1,456 million, a 7.9% increase compared to the prior period, primarily influenced by the strategies pursued for transactions involving exchange rate parities.
2,6872,5042,719 2,836 2,677
2,3392,562 2,429
24.9 26.4 26.8 24.5 21.2 21.1 22.423.1
4thQ/07
1stQ/08
2ndQ/08
3rdQ/08
4thQ/08
1stQ/09
2ndQ/09
3rdQ/09
Recurring Net Income (R$ million)
Annualized Recurring ROE (%)
Sep 30,09 Jun 30,09 Dec 31,08 Sep 30,08Sep/09-Jun/09
Sep/09-Dec/08
Sep/09-Sep/08
Individuals 98,383 96,543 93,172 92,545 1.9% 5.6% 6.3%Credit Card 25,215 24,307 23,638 20,854 3.7% 6.7% 20.9%
Personal Loans 22,498 22,702 21,681 24,620 -0.9% 3.8% -8.6%
Vehicles 50,670 49,535 47,853 47,070 2.3% 5.9% 7.6%
Businesses 147,008 145,976 153,466 138,372 0.7% -4.2% 6.2%Corporate 90,299 91,664 102,826 90,350 -1.5% -12.2% -0.1%
Micro, Small and Middle Market 56,709 54,312 50,640 48,022 4.4% 12.0% 18.1%
Directed Loans 12,761 11,784 11,898 11,823 8.3% 7.3% 7.9%Rural Loans 4,929 4,674 5,654 6,082 5.5% -12.8% -19.0%
Mortgage Loans 7,832 7,110 6,244 5,741 10.2% 25.4% 36.4%
Argentina/Chile/Uruguay/Paraguay 10,541 11,663 13,402 12,026 -9.6% -21.3% -12.4%
Total 268,693 265,966 271,938 254,766 1.0% -1.2% 5.5%Total Retail (**) 167,853 162,639 155,710 152,390 3.2% 7.8% 10.1%
Variation (%)
(**) Includes Credit Card, Personal Loans, Vehicles, Micro, Small and Middle Market, Rural Loans and Mortgage Loans.
Management Discussion and Analysis Itaú Unibanco Holding S.A.
Itaú Unibanco
12,049 11,421 11,212
7,4828,792 9,141
10,427 10,417
488222
41
152
12,53711,642 11,363
7,523
8,792 9,141
10,427 10,417
Dec/07 Mar/08 Jun/08 Sep/08 Dec/08 Mar/09 Jun/09 Sep/09
Parent Company BPI interest (Minority)
4.1%3.1%
1.3%1.9%
1.2%1.3%1.6% 1.3%
5.9%5.4%4.4%
3.9%3.8%4.0%4.2% 3.9%
8.1%8.1%7.9%6.9%6.4%6.5%6.6%6.8%
Dec/07 Mar/08 Jun/08 Sep/08 Dec/08 Mar/09 Jun/09 Sep/09
0.7%0.8%
0.3%0.6%
0.2%0.3%0.2% 0.3%
1.1%1.3%
1.2%0.9%0.8%
1.0%0.8%
1.0%
1.7%2.0%2.0%
1.5%1.5%1.6%1.7%
1.5%
Dec/07 Mar/08 Jun/08 Sep/08 Dec/08 Mar/09 Jun/09 Sep/09
1.5%1.9% 1.6% 1.5%2.5%
1.7%
3.9%4.8%4.8%5.1% 4.9% 4.6% 4.8%
5.6%6.7% 7.0%
8.3% 8.3% 8.1% 7.9% 8.1%
9.8% 10.0% 9.7%
Dec/07 Mar/08 Jun/08 Sep/08 Dec/08 Mar/09 Jun/09 Sep/09
6,0125,506
5,8056,392 6,3066,357
7,0156,462
4th Q/07 1st Q/08 2nd Q/08 3rd Q/08 4th Q/08 1st Q/09 2nd Q/09 3rd Q/09
3,940
3,708
3,846
3,617
3,853
3,825
4,063
3,526
4th Q/07
1st Q/08
2nd Q/08
3rd Q/08
4th Q/08
1st Q/09
2nd Q/09
3rd Q/09
Banking fees and charge revenues R$ million
Non-interest Expenses R$ million
Unrealized Profit/(Loss) R$ million
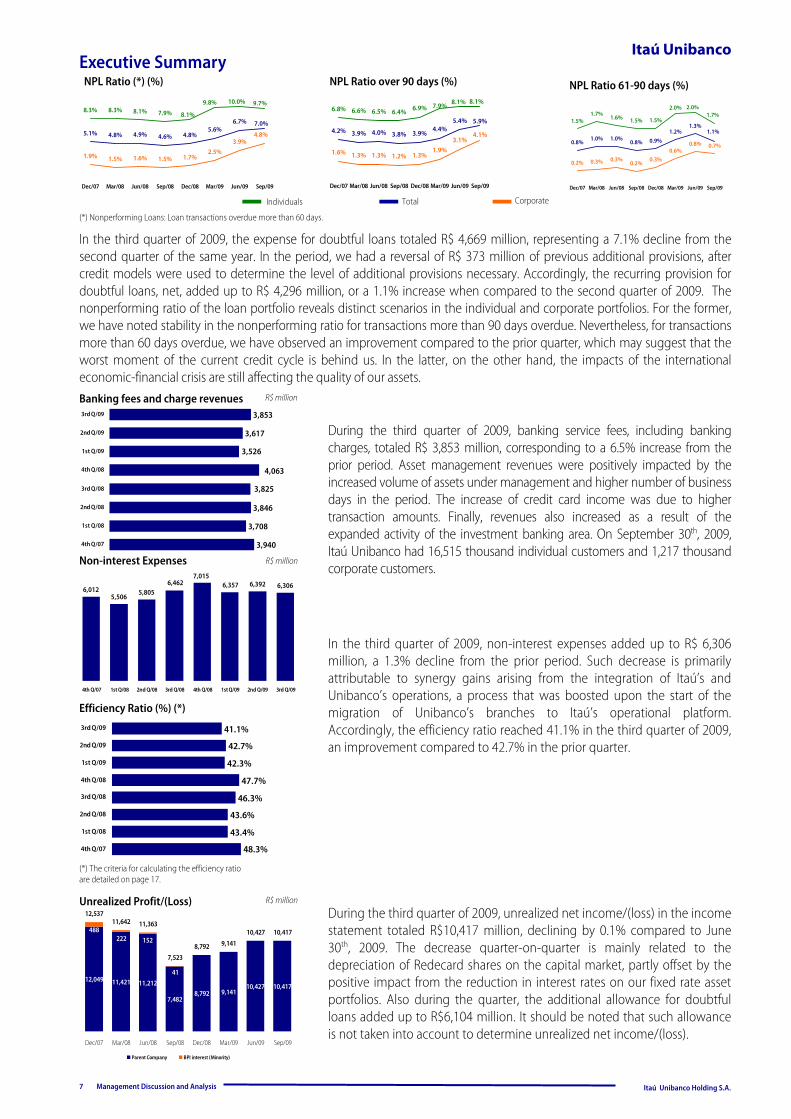
In the third quarter of 2009, non-interest expenses added up to R$ 6,306 million, a 1.3% decline from the prior period. Such decrease is primarily attributable to synergy gains arising from the integration of Itaú’s and Unibanco’s operations, a process that was boosted upon the start of the migration of Unibanco’s branches to Itaú’s operational platform. Accordingly, the efficiency ratio reached 41.1% in the third quarter of 2009, an improvement compared to 42.7% in the prior quarter.
Individuals Total Corporate
7
Efficiency Ratio (%) (*)
(*) The criteria for calculating the efficiency ratio are detailed on page 17.
NPL Ratio over 90 days (%)
During the third quarter of 2009, banking service fees, including banking charges, totaled R$ 3,853 million, corresponding to a 6.5% increase from the prior period. Asset management revenues were positively impacted by the increased volume of assets under management and higher number of business days in the period. The increase of credit card income was due to higher transaction amounts. Finally, revenues also increased as a result of the expanded activity of the investment banking area. On September 30th, 2009, Itaú Unibanco had 16,515 thousand individual customers and 1,217 thousand corporate customers.
During the third quarter of 2009, unrealized net income/(loss) in the income statement totaled R$10,417 million, declining by 0.1% compared to June 30th, 2009. The decrease quarter-on-quarter is mainly related to the depreciation of Redecard shares on the capital market, partly offset by the positive impact from the reduction in interest rates on our fixed rate asset portfolios. Also during the quarter, the additional allowance for doubtful loans added up to R$6,104 million. It should be noted that such allowance is not taken into account to determine unrealized net income/(loss).
In the third quarter of 2009, the expense for doubtful loans totaled R$ 4,669 million, representing a 7.1% decline from the second quarter of the same year. In the period, we had a reversal of R$ 373 million of previous additional provisions, after credit models were used to determine the level of additional provisions necessary. Accordingly, the recurring provision for doubtful loans, net, added up to R$ 4,296 million, or a 1.1% increase when compared to the second quarter of 2009. The nonperforming ratio of the loan portfolio reveals distinct scenarios in the individual and corporate portfolios. For the former, we have noted stability in the nonperforming ratio for transactions more than 90 days overdue. Nevertheless, for transactions more than 60 days overdue, we have observed an improvement compared to the prior quarter, which may suggest that the worst moment of the current credit cycle is behind us. In the latter, on the other hand, the impacts of the international economic-financial crisis are still affecting the quality of our assets.
Executive Summary NPL Ratio (*) (%)
(*) Nonperforming Loans: Loan transactions overdue more than 60 days.
NPL Ratio 61-90 days (%)
48.3%
43.4%
43.6%
46.3%
47.7%
42.3%
42.7%
41.1%
4th Q/07
1st Q/08
2nd Q/08
3rd Q/08
4th Q/08
1st Q/09
2nd Q/09
3rd Q/09
Management Discussion and Analysis Itaú Unibanco Holding S.A.
Itaú Unibanco
R$ million Balance Sheet
8
Executive Summary Third Quarter of 2009
LIABILITIES AND EQUITY Sep 30,09 Jun 30,09 Sep 30,08Sep/09-Jun/09
Sep/09-Sep/08
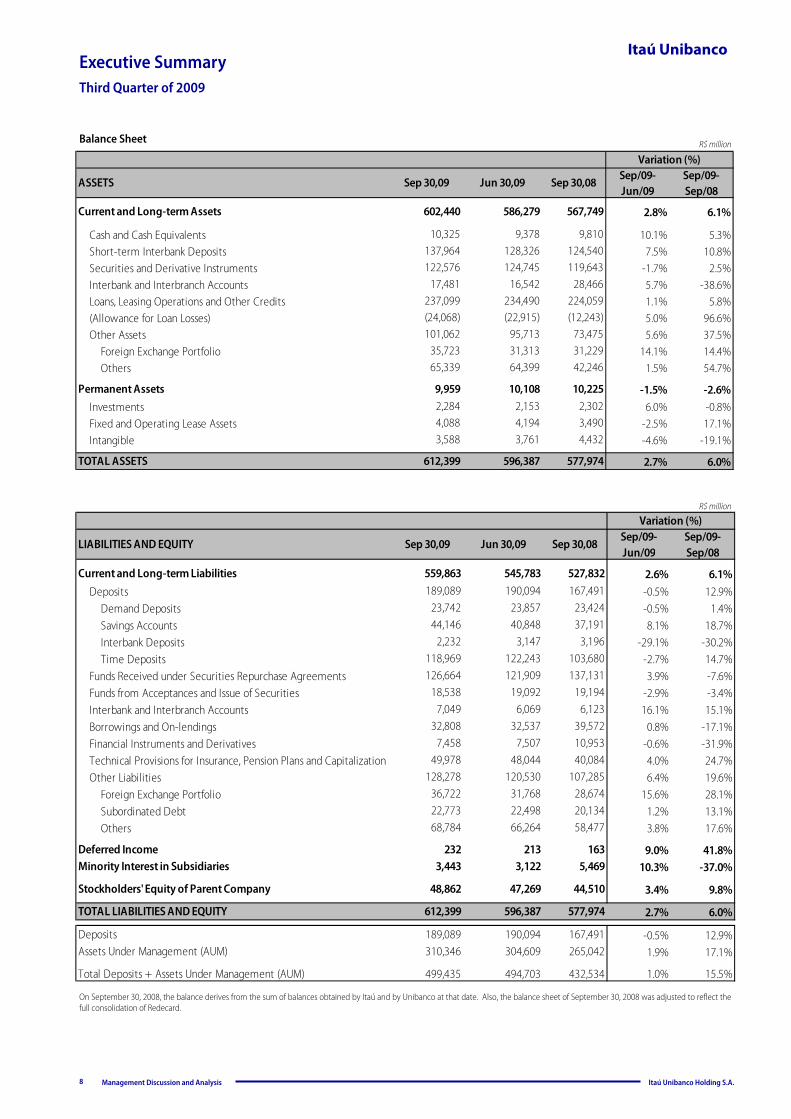
Current and Long-term Liabilities 559,863 545,783 527,832 2.6% 6.1%Deposits 189,089 190,094 167,491 -0.5% 12.9%
Demand Deposits 23,742 23,857 23,424 -0.5% 1.4%Savings Accounts 44,146 40,848 37,191 8.1% 18.7%Interbank Deposits 2,232 3,147 3,196 -29.1% -30.2%Time Deposits 118,969 122,243 103,680 -2.7% 14.7%
Funds Received under Securities Repurchase Agreements 126,664 121,909 137,131 3.9% -7.6%Funds from Acceptances and Issue of Securities 18,538 19,092 19,194 -2.9% -3.4%Interbank and Interbranch Accounts 7,049 6,069 6,123 16.1% 15.1%Borrowings and On-lendings 32,808 32,537 39,572 0.8% -17.1%Financial Instruments and Derivatives 7,458 7,507 10,953 -0.6% -31.9%Technical Provisions for Insurance, Pension Plans and Capitalization 49,978 48,044 40,084 4.0% 24.7%Other Liabilities 128,278 120,530 107,285 6.4% 19.6%
Foreign Exchange Portfolio 36,722 31,768 28,674 15.6% 28.1%Subordinated Debt 22,773 22,498 20,134 1.2% 13.1%Others 68,784 66,264 58,477 3.8% 17.6%
Deferred Income 232 213 163 9.0% 41.8%Minority Interest in Subsidiaries 3,443 3,122 5,469 10.3% -37.0%
Stockholders' Equity of Parent Company 48,862 47,269 44,510 3.4% 9.8%
TOTAL LIABILITIES AND EQUITY 612,399 596,387 577,974 2.7% 6.0%
Deposits 189,089 190,094 167,491 -0.5% 12.9%Assets Under Management (AUM) 310,346 304,609 265,042 1.9% 17.1%
Total Deposits + Assets Under Management (AUM) 499,435 494,703 432,534 1.0% 15.5%
Variation (%)R$ million
On September 30, 2008, the balance derives from the sum of balances obtained by Itaú and by Unibanco at that date. Also, the balance sheet of September 30, 2008 was adjusted to reflect the full consolidation of Redecard.
ASSETS Sep 30,09 Jun 30,09 Sep 30,08Sep/09-Jun/09
Sep/09-Sep/08
Current and Long-term Assets 602,440 586,279 567,749 2.8% 6.1%
Cash and Cash Equivalents 10,325 9,378 9,810 10.1% 5.3%Short-term Interbank Deposits 137,964 128,326 124,540 7.5% 10.8%Securities and Derivative Instruments 122,576 124,745 119,643 -1.7% 2.5%Interbank and Interbranch Accounts 17,481 16,542 28,466 5.7% -38.6%Loans, Leasing Operations and Other Credits 237,099 234,490 224,059 1.1% 5.8%(Allowance for Loan Losses) (24,068) (22,915) (12,243) 5.0% 96.6%Other Assets 101,062 95,713 73,475 5.6% 37.5%
Foreign Exchange Portfolio 35,723 31,313 31,229 14.1% 14.4%Others 65,339 64,399 42,246 1.5% 54.7%
Permanent Assets 9,959 10,108 10,225 -1.5% -2.6%Investments 2,284 2,153 2,302 6.0% -0.8%Fixed and Operating Lease Assets 4,088 4,194 3,490 -2.5% 17.1%Intangible 3,588 3,761 4,432 -4.6% -19.1%
TOTAL ASSETS 612,399 596,387 577,974 2.7% 6.0%
Variation (%)
Management Discussion and Analysis Itaú Unibanco Holding S.A.
Itaú Unibanco
Income Statement
9
Executive Summary Third Quarter of 2009
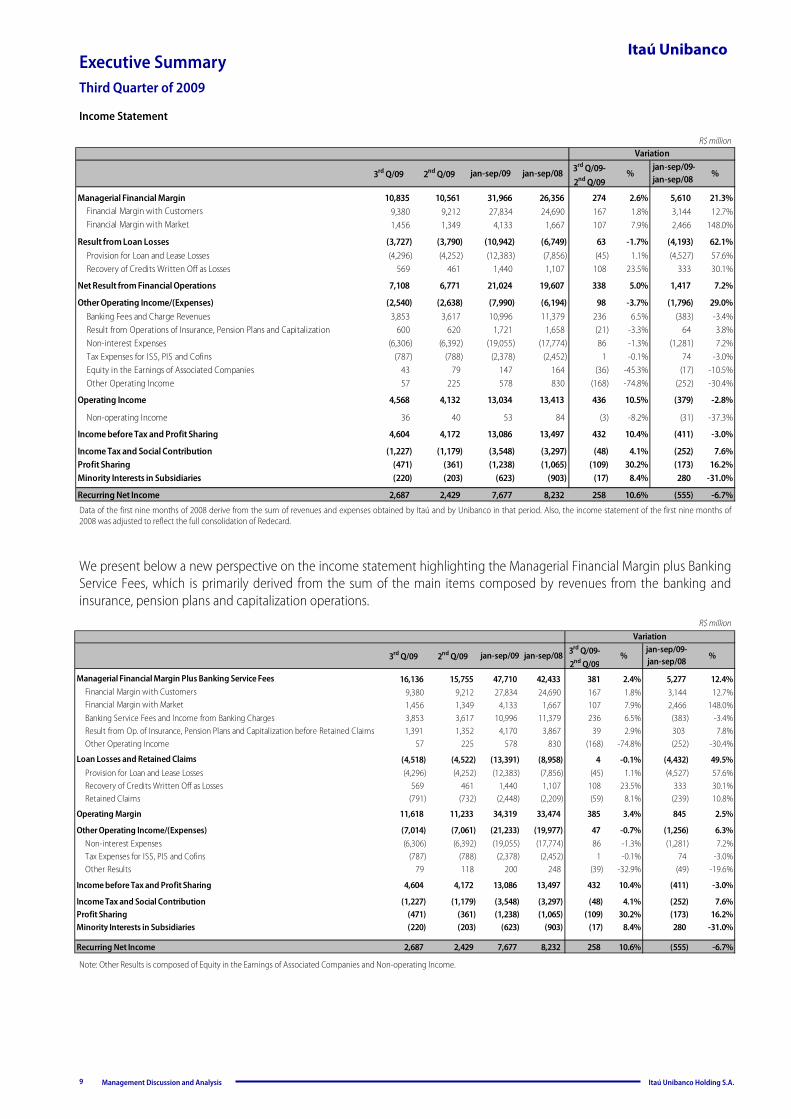
Data of the first nine months of 2008 derive from the sum of revenues and expenses obtained by Itaú and by Unibanco in that period. Also, the income statement of the first nine months of 2008 was adjusted to reflect the full consolidation of Redecard.
R$ million
R$ million
We present below a new perspective on the income statement highlighting the Managerial Financial Margin plus Banking Service Fees, which is primarily derived from the sum of the main items composed by revenues from the banking and insurance, pension plans and capitalization operations.
Note: Other Results is composed of Equity in the Earnings of Associated Companies and Non-operating Income.
3rd Q/09 2nd Q/09 jan-sep/09 jan-sep/08 3rd Q/09-2nd Q/09
%jan-sep/09-jan-sep/08
%
Managerial Financial Margin 10,835 10,561 31,966 26,356 274 2.6% 5,610 21.3%Financial Margin with Customers 9,380 9,212 27,834 24,690 167 1.8% 3,144 12.7%Financial Margin with Market 1,456 1,349 4,133 1,667 107 7.9% 2,466 148.0%
Result from Loan Losses (3,727) (3,790) (10,942) (6,749) 63 -1.7% (4,193) 62.1%Provision for Loan and Lease Losses (4,296) (4,252) (12,383) (7,856) (45) 1.1% (4,527) 57.6%Recovery of Credits Written Off as Losses 569 461 1,440 1,107 108 23.5% 333 30.1%
Net Result from Financial Operations 7,108 6,771 21,024 19,607 338 5.0% 1,417 7.2%
Other Operating Income/(Expenses) (2,540) (2,638) (7,990) (6,194) 98 -3.7% (1,796) 29.0%Banking Fees and Charge Revenues 3,853 3,617 10,996 11,379 236 6.5% (383) -3.4%Result from Operations of Insurance, Pension Plans and Capitalization 600 620 1,721 1,658 (21) -3.3% 64 3.8%Non-interest Expenses (6,306) (6,392) (19,055) (17,774) 86 -1.3% (1,281) 7.2%Tax Expenses for ISS, PIS and Cofins (787) (788) (2,378) (2,452) 1 -0.1% 74 -3.0%Equity in the Earnings of Associated Companies 43 79 147 164 (36) -45.3% (17) -10.5%Other Operating Income 57 225 578 830 (168) -74.8% (252) -30.4%
Operating Income 4,568 4,132 13,034 13,413 436 10.5% (379) -2.8%
Non-operating Income 36 40 53 84 (3) -8.2% (31) -37.3%
Income before Tax and Profit Sharing 4,604 4,172 13,086 13,497 432 10.4% (411) -3.0%
Income Tax and Social Contribution (1,227) (1,179) (3,548) (3,297) (48) 4.1% (252) 7.6%Profit Sharing (471) (361) (1,238) (1,065) (109) 30.2% (173) 16.2%Minority Interests in Subsidiaries (220) (203) (623) (903) (17) 8.4% 280 -31.0%
Recurring Net Income 2,687 2,429 7,677 8,232 258 10.6% (555) -6.7%
Variation
3rd Q/09 2nd Q/09 jan-sep/09 jan-sep/08 3rd Q/09-2nd Q/09
%jan-sep/09-jan-sep/08
%
Managerial Financial Margin Plus Banking Service Fees 16,136 15,755 47,710 42,433 381 2.4% 5,277 12.4%Financial Margin with Customers 9,380 9,212 27,834 24,690 167 1.8% 3,144 12.7%Financial Margin with Market 1,456 1,349 4,133 1,667 107 7.9% 2,466 148.0%Banking Service Fees and Income from Banking Charges 3,853 3,617 10,996 11,379 236 6.5% (383) -3.4%Result from Op. of Insurance, Pension Plans and Capitalization before Retained Claims 1,391 1,352 4,170 3,867 39 2.9% 303 7.8%Other Operating Income 57 225 578 830 (168) -74.8% (252) -30.4%
Loan Losses and Retained Claims (4,518) (4,522) (13,391) (8,958) 4 -0.1% (4,432) 49.5%Provision for Loan and Lease Losses (4,296) (4,252) (12,383) (7,856) (45) 1.1% (4,527) 57.6%Recovery of Credits Written Off as Losses 569 461 1,440 1,107 108 23.5% 333 30.1%Retained Claims (791) (732) (2,448) (2,209) (59) 8.1% (239) 10.8%
Operating Margin 11,618 11,233 34,319 33,474 385 3.4% 845 2.5%
Other Operating Income/(Expenses) (7,014) (7,061) (21,233) (19,977) 47 -0.7% (1,256) 6.3%Non-interest Expenses (6,306) (6,392) (19,055) (17,774) 86 -1.3% (1,281) 7.2%Tax Expenses for ISS, PIS and Cofins (787) (788) (2,378) (2,452) 1 -0.1% 74 -3.0%Other Results 79 118 200 248 (39) -32.9% (49) -19.6%
Income before Tax and Profit Sharing 4,604 4,172 13,086 13,497 432 10.4% (411) -3.0%
Income Tax and Social Contribution (1,227) (1,179) (3,548) (3,297) (48) 4.1% (252) 7.6%Profit Sharing (471) (361) (1,238) (1,065) (109) 30.2% (173) 16.2%Minority Interests in Subsidiaries (220) (203) (623) (903) (17) 8.4% 280 -31.0%
Recurring Net Income 2,687 2,429 7,677 8,232 258 10.6% (555) -6.7%
Variation
Analysis of the Net Income
Analysis of the Net Income
Management Discussion and Analysis Itaú Unibanco Holding S.A.
Itaú Unibanco
Balance %Customers 9,380 9,212 167 1.8%
Interest Rate Sensitive Banking Transactions
1,138 1,047 90 8.6%
Spread-Sensitive Banking Transactions
8,242 8,165 77 0.9%
Market 1,456 1,349 107 7.9%Treasury 1,456 1,349 107 7.9%
Total 10,835 10,561 274 2.6%
3rd Q/09 2nd Q/09Variation
Managerial Financial Margin
11
Managerial Financial Margin R$ million
R$ million
Annualized Rate of Interest Rate Sensitive Banking Transactions Performed with Customers
Annualized Rate of Spread-Sensitive Banking Transactions Performed with Customers
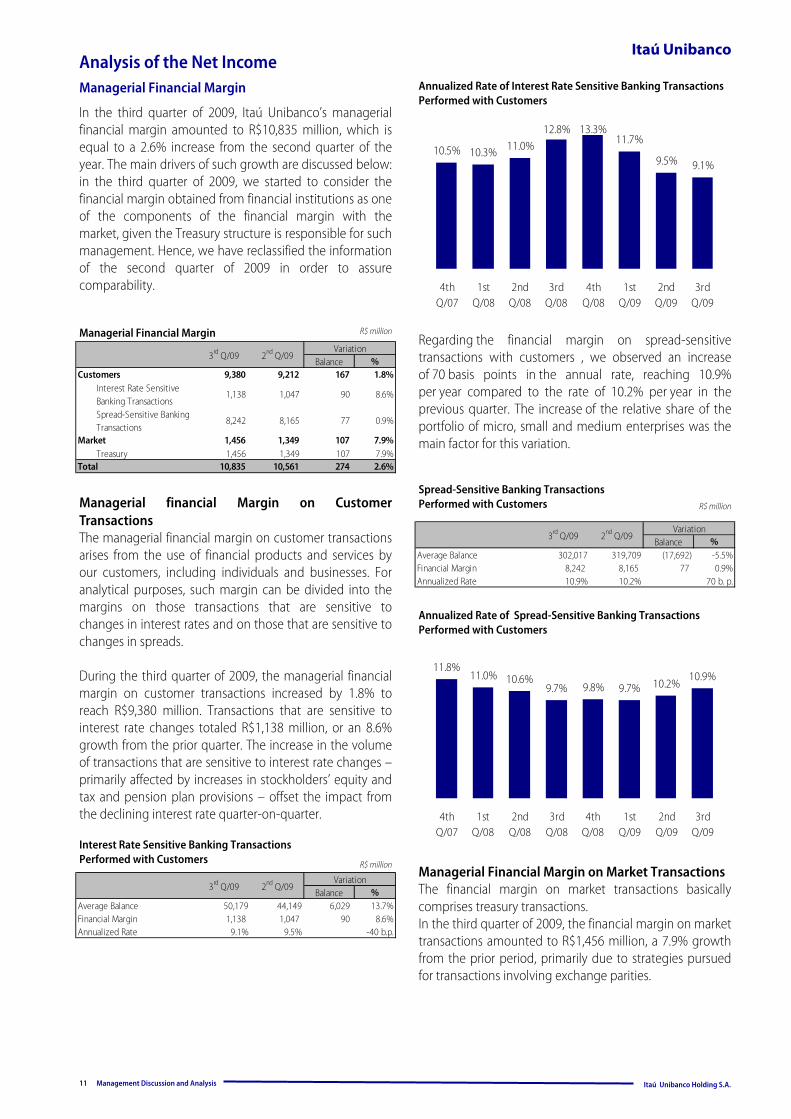
In the third quarter of 2009, Itaú Unibanco’s managerial financial margin amounted to R$10,835 million, which is equal to a 2.6% increase from the second quarter of the year. The main drivers of such growth are discussed below: in the third quarter of 2009, we started to consider the financial margin obtained from financial institutions as one of the components of the financial margin with the market, given the Treasury structure is responsible for such management. Hence, we have reclassified the information of the second quarter of 2009 in order to assure comparability.
Managerial financial Margin on Customer Transactions The managerial financial margin on customer transactions arises from the use of financial products and services by our customers, including individuals and businesses. For analytical purposes, such margin can be divided into the margins on those transactions that are sensitive to changes in interest rates and on those that are sensitive to changes in spreads. During the third quarter of 2009, the managerial financial margin on customer transactions increased by 1.8% to reach R$9,380 million. Transactions that are sensitive to interest rate changes totaled R$1,138 million, or an 8.6% growth from the prior quarter. The increase in the volume of transactions that are sensitive to interest rate changes – primarily affected by increases in stockholders’ equity and tax and pension plan provisions – offset the impact from the declining interest rate quarter-on-quarter.
Regarding the financial margin on spread-sensitive transactions with customers , we observed an increase of 70 basis points in the annual rate, reaching 10.9% per year compared to the rate of 10.2% per year in the previous quarter. The increase of the relative share of the portfolio of micro, small and medium enterprises was the main factor for this variation.
Managerial Financial Margin on Market Transactions The financial margin on market transactions basically comprises treasury transactions. In the third quarter of 2009, the financial margin on market transactions amounted to R$1,456 million, a 7.9% growth from the prior period, primarily due to strategies pursued for transactions involving exchange parities.
Interest Rate Sensitive Banking Transactions Performed with Customers
Spread-Sensitive Banking Transactions Performed with Customers R$ million
11.8%11.0% 10.6%
9.7% 9.8% 9.7% 10.2%10.9%
4thQ/07
1stQ/08
2ndQ/08
3rdQ/08
4thQ/08
1stQ/09
2ndQ/09
3rdQ/09
10.5% 10.3% 11.0%12.8% 13.3%
11.7%
9.5% 9.1%
4thQ/07
1stQ/08
2ndQ/08
3rdQ/08
4thQ/08
1stQ/09
2ndQ/09
3rdQ/09
Balance %Average Balance 50,179 44,149 6,029 13.7%Financial Margin 1,138 1,047 90 8.6%Annualized Rate 9.1% 9.5% -40 b.p.
3rd Q/09 2nd Q/09Variation
Balance %Average Balance 302,017 319,709 (17,692) -5.5%Financial Margin 8,242 8,165 77 0.9%Annualized Rate 10.9% 10.2% 70 b. p.
3rd Q/09 2nd Q/09Variation
Analysis of the Net Income
Management Discussion and Analysis Itaú Unibanco Holding S.A.
Itaú Unibanco
R$ million Analysis of the Managerial Financial Margin
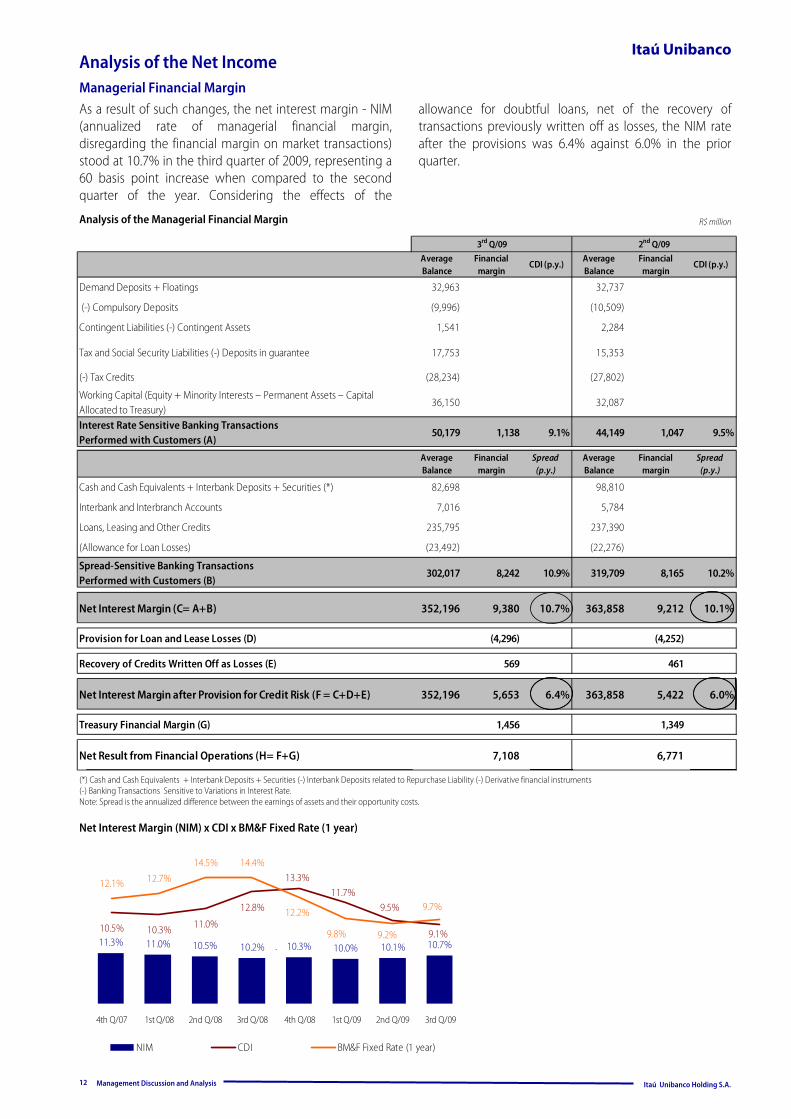
As a result of such changes, the net interest margin - NIM (annualized rate of managerial financial margin, disregarding the financial margin on market transactions) stood at 10.7% in the third quarter of 2009, representing a 60 basis point increase when compared to the second quarter of the year. Considering the effects of the
Net Interest Margin (NIM) x CDI x BM&F Fixed Rate (1 year)
(*) Cash and Cash Equivalents + Interbank Deposits + Securities (-) Interbank Deposits related to Repurchase Liability (-) Derivative financial instruments (-) Banking Transactions Sensitive to Variations in Interest Rate. Note: Spread is the annualized difference between the earnings of assets and their opportunity costs.
Managerial Financial Margin
12
allowance for doubtful loans, net of the recovery of transactions previously written off as losses, the NIM rate after the provisions was 6.4% against 6.0% in the prior quarter.
11.3% 11.0% 10.5% 10.2% 10.3% 10.0% 10.1% 10.7%
10.5% 10.3%
12.1% 12.7%11.7%
11.0%
12.8%
13.3%
9.1%
9.5%
14.5% 14.4%
12.2%
9.2%9.8%
9.7%
4th Q/07 1st Q/08 2nd Q/08 3rd Q/08 4th Q/08 1st Q/09 2nd Q/09 3rd Q/09
NIM CDI BM&F Fixed Rate (1 year)
.
Average Balance
Financial margin
CDI (p.y.)Average Balance
Financial margin
CDI (p.y.)
Demand Deposits + Floatings 32,963 32,737
(-) Compulsory Deposits (9,996) (10,509)
Contingent Liabilities (-) Contingent Assets 1,541 2,284
Tax and Social Security Liabilities (-) Deposits in guarantee 17,753 15,353
(-) Tax Credits (28,234) (27,802)
Working Capital (Equity + Minority Interests – Permanent Assets – Capital Allocated to Treasury)
36,150 32,087
Interest Rate Sensitive Banking TransactionsPerformed with Customers (A)
50,179 1,138 9.1% 44,149 1,047 9.5%
Average Balance
Financial margin
Spread (p.y.)
Average Balance
Financial margin
Spread (p.y.)
Cash and Cash Equivalents + Interbank Deposits + Securities (*) 82,698 98,810
Interbank and Interbranch Accounts 7,016 5,784
Loans, Leasing and Other Credits 235,795 237,390
(Allowance for Loan Losses) (23,492) (22,276)
Spread-Sensitive Banking TransactionsPerformed with Customers (B)
302,017 8,242 10.9% 319,709 8,165 10.2%
Net Interest Margin (C= A+B) 352,196 9,380 10.7% 363,858 9,212 10.1%
Provision for Loan and Lease Losses (D) (4,296) (4,252)
Recovery of Credits Written Off as Losses (E) 569 461
Net Interest Margin after Provision for Credit Risk (F = C+D+E) 352,196 5,653 6.4% 363,858 5,422 6.0%
Treasury Financial Margin (G) 1,456 1,349
Net Result from Financial Operations (H= F+G) 7,108 6,771
2nd Q/093rd Q/09
Analysis of the Net Income
Management Discussion and Analysis Itaú Unibanco Holding S.A.
Itaú Unibanco
Expenses for Provision for Loan Losses and Recovery of Credits Written-off as Losses Results from Loan and Lease Losses
R$ million
13
Coverage Ratio – 60 days
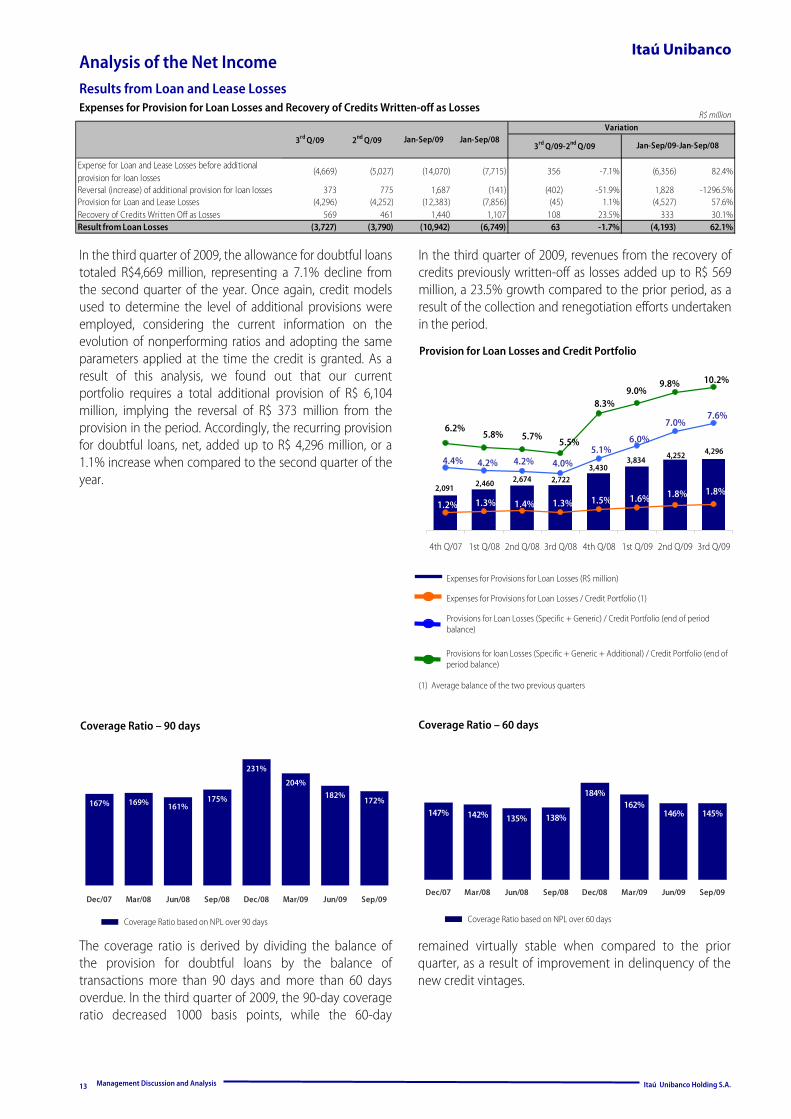
In the third quarter of 2009, the allowance for doubtful loans totaled R$4,669 million, representing a 7.1% decline from the second quarter of the year. Once again, credit models used to determine the level of additional provisions were employed, considering the current information on the evolution of nonperforming ratios and adopting the same parameters applied at the time the credit is granted. As a result of this analysis, we found out that our current portfolio requires a total additional provision of R$ 6,104 million, implying the reversal of R$ 373 million from the provision in the period. Accordingly, the recurring provision for doubtful loans, net, added up to R$ 4,296 million, or a 1.1% increase when compared to the second quarter of the year.
The coverage ratio is derived by dividing the balance of the provision for doubtful loans by the balance of transactions more than 90 days and more than 60 days overdue. In the third quarter of 2009, the 90-day coverage ratio decreased 1000 basis points, while the 60-day
Provision for Loan Losses and Credit Portfolio
Expenses for Provisions for Loan Losses (R$ million)
Expenses for Provisions for Loan Losses / Credit Portfolio (1)
Provisions for Loan Losses (Specific + Generic) / Credit Portfolio (end of period balance)
Provisions for loan Losses (Specific + Generic + Additional) / Credit Portfolio (end of period balance)
(1) Average balance of the two previous quarters
Coverage Ratio based on NPL over 60 days
162%146% 145%
184%
138%135%142%147%
Sep/09Jun/09Mar/09Dec/08Sep/08Jun/08Mar/08Dec/07
4,296
2,091 2,460 2,674 2,7223,430
3,834 4,252
1.8%1.8%1.6%1.5%1.3%1.4%1.3%1.2%
7.6%7.0%
6.0%5.1%
4.0%4.2%4.2%4.4%
10.2%9.8%9.0%
8.3%
5.5%5.7%5.8%6.2%
4th Q/07 1st Q/08 2nd Q/08 3rd Q/08 4th Q/08 1st Q/09 2nd Q/09 3rd Q/09
remained virtually stable when compared to the prior quarter, as a result of improvement in delinquency of the new credit vintages.
Coverage Ratio – 90 days
204%182%
172%
231%
175%161%169%167%
Sep/09Jun/09Mar/09Dec/08Sep/08Jun/08Mar/08Dec/07
Coverage Ratio based on NPL over 90 days
In the third quarter of 2009, revenues from the recovery of credits previously written-off as losses added up to R$ 569 million, a 23.5% growth compared to the prior period, as a result of the collection and renegotiation efforts undertaken in the period.
Expense for Loan and Lease Losses before additional provision for loan losses
(4,669) (5,027) (14,070) (7,715) 356 -7.1% (6,356) 82.4%
Reversal (increase) of additional provision for loan losses 373 775 1,687 (141) (402) -51.9% 1,828 -1296.5%Provision for Loan and Lease Losses (4,296) (4,252) (12,383) (7,856) (45) 1.1% (4,527) 57.6%Recovery of Credits Written Off as Losses 569 461 1,440 1,107 108 23.5% 333 30.1%Result from Loan Losses (3,727) (3,790) (10,942) (6,749) 63 -1.7% (4,193) 62.1%
Jan-Sep/093rd Q/09 2nd Q/09Variation
Jan-Sep/083rd Q/09-2nd Q/09 Jan-Sep/09-Jan-Sep/08
Analysis of the Net Income
Management Discussion and Analysis Itaú Unibanco Holding S.A.
Itaú Unibanco
4.1%3.1%
1.3%1.9%
1.2%1.3%1.6% 1.3%
5.9%5.4%4.4%
3.9%3.8%4.0%4.2% 3.9%
8.1%8.1%7.9%6.9%6.4%6.5%6.6%6.8%
Dec/07 Mar/08 Jun/08 Sep/08 Dec/08 Mar/09 Jun/09 Sep/09
4.8%3.9%
1.7%2.5%
1.5%1.6%1.9% 1.5%
7.0%6.7%5.6%4.8%4.6%4.9%5.1% 4.8%
9.7%10.0%9.8%
8.1%7.9%8.1%8.3%8.3%
Dec/07 Mar/08 Jun/08 Sep/08 Dec/08 Mar/09 Jun/09 Sep/09
0.7%0.8%
0.3%0.6%
0.2%0.3%0.2% 0.3%
1.1%1.3%
1.2%0.9%0.8%
1.0%0.8% 1.0%
1.7%2.0%2.0%
1.5%1.5%1.6%1.7%1.5%
Dec/07 Mar/08 Jun/08 Sep/08 Dec/08 Mar/09 Jun/09 Sep/09
R$ million Ratios
(a) Loans overdue for more than 60 days and without generation of revenues on the accrual basis. (b) Loans overdue for more than 90 days.
Overdue Loans R$ million
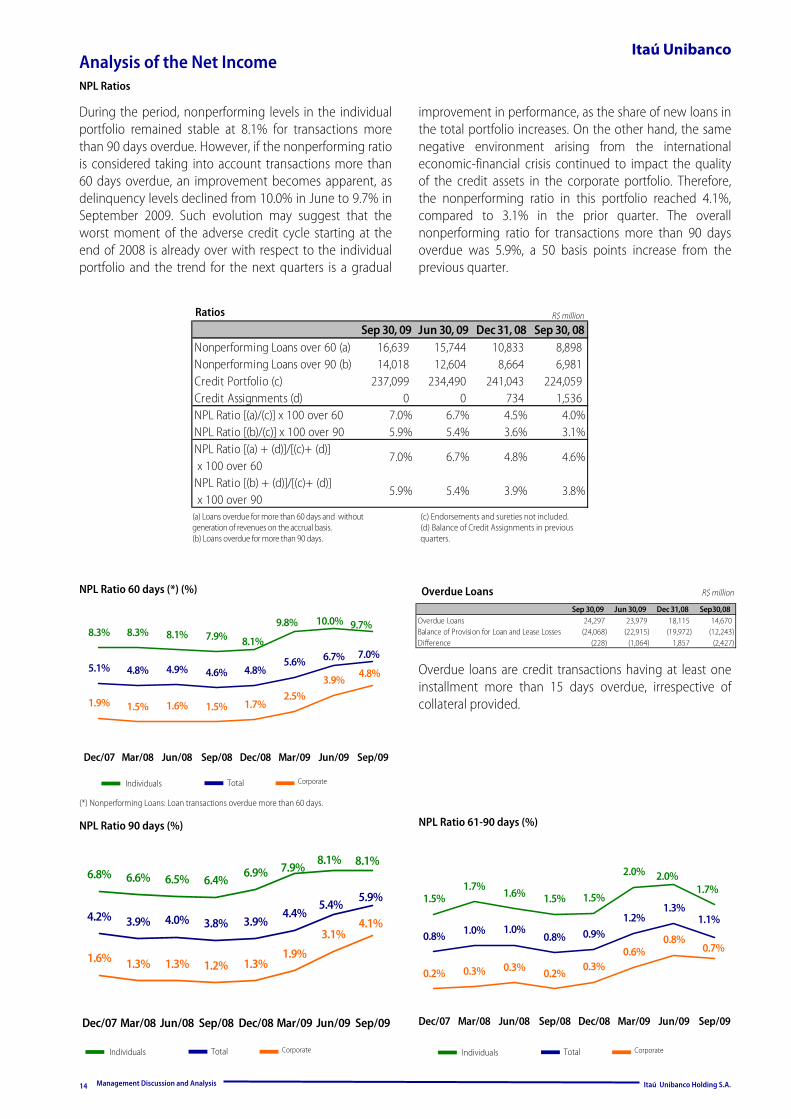
Overdue loans are credit transactions having at least one installment more than 15 days overdue, irrespective of collateral provided.
During the period, nonperforming levels in the individual portfolio remained stable at 8.1% for transactions more than 90 days overdue. However, if the nonperforming ratio is considered taking into account transactions more than 60 days overdue, an improvement becomes apparent, as delinquency levels declined from 10.0% in June to 9.7% in September 2009. Such evolution may suggest that the worst moment of the adverse credit cycle starting at the end of 2008 is already over with respect to the individual portfolio and the trend for the next quarters is a gradual
improvement in performance, as the share of new loans in the total portfolio increases. On the other hand, the same negative environment arising from the international economic-financial crisis continued to impact the quality of the credit assets in the corporate portfolio. Therefore, the nonperforming ratio in this portfolio reached 4.1%, compared to 3.1% in the prior quarter. The overall nonperforming ratio for transactions more than 90 days overdue was 5.9%, a 50 basis points increase from the previous quarter.
NPL Ratios
(c) Endorsements and sureties not included. (d) Balance of Credit Assignments in previous quarters.
NPL Ratio 60 days (*) (%)
NPL Ratio 90 days (%) NPL Ratio 61-90 days (%)
Individuals Total Corporate Individuals Total Corporate
Individuals Total Corporate
(*) Nonperforming Loans: Loan transactions overdue more than 60 days.
Sep 30,09 Jun 30,09 Dec 31,08 Sep30,08Overdue Loans 24,297 23,979 18,115 14,670Balance of Provision for Loan and Lease Losses (24,068) (22,915) (19,972) (12,243)Difference (228) (1,064) 1,857 (2,427)
Sep 30, 09 Jun 30, 09 Dec 31, 08 Sep 30, 08Nonperforming Loans over 60 (a) 16,639 15,744 10,833 8,898 Nonperforming Loans over 90 (b) 14,018 12,604 8,664 6,981 Credit Portfolio (c) 237,099 234,490 241,043 224,059Credit Assignments (d) 0 0 734 1,536 NPL Ratio [(a)/(c)] x 100 over 60 7.0% 6.7% 4.5% 4.0%NPL Ratio [(b)/(c)] x 100 over 90 5.9% 5.4% 3.6% 3.1%NPL Ratio [(a) + (d)]/[(c)+ (d)] x 100 over 60
7.0% 6.7% 4.8% 4.6%
NPL Ratio [(b) + (d)]/[(c)+ (d)] x 100 over 90
5.9% 5.4% 3.9% 3.8%
14
Analysis of the Net Income
Management Discussion and Analysis Itaú Unibanco Holding S.A.
Itaú Unibanco
Banking fee revenues and Banking charge revenues R$ million
15
R$ million
Banking fee revenues and Banking charge revenues
Other R$ million
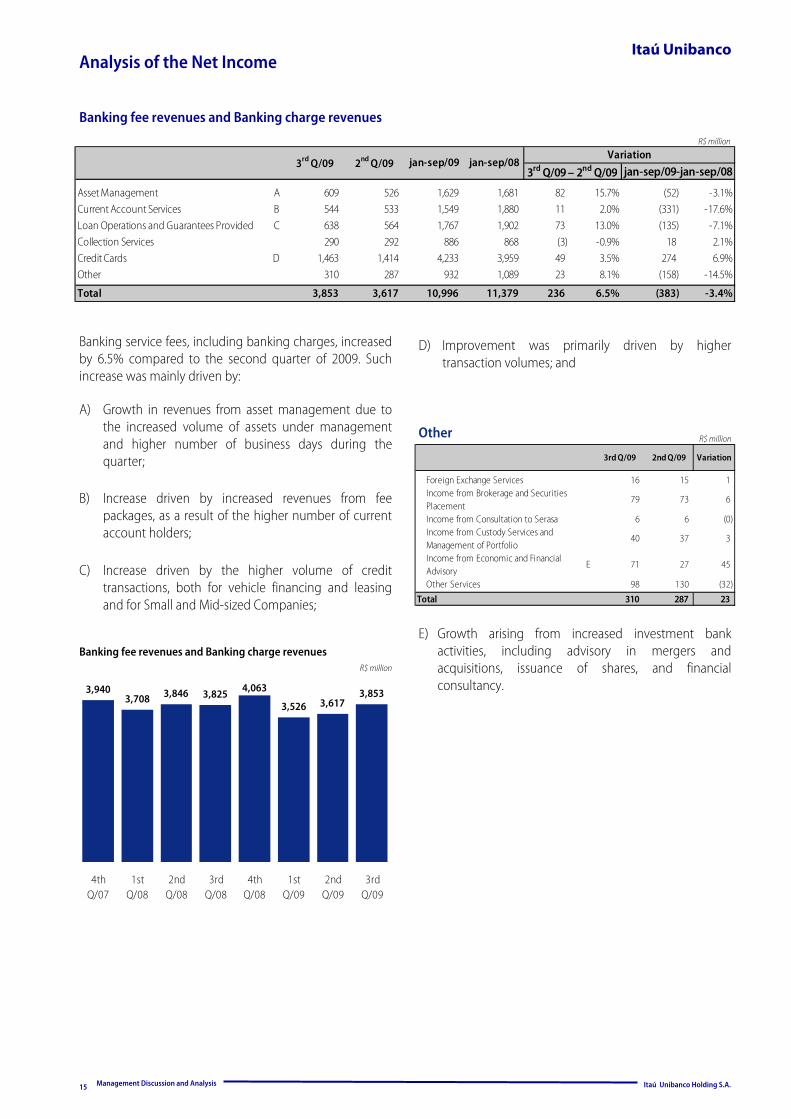
Banking service fees, including banking charges, increased by 6.5% compared to the second quarter of 2009. Such increase was mainly driven by:
B) Increase driven by increased revenues from fee packages, as a result of the higher number of current account holders;
C) Increase driven by the higher volume of credit transactions, both for vehicle financing and leasing and for Small and Mid-sized Companies;
D) Improvement was primarily driven by higher transaction volumes; and
E) Growth arising from increased investment bank activities, including advisory in mergers and acquisitions, issuance of shares, and financial consultancy.
Asset Management A 609 526 1,629 1,681 82 15.7% (52) -3.1%Current Account Services B 544 533 1,549 1,880 11 2.0% (331) -17.6%Loan Operations and Guarantees Provided C 638 564 1,767 1,902 73 13.0% (135) -7.1%Collection Services 290 292 886 868 (3) -0.9% 18 2.1%Credit Cards D 1,463 1,414 4,233 3,959 49 3.5% 274 6.9%Other 310 287 932 1,089 23 8.1% (158) -14.5%
Total 3,853 3,617 10,996 11,379 236 6.5% (383) -3.4%
Variation
3rd Q/09 – 2nd Q/09 jan-sep/09-jan-sep/083rd Q/09 2nd Q/09 jan-sep/09 jan-sep/08
3rd Q/09 2nd Q/09 Variation
Foreign Exchange Services 16 15 1 Income from Brokerage and Securities Placement
79 73 6
Income from Consultation to Serasa 6 6 (0) Income from Custody Services and Management of Portfolio
40 37 3
Income from Economic and Financial Advisory
E 71 27 45
Other Services 98 130 (32)
Total 310 287 23
3,9403,708
4,063
3,526 3,6173,8533,8253,846
4thQ/07
1stQ/08
2ndQ/08
3rdQ/08
4thQ/08
1stQ/09
2ndQ/09
3rdQ/09
A) Growth in revenues from asset management due to the increased volume of assets under management and higher number of business days during the quarter;
Analysis of the Net Income
Management Discussion and Analysis Itaú Unibanco Holding S.A.
Itaú Unibanco
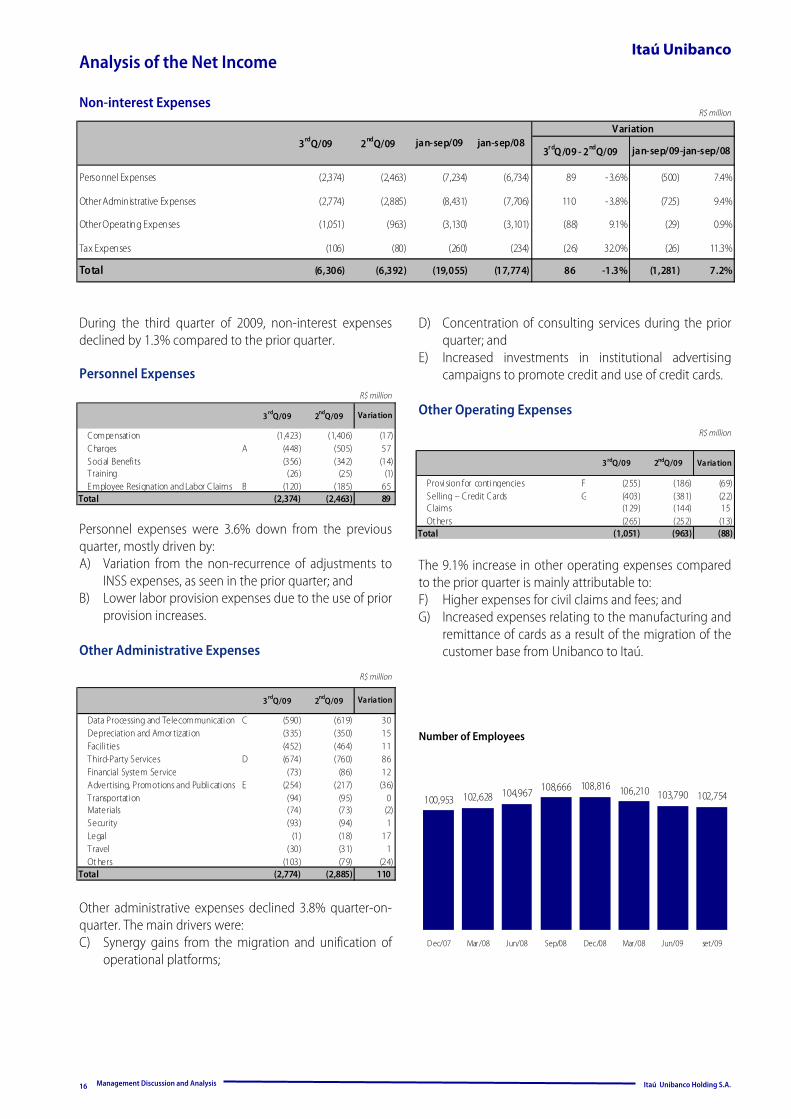
D) Concentration of consulting services during the prior quarter; and
E) Increased investments in institutional advertising campaigns to promote credit and use of credit cards.
Other Operating Expenses
The 9.1% increase in other operating expenses compared to the prior quarter is mainly attributable to: F) Higher expenses for civil claims and fees; and G) Increased expenses relating to the manufacturing and
remittance of cards as a result of the migration of the customer base from Unibanco to Itaú.
During the third quarter of 2009, non-interest expenses declined by 1.3% compared to the prior quarter. Personnel Expenses
Personnel expenses were 3.6% down from the previous quarter, mostly driven by: A) Variation from the non-recurrence of adjustments to
INSS expenses, as seen in the prior quarter; and B) Lower labor provision expenses due to the use of prior
provision increases. Other Administrative Expenses
Other administrative expenses declined 3.8% quarter-on-quarter. The main drivers were: C) Synergy gains from the migration and unification of
operational platforms;
Non-interest Expenses R$ million
Number of Employees
R$ million
R$ million
R$ million
16
Variation
3r dQ/09 - 2ndQ/09 jan-sep/09-jan-sep/08
Personnel Expenses (2,374) (2,463) (7,234) (6,734) 89 -3.6% (500) 7.4%
Other Administrative Expenses (2,774) (2,885) (8,431) (7,706) 110 -3.8% (725) 9.4%
Other Operating Expenses (1,051) (963) (3,130) (3,101) (88) 9.1% (29) 0.9%
Tax Expenses (106) (80) (260) (234) (26) 32.0% (26) 11.3%
Total (6,306) (6,392) (19,055) (17,774) 86 -1.3% (1,281) 7.2%
3rdQ/09 2ndQ/09 jan-sep/09 jan-sep/08
Compensati on (1,423) (1,406) (17) Charges A (448) (505) 57 Soci al Benefi ts (356) (342) (14) Training (26) (25) (1) Employee Resi gnation and Labor C laims B (120) (185) 65
Total (2,374) (2,463) 89
Variation3rdQ/09 2ndQ/09
Data Processing and Telecommunicati on C (590) (619) 30 Depreciation and Amor tizati on (335) (350) 15 Facili ties (452) (464) 11 Third-Party Services D (674) (760) 86 Financial System Service (73) (86) 12 Advertising, Promotions and Publi cati ons E (254) (217) (36) Transportati on (94) (95) 0 Materials (74) (73) (2) Security (93) (94) 1 Legal (1) (18) 17 Travel (30) (31) 1 Ot hers (103) (79) (24)
Total (2,774) (2,885) 110
Variation3rdQ/09 2ndQ/09
Provi sion for conti ngencies F (255) (186) (69) Selling – Credit Cards G (403) (381) (22) C laims (129) (144) 15 Ot hers (265) (252) (13)
Total (1,051) (963) (88)
Variation3rdQ/09 2ndQ/09
100,953 102,628 104,967 108,666 108,816 106,210 103,790 102,754
Dec/07 Mar/08 Jun/08 Sep/08 Dec/08 Mar/08 Jun/09 set/09
Analysis of the Net Income
Management Discussion and Analysis Itaú Unibanco Holding S.A.
Itaú Unibanco
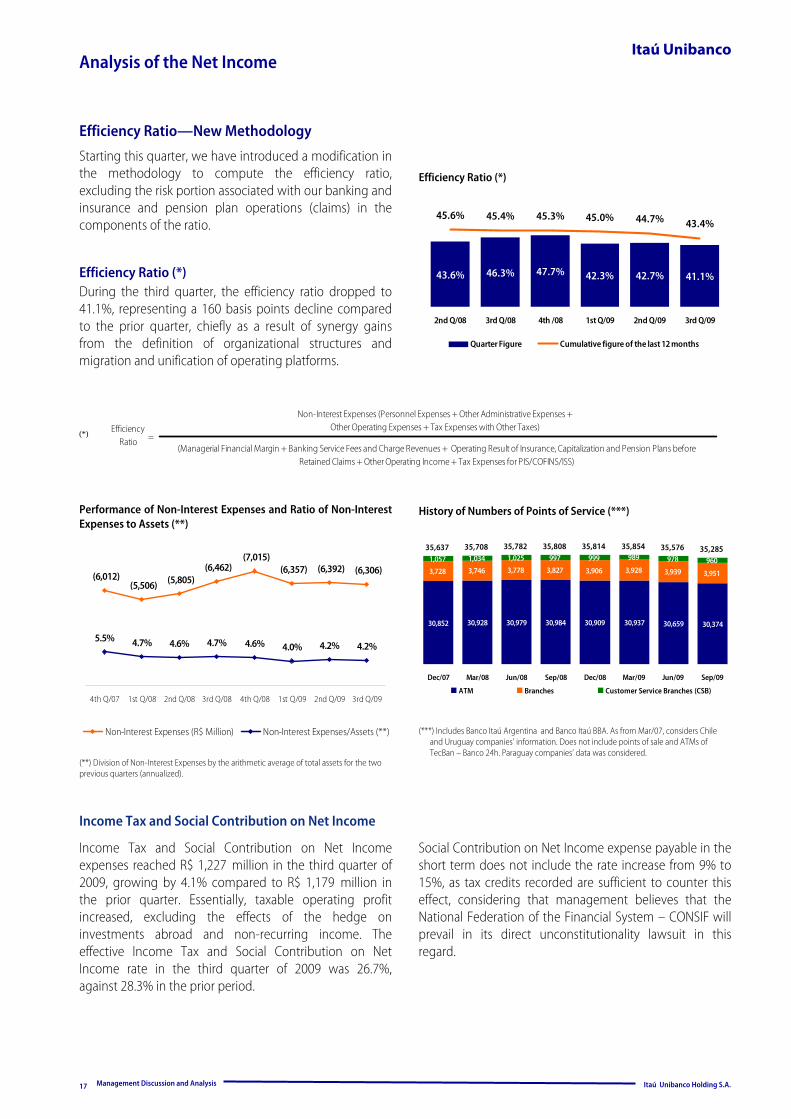
History of Numbers of Points of Service (***)
(***) Includes Banco Itaú Argentina and Banco Itaú BBA. As from Mar/07, considers Chile and Uruguay companies’ information. Does not include points of sale and ATMs of TecBan – Banco 24h. Paraguay companies’ data was considered.
(*)
(**) Division of Non-Interest Expenses by the arithmetic average of total assets for the two previous quarters (annualized).
Performance of Non-Interest Expenses and Ratio of Non-Interest Expenses to Assets (**)
Efficiency Ratio (*)
Efficiency Ratio (*) During the third quarter, the efficiency ratio dropped to 41.1%, representing a 160 basis points decline compared to the prior quarter, chiefly as a result of synergy gains from the definition of organizational structures and migration and unification of operating platforms.
Income Tax and Social Contribution on Net Income
Starting this quarter, we have introduced a modification in the methodology to compute the efficiency ratio, excluding the risk portion associated with our banking and insurance and pension plan operations (claims) in the components of the ratio.
Income Tax and Social Contribution on Net Income expenses reached R$ 1,227 million in the third quarter of 2009, growing by 4.1% compared to R$ 1,179 million in the prior quarter. Essentially, taxable operating profit increased, excluding the effects of the hedge on investments abroad and non-recurring income. The effective Income Tax and Social Contribution on Net Income rate in the third quarter of 2009 was 26.7%, against 28.3% in the prior period.
Social Contribution on Net Income expense payable in the short term does not include the rate increase from 9% to 15%, as tax credits recorded are sufficient to counter this effect, considering that management believes that the National Federation of the Financial System – CONSIF will prevail in its direct unconstitutionality lawsuit in this regard.
43.6% 46.3% 47.7% 42.3% 42.7% 41.1%
45.6% 45.4% 45.3% 45.0% 44.7% 43.4%
2nd Q/08 3rd Q/08 4th /08 1st Q/09 2nd Q/09 3rd Q/09
Quarter Figure Cumulative figure of the last 12 months
(6,012)(5,506) (5,805)
(6,462)(7,015)
(6,357) (6,392) (6,306)
5.5% 4.7% 4.6% 4.7% 4.6% 4.0% 4.2% 4.2%
4th Q/07 1st Q/08 2nd Q/08 3rd Q/08 4th Q/08 1st Q/09 2nd Q/09 3rd Q/09
Non-Interest Expenses (R$ Million) Non-Interest Expenses/Assets (**)
3,9513,9393,9283,9063,8273,7783,7463,728
35,28535,57635,85435,81435,80835,78235,70835,637
30,93730,909 30,659 30,37430,98430,97930,92830,852
1,057 1,034 1,025 997 999 989 978 960
Sep/09Jun/09Mar/09Dec/08Sep/08Jun/08Mar/08Dec/07
ATM Branches Customer Service Branches (CSB)
Efficiency Ratio—New Methodology
17
Non-Interest Expenses (Personnel Expenses + Other Administrative Expenses +Other Operating Expenses + Tax Expenses with Other Taxes)
(Managerial Financial Margin + Banking Service Fees and Charge Revenues + Operating Result of Insurance, Capitalization and Pension Plans before Retained Claims + Other Operating Income + Tax Expenses for PIS/COFINS/ISS)
EfficiencyRatio =

Balance Sheet Balance Sheet by Currency
Value at Risk Ownership Structure
Balance Sheet
Management Discussion and Analysis Itaú Unibanco Holding S.A.
Itaú Unibanco
History of Securities Portfolio R$ million
Credit Portfolio
(*) The credit balance includes sureties and endorsements.
Credit Portfolio R$ million
Securities Portfolio
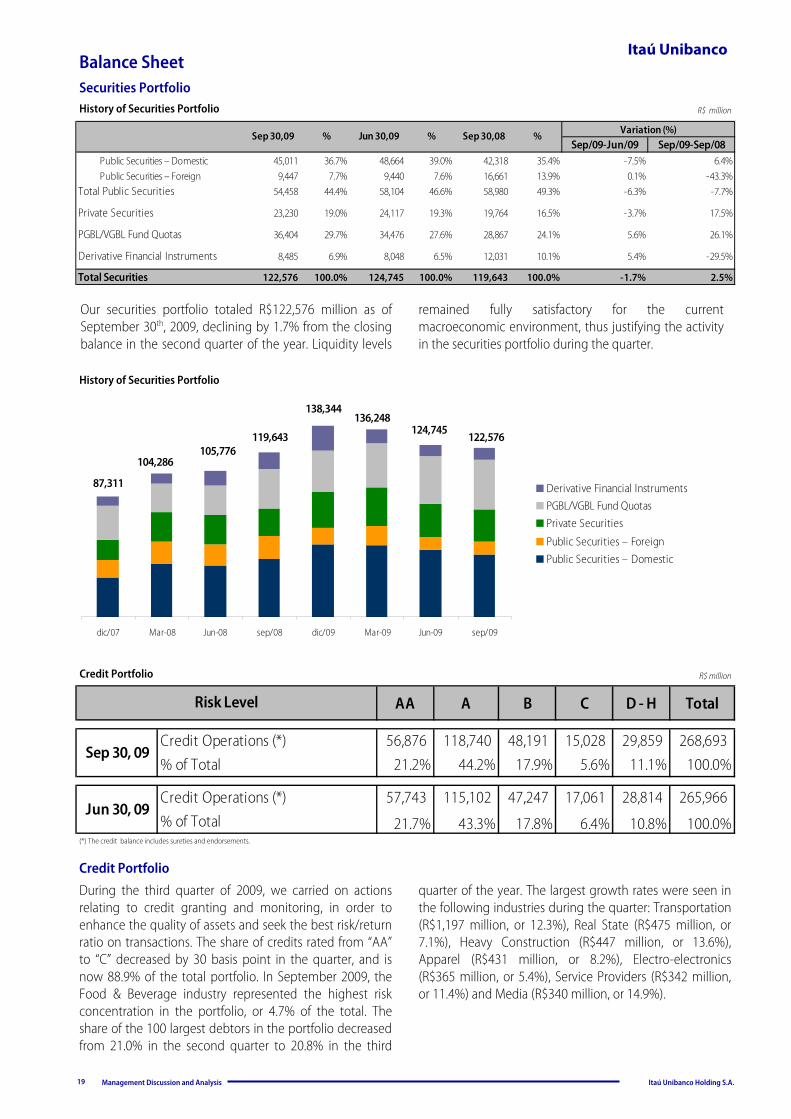
Our securities portfolio totaled R$122,576 million as of September 30th, 2009, declining by 1.7% from the closing balance in the second quarter of the year. Liquidity levels
During the third quarter of 2009, we carried on actions relating to credit granting and monitoring, in order to enhance the quality of assets and seek the best risk/return ratio on transactions. The share of credits rated from “AA” to “C” decreased by 30 basis point in the quarter, and is now 88.9% of the total portfolio. In September 2009, the Food & Beverage industry represented the highest risk concentration in the portfolio, or 4.7% of the total. The share of the 100 largest debtors in the portfolio decreased from 21.0% in the second quarter to 20.8% in the third
quarter of the year. The largest growth rates were seen in the following industries during the quarter: Transportation (R$1,197 million, or 12.3%), Real State (R$475 million, or 7.1%), Heavy Construction (R$447 million, or 13.6%), Apparel (R$431 million, or 8.2%), Electro-electronics (R$365 million, or 5.4%), Service Providers (R$342 million, or 11.4%) and Media (R$340 million, or 14.9%).
remained fully satisfactory for the current macroeconomic environment, thus justifying the activity in the securities portfolio during the quarter.
Sep/09-Jun/09 Sep/09-Sep/08Public Securities – Domestic 45,011 36.7% 48,664 39.0% 42,318 35.4% -7.5% 6.4%Public Securities – Foreign 9,447 7.7% 9,440 7.6% 16,661 13.9% 0.1% -43.3%
Total Public Securities 54,458 44.4% 58,104 46.6% 58,980 49.3% -6.3% -7.7%
Private Securities 23,230 19.0% 24,117 19.3% 19,764 16.5% -3.7% 17.5%
PGBL/VGBL Fund Quotas 36,404 29.7% 34,476 27.6% 28,867 24.1% 5.6% 26.1%
Derivative Financial Instruments 8,485 6.9% 8,048 6.5% 12,031 10.1% 5.4% -29.5%
Total Securities 122,576 100.0% 124,745 100.0% 119,643 100.0% -1.7% 2.5%
Sep 30,08 % Variation (%)Sep 30,09 % Jun 30,09 %
History of Securities Portfolio
dic/07 Mar-08 Jun-08 sep/08 dic/09 Mar-09 Jun-09 sep/09
Derivative Financial InstrumentsPGBL/VGBL Fund QuotasPrivate Securities
Public Securities – ForeignPublic Securities – Domestic
87,311
104,286 105,776
119,643
138,344 136,248
124,745 122,576
AA A B C D - H Total
Credit Operations (*) 56,876 118,740 48,191 15,028 29,859 268,693 % of Total 21.2% 44.2% 17.9% 5.6% 11.1% 100.0%
Credit Operations (*) 57,743 115,102 47,247 17,061 28,814 265,966 % of Total 21.7% 43.3% 17.8% 6.4% 10.8% 100.0%
Jun 30, 09
Risk Level
Sep 30, 09
19
Balance Sheet
Managenent Discussion and Analysis Itaú Unibanco Holding S.A.
Itaú Unibanco
Ratio between Loan Portfolio and Funding
Funding from Customers R$ millions
Funding
20
(*) The credit portfolio balance does not include sureties and endorsements.
R$ millions
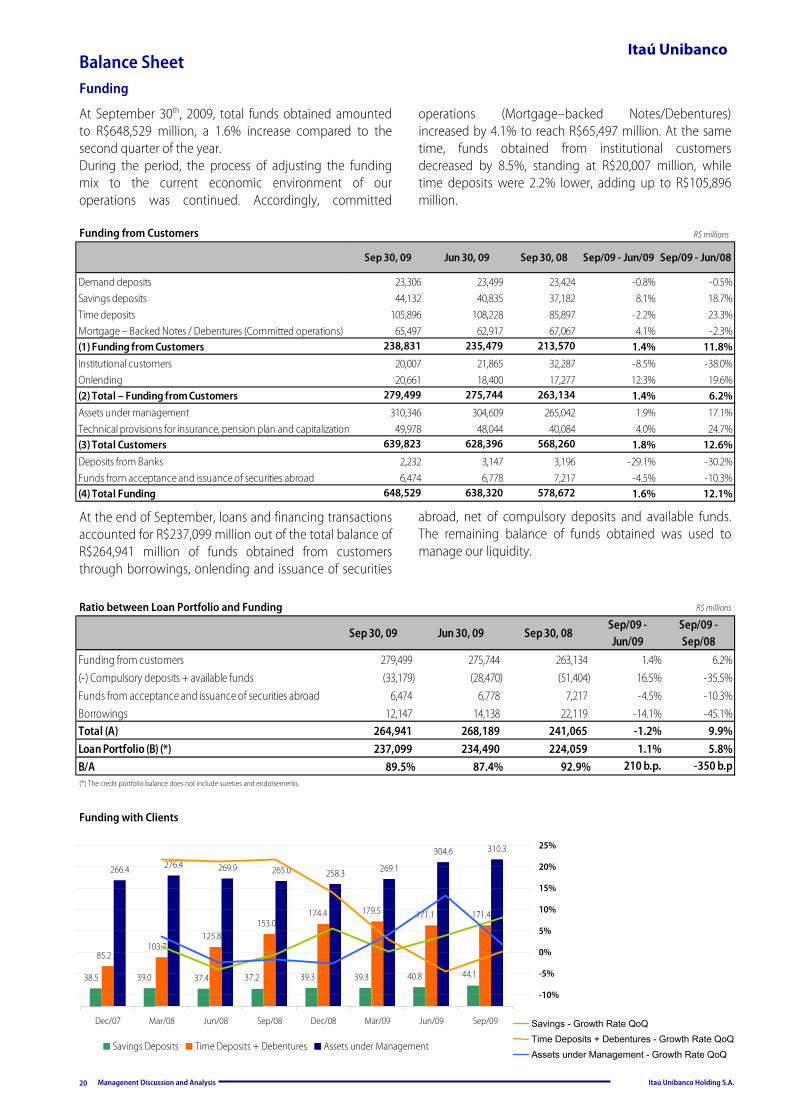
At September 30th, 2009, total funds obtained amounted to R$648,529 million, a 1.6% increase compared to the second quarter of the year. During the period, the process of adjusting the funding mix to the current economic environment of our operations was continued. Accordingly, committed
operations (Mortgage–backed Notes/Debentures) increased by 4.1% to reach R$65,497 million. At the same time, funds obtained from institutional customers decreased by 8.5%, standing at R$20,007 million, while time deposits were 2.2% lower, adding up to R$105,896 million.
At the end of September, loans and financing transactions accounted for R$237,099 million out of the total balance of R$264,941 million of funds obtained from customers through borrowings, onlending and issuance of securities
abroad, net of compulsory deposits and available funds. The remaining balance of funds obtained was used to manage our liquidity.
Funding with Clients
Sep 30, 09 Jun 30, 09 Sep 30, 08Sep/09 - Jun/09
Sep/09 - Sep/08
Funding from customers 279,499 275,744 263,134 1.4% 6.2%(-) Compulsory deposits + available funds (33,179) (28,470) (51,404) 16.5% -35.5%Funds from acceptance and issuance of securities abroad 6,474 6,778 7,217 -4.5% -10.3%Borrowings 12,147 14,138 22,119 -14.1% -45.1%Total (A) 264,941 268,189 241,065 -1.2% 9.9%Loan Portfolio (B) (*) 237,099 234,490 224,059 1.1% 5.8%B/A 89.5% 87.4% 92.9% 210 b.p. -350 b.p
Savings - Growth Rate QoQTime Deposits + Debentures - Growth Rate QoQAssets under Management - Growth Rate QoQ
Sep 30, 09 Jun 30, 09 Sep 30, 08 Sep/09 - Jun/09 Sep/09 - Jun/08
Demand deposits 23,306 23,499 23,424 -0.8% -0.5%Savings deposits 44,132 40,835 37,182 8.1% 18.7%Time deposits 105,896 108,228 85,897 -2.2% 23.3%Mortgage – Backed Notes / Debentures (Committed operations) 65,497 62,917 67,067 4.1% -2.3%(1) Funding from Customers 238,831 235,479 213,570 1.4% 11.8%Institutional customers 20,007 21,865 32,287 -8.5% -38.0%Onlending 20,661 18,400 17,277 12.3% 19.6%(2) Total – Funding from Customers 279,499 275,744 263,134 1.4% 6.2%Assets under management 310,346 304,609 265,042 1.9% 17.1%Technical provisions for insurance, pension plan and capitalization 49,978 48,044 40,084 4.0% 24.7%(3) Total Customers 639,823 628,396 568,260 1.8% 12.6%Deposits from Banks 2,232 3,147 3,196 -29.1% -30.2%Funds from acceptance and issuance of securities abroad 6,474 6,778 7,217 -4.5% -10.3%(4) Total Funding 648,529 638,320 578,672 1.6% 12.1%
266.4 276.4 269.9 265.0 258.3 269.1
304.6 310.3
44.138.5 39.0 37.4 37.2 39.3 39.3 40.8
171.4
85.2103.7
125.8153.0
174.4 179.5 171.1
Dec/07 Mar/08 Jun/08 Sep/08 Dec/08 Mar/09 Jun/09 Sep/09
Savings Deposits Time Deposits + Debentures Assets under Management
-10%
-5%
0%
5%
10%
15%
20%
25%
Balance Sheet
Management Discussion and Analysis Itaú Unibanco Holding S.A.
Itaú Unibanco
Equity
21
Solvency Ratio
External Funding
The table below highlights the main issues abroad of Itaú Unibanco outstanding on September 30th, 2009.
Main Issuances in Effect (1) US$ millions
(1) Balance refers to principal amounts. (2) Amount in US$ equivalent on the dates shown to JPY 30 billion. (3) Perpetual Bonds. (4) and (5) Amounts in US$ equivalent on the issue dates shown to CHP 46.9 billion, and CHP 48.5 billion, respectively. (6), (7) and (8) Amounts in US$ equivalent on the dates shown to € 200 million, € 100 million and € 300 million, respectively.
(9) and (10) Amounts in US$ equivalent on the dates shown to R$ 325 million and R$ 387 million, respectively. (11) Fomentation Financial Unit. (12) 180–day Libor. (13) 90–day Euribor. (14) Structured Notes
Capital Ratios
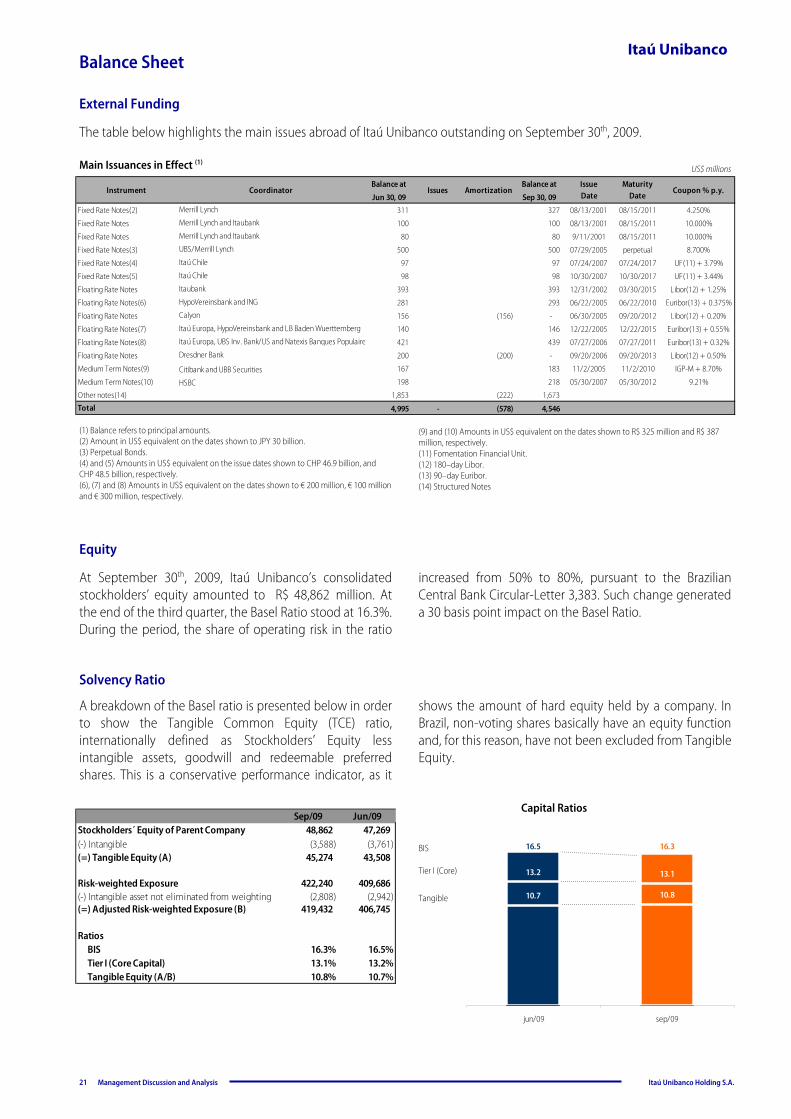
A breakdown of the Basel ratio is presented below in order to show the Tangible Common Equity (TCE) ratio, internationally defined as Stockholders’ Equity less intangible assets, goodwill and redeemable preferred shares. This is a conservative performance indicator, as it
shows the amount of hard equity held by a company. In Brazil, non-voting shares basically have an equity function and, for this reason, have not been excluded from Tangible Equity.
Sep/09 Jun/09Stockholders´ Equity of Parent Company 48,862 47,269 (-) Intangible (3,588) (3,761) (=) Tangible Equity (A) 45,274 43,508
Risk-weighted Exposure 422,240 409,686 (-) Intangible asset not eliminated from weighting (2,808) (2,942) (=) Adjusted Risk-weighted Exposure (B) 419,432 406,745
RatiosBIS 16.3% 16.5%Tier I (Core Capital) 13.1% 13.2%Tangible Equity (A/B) 10.8% 10.7%
At September 30th, 2009, Itaú Unibanco’s consolidated stockholders’ equity amounted to R$ 48,862 million. At the end of the third quarter, the Basel Ratio stood at 16.3%. During the period, the share of operating risk in the ratio
increased from 50% to 80%, pursuant to the Brazilian Central Bank Circular-Letter 3,383. Such change generated a 30 basis point impact on the Basel Ratio.
Tangible
Tier I (Core)
BIS
Balance at Balance at
Jun 30, 09 Sep 30, 09Fixed Rate Notes(2) Merrill Lynch 311 327 08/13/2001 08/15/2011 4.250%
Fixed Rate Notes Merrill Lynch and Itaubank 100 100 08/13/2001 08/15/2011 10.000%
Fixed Rate Notes Merrill Lynch and Itaubank 80 80 9/11/2001 08/15/2011 10.000%
Fixed Rate Notes(3) UBS/Merrill Lynch 500 500 07/29/2005 perpetual 8.700%
Fixed Rate Notes(4) Itaú Chile 97 97 07/24/2007 07/24/2017 UF(11) + 3.79%
Fixed Rate Notes(5) Itaú Chile 98 98 10/30/2007 10/30/2017 UF(11) + 3.44%
Floating Rate Notes Itaubank 393 393 12/31/2002 03/30/2015 Libor(12) + 1.25%
Floating Rate Notes(6) HypoVereinsbank and ING 281 293 06/22/2005 06/22/2010 Euribor(13) + 0.375%
Floating Rate Notes Calyon 156 (156) - 06/30/2005 09/20/2012 Libor(12) + 0.20%
Floating Rate Notes(7) Itaú Europa, HypoVereinsbank and LB Baden Wuerttemberg 140 146 12/22/2005 12/22/2015 Euribor(13) + 0.55%
Floating Rate Notes(8) Itaú Europa, UBS Inv. Bank/US and Natexis Banques Populaire 421 439 07/27/2006 07/27/2011 Euribor(13) + 0.32%
Floating Rate Notes Dresdner Bank 200 (200) - 09/20/2006 09/20/2013 Libor(12) + 0.50%
Medium Term Notes(9) Citibank and UBB Securities 167 183 11/2/2005 11/2/2010 IGP-M + 8.70%
Medium Term Notes(10) HSBC 198 218 05/30/2007 05/30/2012 9.21%
Other notes(14) 1,853 (222) 1,673
Total 4,995 - (578) 4,546
IssueDate
MaturityDate
Coupon % p.y.Instrument Coordinator Issues Amortization
13.2 13.1
10.7 10.8
16.5 16.3
jun/09 sep/09
Balance Sheet by Currency (*)
Management Discussion and Analysis Itaú Unibanco Holding S.A.
Itaú Unibanco
(*) Does not consider eliminations of transactions between local and foreign businesses.
22
R$ million
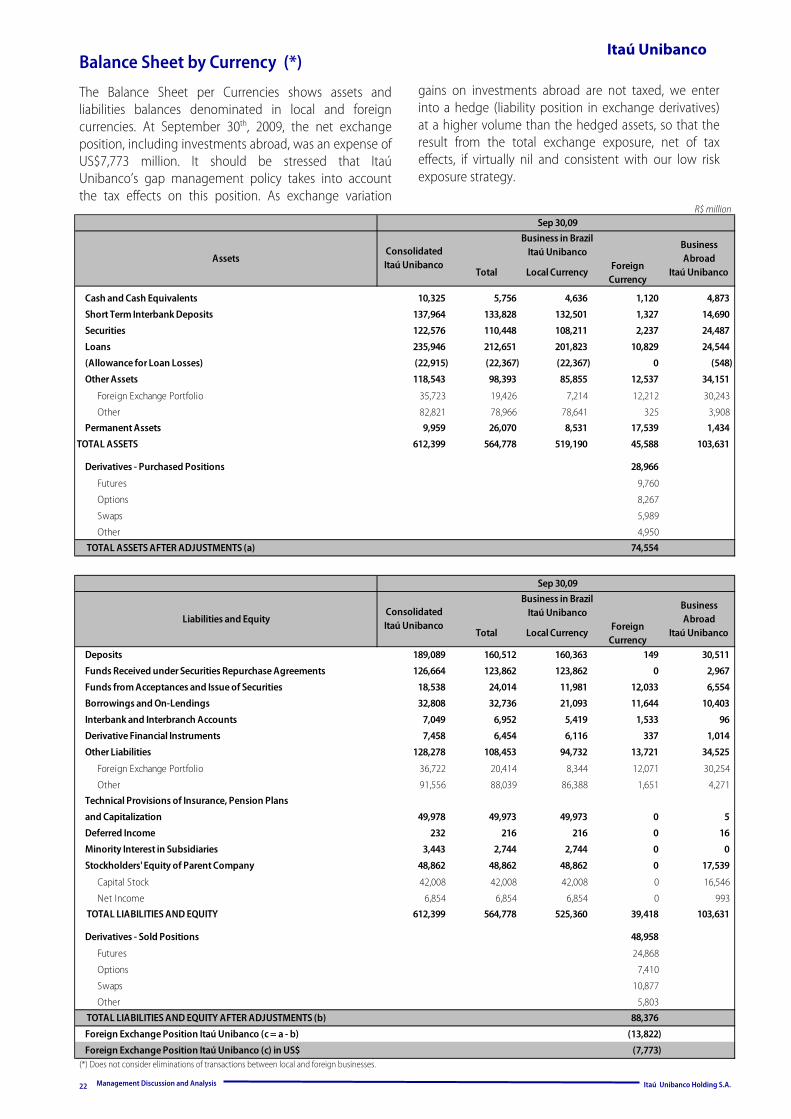
The Balance Sheet per Currencies shows assets and liabilities balances denominated in local and foreign currencies. At September 30th, 2009, the net exchange position, including investments abroad, was an expense of US$7,773 million. It should be stressed that Itaú Unibanco’s gap management policy takes into account the tax effects on this position. As exchange variation
gains on investments abroad are not taxed, we enter into a hedge (liability position in exchange derivatives) at a higher volume than the hedged assets, so that the result from the total exchange exposure, net of tax effects, if virtually nil and consistent with our low risk exposure strategy.
Sep 30,09
Total Local CurrencyForeign
Currency
Cash and Cash Equivalents 10,325 5,756 4,636 1,120 4,873
Short Term Interbank Deposits 137,964 133,828 132,501 1,327 14,690
Securities 122,576 110,448 108,211 2,237 24,487
Loans 235,946 212,651 201,823 10,829 24,544
(Allowance for Loan Losses) (22,915) (22,367) (22,367) 0 (548)
Other Assets 118,543 98,393 85,855 12,537 34,151
Foreign Exchange Portfolio 35,723 19,426 7,214 12,212 30,243
Other 82,821 78,966 78,641 325 3,908
Permanent Assets 9,959 26,070 8,531 17,539 1,434
TOTAL ASSETS 612,399 564,778 519,190 45,588 103,631
Derivatives - Purchased Positions 28,966
Futures 9,760
Options 8,267
Swaps 5,989
Other 4,950
74,554
Sep 30,09
Total Local CurrencyForeign
CurrencyDeposits 189,089 160,512 160,363 149 30,511
Funds Received under Securities Repurchase Agreements 126,664 123,862 123,862 0 2,967
Funds from Acceptances and Issue of Securities 18,538 24,014 11,981 12,033 6,554
Borrowings and On-Lendings 32,808 32,736 21,093 11,644 10,403
Interbank and Interbranch Accounts 7,049 6,952 5,419 1,533 96
Derivative Financial Instruments 7,458 6,454 6,116 337 1,014
Other Liabilities 128,278 108,453 94,732 13,721 34,525
Foreign Exchange Portfolio 36,722 20,414 8,344 12,071 30,254
Other 91,556 88,039 86,388 1,651 4,271
Technical Provisions of Insurance, Pension Plans
and Capitalization 49,978 49,973 49,973 0 5
Deferred Income 232 216 216 0 16
Minority Interest in Subsidiaries 3,443 2,744 2,744 0 0
Stockholders' Equity of Parent Company 48,862 48,862 48,862 0 17,539
Capital Stock 42,008 42,008 42,008 0 16,546
Net Income 6,854 6,854 6,854 0 993
612,399 564,778 525,360 39,418 103,631
Derivatives - Sold Positions 48,958
Futures 24,868
Options 7,410
Swaps 10,877
Other 5,803
88,376
Foreign Exchange Position Itaú Unibanco (c = a - b) (13,822)
Foreign Exchange Position Itaú Unibanco (c) in US$ (7,773)
Business Abroad
Itaú Unibanco
TOTAL LIABILITIES AND EQUITY
ConsolidatedItaú Unibanco
Business in BrazilItaú Unibanco
Business Abroad
Itaú Unibanco
ConsolidatedItaú Unibanco
Business in BrazilItaú Unibanco
Assets
TOTAL ASSETS AFTER ADJUSTMENTS (a)
TOTAL LIABILITIES AND EQUITY AFTER ADJUSTMENTS (b)
Liabilities and Equity
Management Discussion and Analysis Itaú Unibanco Holding S.A.
Itaú Unibanco Value at Risk (VaR)
23
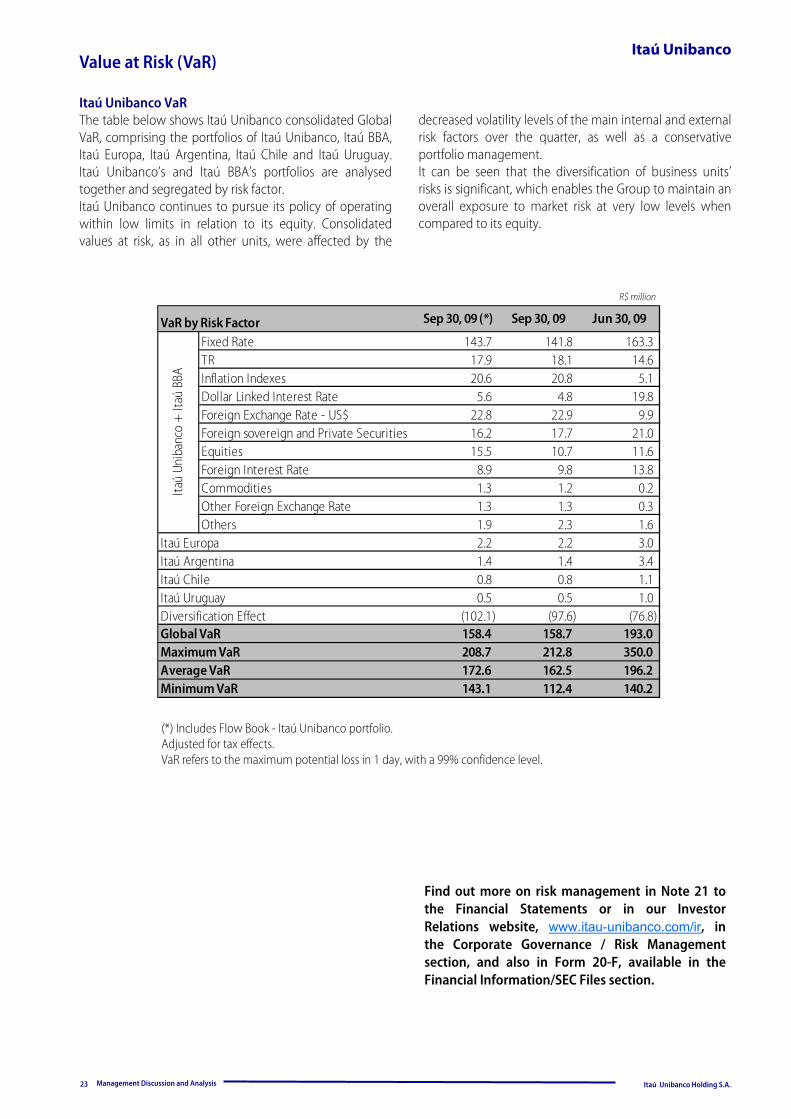
(*) Includes Flow Book - Itaú Unibanco portfolio. Adjusted for tax effects. VaR refers to the maximum potential loss in 1 day, with a 99% confidence level.
R$ million
Find out more on risk management in Note 21 to the Financial Statements or in our Investor Relations website, www.itau-unibanco.com/ir, in the Corporate Governance / Risk Management section, and also in Form 20-F, available in the Financial Information/SEC Files section.
Itaú Unibanco VaR The table below shows Itaú Unibanco consolidated Global VaR, comprising the portfolios of Itaú Unibanco, Itaú BBA, Itaú Europa, Itaú Argentina, Itaú Chile and Itaú Uruguay. Itaú Unibanco’s and Itaú BBA’s portfolios are analysed together and segregated by risk factor. Itaú Unibanco continues to pursue its policy of operating within low limits in relation to its equity. Consolidated values at risk, as in all other units, were affected by the
Sep 30, 09 (*) Sep 30, 09 Jun 30, 09
Fixed Rate 143.7 141.8 163.3 TR 17.9 18.1 14.6 Inflation Indexes 20.6 20.8 5.1 Dollar Linked Interest Rate 5.6 4.8 19.8 Foreign Exchange Rate - US$ 22.8 22.9 9.9 Foreign sovereign and Private Securities 16.2 17.7 21.0 Equities 15.5 10.7 11.6 Foreign Interest Rate 8.9 9.8 13.8 Commodities 1.3 1.2 0.2 Other Foreign Exchange Rate 1.3 1.3 0.3 Others 1.9 2.3 1.6
Itaú Europa 2.2 2.2 3.0 Itaú Argentina 1.4 1.4 3.4 Itaú Chile 0.8 0.8 1.1 Itaú Uruguay 0.5 0.5 1.0 Diversification Effect (102.1) (97.6) (76.8) Global VaR 158.4 158.7 193.0 Maximum VaR 208.7 212.8 350.0 Average VaR 172.6 162.5 196.2 Minimum VaR 143.1 112.4 140.2
VaR by Risk Factor
Itaú
Unib
anco
+ It
aú B
BA
decreased volatility levels of the main internal and external risk factors over the quarter, as well as a conservative portfolio management. It can be seen that the diversification of business units’ risks is significant, which enables the Group to maintain an overall exposure to market risk at very low levels when compared to its equity.
Management Discussion and Analysis Itaú Unibanco Holding S.A.
Itaú Unibanco
Management o four ownership structure is mainly intended to optimize the capital allocation to the various segments comprising the conglomerate. The average acquisition cost of treasury shares, as well as
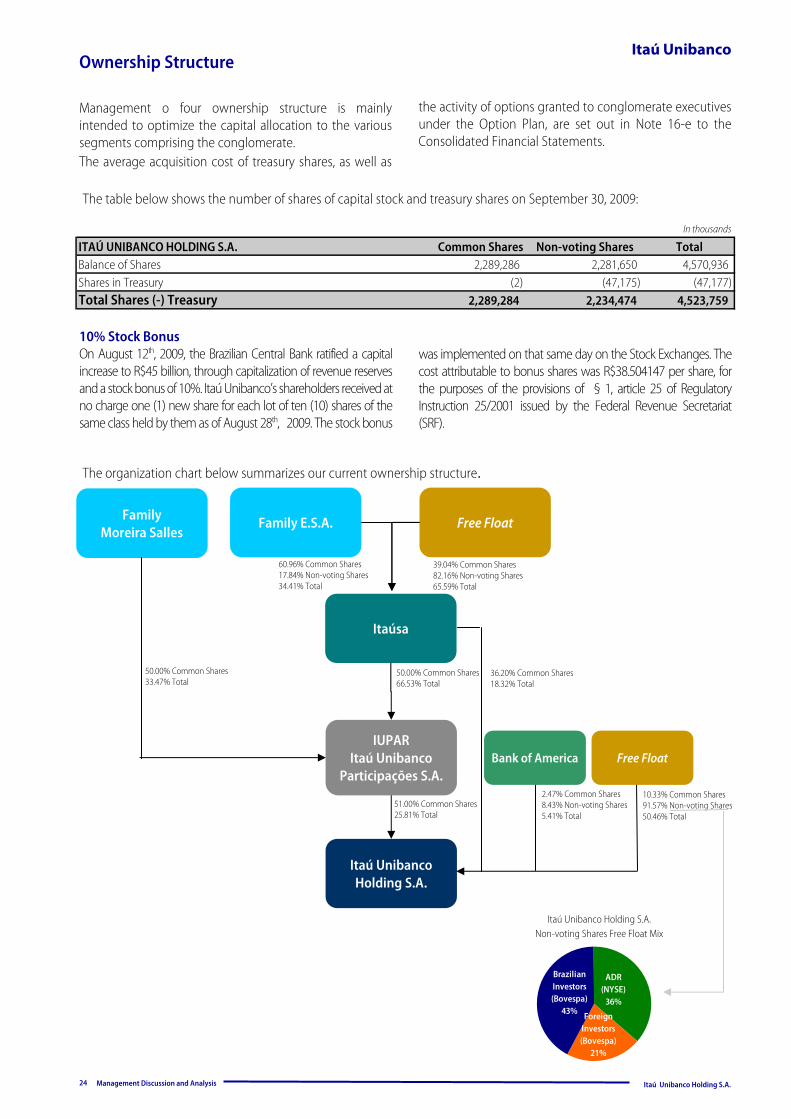
The organization chart below summarizes our current ownership structure.
24
Ownership Structure
the activity of options granted to conglomerate executives under the Option Plan, are set out in Note 16-e to the Consolidated Financial Statements.
The table below shows the number of shares of capital stock and treasury shares on September 30, 2009:
In thousands
Family E.S.A. Free Float Family Moreira Salles
Itaú Unibanco Holding S.A.
60.96% Common Shares 17.84% Non-voting Shares 34.41% Total
39.04% Common Shares 82.16% Non-voting Shares 65.59% Total
36.20% Common Shares 18.32% Total
10.33% Common Shares 91.57% Non-voting Shares 50.46% Total
IUPAR Itaú Unibanco
Participações S.A.
51.00% Common Shares 25.81% Total
Itaúsa
50.00% Common Shares 66.53% Total
50.00% Common Shares 33.47% Total
2.47% Common Shares 8.43% Non-voting Shares 5.41% Total
Bank of America Free Float
Itaú Unibanco Holding S.A. Non-voting Shares Free Float Mix
10% Stock Bonus On August 12th, 2009, the Brazilian Central Bank ratified a capital increase to R$45 billion, through capitalization of revenue reserves and a stock bonus of 10%. Itaú Unibanco’s shareholders received at no charge one (1) new share for each lot of ten (10) shares of the same class held by them as of August 28th, 2009. The stock bonus
was implemented on that same day on the Stock Exchanges. The cost attributable to bonus shares was R$38.504147 per share, for the purposes of the provisions of § 1, article 25 of Regulatory Instruction 25/2001 issued by the Federal Revenue Secretariat (SRF).
ITAÚ UNIBANCO HOLDING S.A. Common Shares Non-voting Shares TotalBalance of Shares 2,289,286 2,281,650 4,570,936 Shares in Treasury (2) (47,175) (47,177) Total Shares (-) Treasury 2,289,284 2,234,474 4,523,759
Foreign Investors (Bovespa)
21%
Brazilian Investors (Bovespa)
43%
ADR (NYSE)
36%
Management Discussion and Analysis Itaú Unibanco Banco Múltiplo S.A.
Itaú Unibanco
Performance in the Stock Market
25
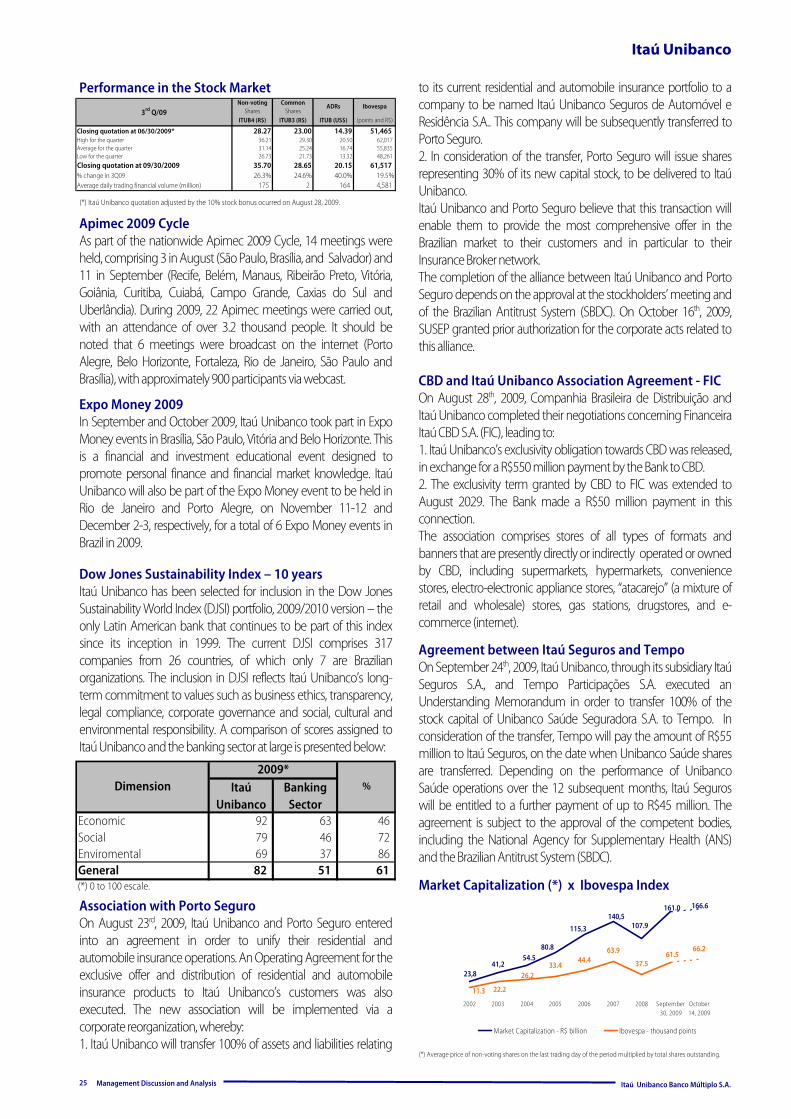
Market Capitalization (*) x Ibovespa Index
(*) Average price of non-voting shares on the last trading day of the period multiplied by total shares outstanding.
(*) Itaú Unibanco quotation adjusted by the 10% stock bonus ocurred on August 28, 2009.
Apimec 2009 Cycle As part of the nationwide Apimec 2009 Cycle, 14 meetings were held, comprising 3 in August (São Paulo, Brasília, and Salvador) and 11 in September (Recife, Belém, Manaus, Ribeirão Preto, Vitória, Goiânia, Curitiba, Cuiabá, Campo Grande, Caxias do Sul and Uberlândia). During 2009, 22 Apimec meetings were carried out, with an attendance of over 3.2 thousand people. It should be noted that 6 meetings were broadcast on the internet (Porto Alegre, Belo Horizonte, Fortaleza, Rio de Janeiro, São Paulo and Brasília), with approximately 900 participants via webcast.
Expo Money 2009 In September and October 2009, Itaú Unibanco took part in Expo Money events in Brasília, São Paulo, Vitória and Belo Horizonte. This is a financial and investment educational event designed to promote personal finance and financial market knowledge. Itaú Unibanco will also be part of the Expo Money event to be held in Rio de Janeiro and Porto Alegre, on November 11-12 and December 2-3, respectively, for a total of 6 Expo Money events in Brazil in 2009.
Dow Jones Sustainability Index – 10 years Itaú Unibanco has been selected for inclusion in the Dow Jones Sustainability World Index (DJSI) portfolio, 2009/2010 version – the only Latin American bank that continues to be part of this index since its inception in 1999. The current DJSI comprises 317 companies from 26 countries, of which only 7 are Brazilian organizations. The inclusion in DJSI reflects Itaú Unibanco’s long-term commitment to values such as business ethics, transparency, legal compliance, corporate governance and social, cultural and environmental responsibility. A comparison of scores assigned to Itaú Unibanco and the banking sector at large is presented below:
Itaú Unibanco
Banking Sector
Economic 92 63 46 Social 79 46 72 Enviromental 69 37 86 General 82 51 61 (*) 0 to 100 escale.
Dimension2009*
%
CBD and Itaú Unibanco Association Agreement - FIC On August 28th, 2009, Companhia Brasileira de Distribuição and Itaú Unibanco completed their negotiations concerning Financeira Itaú CBD S.A. (FIC), leading to: 1. Itaú Unibanco’s exclusivity obligation towards CBD was released, in exchange for a R$550 million payment by the Bank to CBD. 2. The exclusivity term granted by CBD to FIC was extended to August 2029. The Bank made a R$50 million payment in this connection. The association comprises stores of all types of formats and banners that are presently directly or indirectly operated or owned by CBD, including supermarkets, hypermarkets, convenience stores, electro-electronic appliance stores, “atacarejo” (a mixture of retail and wholesale) stores, gas stations, drugstores, and e-commerce (internet).
Agreement between Itaú Seguros and Tempo On September 24th, 2009, Itaú Unibanco, through its subsidiary Itaú Seguros S.A., and Tempo Participações S.A. executed an Understanding Memorandum in order to transfer 100% of the stock capital of Unibanco Saúde Seguradora S.A. to Tempo. In consideration of the transfer, Tempo will pay the amount of R$55 million to Itaú Seguros, on the date when Unibanco Saúde shares are transferred. Depending on the performance of Unibanco Saúde operations over the 12 subsequent months, Itaú Seguros will be entitled to a further payment of up to R$45 million. The agreement is subject to the approval of the competent bodies, including the National Agency for Supplementary Health (ANS) and the Brazilian Antitrust System (SBDC).
Association with Porto Seguro On August 23rd, 2009, Itaú Unibanco and Porto Seguro entered into an agreement in order to unify their residential and automobile insurance operations. An Operating Agreement for the exclusive offer and distribution of residential and automobile insurance products to Itaú Unibanco’s customers was also executed. The new association will be implemented via a corporate reorganization, whereby: 1. Itaú Unibanco will transfer 100% of assets and liabilities relating
to its current residential and automobile insurance portfolio to a company to be named Itaú Unibanco Seguros de Automóvel e Residência S.A.. This company will be subsequently transferred to Porto Seguro. 2. In consideration of the transfer, Porto Seguro will issue shares representing 30% of its new capital stock, to be delivered to Itaú Unibanco. Itaú Unibanco and Porto Seguro believe that this transaction will enable them to provide the most comprehensive offer in the Brazilian market to their customers and in particular to their Insurance Broker network. The completion of the alliance between Itaú Unibanco and Porto Seguro depends on the approval at the stockholders’ meeting and of the Brazilian Antitrust System (SBDC). On October 16th, 2009, SUSEP granted prior authorization for the corporate acts related to this alliance.
33.444.4
63.9
37.5
66.2
161.0
23,841,2
54.580.8
115,3
140,5107.9
166.6
61.5
26.2
11.3 22.2
2002 2003 2004 2005 2006 2007 2008 September30, 2009
October14, 2009
Market Capitalization - R$ billion Ibovespa - thousand points
Non-voting Shares
Common Shares
ADRs Ibovespa
ITUB4 (R$) ITUB3 (R$) ITUB (US$) (points and R$)
Closing quotation at 06/30/2009* 28.27 23.00 14.39 51,465 High for the quarter 36.21 29.30 20.50 62,017 Average for the quarter 31.14 25.24 16.74 55,835 Low for the quarter 26.73 21.73 13.32 48,261 Closing quotation at 09/30/2009 35.70 28.65 20.15 61,517 % change in 3Q09 26.3% 24.6% 40.0% 19.5%Average daily trading financial volume (million) 175 2 164 4,581
3rd Q/09
Pro forma Financial Statements by
Segment
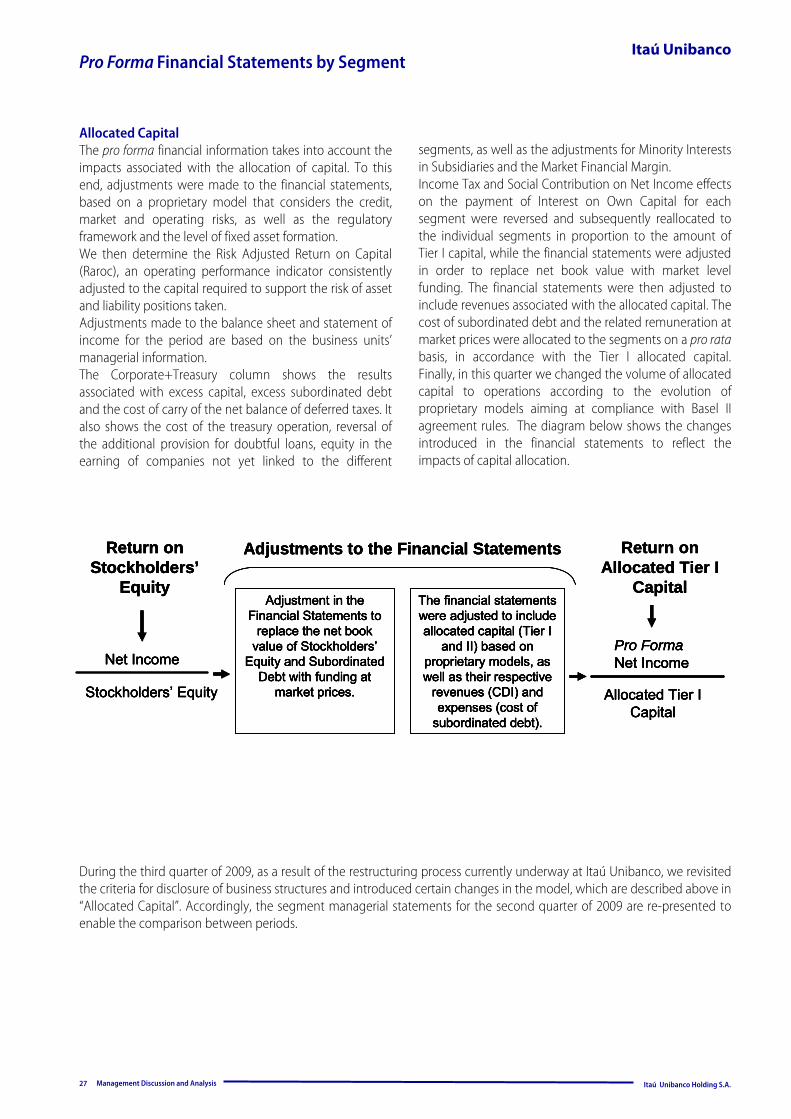
Management Discussion and Analysis Itaú Unibanco Holding S.A.
Itaú Unibanco Pro Forma Financial Statements by Segment
Allocated Capital The pro forma financial information takes into account the impacts associated with the allocation of capital. To this end, adjustments were made to the financial statements, based on a proprietary model that considers the credit, market and operating risks, as well as the regulatory framework and the level of fixed asset formation. We then determine the Risk Adjusted Return on Capital (Raroc), an operating performance indicator consistently adjusted to the capital required to support the risk of asset and liability positions taken. Adjustments made to the balance sheet and statement of income for the period are based on the business units’ managerial information. The Corporate+Treasury column shows the results associated with excess capital, excess subordinated debt and the cost of carry of the net balance of deferred taxes. It also shows the cost of the treasury operation, reversal of the additional provision for doubtful loans, equity in the earning of companies not yet linked to the different
segments, as well as the adjustments for Minority Interests in Subsidiaries and the Market Financial Margin. Income Tax and Social Contribution on Net Income effects on the payment of Interest on Own Capital for each segment were reversed and subsequently reallocated to the individual segments in proportion to the amount of Tier I capital, while the financial statements were adjusted in order to replace net book value with market level funding. The financial statements were then adjusted to include revenues associated with the allocated capital. The cost of subordinated debt and the related remuneration at market prices were allocated to the segments on a pro rata basis, in accordance with the Tier I allocated capital. Finally, in this quarter we changed the volume of allocated capital to operations according to the evolution of proprietary models aiming at compliance with Basel II agreement rules. The diagram below shows the changes introduced in the financial statements to reflect the impacts of capital allocation.
27
Return on Allocated Tier I
Capital
Net Income
Stockholders’ Equity
Adjustments to the Financial Statements
Pro FormaNet Income
Allocated Tier I Capital
Return on Stockholders’
EquityAdjustment in the
Financial Statements to replace the net book
value of Stockholders’Equity and Subordinated
Debt with funding at market prices.
The financial statements were adjusted to include allocated capital (Tier I
and II) based on proprietary models, as well as their respective
revenues (CDI) and expenses (cost of
subordinated debt).
During the third quarter of 2009, as a result of the restructuring process currently underway at Itaú Unibanco, we revisited the criteria for disclosure of business structures and introduced certain changes in the model, which are described above in “Allocated Capital”. Accordingly, the segment managerial statements for the second quarter of 2009 are re-presented to enable the comparison between periods.
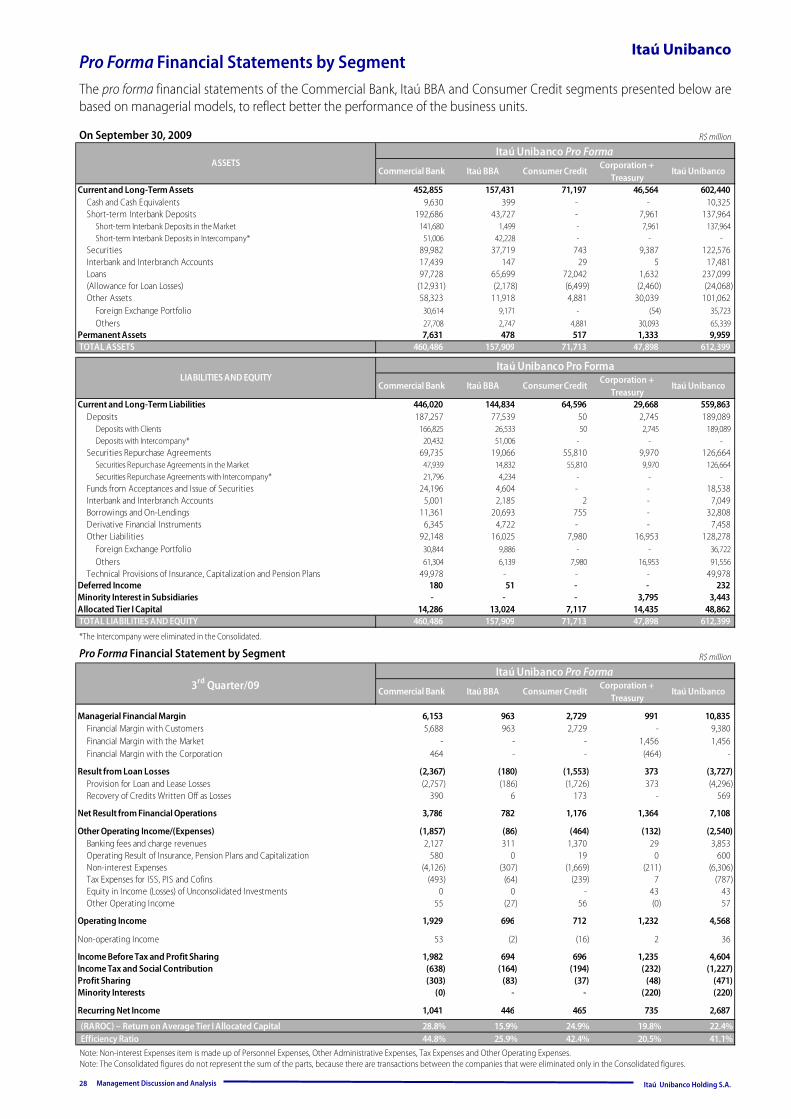
Management Discussion and Analysis Itaú Unibanco Holding S.A.
Itaú Unibanco Pro Forma Financial Statements by Segment
Pro Forma Financial Statement by Segment
The pro forma financial statements of the Commercial Bank, Itaú BBA and Consumer Credit segments presented below are based on managerial models, to reflect better the performance of the business units.
R$ million On September 30, 2009
*The Intercompany were eliminated in the Consolidated.
28
R$ million
Note: Non-interest Expenses item is made up of Personnel Expenses, Other Administrative Expenses, Tax Expenses and Other Operating Expenses. Note: The Consolidated figures do not represent the sum of the parts, because there are transactions between the companies that were eliminated only in the Consolidated figures.
Commercial Bank Itaú BBA Consumer CreditCorporation +
TreasuryItaú Unibanco
Current and Long-Term Assets 452,855 157,431 71,197 46,564 602,440 Cash and Cash Equivalents 9,630 399 - - 10,325 Short-term Interbank Deposits 192,686 43,727 - 7,961 137,964
Short-term Interbank Deposits in the Market 141,680 1,499 - 7,961 137,964 Short-term Interbank Deposits in Intercompany* 51,006 42,228 - - -
Securities 89,982 37,719 743 9,387 122,576 Interbank and Interbranch Accounts 17,439 147 29 5 17,481 Loans 97,728 65,699 72,042 1,632 237,099 (Allowance for Loan Losses) (12,931) (2,178) (6,499) (2,460) (24,068) Other Assets 58,323 11,918 4,881 30,039 101,062
Foreign Exchange Portfolio 30,614 9,171 - (54) 35,723 Others 27,708 2,747 4,881 30,093 65,339
Permanent Assets 7,631 478 517 1,333 9,959 TOTAL ASSETS 460,486 157,909 71,713 47,898 612,399
Commercial Bank Itaú BBA Consumer CreditCorporation +
TreasuryItaú Unibanco
Current and Long-Term Liabilities 446,020 144,834 64,596 29,668 559,863 Deposits 187,257 77,539 50 2,745 189,089
Deposits with Clients 166,825 26,533 50 2,745 189,089 Deposits with Intercompany* 20,432 51,006 - - -
Securities Repurchase Agreements 69,735 19,066 55,810 9,970 126,664 Securities Repurchase Agreements in the Market 47,939 14,832 55,810 9,970 126,664 Securities Repurchase Agreements with Intercompany* 21,796 4,234 - - -
Funds from Acceptances and Issue of Securities 24,196 4,604 - - 18,538 Interbank and Interbranch Accounts 5,001 2,185 2 - 7,049 Borrowings and On-Lendings 11,361 20,693 755 - 32,808 Derivative Financial Instruments 6,345 4,722 - - 7,458 Other Liabilities 92,148 16,025 7,980 16,953 128,278
Foreign Exchange Portfolio 30,844 9,886 - - 36,722 Others 61,304 6,139 7,980 16,953 91,556
Technical Provisions of Insurance, Capitalization and Pension Plans 49,978 - - - 49,978 Deferred Income 180 51 - - 232 Minority Interest in Subsidiaries - - - 3,795 3,443 Allocated Tier I Capital 14,286 13,024 7,117 14,435 48,862 TOTAL LIABILITIES AND EQUITY 460,486 157,909 71,713 47,898 612,399
Itaú Unibanco Pro Forma
Itaú Unibanco Pro FormaASSETS
LIABILITIES AND EQUITY
Commercial Bank Itaú BBA Consumer CreditCorporation +
TreasuryItaú Unibanco
Managerial Financial Margin 6,153 963 2,729 991 10,835 Financial Margin with Customers 5,688 963 2,729 - 9,380 Financial Margin with the Market - - - 1,456 1,456 Financial Margin with the Corporation 464 - - (464) -
Result from Loan Losses (2,367) (180) (1,553) 373 (3,727) Provision for Loan and Lease Losses (2,757) (186) (1,726) 373 (4,296) Recovery of Credits Written Off as Losses 390 6 173 - 569
Net Result from Financial Operations 3,786 782 1,176 1,364 7,108
Other Operating Income/(Expenses) (1,857) (86) (464) (132) (2,540) Banking fees and charge revenues 2,127 311 1,370 29 3,853 Operating Result of Insurance, Pension Plans and Capitalization 580 0 19 0 600 Non-interest Expenses (4,126) (307) (1,669) (211) (6,306) Tax Expenses for ISS, PIS and Cofins (493) (64) (239) 7 (787) Equity in Income (Losses) of Unconsolidated Investments 0 0 - 43 43 Other Operating Income 55 (27) 56 (0) 57
Operating Income 1,929 696 712 1,232 4,568
Non-operating Income 53 (2) (16) 2 36
Income Before Tax and Profit Sharing 1,982 694 696 1,235 4,604 Income Tax and Social Contribution (638) (164) (194) (232) (1,227) Profit Sharing (303) (83) (37) (48) (471) Minority Interests (0) - - (220) (220)
Recurring Net Income 1,041 446 465 735 2,687
(RAROC) – Return on Average Tier I Allocated Capital 28.8% 15.9% 24.9% 19.8% 22.4%Efficiency Ratio 44.8% 25.9% 42.4% 20.5% 41.1%
Itaú Unibanco Pro Forma3rd Quarter/09
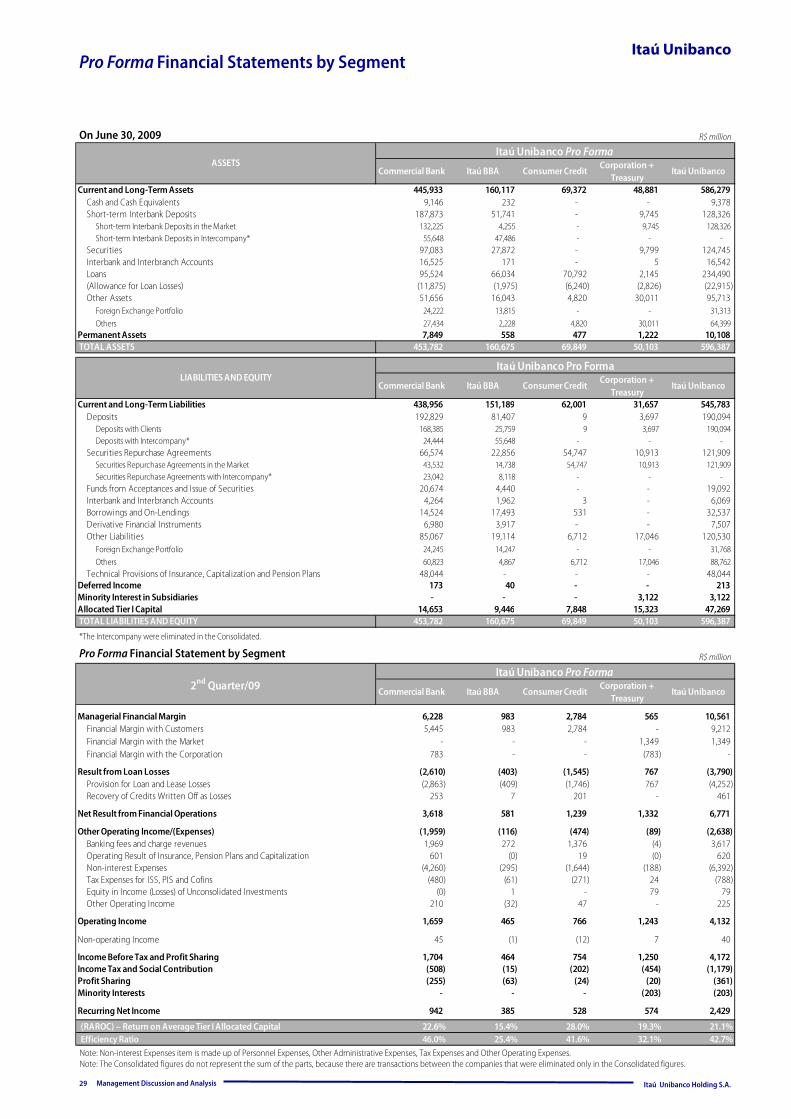
Management Discussion and Analysis Itaú Unibanco Holding S.A.
Itaú Unibanco Pro Forma Financial Statements by Segment
29
R$ million On June 30, 2009
Commercial Bank Itaú BBA Consumer CreditCorporation +
TreasuryItaú Unibanco
Current and Long-Term Assets 445,933 160,117 69,372 48,881 586,279 Cash and Cash Equivalents 9,146 232 - - 9,378 Short-term Interbank Deposits 187,873 51,741 - 9,745 128,326
Short-term Interbank Deposits in the Market 132,225 4,255 - 9,745 128,326 Short-term Interbank Deposits in Intercompany* 55,648 47,486 - - -
Securities 97,083 27,872 - 9,799 124,745 Interbank and Interbranch Accounts 16,525 171 - 5 16,542 Loans 95,524 66,034 70,792 2,145 234,490 (Allowance for Loan Losses) (11,875) (1,975) (6,240) (2,826) (22,915) Other Assets 51,656 16,043 4,820 30,011 95,713
Foreign Exchange Portfolio 24,222 13,815 - - 31,313 Others 27,434 2,228 4,820 30,011 64,399
Permanent Assets 7,849 558 477 1,222 10,108 TOTAL ASSETS 453,782 160,675 69,849 50,103 596,387
Commercial Bank Itaú BBA Consumer CreditCorporation +
TreasuryItaú Unibanco
Current and Long-Term Liabilities 438,956 151,189 62,001 31,657 545,783 Deposits 192,829 81,407 9 3,697 190,094
Deposits with Clients 168,385 25,759 9 3,697 190,094 Deposits with Intercompany* 24,444 55,648 - - -
Securities Repurchase Agreements 66,574 22,856 54,747 10,913 121,909 Securities Repurchase Agreements in the Market 43,532 14,738 54,747 10,913 121,909 Securities Repurchase Agreements with Intercompany* 23,042 8,118 - - -
Funds from Acceptances and Issue of Securities 20,674 4,440 - - 19,092 Interbank and Interbranch Accounts 4,264 1,962 3 - 6,069 Borrowings and On-Lendings 14,524 17,493 531 - 32,537 Derivative Financial Instruments 6,980 3,917 - - 7,507 Other Liabilities 85,067 19,114 6,712 17,046 120,530
Foreign Exchange Portfolio 24,245 14,247 - - 31,768 Others 60,823 4,867 6,712 17,046 88,762
Technical Provisions of Insurance, Capitalization and Pension Plans 48,044 - - - 48,044 Deferred Income 173 40 - - 213 Minority Interest in Subsidiaries - - - 3,122 3,122 Allocated Tier I Capital 14,653 9,446 7,848 15,323 47,269 TOTAL LIABILITIES AND EQUITY 453,782 160,675 69,849 50,103 596,387
Itaú Unibanco Pro Forma
Itaú Unibanco Pro Forma
LIABILITIES AND EQUITY
ASSETS
Commercial Bank Itaú BBA Consumer CreditCorporation +
TreasuryItaú Unibanco
Managerial Financial Margin 6,228 983 2,784 565 10,561 Financial Margin with Customers 5,445 983 2,784 - 9,212 Financial Margin with the Market - - - 1,349 1,349 Financial Margin with the Corporation 783 - - (783) -
Result from Loan Losses (2,610) (403) (1,545) 767 (3,790) Provision for Loan and Lease Losses (2,863) (409) (1,746) 767 (4,252) Recovery of Credits Written Off as Losses 253 7 201 - 461
Net Result from Financial Operations 3,618 581 1,239 1,332 6,771
Other Operating Income/(Expenses) (1,959) (116) (474) (89) (2,638) Banking fees and charge revenues 1,969 272 1,376 (4) 3,617 Operating Result of Insurance, Pension Plans and Capitalization 601 (0) 19 (0) 620 Non-interest Expenses (4,260) (295) (1,644) (188) (6,392) Tax Expenses for ISS, PIS and Cofins (480) (61) (271) 24 (788) Equity in Income (Losses) of Unconsolidated Investments (0) 1 - 79 79 Other Operating Income 210 (32) 47 - 225
Operating Income 1,659 465 766 1,243 4,132
Non-operating Income 45 (1) (12) 7 40
Income Before Tax and Profit Sharing 1,704 464 754 1,250 4,172 Income Tax and Social Contribution (508) (15) (202) (454) (1,179) Profit Sharing (255) (63) (24) (20) (361) Minority Interests - - - (203) (203)
Recurring Net Income 942 385 528 574 2,429
(RAROC) – Return on Average Tier I Allocated Capital 22.6% 15.4% 28.0% 19.3% 21.1%Efficiency Ratio 46.0% 25.4% 41.6% 32.1% 42.7%
Itaú Unibanco Pro Forma2nd Quarter/09
Pro Forma Financial Statement by Segment *The Intercompany were eliminated in the Consolidated.
R$ million
Note: Non-interest Expenses item is made up of Personnel Expenses, Other Administrative Expenses, Tax Expenses and Other Operating Expenses. Note: The Consolidated figures do not represent the sum of the parts, because there are transactions between the companies that were eliminated only in the Consolidated figures.
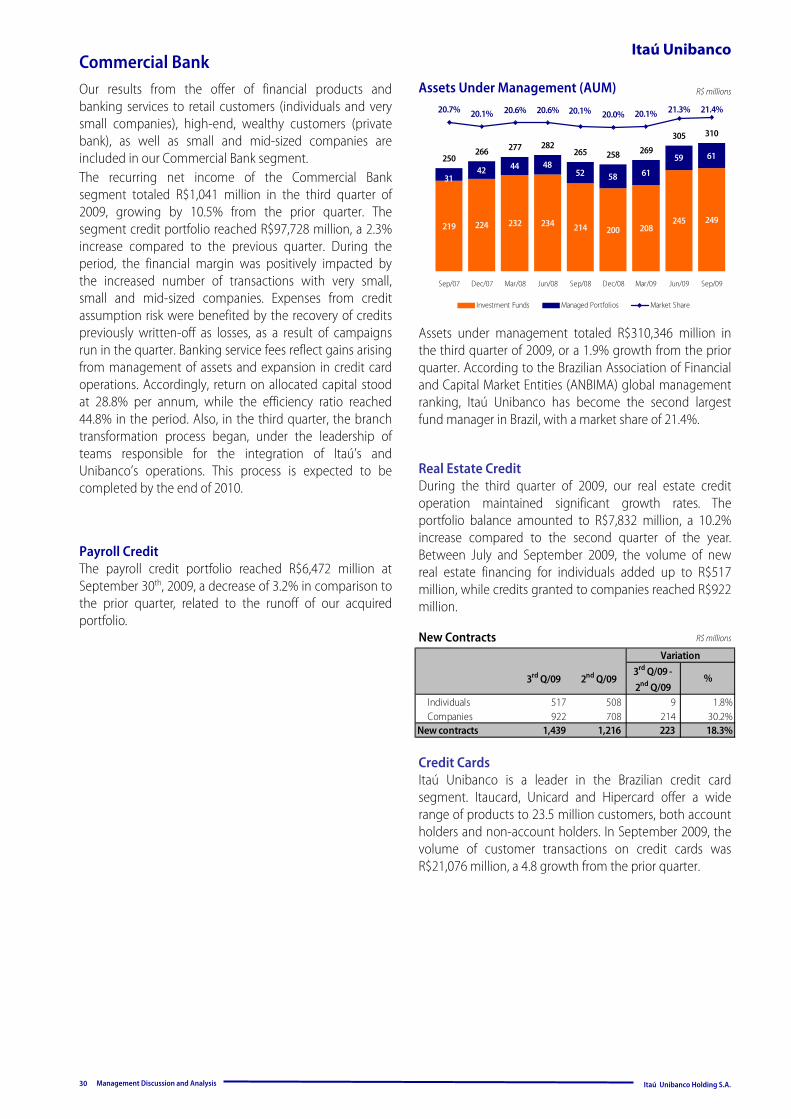
Management Discussion and Analysis Itaú Unibanco Holding S.A.
Commercial Bank Itaú Unibanco
30
Our results from the offer of financial products and banking services to retail customers (individuals and very small companies), high-end, wealthy customers (private bank), as well as small and mid-sized companies are included in our Commercial Bank segment. The recurring net income of the Commercial Bank segment totaled R$1,041 million in the third quarter of 2009, growing by 10.5% from the prior quarter. The segment credit portfolio reached R$97,728 million, a 2.3% increase compared to the previous quarter. During the period, the financial margin was positively impacted by the increased number of transactions with very small, small and mid-sized companies. Expenses from credit assumption risk were benefited by the recovery of credits previously written-off as losses, as a result of campaigns run in the quarter. Banking service fees reflect gains arising from management of assets and expansion in credit card operations. Accordingly, return on allocated capital stood at 28.8% per annum, while the efficiency ratio reached 44.8% in the period. Also, in the third quarter, the branch transformation process began, under the leadership of teams responsible for the integration of Itaú’s and Unibanco’s operations. This process is expected to be completed by the end of 2010.
Assets Under Management (AUM)
Assets under management totaled R$310,346 million in the third quarter of 2009, or a 1.9% growth from the prior quarter. According to the Brazilian Association of Financial and Capital Market Entities (ANBIMA) global management ranking, Itaú Unibanco has become the second largest fund manager in Brazil, with a market share of 21.4%.
Payroll Credit The payroll credit portfolio reached R$6,472 million at September 30th, 2009, a decrease of 3.2% in comparison to the prior quarter, related to the runoff of our acquired portfolio.
Real Estate Credit During the third quarter of 2009, our real estate credit operation maintained significant growth rates. The portfolio balance amounted to R$7,832 million, a 10.2% increase compared to the second quarter of the year. Between July and September 2009, the volume of new real estate financing for individuals added up to R$517 million, while credits granted to companies reached R$922 million.
Credit Cards Itaú Unibanco is a leader in the Brazilian credit card segment. Itaucard, Unicard and Hipercard offer a wide range of products to 23.5 million customers, both account holders and non-account holders. In September 2009, the volume of customer transactions on credit cards was R$21,076 million, a 4.8 growth from the prior quarter.
R$ millions
New Contracts R$ millions
3rd Q/09 2nd Q/093rd Q/09 - 2nd Q/09
%
Individuals 517 508 9 1.8%Companies 922 708 214 30.2%
New contracts 1,439 1,216 223 18.3%
Variation
219 224 232 234 214 200 208245
42 44 4852 58 61
59 61250266 277 282
265 258 269
305 310
249
31
20.7% 20.1% 20.6% 20.6% 20.0% 20.1% 21.3% 21.4%20.1%
Sep/07 Dec/07 Mar/08 Jun/08 Sep/08 Dec/08 Mar/09 Jun/09 Sep/09
Investment Funds Managed Portfolios Market Share
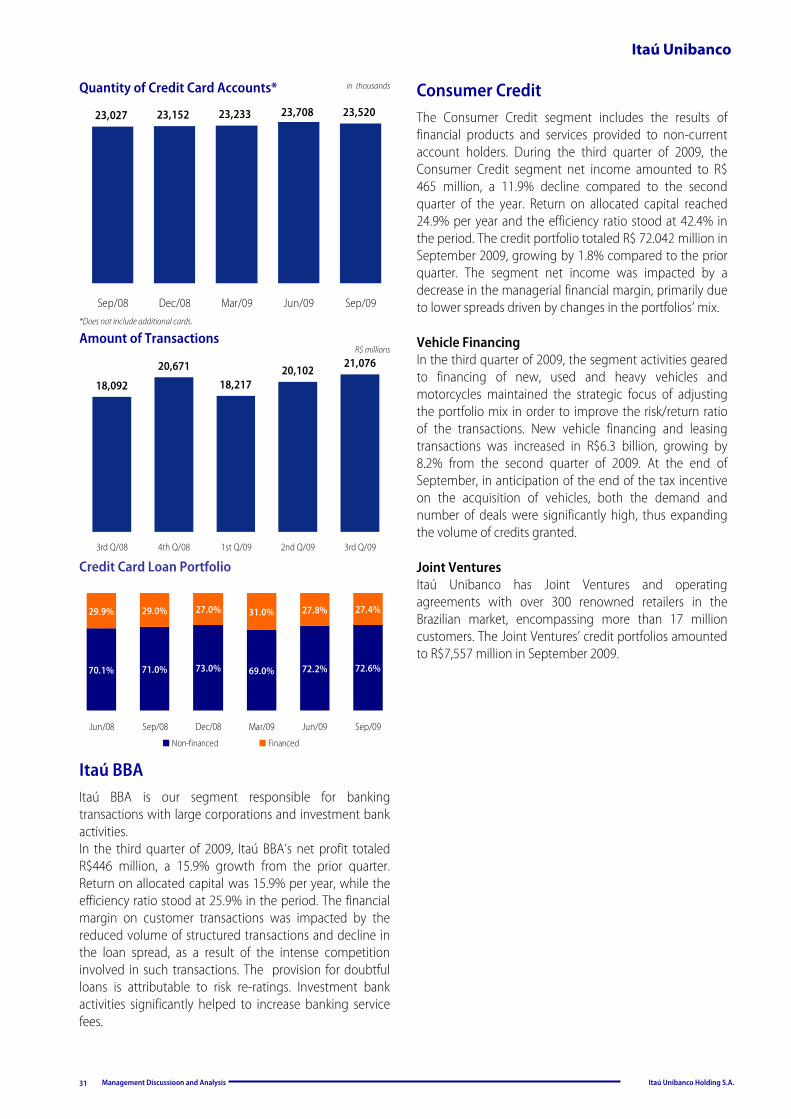
Management Discussioon and Analysis Itaú Unibanco Holding S.A.
Itaú Unibanco
31
Itaú BBA is our segment responsible for banking transactions with large corporations and investment bank activities. In the third quarter of 2009, Itaú BBA’s net profit totaled R$446 million, a 15.9% growth from the prior quarter. Return on allocated capital was 15.9% per year, while the efficiency ratio stood at 25.9% in the period. The financial margin on customer transactions was impacted by the reduced volume of structured transactions and decline in the loan spread, as a result of the intense competition involved in such transactions. The provision for doubtful loans is attributable to risk re-ratings. Investment bank activities significantly helped to increase banking service fees.
Itaú BBA
Consumer Credit
Credit Card Loan Portfolio
The Consumer Credit segment includes the results of financial products and services provided to non-current account holders. During the third quarter of 2009, the Consumer Credit segment net income amounted to R$ 465 million, a 11.9% decline compared to the second quarter of the year. Return on allocated capital reached 24.9% per year and the efficiency ratio stood at 42.4% in the period. The credit portfolio totaled R$ 72.042 million in September 2009, growing by 1.8% compared to the prior quarter. The segment net income was impacted by a decrease in the managerial financial margin, primarily due to lower spreads driven by changes in the portfolios’ mix. Vehicle Financing In the third quarter of 2009, the segment activities geared to financing of new, used and heavy vehicles and motorcycles maintained the strategic focus of adjusting the portfolio mix in order to improve the risk/return ratio of the transactions. New vehicle financing and leasing transactions was increased in R$6.3 billion, growing by 8.2% from the second quarter of 2009. At the end of September, in anticipation of the end of the tax incentive on the acquisition of vehicles, both the demand and number of deals were significantly high, thus expanding the volume of credits granted. Joint Ventures Itaú Unibanco has Joint Ventures and operating agreements with over 300 renowned retailers in the Brazilian market, encompassing more than 17 million customers. The Joint Ventures’ credit portfolios amounted to R$7,557 million in September 2009.
70.1% 71.0% 73.0% 69.0% 72.2% 72.6%
29.9% 29.0% 27.0% 31.0% 27.8% 27.4%
Jun/08 Sep/08 Dec/08 Mar/09 Jun/09 Sep/09
Non-financed Financed
Quantity of Credit Card Accounts* in thousands
*Does not include additional cards.
R$ millions Amount of Transactions
23,027 23,152 23,233 23,708 23,520
Sep/08 Dec/08 Mar/09 Jun/09 Sep/09
18,092
20,671
18,21720,102
21,076
3rd Q/08 4th Q/08 1st Q/09 2nd Q/09 3rd Q/09
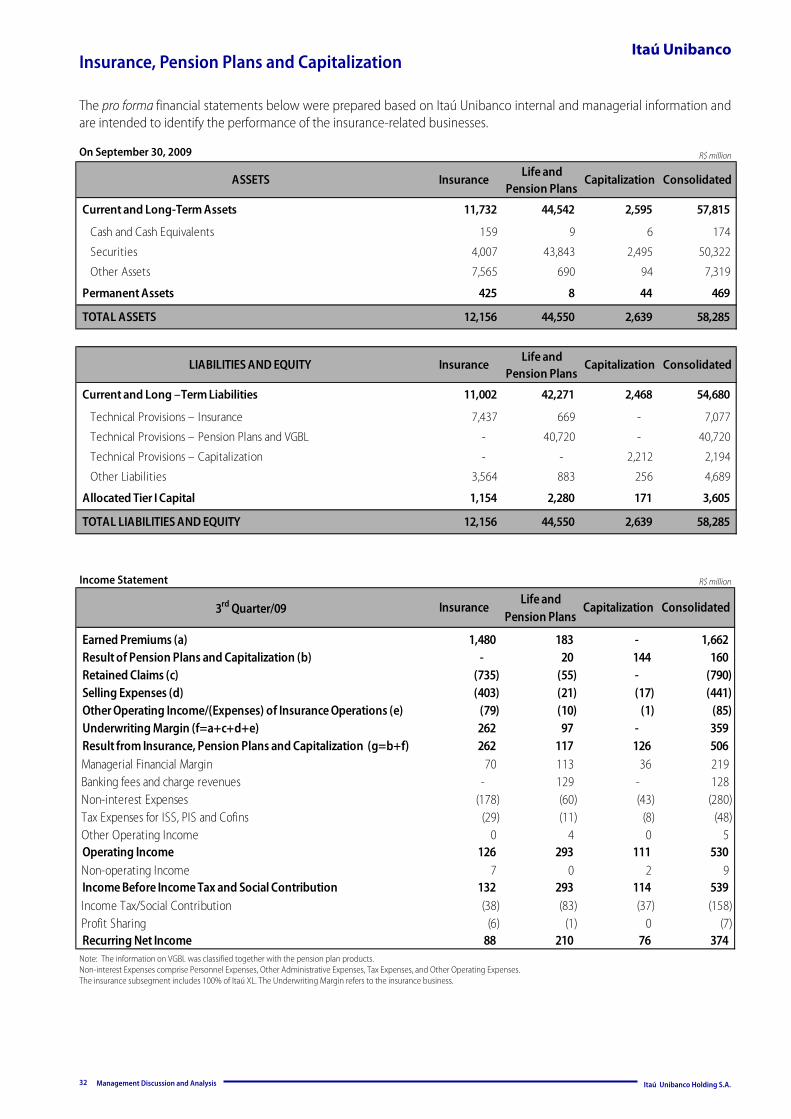
Insurance, Pension Plans and Capitalization
Management Discussion and Analysis Itaú Unibanco Holding S.A.
Itaú Unibanco
R$ million On September 30, 2009
Income Statement R$ million
The pro forma financial statements below were prepared based on Itaú Unibanco internal and managerial information and are intended to identify the performance of the insurance-related businesses.
Note: The information on VGBL was classified together with the pension plan products. Non-interest Expenses comprise Personnel Expenses, Other Administrative Expenses, Tax Expenses, and Other Operating Expenses. The insurance subsegment includes 100% of Itaú XL. The Underwriting Margin refers to the insurance business.
32
ASSETS InsuranceLife and
Pension PlansCapitalization Consolidated
Current and Long-Term Assets 11,732 44,542 2,595 57,815
Cash and Cash Equivalents 159 9 6 174
Securities 4,007 43,843 2,495 50,322
Other Assets 7,565 690 94 7,319
Permanent Assets 425 8 44 469
TOTAL ASSETS 12,156 44,550 2,639 58,285
LIABILITIES AND EQUITY InsuranceLife and
Pension PlansCapitalization Consolidated
Current and Long –Term Liabilities 11,002 42,271 2,468 54,680
Technical Provisions – Insurance 7,437 669 - 7,077
Technical Provisions – Pension Plans and VGBL - 40,720 - 40,720
Technical Provisions – Capitalization - - 2,212 2,194
Other Liabilities 3,564 883 256 4,689
Allocated Tier I Capital 1,154 2,280 171 3,605
TOTAL LIABILITIES AND EQUITY 12,156 44,550 2,639 58,285
3rd Quarter/09 InsuranceLife and
Pension PlansCapitalization Consolidated
Earned Premiums (a) 1,480 183 - 1,662 Result of Pension Plans and Capitalization (b) - 20 144 160 Retained Claims (c) (735) (55) - (790) Selling Expenses (d) (403) (21) (17) (441) Other Operating Income/(Expenses) of Insurance Operations (e) (79) (10) (1) (85) Underwriting Margin (f=a+c+d+e) 262 97 - 359 Result from Insurance, Pension Plans and Capitalization (g=b+f) 262 117 126 506 Managerial Financial Margin 70 113 36 219 Banking fees and charge revenues - 129 - 128 Non-interest Expenses (178) (60) (43) (280) Tax Expenses for ISS, PIS and Cofins (29) (11) (8) (48) Other Operating Income 0 4 0 5 Operating Income 126 293 111 530 Non-operating Income 7 0 2 9 Income Before Income Tax and Social Contribution 132 293 114 539 Income Tax/Social Contribution (38) (83) (37) (158) Profit Sharing (6) (1) 0 (7) Recurring Net Income 88 210 76 374
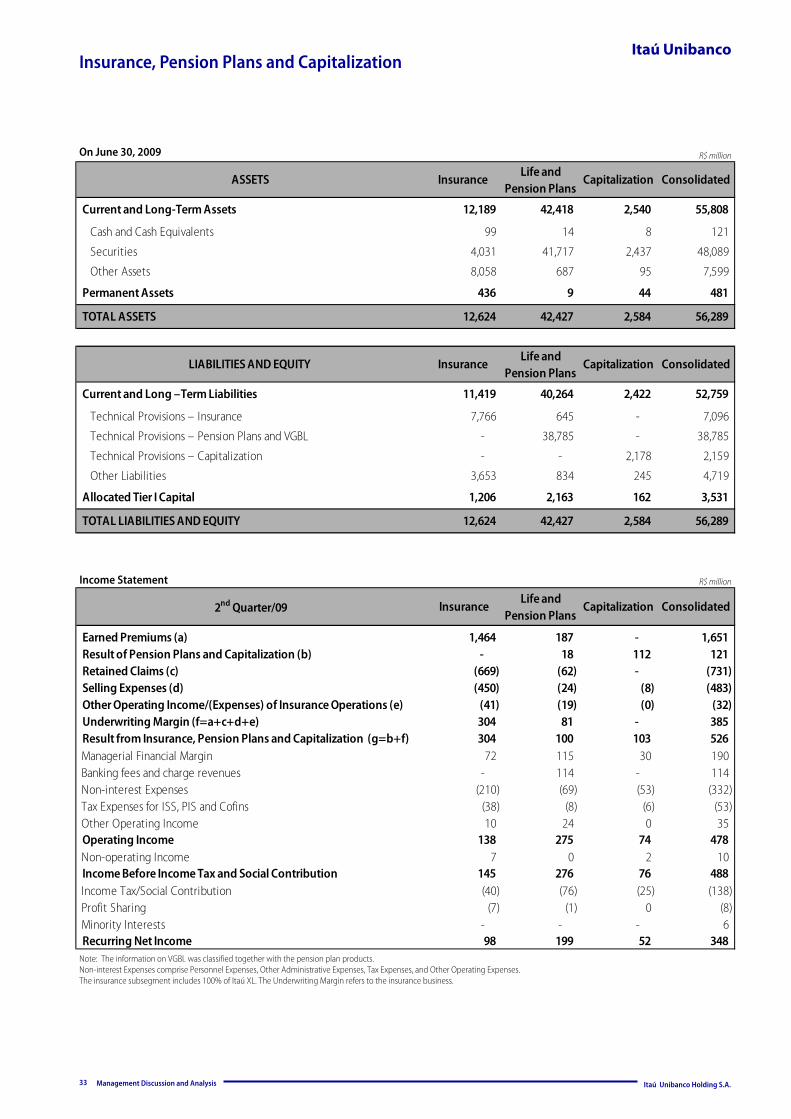
Insurance, Pension Plans and Capitalization
Management Discussion and Analysis Itaú Unibanco Holding S.A.
Itaú Unibanco
Note: The information on VGBL was classified together with the pension plan products. Non-interest Expenses comprise Personnel Expenses, Other Administrative Expenses, Tax Expenses, and Other Operating Expenses. The insurance subsegment includes 100% of Itaú XL. The Underwriting Margin refers to the insurance business.
33
R$ million On June 30, 2009
Income Statement R$ million
ASSETS InsuranceLife and
Pension PlansCapitalization Consolidated
Current and Long-Term Assets 12,189 42,418 2,540 55,808
Cash and Cash Equivalents 99 14 8 121
Securities 4,031 41,717 2,437 48,089
Other Assets 8,058 687 95 7,599
Permanent Assets 436 9 44 481
TOTAL ASSETS 12,624 42,427 2,584 56,289
LIABILITIES AND EQUITY InsuranceLife and
Pension PlansCapitalization Consolidated
Current and Long –Term Liabilities 11,419 40,264 2,422 52,759
Technical Provisions – Insurance 7,766 645 - 7,096
Technical Provisions – Pension Plans and VGBL - 38,785 - 38,785
Technical Provisions – Capitalization - - 2,178 2,159
Other Liabilities 3,653 834 245 4,719
Allocated Tier I Capital 1,206 2,163 162 3,531
TOTAL LIABILITIES AND EQUITY 12,624 42,427 2,584 56,289
2nd Quarter/09 InsuranceLife and
Pension PlansCapitalization Consolidated
Earned Premiums (a) 1,464 187 - 1,651 Result of Pension Plans and Capitalization (b) - 18 112 121 Retained Claims (c) (669) (62) - (731) Selling Expenses (d) (450) (24) (8) (483) Other Operating Income/(Expenses) of Insurance Operations (e) (41) (19) (0) (32) Underwriting Margin (f=a+c+d+e) 304 81 - 385 Result from Insurance, Pension Plans and Capitalization (g=b+f) 304 100 103 526 Managerial Financial Margin 72 115 30 190 Banking fees and charge revenues - 114 - 114 Non-interest Expenses (210) (69) (53) (332) Tax Expenses for ISS, PIS and Cofins (38) (8) (6) (53) Other Operating Income 10 24 0 35 Operating Income 138 275 74 478 Non-operating Income 7 0 2 10 Income Before Income Tax and Social Contribution 145 276 76 488 Income Tax/Social Contribution (40) (76) (25) (138) Profit Sharing (7) (1) 0 (8) Minority Interests - - - 6 Recurring Net Income 98 199 52 348
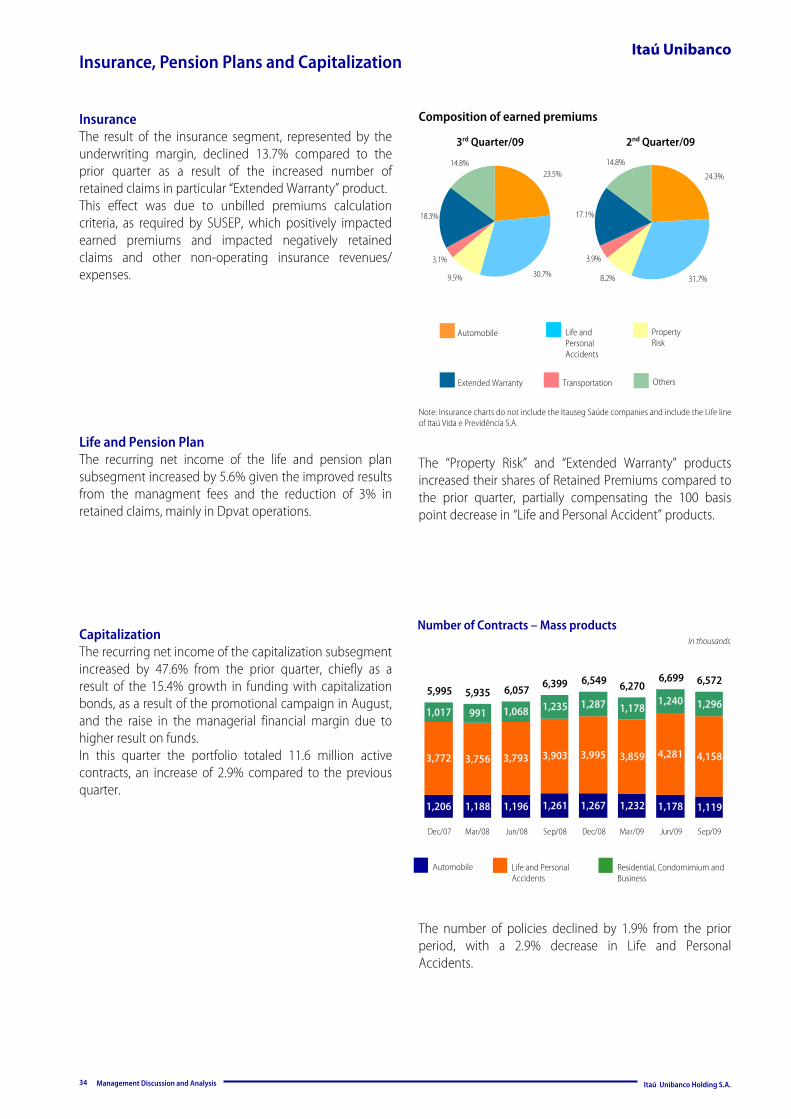
Insurance, Pension Plans and Capitalization
Management Discussion and Analysis Itaú Unibanco Holding S.A.
Itaú Unibanco
Composition of earned premiums
3rd Quarter/09 2nd Quarter/09
Automobile
Extended Warranty
Number of Contracts – Mass products In thousands
Note: Insurance charts do not include the Itauseg Saúde companies and include the Life line of Itaú Vida e Previdência S.A.
Automobile Life and Personal Accidents
Residential, Condomimium and Business
34
Life and Personal Accidents
Property Risk
Capitalization The recurring net income of the capitalization subsegment increased by 47.6% from the prior quarter, chiefly as a result of the 15.4% growth in funding with capitalization bonds, as a result of the promotional campaign in August, and the raise in the managerial financial margin due to higher result on funds. In this quarter the portfolio totaled 11.6 million active contracts, an increase of 2.9% compared to the previous quarter.
The “Property Risk” and “Extended Warranty” products increased their shares of Retained Premiums compared to the prior quarter, partially compensating the 100 basis point decrease in “Life and Personal Accident” products.
The number of policies declined by 1.9% from the prior period, with a 2.9% decrease in Life and Personal Accidents.
Insurance The result of the insurance segment, represented by the underwriting margin, declined 13.7% compared to the prior quarter as a result of the increased number of retained claims in particular “Extended Warranty” product. This effect was due to unbilled premiums calculation criteria, as required by SUSEP, which positively impacted earned premiums and impacted negatively retained claims and other non-operating insurance revenues/expenses.
Life and Pension Plan The recurring net income of the life and pension plan subsegment increased by 5.6% given the improved results from the managment fees and the reduction of 3% in retained claims, mainly in Dpvat operations.
Others Transportation
1,206 1,188 1,196 1,261 1,267 1,232 1,178 1,119
3,772 3,756 3,793 3,903 3,995 3,859 4,281 4,158
1,068 1,235 1,287 1,1781,240 1,296
9911,017
5,995 5,935 6,057 6,399 6,549 6,2706,699 6,572
Dec/07 Mar/08 Jun/08 Sep/08 Dec/08 Mar/09 Jun/09 Sep/09
30.7%
3.1%
14.8%
18.3%
9.5%
23.5%
31.7%
3.9%
14.8%
24.3%
8.2%
17.1%
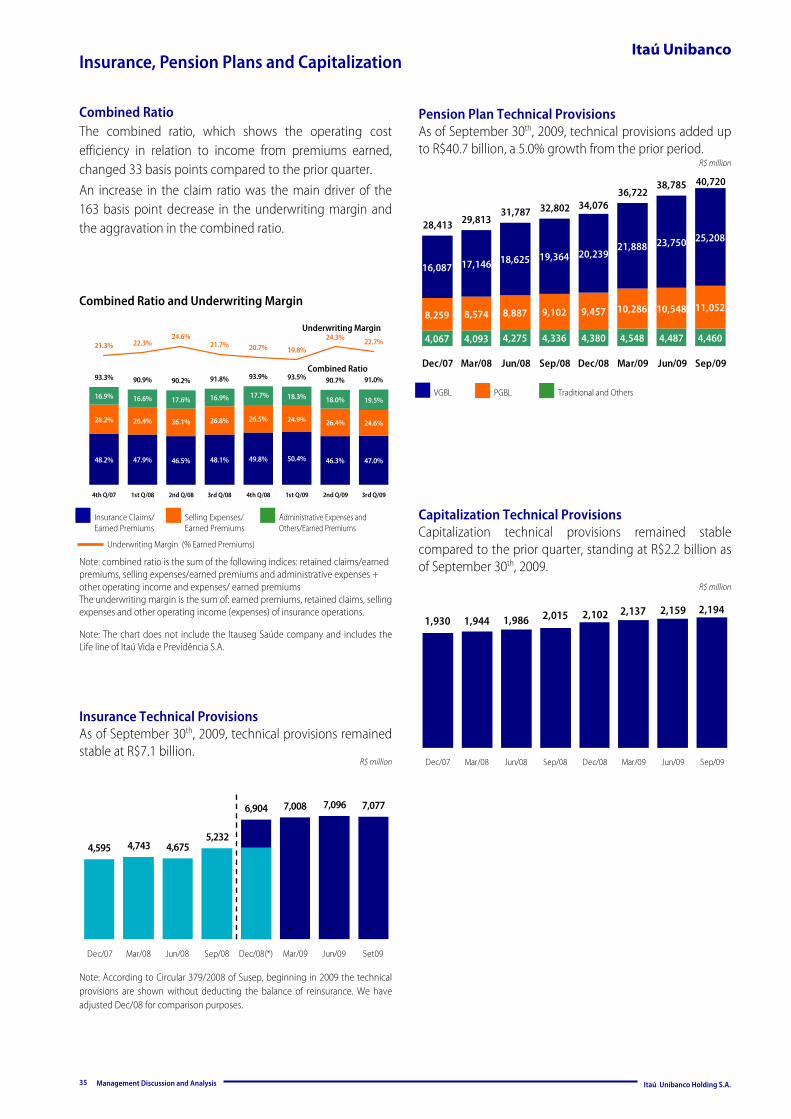
Insurance, Pension Plans and Capitalization
Management Discussion and Analysis Itaú Unibanco Holding S.A.
Itaú Unibanco
R$ million
Traditional and Others PGBL VGBL
R$ million
35
R$ million
Combined Ratio and Underwriting Margin
Note: The chart does not include the Itauseg Saúde company and includes the Life line of Itaú Vida e Previdência S.A.
Insurance Claims/ Earned Premiums
Administrative Expenses and Others/Earned Premiums
Selling Expenses/ Earned Premiums
Underwriting Margin (% Earned Premiums)
Combined Ratio The combined ratio, which shows the operating cost efficiency in relation to income from premiums earned, changed 33 basis points compared to the prior quarter. An increase in the claim ratio was the main driver of the 163 basis point decrease in the underwriting margin and the aggravation in the combined ratio.
Insurance Technical Provisions As of September 30th, 2009, technical provisions remained stable at R$7.1 billion.
Pension Plan Technical Provisions As of September 30th, 2009, technical provisions added up to R$40.7 billion, a 5.0% growth from the prior period.
Capitalization Technical Provisions Capitalization technical provisions remained stable compared to the prior quarter, standing at R$2.2 billion as of September 30th, 2009. Note: combined ratio is the sum of the following indices: retained claims/earned
premiums, selling expenses/earned premiums and administrative expenses + other operating income and expenses/ earned premiums The underwriting margin is the sum of: earned premiums, retained claims, selling expenses and other operating income (expenses) of insurance operations.
Underwriting Margin
Combined Ratio
Note: According to Circular 379/2008 of Susep, beginning in 2009 the technical provisions are shown without deducting the balance of reinsurance. We have adjusted Dec/08 for comparison purposes.
4,067 4,093 4,275 4,336 4,380 4,548 4,487 4,460
8,259 8,574 8,887 9,102 9,457 10,286 10,548 11,052
18,625 19,364 20,23921,888 23,750 25,208
17,14616,087
28,413 29,81331,787 32,802
36,72238,785 40,720
34,076
Dec/07 Mar/08 Jun/08 Sep/08 Dec/08 Mar/09 Jun/09 Sep/09
2,1942,1592,1022,0151,9861,9441,9302,137
Dec/07 Mar/08 Jun/08 Sep/08 Dec/08 Mar/09 Jun/09 Sep/09
6,904 7,008 7,096 7,077
4,595 4,743 4,6755,232
- - -
Dec/07 Mar/08 Jun/08 Sep/08 Dec/08(*) Mar/09 Jun/09 Set09
48.2% 47.9% 46.5% 48.1% 49.8% 50.4% 46.3% 47.0%
28.2% 26.4% 26.8% 26.5% 24.9% 24.6%
16.6% 17.6% 16.9% 18.0% 19.5%
26.4%26.1%
18.3%17.7%16.9%
93.3% 90.9% 90.2% 91.8% 93.9% 93.5% 90.7% 91.0%
21.3% 22.3%24.6%
21.7% 20.7% 19.8%
24.3% 22.7%
4th Q/07 1st Q/08 2nd Q/08 3rd Q/08 4th Q/08 1st Q/09 2nd Q/09 3rd Q/09
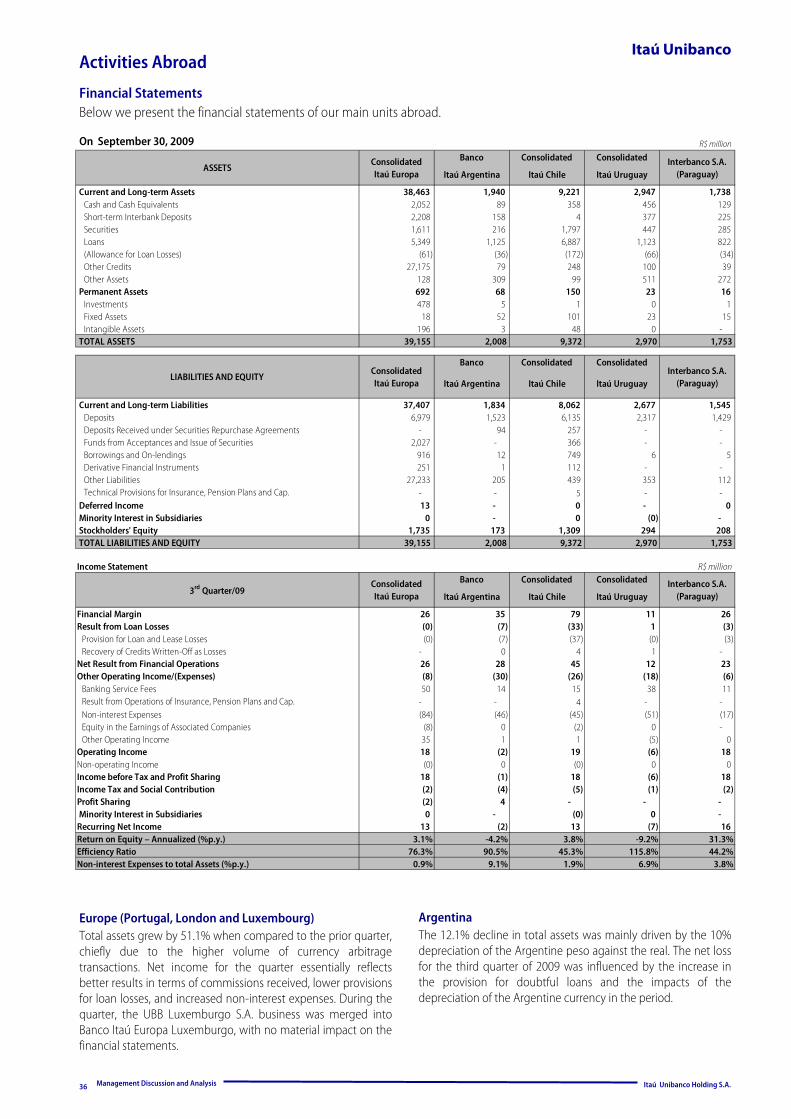
Activities Abroad
Management Discussion and Analysis Itaú Unibanco Holding S.A.
Itaú Unibanco
Financial Statements Below we present the financial statements of our main units abroad.
36
On September 30, 2009 R$ million
Europe (Portugal, London and Luxembourg) Total assets grew by 51.1% when compared to the prior quarter, chiefly due to the higher volume of currency arbitrage transactions. Net income for the quarter essentially reflects better results in terms of commissions received, lower provisions for loan losses, and increased non-interest expenses. During the quarter, the UBB Luxemburgo S.A. business was merged into Banco Itaú Europa Luxemburgo, with no material impact on the financial statements.
Argentina The 12.1% decline in total assets was mainly driven by the 10% depreciation of the Argentine peso against the real. The net loss for the third quarter of 2009 was influenced by the increase in the provision for doubtful loans and the impacts of the depreciation of the Argentine currency in the period.
Banco Consolidated Consolidated
Itaú Argentina Itaú Chile Itaú Uruguay
Current and Long-term Assets 38,463 1,940 9,221 2,947 1,738 Cash and Cash Equivalents 2,052 89 358 456 129 Short-term Interbank Deposits 2,208 158 4 377 225 Securities 1,611 216 1,797 447 285 Loans 5,349 1,125 6,887 1,123 822 (Allowance for Loan Losses) (61) (36) (172) (66) (34) Other Credits 27,175 79 248 100 39 Other Assets 128 309 99 511 272
Permanent Assets 692 68 150 23 16 Investments 478 5 1 0 1 Fixed Assets 18 52 101 23 15 Intangible Assets 196 3 48 0 -
TOTAL ASSETS 39,155 2,008 9,372 2,970 1,753
Banco Consolidated Consolidated
Itaú Argentina Itaú Chile Itaú Uruguay
Current and Long-term Liabilities 37,407 1,834 8,062 2,677 1,545 Deposits 6,979 1,523 6,135 2,317 1,429 Deposits Received under Securities Repurchase Agreements - 94 257 - - Funds from Acceptances and Issue of Securities 2,027 - 366 - - Borrowings and On-lendings 916 12 749 6 5 Derivative Financial Instruments 251 1 112 - - Other Liabilities 27,233 205 439 353 112 Technical Provisions for Insurance, Pension Plans and Cap. - - 5 - -
Deferred Income 13 - 0 - 0 Minority Interest in Subsidiaries 0 - 0 (0) - Stockholders' Equity 1,735 173 1,309 294 208 TOTAL LIABILITIES AND EQUITY 39,155 2,008 9,372 2,970 1,753
Income Statement R$ millionBanco Consolidated Consolidated
Itaú Argentina Itaú Chile Itaú Uruguay
Financial Margin 26 35 79 11 26 Result from Loan Losses (0) (7) (33) 1 (3)
Provision for Loan and Lease Losses (0) (7) (37) (0) (3) Recovery of Credits Written-Off as Losses - 0 4 1 -
Net Result from Financial Operations 26 28 45 12 23 Other Operating Income/(Expenses) (8) (30) (26) (18) (6)
Banking Service Fees 50 14 15 38 11 Result from Operations of Insurance, Pension Plans and Cap. - - 4 - - Non-interest Expenses (84) (46) (45) (51) (17) Equity in the Earnings of Associated Companies (8) 0 (2) 0 - Other Operating Income 35 1 1 (5) 0
Operating Income 18 (2) 19 (6) 18 Non-operating Income (0) 0 (0) 0 0 Income before Tax and Profit Sharing 18 (1) 18 (6) 18 Income Tax and Social Contribution (2) (4) (5) (1) (2) Profit Sharing (2) 4 - - - Minority Interest in Subsidiaries 0 - (0) 0 - Recurring Net Income 13 (2) 13 (7) 16 Return on Equity – Annualized (%p.y.) 3.1% -4.2% 3.8% -9.2% 31.3%Efficiency Ratio 76.3% 90.5% 45.3% 115.8% 44.2%Non-interest Expenses to total Assets (%p.y.) 0.9% 9.1% 1.9% 6.9% 3.8%
Interbanco S.A. (Paraguay)
Interbanco S.A. (Paraguay)
Interbanco S.A. (Paraguay)3rd Quarter/09
ASSETS
LIABILITIES AND EQUITY
ConsolidatedItaú Europa
ConsolidatedItaú Europa
ConsolidatedItaú Europa
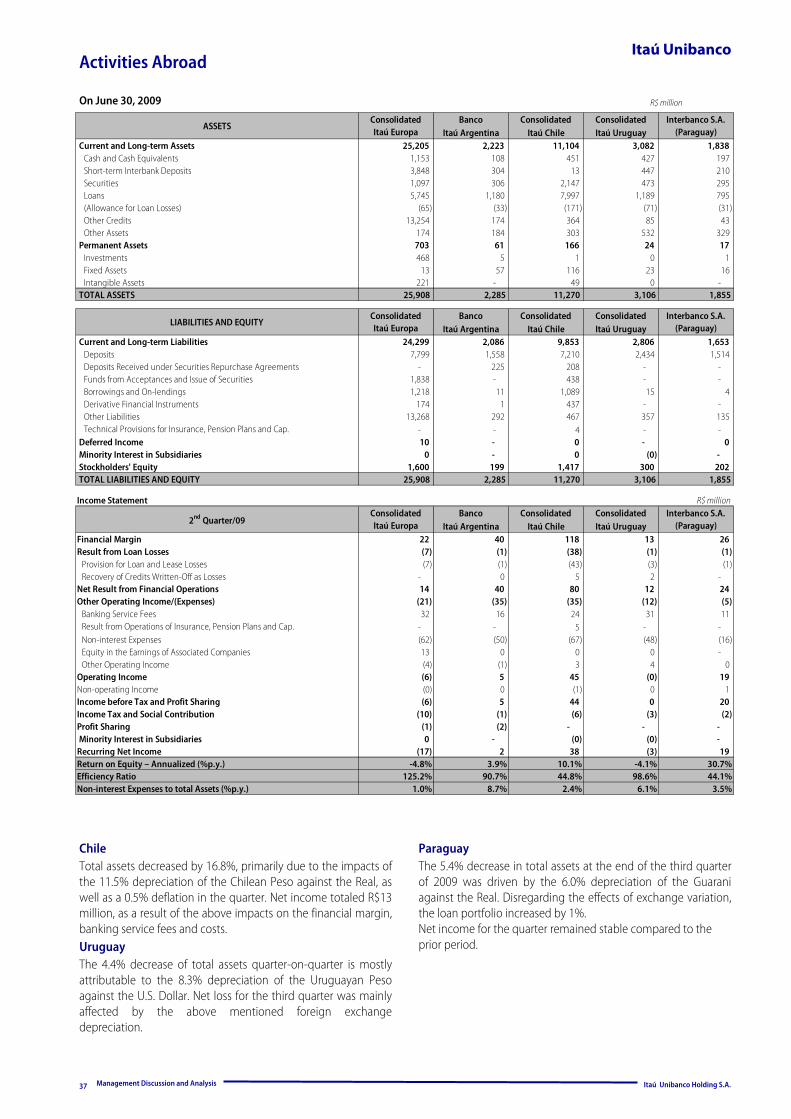
Activities Abroad
Management Discussion and Analysis Itaú Unibanco Holding S.A.
Itaú Unibanco
37
On June 30, 2009 R$ million
Chile Total assets decreased by 16.8%, primarily due to the impacts of the 11.5% depreciation of the Chilean Peso against the Real, as well as a 0.5% deflation in the quarter. Net income totaled R$13 million, as a result of the above impacts on the financial margin, banking service fees and costs. Uruguay The 4.4% decrease of total assets quarter-on-quarter is mostly attributable to the 8.3% depreciation of the Uruguayan Peso against the U.S. Dollar. Net loss for the third quarter was mainly affected by the above mentioned foreign exchange depreciation.
Paraguay The 5.4% decrease in total assets at the end of the third quarter of 2009 was driven by the 6.0% depreciation of the Guarani against the Real. Disregarding the effects of exchange variation, the loan portfolio increased by 1%. Net income for the quarter remained stable compared to the prior period.
Banco Consolidated ConsolidatedItaú Argentina Itaú Chile Itaú Uruguay
Current and Long-term Assets 25,205 2,223 11,104 3,082 1,838 Cash and Cash Equivalents 1,153 108 451 427 197 Short-term Interbank Deposits 3,848 304 13 447 210 Securities 1,097 306 2,147 473 295 Loans 5,745 1,180 7,997 1,189 795 (Allowance for Loan Losses) (65) (33) (171) (71) (31) Other Credits 13,254 174 364 85 43 Other Assets 174 184 303 532 329
Permanent Assets 703 61 166 24 17 Investments 468 5 1 0 1 Fixed Assets 13 57 116 23 16 Intangible Assets 221 - 49 0 -
TOTAL ASSETS 25,908 2,285 11,270 3,106 1,855
Banco Consolidated ConsolidatedItaú Argentina Itaú Chile Itaú Uruguay
Current and Long-term Liabilities 24,299 2,086 9,853 2,806 1,653 Deposits 7,799 1,558 7,210 2,434 1,514 Deposits Received under Securities Repurchase Agreements - 225 208 - - Funds from Acceptances and Issue of Securities 1,838 - 438 - - Borrowings and On-lendings 1,218 11 1,089 15 4 Derivative Financial Instruments 174 1 437 - - Other Liabilities 13,268 292 467 357 135 Technical Provisions for Insurance, Pension Plans and Cap. - - 4 - -
Deferred Income 10 - 0 - 0 Minority Interest in Subsidiaries 0 - 0 (0) - Stockholders' Equity 1,600 199 1,417 300 202 TOTAL LIABILITIES AND EQUITY 25,908 2,285 11,270 3,106 1,855
Income Statement R$ millionBanco Consolidated Consolidated
Itaú Argentina Itaú Chile Itaú UruguayFinancial Margin 22 40 118 13 26 Result from Loan Losses (7) (1) (38) (1) (1)
Provision for Loan and Lease Losses (7) (1) (43) (3) (1) Recovery of Credits Written-Off as Losses - 0 5 2 -
Net Result from Financial Operations 14 40 80 12 24 Other Operating Income/(Expenses) (21) (35) (35) (12) (5)
Banking Service Fees 32 16 24 31 11 Result from Operations of Insurance, Pension Plans and Cap. - - 5 - - Non-interest Expenses (62) (50) (67) (48) (16) Equity in the Earnings of Associated Companies 13 0 0 0 - Other Operating Income (4) (1) 3 4 0
Operating Income (6) 5 45 (0) 19 Non-operating Income (0) 0 (1) 0 1 Income before Tax and Profit Sharing (6) 5 44 0 20 Income Tax and Social Contribution (10) (1) (6) (3) (2) Profit Sharing (1) (2) - - - Minority Interest in Subsidiaries 0 - (0) (0) - Recurring Net Income (17) 2 38 (3) 19 Return on Equity – Annualized (%p.y.) -4.8% 3.9% 10.1% -4.1% 30.7%Efficiency Ratio 125.2% 90.7% 44.8% 98.6% 44.1%Non-interest Expenses to total Assets (%p.y.) 1.0% 8.7% 2.4% 6.1% 3.5%
Interbanco S.A. (Paraguay)
Interbanco S.A. (Paraguay)
Interbanco S.A. (Paraguay)
ConsolidatedItaú Europa
ConsolidatedItaú Europa
2nd Quarter/09ConsolidatedItaú Europa
ASSETS
LIABILITIES AND EQUITY

PricewaterhouseCoopers Av. Francisco Matarazzo, 1700 Torre Torino Caixa Postal 61005 05001-400 São Paulo, SP - Brasil
Report of Independent Auditors on Supplementary Information To the Board of Directors and Stockholders Itaú Unibanco Holding S.A. (formerly Itaú Unibanco Banco Múltiplo S.A.) 1 In connection with our limited reviews of the financial statements of Itaú Unibanco Holding S.A. (Bank) and Itaú Unibanco Holding S.A. and its subsidiary companies (consolidated) as of the September 30, 2009 and 2008 for the nine-month periods then ended, on which we issued a report without exceptions dated October 30, 2009, we performed a review of the supplementary information included in the Management Discussion and Analysis Report on the Consolidated Operations of Itaú Unibanco Holding S.A. and its subsidiary companies for the third quarter of 2009. 2 Our work was performed in accordance with specific rules set forth by the Institute of Independent Auditors of Brazil (IBRACON), in conjunction with the Federal Accountancy Council, for the purpose of reviewing the accounting information contained in the supplementary information of the Management Discussion and Analysis Report on the Consolidated Operations of Itaú Unibanco Holding S.A. and its subsidiary companies, and mainly comprised: (a) inquiry of, and discussion with, management responsible for the accounting, financial and operational areas of the Bank with regard to the main criteria adopted for the preparation of the accounting information presented in the supplementary information and (b) review of the significant information and of the subsequent events which have, or could have, significant effects on the financial position and the operations of the Bank and its subsidiaries. The supplementary information included in the Management Discussion and Analysis Report on the Consolidated Operations is presented to permit additional analysis. Notwithstanding, this information should not be considered an integral part of the financial statements. 3 On the basis of our review, we are not aware of any material modifications that should be made to the accounting information contained in this supplementary information, in order for it to be adequately presented, in all material respects, in relation to the financial statements at September 30, 2009 and for the nine-month period then ended, taken as a whole. São Paulo, October 30, 2009
PricewaterhouseCoopers Auditores Independentes CRC 2SP000160/O-5
Paulo Sergio Miron Contador CRC 1SP173647/O-5


Itaú Unibanco Holding S.A.
Complete Financial Statements
September 30, 2009

MANAGEMENT REPORT – January to September 2009 To our Stockholders: We present the Management Report and the financial statements of Itaú Unibanco Holding S.A. (Itaú Unibanco) and its subsidiaries for the period from January to September 2009, in accordance with the regulations established by the Brazilian Corporate Law, the National Monetary Council (CMN), the Central Bank of Brazil (BACEN), the Brazilian Securities and Exchange Commission (CVM), the Superintendency of Private Insurance (SUSEP), and the National Council of Private Insurance (CNSP).
Significant events Itaú Unibanco celebrates its 85th anniversary The merger of Itaú and Unibanco, announced on November 3, 2008, is completing one year. Because of the legacy of both banks, we decided to celebrate 85 years, the earliest date of foundation among the banks that originated the company, as on September 27, 1924 the start-up of the bank section of Casa Moreira Salles in Poços de Caldas, State of Minas Gerais, was authorized; this bank section would later become Unibanco. The activities of Banco Central de Crédito, which later took the name Itaú, started its activities on January 2, 1945. International Advisory Board The International Advisory Board, chaired by Pedro Malan, was established with the main objective of contributing to the expansion of the Bank’s presence in the international finance community. Its ten members are important business and academic leaders from several countries, with significant and outstanding experience in the finance world: André Lara Resende, Carlos Ghosn, Jacob Frenkel, Marcel Telles, Pedro Aspe, Pedro Moreira Salles, Raghuram Rajan, Roberto Setubal and Woods Staton. Each year, they will hold semi-annual meetings, one in Brazil and one abroad. The first meeting was held in London, in the beginning of October 2009. Alliance with Porto Seguro On August 23, 2009 Itaú Unibanco and Porto Seguro entered into an alliance aimed at the unification of residence and automobile insurance operations. With this transaction, millions of customers of Porto Seguro and Itaú Unibanco now count on the most complete offer in the Brazilian insurance market, especially an extensive network of insurance brokers who will be able to offer a wide range or products and services through the several companies that became part of the group, thus raising their possibilities of choice. As a result of this alliance, the company will have greater financial soundness and will hold the leading position in the residence and automobile insurance segments, with 3.4 million vehicles and 1.2 million properties insured, strengthening our strategy towards leadership in most of the markets in which we operate. Additionally, the alliance will enable the achievement of economy of scale and synergy of costs, and will expand the geographic presence. For this purpose, an operational agreement was signed for the exclusive offer and distribution of residence and automobile insurance products to the customers of the Itaú Unibanco branch network in Brazil and Uruguay. All the assets and liabilities related to the current portfolio of residence and automobile insurance of Itaú Unibanco will be transferred to the new company, Itaú Unibanco Seguros de Automóvel e Residência S.A. This company will be managed by Porto Seguro and Itaú Unibanco’s executives and employees who work in these insurance segments will be allocated to the new company, increasing the expertise and quality in insurance management. In its turn, Porto Seguro will issue shares representing 30% of its new capital stock, which will be delivered to Itaú Unibanco. The completion of the alliance between Itaú Unibanco and Porto Seguro depends on the approval at the stockholders’ meeting and of the Brazilian Antitrust System (SBDC). On October 16, SUSEP granted prior authorization for the corporate acts related to this alliance.
I t a ú U n i b a n c o S . A . – - September 0
43
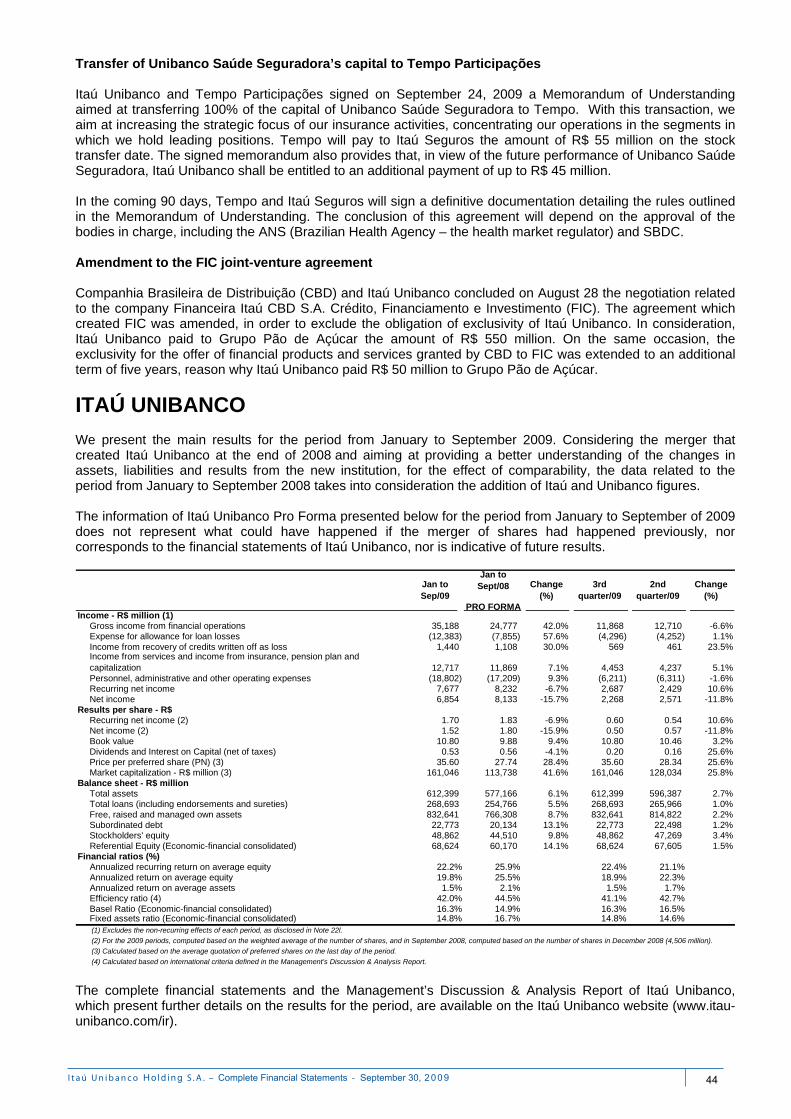
Transfer of Unibanco Saúde Seguradora’s capital to Tempo Participações Itaú Unibanco and Tempo Participações signed on September 24, 2009 a Memorandum of Understanding aimed at transferring 100% of the capital of Unibanco Saúde Seguradora to Tempo. With this transaction, we aim at increasing the strategic focus of our insurance activities, concentrating our operations in the segments in which we hold leading positions. Tempo will pay to Itaú Seguros the amount of R$ 55 million on the stock transfer date. The signed memorandum also provides that, in view of the future performance of Unibanco Saúde Seguradora, Itaú Unibanco shall be entitled to an additional payment of up to R$ 45 million. In the coming 90 days, Tempo and Itaú Seguros will sign a definitive documentation detailing the rules outlined in the Memorandum of Understanding. The conclusion of this agreement will depend on the approval of the bodies in charge, including the ANS (Brazilian Health Agency – the health market regulator) and SBDC. Amendment to the FIC joint-venture agreement Companhia Brasileira de Distribuição (CBD) and Itaú Unibanco concluded on August 28 the negotiation related to the company Financeira Itaú CBD S.A. Crédito, Financiamento e Investimento (FIC). The agreement which created FIC was amended, in order to exclude the obligation of exclusivity of Itaú Unibanco. In consideration, Itaú Unibanco paid to Grupo Pão de Açúcar the amount of R$ 550 million. On the same occasion, the exclusivity for the offer of financial products and services granted by CBD to FIC was extended to an additional term of five years, reason why Itaú Unibanco paid R$ 50 million to Grupo Pão de Açúcar.
ITAÚ UNIBANCO We present the main results for the period from January to September 2009. Considering the merger that created Itaú Unibanco at the end of 2008 and aiming at providing a better understanding of the changes in assets, liabilities and results from the new institution, for the effect of comparability, the data related to the period from January to September 2008 takes into consideration the addition of Itaú and Unibanco figures. The information of Itaú Unibanco Pro Forma presented below for the period from January to September of 2009 does not represent what could have happened if the merger of shares had happened previously, nor corresponds to the financial statements of Itaú Unibanco, nor is indicative of future results.
PRO FORMA
Gross income from financial operations 35,188 24,777 42.0% 11,868 12,710 -6.6%Expense for allowance for loan losses (12,383) (7,855) 57.6% (4,296) (4,252) 1.1%Income from recovery of credits written off as loss 1,440 1,108 30.0% 569 461 23.5%Income from services and income from insurance, pension plan and capitalization 12,717 11,869 7.1% 4,453 4,237 5.1%Personnel, administrative and other operating expenses (18,802) (17,209) 9.3% (6,211) (6,311) -1.6%Recurring net income 7,677 8,232 -6.7% 2,687 2,429 10.6%Net income 6,854 8,133 -15.7% 2,268 2,571 -11.8%
Recurring net income (2) 1.70 1.83 -6.9% 0.60 0.54 10.6%Net income (2) 1.52 1.80 -15.9% 0.50 0.57 -11.8%Book value 10.80 9.88 9.4% 10.80 10.46 3.2%Dividends and Interest on Capital (net of taxes) 0.53 0.56 -4.1% 0.20 0.16 25.6%Price per preferred share (PN) (3) 35.60 27.74 28.4% 35.60 28.34 25.6%Market capitalization - R$ million (3) 161,046 113,738 41.6% 161,046 128,034 25.8%
Total assets 612,399 577,166 6.1% 612,399 596,387 2.7%Total loans (including endorsements and sureties) 268,693 254,766 5.5% 268,693 265,966 1.0%Free, raised and managed own assets 832,641 766,308 8.7% 832,641 814,822 2.2%Subordinated debt 22,773 20,134 13.1% 22,773 22,498 1.2%Stockholders' equity 48,862 44,510 9.8% 48,862 47,269 3.4%Referential Equity (Economic-financial consolidated) 68,624 60,170 14.1% 68,624 67,605 1.5%
Annualized recurring return on average equity 22.2% 25.9% 22.4% 21.1%Annualized return on average equity 19.8% 25.5% 18.9% 22.3%Annualized return on average assets 1.5% 2.1% 1.5% 1.7%Efficiency ratio (4) 42.0% 44.5% 41.1% 42.7%Basel Ratio (Economic-financial consolidated) 16.3% 14.9% 16.3% 16.5%Fixed assets ratio (Economic-financial consolidated) 14.8% 16.7% 14.8% 14.6%
(4) Calculated based on international criteria defined in the Management's Discussion & Analysis Report.
3rd quarter/09
2nd quarter/09
Change (%)
Results per share - R$
Change (%)
Jan to Sept/08
Income - R$ million (1)
Jan to Sep/09
(3) Calculated based on the average quotation of preferred shares on the last day of the period.
(1) Excludes the non-recurring effects of each period, as disclosed in Note 22l.
Financial ratios (%)
Balance sheet - R$ million
(2) For the 2009 periods, computed based on the weighted average of the number of shares, and in September 2008, computed based on the number of shares in December 2008 (4,506 million).
The complete financial statements and the Management’s Discussion & Analysis Report of Itaú Unibanco, which present further details on the results for the period, are available on the Itaú Unibanco website (www.itau-unibanco.com/ir).
I t a ú U n i b a n c o S . A . – - September 0
44
Business performance The process of integration of Unibanco branches into Itaú’s platform started in August 2009. The pilot project involved four branches and one service center. We expect to complete this process until the end of 2010. In the third quarter, we offered to employees training aimed at integrating Itaú and Unibanco operations that was mainly focused on the following areas: Companies, Individuals, Wealth Management Services; Operational Risk and Efficiency, and Audit. A total of 3,705 employees participated and 65,590 training hours were provided. In the first nine months of 2009, the customers of Itaú Unibanco started to count on an even more intricate service structure all over the country, and with new options of easier access to credit and financial services, as a result of the unification and integration of the best in Itaú and Unibanco. Behind the expansion of the service structure, there are also deep changes in progress, with the adoption of the best management and business practices and the integration of talents from both institutions. The main indicators of Itaú Unibanco for this period are as follows. Consolidated assets totaled R$ 612,399 million at September 30, 2009, the highest among the financial private groups of Latin America. Net income for the first nine months of 2009 totaled R$ 6,854 million, with annualized return of 19.8% on average equity (25.5% for the same period of 2008). Recurring net income was R$ 7,677 million, with annualized return of 22.2%. Itaú Unibanco paid or provided for its own taxes and contributions for the period in the amount of R$ 11,456 million. The Bank also withheld and passed on taxes, which were directly levied on financial operations, in the amount of R$ 5,695 million. Consolidated stockholders’ equity totaled R$ 48,862 million at the end of September. The loan portfolio, including endorsements and sureties, reached R$ 268,693 million, an increase of 5.5% as compared to September 30, 2008. In Brazil, non-mandatory loans to the individuals segment reached R$ 98,383 million, a growth of 6.3% as compared to the same period of 2008. The large company segment, in its turn, reached R$ 90,299 million, whereas the very small, small and middle-market company segment reached R$ 56,709 million, an 18.1% increase as compared to September 2008. Free, raised and managed own assets totaled R$ 832,641 million, an increase of 8.7%. Basel ratio stood at 16.3% at the end of September, based on the economic-financial consolidated. Itaú Unibanco’s preferred shares rose 48.6%, as compared to the quotation of December 31, 2008. The market value at Stock Exchanges was R$ 161,046 million at the end of September, which ranked Itaú Unibanco 11th in the global bank ranking at September 30. In the credit card segment, Itaú Unibanco holds the leading position in terms of billing, thus reflecting the growth of both institutions in this market in the last years. With the union of the Itaucard, Unicard and Hipercard businesses, the individual credit card portfolio reached in Brazil R$ 25,215 million at the end of September. At September 30, the balance of the individual vehicle portfolio of Itaú Unibanco in Brazil reached R$ 50,670 million. In the real estate market, Itaú Unibanco’s loan portfolio totaled R$ 7,832 million. Insurance, pension plan and capitalization operations reached R$ 13,679 million in premiums earned in the period from January to September. Technical provisions for insurance, pension plan and capitalization totaled R$ 49,978 million at the end of September. Itaú Unibanco reached the landmark of R$ 40 billion in total pension plan reserves, taking into account the plans for individuals and companies. In the investment banking area, Itaú BBA took part in operations of debentures and promissory notes that totaled R$ 13.3 billion and of securitization that totaled R$ 780 million in the period from January to September 2009. These operations assured the leadership in the Anbid ranking regarding the distribution of fixed income in the period from January to September 2009. In capital markets, it coordinated public offerings of stocks that totaled R$ 5.3 billion. In the Anbid ranking regarding origination of variable income, it was ranked fourth in the period from January to September 2009, with a market share of 12.1%.
I t a ú U n i b a n c o S . A . – - September 0
45
People Itaú Unibanco among the best companies to work Itaú Unibanco is currently in the list of the best companies to work of the Great Place to Work Institute (in partnership with the Época magazine), with a satisfaction rate of 77%; and of FIA/USP (in partnership with the Exame/Você SA magazine), with a satisfaction rate of 78%. This achievement was obtained after these two survey institutes examined the response of approximately 4,000 employees. They responded to questions on aspects concerning the organizational climate, such as recognition, leadership and communication. These institutions have also evaluated the Human Resources practices and conducted interviews with groups of employees. In the work carried out by the Great Place to Work Institute, the bank stood out in items that evaluated companies which were considered the “Most Wanted” (ranked first), the “Companies that hire the most” (ranked second), and those who have “More women” in their staff (ranked 16th). At the end of September 2009, Itaú Unibanco employed approximately 103,000 employees. The employees’ fixed compensation plus charges and benefits totaled R$ 6,257 million in the period from January to September 2009. Additionally, approximately R$ 79 million were invested in education, training and development programs.
Ratings and awards In the third quarter of 2009, Itaú Unibanco's operations were recognized by renowned communication vehicles and institutions:
It was recognized by Euromoney magazine as the best bank in Brazil for the 11th time. The corporate and investment banking segment of Itaú BBA was chosen as the best investment bank in the Brazilian capital markets;
It was awarded as the best bank in investment fund management by the Guia Exame de Investimentos Pessoais;
It was awarded the Outstanding Private Bank – Latin American, granted by Private Banker International (PBI) magazine. This is the second consecutive time that Itaú Unibanco receives its award, considered the most important in the fortune management segment in the world;
Itaú Unibanco is the leader in its sector in Brazil and Latin America, as evaluated by the British magazine The Banker, considered a benchmark for financial managers in the whole world;
Itaú Unibanco was ranked first in the “The 40 largest banks of Latin America in sustainability” for the fifth consecutive time. The study is carried out by the consulting company Management & Excellence in partnership with the Latin Finance magazine;
Itaú Unibanco’s Chief Executive Officer, Mr. Roberto Setubal, was bestowed honor for being considered one of the most successful businessmen in 2009 by Banco Hoje magazine; and
The vice-president in charge of the Wealth Management Services area, Mr. Alfredo Setubal, was acknowledged as a distinguished administrator by the Regional Administration Council of São Paulo (CRA-SP).
Sustainability and corporate social responsibility For the tenth consecutive year, Itaú Unibanco was selected to be in the list comprising 317 companies of 26 countries that make up the Dow Jones Sustainability World Index (DJSI). Itaú Unibanco is the only financial institution in Latin America to be included in this index since it was created in 1999. Of the seven Brazilian companies selected for the 2009/2010 review, three are of the Group: Itaúsa, Itaú Unibanco, and Redecard. On September 28, 2009 the Fundo Itaú Índice de Carbono (carbon index fund), the first in the country linked to carbon credits index, was launched. Its return will be based on the Barclays Capital Global Carbon Index Excess Return Euro (BGCI), a world index that monitors the performance of carbon credits traded in the Emissions Trade Scheme (ETS) of the European Union and the Clean Development Mechanism (MDL). Itaú Unibanco and the MIT Sloan School of Management entered into a partnership to hold discussions on sustainability in Brazil and Latin America. The Bank will invest US$ 500,000 in the research and development of projects related to sustainability and in the organization of workshops at MIT and in Brazil. For the second consecutive year, Itaú Unibanco was conferred honor as “Leading Company” at the Prêmio Época de Mudanças Climáticas (Época climate changes award) ceremony, which acknowledges companies that take concrete actions against global warming. Social and cultural investments
I t a ú U n i b a n c o S . A . – - September 0
46
In the period from January to September 2009, social and cultural investments of Itaú Unibanco totaled R$ 129 million. In 2009, the Programa de Voluntários Itaú Unibanco (volunteers program) launched the Sábado Voluntário (volunteering Saturday) event, with the objective of showing appreciation and organizing employees who already work as volunteers as well as those who have never provided a social service in a context of a joint action. Additionally, a Semana Voluntária (volunteering week) was held in the CEIC, CAT, CTO, and CAU administrative centers, with the objective of encouraging volunteering by employees. Instituto Unibanco mobilized 35 thousand students, parents and teachers to carry out improvements in 42 schools in São Paulo. In 2009, in addition to the 48 schools already benefited in Belo Horizonte, Porto Alegre, and São Paulo, the amount of R$ 5.4 million was provided to improve the quality of education in 45 new public schools, thus benefiting 50 thousand students. Instituto Itaú Cultural carried out 314 events in Brazil and 101 in a number of countries between January and September 2009. The Institution was visited by 204 thousand people in the third quarter of the year and its website was accessed by an average of 825 thousand users per month. The institution distributed 27 thousand products, among books, catalogs, CDs, and DVDs. Itaú Cultural was chosen as one of the 100 best companies to work by the Great Place to Work Institute, which conducted the survey engaged by Época magazine. It is important to remember that Instituto Itaú Cultural undertake its activities in partnership with the Ministry of Culture through the Rouanet Law, according to which a portion of funds are provided as incentive.
Independent Auditors – CVM Instruction No. 381 . Procedures adopted by the Company The policy adopted by Itaú Unibanco, its subsidiaries and parent company, to engage non-audit related services from our independent auditors is based on the applicable regulations and internationally accepted principles that preserve the auditor’s independence. These principles include the following: (a) an auditor cannot audit his or her own work, (b) an auditor cannot function in the role of management in companies where he or she provides external audit services; and (c) an auditor cannot promote the interests of its client. During the period from January to September 2009, the independent auditors and related parties did not provide non-audit related services in excess of 5% of total external audit fees. According to CVM Instruction No. 381, we list below the engaged services and related dates: February 17, 2009 – Agreement for using an electronic library of international accounting standards –
(Comperio) - Itaú Unibanco – Brazil; and February 26, 2009 – Consulting and advisory services agreement in order to resolve specific issues involving
tax, accounting and corporate law – Itaú Unibanco S.A.– Brazil; and July 14, 2009 – Participation in the salary compensation survey named “Encuestas de remuneraciones y
Benefícios adicionales” (additional compensation and benefits surveys) – Oca S.A. Uruguay.
I t a ú U n i b a n c o S . A . – - September 0
47
. Summary of the Independent Auditors’ justification - PricewaterhouseCoopers The provision of the above described non-audit related professional services do not affect the independence or the objectivity of the external audit of Itaú Unibanco, parent and its subsidiary/affiliated companies. The policy adopted for providing non-audit related services to Itaú Unibanco is based on principles that preserve the independence of Independent Auditors, all of which were considered in the provision of the referred services.
Circular No. 3,068/01 of BACEN Itaú Unibanco hereby represents to have the financial capacity and the intention to hold to maturity securities classified under the line “held-to-maturity securities” in the balance sheet, in the amount of R$ 2,859 million, corresponding to only 2.3% of total securities held.
Acknowledgements We thank our employees for their efforts and skills which have been essential to reach consistent and differentiated results, and our stockholders and clients for the trust they put on us. (Approved at the Board of Directors' Meeting of October 30, 2009).
I t a ú U n i b a n c o S . A . – - September 0
48
ITAÚ UNIBANCO HOLDING S.A.
EXECUTIVE BOARDChairman Chief Executive Officer
PEDRO MOREIRA SALLES ROBERTO EGYDIO SETUBAL
Vice-Chairmen Executive Vice-PresidentsALFREDO EGYDIO ARRUDA VILLELA FILHO ALFREDO EGYDIO SETUBAL (*)ROBERTO EGYDIO SETUBAL CANDIDO BOTELHO BRACHER
Members Executive DirectorsALCIDES LOPES TÁPIAS ANTONIO CARLOS BARBOSA DE OLIVEIRAALFREDO EGYDIO SETUBAL CLAUDIA POLITANSKICANDIDO BOTELHO BRACHER MARCOS DE BARROS LISBOA FERNANDO ROBERTO MOREIRA SALLES RICARDO BALDINFRANCISCO EDUARDO DE ALMEIDA PINTO RODOLFO HENRIQUE FISCHERGUILLERMO ALEJANDRO CORTINA SÉRGIO RIBEIRO DA COSTA WERLANGGUSTAVO JORGE LABOISSIERE LOYOLA SILVIO APARECIDO DE CARVALHOHENRI PENCHASISRAEL VAINBOIM DirectorsPEDRO LUIZ BODIN DE MORAES CARLOS ELDER MACIEL DE AQUINORICARDO VILLELA MARINO JACKSON RICARDO GOMES
JOSÉ EDUARDO LIMA DE PAULA ARAUJOLUIZ FELIPE PINHEIRO DE ANDRADE
AUDIT COMMITTEE MARCO ANTONIO ANTUNESPresident WAGNER ROBERTO PUGLIESE
GUSTAVO JORGE LABOISSIERE LOYOLA
Members (*) Investor Relations OfficerALCIDES LOPES TÁPIASEDUARDO AUGUSTO DE ALMEIDA GUIMARÃESGUY ALMEIDA ANDRADETEREZA CRISTINA GROSSI TOGNI
FISCAL COUNCILPresident
IRAN SIQUEIRA LIMA
Members AccountantALBERTO SOZIN FURUGUEM JOSÉ MANUEL DA COSTA GOMESARTEMIO BERTHOLINI CRC - 1SP219892/O-0
BOARD OF DIRECTORS
I t a ú U n i b a n c o S . A . – - September 0
49
ITAÚ UNIBANCO S.A.
Chief Executive Officer and General Manager Directors (Continued)ROBERTO EGYDIO SETUBAL HELI DE ANDRADE
JACKSON RICARDO GOMESExecutive Vice-Presidents JASON PETER CRAUFORD (*)
ALFREDO EGYDIO SETUBAL JEAN MARTIN SIGRIST JÚNIORANTONIO CARLOS BARBOSA DE OLIVEIRA JOÃO ANTONIO DANTAS BEZERRA LEITEGERALDO JOSÉ CARBONE JORGE LUIZ VIEGAS RAMALHO (*)JOSÉ CASTRO ARAÚJO RUDGE LAVÍNIA MORAES DE ALMEIDA NOGUEIRA JUNQUERA (*)MÁRCIO DE ANDRADE SCHETTINI LEILA CRISTIANE BARBOZA BRAGA DE MELO (*)MARCO AMBROGIO CRESPI BONOMI LINDA AGARINAKAMURARODOLFO HENRIQUE FISCHER LUÍS ANTONIO RODRIGUESRUY VILLELA MORAES ABREU LUÍS EDUARDO GROSS SIQUEIRA CUNHASÉRGIO RIBEIRO DA COSTA WERLANG LUÍS OTÁVIO MATIAS
LUIS TADEU MANTOVANI SASSI (*)Executive Directors LUIZ ANTONIO FERNANDES CALDAS MORONE
ALEXANDRE DE BARROS LUIZ ANTONIO NOGUEIRA DE FRANÇACELSO SCARAMUZZA LUIZ EDUARDO LOUREIRO VELOSO (*)CLAUDIA POLITANSKI (*) LUIZ FELIPE PINHEIRO DE ANDRADE (*)DEMOSTHENES MADUREIRA DE PINHO NETO LUIZ FERNANDO OLIVEIRA BARRICHELOFERNANDO MARSELLA CHACON RUIZ LUIZ MARCELO ALVES DE MORAESIVO LUIZ DE SÁ FREIRE VIEITAS JUNIOR (*) MANOEL ANTONIO GRANADOJOÃO JACÓ HAZARABEDIAN MARCELO BOOCKJOSÉ ROBERTO HAYM (*) MARCELO HABICE DA MOTTAMARCOS DE BARROS LISBOA MARCELO LUIS ORTICELLI (*)OSVALDO DO NASCIMENTO MARCELO TONHAZOLO (*)RICARDO BALDIN (*) MARCELO VILLAÇA MACEDO CARVALHORICARDO VILLELA MARINO MARCO ANTONIO ANTUNESSILVIO APARECIDO DE CARVALHO MARCO ANTONIO SUDANO
MARCOS ANTÔNIO VAZ DE MAGALHÃES (*)Directors MARCOS AUGUSTO CAETANO DA SILVA FILHO (*)
ADRIANO BRITO DA COSTA LIMA MARCOS AURÉLIO REITANO ALMIR VIGNOTO MARCOS BRAGA DAINESI (*)ANDRÉ SAPOZNIK (*) MARCOS ROBERTO CARNIELLIANDRÉA MATTEUCCI PINOTTI CORDEIRO MARCOS SILVA MASSUKADO (*)ANTONIO CARLOS RICHECKI RIBEIRO MARCOS VANDERLEI BELINI FERREIRA (*)ANTONIO CARLOS AZZI JÚNIOR MAURÍCIO FERREIRA DE SOUZA (*)ANTONIO SIVALDI ROBERTI FILHO MÁXIMO HERNÁNDEZ GONZÁLEZARNALDO PEREIRA PINTO MIGUEL BURGOS NETOAURÉLIO JOSÉ DA SILVA PORTELLA NATALÍSIO DE ALMEIDA JÚNIORCARLOS ALBERTO BEZERRA DE MOURA (*) OLIVIO MORI JÚNIOR CARLOS AUGUSTO DE OLIVEIRA (*) OSMAR MARCHINICARLOS EDUARDO DE CASTRO (*) OSVALDO JOSÉ DAL FABBROCARLOS EDUARDO DE SOUZA LARA PAULO EIKIEVICIUS CORCHAKICARLOS EDUARDO MONICO PAULO MEIRELLES DE OLIVEIRA SANTOS (*)CARLOS HENRIQUE DONEGÁ AIDAR PAULO PIRES VAZ (**)CARLOS HENRIQUE ZANVETTOR (*) PEDRO PAULO DE ALMEIDA CARNEIRO CUNHA (*)CECÍLIA MARIA ARELLANO MISZPUTEN (*) PLÍNIO CARDOSO DA COSTA PATRÃO (*)CESAR PADOVAN RENÊ MARCELO GONÇALVES (*)CÍCERO MARCUS DE ARAÚJO RENATA HELENA DE OLIVEIRA TUBINICLÁUDIO CESAR SANCHES (*) RICARDO LIMA SOARESCLAUDIO CORACINI RICARDO ORLANDOCLAUDIO JOSÉ COUTINHO ARROMATTE (*) RICARDO RIBEIRO MANDACARU GUERRACOSMO FALCO RICARDO TERENZI NEUENSCHWANDERCRISTIANE MAGALHÃES TEIXEIRA PORTELLA ROBERTO LAMY (*)EDUARDO ALMEIDA PRADO ROBERT MACKELLAR RITCHIEELISABETE SZABO (*) ROGERIO CARVALHO BRAGA (*)ERNESTO ANTUNES DE CARVALHO ROGÉRIO PAULO CALDERÓN PERES (*)FABIO WHITAKER VIDIGAL ROMILDO GONÇALVES VALENTE (*)FERNANDO DELLA TORRE CHAGAS ROONEY SILVAFERNANDO JOSÉ COSTA TELES SANDRA NUNES DA CUNHA BOTEGUIMFLÁVIO AUGUSTO AGUIAR DE SOUZA SERGIO SOUZA FERNANDES JÚNIOR (*)GILBERTO TRAZZI CANTERAS (**)
(*) Elected at the E/ASM of 04/30/09 - Awaiting BACEN's approval.(**) Elected at the ESM of 09/30/09 - Awaiting BACEN's approval.
I t a ú U n i b a n c o S . A . – - September 0
50
BANCO ITAÚ BBA S.A.
BOARD OF DIRECTORS DirectorsADRIANO LIMA BORGES (**)
Chairman ALBERTO ZOFFMANN DO ESPÍRITO SANTOROBERTO EGYDIO SETUBAL ALEXANDRE ENRICO SILVA FIGLIOLINO
ANDRÉ FERRARI (*)Vice-Chairmen ANDRÉ LUIZ HELMEISTER
FERNÃO CARLOS BOTELHO BRACHER ANTONIO JOSÉ CALHEIROS RIBEIRO FERREIRAPEDRO MOREIRA SALLES (*) EDUARDO CARDOSO ARMONIA (*)
EDUARDO CORSETTI (*)Members ELAINE CRISTINA ZANATTA RODRIGUES VASQUINHO
ALFREDO EGYDIO SETUBAL EMERSON SAVI JUNQUEIRAANTONIO BELTRAN MARTINEZ FÁBIO DE SOUZA QUEIROZ FERRAZCANDIDO BOTELHO BRACHER FABIO MASSASHI OKUMURAEDUARDO MAZZILLI DE VASSIMON FERNANDO FONTES IUNESHENRI PENCHAS FRANCISCO DE ASSIS CREMAJOÃO DIONÍSIO FILGUEIRA BARRETO AMOÊDO GILBERTO FRUSSA SÉRGIO RIBEIRO DA COSTA WERLANG GUSTAVO HENRIQUE PENHA TAVARES
GUILHERME DE ALENCAR AMADO (*)EXECUTIVE BOARD ILAN GOLDFAJN (*)
JOÃO CARLOS DE GÊNOVAChief Executive Officer JOÃO MARCOS PEQUENO DE BIASE
CANDIDO BOTELHO BRACHER JOSÉ AUGUSTO DURANDJOSÉ IRINEU NUNES BRAGA
Managing Vice-Presidents LILIAN SALA PULZATTO KIEFERALBERTO FERNANDES LUÍS ALBERTO PIMENTA GARCIAANTONIO CARLOS BARBOSA DE OLIVEIRA LUIZ MARCELO ALVES DE MORAES (*)DANIEL LUIZ GLEIZER MARCELO MAZIEROJEAN-MARC ROBERT NOGUEIRA BAPTISTA ETLIN MARCO ANTONIO SUDANO (*)RODOLFO HENRIQUE FISCHER (*) MARIO ANTONIO BERTONCINI (*)
MÁRIO LÚCIO GURGEL PIRESExecutive Directors MÁRIO LUÍS BRUGNETTI
ALEXANDRE JADALLAH AOUDE MARIO LUIZ AMABILEANDRÉ EMILIO KOK NETO MILTON MALUHY FILHOANDRÉ LUIS TEIXEIRA RODRIGUES PASCHOAL PIPOLO BAPTISTACAIO IBRAHIM DAVID PAULO DE PAULA ABREUNICOLAU FERREIRA CHACUR (*) PAULO ROMAGNOLIPAOLO SERGIO PELLEGRINI PAULO PIRES VAZ (*)PAULO ROMAGNOLI PAULO ROBERTO SCHIAVON DE ANDRADE (*)
PEDRO REZENDE MARINHO NUNESRODRIGO PASTOR FACEIRO LIMA
(*) Elected at 04/30/2009 - Awaiting BACEN's approval.
(**) Elected at 08/03/2009 - Awaiting BACEN's approval.
BANCO ITAUCRED FINANCIAMENTOS S.A. ITAÚ SEGUROS S.A.
Chief Executive Officer Chief Executive OfficerMARCO AMBROGIO CRESPI BONOMI ROBERTO EGYDIO SETUBAL
Executive Vice-President Superintendent DirectorMÁRCIO DE ANDRADE SCHETTINI JOSÉ CASTRO ARAÚJO RUDGE
Directors Executive DirectorsADRIENNE PATRICE GUEDES DAIBERT ANDRÉ HORTA RUTOWITSCH CARLOS HENRIQUE ZANVETTOR ANTONIO EDUARDO MÁRQUEZ DE FIGUEIREDO TRINDADECLÁUDIO JOSÉ COUTINHO ARROMATTE NEY FERRAZ DIASEVANIR COUTINHO USSIERFERNANDO JOSÉ COSTA TELES Managing DirectorsFLÁVIO KITAHARA SOUSA LUIZ FERNANDO BUTORI REIS SANTOS (*)JACKSON RICARDO GOMES MARCO ANTONIO ANTUNESJASON PETER CRAUFORD MARCOS DE BARROS LISBOALUÍS FERNANDO STAUB MOACYR ROBERTO FARTO CASTANHOLUÍS OTÁVIO MATIAS NORBERTO GIL FERREIRA CAMARGO LUIZ FELIPE PINHEIRO DE ANDRADELUIZ HENRIQUE DIDIER JÚNIOR (*) Elected at 10/13/2009 - Awaiting SUSEP's approval.LUIZ OTAVIO PINHO DO AMARALMARCO ANTONIO ANTUNESMARCOS VANDERLEI BELINI FERREIRAROBERTO LAMYRODOLFO HENRIQUE FISCHER
I t a ú U n i b a n c o S . A . – - September 0
51
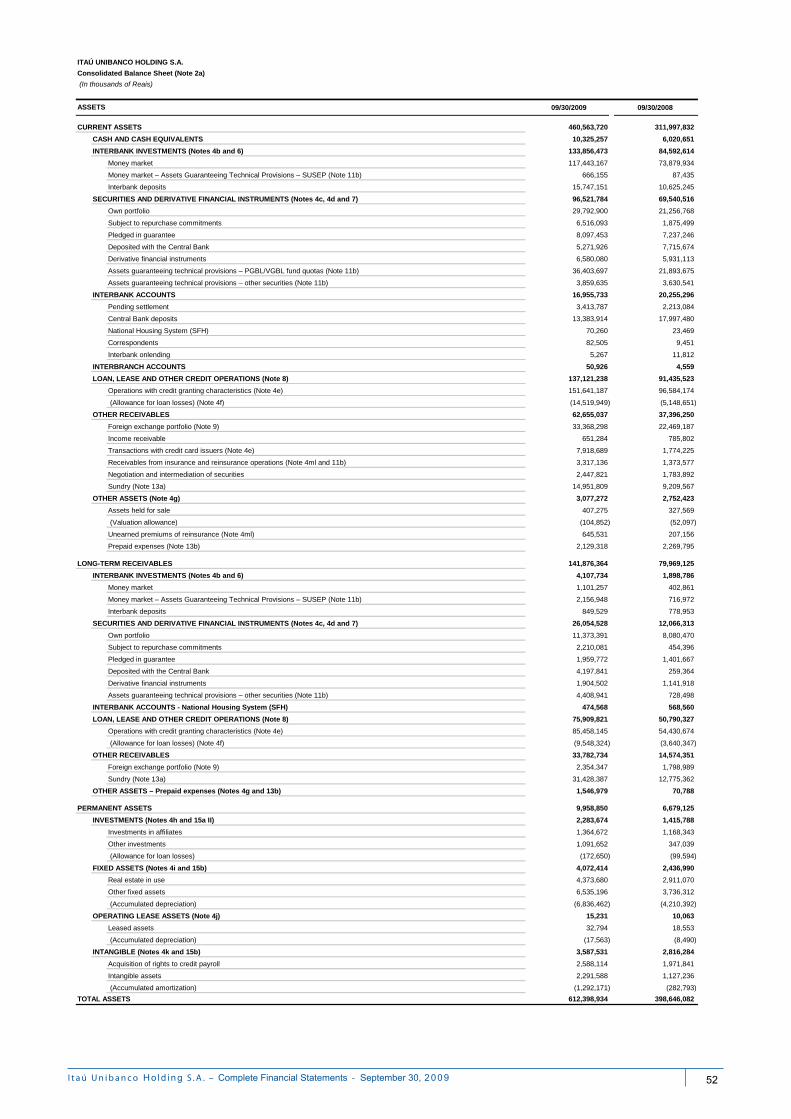
09/30/2009 09/30/2008
460,563,720 311,997,832
10,325,257 6,020,651
133,856,473 84,592,614
Money market 117,443,167 73,879,934
Money market – Assets Guaranteeing Technical Provisions – SUSEP (Note 11b) 666,155 87,435
Interbank deposits 15,747,151 10,625,245
96,521,784 69,540,516
Own portfolio 29,792,900 21,256,768
Subject to repurchase commitments 6,516,093 1,875,499
Pledged in guarantee 8,097,453 7,237,246
Deposited with the Central Bank 5,271,926 7,715,674
Derivative financial instruments 6,580,080 5,931,113
Assets guaranteeing technical provisions – PGBL/VGBL fund quotas (Note 11b) 36,403,697 21,893,675
Assets guaranteeing technical provisions – other securities (Note 11b) 3,859,635 3,630,541
16,955,733 20,255,296
Pending settlement 3,413,787 2,213,084
Central Bank deposits 13,383,914 17,997,480
National Housing System (SFH) 70,260 23,469
Correspondents 82,505 9,451
Interbank onlending 5,267 11,812
50,926 4,559
137,121,238 91,435,523
Operations with credit granting characteristics (Note 4e) 151,641,187 96,584,174
(Allowance for loan losses) (Note 4f) (14,519,949) (5,148,651)
62,655,037 37,396,250
Foreign exchange portfolio (Note 9) 33,368,298 22,469,187
Income receivable 651,284 785,802
Transactions with credit card issuers (Note 4e) 7,918,689 1,774,225
Receivables from insurance and reinsurance operations (Note 4ml and 11b) 3,317,136 1,373,577
Negotiation and intermediation of securities 2,447,821 1,783,892
Sundry (Note 13a) 14,951,809 9,209,567
3,077,272 2,752,423
Assets held for sale 407,275 327,569
(Valuation allowance) (104,852) (52,097)
Unearned premiums of reinsurance (Note 4ml) 645,531 207,156
Prepaid expenses (Note 13b) 2,129,318 2,269,795
141,876,364 79,969,125
4,107,734 1,898,786
Money market 1,101,257 402,861
Money market – Assets Guaranteeing Technical Provisions – SUSEP (Note 11b) 2,156,948 716,972
Interbank deposits 849,529 778,953
26,054,528 12,066,313
Own portfolio 11,373,391 8,080,470
Subject to repurchase commitments 2,210,081 454,396
Pledged in guarantee 1,959,772 1,401,667
Deposited with the Central Bank 4,197,841 259,364
Derivative financial instruments 1,904,502 1,141,918
Assets guaranteeing technical provisions – other securities (Note 11b) 4,408,941 728,498
474,568 568,560
75,909,821 50,790,327
Operations with credit granting characteristics (Note 4e) 85,458,145 54,430,674
(Allowance for loan losses) (Note 4f) (9,548,324) (3,640,347)
33,782,734 14,574,351
Foreign exchange portfolio (Note 9) 2,354,347 1,798,989
Sundry (Note 13a) 31,428,387 12,775,362
1,546,979 70,788
9,958,850 6,679,125
2,283,674 1,415,788
Investments in affiliates 1,364,672 1,168,343
Other investments 1,091,652 347,039
(Allowance for loan losses) (172,650) (99,594)
4,072,414 2,436,990
Real estate in use 4,373,680 2,911,070
Other fixed assets 6,535,196 3,736,312
(Accumulated depreciation) (6,836,462) (4,210,392)
15,231 10,063
Leased assets 32,794 18,553
(Accumulated depreciation) (17,563) (8,490)
3,587,531 2,816,284
Acquisition of rights to credit payroll 2,588,114 1,971,841
Intangible assets 2,291,588 1,127,236
(Accumulated amortization) (1,292,171) (282,793)
612,398,934 398,646,082
OTHER ASSETS (Note 4g)
INTERBANK ACCOUNTS
TOTAL ASSETS
LOAN, LEASE AND OTHER CREDIT OPERATIONS (Note 8)
OTHER RECEIVABLES
OTHER ASSETS – Prepaid expenses (Notes 4g and 13b)
INVESTMENTS (Notes 4h and 15a II)
FIXED ASSETS (Notes 4i and 15b)
PERMANENT ASSETS
OPERATING LEASE ASSETS (Note 4j)
CASH AND CASH EQUIVALENTS
CURRENT ASSETS
ASSETS
ITAÚ UNIBANCO HOLDING S.A.
Consolidated Balance Sheet (Note 2a)
(In thousands of Reais)
INTANGIBLE (Notes 4k and 15b)
INTERBANK INVESTMENTS (Notes 4b and 6)
INTERBRANCH ACCOUNTS
OTHER RECEIVABLES
LOAN, LEASE AND OTHER CREDIT OPERATIONS (Note 8)
SECURITIES AND DERIVATIVE FINANCIAL INSTRUMENTS (Notes 4c, 4d and 7)
LONG-TERM RECEIVABLES
INTERBANK INVESTMENTS (Notes 4b and 6)
SECURITIES AND DERIVATIVE FINANCIAL INSTRUMENTS (Notes 4c, 4d and 7)
INTERBANK ACCOUNTS - National Housing System (SFH)
I t a ú U n i b a n c o S . A . – - September 0
52
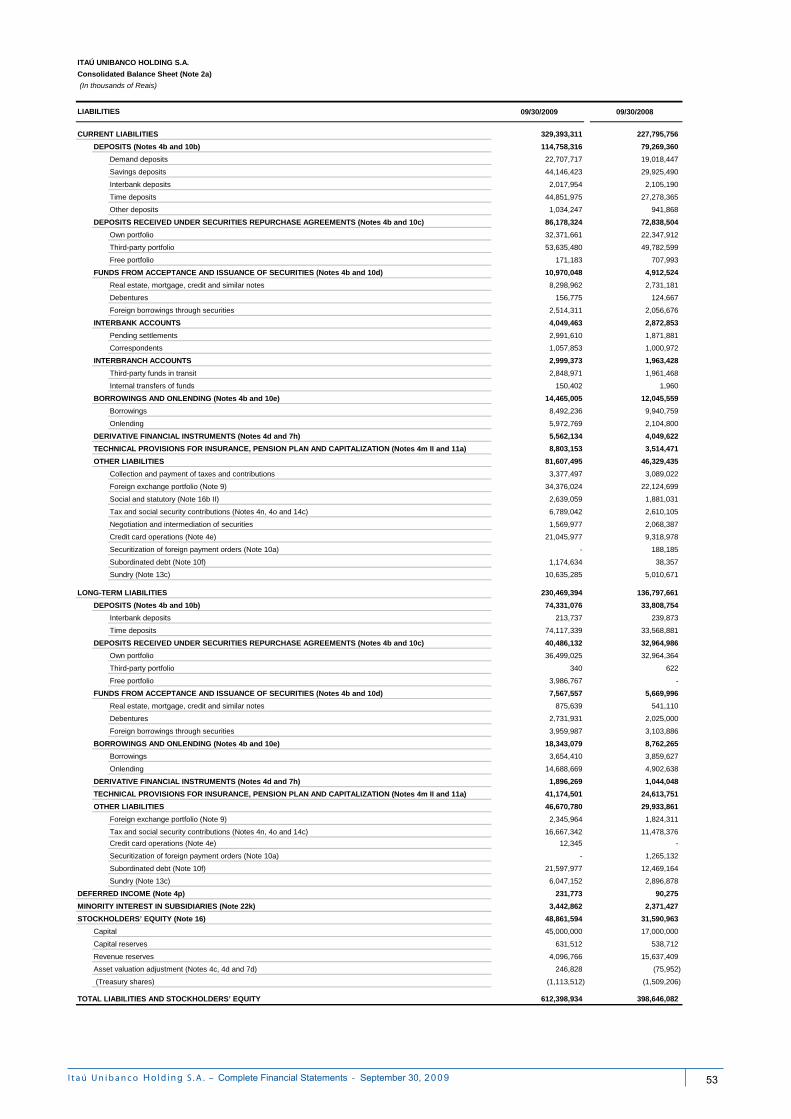
09/30/2009 09/30/2008
329,393,311 227,795,756
114,758,316 79,269,360
Demand deposits 22,707,717 19,018,447
Savings deposits 44,146,423 29,925,490
Interbank deposits 2,017,954 2,105,190
Time deposits 44,851,975 27,278,365
Other deposits 1,034,247 941,868
86,178,324 72,838,504
Own portfolio 32,371,661 22,347,912
Third-party portfolio 53,635,480 49,782,599
Free portfolio 171,183 707,993
10,970,048 4,912,524
Real estate, mortgage, credit and similar notes 8,298,962 2,731,181
Debentures 156,775 124,667
Foreign borrowings through securities 2,514,311 2,056,676
4,049,463 2,872,853
Pending settlements 2,991,610 1,871,881
Correspondents 1,057,853 1,000,972
2,999,373 1,963,428
Third-party funds in transit 2,848,971 1,961,468
Internal transfers of funds 150,402 1,960
14,465,005 12,045,559
Borrowings 8,492,236 9,940,759
Onlending 5,972,769 2,104,800
5,562,134 4,049,622
8,803,153 3,514,471
81,607,495 46,329,435
Collection and payment of taxes and contributions 3,377,497 3,089,022
Foreign exchange portfolio (Note 9) 34,376,024 22,124,699
Social and statutory (Note 16b II) 2,639,059 1,881,031
Tax and social security contributions (Notes 4n, 4o and 14c) 6,789,042 2,610,105
Negotiation and intermediation of securities 1,569,977 2,068,387
Credit card operations (Note 4e) 21,045,977 9,318,978
Securitization of foreign payment orders (Note 10a) - 188,185
Subordinated debt (Note 10f) 1,174,634 38,357
Sundry (Note 13c) 10,635,285 5,010,671
230,469,394 136,797,661
74,331,076 33,808,754
Interbank deposits 213,737 239,873
Time deposits 74,117,339 33,568,881
40,486,132 32,964,986
Own portfolio 36,499,025 32,964,364
Third-party portfolio 340 622
Free portfolio 3,986,767 -
7,567,557 5,669,996
Real estate, mortgage, credit and similar notes 875,639 541,110
Debentures 2,731,931 2,025,000
Foreign borrowings through securities 3,959,987 3,103,886
18,343,079 8,762,265
Borrowings 3,654,410 3,859,627
Onlending 14,688,669 4,902,638
1,896,269 1,044,048
41,174,501 24,613,751
46,670,780 29,933,861
Foreign exchange portfolio (Note 9) 2,345,964 1,824,311
Tax and social security contributions (Notes 4n, 4o and 14c) 16,667,342 11,478,376
Credit card operations (Note 4e) 12,345 -
Securitization of foreign payment orders (Note 10a) - 1,265,132
Subordinated debt (Note 10f) 21,597,977 12,469,164
Sundry (Note 13c) 6,047,152 2,896,878
231,773 90,275
3,442,862 2,371,427
48,861,594 31,590,963
45,000,000 17,000,000
631,512 538,712
4,096,766 15,637,409
246,828 (75,952)
(1,113,512) (1,509,206)
612,398,934 398,646,082
DEPOSITS (Notes 4b and 10b)
CURRENT LIABILITIES
LIABILITIES
DEPOSITS RECEIVED UNDER SECURITIES REPURCHASE AGREEMENTS (Notes 4b and 10c)
FUNDS FROM ACCEPTANCE AND ISSUANCE OF SECURITIES (Notes 4b and 10d)
INTERBANK ACCOUNTS
INTERBRANCH ACCOUNTS
BORROWINGS AND ONLENDING (Notes 4b and 10e)
ITAÚ UNIBANCO HOLDING S.A.
Consolidated Balance Sheet (Note 2a)
(In thousands of Reais)
Capital reserves
Revenue reserves
DEPOSITS (Notes 4b and 10b)
DEPOSITS RECEIVED UNDER SECURITIES REPURCHASE AGREEMENTS (Notes 4b and 10c)
FUNDS FROM ACCEPTANCE AND ISSUANCE OF SECURITIES (Notes 4b and 10d)
STOCKHOLDERS’ EQUITY (Note 16)
MINORITY INTEREST IN SUBSIDIARIES (Note 22k)
BORROWINGS AND ONLENDING (Notes 4b and 10e)
TECHNICAL PROVISIONS FOR INSURANCE, PENSION PLAN AND CAPITALIZATION (Notes 4m II and 11a)
DEFERRED INCOME (Note 4p)
(Treasury shares)
TOTAL LIABILITIES AND STOCKHOLDERS’ EQUITY
DERIVATIVE FINANCIAL INSTRUMENTS (Notes 4d and 7h)
TECHNICAL PROVISIONS FOR INSURANCE, PENSION PLAN AND CAPITALIZATION (Notes 4m II and 11a)
OTHER LIABILITIES
LONG-TERM LIABILITIES
DERIVATIVE FINANCIAL INSTRUMENTS (Notes 4d and 7h)
OTHER LIABILITIES
Capital
Asset valuation adjustment (Notes 4c, 4d and 7d)
I t a ú U n i b a n c o S . A . – - September 0
53
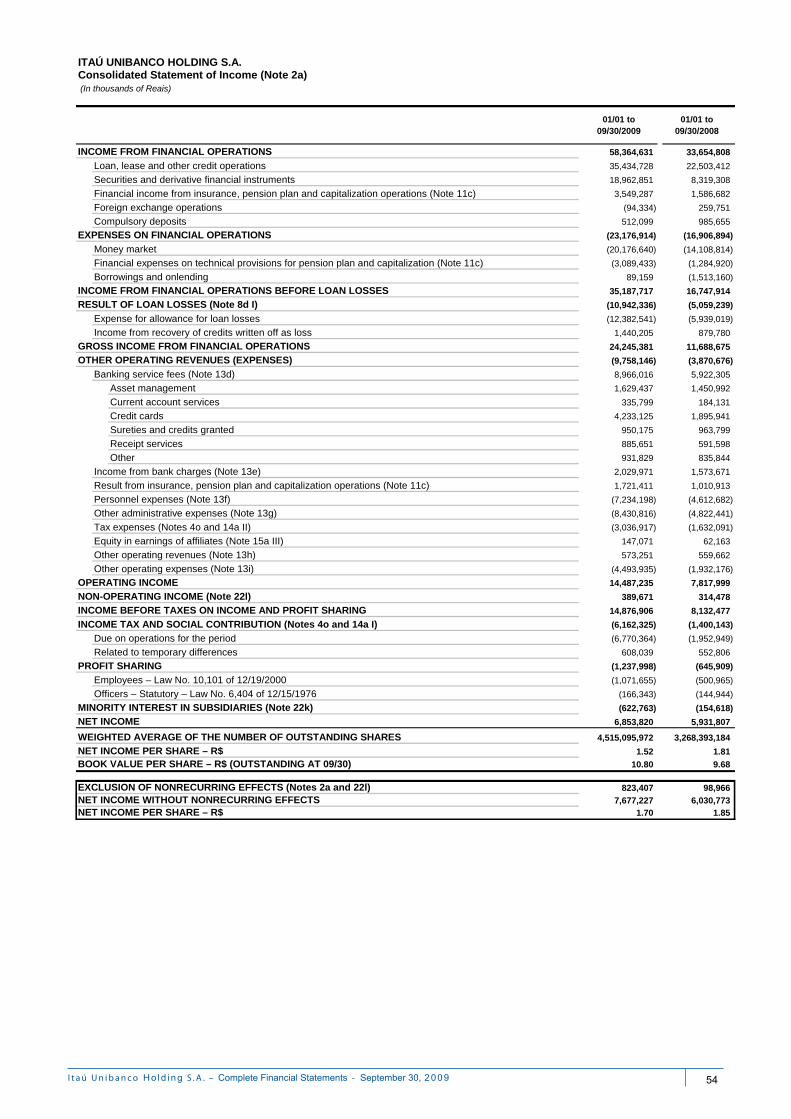
01/01 to 09/30/2009
01/01 to 09/30/2008
58,364,631 33,654,808
35,434,728 22,503,412
18,962,851 8,319,308
3,549,287 1,586,682
(94,334) 259,751
512,099 985,655
(23,176,914) (16,906,894)
(20,176,640) (14,108,814)
(3,089,433) (1,284,920)
89,159 (1,513,160)
35,187,717 16,747,914
(10,942,336) (5,059,239)
(12,382,541) (5,939,019)
1,440,205 879,780
24,245,381 11,688,675
(9,758,146) (3,870,676)
8,966,016 5,922,305
Asset management 1,629,437 1,450,992
Current account services 335,799 184,131
Credit cards 4,233,125 1,895,941
Sureties and credits granted 950,175 963,799
Receipt services 885,651 591,598
Other 931,829 835,844
2,029,971 1,573,671
1,721,411 1,010,913
(7,234,198) (4,612,682)
(8,430,816) (4,822,441)
(3,036,917) (1,632,091)
147,071 62,163
573,251 559,662
(4,493,935) (1,932,176)
14,487,235 7,817,999
389,671 314,478
14,876,906 8,132,477
INCOME TAX AND SOCIAL CONTRIBUTION (Notes 4o and 14a I) (6,162,325) (1,400,143)
(6,770,364) (1,952,949)
608,039 552,806
(1,237,998) (645,909)
(1,071,655) (500,965)
(166,343) (144,944)
(622,763) (154,618)
6,853,820 5,931,807
4,515,095,972 3,268,393,184
1.52 1.81
10.80 9.68
823,407 98,966
7,677,227 6,030,773
1.70 1.85
Borrowings and onlendingINCOME FROM FINANCIAL OPERATIONS BEFORE LOAN LOSSES
RESULT OF LOAN LOSSES (Note 8d I)
EXCLUSION OF NONRECURRING EFFECTS (Notes 2a and 22l)
Result from insurance, pension plan and capitalization operations (Note 11c)
NET INCOME PER SHARE – R$BOOK VALUE PER SHARE – R$ (OUTSTANDING AT 09/30)
NET INCOME
WEIGHTED AVERAGE OF THE NUMBER OF OUTSTANDING SHARES
MINORITY INTEREST IN SUBSIDIARIES (Note 22k)
Securities and derivative financial instruments
Financial income from insurance, pension plan and capitalization operations (Note 11c)
Foreign exchange operations
Employees – Law No. 10,101 of 12/19/2000
INCOME BEFORE TAXES ON INCOME AND PROFIT SHARING
Compulsory deposits
Income from bank charges (Note 13e)
EXPENSES ON FINANCIAL OPERATIONS
Money market
Financial expenses on technical provisions for pension plan and capitalization (Note 11c)
ITAÚ UNIBANCO HOLDING S.A.Consolidated Statement of Income (Note 2a) (In thousands of Reais)
Loan, lease and other credit operations
INCOME FROM FINANCIAL OPERATIONS
NET INCOME PER SHARE – R$
Other administrative expenses (Note 13g)
Tax expenses (Notes 4o and 14a II)
Equity in earnings of affiliates (Note 15a III)
Other operating expenses (Note 13i)
OPERATING INCOME
NON-OPERATING INCOME (Note 22l)
Related to temporary differences
Officers – Statutory – Law No. 6,404 of 12/15/1976
NET INCOME WITHOUT NONRECURRING EFFECTS
Personnel expenses (Note 13f)
PROFIT SHARING
Other operating revenues (Note 13h)
Due on operations for the period
Expense for allowance for loan losses
OTHER OPERATING REVENUES (EXPENSES)
Banking service fees (Note 13d)
Income from recovery of credits written off as loss
GROSS INCOME FROM FINANCIAL OPERATIONS
I t a ú U n i b a n c o S . A . – - September 0
54
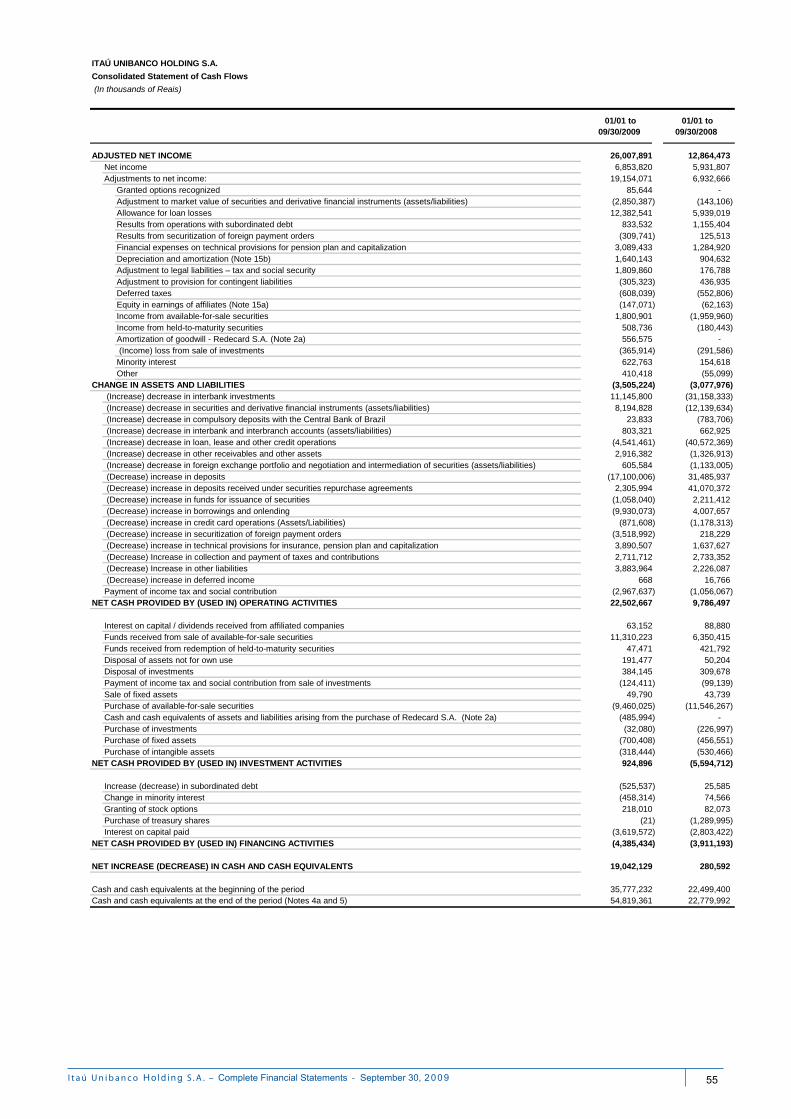
01/01 to 09/30/2009
01/01 to 09/30/2008
26,007,891 12,864,473 6,853,820 5,931,807
19,154,071 6,932,666Granted options recognized 85,644 -Adjustment to market value of securities and derivative financial instruments (assets/liabilities) (2,850,387) (143,106)Allowance for loan losses 12,382,541 5,939,019Results from operations with subordinated debt 833,532 1,155,404Results from securitization of foreign payment orders (309,741) 125,513Financial expenses on technical provisions for pension plan and capitalization 3,089,433 1,284,920Depreciation and amortization (Note 15b) 1,640,143 904,632Adjustment to legal liabilities – tax and social security 1,809,860 176,788Adjustment to provision for contingent liabilities (305,323) 436,935Deferred taxes (608,039) (552,806)Equity in earnings of affiliates (Note 15a) (147,071) (62,163)Income from available-for-sale securities 1,800,901 (1,959,960)Income from held-to-maturity securities 508,736 (180,443)Amortization of goodwill - Redecard S.A. (Note 2a) 556,575 - (Income) loss from sale of investments (365,914) (291,586)Minority interest 622,763 154,618Other 410,418 (55,099)
(3,505,224) (3,077,976) 11,145,800 (31,158,333)
8,194,828 (12,139,634) 23,833 (783,706)
803,321 662,925 (4,541,461) (40,572,369) 2,916,382 (1,326,913)
605,584 (1,133,005) (17,100,006) 31,485,937
2,305,994 41,070,372 (1,058,040) 2,211,412 (9,930,073) 4,007,657
(871,608) (1,178,313) (3,518,992) 218,229
(Decrease) increase in technical provisions for insurance, pension plan and capitalization 3,890,507 1,637,627 2,711,712 2,733,352 3,883,964 2,226,087
(Decrease) increase in deferred income 668 16,766 (2,967,637) (1,056,067) 22,502,667 9,786,497
Interest on capital / dividends received from affiliated companies 63,152 88,880Funds received from sale of available-for-sale securities 11,310,223 6,350,415Funds received from redemption of held-to-maturity securities 47,471 421,792Disposal of assets not for own use 191,477 50,204Disposal of investments 384,145 309,678
(124,411) (99,139)Sale of fixed assets 49,790 43,739Purchase of available-for-sale securities (9,460,025) (11,546,267)Cash and cash equivalents of assets and liabilities arising from the purchase of Redecard S.A. (Note 2a) (485,994) -Purchase of investments (32,080) (226,997)Purchase of fixed assets (700,408) (456,551)Purchase of intangible assets (318,444) (530,466)
924,896 (5,594,712)
Increase (decrease) in subordinated debt (525,537) 25,585Change in minority interest (458,314) 74,566Granting of stock options 218,010 82,073Purchase of treasury shares (21) (1,289,995)Interest on capital paid (3,619,572) (2,803,422)
NET CASH PROVIDED BY (USED IN) FINANCING ACTIVITIES (4,385,434) (3,911,193)
NET INCREASE (DECREASE) IN CASH AND CASH EQUIVALENTS 19,042,129 280,592
35,777,232 22,499,400 54,819,361 22,779,992Cash and cash equivalents at the end of the period (Notes 4a and 5)
Cash and cash equivalents at the beginning of the period
(Decrease) increase in securitization of foreign payment orders
Payment of income tax and social contribution
(Decrease) Increase in collection and payment of taxes and contributions
NET CASH PROVIDED BY (USED IN) OPERATING ACTIVITIES
Payment of income tax and social contribution from sale of investments
NET CASH PROVIDED BY (USED IN) INVESTMENT ACTIVITIES
(Decrease) increase in credit card operations (Assets/Liabilities)
(Increase) decrease in loan, lease and other credit operations
(Decrease) Increase in other liabilities
(Increase) decrease in other receivables and other assets
(Decrease) increase in borrowings and onlending
(Increase) decrease in foreign exchange portfolio and negotiation and intermediation of securities (assets/liabilities) (Decrease) increase in deposits (Decrease) increase in deposits received under securities repurchase agreements (Decrease) increase in funds for issuance of securities
ITAÚ UNIBANCO HOLDING S.A.
(In thousands of Reais)
Net incomeAdjustments to net income:
ADJUSTED NET INCOME
Consolidated Statement of Cash Flows
CHANGE IN ASSETS AND LIABILITIES
(Increase) decrease in securities and derivative financial instruments (assets/liabilities)
(Increase) decrease in interbank and interbranch accounts (assets/liabilities) (Increase) decrease in compulsory deposits with the Central Bank of Brazil
(Increase) decrease in interbank investments
I t a ú U n i b a n c o S . A . – - September 0
55
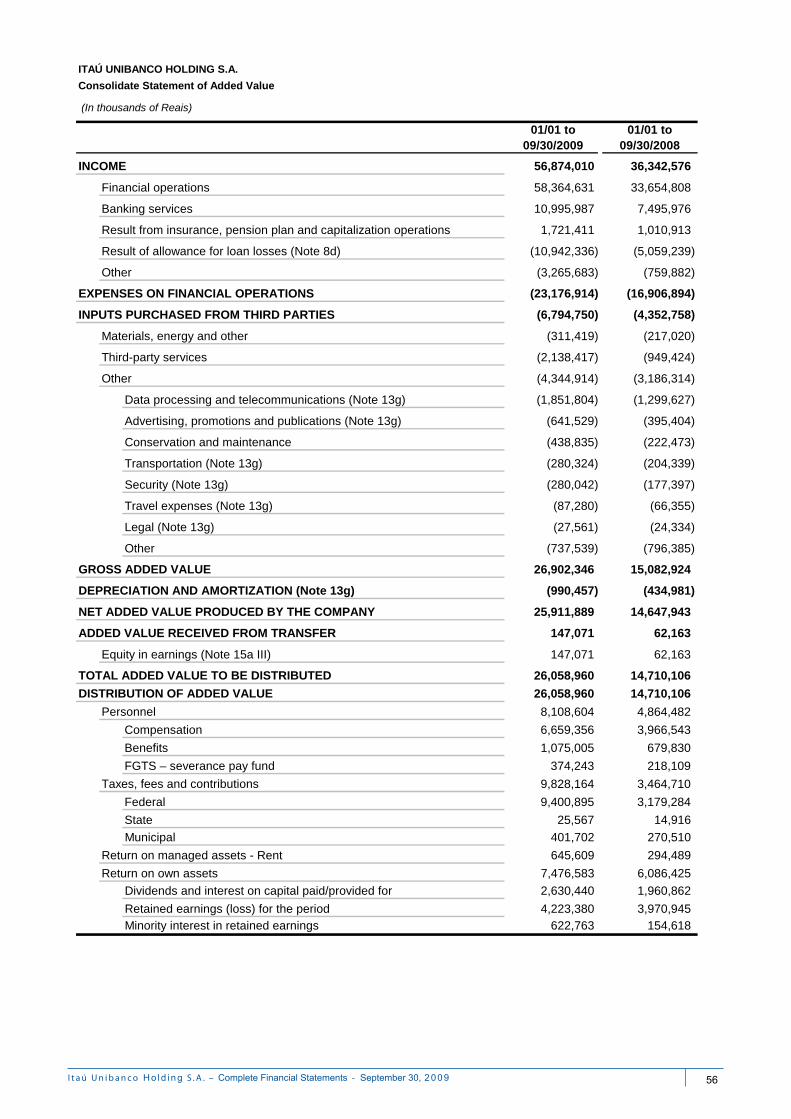
ITAÚ UNIBANCO HOLDING S.A.
Consolidate Statement of Added Value
(In thousands of Reais)
01/01 to 09/30/2009
01/01 to 09/30/2008
56,874,010 36,342,576
58,364,631 33,654,808
10,995,987 7,495,976
1,721,411 1,010,913
(10,942,336) (5,059,239)
(3,265,683) (759,882)
(23,176,914) (16,906,894)
(6,794,750) (4,352,758)
(311,419) (217,020)
(2,138,417) (949,424)
(4,344,914) (3,186,314)
Data processing and telecommunications (Note 13g) (1,851,804) (1,299,627)
Advertising, promotions and publications (Note 13g) (641,529) (395,404)
Conservation and maintenance (438,835) (222,473)
Transportation (Note 13g) (280,324) (204,339)
Security (Note 13g) (280,042) (177,397)
Travel expenses (Note 13g) (87,280) (66,355)
Legal (Note 13g) (27,561) (24,334)
Other (737,539) (796,385)
26,902,346 15,082,924
(990,457) (434,981)
25,911,889 14,647,943
147,071 62,163
147,071 62,163
26,058,960 14,710,106
26,058,960 14,710,106
8,108,604 4,864,482
Compensation 6,659,356 3,966,543
Benefits 1,075,005 679,830
FGTS – severance pay fund 374,243 218,109
9,828,164 3,464,710
Federal 9,400,895 3,179,284
State 25,567 14,916
Municipal 401,702 270,510
645,609 294,489
7,476,583 6,086,425
Dividends and interest on capital paid/provided for 2,630,440 1,960,862
Retained earnings (loss) for the period 4,223,380 3,970,945
Minority interest in retained earnings 622,763 154,618
DISTRIBUTION OF ADDED VALUE
Result from insurance, pension plan and capitalization operations
Return on managed assets - Rent
Return on own assets
Result of allowance for loan losses (Note 8d)
Other
Personnel
Taxes, fees and contributions
Third-party services
Other
INCOME
Financial operations
Banking services
Equity in earnings (Note 15a III)
TOTAL ADDED VALUE TO BE DISTRIBUTED
EXPENSES ON FINANCIAL OPERATIONS
GROSS ADDED VALUE
DEPRECIATION AND AMORTIZATION (Note 13g)
NET ADDED VALUE PRODUCED BY THE COMPANY
Materials, energy and other
INPUTS PURCHASED FROM THIRD PARTIES
ADDED VALUE RECEIVED FROM TRANSFER
I t a ú U n i b a n c o S . A . – - September 0
56
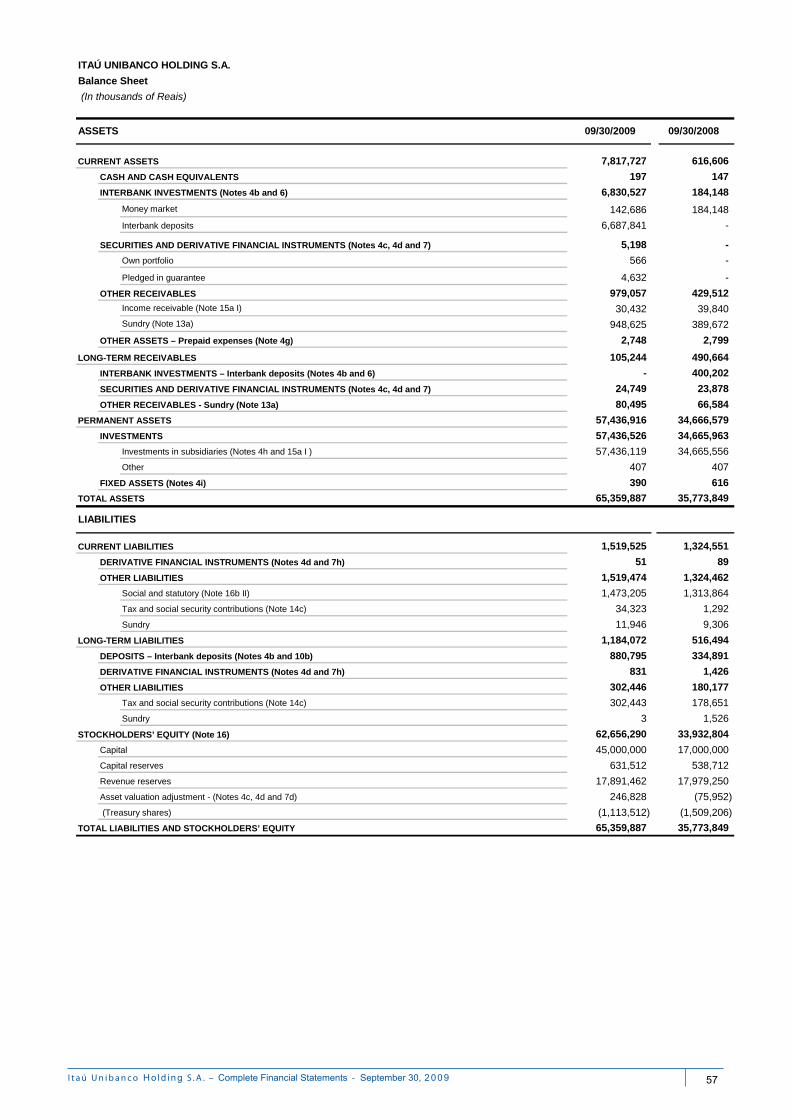
7,817,727 616,606
197 147
6,830,527 184,148
Money market 142,686 184,148
Interbank deposits 6,687,841 -
5,198 -
Own portfolio 566 -
Pledged in guarantee 4,632 -
979,057 429,512
Income receivable (Note 15a I) 30,432 39,840
Sundry (Note 13a) 948,625 389,672
2,748 2,799
105,244 490,664
- 400,202
24,749 23,878
80,495 66,584
57,436,916 34,666,579
57,436,526 34,665,963
Investments in subsidiaries (Notes 4h and 15a I ) 57,436,119 34,665,556
Other 407 407
390 616
65,359,887 35,773,849
1,519,525 1,324,551
51 89
1,519,474 1,324,462
Social and statutory (Note 16b II) 1,473,205 1,313,864
Tax and social security contributions (Note 14c) 34,323 1,292
Sundry 11,946 9,306
1,184,072 516,494
880,795 334,891
831 1,426
302,446 180,177
Tax and social security contributions (Note 14c) 302,443 178,651
Sundry 3 1,526
62,656,290 33,932,804
45,000,000 17,000,000
631,512 538,712
17,891,462 17,979,250
246,828 (75,952)
(1,113,512) (1,509,206)
65,359,887 35,773,849
OTHER RECEIVABLES
INTERBANK INVESTMENTS – Interbank deposits (Notes 4b and 6)
OTHER RECEIVABLES - Sundry (Note 13a)
TOTAL ASSETS
INVESTMENTS
DERIVATIVE FINANCIAL INSTRUMENTS (Notes 4d and 7h)
OTHER LIABILITIES
CURRENT LIABILITIES
(Treasury shares)
DEPOSITS – Interbank deposits (Notes 4b and 10b)
Asset valuation adjustment - (Notes 4c, 4d and 7d)
OTHER LIABILITIES
INTERBANK INVESTMENTS (Notes 4b and 6)
ASSETS
CURRENT ASSETS
TOTAL LIABILITIES AND STOCKHOLDERS’ EQUITY
PERMANENT ASSETS
STOCKHOLDERS’ EQUITY (Note 16)
Capital
Capital reserves
Revenue reserves
LIABILITIES
ITAÚ UNIBANCO HOLDING S.A.
Balance Sheet
(In thousands of Reais)
09/30/2009 09/30/2008
DERIVATIVE FINANCIAL INSTRUMENTS (Notes 4d and 7h)
LONG-TERM LIABILITIES
SECURITIES AND DERIVATIVE FINANCIAL INSTRUMENTS (Notes 4c, 4d and 7)
FIXED ASSETS (Notes 4i)
LONG-TERM RECEIVABLES
SECURITIES AND DERIVATIVE FINANCIAL INSTRUMENTS (Notes 4c, 4d and 7)
OTHER ASSETS – Prepaid expenses (Note 4g)
CASH AND CASH EQUIVALENTS
I t a ú U n i b a n c o S . A . – - September 0
57
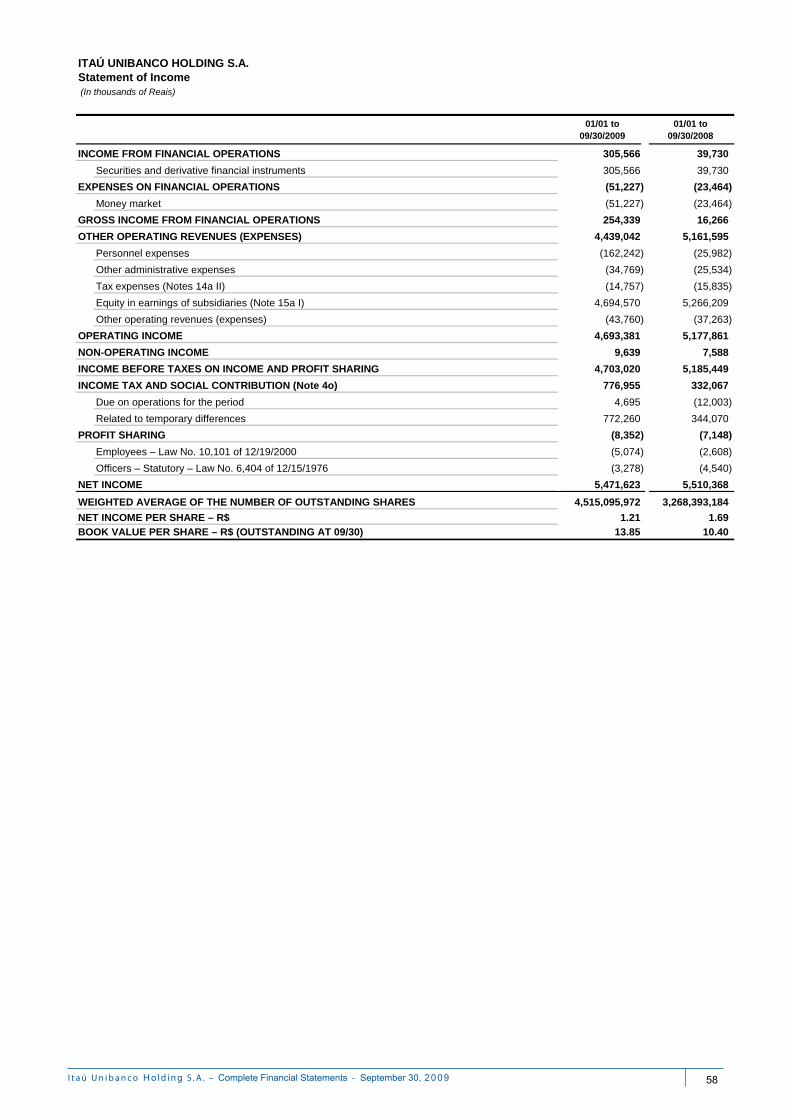
01/01 to 09/30/2009
01/01 to 09/30/2008
305,566 39,730
Securities and derivative financial instruments 305,566 39,730
(51,227) (23,464)
Money market (51,227) (23,464)
254,339 16,266
4,439,042 5,161,595
Personnel expenses (162,242) (25,982)
Other administrative expenses (34,769) (25,534)
Tax expenses (Notes 14a II) (14,757) (15,835)
Equity in earnings of subsidiaries (Note 15a I) 4,694,570 5,266,209
Other operating revenues (expenses) (43,760) (37,263)
4,693,381 5,177,861
9,639 7,588
4,703,020 5,185,449
776,955 332,067
Due on operations for the period 4,695 (12,003)
Related to temporary differences 772,260 344,070
(8,352) (7,148)
Employees – Law No. 10,101 of 12/19/2000 (5,074) (2,608)
Officers – Statutory – Law No. 6,404 of 12/15/1976 (3,278) (4,540)
5,471,623 5,510,368
WEIGHTED AVERAGE OF THE NUMBER OF OUTSTANDING SHARES 4,515,095,972 3,268,393,184
NET INCOME PER SHARE – R$ 1.21 1.69
BOOK VALUE PER SHARE – R$ (OUTSTANDING AT 09/30) 13.85 10.40
ITAÚ UNIBANCO HOLDING S.A.Statement of Income (In thousands of Reais)
OTHER OPERATING REVENUES (EXPENSES)
EXPENSES ON FINANCIAL OPERATIONS
GROSS INCOME FROM FINANCIAL OPERATIONS
INCOME FROM FINANCIAL OPERATIONS
OPERATING INCOME
NON-OPERATING INCOME
PROFIT SHARING
NET INCOME
INCOME BEFORE TAXES ON INCOME AND PROFIT SHARING
INCOME TAX AND SOCIAL CONTRIBUTION (Note 4o)
I t a ú U n i b a n c o S . A . – - September 0
58
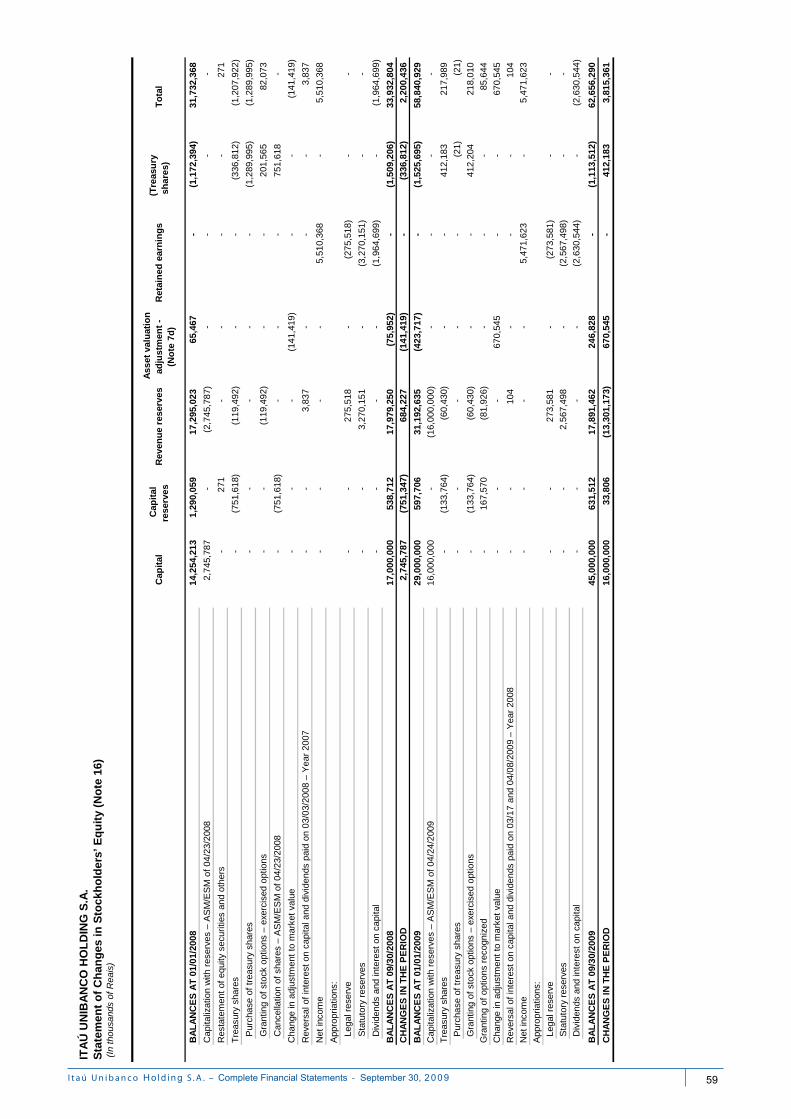
Cap
ital
C
apit
al
rese
rves
R
even
ue
rese
rves
A
sset
val
uat
ion
ad
just
men
t -
(No
te 7
d)
R
etai
ned
ear
nin
gs
(Tre
asu
ry
shar
es)
T
ota
l
14,2
54,2
13
1,
290,
059
17
,295
,023
65
,467
-
(1
,172
,394
)
31
,732
,368
2,74
5,78
7
-
(2
,745
,787
)
-
-
-
-
-
27
1
-
-
-
-
27
1
-
(7
51,6
18)
(119
,492
)
-
-
(336
,812
)
(1,2
07,9
22)
Pur
chas
e of
tre
asur
y sh
ares
-
-
-
-
-
(1,2
89,9
95)
(1,2
89,9
95)
Gra
ntin
g of
sto
ck o
ptio
ns –
exe
rcis
ed o
ptio
ns-
-
(1
19,4
92)
-
-
20
1,56
5
82
,073
Can
cella
tion
of s
hare
s –
AS
M/E
SM
of
04/2
3/20
08-
(751
,618
)
-
-
-
75
1,61
8
-
-
-
-
(141
,419
)
-
-
(141
,419
)
-
-
3,83
7
-
-
-
3,83
7
-
-
-
-
5,
510,
368
-
5,
510,
368
Lega
l res
erve
-
-
27
5,51
8
-
(2
75,5
18)
-
-
Sta
tuto
ry r
eser
ves
-
-
3,27
0,15
1
-
(3,2
70,1
51)
-
-
Div
iden
ds a
nd in
tere
st o
n ca
pita
l-
-
-
-
(1,9
64,6
99)
-
(1,9
64,6
99)
17,0
00,0
00
53
8,71
2
17,9
79,2
50
(75,
952)
-
(1,5
09,2
06)
33,9
32,8
04
2,74
5,78
7
(751
,347
)
68
4,22
7
(141
,419
)
-
(336
,812
)
2,20
0,43
6
29,0
00,0
00
59
7,70
6
31,1
92,6
35
(423
,717
)
-
(1,5
25,6
95)
58,8
40,9
29
16,0
00,0
00
-
(16,
000,
000)
-
-
-
-
-
(1
33,7
64)
(60,
430)
-
-
412,
183
217,
989
Pur
chas
e of
tre
asur
y sh
ares
-
-
-
-
-
(21)
(2
1)
Gra
ntin
g of
sto
ck o
ptio
ns –
exe
rcis
ed o
ptio
ns-
(133
,764
)
(6
0,43
0)
-
-
41
2,20
4
21
8,01
0
-
16
7,57
0
(81,
926)
-
-
-
85,6
44
-
-
-
670,
545
-
-
670,
545
-
-
104
-
-
-
10
4
-
-
-
-
5,
471,
623
-
5,
471,
623
Lega
l res
erve
-
-
27
3,58
1
-
(2
73,5
81)
-
-
Sta
tuto
ry r
eser
ves
-
-
2,56
7,49
8
-
(2,5
67,4
98)
-
-
Div
iden
ds a
nd in
tere
st o
n ca
pita
l-
-
-
-
(2,6
30,5
44)
-
(2,6
30,5
44)
45,0
00,0
00
63
1,51
2
17,8
91,4
62
246,
828
-
(1,1
13,5
12)
62,6
56,2
90
16,0
00,0
00
33
,806
(13,
301,
173)
670,
545
-
412,
183
3,81
5,36
1
BA
LA
NC
ES
AT
09/
30/2
008
BA
LA
NC
ES
AT
01/
01/2
008
Res
tate
men
t of
equ
ity s
ecur
ities
and
oth
ers
Cha
nge
in a
djus
tmen
t to
mar
ket
valu
e
Rev
ersa
l of
inte
rest
on
capi
tal a
nd d
ivid
ends
pai
d on
03/
03/2
008
– Y
ear
2007
App
ropr
iatio
ns:
BA
LA
NC
ES
AT
01/
01/2
009
(In
tho
usan
ds o
f R
eais
)
ITA
Ú U
NIB
AN
CO
HO
LD
ING
S.A
.S
tate
men
t o
f C
han
ges
in
Sto
ckh
old
ers’
Eq
uit
y (N
ote
16)
Cap
italiz
atio
n w
ith r
eser
ves
– A
SM
/ES
M o
f 04
/23/
2008
Tre
asur
y sh
ares
App
ropr
iatio
ns:
Net
inco
me
CH
AN
GE
S I
N T
HE
PE
RIO
D
Cap
italiz
atio
n w
ith r
eser
ves
– A
SM
/ES
M o
f 04
/24/
2009
BA
LA
NC
ES
AT
09/
30/2
009
CH
AN
GE
S I
N T
HE
PE
RIO
D
Tre
asur
y sh
ares
Cha
nge
in a
djus
tmen
t to
mar
ket
valu
e
Rev
ersa
l of
inte
rest
on
capi
tal a
nd d
ivid
ends
pai
d on
03/
17 a
nd 0
4/08
/200
9 –
Yea
r 20
08
Gra
ntin
g of
opt
ions
rec
ogni
zed
Net
inco
me
I t a ú U n i b a n c o S . A . – - September 0
59
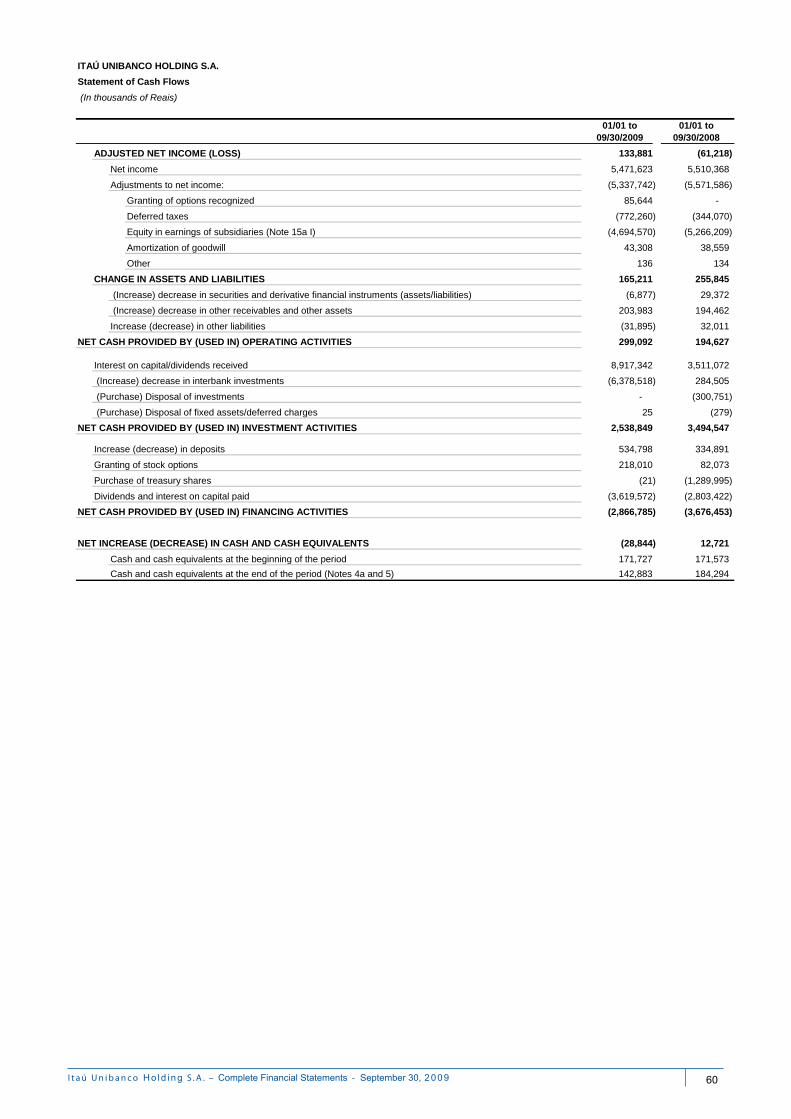
01/01 to 09/30/2009
01/01 to 09/30/2008
133,881 (61,218)
5,471,623 5,510,368
(5,337,742) (5,571,586)
Granting of options recognized 85,644 -
Deferred taxes (772,260) (344,070)
Equity in earnings of subsidiaries (Note 15a I) (4,694,570) (5,266,209)
Amortization of goodwill 43,308 38,559
Other 136 134
165,211 255,845
(6,877) 29,372
203,983 194,462
(31,895) 32,011
299,092 194,627
8,917,342 3,511,072
(6,378,518) 284,505
- (300,751)
25 (279)
2,538,849 3,494,547
534,798 334,891
218,010 82,073
(21) (1,289,995)
(3,619,572) (2,803,422)
(2,866,785) (3,676,453)
(28,844) 12,721
Cash and cash equivalents at the beginning of the period 171,727 171,573
Cash and cash equivalents at the end of the period (Notes 4a and 5) 142,883 184,294
(Increase) decrease in securities and derivative financial instruments (assets/liabilities)
ADJUSTED NET INCOME (LOSS)
CHANGE IN ASSETS AND LIABILITIES
Net income
Adjustments to net income:
Statement of Cash Flows
ITAÚ UNIBANCO HOLDING S.A.
(In thousands of Reais)
(Increase) decrease in other receivables and other assets
Increase (decrease) in other liabilities
Dividends and interest on capital paid
NET CASH PROVIDED BY (USED IN) FINANCING ACTIVITIES
NET INCREASE (DECREASE) IN CASH AND CASH EQUIVALENTS
NET CASH PROVIDED BY (USED IN) INVESTMENT ACTIVITIES
Granting of stock options
Purchase of treasury shares
NET CASH PROVIDED BY (USED IN) OPERATING ACTIVITIES
Interest on capital/dividends received
(Purchase) Disposal of fixed assets/deferred charges
(Purchase) Disposal of investments
Increase (decrease) in deposits
(Increase) decrease in interbank investments
I t a ú U n i b a n c o S . A . – - September 0
60
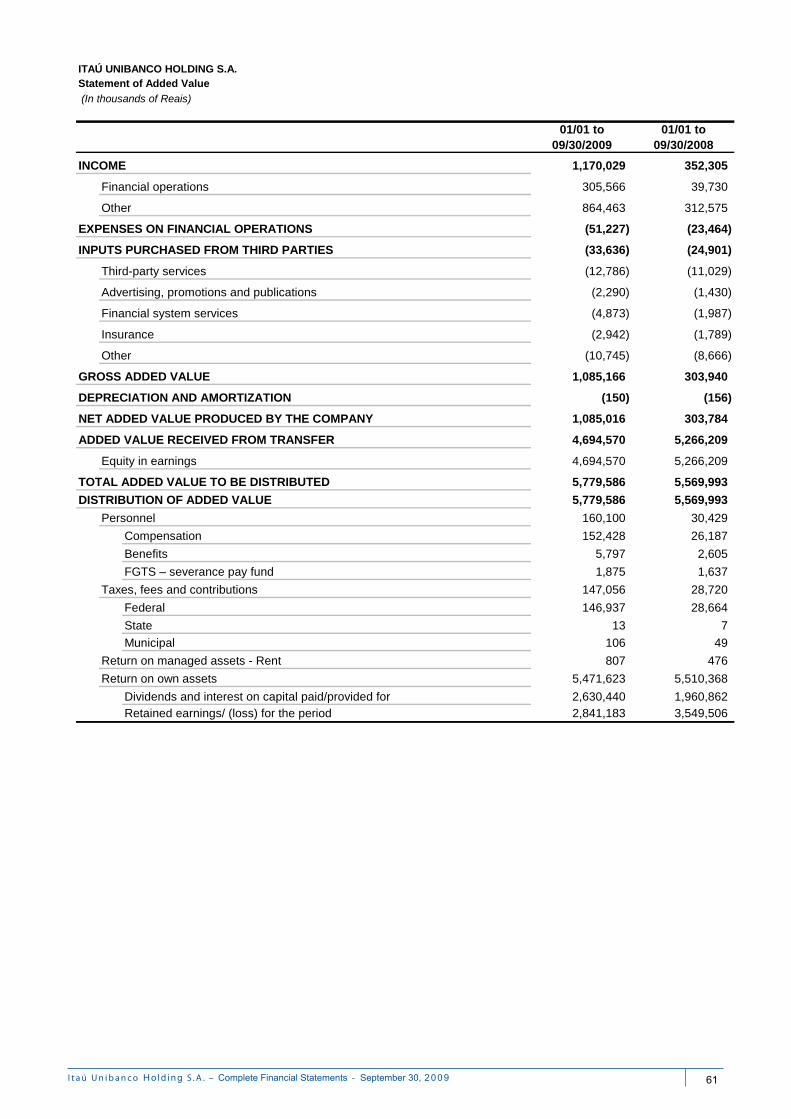
01/01 to 09/30/2009
01/01 to 09/30/2008
1,170,029 352,305
305,566 39,730
864,463 312,575
(51,227) (23,464)
(33,636) (24,901)
(12,786) (11,029)
(2,290) (1,430)
(4,873) (1,987)
(2,942) (1,789)
(10,745) (8,666)
1,085,166 303,940
(150) (156)
1,085,016 303,784
4,694,570 5,266,209
4,694,570 5,266,209
5,779,586 5,569,993
5,779,586 5,569,993
160,100 30,429
Compensation 152,428 26,187
Benefits 5,797 2,605
FGTS – severance pay fund 1,875 1,637
147,056 28,720
Federal 146,937 28,664
State 13 7
Municipal 106 49
807 476
5,471,623 5,510,368
Dividends and interest on capital paid/provided for 2,630,440 1,960,862
Retained earnings/ (loss) for the period 2,841,183 3,549,506
DISTRIBUTION OF ADDED VALUE
INCOME
Financial operations
EXPENSES ON FINANCIAL OPERATIONS
NET ADDED VALUE PRODUCED BY THE COMPANY
Third-party services
Advertising, promotions and publications
Return on managed assets - Rent
Return on own assets
Personnel
Taxes, fees and contributions
Equity in earnings
TOTAL ADDED VALUE TO BE DISTRIBUTED
GROSS ADDED VALUE
DEPRECIATION AND AMORTIZATION
ADDED VALUE RECEIVED FROM TRANSFER
ITAÚ UNIBANCO HOLDING S.A.Statement of Added Value
(In thousands of Reais)
Other
Financial system services
Insurance
INPUTS PURCHASED FROM THIRD PARTIES
Other
I t a ú U n i b a n c o S . A . – - September 0
61
ITAÚ UNIBANCO HOLDING S.A.
NOTES TO THE FINANCIAL STATEMENTS
FROM JANUARY 1 TO SEPTEMBER 30, 2009 AND 2008
(In thousands of Reais)
NOTE 1 - OPERATIONS
Itaú Unibanco Banco Holding S.A. (ITAÚ UNIBANCO HOLDING) is a publicly-held company which, together with its subsidiary and affiliated companies, operates in Brazil and abroad, with all types of banking activities, through its commercial, investment, consumer credit, real estate loan, finance and investment credit, and lease portfolios, including foreign exchange operations, and other complementary activities, with emphasis on Insurance, Private Pension Plans, Capitalization, Securities Brokerage and Administration of Credit Cards, Consortia, Investment Funds and Managed Portfolios.
I t a ú U n i b a n c o S . A . – - September 0
62
NOTE 2 – PRESENTATION OF THE FINANCIAL STATEMENTS a) Presentation of the Financial Statements
The financial statements of ITAÚ UNIBANCO HOLDING and of its subsidiaries (ITAÚ UNIBANCO HOLDING CONSOLIDATED) have been prepared in accordance with accounting principles established by the Brazilian Corporate Law, including the amendments introduced by Laws No. 11,638, of December 28, 2007, and No. 11,941, of May 27, 2009 (Note 22n), in conformity, when applicable, with instructions issued by the Central Bank of Brazil (BACEN), the National Monetary Council (CMN), the Brazilian Securities and Exchange Commission (CVM) and the Superintendency of Private Insurance (SUSEP), and National Council of Private Insurance (CNSP), which include the use of estimates necessary to calculate accounting provisions.
On February 18, 2009, BACEN approved the merger of the financial operations of ITAÚ UNIBANCO S.A. (ITAÚ UNIBANCO) and Unibanco – União de Bancos Brasileiros S.A. (UNIBANCO). These operations were integrated according to the respective business segment, through splits and mergers occurred on February 28, 2009; therefore, the Consolidated Financial Statements for the period from January 1 to September 30, 2009, and the corresponding notes to these financial statements are not presented with data “Without UNIBANCO”, as disclosed at December 31, 2008.
On March 30, 2009, ITAÚ purchased 24,082,760 nominative common shares of Redecard S.A. for R$ 590,028, giving rise to a goodwill amounting to R$ 556,575 which, net of taxes, totaled R$ 506,483, fully amortized in the Consolidated Financial Statements. In view of this transaction, ITAÚ UNIBANCO started to have the stockholding control over Redecard S.A., fully consolidated in the Financial Statements of ITAÚ UNIBANCO HOLDING from the first quarter of 2009.
In order to enable the proper analysis of the net income, the heading “Net income without nonrecurring effects” is presented below the Consolidated Statement of Income, and this effect is highlighted in a heading called “Exclusion of nonrecurring effects” (Note 22l). As set forth in the sole paragraph of article 7 of BACEN Circular Letter No. 3,068, of November 8, 2001, securities classified as trading securities (Note 4c) are presented in the Balance Sheet under Current Assets regardless of their maturity dates. Lease Operations are presented at present value in the Balance Sheet, and the related income and expenses, which represent the financial result of these operations, are presented, grouped together, under loan, lease and other credit operations in the Statement of Income. Advances on exchange contracts are reclassified from Other Liabilities – Foreign Exchange Portfolio. The foreign exchange result is presented on an adjusted basis, with the reclassification of expenses and income, in order to represent exclusively the impact of variations and differences of rates on the balance sheet accounts denominated in foreign currencies.
I t a ú U n i b a n c o S . A . – - September 0
63
b) Consolidation As set forth in paragraph 1, article 2, of BACEN Circular No. 2,804, of February 11, 1998, the financial statements of ITAÚ UNIBANCO HOLDING comprise the consolidation of its foreign branches and subsidiaries. Intercompany transactions and balances and results have been eliminated on consolidation. The investments held by consolidated companies in Exclusive Investment Funds are consolidated. The investments in these fund portfolios are classified by type of transaction and were distributed by type of security, in the same categories in which these securities had been originally allocated. The effects of the Foreign Exchange Variation on investments abroad are classified in the heading Securities and Derivative Financial Instruments in Statement of Income, including for comparability effects. The difference between the Net Income and Stockholders’ Equity between ITAÚ UNIBANCO HOLDING and ITAÚ UNIBANCO HOLDING CONSOLIDATED (Note 16d) results from the elimination of unrealized profits arising from transactions between the parent company and consolidated companies, and from the adoption of different criteria for the amortization of goodwill originated on purchase of investments and the recognition of deferred tax assets. In ITAÚ UNIBANCO HOLDING, the goodwill recorded in subsidiaries, mainly originated from the ITAÚ UNIBANCO merger, is being amortized based on the expected future profitability and appraisal reports or upon realization of the investment, according to the rules and guidance of CMN and BACEN. In ITAÚ UNIBANCO HOLDING CONSOLIDATED, this goodwill was fully amortized in the years when these investments occurred, in order to: a) permit better comparability with previous periods’ consolidated financial statements; and b) permit measuring Net Income and Stockholders’ Equity based on conservative criteria.
I t a ú U n i b a n c o S . A . – - September 0
64
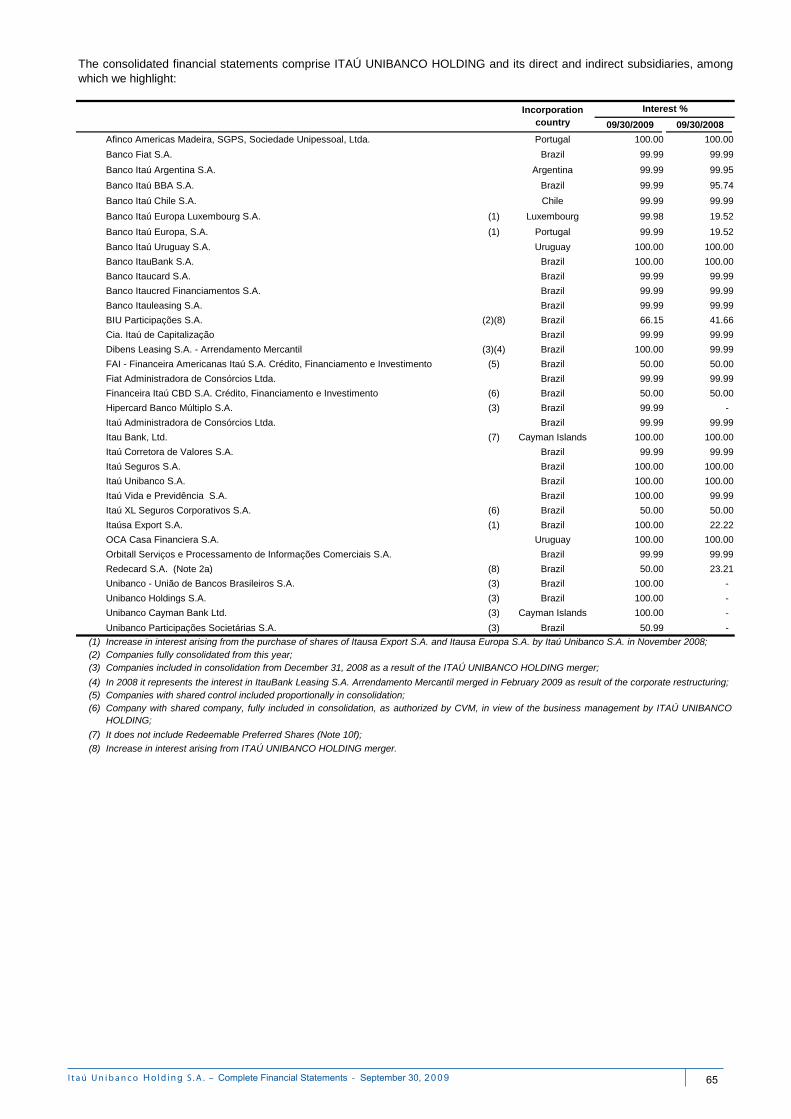
09/30/2009 09/30/2008
Afinco Americas Madeira, SGPS, Sociedade Unipessoal, Ltda. Portugal 100.00 100.00
Banco Fiat S.A. Brazil 99.99 99.99
Banco Itaú Argentina S.A. Argentina 99.99 99.95
Banco Itaú BBA S.A. Brazil 99.99 95.74
Banco Itaú Chile S.A. Chile 99.99 99.99
Banco Itaú Europa Luxembourg S.A. (1) Luxembourg 99.98 19.52
Banco Itaú Europa, S.A. (1) Portugal 99.99 19.52
Banco Itaú Uruguay S.A. Uruguay 100.00 100.00
Banco ItauBank S.A. Brazil 100.00 100.00
Banco Itaucard S.A. Brazil 99.99 99.99
Banco Itaucred Financiamentos S.A. Brazil 99.99 99.99
Banco Itauleasing S.A. Brazil 99.99 99.99
BIU Participações S.A. (2)(8) Brazil 66.15 41.66
Cia. Itaú de Capitalização Brazil 99.99 99.99
Dibens Leasing S.A. - Arrendamento Mercantil (3)(4) Brazil 100.00 99.99
FAI - Financeira Americanas Itaú S.A. Crédito, Financiamento e Investimento (5) Brazil 50.00 50.00
Fiat Administradora de Consórcios Ltda. Brazil 99.99 99.99
Financeira Itaú CBD S.A. Crédito, Financiamento e Investimento (6) Brazil 50.00 50.00
Hipercard Banco Múltiplo S.A. (3) Brazil 99.99 -
Itaú Administradora de Consórcios Ltda. Brazil 99.99 99.99
Itau Bank, Ltd. (7) Cayman Islands 100.00 100.00
Itaú Corretora de Valores S.A. Brazil 99.99 99.99
Itaú Seguros S.A. Brazil 100.00 100.00
Itaú Unibanco S.A. Brazil 100.00 100.00
Itaú Vida e Previdência S.A. Brazil 100.00 99.99
Itaú XL Seguros Corporativos S.A. (6) Brazil 50.00 50.00
Itaúsa Export S.A. (1) Brazil 100.00 22.22
OCA Casa Financiera S.A. Uruguay 100.00 100.00
Orbitall Serviços e Processamento de Informações Comerciais S.A. Brazil 99.99 99.99
Redecard S.A. (Note 2a) (8) Brazil 50.00 23.21
Unibanco - União de Bancos Brasileiros S.A. (3) Brazil 100.00 -
Unibanco Holdings S.A. (3) Brazil 100.00 -
Unibanco Cayman Bank Ltd. (3) Cayman Islands 100.00 -
Unibanco Participações Societárias S.A. (3) Brazil 50.99 -
(1) (2) (3)
(4) (5) (6)
(7)
(8)
Increase in interest arising from the purchase of shares of Itausa Export S.A. and Itausa Europa S.A. by Itaú Unibanco S.A. in November 2008;
Companies with shared control included proportionally in consolidation;
The consolidated financial statements comprise ITAÚ UNIBANCO HOLDING and its direct and indirect subsidiaries, amongwhich we highlight:
Interest %Incorporation country
Companies fully consolidated from this year;Companies included in consolidation from December 31, 2008 as a result of the ITAÚ UNIBANCO HOLDING merger;
Company with shared company, fully included in consolidation, as authorized by CVM, in view of the business management by ITAÚ UNIBANCOHOLDING;
It does not include Redeemable Preferred Shares (Note 10f);
Increase in interest arising from ITAÚ UNIBANCO HOLDING merger.
In 2008 it represents the interest in ItauBank Leasing S.A. Arrendamento Mercantil merged in February 2009 as result of the corporate restructuring;
I t a ú U n i b a n c o S . A . – - September 0
65
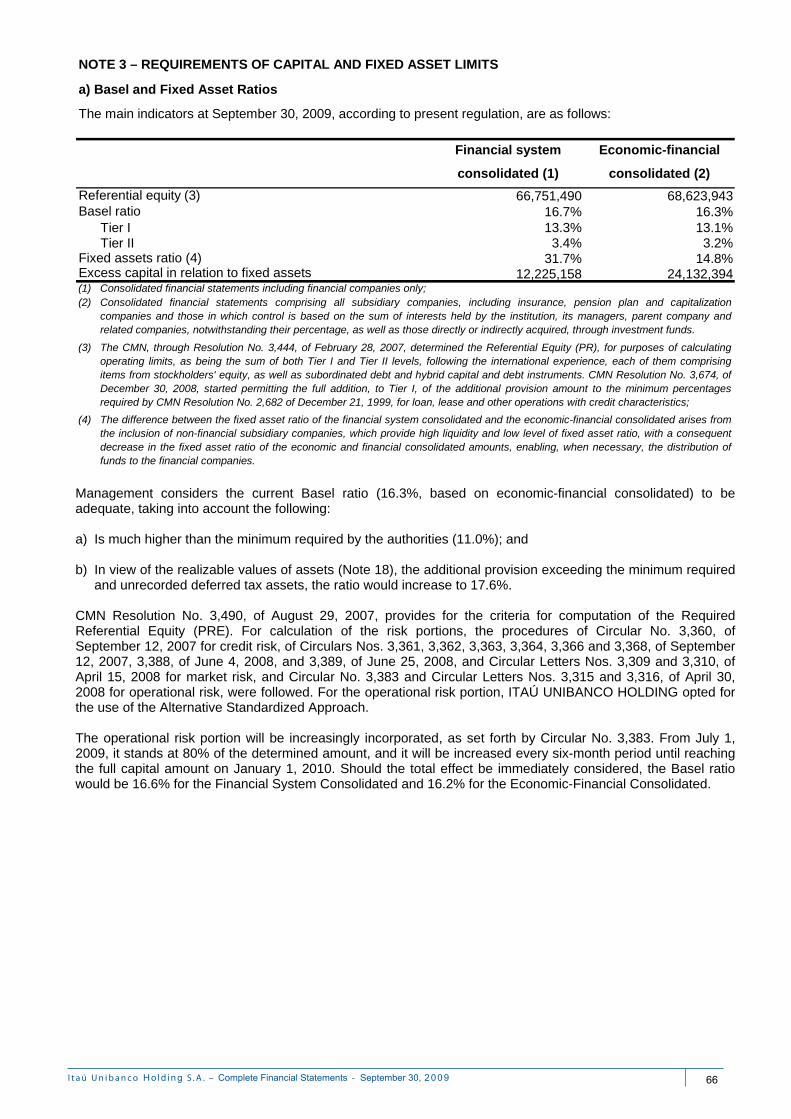
Financial system Economic-financial
consolidated (1) consolidated (2)
66,751,490 68,623,94316.7% 16.3%
Tier I 13.3% 13.1%Tier II 3.4% 3.2%
31.7% 14.8%12,225,158 24,132,394
(1)(2)
(3)
(4)
NOTE 3 – REQUIREMENTS OF CAPITAL AND FIXED ASSET LIMITS
Excess capital in relation to fixed assets
Basel ratio
Fixed assets ratio (4)
Referential equity (3)
The main indicators at September 30, 2009, according to present regulation, are as follows:
a) Basel and Fixed Asset Ratios
The difference between the fixed asset ratio of the financial system consolidated and the economic-financial consolidated arises fromthe inclusion of non-financial subsidiary companies, which provide high liquidity and low level of fixed asset ratio, with a consequentdecrease in the fixed asset ratio of the economic and financial consolidated amounts, enabling, when necessary, the distribution offunds to the financial companies.
The CMN, through Resolution No. 3,444, of February 28, 2007, determined the Referential Equity (PR), for purposes of calculatingoperating limits, as being the sum of both Tier I and Tier II levels, following the international experience, each of them comprisingitems from stockholders' equity, as well as subordinated debt and hybrid capital and debt instruments. CMN Resolution No. 3,674, ofDecember 30, 2008, started permitting the full addition, to Tier I, of the additional provision amount to the minimum percentagesrequired by CMN Resolution No. 2,682 of December 21, 1999, for loan, lease and other operations with credit characteristics;
Consolidated financial statements including financial companies only;Consolidated financial statements comprising all subsidiary companies, including insurance, pension plan and capitalizationcompanies and those in which control is based on the sum of interests held by the institution, its managers, parent company andrelated companies, notwithstanding their percentage, as well as those directly or indirectly acquired, through investment funds.
Management considers the current Basel ratio (16.3%, based on economic-financial consolidated) to be adequate, taking into account the following: a) Is much higher than the minimum required by the authorities (11.0%); and b) In view of the realizable values of assets (Note 18), the additional provision exceeding the minimum required
and unrecorded deferred tax assets, the ratio would increase to 17.6%. CMN Resolution No. 3,490, of August 29, 2007, provides for the criteria for computation of the Required Referential Equity (PRE). For calculation of the risk portions, the procedures of Circular No. 3,360, of September 12, 2007 for credit risk, of Circulars Nos. 3,361, 3,362, 3,363, 3,364, 3,366 and 3,368, of September 12, 2007, 3,388, of June 4, 2008, and 3,389, of June 25, 2008, and Circular Letters Nos. 3,309 and 3,310, of April 15, 2008 for market risk, and Circular No. 3,383 and Circular Letters Nos. 3,315 and 3,316, of April 30, 2008 for operational risk, were followed. For the operational risk portion, ITAÚ UNIBANCO HOLDING opted for the use of the Alternative Standardized Approach. The operational risk portion will be increasingly incorporated, as set forth by Circular No. 3,383. From July 1, 2009, it stands at 80% of the determined amount, and it will be increased every six-month period until reaching the full capital amount on January 1, 2010. Should the total effect be immediately considered, the Basel ratio would be 16.6% for the Financial System Consolidated and 16.2% for the Economic-Financial Consolidated.
I t a ú U n i b a n c o S . A . – - September 0
66
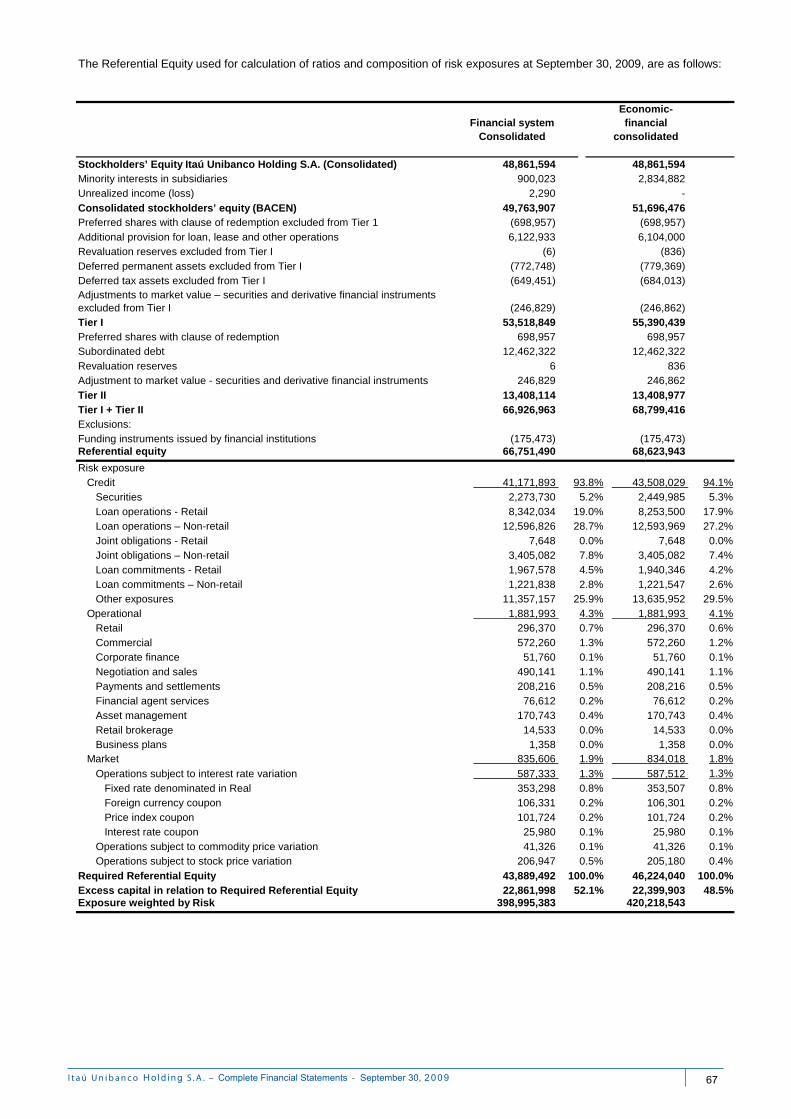
Financial system Consolidated
Economic-financial
consolidated
Stockholders’ Equity Itaú Unibanco Holding S.A. (Consolidated) 48,861,594 48,861,594 Minority interests in subsidiaries 900,023 2,834,882 Unrealized income (loss) 2,290 -
Consolidated stockholders’ equity (BACEN) 49,763,907 51,696,476 Preferred shares with clause of redemption excluded from Tier 1 (698,957) (698,957)Additional provision for loan, lease and other operations 6,122,933 6,104,000 Revaluation reserves excluded from Tier I (6) (836)Deferred permanent assets excluded from Tier I (772,748) (779,369)Deferred tax assets excluded from Tier I (649,451) (684,013)Adjustments to market value – securities and derivative financial instruments excluded from Tier I (246,829) (246,862)Tier I 53,518,849 55,390,439 Preferred shares with clause of redemption 698,957 698,957 Subordinated debt 12,462,322 12,462,322 Revaluation reserves 6 836 Adjustment to market value - securities and derivative financial instruments 246,829 246,862
Tier II 13,408,114 13,408,977 Tier I + Tier II 66,926,963 68,799,416 Exclusions: Funding instruments issued by financial institutions (175,473) (175,473)Referential equity 66,751,490 68,623,943
Risk exposure Credit 41,171,893 93.8% 43,508,029 94.1% Securities 2,273,730 5.2% 2,449,985 5.3% Loan operations - Retail 8,342,034 19.0% 8,253,500 17.9% Loan operations – Non-retail 12,596,826 28.7% 12,593,969 27.2% Joint obligations - Retail 7,648 0.0% 7,648 0.0% Joint obligations – Non-retail 3,405,082 7.8% 3,405,082 7.4% Loan commitments - Retail 1,967,578 4.5% 1,940,346 4.2% Loan commitments – Non-retail 1,221,838 2.8% 1,221,547 2.6% Other exposures 11,357,157 25.9% 13,635,952 29.5% Operational 1,881,993 4.3% 1,881,993 4.1% Retail 296,370 0.7% 296,370 0.6% Commercial 572,260 1.3% 572,260 1.2% Corporate finance 51,760 0.1% 51,760 0.1% Negotiation and sales 490,141 1.1% 490,141 1.1% Payments and settlements 208,216 0.5% 208,216 0.5% Financial agent services 76,612 0.2% 76,612 0.2% Asset management 170,743 0.4% 170,743 0.4% Retail brokerage 14,533 0.0% 14,533 0.0% Business plans 1,358 0.0% 1,358 0.0% Market 835,606 1.9% 834,018 1.8%
Operations subject to interest rate variation 587,333 1.3% 587,512 1.3%
Fixed rate denominated in Real 353,298 0.8% 353,507 0.8% Foreign currency coupon 106,331 0.2% 106,301 0.2% Price index coupon 101,724 0.2% 101,724 0.2% Interest rate coupon 25,980 0.1% 25,980 0.1% Operations subject to commodity price variation 41,326 0.1% 41,326 0.1% Operations subject to stock price variation 206,947 0.5% 205,180 0.4%
Required Referential Equity 43,889,492 100.0% 46,224,040 100.0%Excess capital in relation to Required Referential Equity 22,861,998 52.1% 22,399,903 48.5%Exposure weighted by Risk 398,995,383 420,218,543
The Referential Equity used for calculation of ratios and composition of risk exposures at September 30, 2009, are as follows:
I t a ú U n i b a n c o S . A . – - September 0
67
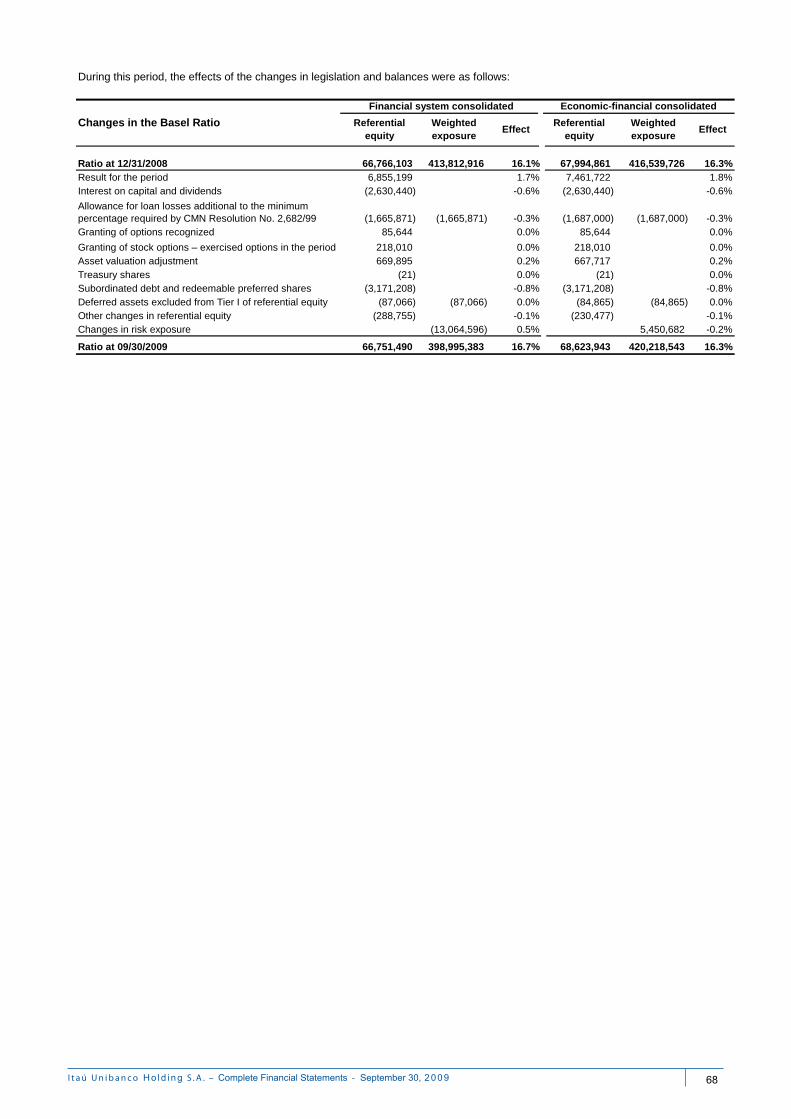
66,766,103 413,812,916 16.1% 67,994,861 416,539,726 16.3%6,855,199 1.7% 7,461,722 1.8%
(2,630,440) -0.6% (2,630,440) -0.6%
(1,665,871) (1,665,871) -0.3% (1,687,000) (1,687,000) -0.3%85,644 0.0% 85,644 0.0%
218,010 0.0% 218,010 0.0%669,895 0.2% 667,717 0.2%
(21) 0.0% (21) 0.0%(3,171,208) -0.8% (3,171,208) -0.8%
(87,066) (87,066) 0.0% (84,865) (84,865) 0.0%(288,755) -0.1% (230,477) -0.1%
(13,064,596) 0.5% 5,450,682 -0.2%
66,751,490 398,995,383 16.7% 68,623,943 420,218,543 16.3%
During this period, the effects of the changes in legislation and balances were as follows:
EffectWeighted exposure
Effect
Financial system consolidated Economic-financial consolidated
Referential equity
Referential equity
Weighted exposure
Changes in the Basel Ratio
Ratio at 12/31/2008Result for the periodInterest on capital and dividends
Asset valuation adjustmentGranting of stock options – exercised options in the period
Treasury shares
Allowance for loan losses additional to the minimum percentage required by CMN Resolution No. 2,682/99
Subordinated debt and redeemable preferred shares
Granting of options recognized
Deferred assets excluded from Tier I of referential equityOther changes in referential equityChanges in risk exposure
Ratio at 09/30/2009
I t a ú U n i b a n c o S . A . – - September 0
68
b) Capital for Insurance Activity
SUSEP, following the worldwide trend towards the strengthening of the insurance market, disclosed on December 26, 2006 the Resolutions Nos. 155 and 158, amended by Resolutions No. 178 of December 28, 2007, and No. 200 of December 16, 2008, and Circular No. 355 of December 14, 2007. The regulations, in force as from January 2008, provide for the rules on regulatory capital required for authorization and operation of insurance companies and rules for the allocation of capital from subscription risk for several insurance segments. Noteworthy is the fact that the adjusted stockholders’ equity of ITAU UNIBANCO HOLDING companies exclusively engaged in insurance activities is higher than the required regulatory capital. As of September 30, 2009, the regulatory capital required was R$ 1,074,363 for an existing adjusted stockholders’ equity of R$ 3,502,257.
I t a ú U n i b a n c o S . A . – - September 0
69
NOTE 4 – SUMMARY OF THE MAIN ACCOUNTING PRACTICES a) Cash and cash equivalents – for purposes of Consolidated Statement of Cash Flows, it includes cash and
current accounts in banks (considered in the heading cash and cash equivalents), interbank deposits and securities purchased under agreements to resell – funded position that have original maturities of up to 90 days or less.
b) Interbank investments, remunerated restricted credits – Central Bank of Brazil, remunerated
deposits, deposits received under securities repurchase agreements, funds from acceptance and issuance of securities, borrowings and onlendings, subordinated debt and other receivables and payables – transactions subject to monetary correction and foreign exchange variation and operations with fixed charges are recorded at present value, net of the transaction costs incurred, calculated “pro rata die” based on the effective rate of transactions, according to CVM Resolution No. 556 of November 12, 2008.
c) Securities - recorded at cost of acquisition restated by the index and/or effective interest rate and presented
in the Balance Sheet, according to BACEN Circular No. 3,068, of November 8, 2001. Securities are classified into the following categories:
Trading securities – acquired to be actively and frequently traded, and adjusted to market value, with a
contra-entry to the results for the period; Available-for-sale securities – securities that can be negotiated but are not acquired to be actively and
frequently traded. They are adjusted to their market value with a contra-entry to an account disclosed in stockholders’ equity;
Held-to-maturity securities – securities, except for non-redeemable shares, for which the bank has the
financial condition and intends or is required to hold them in the portfolio up to their maturity, are recorded at cost of acquisition, or market value, whenever these are transferred from another category. The securities are adjusted up to their maturity date, not being adjusted to market value.
Gains and losses on available-for-sale securities, when realized, are recognized at the trading date in the statement of income, with a contra-entry to a specific stockholders’ equity account. Decreases in the market value of available-for-sale and held-to-maturity securities below their related costs, resulting from non-temporary reasons, are recorded in results as realized losses.
d) Derivative financial instruments - these are classified on the date of their acquisition, according to
management's intention of using them either as a hedge or not, according to BACEN Circular No. 3,082, of January 30, 2002. Transactions involving financial instruments, carried out upon the client's request, for their own account, or which do not comply with the hedging criteria (mainly derivatives used to manage the overall risk exposure) are stated at market value, including realized and unrealized gains and losses, which are recorded directly in the statements of income.
The derivatives used for protection against risk exposure or to modify the characteristics of financial assets and liabilities, which have changes in market value highly associated with those of the items being protected at the beginning and throughout the duration of the contract, and which are found effective to reduce the risk related to the exposure being protected, are classified as a hedge, in accordance with their nature:
Market Risk Hedge – Financial assets and liabilities, as well as their related financial instruments, are
accounted for at their market value plus realized and unrealized gains and losses, which are recorded directly in the statement of income;
I t a ú U n i b a n c o S . A . – - September 0
70
Cash Flow Hedge - The effective amount of the hedge of financial assets and liabilities, as well as their related financial instruments, are accounted for at their market value plus realized and unrealized gains and losses, net of tax effects, when applicable, and recorded in a specific account in stockholders’ equity. The ineffective portion of hedge is recorded directly in the statement of income.
e) Loan, lease and other credit operations (Operations with credit granting characteristics) – these
transactions are recorded at present value and calculated “pro rata die” based on the variation of the contracted index and interest rate, and are recorded on the accrual basis until the 60th day overdue in financial companies. After the 60th day, income is recognized upon the effective receipt of installments. Credit card operations include receivables arising from the purchases made by cardholders. The funds related to these amounts are recorded in Other Liabilities – Credit Card Operations, which also include funds arising from other credits related to transactions with credit card issuers.
f) Allowance for loan losses - the balance of the allowance for loan losses was recorded based on the credit
risk analysis, at an amount considered sufficient to cover loan losses according to the rules determined by CMN Resolution No. 2,682 of December 21, 1999, among which are:
Provisions are recorded from the date loans are granted, based on the client’s risk rating and on the
periodic quality evaluation of clients and industries, and not only in the event of default; Based exclusively on delinquency, write-offs of credit operations against loss must be carried out 360
days after the due date of the credit or 540 days for operations that mature after a period of 36 months. g) Other assets - these assets are mainly comprised by assets held for sale relating to real estate available for
sale, own real estate not in use and real estate received as payment in kind, which are adjusted to market value through the set-up of a provision, according to current regulations; reinsurance unearned premiums (Note 4m l); and prepaid expenses, corresponding to disbursements, the benefit of which will occur in future periods.
h) Investments - in subsidiary and affiliated companies, investments are accounted for under the equity
method. The consolidated financial statements of foreign branches and subsidiaries are adapted to comply with Brazilian accounting practices and converted into Reais. Other investments are recorded at cost and adjusted to market value by setting up a provision in accordance with current standards.
i) Fixed assets - these assets are stated at cost of acquisition or construction, less accumulated depreciation,
adjusted to market value until December 31, 2007, when applicable. For insurance, pension plan and capitalization operations, property and equipment are adjusted to market value supported by appraisal reports. Correspond to rights related to tangible assets intended for maintenance of the company's operations or exercised for such purpose, including assets arising from transactions that transfer to the company their benefits, risks and control. The items acquired through Lease contracts are recorded according to CVM Resolution No. 554, of November 12, 2008, as contra-entry to Lease obligations. Depreciation is calculated using the straight-line method, based on monetarily restated cost, at the following annual rates:
Real estate in use 4 % to 8 % Leasehold improvements From 10% Installations, furniture, equipment and security, transportation and communication systems 10 % to 25 % EDP systems 20 % to 50 %
j) Operating leases – leased assets are stated at cost of acquisition less accumulated depreciation. The
depreciation of leased assets is recognized under the straight-line method, based on their usual useful lives, taking into account that the useful life shall be decreased by 30% should it meet the conditions provided for by Ordinance No. 113 of February 26, 1988 issued by the Ministry of Finance. Receivables are recorded in lease receivable at the contractual amount, with contra-entry to unearned income accounts. The recognition in income will occur on the due date of the installments.
I t a ú U n i b a n c o S . A . – - September 0
71
k) Intangible assets – correspond to rights acquired whose subjects are intangible assets intended for maintenance of the company or which are exercised for such purpose, according to the CMN Resolution No. 3,642, of November 26, 2008. They are composed of rights acquired to credit payrolls and partnership agreements, amortized over the agreement terms, and software and customer portfolios, amortized over a term varying from five to ten years.
l) Reduction to the recoverable value of assets – a loss is recognized when there are clear evidences that
assets are stated at a non-recoverable value. From 2008, this procedure started to be adopted annually in the fourth quarter.
m) Insurance, pension plan and capitalization operations – Insurance premiums, acceptance coinsurance
and selling expenses are accounted for in accordance with the insurance effectiveness term, through the recognition and reversal of the provision for unearned premiums and deferred selling expenses. Interest arising from fractioning of insurance premiums is accounted for as incurred. Revenues from social security contributions, gross revenue from capitalization certificates and respective technical provisions are recognized upon receipt.
I - Credits from operations and other assets related to insurance and reinsurance operations:
Insurance premiums receivable – Refer to installments of insurance premiums receivable, current and past due, in accordance with insurance policies issued.
Reinsurance recoverable amounts – Refer to claims paid to the insured party pending recovery from
Reinsurer, installments of unsettled claims and incurred but not reported claims - Reinsurance (IBNR), classified in assets in accordance with the criteria established by CNSP Resolution No. 162, of December 26, 2006, as amended by CNSP Resolution No. 195, of December 16, 2008, and SUSEP Circular No. 379, of December 19, 2008.
Reinsurance unearned premiums – Recognized to determine the portion of reinsurance unearned
premiums, calculated “pro rata die”, and for risks of policies not issued computed based on estimates, based on the actuarial technical study and in compliance with the criteria established by CNSP Resolution No. 162, of December 26, 2006, as amended by CNSP Resolution No. 195, of December 16, 2008, and SUSEP Circular No. 379, of December 19, 2008.
II - Technical provisions of insurance, pension plan and capitalization – provisions are recognized according to the technical notes approved by SUSEP and criteria established by CNSP Resolution No. 162 of December 26, 2006 and the amendments introduced by CNSP Resolution No. 181, of December 19, 2007, and CNSP Resolution No. 195, of December 16, 2008.
II.I - Insurance
Provision for unearned premiums – recognized to determine unearned premiums relating to the
risk coverage period, calculated “pro rata die”, and relating to risks not yet issued, calculated based on estimates, according to an actuarial technical study;
Provision for premium deficiency – recognized according to the Technical Actuarial Note in case
of insufficient Provision for unearned premiums;
Provision for unsettled claims - recognized based on claims of loss in an amount sufficient to cover future commitments, awaiting judicial decision, which amounts are determined by court-appointed experts and legal advisors that make assessments based on the insured amounts and technical regulations, taking into consideration the likelihood of unfavorable outcome to the insurance company;
Provision for claims incurred but not reported (IBNR) – recognized for the estimated amount of
claims occurred for risks assumed in the portfolio but not reported.
II.II - Pension plan and individual life with living benefits – correspond to liabilities assumed such as retirement plans, disability, pension and annuity:
I t a ú U n i b a n c o S . A . – - September 0
72
Mathematical provisions for benefits to be granted and benefits granted – correspond to commitments assumed with participants, but for which benefits are not yet due, and to those receiving the benefits;
Provision for insufficient contribution – recognized in case of insufficient mathematical provisions;
Provision for events incurred but not reported (IBNR) – recognized for the estimated amount of
events occurred but not reported;
Provision for financial surplus – recognized at the difference between the contributions adjusted daily by the Investment Portfolio and the funds guaranteeing them, according to the plan’s regulation;
Provision for financial variation – recognized according to the methodology provided for in the
Technical Actuarial Note in order to guarantee that the financial assets are sufficient to cover mathematical provisions.
II.III- Capitalization
Mathematical provision for redemptions – represents capitalization certificates received to be
redeemed;
Provision for raffle contingencies – recognized according to the methodology provided for in the Technical Actuarial Note to cover the Provision for raffles in the event of insufficient funds.
n) Contingent assets and liabilities and legal liabilities – tax and social security - assessed, recognized
and disclosed according to the provisions set forth in CMN Resolution No. 3,535 of January 31, 2008.
I - Contingent assets and liabilities
Refer to potential rights and obligations arising from past events, the occurrence of which is dependent upon future events.
Contingent assets - not recognized, except upon evidence ensuring a high reliability level of
realization, usually represented by claims awarded a final and unappealable judgment and confirmation of the recoverability of the claim through receipt of amounts or offset against another liability;
Contingent liabilities - basically arise from administrative proceedings and lawsuits, inherent in the
normal course of business, filed by third parties, former employees and governmental bodies, in connection with civil, labor, tax and social security lawsuits and other risks. These contingencies are calculated based on conservative practices, being usually recorded based on the opinion of legal advisors and considering the probability that financial resources shall be required for settling the obligation, the amount of which may be estimated with sufficient certainty. Contingencies are classified either as probable, for which provisions are recognized; possible, which are disclosed but not recognized; or remote, for which recognition or disclosure are not required. Any contingent amounts are measured through the use of models and criteria which allow their adequate measurement, in spite of the uncertainty of their term and amounts.
Escrow deposits are restated in accordance with the current legislation.
Contingencies guaranteed by indemnity clauses in privatization processes and with liquidity are only recognized upon judicial notification with simultaneous recognition of receivables, without any effect on results.
I t a ú U n i b a n c o S . A . – - September 0
73
II - Legal liabilities – tax and social security
Represented by amounts payable related to tax liabilities, the legality or constitutionality of which are subject to administrative or judicial defense, recognized at the full amount under discussion.
Liabilities and related escrow deposits are adjusted in accordance with the current legislation.
o) Taxes - these provisions are calculated according to current legislation at the rates shown below, for effects
of the related calculation bases.
15.00%10.00%15.00%
0.65%4.00%
up to 5.00%(1)
(2) For non-financial subsidiaries that fall into the non-cumulative calculation system, the PIS rate is 1.65% and COFINS rate is7.6%.
Income taxAdditional income taxSocial contribution (1)PIS (2)COFINS (2)ISS
As from May 1, 2008, for financial subsidiaries and equivalent companies, the rate was changed from 9% to 15%, as provided forin articles 17 and 41 of Law No. 11,727 of June 24, 2008. For non-financial and social security subsidiaries, the rate remained at9%.
The changes introduced by Laws No. 11,638 and No. 11,941 (articles 37 and 38), which modified the criterion for recognizing revenues, costs and expenses, computed to determine the net income for the year, did not produce effects for purposes of determining the taxable income of companies that opt for the Transition Tax Regime (RTT), so for tax purposes the rules effective on December 31, 2007 were followed. The tax effect arising from the adoption of such rules is recorded, for accounting purposes, in the corresponding deferred assets and liabilities.
p) Deferred income – this refers to unexpired interest received in advance that is recognized in income as
earned, and the negative goodwill on acquisition of investments arising from expected future losses, which has not been absorbed in the consolidation process.
I t a ú U n i b a n c o S . A . – - September 0
74
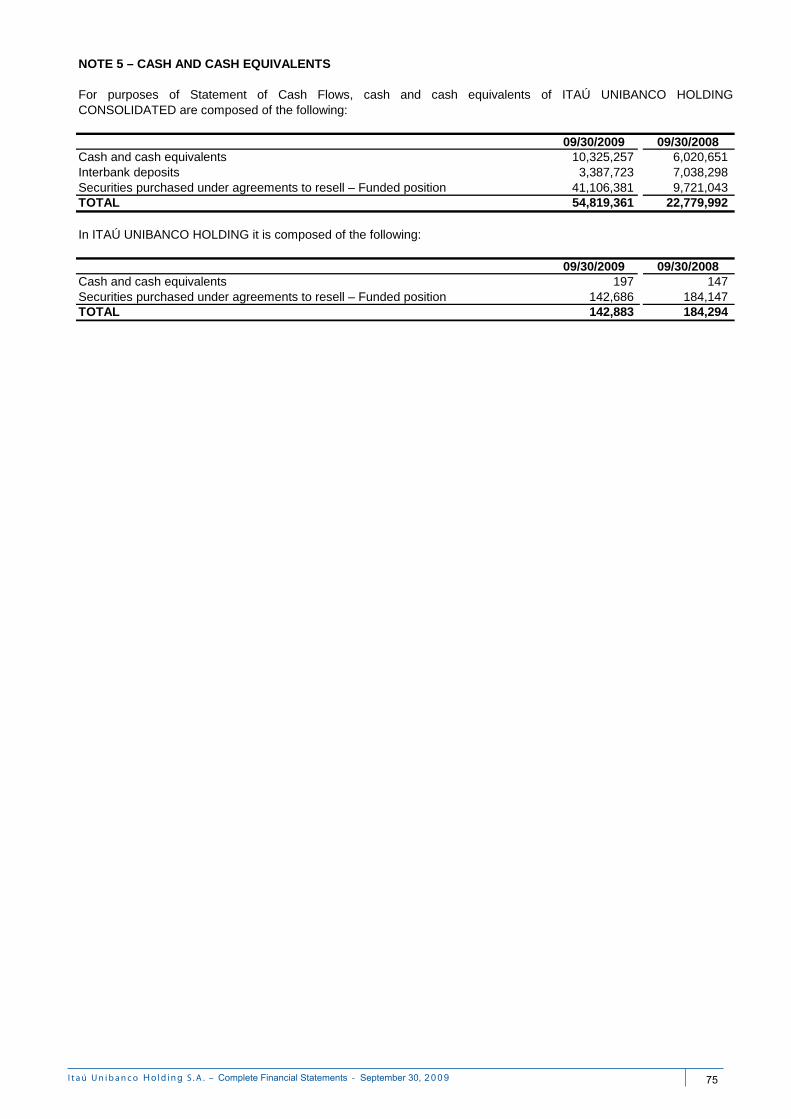
09/30/2009 09/30/2008Cash and cash equivalents 10,325,257 6,020,651 Interbank deposits 3,387,723 7,038,298 Securities purchased under agreements to resell – Funded position 41,106,381 9,721,043 TOTAL 54,819,361 22,779,992
09/30/2009 09/30/2008Cash and cash equivalents 197 147 Securities purchased under agreements to resell – Funded position 142,686 184,147 TOTAL 142,883 184,294
For purposes of Statement of Cash Flows, cash and cash equivalents of ITAÚ UNIBANCO HOLDINGCONSOLIDATED are composed of the following:
NOTE 5 – CASH AND CASH EQUIVALENTS
In ITAÚ UNIBANCO HOLDING it is composed of the following:
I t a ú U n i b a n c o S . A . – - September 0
75
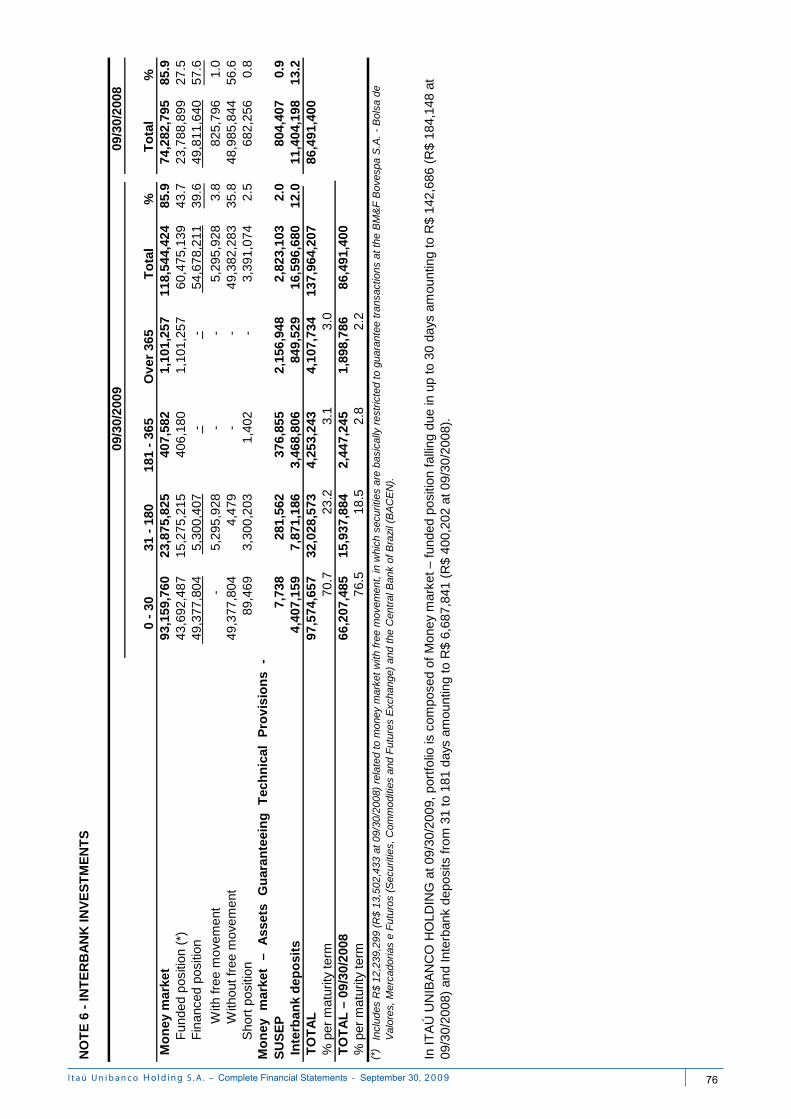
0 -
3031
- 1
8018
1 -
365
Ov
er 3
65T
ota
l%
To
tal
%93
,159
,760
23
,875
,825
407,
582
1,
101,
257
118,
544,
424
85
.974
,282
,795
85
.943
,692
,487
15,2
75,2
15
406,
180
1,
101,
257
60
,475
,139
43.7
23,7
88,8
99
27
.5 4
9,37
7,80
4 5
,300
,407
- -
54,
678,
211
39.6
49,
811,
640
57.6
With
fre
e m
ove
me
nt-
5,29
5,9
28
-
-
5,29
5,92
8
3.8
825,
796
1.0
With
out f
ree
mov
emen
t49
,377
,804
4,4
79
-
-
49,3
82,2
83
35
.848
,985
,844
56.6
89,4
69
3,
300
,203
1,40
2
-
3,39
1,07
4
2.5
682,
256
0.8
7,73
8
281
,562
37
6,85
5
2,15
6,94
8
2,82
3,10
3
2.0
804,
407
0.9
4,40
7,15
9
7,
871,
186
3,
468,
806
849,
529
16
,596
,680
12
.011
,404
,198
13
.297
,574
,657
32
,028
,573
4,25
3,24
3
4,
107,
734
137,
964,
207
86
,491
,400
70
.723
.23.
13.
066
,207
,485
15
,937
,884
2,44
7,24
5
1,
898,
786
86,4
91,4
00
76.5
18.5
2.8
2.2
(*)NO
TE
6 -
INT
ER
BA
NK
IN
VE
ST
ME
NT
S
Inte
rba
nk
de
po
sits
TO
TA
L
TO
TA
L –
09/
30/
2008
% p
er m
atur
ity t
erm
Incl
udes
R$
12,2
39,2
99 (
R$
13,5
02,4
33 a
t 09
/30/
2008
) re
late
d to
mon
ey m
arke
t w
ith f
ree
mov
emen
t, in
whi
ch s
ecur
ities
are
bas
ical
ly r
estr
icte
d to
gua
rant
ee t
rans
actio
ns a
t th
e B
M&
F B
oves
pa S
.A.
- B
olsa
de
Val
ores
, M
erca
doria
s e
Fut
uros
(S
ecur
ities
, C
omm
oditi
es a
nd F
utur
es E
xcha
nge)
and
the
Cen
tral
Ban
k of
Bra
zil (
BA
CE
N).
In IT
AÚ
UN
IBA
NC
O H
OLD
ING
at
09/3
0/20
09, p
ortf
olio
is c
ompo
sed
of M
oney
mar
ket –
fun
ded
posi
tion
falli
ng d
ue in
up
to 3
0 da
ys a
mou
ntin
g to
R$
142,
686
(R$
184,
148
at
09/3
0/20
08)
and
Inte
rban
k de
posi
ts f
rom
31
to 1
81 d
ays
amou
ntin
g to
R$
6,68
7,84
1 (R
$ 40
0,20
2 at
09/
30/2
008)
.
09/3
0/20
08
% p
er m
atur
ity t
erm
Fun
ded
posi
tion
(*)
Fin
ance
d po
sitio
n
Mo
ney
mar
ket
–A
sset
sG
uar
ante
ein
gT
ech
nic
alP
rov
isio
ns
-S
US
EP
09/3
0/20
09
Mo
ney
mar
ket
Sho
rt p
ositi
on
I t a ú U n i b a n c o S . A . – - September 0
76
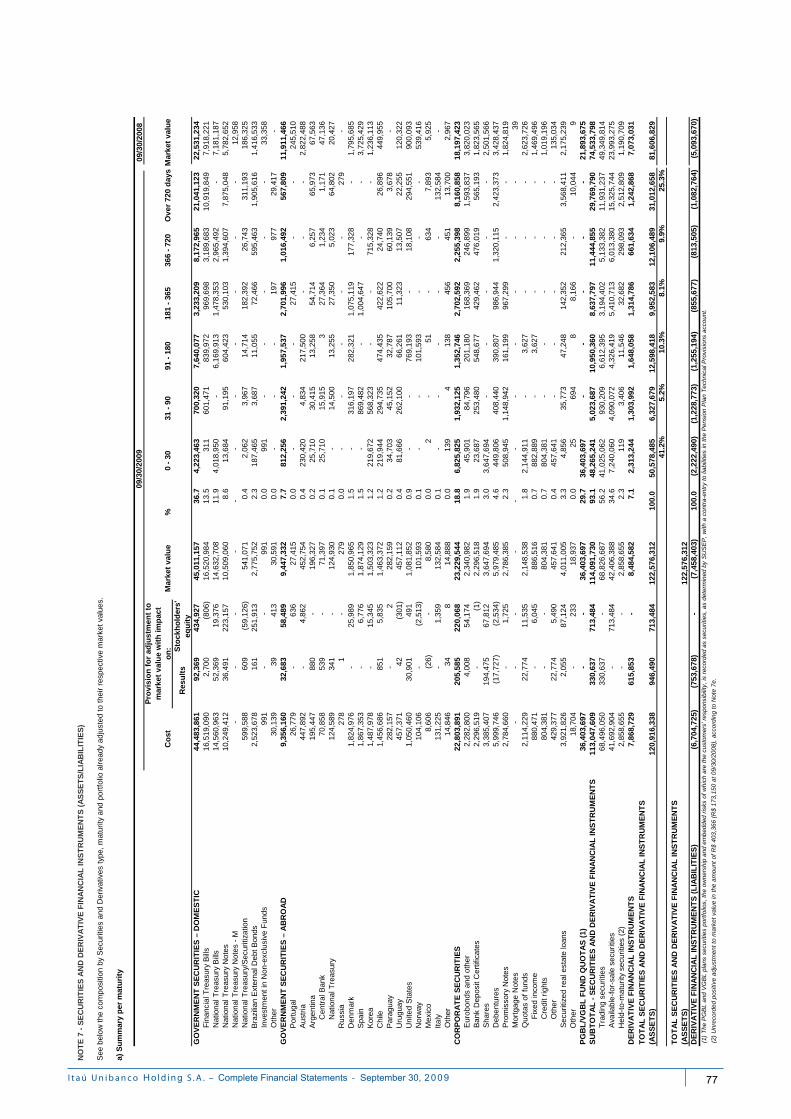
09/3
0/20
08
Res
ult
sS
tock
ho
lder
s'
equ
ity
44,4
83,8
61
92
,369
43
4,92
7
45,0
11,1
57
36
.74,
223,
463
700,
320
7,64
0,07
7
3,23
3,20
9
8,17
2,96
5
21
,041
,123
22
,531
,234
16
,519
,090
2,
700
(8
06)
16
,520
,984
13
.531
1
601,
471
83
9,97
2
969,
698
3,
189,
683
10,9
19,8
49
7,
918,
221
Nat
iona
l Tre
asur
y B
ills
14,5
60,9
63
52,3
69
19
,376
14,6
32,7
08
11.9
4,01
8,95
0
-
6,16
9,91
3
1,
478,
353
2,96
5,49
2
-
7,18
1,18
7
10
,249
,412
36
,491
223,
157
10
,509
,060
8.
613
,684
91,1
95
60
4,42
3
530,
103
1,
394,
607
7,87
5,04
8
5,78
2,65
2
-
-
-
-
-
-
-
-
-
-
-
12
,958
599,
588
60
9
(5
9,12
6)
54
1,07
1
0.4
2,06
2
3,
967
14,7
14
18
2,39
2
26,7
43
31
1,19
3
18
6,32
5
2,52
3,67
8
16
1
25
1,91
3
2,77
5,75
2
2.
318
7,46
5
3,68
7
11
,055
72,4
66
59
5,46
3
1,90
5,61
6
1,41
6,53
3
99
1
-
-
991
0.
099
1
-
-
-
-
-
33
,358
30,1
39
39
41
3
30
,591
0.
0-
-
-
197
97
7
29
,417
-
9,35
6,16
0
32,6
83
58,4
89
9,44
7,33
2
7.7
812,
256
2,
391,
242
1,
957,
537
2,
701,
996
1,
016,
492
567,
809
11
,911
,466
26
,779
-
636
27,4
15
0.0
-
-
-
27
,415
-
-
245,
510
44
7,89
2
-
4,
862
45
2,75
4
0.4
230,
420
4,
834
217,
500
-
-
-
2,82
2,48
8
19
5,44
7
880
-
19
6,32
7
0.2
25,7
10
30
,415
13,2
58
54
,714
6,25
7
65,9
73
67
,563
Cen
tral
Ban
k70
,858
53
9
-
71,3
97
0.1
25,7
10
15
,915
3
27,3
64
1,
234
1,
171
47
,136
Nat
iona
l Tre
asur
y12
4,58
9
341
-
12
4,93
0
0.1
-
14
,500
13,2
55
27
,350
5,02
3
64,8
02
20
,427
278
1
-
279
0.
0-
-
-
-
-
279
-
1,82
4,97
6
-
25,9
89
1,
850,
965
1.5
-
31
6,19
7
282,
321
1,
075,
119
177,
328
-
1,79
5,68
5
1,
867,
353
-
6,
776
1,
874,
129
1.5
-
86
9,48
2
-
1,
004,
647
-
-
3,72
5,42
9
1,
487,
978
-
15
,345
1,50
3,32
3
1.
221
9,67
2
568,
323
-
-
71
5,32
8
-
1,
236,
113
1,45
6,68
6
85
1
5,
835
1,
463,
372
1.2
219,
944
29
4,73
5
474,
435
42
2,62
2
24,7
40
26
,896
449,
955
28
2,15
7
-
2
28
2,15
9
0.2
34,7
03
45
,152
32,7
87
10
5,70
0
60,1
39
3,
678
-
45
7,37
1
42
(3
01)
45
7,11
2
0.4
81,6
66
26
2,10
0
66,2
61
11
,323
13,5
07
22
,255
120,
322
1,
050,
460
30,9
01
49
1
1,
081,
852
0.9
-
-
769,
193
-
18,1
08
29
4,55
1
90
0,09
3
104,
106
-
(2,5
13)
101,
593
0.
1-
-
10
1,59
3
-
-
-
53
9,41
6
8,60
6
(2
6)
-
8,58
0
0.
02
-
51
-
634
7,89
3
5,92
5
13
1,22
5
-
1,
359
13
2,58
4
0.1
-
-
-
-
-
13
2,58
4
-
14
,846
34
8
14,8
88
0.0
139
4
13
8
456
45
1
13
,700
2,96
7
22
,803
,891
205,
585
22
0,06
8
23,2
29,5
44
18
.86,
825,
825
1,93
2,12
5
1,35
2,74
6
2,70
2,59
2
2,25
5,39
8
8,
160,
858
18,1
97,4
23
2,28
2,80
0
4,
008
54
,174
2,34
0,98
2
1.
945
,901
84,7
96
20
1,18
0
168,
369
24
6,89
9
1,59
3,83
7
3,82
0,02
3
2,
296,
519
-
(1
)
2,29
6,51
8
1.
923
,687
253,
480
54
8,67
7
429,
462
47
6,01
9
565,
193
1,82
3,56
5
3,
385,
407
194,
475
67
,812
3,64
7,69
4
3.
03,
647,
694
-
-
-
-
-
2,
501,
566
5,99
9,74
6
(1
7,72
7)
(2
,534
)
5,
979,
485
4.6
449,
806
40
8,44
0
390,
807
98
6,94
4
1,32
0,11
5
2,
423,
373
3,
428,
437
2,78
4,66
0
-
1,72
5
2,78
6,38
5
2.
350
8,94
5
1,14
8,94
2
16
1,19
9
967,
299
-
-
1,
824,
819
-
-
-
-
-
-
-
-
-
-
-
39
2,
114,
229
22,7
74
11
,535
2,14
8,53
8
1.
82,
144,
911
-
3,
627
-
-
-
2,
623,
726
Fix
ed in
com
e88
0,47
1
-
6,
045
88
6,51
6
0.7
882,
889
-
3,62
7
-
-
-
1,46
9,49
6
C
redi
t rig
hts
804,
381
-
-
80
4,38
1
0.7
804,
381
-
-
-
-
-
1,01
9,19
6
O
ther
429,
377
22
,774
5,49
0
457,
641
0.
445
7,64
1
-
-
-
-
-
13
5,03
4
3,92
1,82
6
2,
055
87
,124
4,01
1,00
5
3.
34,
856
35,7
73
47
,248
142,
352
21
2,36
5
3,56
8,41
1
2,17
5,23
9
18
,704
-
233
18,9
37
0.0
25
69
4
8
8,16
6
-
10,0
44
9
36
,403
,697
-
-
36,4
03,6
97
29
.736
,403
,697
-
-
-
-
-
21
,893
,675
11
3,04
7,60
9
33
0,63
7
713,
484
11
4,09
1,73
0
93
.148
,265
,241
5,
023,
687
10
,950
,360
8,
637,
797
11
,444
,855
29
,769
,790
74
,533
,798
68
,496
,050
33
0,63
7
-
68
,826
,687
56
.241
,025
,062
93
0,20
9
6,61
2,39
5
3,
194,
402
5,13
3,38
2
11
,931
,237
49,3
49,8
14
41,6
92,9
04
-
71
3,48
4
42,4
06,3
88
34.6
7,24
0,06
0
4,
090,
072
4,32
6,41
9
5,
410,
713
6,01
3,38
0
15
,325
,744
23,9
93,2
75
2,85
8,65
5
-
-
2,
858,
655
2.3
119
3,
406
11,5
46
32
,682
298,
093
2,
512,
809
1,
190,
709
7,86
8,72
9
615,
853
-
8,
484,
582
7.
12,
313,
244
1,30
3,99
2
1,64
8,05
8
1,31
4,78
6
661,
634
1,
242,
868
7,07
3,03
1
120,
916,
338
946,
490
71
3,48
4
122,
576,
312
100.
0
50
,578
,485
6,
327,
679
12,5
98,4
18
9,95
2,58
3
12
,106
,489
31,0
12,6
58
81
,606
,829
41
.2%
5.2%
10.3
%8.
1%9.
9%25
.3%
122,
576,
312
(6,7
04,7
25)
(7
53,6
78)
-
(7,4
58,4
03)
10
0.0
(2
,222
,490
)
(1
,228
,773
)
(1,2
55,1
94)
(8
55,6
77)
(813
,505
)
(1
,082
,764
)
(5,0
93,6
70)
(
1) T
he P
GB
L a
nd V
GB
L p
lans
se
curi
ties
por
tfo
lios,
th
e o
wn
ersh
ip a
nd
em
bed
ded
ris
ks o
f w
hic
h a
re t
he
cust
omer
s’ r
esp
ons
ibili
ty,
is r
eco
rde
d a
s se
curit
ies,
as
dete
rmin
ed b
y S
US
EP
, w
ith a
con
tra-
entr
y to
lia
bilit
ies
in t
he
Pe
nsio
n P
lan
Te
chn
ica
l Pro
visi
ons
acco
unt
.
(2)
Unr
eco
rde
d p
ositi
ve a
djus
tmen
t to
mar
ket
valu
e in
the
am
oun
t of
R$
403
,36
6 (R
$ 1
73,1
50
at
09/
30/2
008
), a
cco
rdin
g to
Not
e 7
e.
TO
TA
L S
EC
UR
ITIE
S A
ND
DE
RIV
AT
IVE
FIN
AN
CIA
L IN
ST
RU
ME
NT
S
(AS
SE
TS
)D
ER
IVA
TIV
E F
INA
NC
IAL
INS
TR
UM
EN
TS
(L
IAB
ILIT
IES
)
TO
TA
L S
EC
UR
ITIE
S A
ND
DE
RIV
AT
IVE
FIN
AN
CIA
L IN
ST
RU
ME
NT
S
(AS
SE
TS
)
Oth
er
SU
BT
OT
AL
- S
EC
UR
ITIE
S A
ND
DE
RIV
AT
IVE
FIN
AN
CIA
L IN
ST
RU
ME
NT
S
Hel
d-to
-mat
urity
sec
uriti
es (
2)A
vaila
ble-
for-
sale
sec
uriti
es
PG
BL
/VG
BL
FU
ND
QU
OT
AS
(1
)
DE
RIV
AT
IVE
FIN
AN
CIA
L IN
ST
RU
ME
NT
S
Tra
ding
sec
uriti
es
Chi
le K
orea
Oth
erG
OV
ER
NM
EN
T S
EC
UR
ITIE
S –
AB
RO
AD
Arg
entin
a A
ustr
ia
Den
mar
k S
pain
Por
tuga
l
Rus
sia
GO
VE
RN
ME
NT
SE
CU
RIT
IES
– D
OM
ES
TIC
Bra
zilia
n E
xter
nal D
ebt B
onds
Inve
stm
ent i
n N
on-e
xclu
sive
Fun
ds
Fin
anci
al T
reas
ury
Bill
s
Nat
iona
l Tre
asur
y N
otes
Nat
iona
l Tre
asur
y N
otes
- M
Nat
iona
l Tre
asur
y/S
ecur
itiza
tion
366
- 72
0O
ver
720
day
sM
arke
t v
alu
eM
arke
t v
alu
e0
- 30
31 -
90
%18
1 -
365
Uni
ted
Sta
tes
Mex
ico
NO
TE
7 -
SE
CU
RIT
IES
AN
D D
ER
IVA
TIV
E F
INA
NC
IAL
INS
TR
UM
EN
TS
(A
SS
ET
S/L
IAB
ILIT
IES
)
See
bel
ow th
e co
mpo
sitio
n by
Sec
uriti
es a
nd D
eriv
ativ
es ty
pe, m
atur
ity a
nd p
ortf
olio
alr
eady
adj
uste
d to
thei
r re
spec
tive
mar
ket v
alue
s.
a) S
um
mar
y p
er m
atu
rity
09/3
0/20
09P
rov
isio
n f
or
adju
stm
ent
to
mar
ket
val
ue
wit
h im
pac
t o
n:
91 -
180
Co
st
Ban
k D
epos
it C
ertif
icat
es
Oth
er It
aly
Nor
way
Par
agua
y
Pro
mis
sory
Not
esM
ortg
age
Not
es
Sec
uriti
zed
real
est
ate
loan
s
Eur
obon
ds a
nd o
ther
Quo
tas
of f
unds
Uru
guay
Sha
res
Deb
entu
res
CO
RP
OR
AT
E S
EC
UR
ITIE
S
I t a ú U n i b a n c o S . A . – - September 0
77
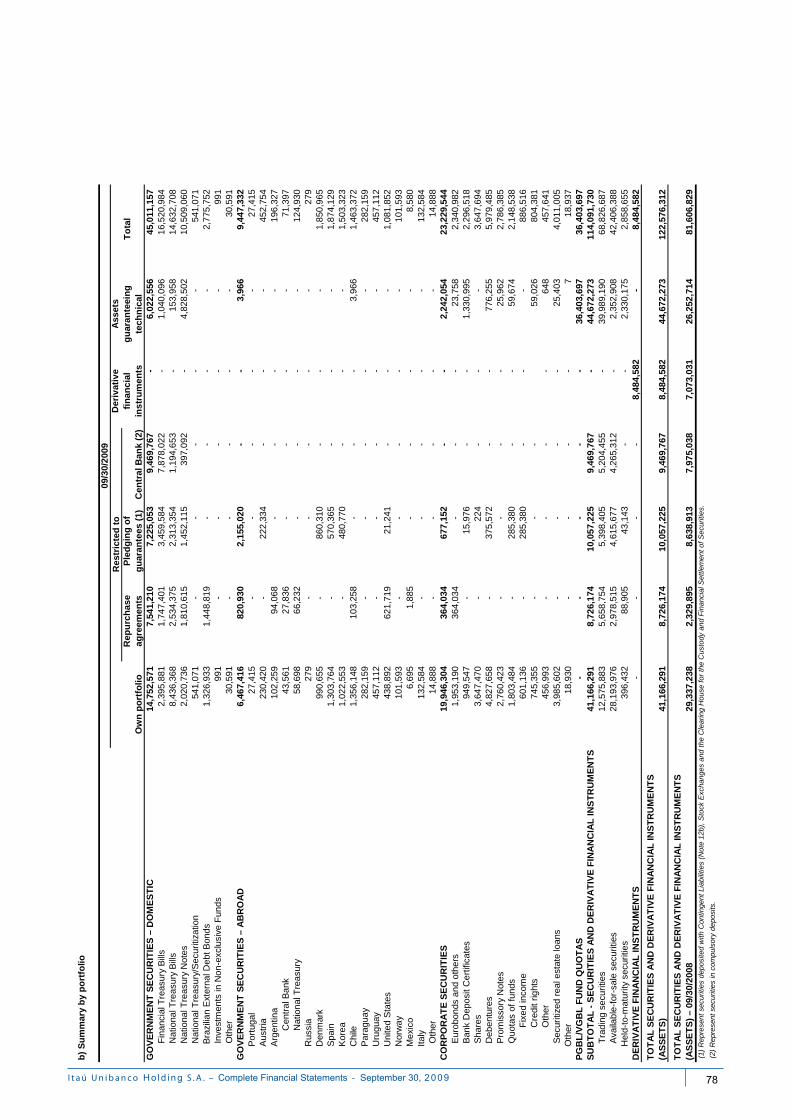
14,7
52,5
71
7
,54
1,2
10
7,
225,
053
9
,46
9,7
67
-
6,
022,
556
4
5,0
11,1
57
2,
395,
881
1,7
47,
401
3,
459,
584
7
,87
8,0
22
-
1,
040,
096
1
6,5
20,9
84
8,
436,
368
2,5
34,
375
2,
313,
354
1
,19
4,6
53
-
15
3,95
8
1
4,6
32,7
08
2,
020,
736
1,8
10,
615
1,
452,
115
39
7,0
92
-
4,82
8,50
2
10,
509
,060
541,
071
-
-
-
-
-
5
41,0
71
1,
326,
933
1,4
48,
819
-
-
-
-
2,7
75,7
52
991
-
-
-
-
-
99
1
30,5
91
-
-
-
-
-
30,5
91
6,46
7,41
6
820,
930
2,15
5,02
0
-
-
3,
966
9,4
47,3
32
27,4
15
-
-
-
-
-
27,4
15
230,
420
-
222,
334
-
-
-
452
,754
102,
259
94,
068
-
-
-
-
196
,327
Cen
tra
l Ba
nk43
,561
27,
836
-
-
-
-
71,3
97
Nat
iona
l Tre
asu
ry58
,698
66,
232
-
-
-
-
124
,930
279
-
-
-
-
-
27
9
990,
655
-
860,
310
-
-
-
1,8
50,9
65
1,30
3,76
4
-
57
0,36
5
-
-
-
1,
874
,129
1,
022,
553
-
480,
770
-
-
-
1,5
03,3
23
1,35
6,14
8
10
3,2
58
-
-
-
3,
966
1,4
63,3
72
282,
159
-
-
-
-
-
2
82,1
59
45
7,11
2
-
-
-
-
-
457
,112
438,
892
621,
719
21,2
41
-
-
-
1,0
81,8
52
101,
593
-
-
-
-
-
1
01,5
93
6,
695
1,
885
-
-
-
-
8,
580
13
2,58
4
-
-
-
-
-
132
,584
14,8
88
-
-
-
-
-
14,8
88
19,9
46,3
04
36
4,0
34
67
7,15
2
-
-
2,24
2,05
4
23,
229
,544
1,95
3,19
0
36
4,0
34
-
-
-
23
,758
2,
340
,982
94
9,54
7
-
15
,976
-
-
1,33
0,99
5
2,2
96,5
18
3,64
7,47
0
-
22
4
-
-
-
3,
647
,694
4,
827,
658
-
375,
572
-
-
77
6,25
5
5,
979
,485
2,
760,
423
-
-
-
-
25,9
62
2,7
86,3
85
1,80
3,48
4
-
28
5,38
0
-
-
59,6
74
2,1
48,5
38
Fix
ed
inco
me
601,
136
-
285,
380
-
-
-
886
,516
Cre
dit r
ight
s 74
5,35
5
-
-
-
59
,026
8
04,3
81
O
ther
45
6,99
3
-
-
-
-
64
8
457
,641
3,98
5,60
2
-
-
-
-
25
,403
4,
011
,005
18
,930
-
-
-
-
7
18,9
37
-
-
-
-
-
36
,403
,697
36,
403
,697
41,1
66,2
91
8
,72
6,1
74
10
,057
,225
9,4
69,
767
-
44,6
72,2
73
11
4,0
91,7
30
12
,575
,883
5,6
58,
754
5,
398,
405
5
,20
4,4
55
-
39
,989
,190
68,
826
,687
28,1
93,9
76
2
,97
8,5
15
4,61
5,67
7
4,2
65,
312
-
2,35
2,90
8
42,
406
,388
396,
432
88,
905
43
,143
-
-
2,33
0,17
5
2,8
58,6
55
-
-
-
-
8,48
4,58
2
-
8,
484
,582
41,1
66,2
91
8
,72
6,1
74
10,0
57,2
25
9
,46
9,7
67
8,
484,
582
44,6
72,2
73
12
2,5
76,3
12
29,3
37,2
38
2
,32
9,8
95
8,63
8,91
3
7,9
75,
038
7,07
3,03
1
26
,252
,714
81,
606
,829
Deb
entu
res
PG
BL
/VG
BL
FU
ND
QU
OT
AS
SU
BT
OT
AL
- S
EC
UR
ITIE
S A
ND
DE
RIV
AT
IVE
FIN
AN
CIA
L IN
ST
RU
ME
NT
S
Ava
ilab
le-f
or-s
ale
secu
ritie
sT
radi
ng s
ecu
ritie
s
Pro
mis
sory
Not
esQ
uota
s of
fun
ds
Sec
uriti
zed
rea
l est
ate
loan
s
Sha
res
Rus
sia
Por
tuga
l
Nor
wa
y
Chi
le
Den
mar
kS
pain
Kor
ea
Ban
k D
epos
it C
ert
ifica
tes
Eur
obo
nds
and
oth
ers
CO
RP
OR
AT
E S
EC
UR
ITIE
S
Inve
stm
ents
in N
on-e
xclu
sive
Fun
ds
GO
VE
RN
ME
NT
SE
CU
RIT
IES
– A
BR
OA
D
Aus
tria
Arg
ent
ina
Oth
er
Uru
gua
yP
ara
guay
Uni
ted
Sta
tes
Mex
ico
Italy
Rep
urc
ha
se
ag
reem
ents
Ow
n p
ort
folio
Der
ivat
ive
fin
anci
al
ins
tru
men
tsP
led
gin
g o
f g
uar
ante
es (
1)
Ot h
er
Nat
iona
l Tre
asur
y/S
ecur
itiza
tion
Nat
iona
l Tre
asur
y N
otes
Bra
zilia
n E
xter
nal D
ebt B
ond
s
Nat
iona
l Tre
asur
y B
ills
b)
Su
mm
ary
by
po
rtfo
lio
GO
VE
RN
ME
NT
SE
CU
RIT
IES
– D
OM
ES
TIC
Fin
anci
al T
reas
ury
Bill
s
09/
30/
200
9R
estr
icte
d t
oA
sset
s g
uar
ante
ein
g
tech
nic
al
To
tal
Cen
tra
l Ban
k (2
)
(2)
Rep
rese
nt s
ecur
ities
in c
ompu
lsor
y de
posi
ts.
Oth
er
TO
TA
L S
EC
UR
ITIE
S A
ND
DE
RIV
AT
IVE
FIN
AN
CIA
L IN
ST
RU
ME
NT
S
(AS
SE
TS
)
TO
TA
L S
EC
UR
ITIE
S A
ND
DE
RIV
AT
IVE
FIN
AN
CIA
L IN
ST
RU
ME
NT
S
(AS
SE
TS
) –
09/3
0/20
08 (
1) R
epre
sent
sec
uriti
es d
epos
ited
with
Con
tinge
nt L
iabi
litie
s (N
ote
12b)
, S
tock
Exc
hang
es a
nd t
he C
lear
ing
Hou
se f
or t
he C
usto
dy a
nd F
inan
cial
Set
tlem
ent
of S
ecur
ities
.
DE
RIV
AT
IVE
FIN
AN
CIA
L I
NS
TR
UM
EN
TS
Hel
d-to
-mat
urity
sec
uriti
es
I t a ú U n i b a n c o S . A . – - September 0
78
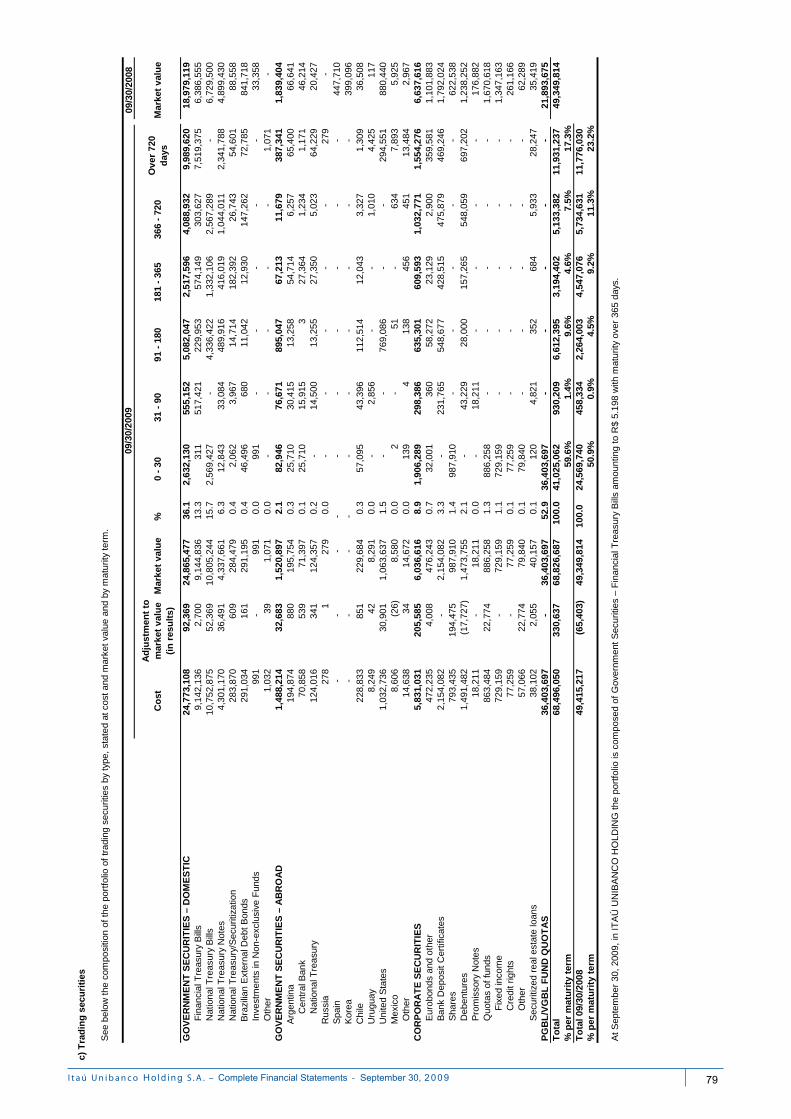
09/3
0/20
08
Co
stA
dju
stm
ent
to
mar
ket
val
ue
(in
res
ult
s)M
arke
t v
alu
e %
0 -
3031
- 9
091
- 1
8018
1 -
365
366
- 72
0O
ver
720
d
ays
Mar
ket
val
ue
24,7
73,1
08
92
,369
24
,865
,477
36
.12,
632,
130
555,
152
5,08
2,04
7
2,51
7,59
6
4,08
8,93
2
9,98
9,62
0
1
8,97
9,11
9
9,
142,
136
2,70
0
9,14
4,83
6
13
.331
1
517,
421
22
9,95
3
574,
149
30
3,62
7
7,51
9,37
5
6,
386,
555
10
,752
,875
5
2,36
9
10
,805
,244
15.7
2,56
9,42
7
-
4,33
6,42
2
1,
332,
106
2,56
7,28
9
-
6,72
9,50
0
4,30
1,17
0
36
,491
4,33
7,66
1
6.
312
,843
33
,084
489,
916
41
6,01
9
1,04
4,01
1
2,
341,
788
4,89
9,43
0
283,
870
60
9
28
4,47
9
0.4
2,06
2
3,
967
14,7
14
18
2,39
2
26,7
43
54
,601
88,5
58
29
1,03
4
161
291,
195
0.
446
,496
68
0
11,0
42
12
,930
147,
262
72
,785
841,
718
991
-
991
0.0
991
-
-
-
-
-
33,3
58
1,
032
39
1,
071
0.
0-
-
-
-
-
1,
071
-
1,48
8,21
4
32,6
83
1,52
0,89
7
2.
182
,946
76
,671
89
5,04
7
67
,213
11
,679
38
7,34
1
1,83
9,40
4
194,
874
88
0
19
5,75
4
0.3
25,7
10
30,4
15
13
,258
54,7
14
6,
257
65,4
00
66
,641
Cen
tral
Ban
k70
,858
53
9
71
,397
0.1
25,7
10
15,9
15
3
27
,364
1,23
4
1,
171
46
,214
Nat
iona
l Tre
asur
y12
4,01
6
341
124,
357
0.
2-
14
,500
13,2
55
27
,350
5,02
3
64
,229
20,4
27
27
8
1
279
0.0
-
-
-
-
-
279
-
-
-
-
-
-
-
-
-
-
-
44
7,71
0
-
-
-
-
-
-
-
-
-
-
39
9,09
6
22
8,83
3
851
229,
684
0.
357
,095
43
,396
112,
514
12
,043
3,32
7
1,
309
36
,508
8,24
9
42
8,29
1
0.0
-
2,85
6
-
-
1,
010
4,42
5
117
1,03
2,73
6
30
,901
1,06
3,63
7
1.
5-
-
769,
086
-
-
29
4,55
1
880,
440
8,60
6
(2
6)
8,
580
0.
02
-
51
-
63
4
7,89
3
5,92
5
14,
638
34
14,6
72
0.
013
9
4
138
45
6
451
13
,484
2,96
7
5,83
1,03
1
205,
585
6,
036,
616
8.9
1,90
6,28
9
29
8,38
6
63
5,30
1
60
9,59
3
1,
032,
771
1,
554,
276
6,63
7,61
6
472,
235
4,
008
47
6,24
3
0.7
32,0
01
360
58
,272
23,1
29
2,
900
359,
581
1,
101,
883
2,
154,
082
-
2,
154,
082
3.3
-
231,
765
54
8,67
7
428,
515
47
5,87
9
469,
246
1,
792,
024
79
3,43
5
194,
475
98
7,91
0
1.4
987,
910
-
-
-
-
-
622,
538
1,49
1,48
2
(1
7,72
7)
1,
473,
755
2.1
-
43,2
29
28
,000
157,
265
54
8,05
9
697,
202
1,
238,
252
1
8,21
1
-
18
,211
0.0
-
18,2
11
-
-
-
-
17
6,88
2
86
3,48
4
22,7
74
88
6,25
8
1.3
886,
258
-
-
-
-
-
1,67
0,61
8
Fix
ed
inco
me
72
9,15
9
-
72
9,15
9
1.1
729,
159
-
-
-
-
-
1,34
7,16
3
Cre
dit r
ight
s 77
,259
-
77,2
59
0.
177
,259
-
-
-
-
-
261,
166
Oth
er
57,0
66
22,7
74
79
,840
0.1
79,8
40
-
-
-
-
-
62
,289
38,
102
2,
055
40
,157
0.1
120
4,
821
352
68
4
5,93
3
28
,247
35,4
19
36
,403
,697
-
36,4
03,6
97
52.9
36,4
03,6
97
-
-
-
-
-
21,8
93,6
75
68
,496
,050
330,
637
68
,826
,687
10
0.0
41,0
25,0
62
930,
209
6,61
2,39
5
3,19
4,40
2
5,13
3,38
2
11,9
31,2
37
49,
349,
814
59.6
%1.
4%9.
6%4.
6%7.
5%17
.3%
49,4
15,2
17
(6
5,40
3)
49,3
49,8
14
100.
024
,569
,740
45
8,33
4
2,
264,
003
4,
547,
076
5,
734,
631
11
,776
,030
50
.9%
0.9%
4.5%
9.2%
11.3
%23
.2%
At S
epte
mbe
r 30
, 200
9, in
ITA
Ú U
NIB
AN
CO
HO
LDIN
G th
e po
rtfo
lio is
com
pose
d of
Gov
ernm
ent S
ecur
ities
– F
inan
cial
Tre
asur
y B
ills
amou
ntin
g to
R$
5.19
8 w
ith m
atur
ity o
ver
365
days
.
GO
VE
RN
ME
NT
SE
CU
RIT
IES
– D
OM
ES
TIC
Fin
anci
al T
reas
ury
Bill
sN
atio
nal T
reas
ury
Bill
s
c) T
rad
ing
sec
uri
ties
See
bel
ow th
e co
mpo
sitio
n of
the
port
folio
of
trad
ing
secu
ritie
s by
typ
e, s
tate
d at
cos
t and
mar
ket v
alue
and
by
mat
urity
term
.
09/3
0/20
09
Nat
iona
l Tre
asur
y N
otes
Nat
iona
l Tre
asur
y/S
ecur
itiza
tion
Bra
zilia
n E
xter
nal D
ebt B
onds
Inve
stm
en
ts in
Non
-exc
lusi
ve F
und
sO
ther
GO
VE
RN
ME
NT
SE
CU
RIT
IES
– A
BR
OA
DA
rgen
tina
Rus
sia
Spa
inK
orea
Chi
leU
rugu
ayU
nite
d S
tate
sM
exic
oO
ther
CO
RP
OR
AT
E S
EC
UR
ITIE
SE
urob
o nds
and
oth
erB
ank
Dep
osit
Cer
tific
ates
Sha
res
Deb
entu
res
Pro
mis
sory
Not
esQ
uota
s of
fun
ds
Sec
uriti
zed
real
est
ate
loan
s
PG
BL
/VG
BL
FU
ND
QU
OT
AS
To
tal
% p
er m
atu
rity
ter
mT
ota
l 09/
30/2
008
% p
er m
atu
rity
ter
m
I t a ú U n i b a n c o S . A . – - September 0
79
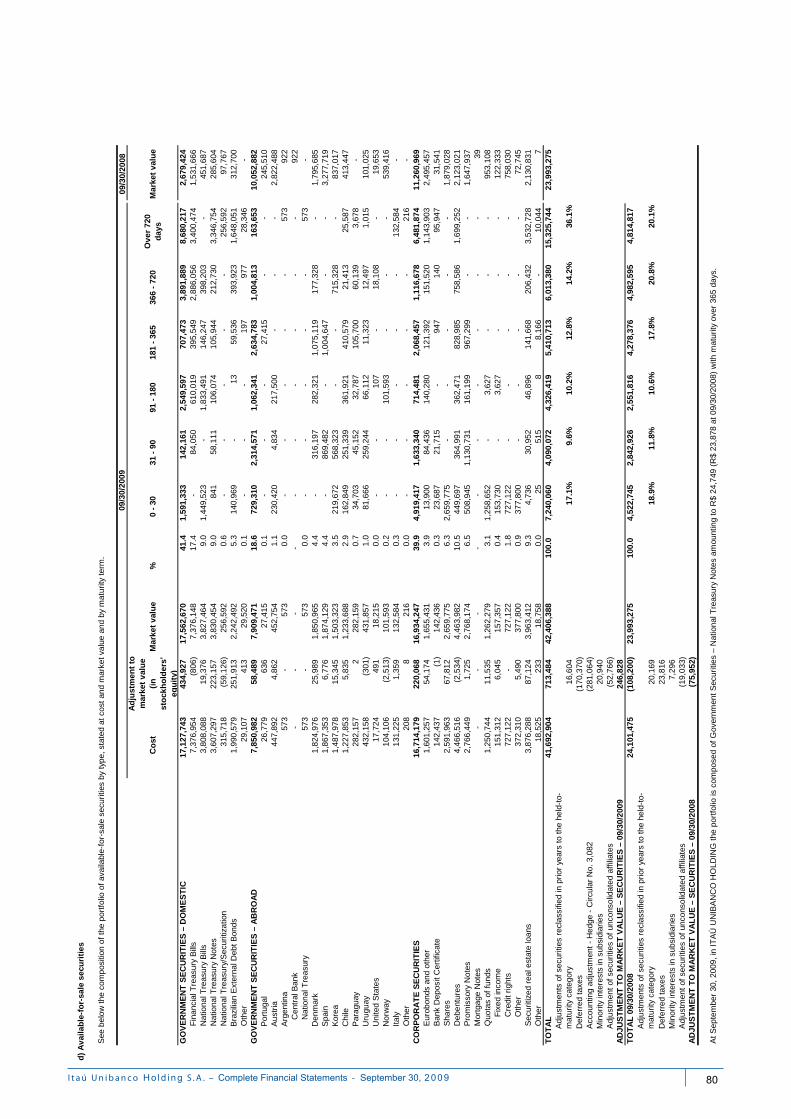
09/3
0/20
08
Co
st
Ad
just
me
nt
to
mar
ket
val
ue
(in
s
tock
ho
lde
rs'
equ
ity)
Mar
ket
val
ue
%0
- 30
31 -
90
91 -
180
181
- 36
536
6 -
720
Ov
er 7
20
day
sM
arke
t v
alu
e
17,1
27,7
43
43
4,92
7
17,5
62,6
70
41.4
1,59
1,33
3
142,
161
2,
549,
597
70
7,47
3
3,
891,
889
8,
680,
217
2,67
9,42
4
7,
376,
954
(806
)
7,37
6,14
8
17
.4-
84
,050
610,
019
39
5,54
9
2,88
6,05
6
3,
400,
474
1,53
1,66
6
3,80
8,08
8
19
,376
3,82
7,46
4
9.
01,
449,
523
-
1,
833,
491
146,
247
39
8,20
3
-
45
1,68
7
3,
607,
297
223,
157
3,
830,
454
9.0
841
58
,111
106,
074
10
5,94
4
212,
730
3,
346,
754
285,
604
315,
718
(5
9,12
6)
25
6,59
2
0.6
-
-
-
-
-
256,
592
97
,767
1,99
0,57
9
25
1,91
3
2,24
2,49
2
5.
314
0,96
9
-
13
59,5
36
39
3,92
3
1,64
8,05
1
31
2,70
0
29
,107
41
3
29
,520
0.1
-
-
-
197
97
7
28,3
46
-
7,85
0,98
2
58,4
89
7,90
9,47
1
18
.672
9,31
0
2,
314,
571
1,06
2,34
1
2,63
4,78
3
1,00
4,81
3
163,
653
10
,052
,882
26
,779
63
6
27
,415
0.1
-
-
-
27,4
15
-
-
24
5,51
0
44
7,89
2
4,86
2
452,
754
1.
123
0,42
0
4,83
4
21
7,50
0
-
-
-
2,
822,
488
57
3
-
57
3
0.
0-
-
-
-
-
57
3
92
2
C
entr
al B
ank
-
-
-
-
-
-
-
-
-
-
92
2
N
atio
nal T
reas
ury
573
-
573
0.0
-
-
-
-
-
573
-
1,
824,
976
25,9
89
1,
850,
965
4.4
-
316,
197
28
2,32
1
1,07
5,11
9
17
7,32
8
-
1,
795,
685
1,
867,
353
6,77
6
1,87
4,12
9
4.
4-
86
9,48
2
-
1,
004,
647
-
-
3,27
7,71
9
1,48
7,97
8
15
,345
1,50
3,32
3
3.
521
9,67
2
568,
323
-
-
71
5,32
8
-
83
7,01
7
1,
227,
853
5,83
5
1,23
3,68
8
2.
916
2,84
9
251,
339
36
1,92
1
410,
579
21
,413
25,5
87
41
3,44
7
28
2,15
7
2
282,
159
0.
734
,703
45
,152
32,7
87
10
5,70
0
60,1
39
3,
678
-
432,
158
(3
01)
43
1,85
7
1.0
81,6
66
259,
244
66
,112
11,3
23
12
,497
1,01
5
101,
025
17,7
24
491
18,2
15
0.
0-
-
107
-
18,1
08
-
19,6
53
10
4,10
6
(2,5
13)
101,
593
0.
2-
-
101,
593
-
-
-
539,
416
131,
225
1,
359
13
2,58
4
0.3
-
-
-
-
-
132,
584
-
208
8
21
6
0.
0-
-
-
-
-
21
6
-
16,7
14,1
79
22
0,06
8
16,9
34,2
47
39.9
4,91
9,41
7
1,63
3,34
0
71
4,48
1
2,
068,
457
1,
116,
678
6,
481,
874
11,2
60,9
69
1,60
1,25
7
54
,174
1,65
5,43
1
3.
913
,900
84
,436
140,
280
12
1,39
2
151,
520
1,
143,
903
2,49
5,45
7
142,
437
(1
)
142,
436
0.
323
,687
21
,715
-
94
7
140
95
,947
31,5
41
2,
591,
963
67,8
12
2,
659,
775
6.3
2,65
9,77
5
-
-
-
-
-
1,87
9,02
8
4,46
6,51
6
(2
,534
)
4,46
3,98
2
10
.544
9,69
7
364,
991
36
2,47
1
828,
985
75
8,58
6
1,69
9,25
2
2,
123,
021
2,
766,
449
1,72
5
2,76
8,17
4
6.
550
8,94
5
1,13
0,73
1
16
1,19
9
967,
299
-
-
1,
647,
937
-
-
-
-
-
-
-
-
-
-
39
1,25
0,74
4
11
,535
1,26
2,27
9
3.
11,
258,
652
-
3,
627
-
-
-
95
3,10
8
F
ixed
inco
me
151,
312
6,
045
15
7,35
7
0.4
153,
730
-
3,62
7
-
-
-
122,
333
Cre
dit r
ight
s72
7,12
2
-
72
7,12
2
1.8
727,
122
-
-
-
-
-
758,
030
Oth
er37
2,31
0
5,49
0
377,
800
0.
937
7,80
0
-
-
-
-
-
72
,745
3,87
6,28
8
87
,124
3,96
3,41
2
9.
34,
736
30,9
52
46
,896
141,
668
20
6,43
2
3,53
2,72
8
2,
130,
831
18
,525
23
3
18
,758
0.0
25
51
5
8
8,16
6
-
10,0
44
7
41
,692
,904
713,
484
42
,406
,388
10
0.0
7,
240,
060
4,
090,
072
4,32
6,41
9
5,41
0,71
3
6,01
3,38
0
15,3
25,7
44
23,9
93,2
75
16,6
04
17
.1%
9.6%
10.2
%12
.8%
14.2
%36
.1%
(170
,370
)
(2
81,0
64)
20
,940
(5
2,76
6)
246,
828
24
,101
,475
(108
,200
)
23
,993
,275
10
0.0
4,
522,
745
2,
842,
926
2,55
1,81
6
4,27
8,37
6
4,98
2,59
5
4,81
4,81
7
20,1
69
18
.9%
11.8
%10
.6%
17.8
%20
.8%
20.1
%23
,816
7,29
6
(19,
033)
(7
5,95
2)
Oth
erT
OT
AL
Pro
mis
sory
Not
esM
ortg
age
Not
esQ
uota
s of
fun
ds
Sec
uriti
zed
real
est
ate
loan
s
Eur
obon
ds a
nd o
ther
Ban
k D
epos
it C
ertif
icat
eS
hare
sD
eben
ture
s
Uni
ted
Sta
tes
Nor
way
Oth
erC
OR
PO
RA
TE
SE
CU
RIT
IES
Kor
ea C
hile
Par
agua
y U
rugu
ay
Nat
iona
l Tre
asur
y/S
ecur
itiza
tion
Bra
zilia
n E
xter
nal D
ebt B
onds
d)
Av
aila
ble
-fo
r-sa
le s
ecu
riti
es
See
bel
ow th
e co
mpo
sitio
n of
the
port
folio
of
avai
labl
e-fo
r-sa
le s
ecur
ities
by
type
, sta
ted
at c
ost a
nd m
arke
t val
ue a
nd b
y m
atur
ity t
erm
.
09/3
0/20
09
GO
VE
RN
ME
NT
SE
CU
RIT
IES
– D
OM
ES
TIC
Fin
anci
al T
reas
ury
Bill
sN
atio
nal T
reas
ury
Bill
sN
atio
nal T
reas
ury
Not
es
Oth
er
Ital
y
Adj
ustm
ents
of
secu
ritie
s re
clas
sifie
d in
prio
r ye
ars
to t
he h
eld-
to-
mat
urity
cat
egor
yD
efer
red
taxe
s
GO
VE
RN
ME
NT
SE
CU
RIT
IES
– A
BR
OA
D P
ortu
gal
Aus
tria
Arg
entin
a
Den
mar
k S
pain
Acc
ount
ing
adju
stm
ent
- H
edge
- C
ircul
ar N
o. 3
,082
Min
ority
inte
rest
s in
sub
sidi
arie
sA
djus
tmen
t of
sec
uriti
es o
f un
cons
olid
ated
aff
iliat
esA
DJU
ST
ME
NT
TO
MA
RK
ET
VA
LU
E –
SE
CU
RIT
IES
– 0
9/30
/200
9T
OT
AL
09/
30/2
008
Adj
ustm
ents
of
secu
ritie
s re
clas
sifie
d in
prio
r ye
ars
to t
he h
eld-
to-
mat
urity
cat
egor
yD
efer
red
taxe
sM
inor
ity in
tere
sts
in s
ubsi
diar
ies
Adj
ustm
ent
of s
ecur
ities
of
unco
nsol
idat
ed a
ffili
ates
AD
JUS
TM
EN
T T
O M
AR
KE
T V
AL
UE
– S
EC
UR
ITIE
S –
09/
30/2
008
At S
epte
mbe
r 30
, 200
9, in
ITA
Ú U
NIB
AN
CO
HO
LDIN
G th
e po
rtfo
lio is
com
pose
d of
Gov
ernm
ent
Sec
uriti
es –
Nat
iona
l Tre
asur
y N
otes
am
ount
ing
to R
$ 24
,749
(R
$ 23
,878
at 0
9/30
/200
8) w
ith m
atur
ity o
ver
365
days
.
I t a ú U n i b a n c o S . A . – - September 0
80
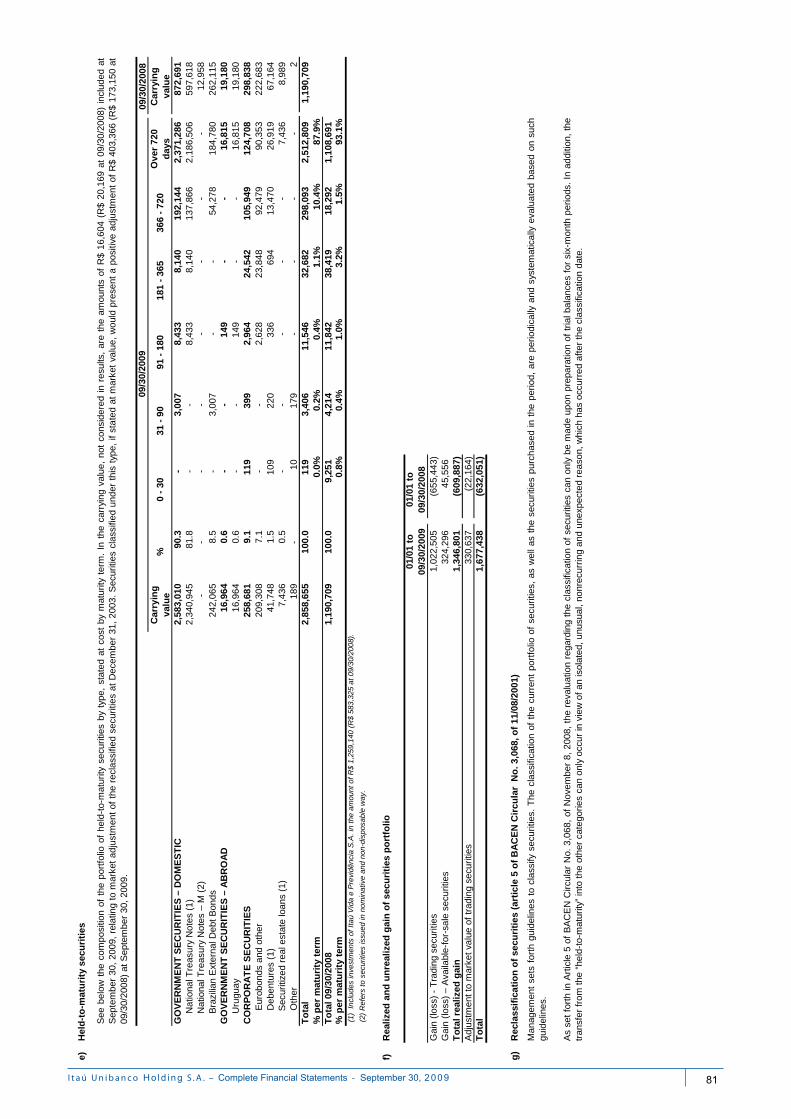
e)
09/3
0/20
08C
arry
ing
v
alu
e%
0 -
3031
- 9
091
- 1
8018
1 -
365
366
- 72
0O
ver
720
d
ays
Car
ryin
g
val
ue
2,58
3,01
090
.3
-
3,
007
8,43
3
8,14
0
192,
144
2,37
1,28
6
87
2,69
1
2,34
0,94
5
81.8
-
-
8,
433
8,
140
137,
866
2,
186,
506
597,
618
-
-
-
-
-
-
-
-
12,9
58
242,
065
8.5
-
3,
007
-
-
54
,278
184,
780
26
2,11
5
16,9
64
0.
6
-
-
149
-
-
16
,815
19
,180
16
,964
0.
6
-
-
14
9
-
-
16,8
15
19
,180
25
8,68
1
9.1
119
399
2,
964
24
,542
105,
949
124,
708
29
8,83
8
209,
308
7.1
-
-
2,62
8
23,8
48
92,4
79
90
,353
222,
683
41
,748
1.
5
109
220
336
694
13
,470
26,9
19
67
,164
7,
436
0.
5
-
-
-
-
-
7,43
6
8,98
9
18
9
-
10
179
-
-
-
-
2
2,
858,
655
100.
0
119
3,40
6
11
,546
32,6
82
29
8,09
3
2,
512,
809
1,19
0,70
9
0.
0%0.
2%0.
4%1.
1%10
.4%
87.9
%1,
190,
709
100.
09,
251
4,21
411
,842
38,4
1918
,292
1,10
8,69
10.
8%0.
4%1.
0%3.
2%1.
5%93
.1%
f)
01/0
1 to
09
/30/
2009
01/0
1 to
09
/30/
2008
1,02
2,50
5
(655
,443
)
32
4,29
6
45
,556
1,
346,
801
(609
,887
)
330,
637
(22,
164)
1,67
7,43
8(6
32,0
51)
g)
Sec
uriti
zed
real
est
ate
loan
s (1
)
% p
er m
atu
rity
ter
m (
1)
Incl
udes
inve
stm
ents
of
Ita
ú V
ida
e P
revi
dênc
ia S
.A.
in t
he a
mou
nt o
f R
$ 1,
259,
140
(R
$ 58
3,32
5 a
t 09
/30/
200
8).
(2)
Ref
ers
to
secu
ritie
s is
sued
in n
om
ina
tive
and
non
-dis
posa
ble
way
.
Oth
erT
ota
l%
per
mat
uri
ty t
erm
To
tal 0
9/30
/200
8
GO
VE
RN
ME
NT
SE
CU
RIT
IES
– D
OM
ES
TIC
GO
VE
RN
ME
NT
SE
CU
RIT
IES
– A
BR
OA
DU
rugu
ayC
OR
PO
RA
TE
SE
CU
RIT
IES
Hel
d-t
o-m
atu
rity
sec
uri
ties
See
belo
wth
eco
mpo
sitio
nof
the
port
folio
ofhe
ld-t
o-m
atur
ityse
curit
ies
by
type
,st
ated
atco
stby
mat
urity
term
.In
the
carr
ying
valu
e,no
tco
nsid
ere
din
resu
lts,
are
the
amou
nts
ofR
$16
,604
(R$
20,1
69at
09/3
0/20
08)
incl
uded
atS
epte
mbe
r30
,20
09,
rela
ting
tom
arke
tad
just
men
tof
the
recl
assi
fied
secu
ritie
sat
Dec
embe
r31
,20
03.
Sec
uriti
escl
assi
fied
unde
rth
isty
pe,
ifst
ate
dat
mar
ket
valu
e,w
ould
pres
ent
apo
sitiv
ead
just
men
tof
R$
403,
366
(R$
173,
150
at09
/30/
2008
) at
Sep
tem
ber
30, 2
009.
09/3
0/20
09
As
set
fort
hin
Art
icle
5of
BA
CE
NC
ircul
arN
o.3,
068,
ofN
ovem
ber
8,20
08,
the
reva
luat
ion
rega
rdin
gth
ecl
assi
ficat
ion
ofse
curit
ies
can
only
bem
ade
upo
npr
epar
atio
nof
tria
lbal
ance
sfo
rsi
x-m
onth
perio
ds.
Inad
ditio
n,th
etr
ansf
er f
rom
the
“hel
d-to
-mat
urity
” in
to th
e ot
her
cate
gorie
s ca
n on
ly o
ccur
in v
iew
of
an is
olat
ed,
unus
ual,
nonr
ecur
ring
and
une
xpec
ted
reas
on, w
hich
has
occ
urre
d af
ter
the
clas
sific
atio
n da
te.
Man
agem
ent
sets
fort
hgu
idel
ines
tocl
assi
fyse
curit
ies.
The
clas
sific
atio
nof
the
curr
ent
port
folio
ofse
curit
ies,
asw
ella
sth
ese
curit
ies
purc
has
edin
the
perio
d,ar
epe
riodi
cally
and
syst
emat
ical
lyev
alua
ted
base
don
such
guid
elin
es.
Nat
iona
l Tre
asur
y N
otes
(1)
Nat
iona
l Tre
asur
y N
otes
– M
(2)
Bra
zilia
n E
xter
nal D
ebt
Bon
ds
Eur
obon
ds a
nd o
ther
Deb
entu
res
(1)
Gai
n (lo
ss)
- T
radi
ng s
ecur
ities
Rea
lize
d a
nd
un
real
ized
gai
n o
f se
curi
ties
po
rtfo
lio
Rec
lass
ific
atio
n o
f se
curi
ties
(ar
ticl
e 5
of
BA
CE
N C
ircu
lar
No
. 3,0
68, o
f 11
/08/
2001
)
Gai
n (lo
ss)
– A
vaila
ble-
for-
sale
sec
uriti
esT
ota
l rea
lized
gai
nA
djus
tmen
t to
mar
ket
valu
e of
tra
ding
sec
uriti
esT
ota
l
I t a ú U n i b a n c o S . A . – - September 0
81
h) Derivative financial instruments
The globalization of the markets in recent years has resulted in a high level of sophistication in the financial products used. As a result of this process, there has been an increasing demand for derivative financial instruments to manage market risks, mainly arising from fluctuations in interest and exchange rates, commodities and other asset prices. Accordingly, ITAU UNIBANCO HOLDING and its subsidiaries operate in the derivative markets for meeting the growing needs of their clients, as well as carrying out their risk management policy. Such policy is based on the use of derivative instruments to minimize the risks resulting from commercial and financial operations. The derivative financial instruments’ business with clients is carried out after the approval of credit limits. The process of limit approval takes into consideration potential stress scenarios. Knowing the client, the sector in which it operates and its risk appetite profile, in addition to providing information on the risks involved in the transaction and the negotiated conditions, ensures transparency in the relationship between the parties and supply of a product that better meet the needs of the client in view of its operating characteristics. The derivative transactions carried out by ITAÚ UNIBANCO HOLDING and its subsidiaries with customers are neutralized in order to eliminate market risks. Most derivative contracts traded by the institution with clients in Brazil are swap, forward, option and futures contracts, which are registered at the BM&F Bovespa or at the CETIP – S.A. – OTC Clearing House (CETIP). Overseas transactions are carried out with futures, forwards, options and swaps with registration mainly in the Chicago, New York and London Exchanges. It should be emphasized that there are over-the-counter operations, but their risks are low as compared to the institutions’ total. Noteworthy is also the fact that there are no structured operations based on subprime assets and all operations are based on risk factors traded at stock exchanges. The main risk factors of the derivatives, assumed at September 30, 2009, were related to the foreign exchange rate, interest rate, commodities, U.S. dollar coupon, Reference Rate coupon, Libor and variable income. The management of these and other market risk factors is supported by the infrastructure of sophisticated statistical and deterministic models. Based on this management model, the institution, with the use of transactions involving derivatives, has been able to optimize the risk-return ratios, even under highly volatile situations. Most derivatives included in the institution’s portfolio are traded at stock exchanges. The prices disclosed by stock exchanges are used for these derivatives, except in cases in which the low representativeness of price due to illiquidity of a specific contract is identified. Derivatives typically precified like this are future contracts. Likewise, there are other instruments whose quotations (fair prices) are directly disclosed by independent institutions and which are precified based on this direct information. A great part of the Brazilian government securities, highly-liquid international (public and private) securities and shares fit into this situation. For derivatives whose prices are not directly disclosed by stock exchanges, fair prices are obtained by pricing models which use market information, deducted based on prices disclosed for higher liquidity assets. Interest and market volatility curves which provide entry data for the models are extracted from those prices. Over-the-counter derivatives, forward contracts and securities without much liquidity are in this situation. The total value of margins pledged in guarantee was R$ 15,513,710 and was basically composed of government securities.
I t a ú U n i b a n c o S . A . – - September 0
82
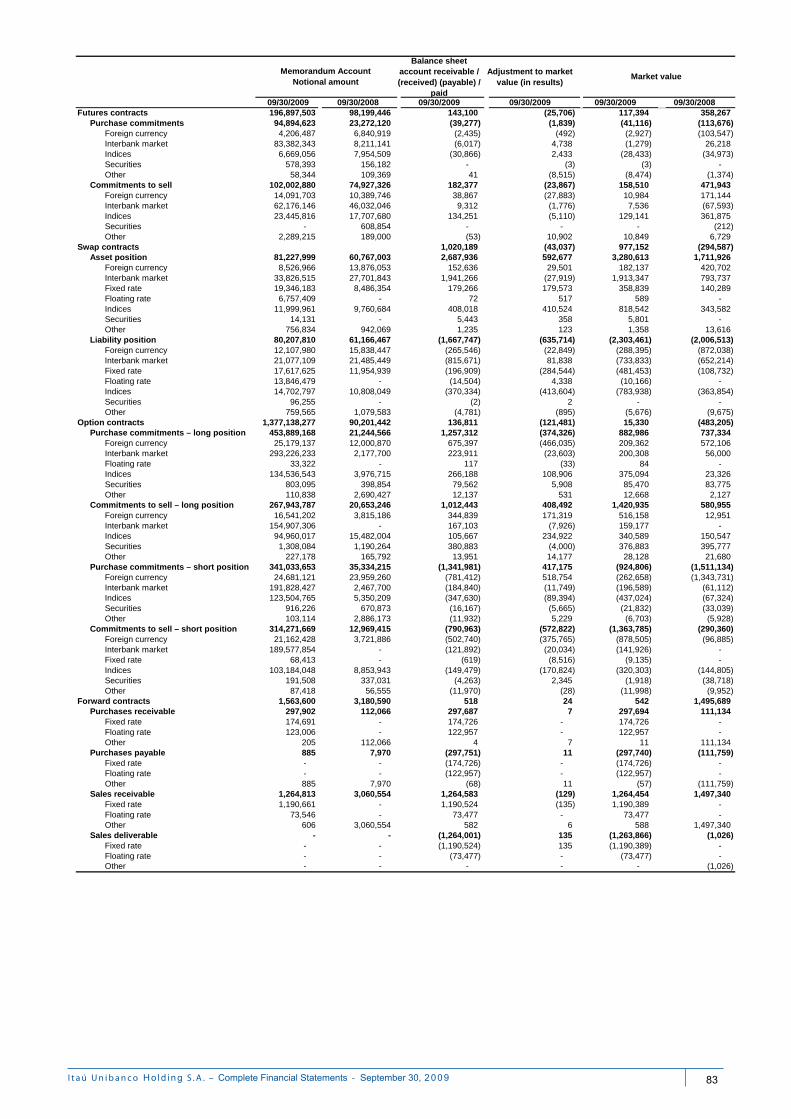
Balance sheet account receivable / (received) (payable) /
paid
Adjustment to market value (in results)
09/30/2009 09/30/2008 09/30/2009 09/30/2009 09/30/2009 09/30/2008Futures contracts 196,897,503 98,199,446 143,100 (25,706) 117,394 358,267
Purchase commitments 94,894,623 23,272,120 (39,277) (1,839) (41,116) (113,676) Foreign currency 4,206,487 6,840,919 (2,435) (492) (2,927) (103,547) Interbank market 83,382,343 8,211,141 (6,017) 4,738 (1,279) 26,218 Indices 6,669,056 7,954,509 (30,866) 2,433 (28,433) (34,973) Securities 578,393 156,182 - (3) (3) - Other 58,344 109,369 41 (8,515) (8,474) (1,374)
Commitments to sell 102,002,880 74,927,326 182,377 (23,867) 158,510 471,943 Foreign currency 14,091,703 10,389,746 38,867 (27,883) 10,984 171,144 Interbank market 62,176,146 46,032,046 9,312 (1,776) 7,536 (67,593) Indices 23,445,816 17,707,680 134,251 (5,110) 129,141 361,875 Securities - 608,854 - - - (212) Other 2,289,215 189,000 (53) 10,902 10,849 6,729
Swap contracts 1,020,189 (43,037) 977,152 (294,587) Asset position 81,227,999 60,767,003 2,687,936 592,677 3,280,613 1,711,926
Foreign currency 8,526,966 13,876,053 152,636 29,501 182,137 420,702 Interbank market 33,826,515 27,701,843 1,941,266 (27,919) 1,913,347 793,737 Fixed rate 19,346,183 8,486,354 179,266 179,573 358,839 140,289 Floating rate 6,757,409 - 72 517 589 - Indices 11,999,961 9,760,684 408,018 410,524 818,542 343,582 Securities 14,131 - 5,443 358 5,801 - Other 756,834 942,069 1,235 123 1,358 13,616
Liability position 80,207,810 61,166,467 (1,667,747) (635,714) (2,303,461) (2,006,513) Foreign currency 12,107,980 15,838,447 (265,546) (22,849) (288,395) (872,038) Interbank market 21,077,109 21,485,449 (815,671) 81,838 (733,833) (652,214) Fixed rate 17,617,625 11,954,939 (196,909) (284,544) (481,453) (108,732) Floating rate 13,846,479 - (14,504) 4,338 (10,166) - Indices 14,702,797 10,808,049 (370,334) (413,604) (783,938) (363,854) Securities 96,255 - (2) 2 - - Other 759,565 1,079,583 (4,781) (895) (5,676) (9,675)
Option contracts 1,377,138,277 90,201,442 136,811 (121,481) 15,330 (483,205) Purchase commitments – long position 453,889,168 21,244,566 1,257,312 (374,326) 882,986 737,334
Foreign currency 25,179,137 12,000,870 675,397 (466,035) 209,362 572,106 Interbank market 293,226,233 2,177,700 223,911 (23,603) 200,308 56,000 Floating rate 33,322 - 117 (33) 84 - Indices 134,536,543 3,976,715 266,188 108,906 375,094 23,326 Securities 803,095 398,854 79,562 5,908 85,470 83,775 Other 110,838 2,690,427 12,137 531 12,668 2,127
Commitments to sell – long position 267,943,787 20,653,246 1,012,443 408,492 1,420,935 580,955 Foreign currency 16,541,202 3,815,186 344,839 171,319 516,158 12,951 Interbank market 154,907,306 - 167,103 (7,926) 159,177 - Indices 94,960,017 15,482,004 105,667 234,922 340,589 150,547 Securities 1,308,084 1,190,264 380,883 (4,000) 376,883 395,777 Other 227,178 165,792 13,951 14,177 28,128 21,680
Purchase commitments – short position 341,033,653 35,334,215 (1,341,981) 417,175 (924,806) (1,511,134) Foreign currency 24,681,121 23,959,260 (781,412) 518,754 (262,658) (1,343,731) Interbank market 191,828,427 2,467,700 (184,840) (11,749) (196,589) (61,112) Indices 123,504,765 5,350,209 (347,630) (89,394) (437,024) (67,324) Securities 916,226 670,873 (16,167) (5,665) (21,832) (33,039) Other 103,114 2,886,173 (11,932) 5,229 (6,703) (5,928)
Commitments to sell – short position 314,271,669 12,969,415 (790,963) (572,822) (1,363,785) (290,360) Foreign currency 21,162,428 3,721,886 (502,740) (375,765) (878,505) (96,885) Interbank market 189,577,854 - (121,892) (20,034) (141,926) - Fixed rate 68,413 - (619) (8,516) (9,135) - Indices 103,184,048 8,853,943 (149,479) (170,824) (320,303) (144,805) Securities 191,508 337,031 (4,263) 2,345 (1,918) (38,718) Other 87,418 56,555 (11,970) (28) (11,998) (9,952)
Forward contracts 1,563,600 3,180,590 518 24 542 1,495,689 Purchases receivable 297,902 112,066 297,687 7 297,694 111,134
Fixed rate 174,691 - 174,726 - 174,726 - Floating rate 123,006 - 122,957 - 122,957 - Other 205 112,066 4 7 11 111,134
Purchases payable 885 7,970 (297,751) 11 (297,740) (111,759) Fixed rate - - (174,726) - (174,726) - Floating rate - - (122,957) - (122,957) - Other 885 7,970 (68) 11 (57) (111,759)
Sales receivable 1,264,813 3,060,554 1,264,583 (129) 1,264,454 1,497,340 Fixed rate 1,190,661 - 1,190,524 (135) 1,190,389 - Floating rate 73,546 - 73,477 - 73,477 - Other 606 3,060,554 582 6 588 1,497,340
Sales deliverable - - (1,264,001) 135 (1,263,866) (1,026) Fixed rate - - (1,190,524) 135 (1,190,389) - Floating rate - - (73,477) - (73,477) - Other - - - - - (1,026)
Market valueMemorandum Account
Notional amount
I t a ú U n i b a n c o S . A . – - September 0
83
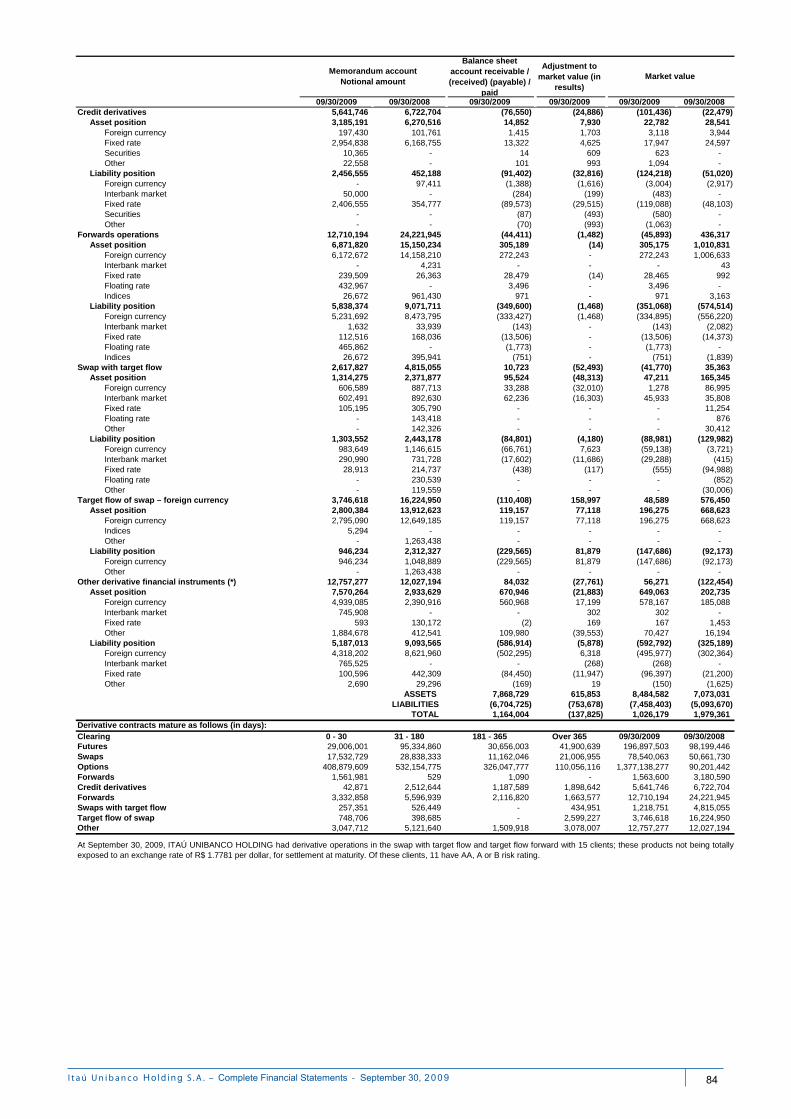
Balance sheet account receivable / (received) (payable) /
paid
Adjustment to market value (in
results)
09/30/2009 09/30/2008 09/30/2009 09/30/2009 09/30/2009 09/30/2008Credit derivatives 5,641,746 6,722,704 (76,550) (24,886) (101,436) (22,479)
Asset position 3,185,191 6,270,516 14,852 7,930 22,782 28,541 Foreign currency 197,430 101,761 1,415 1,703 3,118 3,944 Fixed rate 2,954,838 6,168,755 13,322 4,625 17,947 24,597 Securities 10,365 - 14 609 623 - Other 22,558 - 101 993 1,094 -
Liability position 2,456,555 452,188 (91,402) (32,816) (124,218) (51,020) Foreign currency - 97,411 (1,388) (1,616) (3,004) (2,917) Interbank market 50,000 - (284) (199) (483) - Fixed rate 2,406,555 354,777 (89,573) (29,515) (119,088) (48,103) Securities - - (87) (493) (580) - Other - - (70) (993) (1,063) -
Forwards operations 12,710,194 24,221,945 (44,411) (1,482) (45,893) 436,317 Asset position 6,871,820 15,150,234 305,189 (14) 305,175 1,010,831
Foreign currency 6,172,672 14,158,210 272,243 - 272,243 1,006,633 Interbank market - 4,231 - - - 43 Fixed rate 239,509 26,363 28,479 (14) 28,465 992 Floating rate 432,967 - 3,496 - 3,496 - Indices 26,672 961,430 971 - 971 3,163
Liability position 5,838,374 9,071,711 (349,600) (1,468) (351,068) (574,514) Foreign currency 5,231,692 8,473,795 (333,427) (1,468) (334,895) (556,220) Interbank market 1,632 33,939 (143) - (143) (2,082) Fixed rate 112,516 168,036 (13,506) - (13,506) (14,373) Floating rate 465,862 - (1,773) - (1,773) - Indices 26,672 395,941 (751) - (751) (1,839)
Swap with target flow 2,617,827 4,815,055 10,723 (52,493) (41,770) 35,363 Asset position 1,314,275 2,371,877 95,524 (48,313) 47,211 165,345
Foreign currency 606,589 887,713 33,288 (32,010) 1,278 86,995 Interbank market 602,491 892,630 62,236 (16,303) 45,933 35,808 Fixed rate 105,195 305,790 - - - 11,254 Floating rate - 143,418 - - - 876 Other - 142,326 - - - 30,412
Liability position 1,303,552 2,443,178 (84,801) (4,180) (88,981) (129,982) Foreign currency 983,649 1,146,615 (66,761) 7,623 (59,138) (3,721) Interbank market 290,990 731,728 (17,602) (11,686) (29,288) (415) Fixed rate 28,913 214,737 (438) (117) (555) (94,988) Floating rate - 230,539 - - - (852) Other - 119,559 - - - (30,006)
Target flow of swap – foreign currency 3,746,618 16,224,950 (110,408) 158,997 48,589 576,450 Asset position 2,800,384 13,912,623 119,157 77,118 196,275 668,623
Foreign currency 2,795,090 12,649,185 119,157 77,118 196,275 668,623 Indices 5,294 - - - - - Other - 1,263,438 - - - -
Liability position 946,234 2,312,327 (229,565) 81,879 (147,686) (92,173) Foreign currency 946,234 1,048,889 (229,565) 81,879 (147,686) (92,173) Other - 1,263,438 - - - -
Other derivative financial instruments (*) 12,757,277 12,027,194 84,032 (27,761) 56,271 (122,454) Asset position 7,570,264 2,933,629 670,946 (21,883) 649,063 202,735
Foreign currency 4,939,085 2,390,916 560,968 17,199 578,167 185,088 Interbank market 745,908 - - 302 302 - Fixed rate 593 130,172 (2) 169 167 1,453 Other 1,884,678 412,541 109,980 (39,553) 70,427 16,194
Liability position 5,187,013 9,093,565 (586,914) (5,878) (592,792) (325,189) Foreign currency 4,318,202 8,621,960 (502,295) 6,318 (495,977) (302,364) Interbank market 765,525 - - (268) (268) - Fixed rate 100,596 442,309 (84,450) (11,947) (96,397) (21,200) Other 2,690 29,296 (169) 19 (150) (1,625)
ASSETS 7,868,729 615,853 8,484,582 7,073,031 LIABILITIES (6,704,725) (753,678) (7,458,403) (5,093,670)
TOTAL 1,164,004 (137,825) 1,026,179 1,979,361 Derivative contracts mature as follows (in days):Clearing 0 - 30 31 - 180 181 - 365 Over 365 09/30/2009 09/30/2008Futures 29,006,001 95,334,860 30,656,003 41,900,639 196,897,503 98,199,446 Swaps 17,532,729 28,838,333 11,162,046 21,006,955 78,540,063 50,661,730 Options 408,879,609 532,154,775 326,047,777 110,056,116 1,377,138,277 90,201,442 Forwards 1,561,981 529 1,090 - 1,563,600 3,180,590 Credit derivatives 42,871 2,512,644 1,187,589 1,898,642 5,641,746 6,722,704 Forwards 3,332,858 5,596,939 2,116,820 1,663,577 12,710,194 24,221,945 Swaps with target flow 257,351 526,449 - 434,951 1,218,751 4,815,055 Target flow of swap 748,706 398,685 - 2,599,227 3,746,618 16,224,950 Other 3,047,712 5,121,640 1,509,918 3,078,007 12,757,277 12,027,194
Memorandum accountNotional amount
Market value
At September 30, 2009, ITAÚ UNIBANCO HOLDING had derivative operations in the swap with target flow and target flow forward with 15 clients; these products not being totallyexposed to an exchange rate of R$ 1.7781 per dollar, for settlement at maturity. Of these clients, 11 have AA, A or B risk rating.
I t a ú U n i b a n c o S . A . – - September 0
84
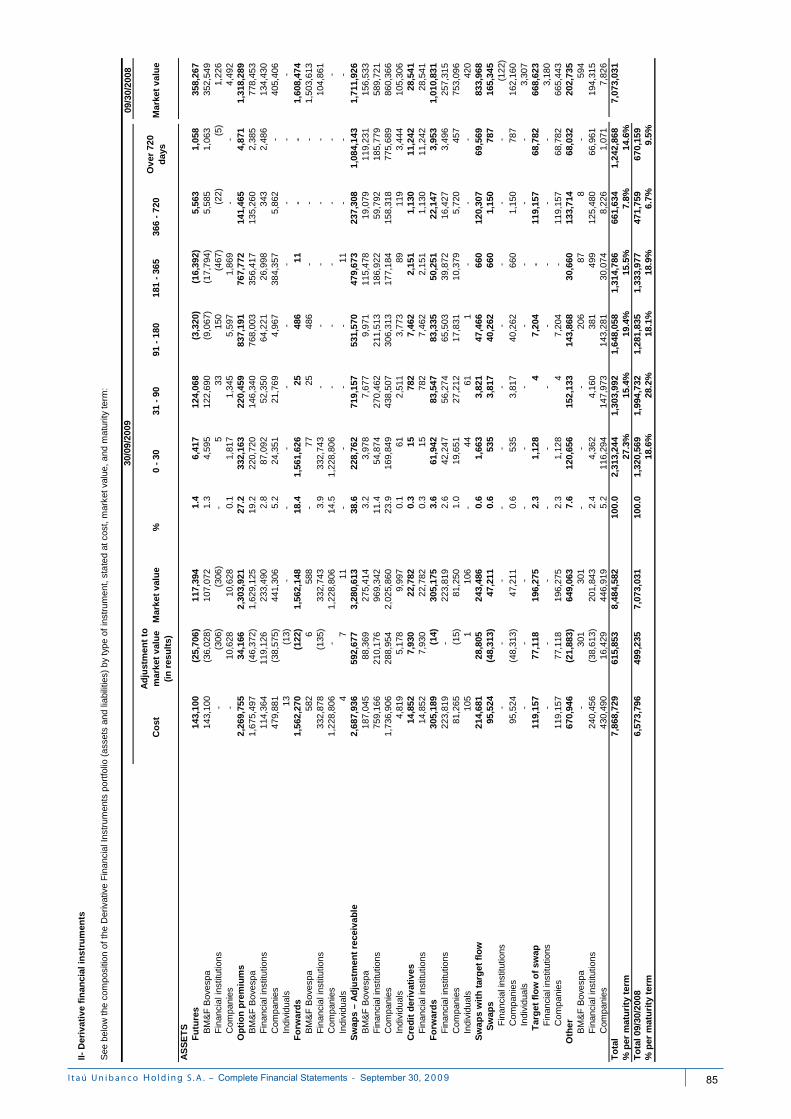
09/3
0/2
008
Co
stA
dju
stm
ent
to
mar
ket
val
ue
(in
res
ult
s)
Mar
ket
val
ue
%0
- 30
31
- 90
91 -
180
181
- 3
65
366
- 7
20O
ver
72
0 d
ays
Ma
rket
val
ue
143
,10
0
(25,
706
)
117
,394
1.
4
6,41
7
12
4,0
68
(3
,320
)
(16,
392)
5,
563
1,05
8
35
8,26
7
B
M&
F B
ove
spa
143
,10
0
(36,
028
)
10
7,07
2
1.3
4,59
5
12
2,6
90
(9,0
67)
(17,
794)
5,58
5
1,06
3
352,
549
Fin
anci
al i
nstit
utio
ns-
(306
)
(3
06)
-
5
33
150
(467
)
(22)
(5)
1,
226
C
om
pan
ies
-
10
,628
10,6
28
0.
1
1,
817
1,3
45
5
,597
1,
869
-
-
4,49
2
2,2
69,7
55
34
,166
2
,303
,921
27.2
332,
163
22
0,4
59
83
7,1
91
76
7,7
72
14
1,46
5
4,87
1
1,
318,
289
B
M&
F B
ove
spa
1,6
75,4
97
(46,
372
)
1
,629
,125
19.2
22
0,72
0
146
,340
76
8,0
03
356,
417
13
5,26
0
2,38
5
778,
453
Fin
anci
al i
nstit
utio
ns1
14,3
64
11
9,12
6
233
,490
2.
8
87
,09
2
52,3
50
64
,221
26,9
98
34
3
2,
486
13
4,43
0
C
om
pan
ies
479
,88
1
(38,
575
)
44
1,30
6
5.2
24,3
51
21
,769
4,9
67
384,
357
5,
862
-
40
5,40
6
In
divi
dual
s1
3
(1
3)
-
-
-
-
-
-
-
-
-
1,5
62,2
70
(1
22)
1,
562,
148
18.4
1,56
1,62
6
25
48
6
11
-
-
1,
608,
474
B
M&
F B
ove
spa
582
6
58
8
-
77
25
486
-
-
-
1,50
3,61
3
Fin
anci
al i
nstit
utio
ns3
32,8
78
(1
35)
332,
743
3.
9
33
2,74
3
-
-
-
-
-
104,
861
Co
mp
anie
s1
,228
,80
6
-
1,
228,
806
14.5
1,
228,
806
-
-
-
-
-
-
In
divi
dual
s4
7
11
-
-
-
-
11
-
-
-
2,6
87,9
36
5
92,6
77
3,2
80,6
13
38
.6
22
8,76
2
719
,157
531
,570
479,
673
237,
308
1
,084
,14
3
1,
711,
926
B
M&
F B
ove
spa
187
,04
5
88,3
69
27
5,41
4
3.2
3,97
8
7
,677
9,9
71
115,
478
19
,079
119,
231
156,
533
Fin
anci
al i
nstit
utio
ns7
59,1
66
21
0,17
6
969
,342
11
.4
54,8
74
27
0,4
62
211
,513
18
6,92
2
59,7
92
18
5,77
9
58
9,72
1
C
om
pan
ies
1,7
36,9
06
288
,954
2
,025
,860
23.9
16
9,84
9
438
,507
30
6,3
13
177,
184
15
8,31
8
775
,68
9
86
0,36
6
In
divi
dual
s4,
819
5,17
8
9,99
7
0.1
61
2
,511
3,7
73
89
11
9
3,
444
10
5,30
6
14
,85
2
7,93
0
22
,782
0.
3
15
78
2
7,4
62
2,
151
1,13
0
11
,242
28
,54
1
F
inan
cia
l ins
titut
ions
14,8
52
7,93
0
22,7
82
0.
3
15
782
7
,462
2,
151
1,
130
11
,242
28
,54
1
3
05,1
89
(1
4)
305,
175
3.
6
61,9
42
83
,54
7
83,3
35
50,2
51
22,1
47
3,
953
1,01
0,83
1
Fin
anci
al i
nstit
utio
ns2
23,8
19
-
22
3,81
9
2.6
42,2
47
56
,274
65,5
03
39
,872
16,4
27
3,
496
25
7,31
5
C
om
pan
ies
81,2
65
(15)
81
,250
1.0
19,6
51
27
,212
17,8
31
10
,379
5,72
0
457
753,
096
Indi
vidu
als
105
1
10
6
-
44
61
1
-
-
-
420
Sw
ap
s w
ith
tar
get
flo
w
214
,68
1
28,8
05
243
,486
0.
6
1,66
3
3
,821
47,4
66
660
12
0,30
7
69,5
69
833,
968
Sw
aps
95
,52
4
(48,
313
)
47,2
11
0.6
53
5
3,8
17
40
,262
6
60
1,15
0
78
7
165,
345
Fin
anci
al i
nstit
utio
ns-
-
-
-
-
-
-
-
-
-
(1
22)
Co
mp
anie
s95
,52
4
(4
8,31
3)
47,2
11
0.
6
53
5
3,8
17
40
,262
660
1,15
0
787
162,
160
Indi
vidu
als
-
-
-
-
-
-
-
-
-
-
3,30
7
Tar
ge
t fl
ow
of
swap
1
19,1
57
77
,118
1
96,2
75
2.3
1,
128
4
7,
204
-
11
9,15
7
68,7
82
668,
623
Fin
anci
al i
nstit
utio
ns-
-
-
-
-
-
-
-
-
-
3,
180
C
om
pan
ies
119
,15
7
77,1
18
19
6,27
5
2.3
1,12
8
4
7,
204
-
119,
157
68
,782
66
5,44
3
6
70,9
46
(2
1,88
3)
649
,063
7.
6
120,
656
15
2,1
33
14
3,8
68
3
0,66
0
133,
714
68
,032
20
2,73
5
B
M&
F B
ove
spa
-
30
1
30
1
-
-
-
20
6
87
8
-
594
Fin
anci
al i
nstit
utio
ns2
40,4
56
(3
8,61
3)
201,
843
2.
4
4,
362
4,1
60
38
1
49
9
12
5,48
0
66,9
61
194,
315
Co
mp
anie
s4
30,4
90
16
,429
446,
919
5.
2
11
6,29
4
147
,973
14
3,2
81
30,0
74
8,
226
1,
071
7,
826
T
ota
l 7
,868
,72
9
615
,853
8
,484
,582
100.
0
2,31
3,24
4
1,
303
,992
1,
648
,058
1,
314,
786
66
1,63
4
1
,242
,86
8
7,
073,
031
%
per
mat
uri
ty t
erm
27.3
%15
.4%
19.4
%15
.5%
7.8
%1
4.6%
To
tal 0
9/30
/200
86
,573
,79
6
499
,235
7
,073
,031
100.
0
1,32
0,56
9
1,
994
,732
1,
281
,835
1,
333,
977
47
1,75
9
670
,15
9
% p
er m
atu
rity
ter
m18
.6%
28.2
%18
.1%
18.9
%6
.7%
9.5%
Sw
ap
s –
Ad
just
men
t re
ceiv
able
Cre
dit
der
ivat
ives
Fo
rwar
ds
Oth
er
AS
SE
TS
Fu
ture
s
Op
tio
n p
rem
ium
s
Fo
rwar
ds
II- D
eriv
ativ
e f
inan
cial
ins
tru
me
nts
30/0
9/2
009
See
bel
ow t
he c
ompo
sitio
n o
f th
e D
eriv
ativ
e F
inan
cial
Inst
rum
ents
por
tfol
io (
ass
ets
and
liab
ilitie
s) b
y ty
pe o
f in
stru
me
nt, s
tate
d at
cos
t, m
arke
t val
ue, a
nd m
atur
ity te
rm:
I t a ú U n i b a n c o S . A . – - September 0
85
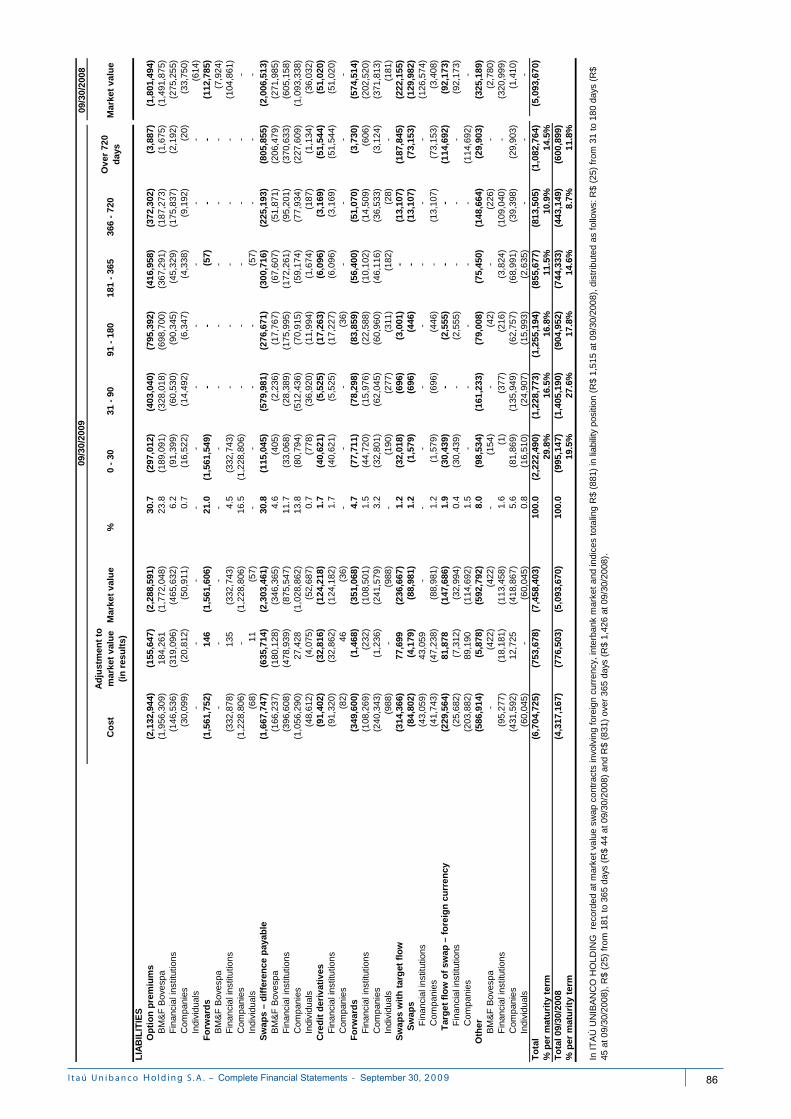
09/3
0/2
008
Co
stA
dju
stm
ent
to
mar
ket
val
ue
(in
res
ult
s)
Mar
ket
val
ue
%0
- 30
31
- 90
91 -
180
181
- 3
65
366
- 7
20O
ver
72
0 d
ays
Ma
rket
val
ue
Op
tio
n p
rem
ium
s (2
,132
,94
4)
(155
,647
)
(2
,288
,591
)
30.7
(297
,01
2)
(4
03,0
40)
(795
,392
)
(4
16,
958)
(372
,302
)
(3
,887
)
(1
,801
,49
4)
B
M&
F B
ove
spa
(1,9
56,3
09)
1
84,2
61
(1,7
72,0
48)
23.8
(1
89,0
91)
(328
,01
8)
(698
,700
)
(36
7,29
1)
(187
,273
)
(1,6
75)
(1
,491
,87
5)
F
inan
cia
l ins
titut
ions
(146
,53
6)
(3
19,0
96)
(4
65,6
32)
6.
2
(9
1,39
9)
(60
,530
)
(9
0,34
5)
(4
5,32
9)
(1
75,8
37)
(2
,192
)
(275
,25
5)
Co
mp
anie
s(3
0,09
9)
(2
0,81
2)
(50,
911
)
0.
7
(1
6,52
2)
(14
,492
)
(6
,347
)
(4
,338
)
(9
,192
)
(2
0)
(33,
750)
Indi
vidu
als
-
-
-
-
-
-
-
-
-
-
(614
)
F
orw
ard
s (1
,561
,75
2)
146
(1
,561
,606
)
21.0
(1,5
61,5
49)
-
-
(5
7)
-
-
(112
,78
5)
BM
&F
Bov
esp
a-
-
-
-
-
-
-
-
-
-
(7
,924
)
Fin
anci
al i
nstit
utio
ns(3
32,8
78)
135
(332
,743
)
4.5
(332
,74
3)
-
-
-
-
-
(1
04,8
61)
Co
mp
anie
s(1
,228
,80
6)
-
(1,2
28,8
06)
16.5
(1
,228
,80
6)
-
-
-
-
-
-
In
divi
dual
s(6
8)
11
(57)
-
-
-
-
(57)
-
-
-
Sw
ap
s –
dif
fere
nc
e p
ayab
le
(1,6
67,7
47)
(6
35,7
14)
(2,3
03,4
61)
30
.8
(1
15,0
45)
(579
,98
1)
(2
76,6
71)
(30
0,71
6)
(2
25,1
93)
(805
,855
)
(2
,006
,51
3)
B
M&
F B
ove
spa
(166
,23
7)
(1
80,1
28)
(3
46,3
65)
4.
6
(4
05)
(2
,236
)
(17,
767)
(67,
607)
(51,
871)
(2
06,4
79)
(2
71,9
85)
F
inan
cia
l ins
titut
ions
(396
,60
8)
(4
78,9
39)
(8
75,5
47)
11
.7
(33,
068)
(2
8,3
89)
(175
,995
)
(17
2,26
1)
(95,
201)
(3
70,6
33)
(6
05,1
58)
C
om
pan
ies
(1,0
56,2
90)
27
,428
(1,0
28,8
62)
13.8
(8
0,79
4)
(512
,43
6)
(70,
915)
(59,
174)
(77,
934)
(2
27,6
09)
(1
,093
,33
8)
In
divi
dual
s(4
8,61
2)
(4
,075
)
(52,
687
)
0.
7
(7
78)
(3
6,92
0)
(1
1,99
4)
(1
,674
)
(1
87)
(1
,134
)
(36,
032)
Cre
dit
der
ivat
ives
(9
1,40
2)
(3
2,81
6)
(1
24,2
18)
1.7
(4
0,62
1)
(5,5
25)
(1
7,26
3)
(6,0
96)
(3,1
69)
(51,
544
)
(51,
020)
Fin
anci
al i
nstit
utio
ns(9
1,32
0)
(3
2,86
2)
(124
,182
)
1.7
(40,
621)
(5
,525
)
(17,
227)
(6,0
96)
(3,1
69)
(51,
544
)
(5
1,02
0)
C
om
pan
ies
(82)
46
(3
6)
-
-
-
(36)
-
-
-
-
F
orw
ard
s (3
49,6
00)
(1,4
68)
(351
,068
)
4.
7
(77,
711)
(7
8,2
98)
(8
3,85
9)
(56,
400
)
(51,
070)
(3
,730
)
(5
74,5
14)
F
inan
cia
l ins
titut
ions
(108
,26
9)
(2
32)
(108
,501
)
1.5
(44,
720)
(1
5,9
76)
(22,
588)
(10,
102)
(14,
509)
(6
06)
(202
,52
0)
Co
mp
anie
s(2
40,3
43)
(1,2
36)
(2
41,5
79)
3.
2
(3
2,80
1)
(62
,045
)
(6
0,96
0)
(4
6,11
6)
(3
6,53
3)
(3,1
24)
(3
71,8
13)
In
divi
dual
s(9
88)
-
(9
88)
-
(1
90)
(2
77)
(311
)
(182
)
(28)
-
(181
)
S
wa
ps
wit
h t
arg
et f
low
(3
14,3
66)
77,6
99
(236
,667
)
1.
2
(32,
018)
(6
96)
(3,0
01)
-
(13,
107)
(1
87,8
45)
(222
,15
5)
Sw
aps
(8
4,80
2)
(4
,179
)
(8
8,98
1)
1.
2
(1,5
79)
(6
96)
(446
)
-
(13,
107)
(7
3,15
3)
(1
29,9
82)
F
inan
cia
l ins
titut
ions
(43,
059
)
43,0
59
-
-
-
-
-
-
-
-
(126
,57
4)
Co
mp
anie
s(4
1,74
3)
(4
7,23
8)
(88,
981
)
1.
2
(1
,579
)
(6
96)
(446
)
-
(1
3,10
7)
(73,
153
)
(3
,408
)
Tar
ge
t fl
ow
of
swap
– f
ore
ign
cu
rre
ncy
(2
29,5
64)
81,8
78
(147
,686
)
1.
9
(30,
439)
-
(2
,555
)
-
-
(114
,692
)
(9
2,17
3)
F
inan
cia
l ins
titut
ions
(25,
682
)
(7,3
12)
(3
2,99
4)
0.4
(30,
439)
-
(2,5
55)
-
-
-
(92,
173)
Co
mp
anie
s(2
03,8
82)
89,1
90
(1
14,6
92)
1.
5
-
-
-
-
-
(1
14,6
92)
-
Oth
er
(586
,91
4)
(5
,878
)
(5
92,7
92)
8.0
(9
8,53
4)
(161
,23
3)
(7
9,00
8)
(75,
450
)
(148
,664
)
(2
9,90
3)
(3
25,1
89)
B
M&
F B
ove
spa
-
(4
22)
(422
)
-
(154
)
-
(4
2)
-
(226
)
-
(2,7
80)
F
inan
cia
l ins
titut
ions
(95,
277
)
(18,
181
)
(1
13,4
58)
1.
6
(1
)
(3
77)
(216
)
(3,8
24)
(109
,040
)
-
(320
,99
9)
Co
mp
anie
s(4
31,5
92)
12,7
25
(4
18,8
67)
5.
6
(8
1,86
9)
(135
,94
9)
(62,
757)
(68,
991)
(39,
398)
(2
9,90
3)
(1,4
10)
In
divi
dual
s(6
0,04
5)
-
(6
0,04
5)
0.8
(16,
510)
(2
4,9
07)
(15,
993)
(2,6
35)
-
-
-
To
tal
(6,7
04,7
25)
(7
53,6
78)
(7
,458
,403
)
10
0.0
(2
,222
,49
0)
(1
,228
,77
3)
(1,2
55,1
94)
(8
55,
677)
(813
,505
)
(1
,082
,764
)
(5
,093
,67
0)
%
per
mat
uri
ty t
erm
29.8
%16
.5%
16.8
%11
.5%
10.9
%1
4.5%
To
tal 0
9/30
/200
8(4
,317
,16
7)
(776
,503
)
(5
,093
,670
)
100.
0
(995
,14
7)
(1
,405
,19
0)
(904
,952
)
(7
44,
333)
(443
,149
)
(6
00,8
99)
% p
er m
atu
rity
ter
m19
.5%
27.6
%17
.8%
14.6
%8
.7%
11.
8%
LIA
BIL
ITIE
S
09/3
0/2
009
In I
TA
Ú U
NIB
AN
CO
HO
LD
ING
rec
orde
d a
t m
ark
et v
alu
e sw
ap c
ontr
act
s in
volv
ing
fore
ign
curr
ency
, int
erba
nk
mar
ket
and
indi
ces
tota
ling
R$
(881
) in
liab
ility
pos
ition
(R
$ 1
,515
at 0
9/30
/200
8), d
istr
ibut
ed a
s fo
llow
s: R
$ (2
5) f
rom
31
to 1
80
day
s (R
$
45 a
t 09/
30/2
008)
, R
$ (
25)
from
181
to 3
65 d
ays
(R$
44 a
t 09/
30/2
008)
and
R$
(831
) o
ver
365
da
ys (
R$
1,42
6 at
09/
30/2
008
).
I t a ú U n i b a n c o S . A . – - September 0
86
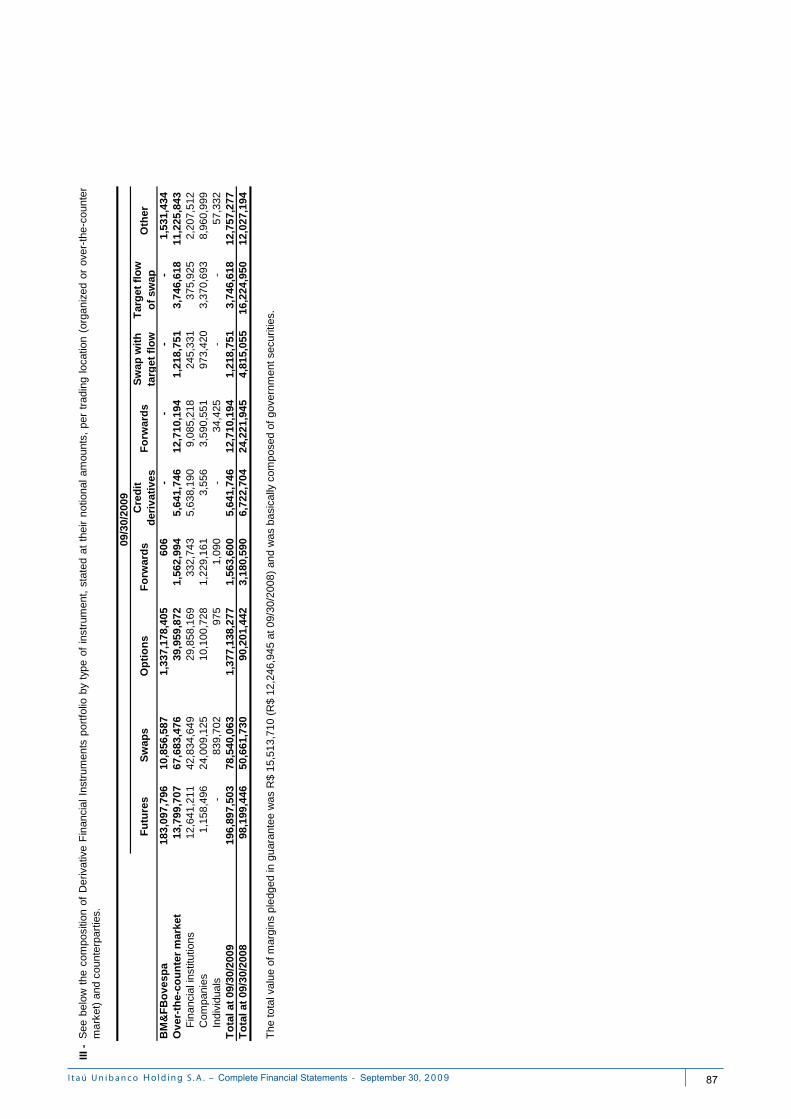
III -
Fu
ture
sS
wap
sO
pti
on
sF
orw
ard
sC
red
it
der
ivat
ives
Fo
rwar
ds
Sw
ap w
ith
ta
r get
flo
wT
arg
et f
low
o
f sw
apO
ther
183,
097,
796
10
,856
,587
1,33
7,17
8,40
5
606
-
-
-
-
1,53
1,43
4
13,7
99,7
07
67
,683
,476
39,9
59,8
72
1,5
62,9
94
5,64
1,74
6
12,7
10,1
941
,218
,751
3,
746,
618
11
,225
,843
12,6
41,2
11
42
,834
,649
29
,858
,169
332,
743
5,
638,
190
9,08
5,21
8
24
5,33
1
375,
925
2,
207,
512
1,15
8,49
6
24
,009
,125
10
,100
,728
1,2
29,1
61
3,
556
3,59
0,55
1
97
3,42
0
3,37
0,69
3
8,
960,
999
-
83
9,70
2
975
1,09
0
-
34
,425
-
-
57,3
32
196,
897,
503
78
,540
,063
1,37
7,13
8,27
7
1,5
63,6
00
5,64
1,74
6
12,7
10,1
941
,218
,751
3,
746,
618
12
,757
,277
98,1
99,4
46
50
,661
,730
90,2
01,4
42
3,1
80,5
90
6,72
2,70
4
24,2
21,9
454
,815
,055
16
,224
,950
12,0
27,1
94
See
belo
wth
eco
mpo
sitio
nof
De
rivat
ive
Fin
anci
alIn
stru
men
tsp
ortf
olio
byty
peof
inst
rum
ent,
stat
edat
thei
rn
otio
nal
amou
nts,
per
trad
ing
loca
tion
(org
aniz
edor
over
-the
-cou
nter
mar
ket)
and
cou
nter
part
ies.
09/3
0/20
09
Com
pani
es
The
tota
l val
ue o
f m
arg
ins
pled
ged
in g
uara
ntee
was
R$
15,5
13,
710
(R$
12,2
46,9
45 a
t 09/
30/2
008
) an
d w
as b
asi
cally
com
pos
ed o
f go
vern
men
t sec
uriti
es.
BM
&F
Bo
ves
pa
Fin
anci
al in
stitu
tions
Ov
er-t
he-
cou
nte
r m
arke
t
Indi
vidu
als
To
tal a
t 09
/30/
2008
To
tal a
t 09
/30/
2009
I t a ú U n i b a n c o S . A . – - September 0
87
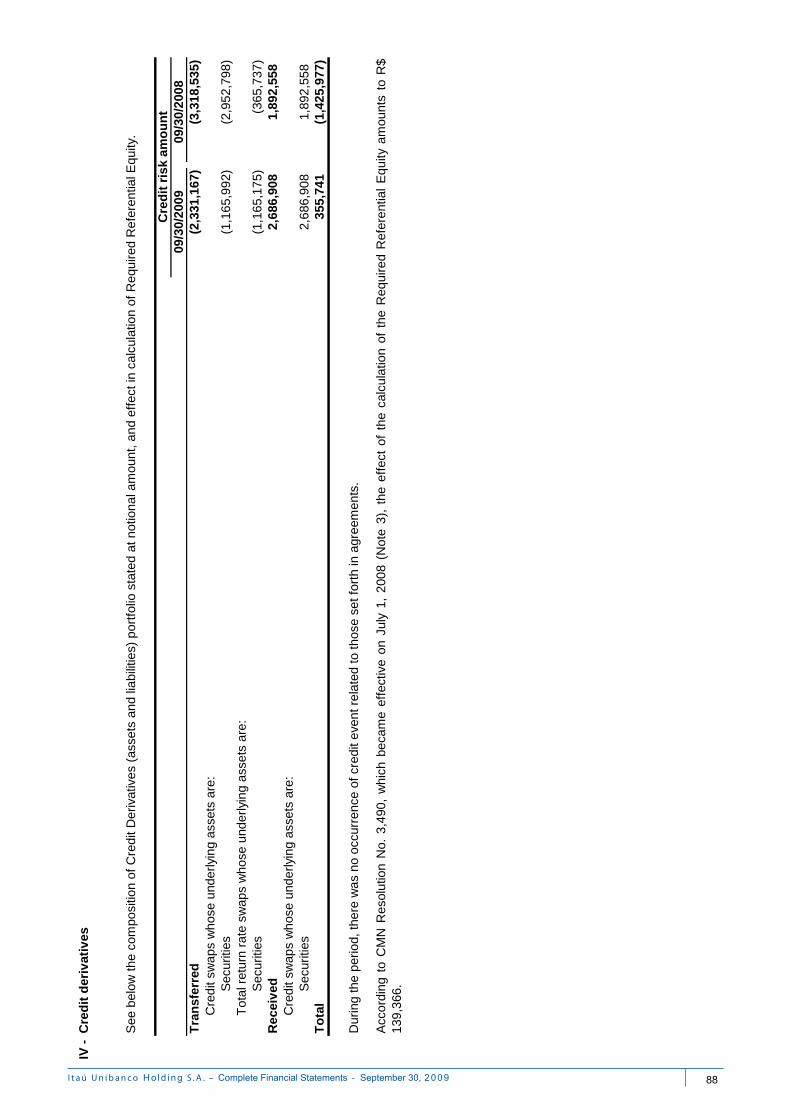
IV -
09/3
0/20
0909
/30/
2008
(2,3
31,1
67)
(3,3
18,5
35)
(1,1
65,9
92)
(2,9
52,7
98)
(1,1
65,1
75)
(365
,737
)
2,68
6,90
81,
892,
558
2,68
6,90
81,
892,
558
To
tal
355,
741
(1,4
25,9
77)
Acc
ordi
ngto
CM
NR
esol
utio
nN
o.3,
490,
whi
chbe
cam
eef
fect
ive
onJu
ly1,
2008
(Not
e3)
,th
eef
fect
ofth
eca
lcul
atio
nof
the
Req
uire
dR
efer
entia
lE
quity
amou
nts
toR
$13
9,36
6.
See
bel
ow th
e co
mpo
sitio
n of
Cre
dit D
eriv
ativ
es (
asse
ts a
nd li
abili
ties)
por
tfol
io s
tate
d at
not
iona
l am
ount
, and
eff
ect i
n ca
lcul
atio
n of
Req
uire
d R
efer
entia
l Equ
ity.
Cre
dit s
wap
s w
hose
und
erly
ing
asse
ts a
re:
Tot
al r
etur
n ra
te s
wap
s w
hose
und
erly
ing
asse
ts a
re:
Sec
uriti
es
Tra
nsf
erre
d
Sec
uriti
es
Cre
dit
ris
k am
ou
nt
Cre
dit
der
ivat
ives
Dur
ing
the
perio
d, th
ere
was
no
occu
rren
ce o
f cr
edit
even
t rel
ated
to th
ose
set f
orth
in a
gree
men
ts.
Sec
uriti
es
Rec
eiv
edC
redi
t sw
aps
who
se u
nder
lyin
g as
sets
are
:
I t a ú U n i b a n c o S . A . – - September 0
88
V - Accounting hedge a) The purpose of ITAÚ UNIBANCO hedge relationship is to protect the cash flow of payment of debt interest
(CDB / Redeemable preferred shares) related to its variable interest rate risk (CDI / LIBOR), making the cash flow constant (fixed rate) and regardless of the variations of DI Cetip Over and LIBOR.
To protect the future cash flows of debt against exposure to variable interest rate (CDI), at September 30, 2009 ITAÚ UNIBANCO HOLDING negotiated DI Futures agreements at BM&FBOVESPA with maturity between 2009 and 2017 in the amount of R$ 10,099,463. To protect the future cash flows of debt against exposure to variable interest rate (LIBOR), at September 30, 2009 ITAÚ UNIBANCO HOLDING negotiated Swap contracts with maturity in 2015 in the amount of R$ 698,921. These derivative financial instruments gave rise to adjustment to market value net of tax effects recorded in stockholders net equity of (R$ 170,867), of which (R$ 158,850) refers to CDB and (R$ 12,017) refers to Redeemable preferred shares. The hedged items total R$ 9,667,728 of CDB with maturities between 2009 and 2017 and R$ 698,921 of swaps of redeemable preferred shares with maturity in 2015. The gains or losses related to the accounting hedge of cash flows, which we expect that they be reclassified from stockholders’ equity into results in the following months, amount to R$ 116,567. The effectiveness computed for hedge portfolio was in conformity with the provisions of BACEN Circular No. 3,082 of January 30, 2002.
b) The swap operations contracted in a negotiation associated with the funding and/or investment in the amount of R$ 603,612 are recorded at amounts restated in accordance with variations occurred in respective ratios (“curve”) and are not valued at their market value, as permitted by BACEN Circular No. 3,150/02.
I t a ú U n i b a n c o S . A . – - September 0
89
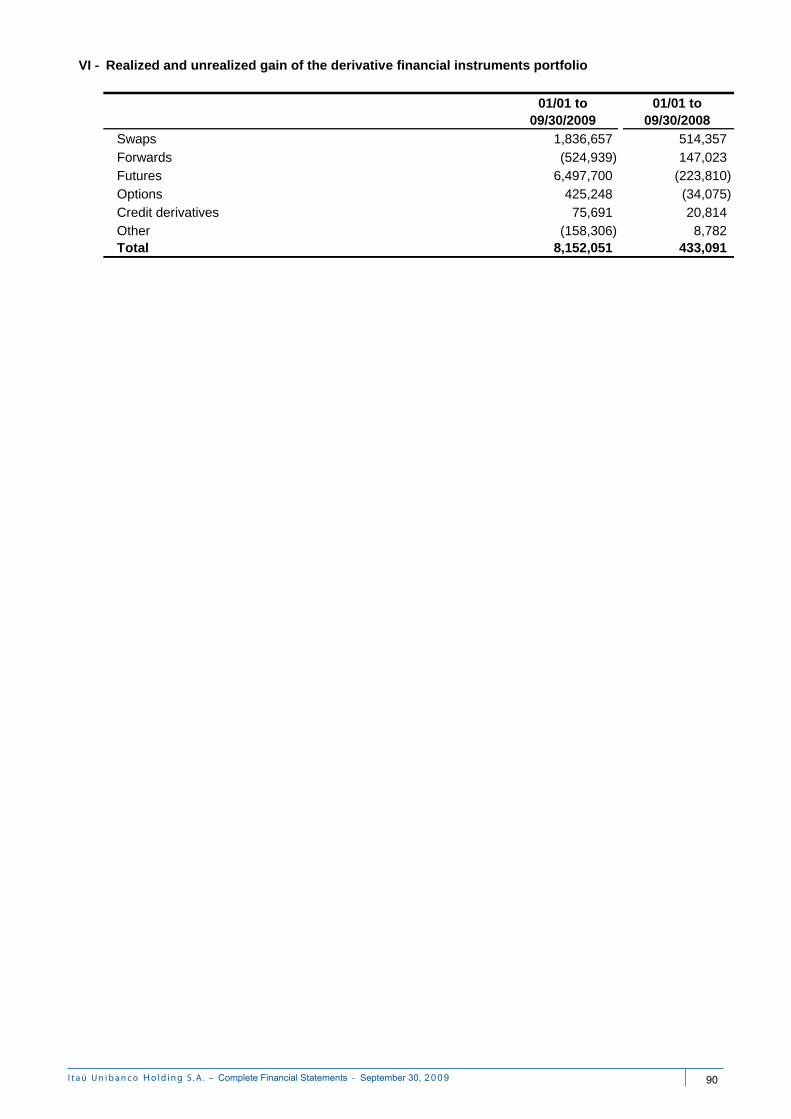
VI -
01/01 to 09/30/2009
01/01 to 09/30/2008
Swaps 1,836,657 514,357 Forwards (524,939) 147,023 Futures 6,497,700 (223,810) Options 425,248 (34,075) Credit derivatives 75,691 20,814 Other (158,306) 8,782 Total 8,152,051 433,091
Realized and unrealized gain of the derivative financial instruments portfolio
I t a ú U n i b a n c o S . A . – - September 0
90
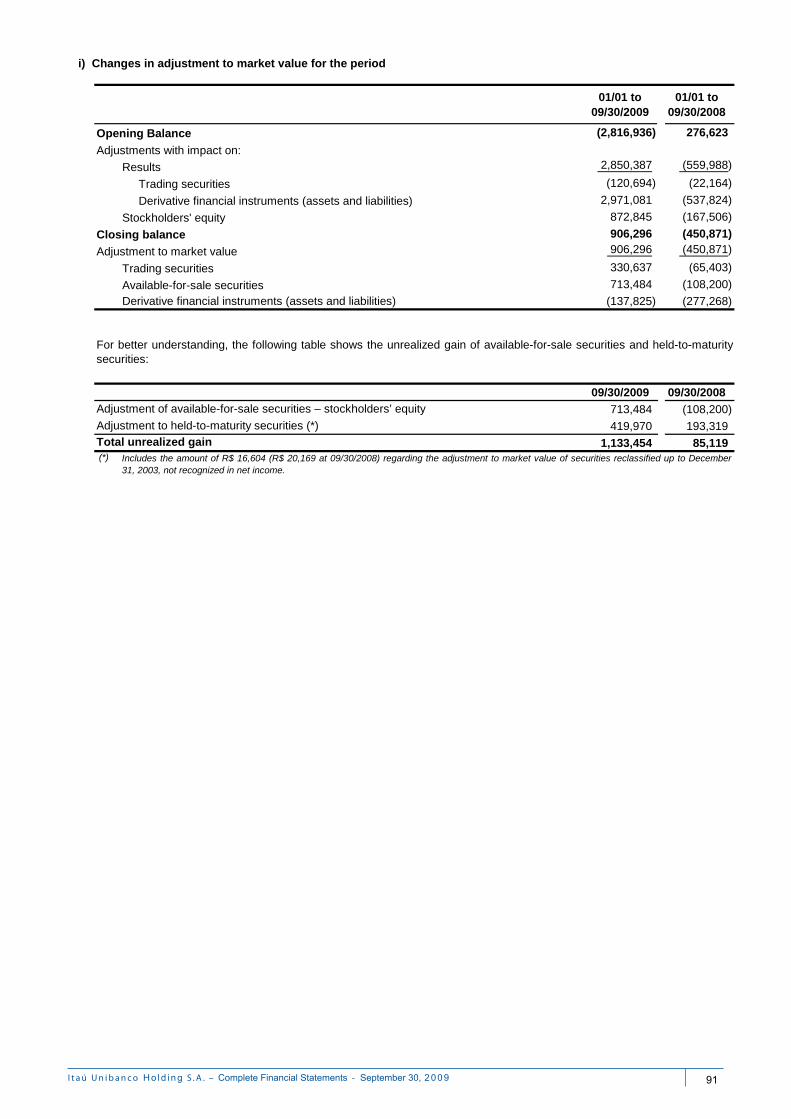
01/01 to 09/30/2009
01/01 to 09/30/2008
(2,816,936) 276,623
2,850,387 (559,988)
(120,694) (22,164)
2,971,081 (537,824)
872,845 (167,506)
906,296 (450,871) 906,296 (450,871)
330,637 (65,403)
713,484 (108,200)
(137,825) (277,268)
09/30/2009 09/30/2008
713,484 (108,200)
419,970 193,319
1,133,454 85,119 (*)
Adjustment to held-to-maturity securities (*)
Total unrealized gain
For better understanding, the following table shows the unrealized gain of available-for-sale securities and held-to-maturitysecurities:
Adjustment of available-for-sale securities – stockholders’ equity
i) Changes in adjustment to market value for the period
Available-for-sale securitiesDerivative financial instruments (assets and liabilities)
Includes the amount of R$ 16,604 (R$ 20,169 at 09/30/2008) regarding the adjustment to market value of securities reclassified up to December31, 2003, not recognized in net income.
Opening Balance
Results
Trading securities
Stockholders' equity
Adjustments with impact on:
Closing balance
Adjustment to market value
Trading securities
Derivative financial instruments (assets and liabilities)
I t a ú U n i b a n c o S . A . – - September 0
91
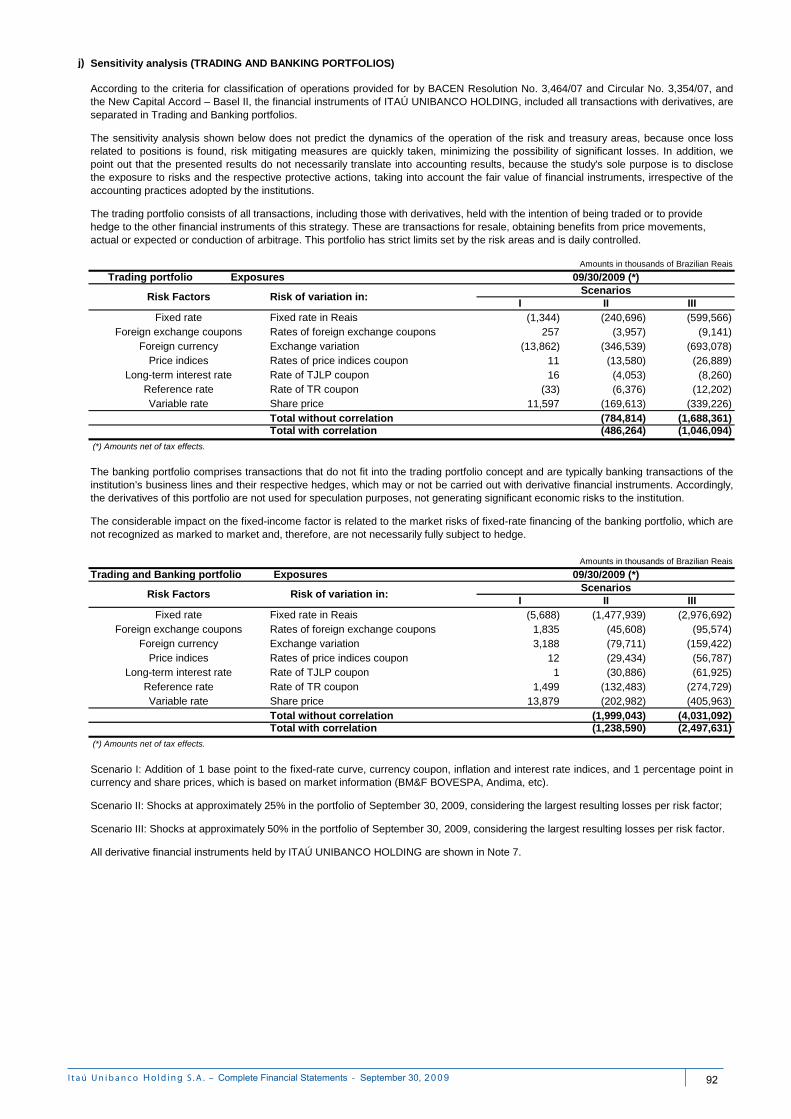
j)
Amounts in thousands of Brazilian Reais
I II IIIFixed rate Fixed rate in Reais (1,344) (240,696) (599,566)
Foreign exchange coupons Rates of foreign exchange coupons 257 (3,957) (9,141)Foreign currency Exchange variation (13,862) (346,539) (693,078)
Price indices Rates of price indices coupon 11 (13,580) (26,889)Long-term interest rate Rate of TJLP coupon 16 (4,053) (8,260)
Reference rate Rate of TR coupon (33) (6,376) (12,202)Variable rate Share price 11,597 (169,613) (339,226)
Total without correlation (784,814) (1,688,361)Total with correlation (486,264) (1,046,094)
Amounts in thousands of Brazilian Reais
I II IIIFixed rate Fixed rate in Reais (5,688) (1,477,939) (2,976,692)
Foreign exchange coupons Rates of foreign exchange coupons 1,835 (45,608) (95,574)Foreign currency Exchange variation 3,188 (79,711) (159,422)
Price indices Rates of price indices coupon 12 (29,434) (56,787)Long-term interest rate Rate of TJLP coupon 1 (30,886) (61,925)
Reference rate Rate of TR coupon 1,499 (132,483) (274,729)Variable rate Share price 13,879 (202,982) (405,963)
Total without correlation (1,999,043) (4,031,092)Total with correlation (1,238,590) (2,497,631)
Risk Factors Risk of variation in:Scenarios
All derivative financial instruments held by ITAÚ UNIBANCO HOLDING are shown in Note 7.
Scenario I: Addition of 1 base point to the fixed-rate curve, currency coupon, inflation and interest rate indices, and 1 percentage point incurrency and share prices, which is based on market information (BM&F BOVESPA, Andima, etc).
Scenario II: Shocks at approximately 25% in the portfolio of September 30, 2009, considering the largest resulting losses per risk factor;
Scenario III: Shocks at approximately 50% in the portfolio of September 30, 2009, considering the largest resulting losses per risk factor.
(*) Amounts net of tax effects.
The banking portfolio comprises transactions that do not fit into the trading portfolio concept and are typically banking transactions of theinstitution’s business lines and their respective hedges, which may or not be carried out with derivative financial instruments. Accordingly,the derivatives of this portfolio are not used for speculation purposes, not generating significant economic risks to the institution.
The considerable impact on the fixed-income factor is related to the market risks of fixed-rate financing of the banking portfolio, which arenot recognized as marked to market and, therefore, are not necessarily fully subject to hedge.
Trading and Banking portfolio Exposures 09/30/2009 (*)
Risk Factors Risk of variation in:Scenarios
(*) Amounts net of tax effects.
The trading portfolio consists of all transactions, including those with derivatives, held with the intention of being traded or to provide hedge to the other financial instruments of this strategy. These are transactions for resale, obtaining benefits from price movements, actual or expected or conduction of arbitrage. This portfolio has strict limits set by the risk areas and is daily controlled.
09/30/2009 (*)
Sensitivity analysis (TRADING AND BANKING PORTFOLIOS)
According to the criteria for classification of operations provided for by BACEN Resolution No. 3,464/07 and Circular No. 3,354/07, andthe New Capital Accord – Basel II, the financial instruments of ITAÚ UNIBANCO HOLDING, included all transactions with derivatives, areseparated in Trading and Banking portfolios.
The sensitivity analysis shown below does not predict the dynamics of the operation of the risk and treasury areas, because once lossrelated to positions is found, risk mitigating measures are quickly taken, minimizing the possibility of significant losses. In addition, wepoint out that the presented results do not necessarily translate into accounting results, because the study's sole purpose is to disclosethe exposure to risks and the respective protective actions, taking into account the fair value of financial instruments, irrespective of theaccounting practices adopted by the institutions.
Trading portfolio Exposures
I t a ú U n i b a n c o S . A . – - September 0
92
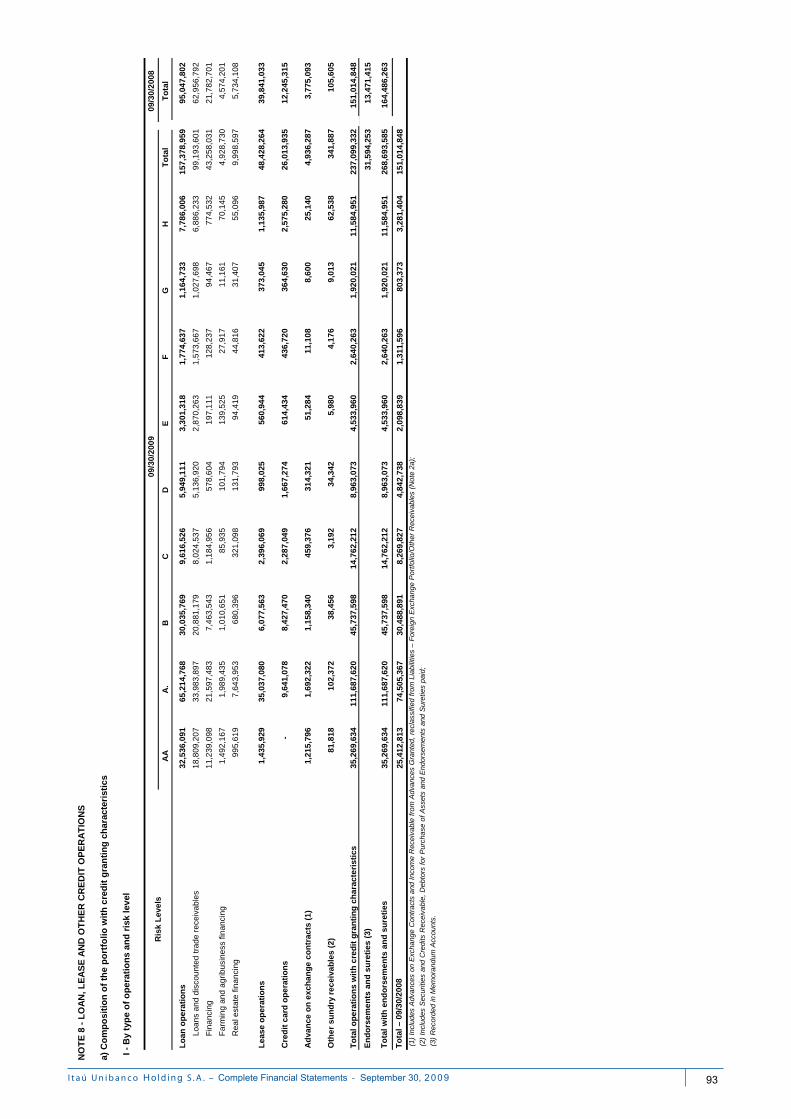
AA
A.
BC
DE
FG
HT
ota
lT
ota
l
32,5
36,0
91
65
,21
4,7
68
30
,035
,769
9,
616
,52
6
5
,94
9,1
11
3
,30
1,3
18
1,77
4,63
7
1,
164
,733
7,78
6,00
6
15
7,3
78,9
59
9
5,0
47
,80
2
Loa
ns
and
dis
coun
ted
trad
e re
ceiv
able
s18
,809
,207
33
,98
3,89
7
20,8
81,1
79
8,0
24
,53
7
5
,13
6,9
20
2
,870
,263
1,57
3,66
7
1,
027
,698
6,88
6,23
3
99
,193
,601
6
2,9
56
,79
2
Fin
anci
ng11
,239
,098
21
,59
7,48
3
7,4
63,5
43
1
,18
4,9
56
57
8,6
04
19
7,1
11
12
8,23
7
94
,46
7
7
74
,53
2
43,2
58,0
31
21,
78
2,7
01
Far
min
g an
d a
grib
usi
ness
fin
anci
ng
1,49
2,1
67
1,
989,
435
1,0
10,6
51
8
5,9
35
10
1,7
94
13
9,5
25
2
7,9
17
1
1,1
61
70,
14
5
4
,92
8,7
30
4,57
4,2
01
Rea
l est
ate
finan
cing
995
,619
7,
643,
953
68
0,3
96
3
21
,09
8
13
1,7
93
94
,41
9
44
,81
6
31
,40
7
5
5,0
96
9,9
98
,59
7
5,
734
,10
8
1,43
5,9
29
35
,03
7,08
0
6,0
77,5
63
2
,39
6,0
69
99
8,0
25
56
0,9
44
41
3,62
2
37
3,0
45
1,
135,
987
48,4
28,2
64
39,
84
1,0
33
-
9
,64
1,0
78
8,4
27,4
70
2
,28
7,0
49
1,6
67
,274
614
,434
43
6,72
0
36
4,6
30
2,
575,
280
26,0
13,9
35
12,
24
5,3
15
1,21
5,7
96
1,
692,
322
1,1
58,3
40
4
59
,37
6
31
4,3
21
51
,28
4
11
,10
8
8,6
00
25,
14
0
4
,93
6,2
87
3,77
5,0
93
81,8
18
1
02
,37
2
38
,45
6
3,1
92
3
4,3
42
5,9
80
4,1
76
9,0
13
62,
53
8
3
41
,88
7
10
5,6
05
35,2
69,6
34
111,
687,
620
45
,737
,598
14
,762
,21
2
8,96
3,0
73
4
,53
3,9
60
2,64
0,26
3
1,
920
,021
11,5
84,
951
23
7,0
99,3
32
15
1,01
4,8
48
31,5
94,2
53
13,
47
1,4
15
35,2
69,6
34
111,
687,
620
45
,737
,598
14
,762
,21
2
8,96
3,0
73
4
,53
3,9
60
2,64
0,26
3
1,
920
,021
11,5
84,
951
26
8,6
93,5
85
16
4,48
6,2
63
25,4
12,8
13
74
,50
5,3
67
30
,488
,891
8,
269
,82
7
4
,84
2,7
38
2
,09
8,8
39
1,31
1,59
6
8
03
,37
3
3,28
1,40
4
15
1,0
14,8
48
09/3
0/2
008
NO
TE
8 -
LO
AN
, LE
AS
E A
ND
OT
HE
R C
RE
DIT
OP
ER
AT
ION
S
a) C
om
po
siti
on
of
the
po
rtfo
lio w
ith
cre
dit
gra
nti
ng
ch
arac
teri
stic
s
I -
By
typ
e o
f o
per
atio
ns
and
ris
k le
vel
Ris
k L
eve
ls09
/30/
200
9
Lo
an
op
era
tio
ns
Le
ase
op
erat
ion
s
Cre
dit
car
d o
pe
rati
on
s
Ad
van
ce o
n e
xch
ang
e c
on
trac
ts (
1)
Oth
er
su
nd
ry r
ecei
vab
les
(2
)
To
tal
op
era
tio
ns
wit
h c
red
it g
ran
tin
g c
har
acte
rist
ics
En
do
rsem
ents
an
d s
ure
ties
(3)
To
tal
wit
h e
nd
ors
emen
ts a
nd
su
reti
es
(3)
Rec
orde
d in
Mem
oran
dum
Acc
ount
s.
To
tal
– 09
/30/
2008
(1)
Inc
lude
s A
dvan
ces
on E
xcha
nge
Con
trac
ts a
nd In
com
e R
ecei
vabl
e fr
om A
dvan
ces
Gra
nted
, rec
lass
ified
fro
m L
iabi
litie
s –
For
eign
Exc
hang
e P
ort
folio
/Oth
er R
ece
ivab
les
(No
te 2
a);
(2)
Inc
lude
s S
ecur
ities
and
Cre
dits
Rec
eiva
ble,
Deb
tors
for
Pur
chas
e of
Ass
ets
and
End
orse
men
ts a
nd S
uret
ies
paid
;
I t a ú U n i b a n c o S . A . – - September 0
93
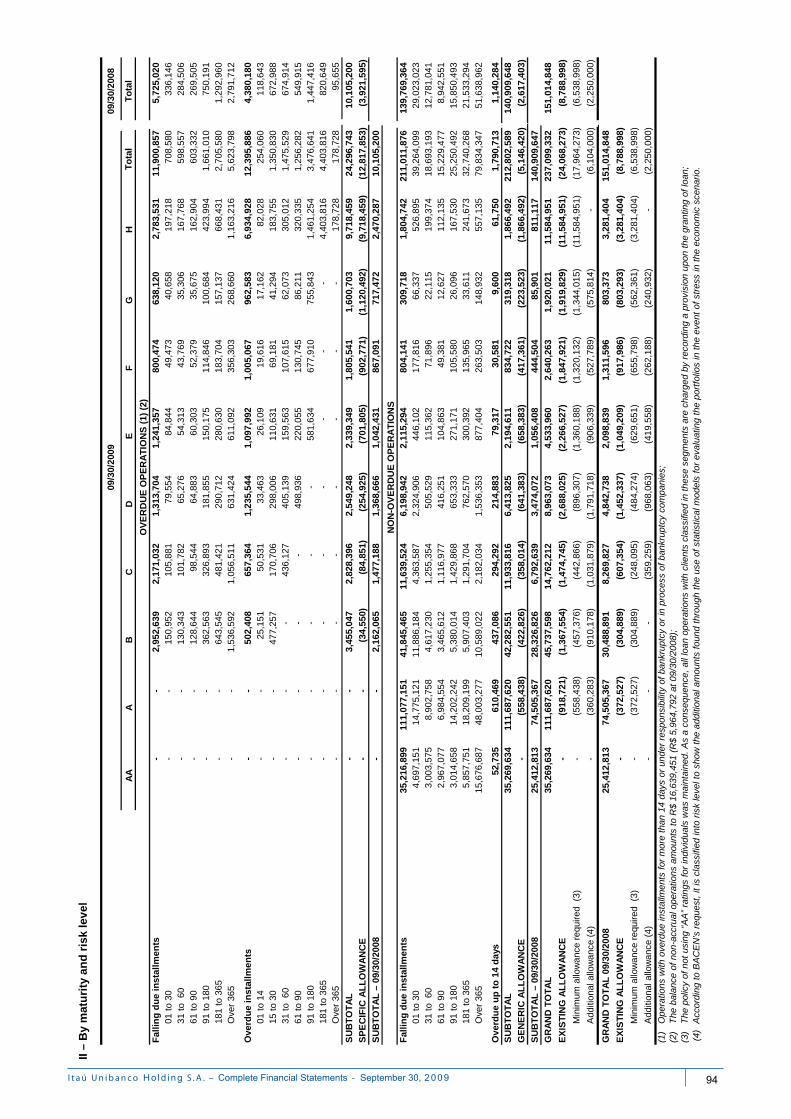
AA
AB
CD
EF
GH
To
tal
To
tal
-
-
2,95
2,63
9
2,
171,
032
1,31
3,70
4
1,
241,
357
800,
474
63
8,12
0
2,78
3,53
1
11,9
00,8
57
5,72
5,02
0
01
to
30-
-
15
0,95
2
105,
881
79
,554
84,8
44
49
,473
40,6
58
19
7,21
8
70
8,58
0
336,
146
31
to
60
-
-
130,
343
10
1,78
2
65,2
76
54
,313
43,7
69
35
,306
167,
768
598,
557
28
4,50
6
61 t
o 90
-
-
128,
644
98
,544
64,8
83
60
,303
52,3
79
35
,675
162,
904
603,
332
26
9,50
5
91 t
o 18
0-
-
36
2,56
3
326,
893
18
1,85
5
150,
175
11
4,84
6
100,
684
42
3,99
4
1,
661,
010
750,
191
18
1 to
365
-
-
643,
545
48
1,42
1
290,
712
28
0,63
0
183,
704
15
7,13
7
668,
431
2,70
5,58
0
1,
292,
960
Ove
r 36
5-
-
1,
536,
592
1,05
6,51
1
63
1,42
4
611,
092
35
6,30
3
268,
660
1,
163,
216
5,
623,
798
2,79
1,71
2
-
-
502,
408
65
7,36
4
1,23
5,54
4
1,
097,
992
1,00
5,06
7
96
2,58
3
6,93
4,92
8
12,3
95,8
86
4,38
0,18
0
01
to
14-
-
25
,151
50,5
31
33
,463
26,1
09
19
,616
17,1
62
82
,028
25
4,06
0
118,
643
15
to
30-
-
47
7,25
7
170,
706
29
8,00
6
110,
631
69
,181
41,2
94
18
3,75
5
1,
350,
830
672,
988
31
to
60
-
-
-
436,
127
40
5,13
9
159,
563
10
7,61
5
62,0
73
30
5,01
2
1,
475,
529
674,
914
61
to
90-
-
-
-
49
8,93
6
220,
055
13
0,74
5
86,2
11
32
0,33
5
1,
256,
282
549,
915
91
to
180
-
-
-
-
-
581,
634
67
7,91
0
755,
843
1,
461,
254
3,
476,
641
1,44
7,41
6
18
1 to
365
-
-
-
-
-
-
-
-
4,40
3,81
6
4,40
3,81
6
82
0,64
9
Ove
r 36
5-
-
-
-
-
-
-
-
17
8,72
8
17
8,72
8
95,6
55
-
-
3,45
5,04
7
2,
828,
396
2,54
9,24
8
2,
339,
349
1,80
5,54
1
1,
600,
703
9,71
8,45
9
24,2
96,7
43
10,1
05,2
00
-
-
(34,
550)
(84,
851)
(254
,925
)
(701
,805
)
(902
,771
)
(1,1
20,4
92)
(9
,718
,459
)
(1
2,81
7,85
3)
(3
,921
,595
)
-
-
2,16
2,06
5
1,
477,
188
1,36
8,66
6
1,
042,
431
867,
091
71
7,47
2
2,47
0,28
7
10,1
05,2
00
35,2
16,8
99
111,
077,
151
41,8
45,4
65
11,6
39,5
24
6,19
8,94
2
2,
115,
294
804,
141
30
9,71
8
1,80
4,74
2
211,
011,
876
139,
769,
364
01 t
o 30
4,69
7,15
1
14
,775
,121
11
,886
,184
4,
363,
587
2,32
4,90
6
44
6,10
2
177,
816
66
,337
526,
895
39,2
64,0
99
29,0
23,0
23
31 t
o 6
03,
003,
575
8,90
2,75
8
4,
617,
230
1,25
5,35
4
50
5,52
9
115,
362
71
,896
22,1
15
19
9,37
4
18
,693
,193
12
,781
,041
61
to
902,
967,
077
6,98
4,55
4
3,
465,
612
1,11
6,97
7
41
6,25
1
104,
863
49
,381
12,6
27
11
2,13
5
15
,229
,477
8,
942,
551
91 t
o 18
03,
014,
658
14,2
02,2
42
5,38
0,01
4
1,
429,
868
653,
333
27
1,17
1
105,
580
26
,096
167,
530
25,2
50,4
92
15,8
50,4
93
181
to 3
655,
857,
751
18,2
09,1
99
5,90
7,40
3
1,
291,
704
762,
570
30
0,39
2
135,
965
33
,611
241,
673
32,7
40,2
68
21,5
33,2
94
Ove
r 36
515
,676
,687
48
,003
,277
10
,589
,022
2,
182,
034
1,53
6,35
3
87
7,40
4
263,
503
14
8,93
2
557,
135
79,8
34,3
47
51,6
38,9
62
52,7
35
61
0,46
9
437,
086
29
4,29
2
214,
883
79
,317
30,5
81
9,
600
61
,750
1,
790,
713
1,14
0,28
4
35
,269
,634
11
1,68
7,62
0
42
,282
,551
11
,933
,816
6,
413,
825
2,19
4,61
1
83
4,72
2
319,
318
1,
866,
492
21
2,80
2,58
9
14
0,90
9,64
8
-
(558
,438
)
(422
,826
)
(358
,014
)
(641
,383
)
(658
,383
)
(417
,361
)
(223
,523
)
(1,8
66,4
92)
(5,1
46,4
20)
(2
,617
,403
)
25,4
12,8
13
74,5
05,3
67
28,3
26,8
26
6,79
2,63
9
3,
474,
072
1,05
6,40
8
44
4,50
4
85,9
01
81
1,11
7
14
0,90
9,64
7
GR
AN
D T
OT
AL
35,2
69,6
34
111,
687,
620
45,7
37,5
98
14,7
62,2
12
8,96
3,07
3
4,
533,
960
2,64
0,26
3
1,
920,
021
11,5
84,9
51
23
7,09
9,33
2
15
1,01
4,84
8
-
(918
,721
)
(1,3
67,5
54)
(1
,474
,745
)
(2,6
88,0
25)
(2
,266
,527
)
(1,8
47,9
21)
(1
,919
,829
)
(11,
584,
951)
(2
4,06
8,27
3)
(8
,788
,998
)
Min
imum
allo
wan
ce r
equi
red
(3)
-
(558
,438
)
(457
,376
)
(442
,866
)
(896
,307
)
(1,3
60,1
88)
(1
,320
,132
)
(1,3
44,0
15)
(1
1,58
4,95
1)
(17,
964,
273)
(6,5
38,9
98)
Add
ition
al a
llow
ance
(4)
-
(360
,283
)
(910
,178
)
(1,0
31,8
79)
(1
,791
,718
)
(906
,339
)
(527
,789
)
(575
,814
)
-
(6
,104
,000
)
(2,2
50,0
00)
25,4
12,8
13
74,5
05,3
67
30,4
88,8
91
8,26
9,82
7
4,
842,
738
2,09
8,83
9
1,
311,
596
803,
373
3,
281,
404
15
1,01
4,84
8
-
(372
,527
)
(304
,889
)
(607
,354
)
(1,4
52,3
37)
(1
,049
,209
)
(917
,986
)
(803
,293
)
(3,2
81,4
04)
(8,7
88,9
98)
Min
imum
allo
wan
ce r
equi
red
(3)
-
(3
72,5
27)
(3
04,8
89)
(2
48,0
95)
(4
84,2
74)
(6
29,6
51)
(6
55,7
98)
(5
62,3
61)
(3
,281
,404
)
(6
,538
,998
)
Add
ition
al a
llow
ance
(4)
-
-
-
(359
,259
)
(968
,063
)
(419
,558
)
(262
,188
)
(240
,932
)
-
(2
,250
,000
)
(1)
(2)
(3)
(4)
The
pol
icy
of n
ot u
sing
“A
A”
ratin
gs f
or in
divi
dual
s w
as m
aint
aine
d. A
s a
cons
eque
nce,
all
loan
ope
ratio
ns w
ith c
lient
s cl
assi
fied
in t
hese
seg
men
ts a
re c
harg
ed b
y re
cord
ing
a pr
ovis
ion
upon
the
gra
ntin
g of
loan
;
GR
AN
D T
OT
AL
09/
30/2
008
EX
IST
ING
AL
LO
WA
NC
E
The
bal
ance
of
non-
accr
ual o
pera
tions
am
ount
s to
R$
16,6
39,4
51 (
R$
5,96
4,79
2 at
09/
30/2
008)
;
NO
N-O
VE
RD
UE
OP
ER
AT
ION
SF
alli
ng
du
e in
stal
lmen
ts
Ove
rdu
e u
p t
o 1
4 d
ays
SU
BT
OT
AL
SP
EC
IFIC
AL
LO
WA
NC
E
SU
BT
OT
AL
– 0
9/30
/200
8
EX
IST
ING
AL
LO
WA
NC
E
GE
NE
RIC
AL
LO
WA
NC
E
SU
BT
OT
AL
– 0
9/30
/200
8
Acc
ordi
ng t
o B
AC
EN
’s r
eque
st,
it is
cla
ssifi
ed in
to r
isk
leve
l to
show
the
add
ition
al a
mou
nts
foun
d th
roug
h th
e us
e of
sta
tistic
al m
odel
s fo
r ev
alua
ting
the
port
folio
s in
the
eve
nt o
f st
ress
in t
he e
cono
mic
sce
nario
.
II –
By
mat
uri
ty a
nd
ris
k le
vel
09/3
0/20
0909
/30/
2008
OV
ER
DU
E O
PE
RA
TIO
NS
(1)
(2)
Ope
ratio
ns w
ith o
verd
ue in
stal
lmen
ts f
or m
ore
than
14
days
or
unde
r re
spon
sibi
lity
of b
ankr
uptc
y or
in p
roce
ss o
f ba
nkru
ptcy
com
pani
es;
Fal
lin
g d
ue
inst
allm
ents
Ove
rdu
e in
stal
lmen
ts
SU
BT
OT
AL
I t a ú U n i b a n c o S . A . – - September 0
94
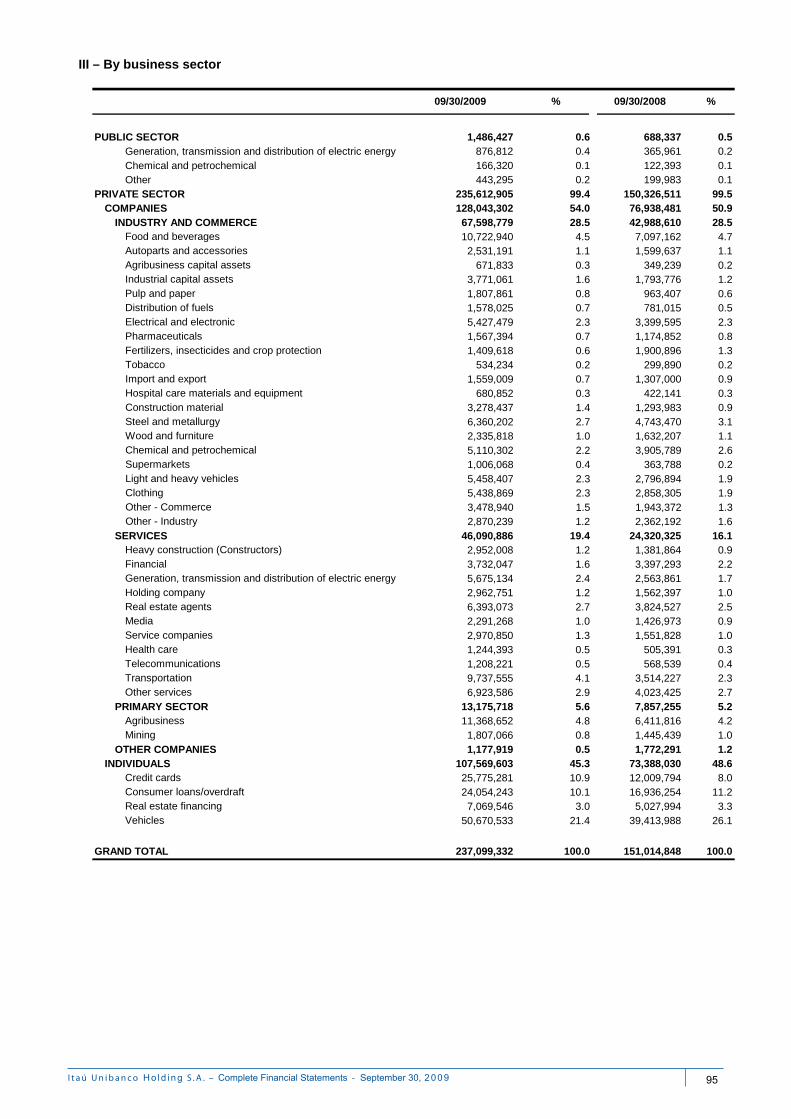
1,486,427 0.6 688,337 0.5Generation, transmission and distribution of electric energy 876,812 0.4 365,961 0.2Chemical and petrochemical 166,320 0.1 122,393 0.1Other 443,295 0.2 199,983 0.1
235,612,905 99.4 150,326,511 99.5128,043,302 54.0 76,938,481 50.967,598,779 28.5 42,988,610 28.5
Food and beverages 10,722,940 4.5 7,097,162 4.7Autoparts and accessories 2,531,191 1.1 1,599,637 1.1Agribusiness capital assets 671,833 0.3 349,239 0.2Industrial capital assets 3,771,061 1.6 1,793,776 1.2Pulp and paper 1,807,861 0.8 963,407 0.6Distribution of fuels 1,578,025 0.7 781,015 0.5Electrical and electronic 5,427,479 2.3 3,399,595 2.3Pharmaceuticals 1,567,394 0.7 1,174,852 0.8Fertilizers, insecticides and crop protection 1,409,618 0.6 1,900,896 1.3Tobacco 534,234 0.2 299,890 0.2Import and export 1,559,009 0.7 1,307,000 0.9Hospital care materials and equipment 680,852 0.3 422,141 0.3Construction material 3,278,437 1.4 1,293,983 0.9Steel and metallurgy 6,360,202 2.7 4,743,470 3.1Wood and furniture 2,335,818 1.0 1,632,207 1.1Chemical and petrochemical 5,110,302 2.2 3,905,789 2.6Supermarkets 1,006,068 0.4 363,788 0.2Light and heavy vehicles 5,458,407 2.3 2,796,894 1.9Clothing 5,438,869 2.3 2,858,305 1.9Other - Commerce 3,478,940 1.5 1,943,372 1.3Other - Industry 2,870,239 1.2 2,362,192 1.6
46,090,886 19.4 24,320,325 16.1Heavy construction (Constructors) 2,952,008 1.2 1,381,864 0.9Financial 3,732,047 1.6 3,397,293 2.2Generation, transmission and distribution of electric energy 5,675,134 2.4 2,563,861 1.7Holding company 2,962,751 1.2 1,562,397 1.0Real estate agents 6,393,073 2.7 3,824,527 2.5Media 2,291,268 1.0 1,426,973 0.9Service companies 2,970,850 1.3 1,551,828 1.0Health care 1,244,393 0.5 505,391 0.3Telecommunications 1,208,221 0.5 568,539 0.4Transportation 9,737,555 4.1 3,514,227 2.3Other services 6,923,586 2.9 4,023,425 2.7
13,175,718 5.6 7,857,255 5.2Agribusiness 11,368,652 4.8 6,411,816 4.2Mining 1,807,066 0.8 1,445,439 1.0
1,177,919 0.5 1,772,291 1.2107,569,603 45.3 73,388,030 48.6
Credit cards 25,775,281 10.9 12,009,794 8.0Consumer loans/overdraft 24,054,243 10.1 16,936,254 11.2Real estate financing 7,069,546 3.0 5,027,994 3.3Vehicles 50,670,533 21.4 39,413,988 26.1
237,099,332 100.0 151,014,848 100.0GRAND TOTAL
SERVICES
PRIMARY SECTOR
OTHER COMPANIESINDIVIDUALS
PUBLIC SECTOR
PRIVATE SECTORCOMPANIES
INDUSTRY AND COMMERCE
III – By business sector
09/30/2009 % 09/30/2008 %
I t a ú U n i b a n c o S . A . – - September 0
95
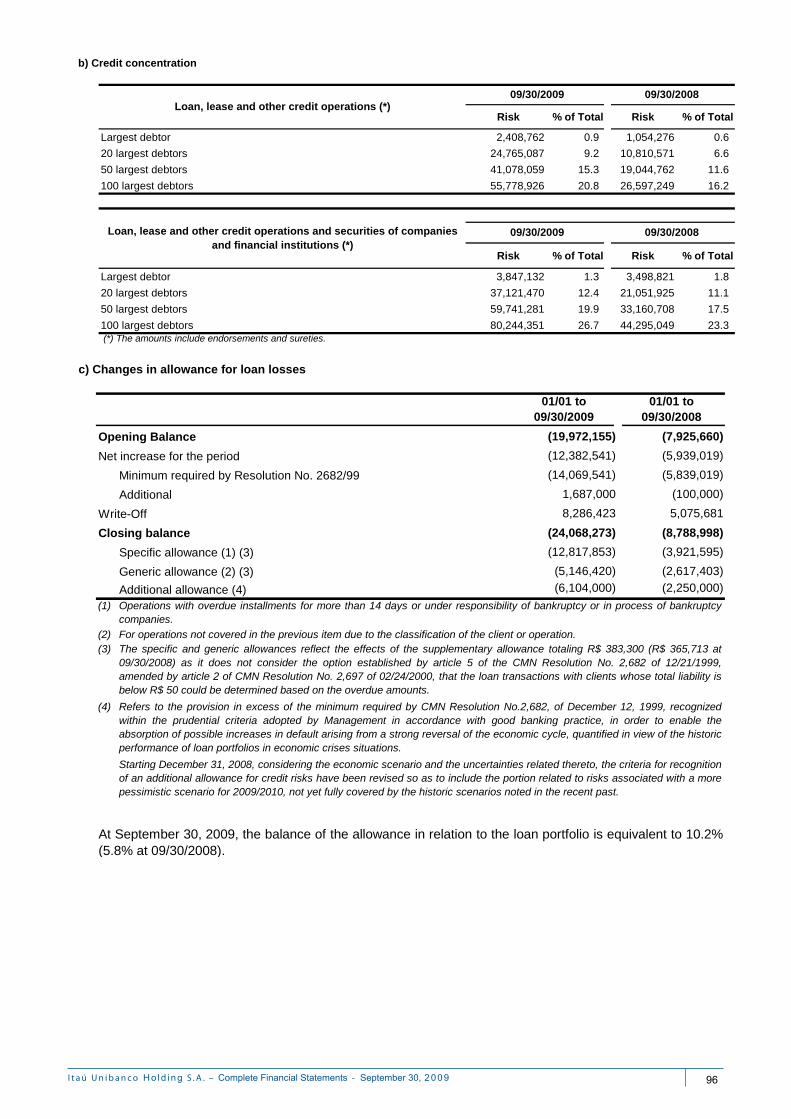
Risk % of Total Risk % of Total
Largest debtor 2,408,762 0.9 1,054,276 0.6
20 largest debtors 24,765,087 9.2 10,810,571 6.6
50 largest debtors 41,078,059 15.3 19,044,762 11.6
100 largest debtors 55,778,926 20.8 26,597,249 16.2
Risk % of Total Risk % of Total
Largest debtor 3,847,132 1.3 3,498,821 1.8
20 largest debtors 37,121,470 12.4 21,051,925 11.1
50 largest debtors 59,741,281 19.9 33,160,708 17.5
100 largest debtors 80,244,351 26.7 44,295,049 23.3 (*) The amounts include endorsements and sureties.
09/30/2009 09/30/2008
b) Credit concentration
09/30/2009 09/30/2008
Loan, lease and other credit operations and securities of companies and financial institutions (*)
Loan, lease and other credit operations (*)
(19,972,155) (7,925,660)
(12,382,541) (5,939,019)
Minimum required by Resolution No. 2682/99 (14,069,541) (5,839,019)
Additional 1,687,000 (100,000)
8,286,423 5,075,681
(24,068,273) (8,788,998)
Specific allowance (1) (3) (12,817,853) (3,921,595)
Generic allowance (2) (3) (5,146,420) (2,617,403)
Additional allowance (4) (6,104,000) (2,250,000)
(1)
(2) (3) The specific and generic allowances reflect the effects of the supplementary allowance totaling R$ 383,300 (R$ 365,713 at
09/30/2008) as it does not consider the option established by article 5 of the CMN Resolution No. 2,682 of 12/21/1999,amended by article 2 of CMN Resolution No. 2,697 of 02/24/2000, that the loan transactions with clients whose total liability isbelow R$ 50 could be determined based on the overdue amounts.
c) Changes in allowance for loan losses
01/01 to09/30/2008
Operations with overdue installments for more than 14 days or under responsibility of bankruptcy or in process of bankruptcycompanies.
01/01 to09/30/2009
At September 30, 2009, the balance of the allowance in relation to the loan portfolio is equivalent to 10.2%(5.8% at 09/30/2008).
Opening Balance
Net increase for the period
Write-Off
Refers to the provision in excess of the minimum required by CMN Resolution No.2,682, of December 12, 1999, recognizedwithin the prudential criteria adopted by Management in accordance with good banking practice, in order to enable theabsorption of possible increases in default arising from a strong reversal of the economic cycle, quantified in view of the historicperformance of loan portfolios in economic crises situations.
For operations not covered in the previous item due to the classification of the client or operation.
Closing balance
Starting December 31, 2008, considering the economic scenario and the uncertainties related thereto, the criteria for recognitionof an additional allowance for credit risks have been revised so as to include the portion related to risks associated with a morepessimistic scenario for 2009/2010, not yet fully covered by the historic scenarios noted in the recent past.
(4)
I t a ú U n i b a n c o S . A . – - September 0
96
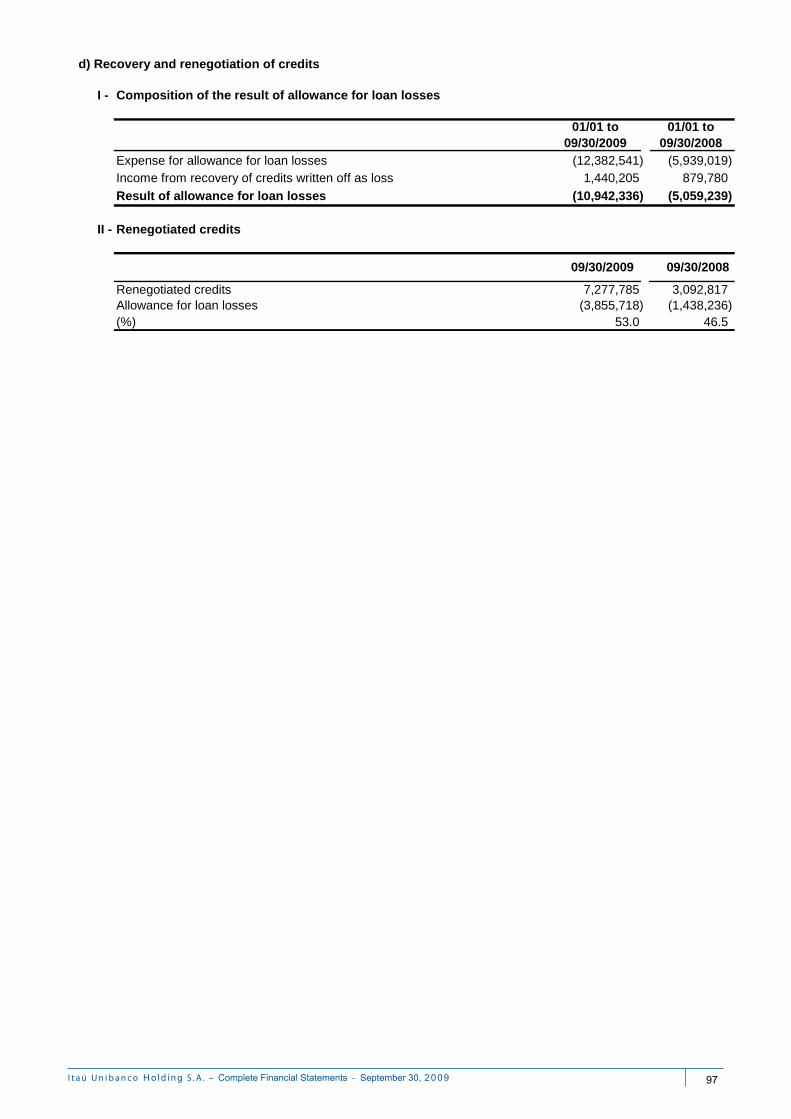
I - Composition of the result of allowance for loan losses
Expense for allowance for loan losses (12,382,541) (5,939,019) Income from recovery of credits written off as loss 1,440,205 879,780
Result of allowance for loan losses (10,942,336) (5,059,239)
II - Renegotiated credits
Renegotiated credits 7,277,785 3,092,817 Allowance for loan losses (3,855,718) (1,438,236) (%) 53.0 46.5
09/30/2009 09/30/2008
d) Recovery and renegotiation of credits
01/01 to09/30/2009
01/01 to09/30/2008
I t a ú U n i b a n c o S . A . – - September 0
97
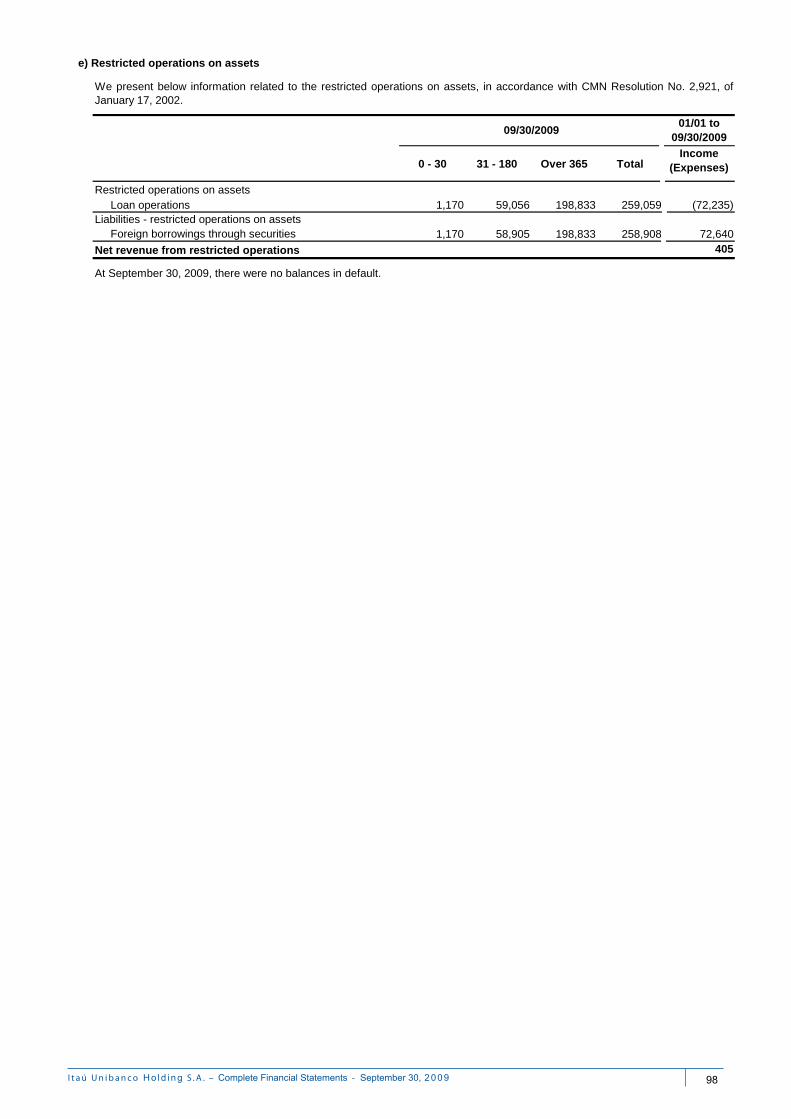
0 - 30 31 - 180 Over 365 TotalIncome
(Expenses)
Loan operations 1,170 59,056 198,833 259,059 (72,235)
Foreign borrowings through securities 1,170 58,905 198,833 258,908 72,640 405 Net revenue from restricted operations
At September 30, 2009, there were no balances in default.
e) Restricted operations on assets
Restricted operations on assets
We present below information related to the restricted operations on assets, in accordance with CMN Resolution No. 2,921, ofJanuary 17, 2002.
Liabilities - restricted operations on assets
09/30/200901/01 to
09/30/2009
I t a ú U n i b a n c o S . A . – - September 0
98
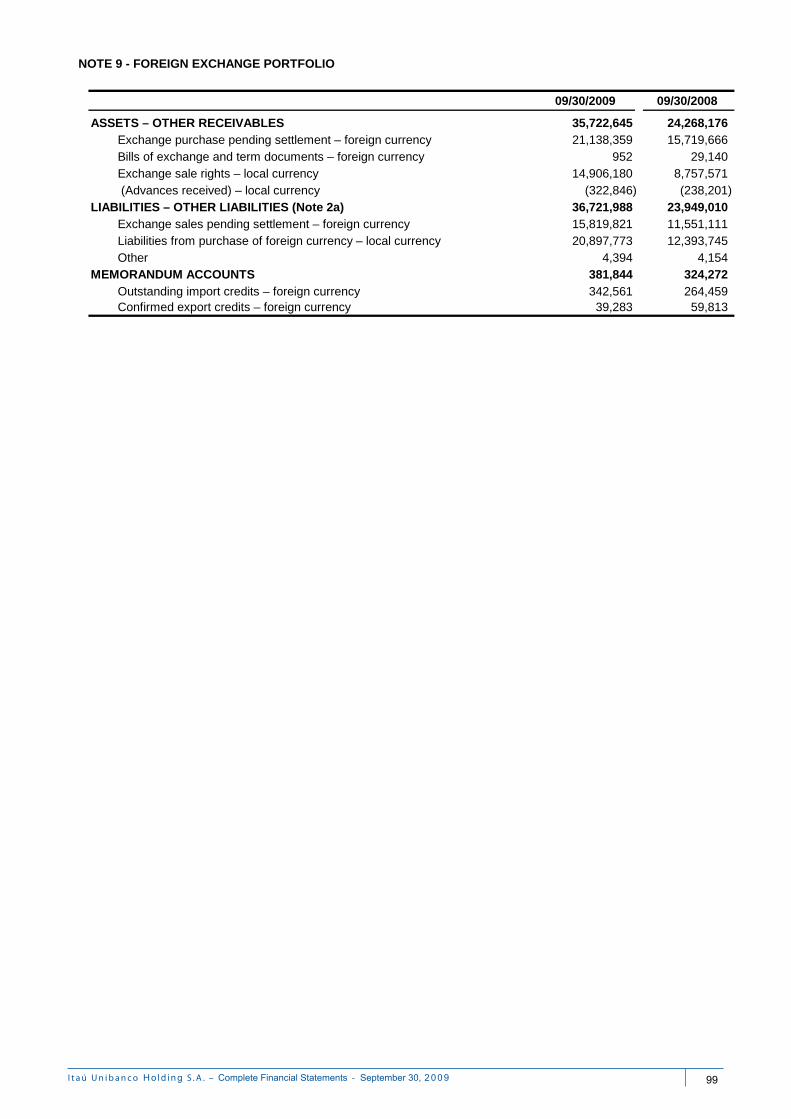
09/30/2009 09/30/2008
35,722,645 24,268,176 Exchange purchase pending settlement – foreign currency 21,138,359 15,719,666 Bills of exchange and term documents – foreign currency 952 29,140 Exchange sale rights – local currency 14,906,180 8,757,571 (Advances received) – local currency (322,846) (238,201)
36,721,988 23,949,010 Exchange sales pending settlement – foreign currency 15,819,821 11,551,111 Liabilities from purchase of foreign currency – local currency 20,897,773 12,393,745 Other 4,394 4,154
381,844 324,272 Outstanding import credits – foreign currency 342,561 264,459 Confirmed export credits – foreign currency 39,283 59,813
NOTE 9 - FOREIGN EXCHANGE PORTFOLIO
ASSETS – OTHER RECEIVABLES
LIABILITIES – OTHER LIABILITIES (Note 2a)
MEMORANDUM ACCOUNTS
I t a ú U n i b a n c o S . A . – - September 0
99
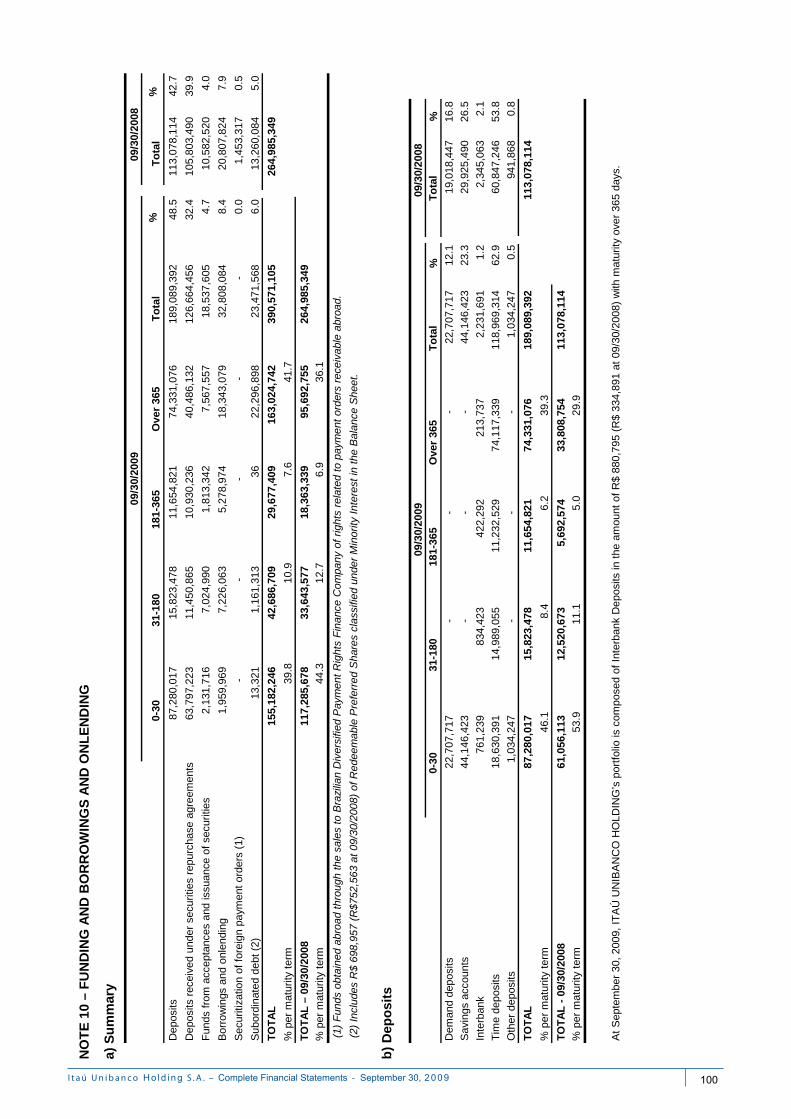
0-30
31-1
8018
1-36
5O
ver
365
To
tal
%T
ota
l%
Dep
osits
87,2
80,0
17
15,8
23,4
78
11,6
54,8
21
74,3
31,0
76
189,
089,
392
48.5
113,
078,
114
42
.7
Dep
osits
rec
eive
d un
der
secu
ritie
s re
purc
hase
agr
eem
ents
63,7
97,2
23
11,4
50,8
65
10,9
30,2
36
40,4
86,1
32
126,
664,
456
32.4
105,
803,
490
39
.9
Fun
ds f
rom
acc
epta
nces
and
issu
ance
of
secu
ritie
s2,
131,
716
7,02
4,99
0
1,
813,
342
7,56
7,55
7
18
,537
,605
4.
710
,582
,520
4.0
Bor
row
ings
and
onl
endi
ng1,
959,
969
7,22
6,06
3
5,
278,
974
18,3
43,0
79
32,8
08,0
84
8.4
20,8
07,8
24
7.
9
Sec
uriti
zatio
n of
for
eign
pay
men
t or
ders
(1)
-
-
-
-
-
0.0
1,45
3,31
7
0.5
Sub
ordi
nate
d de
bt (
2)13
,321
1,16
1,31
3
36
22
,296
,898
23
,471
,568
6.
013
,260
,084
5.0
TO
TA
L
155,
182,
246
42,6
86,7
09
29,6
77,4
09
163,
024,
742
390,
571,
105
264,
985,
349
% p
er m
atur
ity t
erm
39.8
10.9
7.6
41.7
TO
TA
L –
09/
30/2
008
117,
285,
678
33,6
43,5
77
18,3
63,3
39
95,6
92,7
55
264,
985,
349
% p
er m
atur
ity t
erm
44.3
12.7
6.9
36.1
(2)
Inc
lude
s R
$ 69
8,95
7 (R
$752
,563
at
09/3
0/20
08)
of R
edee
mab
le P
refe
rred
Sha
res
clas
sifie
d un
der
Min
ority
Int
eres
t in
the
Bal
ance
She
et.
NO
TE
10
– F
UN
DIN
G A
ND
BO
RR
OW
ING
S A
ND
ON
LE
ND
ING
a) S
um
mar
y
09/3
0/20
0809
/30/
2009
(1)
Fun
ds o
btai
ned
abro
ad t
hrou
gh t
he s
ales
to
Bra
zilia
n D
iver
sifie
d P
aym
ent
Rig
hts
Fin
ance
Com
pany
of
right
s re
late
d to
pay
me
nt o
rder
s re
ceiv
able
abr
oad.
0-30
31-1
8018
1-36
5O
ver
365
To
tal
%T
ota
l%
Dem
and
depo
sits
22,7
07,7
17
-
-
-
22
,707
,717
12.1
19,0
18,4
47
16
.8
Sav
ings
acc
ount
s44
,146
,423
-
-
-
44,1
46,4
23
23
.329
,925
,490
26.5
Inte
rban
k76
1,23
9
83
4,42
3
42
2,29
2
21
3,73
7
2,23
1,69
1
1.2
2,34
5,06
3
2.1
Tim
e de
posi
ts18
,630
,391
14,9
89,0
55
11
,232
,529
74,1
17,3
39
118,
969,
314
62
.960
,847
,246
53.8
Oth
er d
epos
its1,
034,
247
-
-
-
1,
034,
247
0.
594
1,86
8
0.
8
TO
TA
L
87,2
80,0
17
15
,823
,478
11,6
54,8
21
74
,331
,076
18
9,08
9,39
2
113,
078,
114
% p
er m
atur
ity t
erm
46.1
8.4
6.2
39.3
TO
TA
L -
09/
30/2
008
61,0
56,1
13
12
,520
,673
5,69
2,57
4
33,8
08,7
54
113,
078,
114
% p
er m
atur
ity t
erm
53.9
11.1
5.0
29.9
At
Sep
tem
ber
30,
2009
, IT
AÚ
UN
IBA
NC
O H
OLD
ING
’s p
ortf
olio
is c
ompo
sed
of I
nter
bank
Dep
osits
in t
he a
mou
nt o
f R
$ 88
0,79
5 (R
$ 33
4,89
1 at
09/
30/2
008)
with
mat
urity
ove
r 36
5 da
ys.
b)
Dep
osi
ts
09/3
0/20
0809
/30/
2009
I t a ú U n i b a n c o S . A . – - September 0
100
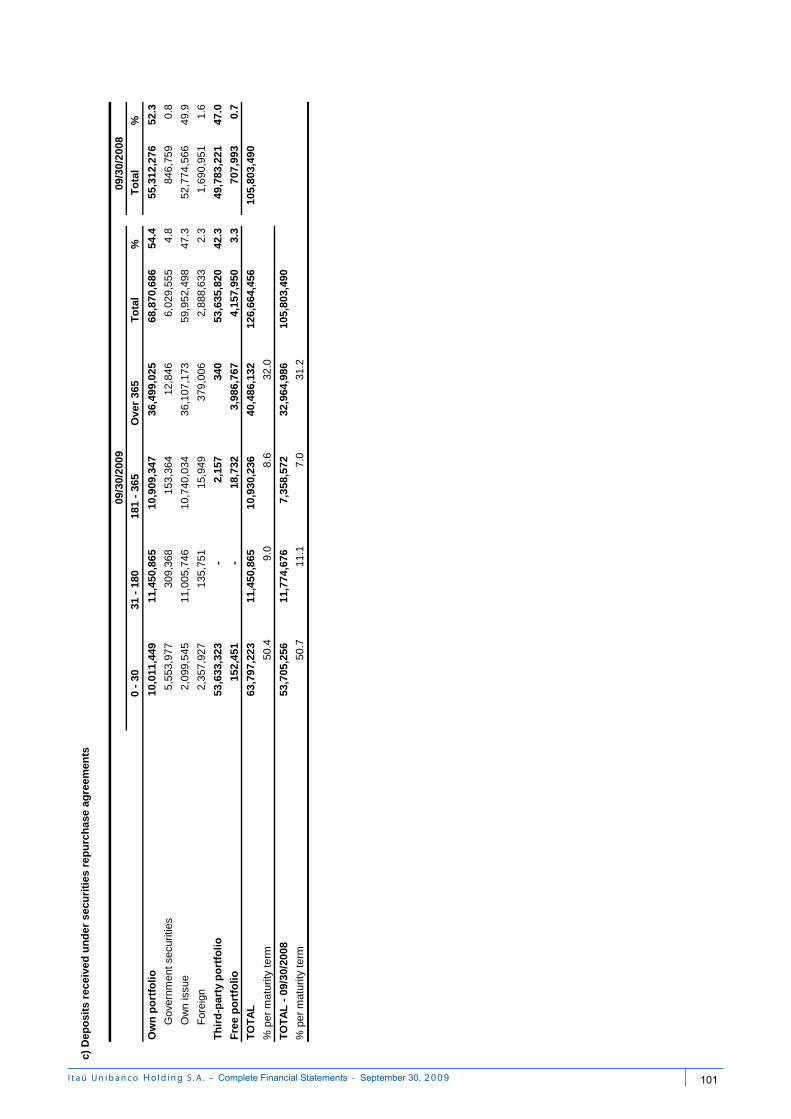
0 -
3031
- 1
8018
1 -
365
Ove
r 36
5T
ota
l%
To
tal
%
10,0
11,4
49
11,4
50,8
65
10,9
09,3
47
36,4
99,0
25
68,8
70,6
86
54.4
55,3
12,2
76
52
.3
Gov
ernm
ent
secu
ritie
s5,
553,
977
309,
368
153,
364
12,8
46
6,02
9,55
5
4.
884
6,75
9
0.8
Ow
n is
sue
2,09
9,54
5
11
,005
,746
10
,740
,034
36
,107
,173
59
,952
,498
47
.352
,774
,566
49.9
For
eign
2,35
7,92
7
13
5,75
1
15
,949
37
9,00
6
2,
888,
633
2.3
1,69
0,95
1
1.6
53,6
33,3
23
-
2,
157
340
53
,635
,820
42
.349
,783
,221
47.0
152,
451
-
18
,732
3,
986,
767
4,15
7,95
0
3.
370
7,99
3
0.7
63,7
97,2
23
11,4
50,8
65
10,9
30,2
36
40,4
86,1
32
126,
664,
456
105,
803,
490
50.4
9.0
8.6
32.0
53,7
05,2
56
11,7
74,6
76
7,35
8,57
2
32
,964
,986
10
5,80
3,49
0
50.7
11.1
7.0
31.2
TO
TA
L -
09/
30/2
008
% p
er m
atur
ity t
erm
Ow
n p
ort
foli
o
Th
ird
-par
ty p
ort
foli
o
TO
TA
L
Fre
e p
ort
foli
o
c) D
epo
sits
rec
eive
d u
nd
er s
ecu
riti
es r
epu
rch
ase
agre
emen
ts
% p
er m
atur
ity t
erm
09/3
0/20
0909
/30/
2008
I t a ú U n i b a n c o S . A . – - September 0
101
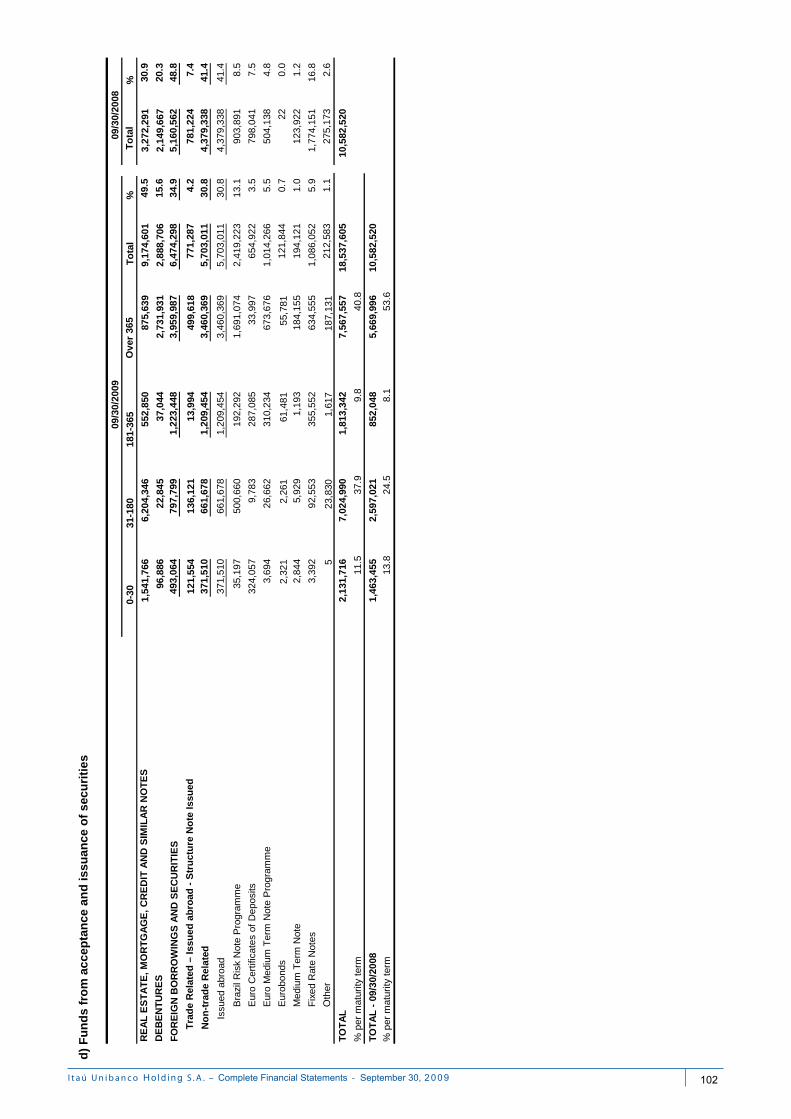
0-30
31-1
8018
1-36
5O
ver
365
To
tal
%T
ota
l%
1,54
1,76
6
6,
204,
346
552,
850
875,
639
9,17
4,60
1
49
.5
3,
272,
291
30.9
96,8
86
22
,845
37,0
44
2,73
1,93
1
2,
888,
706
15.6
2,14
9,66
7
20
.3
493
,064
797
,799
1,2
23,4
48 3
,959
,987
6,4
74,2
98 3
4.9
5,1
60,5
62 4
8.8
121,
554
136,
121
13
,994
49
9,61
8
7
71,2
87 4
.2 7
81,2
24 7
.4
371
,510
661
,678
1,2
09,4
54 3
,460
,369
5,7
03,0
11 3
0.8
4,3
79,3
38 4
1.4
371
,510
661
,678
1,2
09,4
54 3
,460
,369
5,7
03,0
11 3
0.8
4,3
79,3
38 4
1.4
Bra
zil R
isk
Not
e P
rogr
amm
e35
,197
500,
660
19
2,29
2
1,
691,
074
2,41
9,22
3
13
.1
90
3,89
1
8.5
Eur
o C
ertif
icat
es o
f D
epos
its32
4,05
7
9,
783
28
7,08
5
33
,997
65
4,92
2
3.5
798,
041
7.
5
Eur
o M
ediu
m T
erm
Not
e P
rogr
amm
e3,
694
26
,662
310,
234
673,
676
1,01
4,26
6
5.
5
50
4,13
8
4.8
Eur
obon
ds2,
321
2,26
1
61
,481
55,7
81
12
1,84
4
0.7
22
0.0
Med
ium
Ter
m N
ote
2,84
4
5,92
9
1,19
3
18
4,15
5
19
4,12
1
1.0
123,
922
1.
2
Fix
ed R
ate
Not
es3,
392
92
,553
355,
552
634,
555
1,08
6,05
2
5.
9
1,
774,
151
16.8
Oth
er5
23
,830
1,
617
18
7,13
1
212,
583
1.
1
27
5,17
3
2.6
2,13
1,71
6
7,
024,
990
1,81
3,34
2
7,56
7,55
7
18
,537
,605
10
,582
,520
11.5
37.9
9.8
40.8
1,46
3,45
5
2,
597,
021
852,
048
5,66
9,99
6
10
,582
,520
13.8
24.5
8.1
53.6
d)
Fu
nd
s fr
om
acc
epta
nce
an
d is
suan
ce o
f se
curi
ties
09/3
0/20
0909
/30/
2008
RE
AL
ES
TA
TE
, M
OR
TG
AG
E,
CR
ED
IT A
ND
SIM
ILA
R N
OT
ES
DE
BE
NT
UR
ES
FO
RE
IGN
BO
RR
OW
ING
S A
ND
SE
CU
RIT
IES
Tra
de
Rel
ated
– I
ssu
ed a
bro
ad -
Str
uct
ure
No
te I
ssu
ed
% p
er m
atur
ity t
erm
TO
TA
L -
09/
30/2
008
% p
er m
atur
ity t
erm
No
n-t
rad
e R
elat
ed
Issu
ed a
broa
d
TO
TA
L
I t a ú U n i b a n c o S . A . – - September 0
102
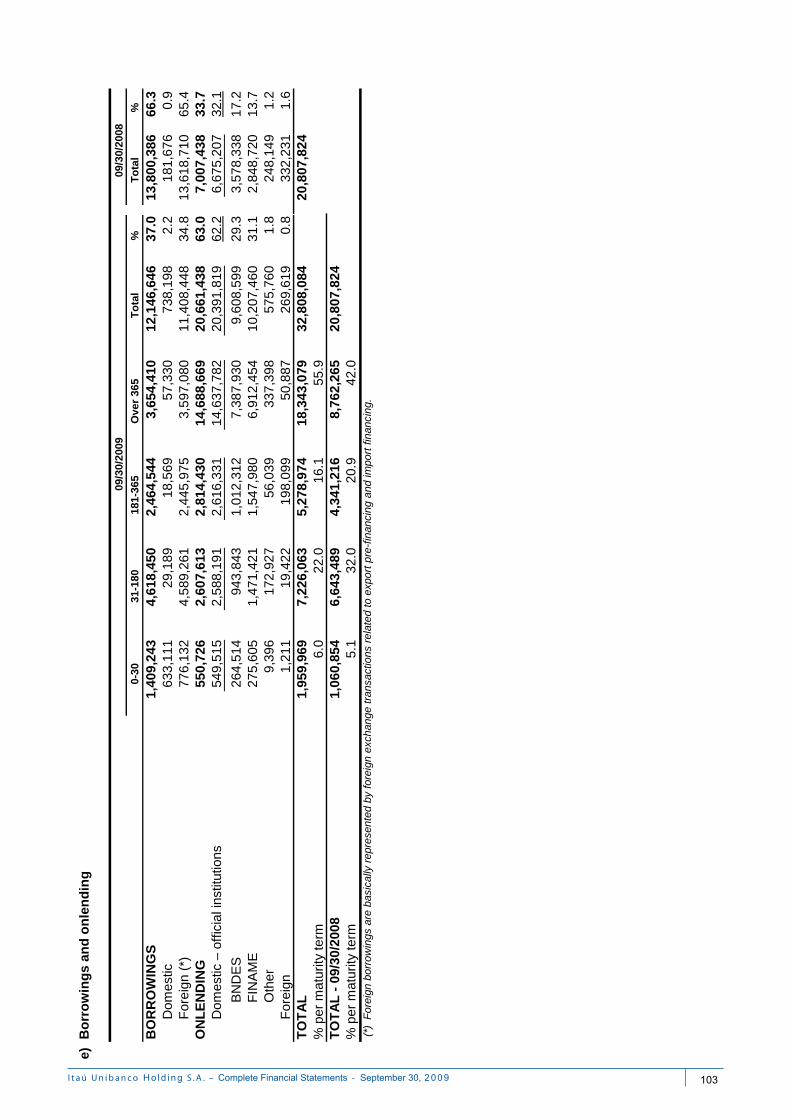
e)
0-30
31-1
8018
1-36
5O
ver
365
To
tal
%T
ota
l%
1,40
9,24
3
4,61
8,45
0
2,
464,
544
3,65
4,41
0
12
,146
,646
37
.013
,800
,386
66.3
633,
111
29
,189
18,5
69
57
,330
73
8,19
8
2.
218
1,67
6
0.9
776,
132
4,
589,
261
2,44
5,97
5
3,
597,
080
11
,408
,448
34.8
13,6
18,7
10
65.4
550,
726
2,60
7,61
3
2,
814,
430
14,6
88,6
69
20
,661
,438
63
.07,
007,
438
33
.7 5
49,5
15 2
,588
,191
2,6
16,3
31 1
4,63
7,78
2 2
0,39
1,81
962
.2 6
,675
,207
32.1
BN
DE
S26
4,51
4
943,
843
1,
012,
312
7,38
7,93
0
9,60
8,59
9
29.3
3,57
8,33
8
17
.2F
INA
ME
275,
605
1,
471,
421
1,54
7,98
0
6,
912,
454
10
,207
,460
31.1
2,84
8,72
0
13
.7O
ther
9,39
6
17
2,92
7
56,0
39
33
7,39
8
57
5,76
0
1.
824
8,14
9
1.2
1,21
1
19
,422
198,
099
50
,887
26
9,61
9
0.
833
2,23
1
1.6
1,95
9,96
9
7,22
6,06
3
5,
278,
974
18,3
43,0
79
32
,808
,084
20
,807
,824
6.0
22
.0
16.1
55
.9
1,
060,
854
6,
643,
489
4,34
1,21
6
8,
762,
265
20,8
07,8
24
5.1
32
.0
20.9
42
.0
(*)
For
eign
For
eign
(*)
09/3
0/20
09
For
eign
bor
row
ings
are
bas
ical
ly r
epre
sent
ed b
y fo
reig
n ex
chan
ge t
rans
actio
ns r
elat
ed t
o ex
port
pre
-fin
anci
ng a
nd im
port
fin
anci
ng.
% p
er m
atur
ity te
rmT
OT
AL
- 0
9/30
/200
8%
per
mat
urity
term
TO
TA
L
Bo
rro
win
gs
and
on
len
din
g
Dom
estic
– o
ffic
ial i
nstit
utio
ns
09/3
0/20
08
BO
RR
OW
ING
SD
omes
tic
ON
LE
ND
ING
I t a ú U n i b a n c o S . A . – - September 0
103
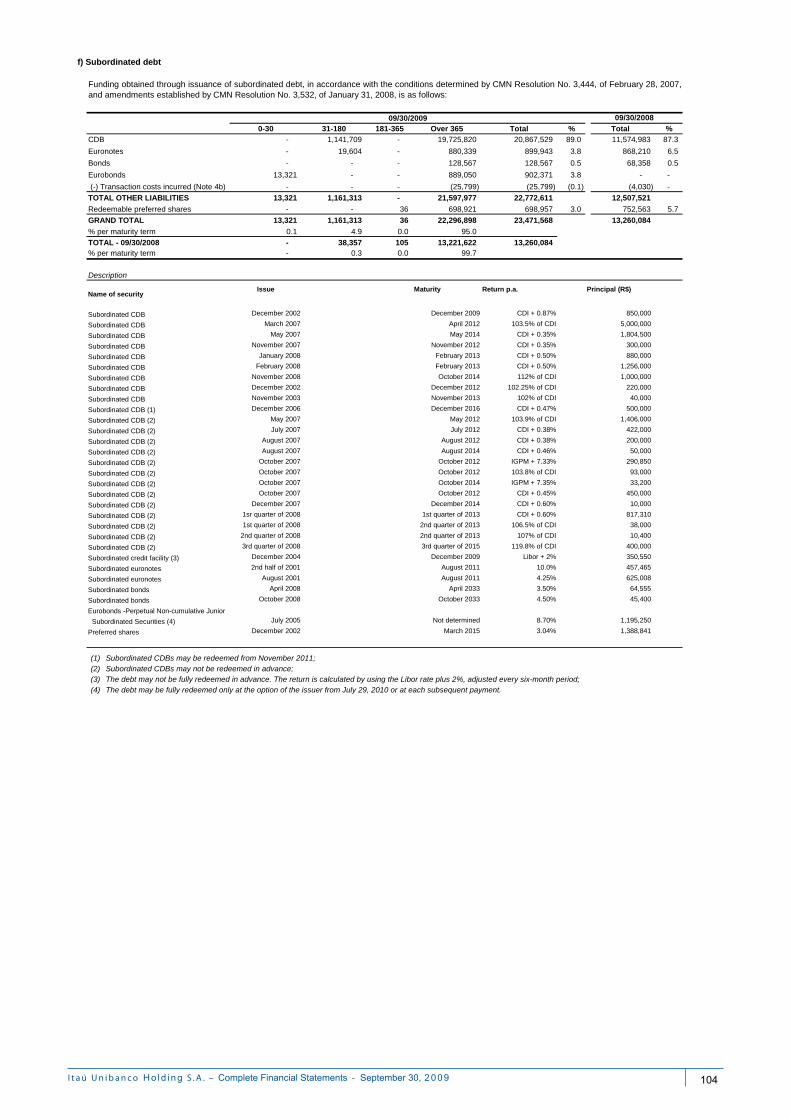
0-30 31-180 181-365 Over 365 Total % Total %
- 1,141,709 - 19,725,820 20,867,529 89.0 11,574,983 87.3
- 19,604 - 880,339 899,943 3.8 868,210 6.5
Bonds - - - 128,567 128,567 0.5 68,358 0.5
Eurobonds 13,321 - - 889,050 902,371 3.8 - -
(-) Transaction costs incurred (Note 4b) - - - (25,799) (25,799) (0.1) (4,030) -
13,321 1,161,313 - 21,597,977 22,772,611 12,507,521
Redeemable preferred shares - - 36 698,921 698,957 3.0 752,563 5.7
13,321 1,161,313 36 22,296,898 23,471,568 13,260,084
0.1 4.9 0.0 95.0
- 38,357 105 13,221,622 13,260,084 - 0.3 0.0 99.7
Description
Issue Maturity Return p.a. Principal (R$)
Subordinated CDB December 2002 December 2009 CDI + 0.87% 850,000
Subordinated CDB March 2007 April 2012 103.5% of CDI 5,000,000
Subordinated CDB May 2007 May 2014 CDI + 0.35% 1,804,500
Subordinated CDB November 2007 November 2012 CDI + 0.35% 300,000
Subordinated CDB January 2008 February 2013 CDI + 0.50% 880,000
Subordinated CDB February 2008 February 2013 CDI + 0.50% 1,256,000
Subordinated CDB November 2008 October 2014 112% of CDI 1,000,000
Subordinated CDB December 2002 December 2012 102.25% of CDI 220,000
Subordinated CDB November 2003 November 2013 102% of CDI 40,000
Subordinated CDB (1) December 2006 December 2016 CDI + 0.47% 500,000
Subordinated CDB (2) May 2007 May 2012 103.9% of CDI 1,406,000
Subordinated CDB (2) July 2007 July 2012 CDI + 0.38% 422,000
Subordinated CDB (2) August 2007 August 2012 CDI + 0.38% 200,000
Subordinated CDB (2) August 2007 August 2014 CDI + 0.46% 50,000
Subordinated CDB (2) October 2007 October 2012 IGPM + 7.33% 290,850
Subordinated CDB (2) October 2007 October 2012 103.8% of CDI 93,000
Subordinated CDB (2) October 2007 October 2014 IGPM + 7.35% 33,200
Subordinated CDB (2) October 2007 October 2012 CDI + 0.45% 450,000
Subordinated CDB (2) December 2007 December 2014 CDI + 0.60% 10,000
Subordinated CDB (2) 1sr quarter of 2008 1st quarter of 2013 CDI + 0.60% 817,310
Subordinated CDB (2) 1st quarter of 2008 2nd quarter of 2013 106.5% of CDI 38,000
Subordinated CDB (2) 2nd quarter of 2008 2nd quarter of 2013 107% of CDI 10,400
Subordinated CDB (2) 3rd quarter of 2008 3rd quarter of 2015 119.8% of CDI 400,000
Subordinated credit facility (3) December 2004 December 2009 Libor + 2% 350,550
Subordinated euronotes 2nd half of 2001 August 2011 10.0% 457,465
Subordinated euronotes August 2001 August 2011 4.25% 625,008
Subordinated bonds April 2008 April 2033 3.50% 64,555
Subordinated bonds October 2008 October 2033 4.50% 45,400
Eurobonds -Perpetual Non-cumulative Junior
Subordinated Securities (4) July 2005 Not determined 8.70% 1,195,250
Preferred shares December 2002 March 2015 3.04% 1,388,841
(1)(2)(3)(4) The debt may be fully redeemed only at the option of the issuer from July 29, 2010 or at each subsequent payment.
Name of security
Subordinated CDBs may be redeemed from November 2011;Subordinated CDBs may not be redeemed in advance;The debt may not be fully redeemed in advance. The return is calculated by using the Libor rate plus 2%, adjusted every six-month period;
f) Subordinated debt
Euronotes
09/30/2009
Funding obtained through issuance of subordinated debt, in accordance with the conditions determined by CMN Resolution No. 3,444, of February 28, 2007,and amendments established by CMN Resolution No. 3,532, of January 31, 2008, is as follows:
09/30/2008
CDB
TOTAL OTHER LIABILITIES
TOTAL - 09/30/2008% per maturity term
GRAND TOTAL
% per maturity term
I t a ú U n i b a n c o S . A . – - September 0
104
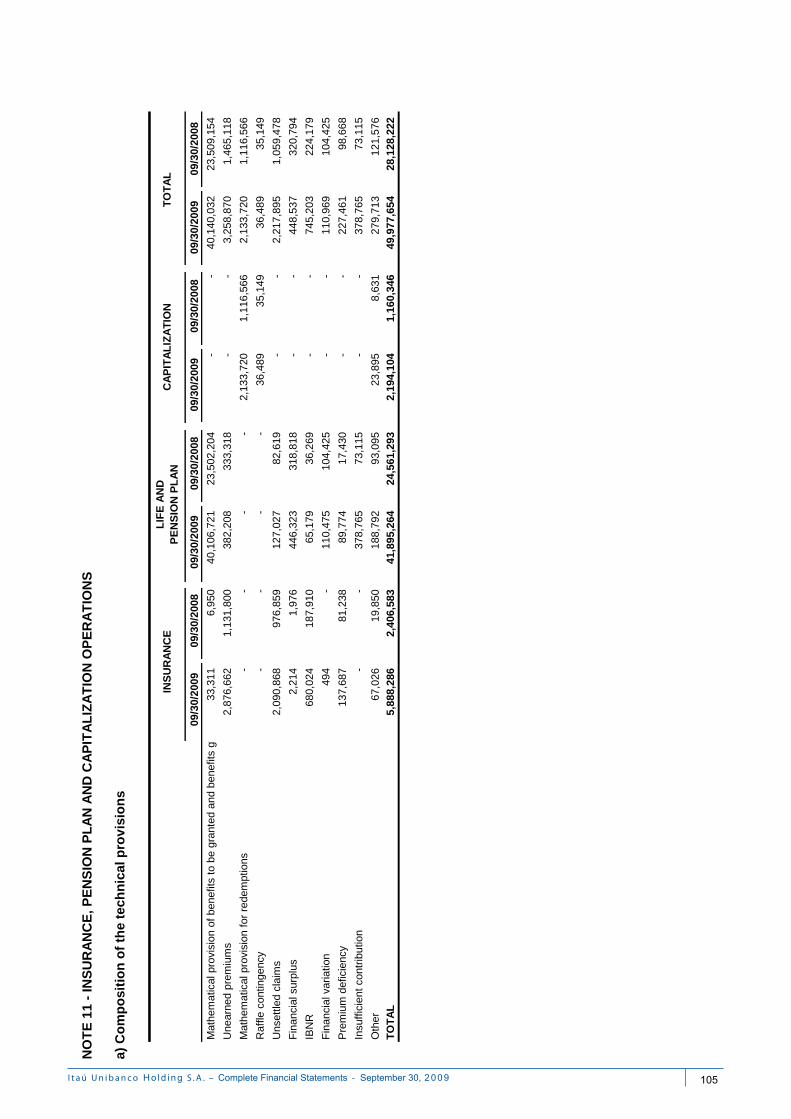
09/
30/2
009
09/
30/2
008
09/
30/2
009
09/
30/2
008
09/
30/2
009
09/
30/2
008
09/
30/2
009
09/
30/2
008
33,3
11
6,
950
40
,106
,721
23
,502
,204
-
-
40
,140
,032
23
,509
,154
2,87
6,66
2
1,
131,
800
382,
208
33
3,31
8
-
-
3,25
8,87
0
1,
465,
118
-
-
-
-
2,13
3,72
0
1,
116,
566
2,13
3,72
0
1,
116,
566
Raf
fle c
ontin
genc
y-
-
-
-
36
,489
35,1
49
36
,489
35,1
49
2,09
0,86
8
97
6,85
9
127,
027
82
,619
-
-
2,21
7,89
5
1,
059,
478
2,21
4
1,97
6
446,
323
31
8,81
8
-
-
448,
537
32
0,79
4
680,
024
18
7,91
0
65,1
79
36
,269
-
-
745,
203
22
4,17
9
494
-
11
0,47
5
104,
425
-
-
11
0,96
9
104
,425
137,
687
81
,238
89,7
74
17
,430
-
-
227,
461
98
,668
-
-
378,
765
73
,115
-
-
378,
765
73
,115
67,0
26
19
,850
188,
792
93
,095
23,8
95
8,
631
27
9,71
3
121,
576
5,88
8,28
6
2,
406,
583
41,8
95,2
64
24,5
61,2
93
2,19
4,10
4
1,
160,
346
49,9
77,6
54
28,1
28,2
22
NO
TE
11
- IN
SU
RA
NC
E, P
EN
SIO
N P
LA
N A
ND
CA
PIT
AL
IZA
TIO
N O
PE
RA
TIO
NS
a) C
om
po
siti
on
of
the
tech
nic
al p
rov
isio
ns
TO
TA
LIN
SU
RA
NC
EL
IFE
AN
D
PE
NS
ION
PL
AN
Une
arne
d pr
emiu
ms
CA
PIT
AL
IZA
TIO
N
Mat
hem
atic
al p
rovi
sion
of
bene
fits
to b
e gr
ante
d an
d be
nefit
s gr
TO
TA
L
Fin
anci
al s
urpl
us
Uns
ettle
d cl
aim
s
Mat
hem
atic
al p
rovi
sion
for
red
empt
ions
IBN
R
Fin
anci
al v
aria
tion
Pre
miu
m d
efic
ienc
y
Insu
ffic
ient
con
trib
utio
n
Oth
er
I t a ú U n i b a n c o S . A . – - September 0
105
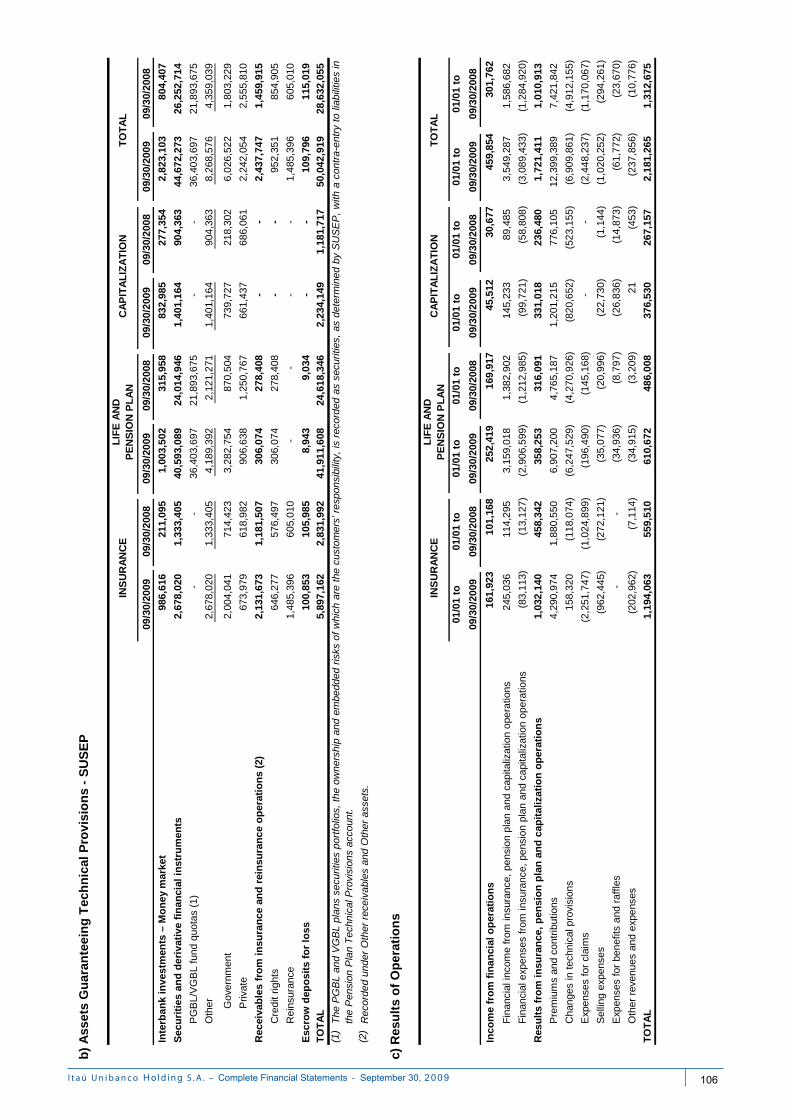
09/3
0/20
0909
/30/
2008
09/3
0/20
0909
/30/
2008
09/3
0/20
0909
/30/
2008
09/3
0/20
0909
/30/
2008
986,
616
21
1,0
95
1,00
3,5
02
31
5,9
58
832,
985
27
7,35
4
2,8
23,1
03
8
04,4
07
2,67
8,02
0
1,
333,
405
40,5
93,
089
24
,01
4,9
46
1,4
01,1
64
90
4,36
3
44,6
72,
273
26
,252
,71
4
-
-
36,4
03,
697
21
,89
3,6
75
-
-
36,4
03,
697
21
,893
,67
5
2,6
78,0
20 1
,333
,405
4,1
89,3
92 2
,121
,271
1,4
01,1
64 9
04,3
63 8
,268
,576
4,3
59,0
39
Gov
ernm
ent
2,00
4,04
1
71
4,4
23
3,28
2,7
54
87
0,5
04
739,
727
21
8,30
2
6,0
26,5
22
1
,803
,229
Priv
ate
673,
979
61
8,9
82
906,
638
1
,250
,767
661,
437
68
6,06
1
2,2
42,0
54
2
,555
,810
Rec
eiva
ble
s fr
om
in
sura
nce
an
d r
ein
sura
nce
op
erat
ion
s (2
)2,
131,
673
1,18
1,50
7
30
6,0
74
278,
408
-
-
2
,437
,747
1,4
59,9
15
Cre
dit
right
s 64
6,27
7
576,
497
30
6,0
74
278,
408
-
-
95
2,35
1
854
,905
Rei
nsur
ance
1,48
5,39
6
60
5,0
10
-
-
-
-
1,4
85,3
96
6
05,0
10
Esc
row
dep
osi
ts f
or
loss
100,
853
10
5,9
85
8,9
43
9,0
34
-
-
109,
796
1
15,0
19
5,89
7,16
2
2,
831,
992
41,9
11,
608
24
,61
8,3
46
2,2
34,1
49
1
,181
,717
50,0
42,
919
28
,632
,05
5
(1)
(2)
1
61,9
23
1
01,1
68
2
52,4
19
1
69,9
17
45,5
12
30,6
77
45
9,8
54
30
1,7
62
245,
036
11
4,2
95
3,15
9,0
18
1
,382
,902
145,
233
8
9,48
5
3
,549
,287
1,5
86,6
82
(83,
113)
(1
3,1
27)
(2
,90
6,5
99)
(1
,21
2,9
85)
(9
9,7
21)
(5
8,80
8)
(3,0
89,
433)
(1
,284
,92
0)
1,03
2,14
0
45
8,3
42
358,
253
31
6,0
91
331,
018
23
6,48
0
1,7
21,4
11
1
,010
,913
4,29
0,97
4
1,
880,
550
6,90
7,20
0
4
,765
,187
1,2
01,2
15
77
6,10
5
12,3
99,
389
7,
421,
842
158,
320
(1
18,
074
)
(6,2
47,
529
)
(4,2
70,
926
)
(82
0,6
52)
(5
23,
155
)
(6,9
09,
861)
(4
,912
,15
5)
(2,2
51,7
47)
(1
,02
4,8
99)
(1
96,
490
)
(14
5,1
68)
-
-
(2
,44
8,23
7)
(1,1
70,0
67)
(962
,445
)
(27
2,1
21)
(3
5,0
77)
(2
0,9
96)
(2
2,7
30)
(1
,144
)
(1
,02
0,25
2)
(294
,261
)
-
-
(34,
936
)
(8,7
97)
(26,
836
)
(14,
873)
(6
1,77
2)
(23,
670)
(202
,962
)
(7,1
14)
(34,
915
)
(3,2
09)
21
(453
)
(2
37,8
56)
(1
0,77
6)
1,19
4,06
3
55
9,5
10
610,
672
48
6,0
08
376,
530
26
7,15
7
2,1
81,2
65
1
,312
,675
TO
TA
L
CA
PIT
AL
IZA
TIO
N
The
PG
BL
and
VG
BL
plan
sse
curit
ies
port
folio
s,th
eow
ners
hip
and
embe
dded
risks
ofw
hich
are
the
cust
omer
s’re
spon
sibi
lity,
isre
cord
edas
secu
ritie
s,as
dete
rmin
edby
SU
SE
P,
with
aco
ntra
-ent
ryto
liabi
litie
sin
the
Pen
sion
Pla
n T
echn
ical
Pro
visi
ons
acco
unt.
Rec
orde
d un
der
Oth
er r
ecei
vabl
es a
nd O
ther
ass
ets.
c) R
esu
lts
of
Op
erat
ion
s
TO
TA
LIN
SU
RA
NC
EL
IFE
AN
D
PE
NS
ION
PL
AN
Inte
rban
k in
vest
men
ts –
Mo
ney
mar
ket
Sec
uri
ties
an
d d
eriv
ativ
e fi
nan
cial
in
stru
men
ts
PG
BL
/VG
BL
fun
d qu
ota
s (1
)
Oth
er
TO
TA
L
b)
Ass
ets
Gu
aran
teei
ng
Tec
hn
ical
Pro
visi
on
s -
SU
SE
P
INS
UR
AN
CE
LIF
E A
ND
P
EN
SIO
N P
LA
NC
AP
ITA
LIZ
AT
ION
01/0
1 to
09/3
0/20
08
01/0
1 to
09/3
0/20
09
01/0
1 to
09/3
0/20
08
Cha
nges
in t
echn
ical
pro
visi
ons
01/0
1 to
09/3
0/20
08
Res
ult
s fr
om
in
sura
nce
, p
ensi
on
pla
n a
nd
cap
ital
izat
ion
op
erat
ion
s
Pre
miu
ms
and
cont
ribut
ions
Fin
anci
al in
com
e fr
om in
sura
nce,
pen
sion
pla
n an
d ca
pita
lizat
ion
oper
atio
ns
Fin
anci
al e
xpen
ses
from
insu
ranc
e, p
ensi
on p
lan
and
capi
taliz
atio
n op
erat
ions
01/0
1 to
09/3
0/20
09
Exp
ense
s fo
r cl
aim
s
Oth
er r
even
ues
and
expe
nses
TO
TA
L
Sel
ling
expe
nses
Exp
ense
s fo
r be
nefit
s an
d ra
ffle
s
01/0
1 to
09/3
0/20
08
01/0
1 to
09/3
0/20
09
01/0
1 to
09/3
0/20
09
Inco
me
fro
m f
inan
cial
op
erat
ion
s
I t a ú U n i b a n c o S . A . – - September 0
106
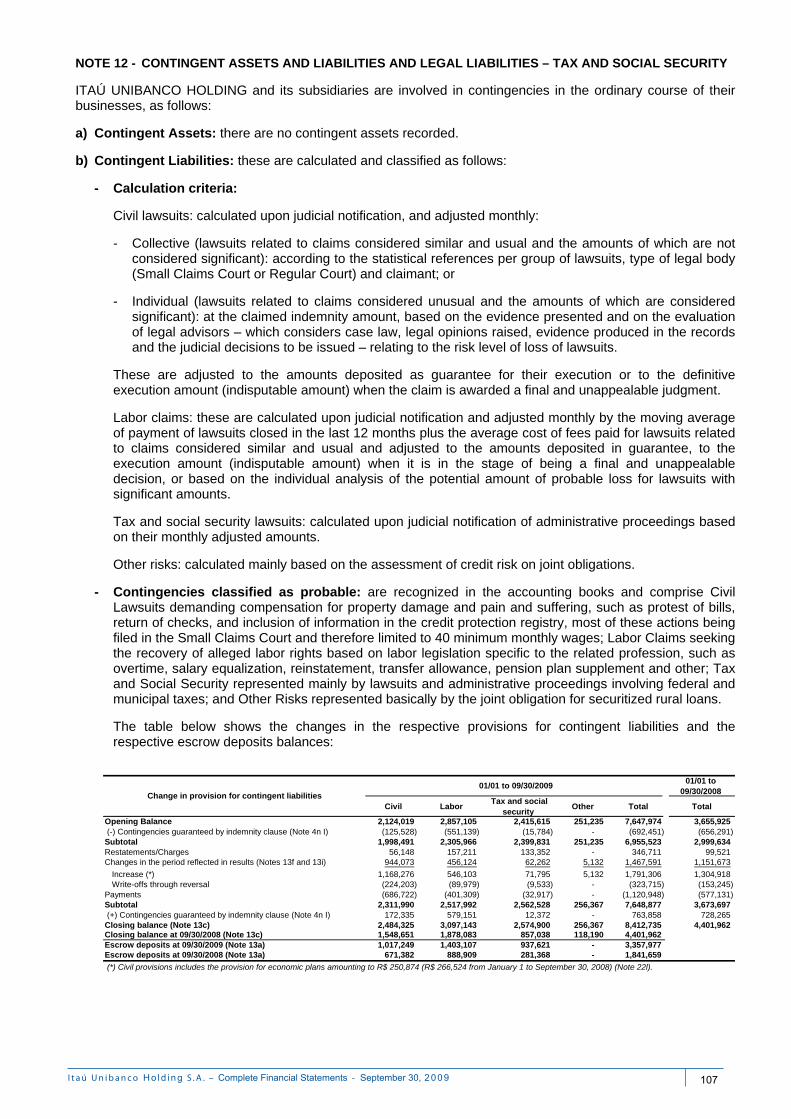
NOTE 12 - CONTINGENT ASSETS AND LIABILITIES AND LEGAL LIABILITIES – TAX AND SOCIAL SECURITY ITAÚ UNIBANCO HOLDING and its subsidiaries are involved in contingencies in the ordinary course of their businesses, as follows: a) Contingent Assets: there are no contingent assets recorded. b) Contingent Liabilities: these are calculated and classified as follows:
- Calculation criteria:
Civil lawsuits: calculated upon judicial notification, and adjusted monthly:
- Collective (lawsuits related to claims considered similar and usual and the amounts of which are not considered significant): according to the statistical references per group of lawsuits, type of legal body (Small Claims Court or Regular Court) and claimant; or
- Individual (lawsuits related to claims considered unusual and the amounts of which are considered
significant): at the claimed indemnity amount, based on the evidence presented and on the evaluation of legal advisors – which considers case law, legal opinions raised, evidence produced in the records and the judicial decisions to be issued – relating to the risk level of loss of lawsuits.
These are adjusted to the amounts deposited as guarantee for their execution or to the definitive execution amount (indisputable amount) when the claim is awarded a final and unappealable judgment.
Labor claims: these are calculated upon judicial notification and adjusted monthly by the moving average of payment of lawsuits closed in the last 12 months plus the average cost of fees paid for lawsuits related to claims considered similar and usual and adjusted to the amounts deposited in guarantee, to the execution amount (indisputable amount) when it is in the stage of being a final and unappealable decision, or based on the individual analysis of the potential amount of probable loss for lawsuits with significant amounts.
Tax and social security lawsuits: calculated upon judicial notification of administrative proceedings based on their monthly adjusted amounts.
Other risks: calculated mainly based on the assessment of credit risk on joint obligations.
- Contingencies classified as probable: are recognized in the accounting books and comprise Civil
Lawsuits demanding compensation for property damage and pain and suffering, such as protest of bills, return of checks, and inclusion of information in the credit protection registry, most of these actions being filed in the Small Claims Court and therefore limited to 40 minimum monthly wages; Labor Claims seeking the recovery of alleged labor rights based on labor legislation specific to the related profession, such as overtime, salary equalization, reinstatement, transfer allowance, pension plan supplement and other; Tax and Social Security represented mainly by lawsuits and administrative proceedings involving federal and municipal taxes; and Other Risks represented basically by the joint obligation for securitized rural loans.
The table below shows the changes in the respective provisions for contingent liabilities and the respective escrow deposits balances:
01/01 to 09/30/2008
Civil Labor Tax and social
security Other Total Total
2,124,019 2,857,105 2,415,615 251,235 7,647,974 3,655,925 (125,528) (551,139) (15,784) - (692,451) (656,291)
1,998,491 2,305,966 2,399,831 251,235 6,955,523 2,999,634 Restatements/Charges 56,148 157,211 133,352 - 346,711 99,521
944,073 456,124 62,262 5,132 1,467,591 1,151,673
Increase (*) 1,168,276 546,103 71,795 5,132 1,791,306 1,304,918 Write-offs through reversal (224,203) (89,979) (9,533) - (323,715) (153,245)
(686,722) (401,309) (32,917) - (1,120,948) (577,131) 2,311,990 2,517,992 2,562,528 256,367 7,648,877 3,673,697
172,335 579,151 12,372 - 763,858 728,265 2,484,325 3,097,143 2,574,900 256,367 8,412,735 4,401,962 1,548,651 1,878,083 857,038 118,190 4,401,962 1,017,249 1,403,107 937,621 - 3,357,977
671,382 888,909 281,368 - 1,841,659
(*) Civil provisions includes the provision for economic plans amounting to R$ 250,874 (R$ 266,524 from January 1 to September 30, 2008) (Note 22l).
Changes in the period reflected in results (Notes 13f and 13i)
Payments
(-) Contingencies guaranteed by indemnity clause (Note 4n I)
Closing balance (Note 13c) (+) Contingencies guaranteed by indemnity clause (Note 4n I)Subtotal
Subtotal
01/01 to 09/30/2009
Escrow deposits at 09/30/2009 (Note 13a)Escrow deposits at 09/30/2008 (Note 13a)
Closing balance at 09/30/2008 (Note 13c)
Change in provision for contingent liabilities
Opening Balance
I t a ú U n i b a n c o S . A . – - September 0
107
- Contingencies classified as possible: not recognized in the accounting books and comprise Civil Lawsuits amounting to R$ 372,699 and Tax and Social Security Lawsuits amounting to R$ 5,073,426. The principal characteristics of these lawsuits are described below:
Claim for of corporate income tax (IRPJ), social contribution (CSLL), PIS and COFINS, as tax
authorities understand there has been unreported income due to assignment of usufruct of quotas and shares, recorded as a contra-entry to the investment account in permanent assets – R$ 1,276,180;
Claim for of corporate income tax (IRPJ) and social contribution (CSLL) on operations related to
transfer of shares of companies located abroad for payment of capital of other companies – R$ 800,097;
ISS – Banking Institutions – R$ 308,367: refers to tax assessments notices issued by municipalities for
collection of ISS on amounts recorded in several accounts, on the grounds of being service revenue. An administrative final decision or tax foreclosure is pending;
Deductibility of losses in receipt of loans and discounts granted in renegotiation of loans – R$ 284,758;
Dismissal of offset request – R$ 269,271: offset requests which were not validated due to formal
issues or alleged lack of evidence of credit liquidity. Issue discussed at the administrative level, in which the company stated its defense and exhibited documentation evidencing credit liquidity;
Levy of social security contributions on non-compensatory amounts – R$ 218,038: administrative and
court discussion on the portions that, according to the company’s understanding, are not part of contribution salary for social security tax purposes;
Deductibility of goodwill in purchase of investments – R$ 197,267: assessment notices that discuss
the deduction of goodwill of merged companies;
Acquisition of Customers Portfolio - R$ 169,367: aims at recognizing the deduction, from the IRPJ and CSLL calculation basis, of expenses assumed by Banco Itaú with the amortization of assets related to the acquisition of the customers portfolio of the Group banks;
IRPJ/PDD (income tax/Allowance for loan losses) – R$ 163,512: reject the Regulatory Instruction (IN)
No. 80/93, which reduced the percentage from 1.5% to 0.5% for realization of the Allowance for Loan Losses in base year 1993, calculated by adopting the IN No. 76/87 and the CMN Resolution No. 1,748, of August 31, 1990. The bank makes allegations about the impossibility of applying the rule to events occurred in the fiscal year when it was enacted (principle of anteriority). A suspension was awarded for the bank’s appeal, however, the judgment by the Federal Regional Court of the 3rd Region is pending;
Apportionment of Net Assets by Book Value – R$ 128,861: refers to the tax assessment notice issued
due to the deduction of capital loss computed in the winding-up and liquidation of investments. Awaiting Court's decision;
Required the corporate income tax (IRPJ) arising from offset of losses for 2005, which, according to
tax authorities, had been carried out above the balance stated for the Federal Revenue Service, in view of the ex officio changes made to the Corporate Income Tax Declaration (DIPJ) submitted by the taxpayer – R$ 97,486;
Differences in the completion of Declaration of Federal Contributions and Taxes (DCTF) – R$ 82,990:
required levy of withholding income tax (IRRF) arising from the challenge, by the Federal Revenue Service authorities, concerning the completion of the DCTF and missing payments (DARFs);
Assessment notices about the Declaration of Federal Contributions and Taxes (DCTF) – R$ 74,201:
electronic assessment notices issued by the Federal Revenue Service, which defense is stated at the administrative level, in which the submitted documentation is being analyzed;
Criteria for taxation of revenues made available abroad - R$ 69,394: assessment notices in relation to
which the inspection authorities discuss criteria for determining the calculation basis and taxable event;
I t a ú U n i b a n c o S . A . – - September 0
108
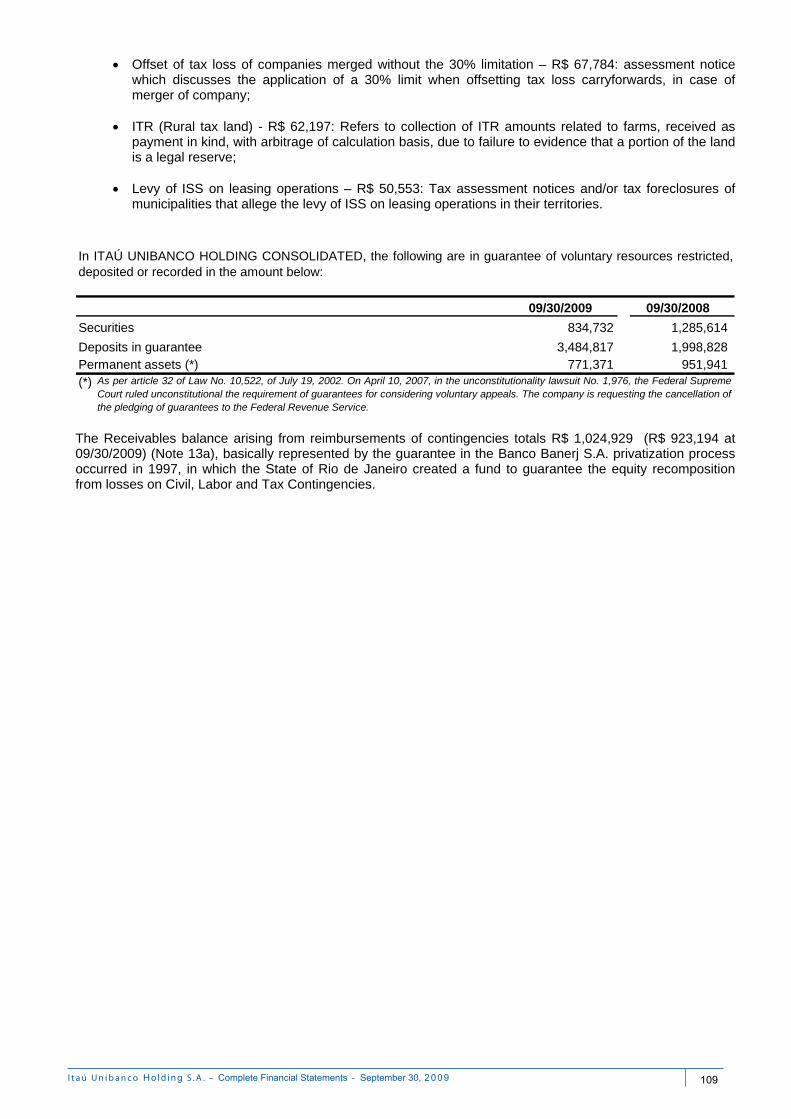
Offset of tax loss of companies merged without the 30% limitation – R$ 67,784: assessment notice which discusses the application of a 30% limit when offsetting tax loss carryforwards, in case of merger of company;
ITR (Rural tax land) - R$ 62,197: Refers to collection of ITR amounts related to farms, received as
payment in kind, with arbitrage of calculation basis, due to failure to evidence that a portion of the land is a legal reserve;
Levy of ISS on leasing operations – R$ 50,553: Tax assessment notices and/or tax foreclosures of
municipalities that allege the levy of ISS on leasing operations in their territories.
09/30/2009 09/30/2008
834,732 1,285,614
3,484,817 1,998,828 771,371 951,941
(*) As per article 32 of Law No. 10,522, of July 19, 2002. On April 10, 2007, in the unconstitutionality lawsuit No. 1,976, the Federal SupremeCourt ruled unconstitutional the requirement of guarantees for considering voluntary appeals. The company is requesting the cancellation ofthe pledging of guarantees to the Federal Revenue Service.
In ITAÚ UNIBANCO HOLDING CONSOLIDATED, the following are in guarantee of voluntary resources restricted,deposited or recorded in the amount below:
Deposits in guarantee
Securities
Permanent assets (*)
The Receivables balance arising from reimbursements of contingencies totals R$ 1,024,929 (R$ 923,194 at 09/30/2009) (Note 13a), basically represented by the guarantee in the Banco Banerj S.A. privatization process occurred in 1997, in which the State of Rio de Janeiro created a fund to guarantee the equity recomposition from losses on Civil, Labor and Tax Contingencies.
I t a ú U n i b a n c o S . A . – - September 0
109
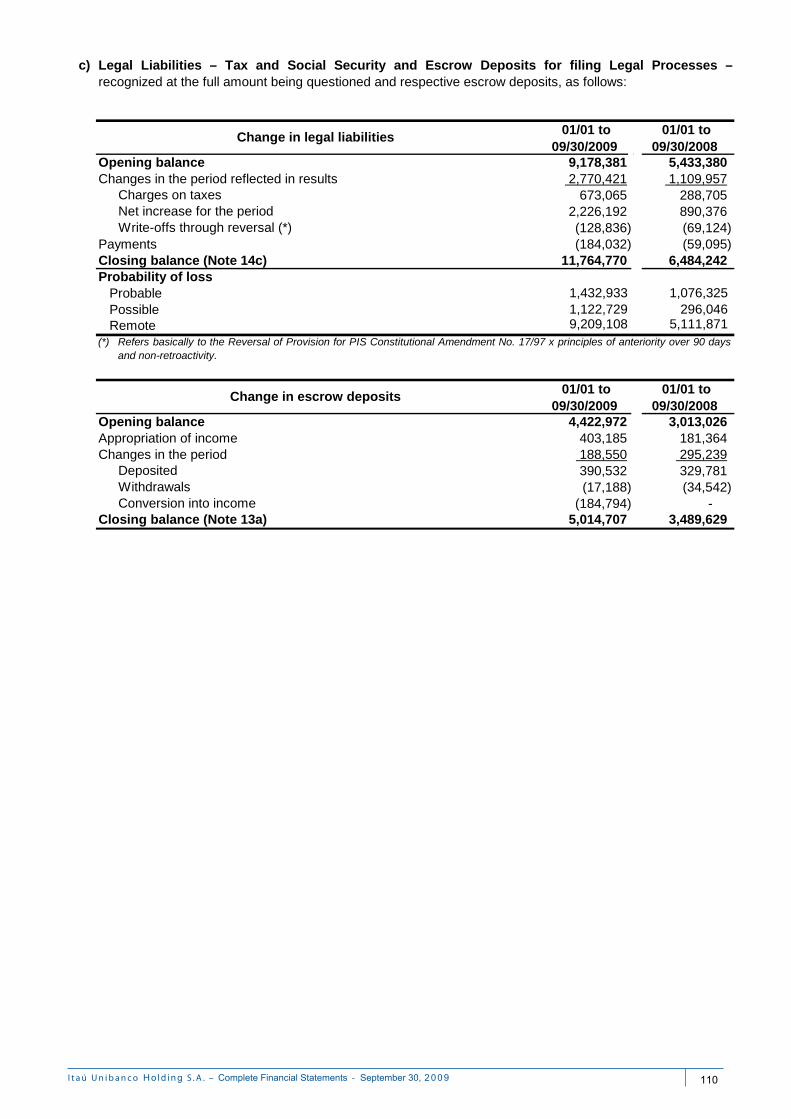
c)
01/01 to 01/01 to 09/30/2009 09/30/2008
9,178,381 5,433,380 2,770,421 1,109,957
Charges on taxes 673,065 288,705 Net increase for the period 2,226,192 890,376 Write-offs through reversal (*) (128,836) (69,124)
(184,032) (59,095) 11,764,770 6,484,242
1,432,933 1,076,325 1,122,729 296,046 9,209,108 5,111,871
(*)
01/01 to 01/01 to 09/30/2009 09/30/2008
4,422,972 3,013,026 403,185 181,364
188,550 295,239Deposited 390,532 329,781 Withdrawals (17,188) (34,542) Conversion into income (184,794) -
5,014,707 3,489,629
Changes in the period reflected in results
Payments
Legal Liabilities – Tax and Social Security and Escrow Deposits for filing Legal Processes –recognized at the full amount being questioned and respective escrow deposits, as follows:
Opening balance
Change in legal liabilities
Appropriation of incomeChanges in the period
Closing balance (Note 13a)
Opening balance
Remote
Change in escrow deposits
Closing balance (Note 14c)Probability of loss
ProbablePossible
Refers basically to the Reversal of Provision for PIS Constitutional Amendment No. 17/97 x principles of anteriority over 90 daysand non-retroactivity.
I t a ú U n i b a n c o S . A . – - September 0
110
The main natures of processes are described as follows: PIS e COFINS X Law No. 9,718/98 – R$ 7,315,511 – Assert the right of paying contributions to PIS and
COFINS on revenue, not adopting the provisions of Article 3, paragraph 1, of Law No. 9,718, of November 27, 1998, which established the inappropriate extension of the calculation bases of these contributions. The corresponding escrow deposit totals R$ 1,057,623;
IRPJ and CSLL X Profit Earned Abroad – R$ 1,144,849. Aimed at rejecting the requirement set forth by
Regulatory Instruction No. 213 of October 7, 2002, in view of its illegality, determining the inclusion of equity in earnings in the calculation of taxable income and the CSLL calculation basis, including that from disposal of investment abroad. The corresponding escrow deposit totals R$ 558,794;
CSLL X Equality – R$ 703,899 – Assert the right of paying CSLL at 8%, applicable to companies in general,
according to the heading of Article 19 of Law No. 9,249 of December 26, 1995, rejecting the provisions of paragraph 1 therein, which sets forth a differentiated rate (18%) for financial institutions, in view of the infraction to the principle of equality. The corresponding escrow deposit totals R$ 350,057;
CSL x Non Employers – R$ 433,675 – Assert the right of paying social contribution on net income (CSLL),
since it does not fit into the employers concept (article 2 of Consolidation of Labor Laws - CLT), thus recognizing the illegality and unconstitutionality of Law No. 7,689/88, which unduly increased the CSLL calculation basis, considering any company as a debtor. The escrow deposit balance totals R$ 358,263.
PIS X Constitutional Amendments Nos. 10/96 and 17/97 – R$ 338,788– Aimed at rejecting the levy of PIS,
based on principles of anteriority over 90 days, and non-retroactivity of Constitutional Amendments Nos. 10/96 and 17/97, and nonexistence of legislation for this period. Successively, aimed at paying PIS over the mentioned period based on Supplementary Law No. 7/70. The corresponding escrow deposit totals R$ 67,655;
INSS X Supplementary Law No. 84/96 and Additional rate of 2.5% – R$ 235,874 – Aimed at rejecting the
levy of social security contribution at 15%, as well as an additional rate of 2.5%, on compensation paid to service providers that are individuals and managers, set forth by Supplementary Law No. 84/96, in view of its unconstitutionality, as this contribution has the same taxable year and income tax calculation basis, going against the provisions of Articles 153, item III, 154, item I, 156, item III and 195, paragraph 4, of Federal Constitution. The corresponding escrow deposit totals R$ 274,194;
According to the opinion of the legal advisors, ITAÚ UNIBANCO HOLDING and its subsidiary companies are not involved in any other administrative proceedings or lawsuits that may significantly affect the results of their operations. The combined evaluation of all existing provisions for all contingent liabilities and legal obligations, which are recognized through the adoption of statistical models for claims involving small amounts and separate analysis by internal and external legal advisors of other cases, showed that the amounts provided for are sufficient, according to the CMN Resolution No. 3,535 of January 31, 2008
I t a ú U n i b a n c o S . A . – - September 0
111
a)
09/30/2009 09/30/200827,426,886 9,443,515
955,427 895,907 2,974,685 1,615,743 6,842,794 3,840,4875,014,707 3,489,629
349,000 548,289 1,024,929 923,194
- 248,755 768,652 387,116 119,123 203,322 34,953 28,996
177,765 100,782 50,657 4,853
498,110 142,335Securities and credits receivable 805,534 158,481 (Allowance for other loan losses) (307,424) (16,146)
142,508 112,006
46,380,196 21,984,929
Salary advancesAmounts receivable from related companiesOperations without credit granting characteristics
Other
Total
At ITAÚ UNIBANCO HOLDING, Other Sundry Receivables are basically composed of Taxes and Contributions forOffset of R$ 146,329 (R$ 60,885 at 09/30/2008) and Deferred Tax Assets of R$ 836,564 (R$ 383,696 at09/30/2008) (Note 14b I).
Escrow deposits for legal liabilities – tax and social security (Note 12c)Escrow deposits for foreign fund raising programReceivables from reimbursement of contingent liabilities (Note 12b)
Recoverable payments
Receivables from sale of Credicard brand/ Visa Inc. and Visa Net sharesSundry domestic debtorsSundry foreign debtors
Escrow deposits in guarantee for provision for contingent liabilities (Note 12b)
NOTE 13 – BREAKDOWN OF ACCOUNTS
Deferred tax assets (Note 14b I)Social contribution for offset (Note 14b I)Taxes and contributions for offset
Other sundry receivables
I t a ú U n i b a n c o S . A . – - September 0
112
09/30/2009 09/30/20082,280,357 2,160,548
Related to vehicle financing 1,622,283 1,986,626 Related to insurance and pension plan 515,968 155,481 Other 142,106 18,441
Credit Guarantee Fund (*) 760,702 - 384,314 45,180 250,924 134,855
3,676,297 2,340,583 (*)
Advertising
Refers to the spontaneous payment, equivalent to the prepayment of installments of the contribution to Fundo Garantidor de Crédito(Brazilian deposit guarantee fund), according to BACEN Circular No. 3,416, of 10/24/2008.
b) Prepaid expenses
OtherTotal
Commissions
I t a ú U n i b a n c o S . A . – - September 0
113
c) Other sundry liabilities
09/30/2009 09/30/2008 8,412,735 4,401,962 1,947,971 1,096,301 1,273,277 807,662 765,496 517,621 208,288 129,471 447,230 293,746 1,110,943 250,745 13,182 89,593 316,156 215,171 144,613 53,336 121,674 27,114 978,978 - 540,808 - 122,889 - 278,197 24,827 16,682,437 7,907,549
(1)
(2)
Provision set up at 12/31/2008 in the amount of R$ 1,330,800 to cover expenditures on communication with customers,adequacy of systems and personnel.
Provision set up to cover possible future deficits up to the total discontinuance of the portfolio, arising from the difference ofadjustments to monthly installments, authorized annually by the regulatory body, and the actual variation of hospital costs thataffect the compensation of claims.
Provision for integration expenditures with ITAÚ UNIBANCO merger (1)Provision to cover actuarial deficit (Note 19c)
Total
Creditors of funds to be released
Related to insurance operations
Funds from consortia participants
Other
Liabilities for purchase of assets and rights
Provision for health insurance (2)Expenses for lease interests (Note 4i)
Provision for contingent liabilities (Note 12b)
Personnel provisionProvision for sundry payments
Liabilities for official agreements and rendering of payment services
Sundry creditors - localSundry creditors - foreign
I t a ú U n i b a n c o S . A . – - September 0
114
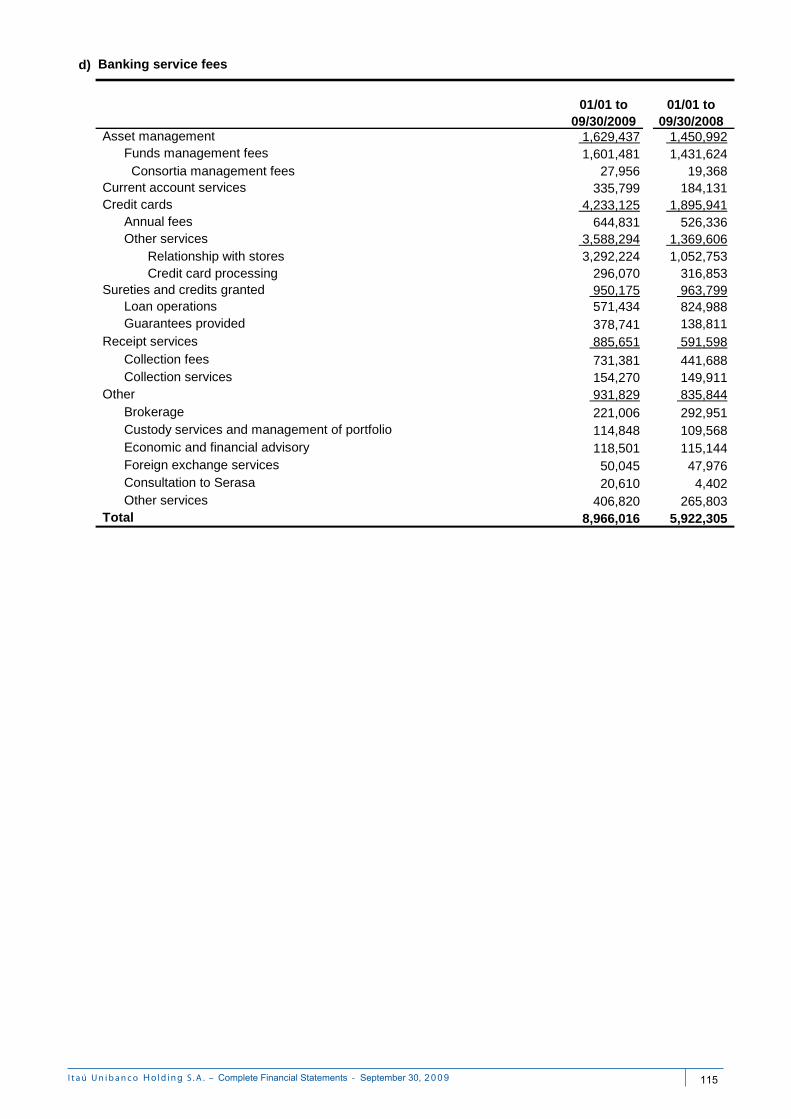
d)
01/01 to 09/30/2009
01/01 to 09/30/2008
1,629,437 1,450,9921,601,481 1,431,624
Consortia management fees 27,956 19,368 335,799 184,131
4,233,125 1,895,941644,831 526,336
3,588,294 1,369,606Relationship with stores 3,292,224 1,052,753 Credit card processing 296,070 316,853
950,175 963,799571,434 824,988378,741 138,811 885,651 591,598
731,381 441,688 154,270 149,911 931,829 835,844
221,006 292,951 114,848 109,568 118,501 115,144 50,045 47,976 20,610 4,402
406,820 265,803 8,966,016 5,922,305
Other
Banking service fees
Loan operationsGuarantees provided
Receipt servicesCollection fees
Asset managementFunds management fees
Current account servicesCredit cards
Annual feesOther services
Collection services
Sureties and credits granted
Total
Custody services and management of portfolio
Consultation to Serasa
Brokerage
Economic and financial advisoryForeign exchange services
Other services
I t a ú U n i b a n c o S . A . – - September 0
115
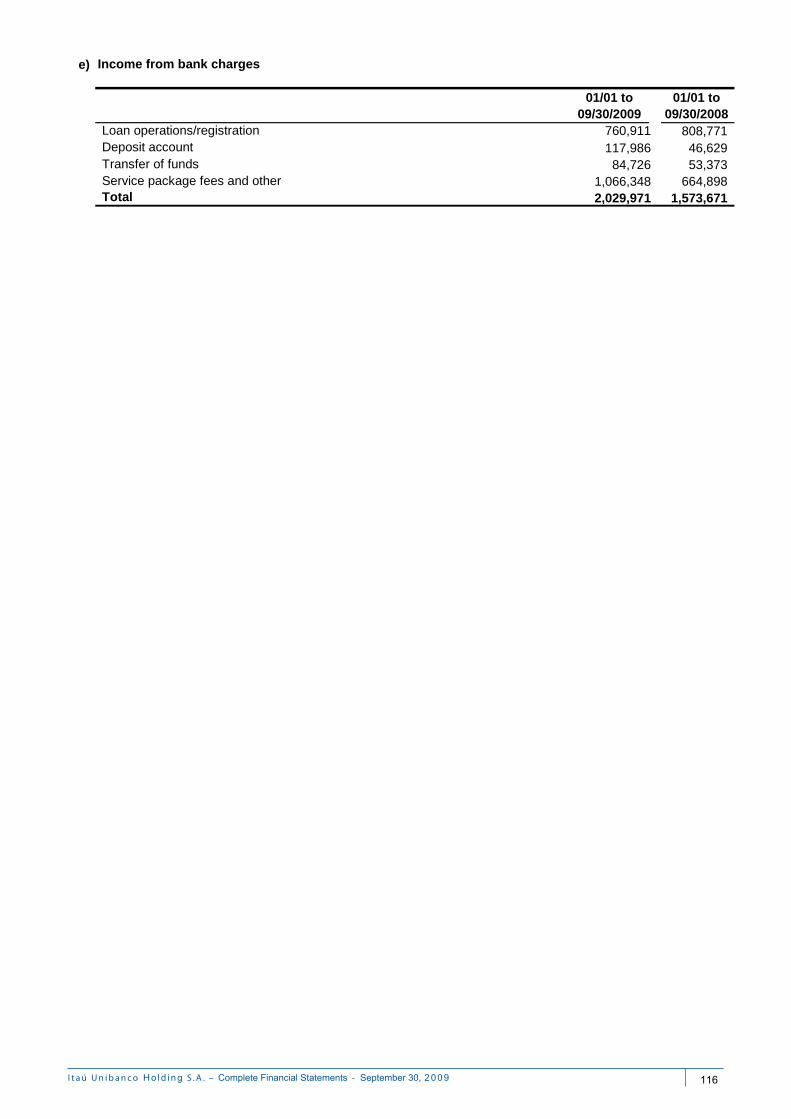
e)
01/01 to 09/30/2009
01/01 to 09/30/2008
760,911 808,771117,986 46,629
84,726 53,373 1,066,348 664,898
2,029,971 1,573,671
Income from bank charges
Deposit accountTransfer of funds
Loan operations/registration
Service package fees and otherTotal
I t a ú U n i b a n c o S . A . – - September 0
116
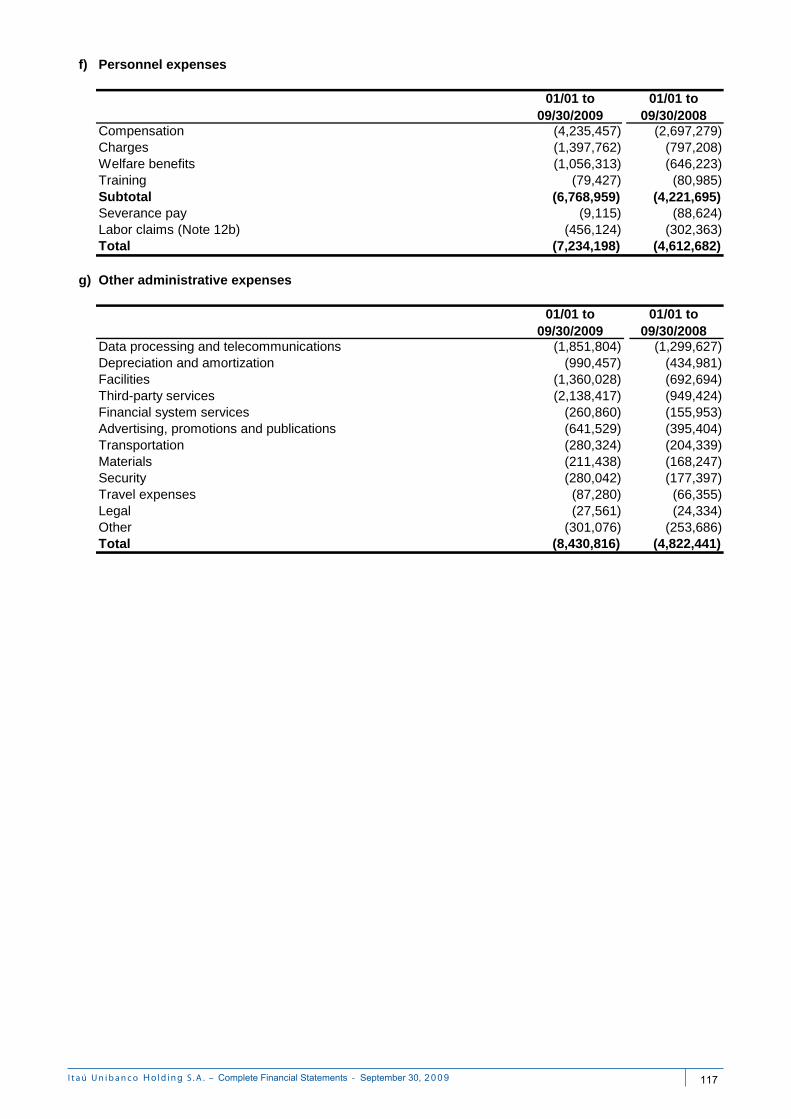
f)
01/01 to 09/30/2009
01/01 to 09/30/2008
(4,235,457) (2,697,279) (1,397,762) (797,208) (1,056,313) (646,223) (79,427) (80,985)
(6,768,959) (4,221,695) (9,115) (88,624) (456,124) (302,363)
(7,234,198) (4,612,682)
g)
01/01 to 09/30/2009
01/01 to 09/30/2008
(1,851,804) (1,299,627) (990,457) (434,981) (1,360,028) (692,694) (2,138,417) (949,424) (260,860) (155,953) (641,529) (395,404) (280,324) (204,339) (211,438) (168,247) (280,042) (177,397) (87,280) (66,355) (27,561) (24,334) (301,076) (253,686)
(8,430,816) (4,822,441)
FacilitiesThird-party services
Other
Training
Legal
Data processing and telecommunicationsDepreciation and amortization
Financial system servicesAdvertising, promotions and publications
Total
TransportationMaterialsSecurityTravel expenses
Personnel expenses
Other administrative expenses
Total
SubtotalSeverance payLabor claims (Note 12b)
CompensationChargesWelfare benefits
I t a ú U n i b a n c o S . A . – - September 0
117
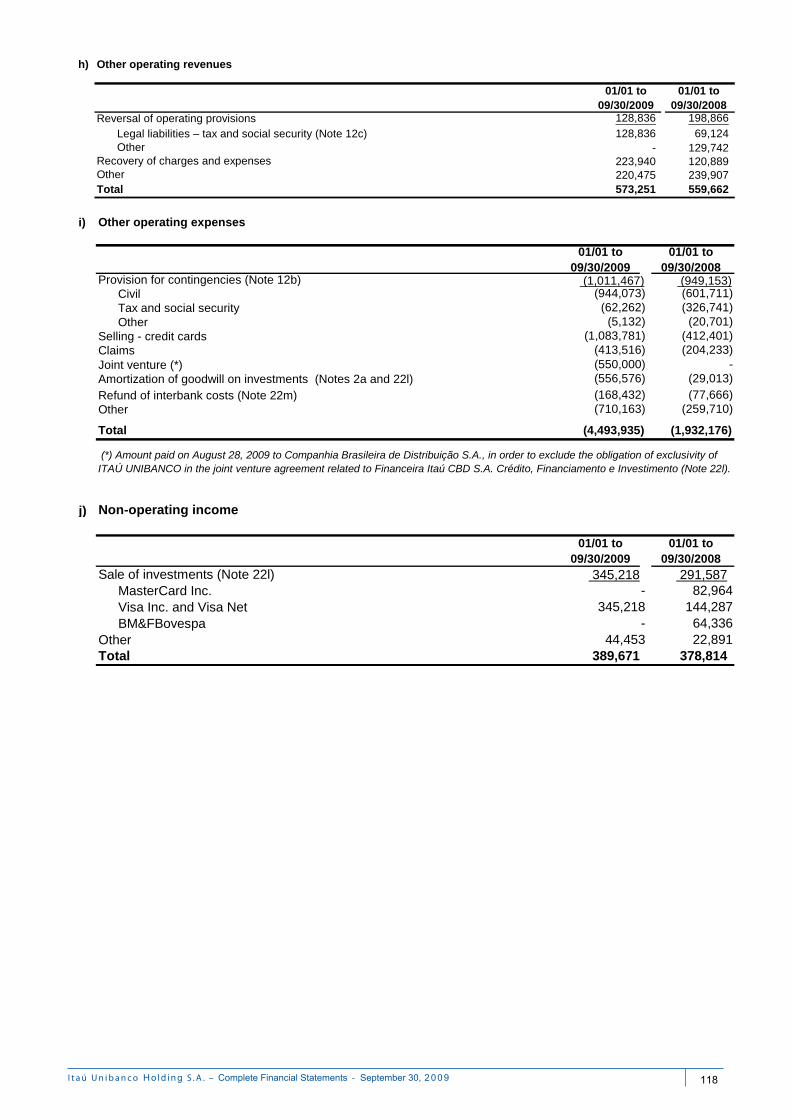
h)
01/01 to 09/30/2009
01/01 to 09/30/2008
128,836 198,866
Legal liabilities – tax and social security (Note 12c) 128,836 69,124Other - 129,742
223,940 120,889220,475 239,907573,251 559,662
Other operating revenues
Total
Reversal of operating provisions
Recovery of charges and expensesOther
i)
01/01 to 09/30/2009
01/01 to 09/30/2008
(1,011,467) (949,153) (944,073) (601,711) (62,262) (326,741) (5,132) (20,701) (1,083,781) (412,401) (413,516) (204,233) (550,000) - (556,576) (29,013)
(168,432) (77,666) (710,163) (259,710)
(4,493,935) (1,932,176)
j)
01/01 to 09/30/2009
01/01 to 09/30/2008
345,218 291,587 - 82,964 345,218 144,287
BM&FBovespa - 64,336 44,453 22,891
389,671 378,814 Total
Provision for contingencies (Note 12b)
MasterCard Inc.Visa Inc. and Visa Net
Other
Other
Non-operating income
Sale of investments (Note 22l)
Total
Other operating expenses
Amortization of goodwill on investments (Notes 2a and 22l)
Selling - credit cardsClaims
Other
CivilTax and social security
Joint venture (*)
(*) Amount paid on August 28, 2009 to Companhia Brasileira de Distribuição S.A., in order to exclude the obligation of exclusivity of ITAÚ UNIBANCO in the joint venture agreement related to Financeira Itaú CBD S.A. Crédito, Financiamento e Investimento (Note 22l).
Refund of interbank costs (Note 22m)
I t a ú U n i b a n c o S . A . – - September 0
118
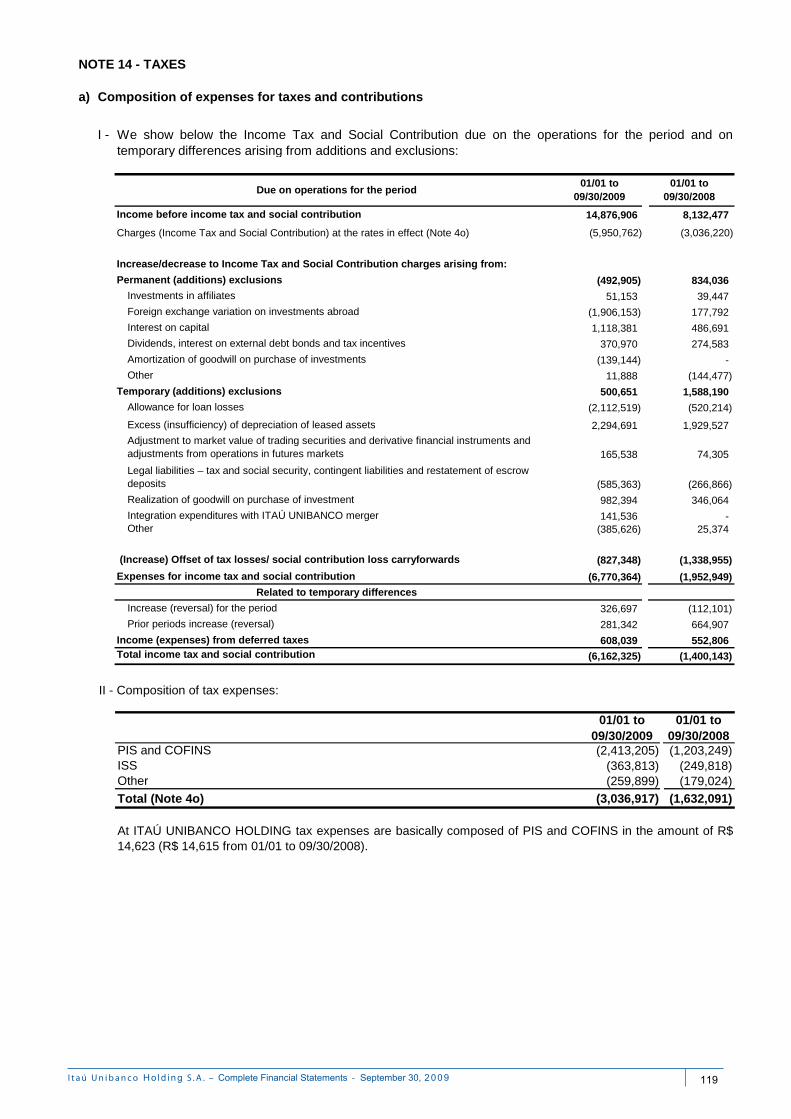
a)
I -
Income before income tax and social contribution 14,876,906 8,132,477
Charges (Income Tax and Social Contribution) at the rates in effect (Note 4o) (5,950,762) (3,036,220)
Increase/decrease to Income Tax and Social Contribution charges arising from:
Permanent (additions) exclusions (492,905) 834,036
Investments in affiliates 51,153 39,447
Foreign exchange variation on investments abroad (1,906,153) 177,792
Interest on capital 1,118,381 486,691
Dividends, interest on external debt bonds and tax incentives 370,970 274,583
Amortization of goodwill on purchase of investments (139,144) -
Other 11,888 (144,477)
Temporary (additions) exclusions 500,651 1,588,190
Allowance for loan losses (2,112,519) (520,214)
Excess (insufficiency) of depreciation of leased assets 2,294,691 1,929,527
Adjustment to market value of trading securities and derivative financial instruments and adjustments from operations in futures markets 165,538 74,305
Legal liabilities – tax and social security, contingent liabilities and restatement of escrow deposits (585,363) (266,866)
Realization of goodwill on purchase of investment 982,394 346,064
Integration expenditures with ITAÚ UNIBANCO merger 141,536 - Other (385,626) 25,374
(Increase) Offset of tax losses/ social contribution loss carryforwards (827,348) (1,338,955)
Expenses for income tax and social contribution (6,770,364) (1,952,949)
Related to temporary differences
Increase (reversal) for the period 326,697 (112,101)
Prior periods increase (reversal) 281,342 664,907
Income (expenses) from deferred taxes 608,039 552,806 Total income tax and social contribution (6,162,325) (1,400,143)
NOTE 14 - TAXES
01/01 to 09/30/2009
01/01 to 09/30/2008
Composition of expenses for taxes and contributions
We show below the Income Tax and Social Contribution due on the operations for the period and ontemporary differences arising from additions and exclusions:
Due on operations for the period
01/01 to 09/30/2009
01/01 to 09/30/2008
PIS and COFINS (2,413,205) (1,203,249) ISS (363,813) (249,818) Other (259,899) (179,024)
Total (Note 4o) (3,036,917) (1,632,091)
At ITAÚ UNIBANCO HOLDING tax expenses are basically composed of PIS and COFINS in the amount of R$14,623 (R$ 14,615 from 01/01 to 09/30/2008).
II - Composition of tax expenses:
I t a ú U n i b a n c o S . A . – - September 0
119
III- Tax effects on foreign exchange management of investments abroad
In order to minimize the effects on income in connection with the foreign exchange variation on investments abroad, net of respective tax effects, ITAÚ UNIBANCO HOLDING carries out derivative transactions in foreign currency (hedge), as mentioned in Note 22b.
Results of these transactions are considered in the calculation basis of income tax and social contribution, according to their nature, while the foreign exchange variation on investments abroad is not included therein, pursuant to tax legislation in force.
I t a ú U n i b a n c o S . A . – - September 0
120
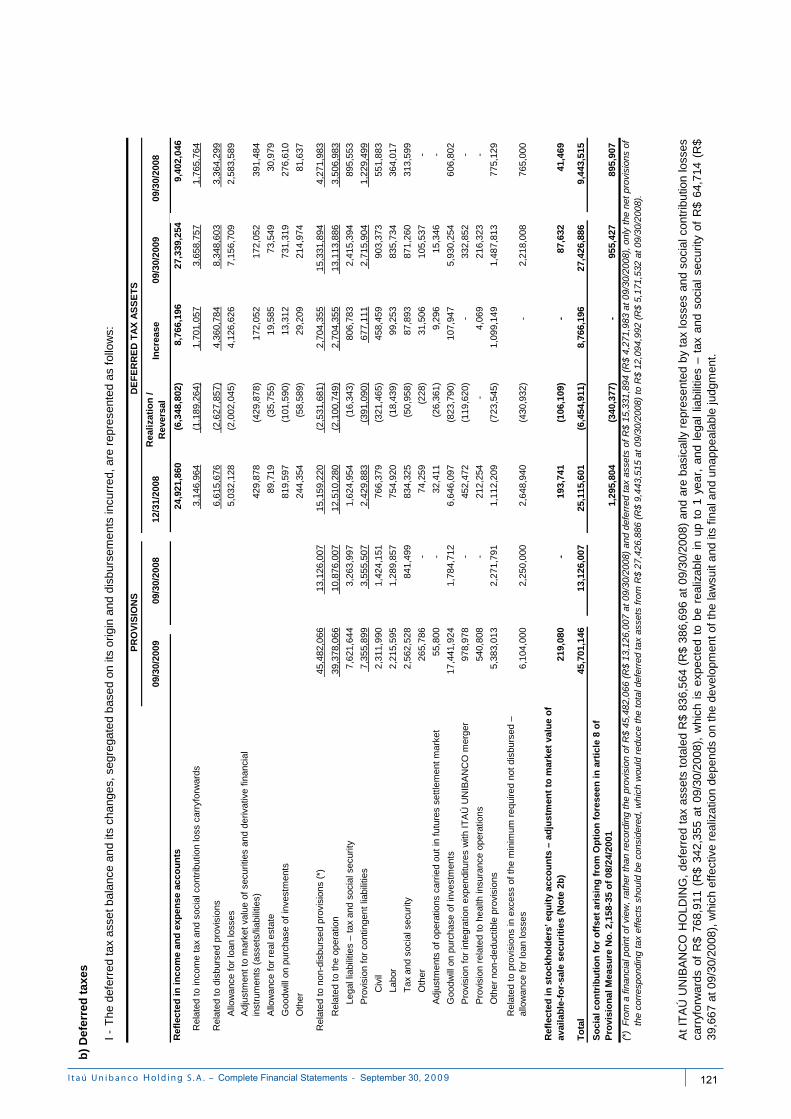
I -
24
,921
,860
(6,3
48,8
02)
8,76
6,19
6
27,
339,
254
9,4
02,0
46
3,1
46,9
64 (
1,18
9,26
4) 1
,701
,057
3,6
58,7
57 1
,765
,764
6,6
15,6
76 (
2,62
7,85
7) 4
,360
,784
8,3
48,6
03 3
,364
,299
5,0
32,1
28 (
2,00
2,04
5)4,
126,
626
7,1
56,7
092,
583,
589
429
,878
(42
9,87
8)17
2,05
2
172
,052
391,
484
89,
719
(35
,755
)19
,585
73,
549
30,9
79
819
,597
(10
1,59
0)13
,312
731
,319
276,
610
244
,354
(58
,589
)29
,209
214
,974
81,6
37
45,
482,
066
13,
126,
007
15,
159,
220
(2,
531,
681)
2,7
04,3
55 1
5,33
1,89
4 4
,271
,983
39,
378,
066
10,
876,
007
12,
510,
280
(2,
100,
749)
2,7
04,3
55 1
3,11
3,88
6 3
,506
,983
7,62
1,64
4
3,26
3,99
7
1,6
24,9
54(1
6,34
3)
80
6,78
3
2,4
15,3
9489
5,55
3
7,3
55,8
99 3
,555
,507
2,4
29,8
83 (
391,
090)
677
,111
2,7
15,9
04 1
,229
,499
Civ
il2,
311,
990
1,
424,
151
7
66,3
79(3
21,4
65)
45
8,45
9
903
,373
551,
883
Labo
r2,
215,
595
1,
289,
857
7
54,9
20(1
8,43
9)
99
,253
835
,734
364,
017
Tax
and
soc
ial s
ecur
ity2,
562,
528
84
1,49
9
83
4,32
5
(5
0,95
8)
87
,893
871
,260
313,
599
Oth
er26
5,78
6
-
74,2
59
(2
28)
31,5
06
1
05,5
37-
55,8
00
-
32
,411
(26,
361)
9,29
6
15,
346
-
17,4
41,9
24
1,
784,
712
6,
646,
097
(823
,790
)
107,
947
5,
930,
254
606,
802
978,
978
-
45
2,47
2
(1
19,6
20)
-
3
32,8
52-
540,
808
-
21
2,25
4
-
4,
069
2
16,3
23-
5,38
3,01
3
2,27
1,79
1
1,11
2,20
9
(7
23,5
45)
1,
099,
149
1,4
87,8
1377
5,12
9
6,1
04,0
00 2
,250
,000
2,6
48,9
40 (
430,
932)
-
2,2
18,0
08 7
65,0
00
219
,080
- 1
93,7
41 (
106,
109)
-
87,6
32
41,
469
45,7
01,1
46
13
,126
,007
25,1
15,6
01
(6,4
54,9
11)
8,
766,
196
27,4
26,8
86
9,44
3,51
5
1,29
5,80
4
(
340,
377)
- 9
55,4
2789
5,90
7
(*)
PR
OV
ISIO
NS
09/3
0/20
0909
/30/
2008
Rel
ated
to
inco
me
tax
and
soci
al c
ontr
ibut
ion
loss
car
ryfo
rwar
ds
Ref
lect
ed i
n i
nco
me
and
exp
ense
acc
ou
nts
09/3
0/20
0909
/30/
2008
Ref
lect
edin
sto
ckh
old
ers’
equ
ity
acco
un
ts–
adju
stm
ent
tom
arke
tva
lue
of
avai
lab
le-f
or-
sale
sec
uri
ties
(N
ote
2b
)
Adj
ustm
ents
of
oper
atio
ns c
arrie
d ou
t in
fut
ures
set
tlem
ent
mar
ket
b)
Def
erre
d t
axes
The
def
erre
d ta
x as
set b
alan
ce a
nd it
s ch
ange
s, s
egre
gate
d ba
sed
on it
s or
igin
and
dis
burs
emen
ts in
curr
ed, a
re r
epre
sent
ed a
s fo
llow
s:
DE
FE
RR
ED
TA
X A
SS
ET
S
Incr
ease
12/3
1/20
08R
eali
zati
on
/
Rev
ersa
l
Pro
visi
on r
elat
ed t
o he
alth
insu
ranc
e op
erat
ions
At
ITA
ÚU
NIB
AN
CO
HO
LDIN
G,
defe
rred
tax
asse
tsto
tale
dR
$83
6,56
4(R
$38
6,69
6at
09/3
0/20
08)
and
are
basi
cally
repr
esen
ted
byta
xlo
sses
and
soci
alco
ntrib
utio
nlo
sses
carr
yfor
war
dsof
R$
768,
911
(R$
342,
355
at09
/30/
2008
),w
hich
isex
pect
edto
bere
aliz
able
inup
to1
year
,an
dle
gal
liabi
litie
s–
tax
and
soci
alse
curit
yof
R$
64,7
14(R
$39
,667
at 0
9/30
/200
8), w
hich
eff
ectiv
e re
aliz
atio
n de
pend
s on
the
deve
lopm
ent
of t
he la
wsu
it an
d its
fin
al a
nd u
napp
eala
ble
judg
men
t.
To
tal
So
cial
co
ntr
ibu
tio
n f
or
off
set
aris
ing
fro
m O
pti
on
fo
rese
en i
n a
rtic
le 8
of
Pro
visi
on
al M
easu
re N
o.
2,15
8-35
of
08/2
4/20
01
Fro
ma
finan
cial
poin
tof
view
,ra
ther
than
reco
rdin
gth
epr
ovis
ion
ofR
$45
,482
,066
(R$
13,1
26,0
07at
09/3
0/20
08)
and
defe
rred
tax
asse
tsof
R$
15,3
31,8
94(R
$4,
271,
983
at09
/30/
2008
),on
lyth
ene
tpr
ovis
ions
ofth
e co
rres
pond
ing
tax
effe
cts
shou
ld b
e co
nsid
ered
, w
hich
wou
ld r
educ
e th
e to
tal d
efer
red
tax
asse
ts f
rom
R$
27,4
26,8
86 (
R$
9,4
43,5
15 a
t 09
/30/
2008
) to
R$
12,0
94,9
92 (
R$
5,17
1,53
2 at
09/
30/2
008)
.
Rel
ated
to
prov
isio
ns in
exc
ess
of t
he m
inim
um r
equi
red
not
disb
urse
d –
allo
wan
ce f
or lo
an lo
sses
Lega
l lia
bilit
ies
– ta
x an
d so
cial
sec
urity
Pro
visi
on f
or in
tegr
atio
n ex
pend
iture
s w
ith I
TA
Ú U
NIB
AN
CO
mer
ger
Oth
er n
on-d
educ
tible
pro
visi
ons
Allo
wan
ce f
or r
eal e
stat
e
Adj
ustm
ent
to m
arke
t va
lue
of s
ecur
ities
and
der
ivat
ive
finan
cial
in
stru
men
ts (
asse
ts/li
abili
ties)
Allo
wan
ce f
or lo
an lo
sses
Rel
ated
to
disb
urse
d pr
ovis
ions
Goo
dwill
on
purc
hase
of
inve
stm
ents
Oth
er Pro
visi
on f
or c
ontin
gent
liab
ilitie
s
Goo
dwill
on
purc
hase
of
inve
stm
ents
Rel
ated
to
non-
disb
urse
d pr
ovis
ions
(*)
Rel
ated
to
the
oper
atio
n
I t a ú U n i b a n c o S . A . – - September 0
121
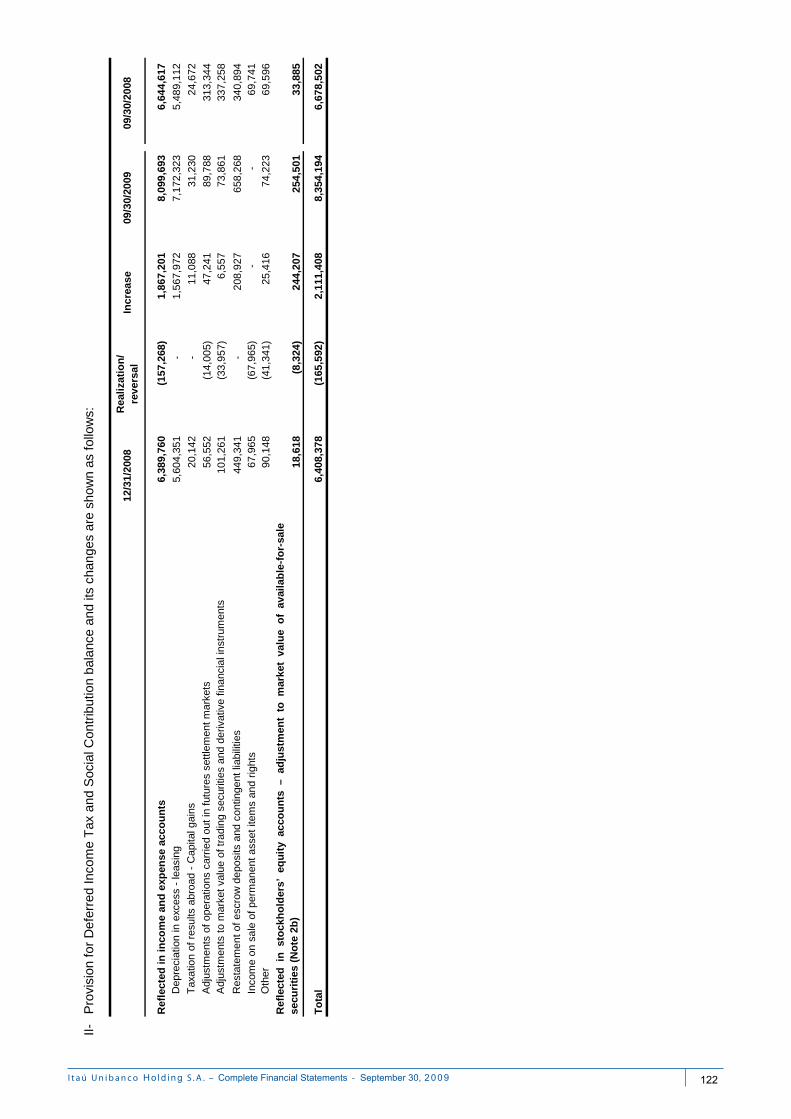
II-
6,38
9,76
0
(1
57,2
68)
1
,867
,201
8,09
9,69
3
6,6
44
,617
Dep
reci
atio
n in
exc
ess
- le
asin
g5,
604,
351
-
1
,567
,972
7,17
2,32
3
5,4
89
,112
Tax
atio
n of
res
ults
abr
oad
- C
apita
l gai
ns20
,142
-
11,0
88
31,2
30
2
4,6
72
Adj
ustm
ents
of
oper
atio
ns c
arrie
d ou
t in
fut
ures
set
tlem
ent
mar
kets
56,5
52
(14
,00
5)
47
,241
89
,788
313
,344
Adj
ustm
ents
to
mar
ket
valu
e of
tra
ding
sec
uriti
es a
nd d
eriv
ativ
e fin
anci
al in
stru
men
ts10
1,26
1
(3
3,9
57)
6,5
57
73
,861
337
,258
Res
tate
men
t of
esc
row
dep
osits
and
con
tinge
nt li
abili
ties
449,
341
-
2
08,9
27
6
58,2
68
340
,894
Inco
me
on s
ale
of p
erm
anen
t as
set
item
s an
d rig
hts
67,9
65
(67
,96
5)
-
-
69
,741
O
ther
90,1
48
(41
,34
1)
25
,416
74
,223
69
,596
18,6
18
(8,3
24)
2
44,2
07
2
54,5
01
33
,885
6,40
8,37
8
(1
65,5
92)
2
,111
,408
8,35
4,19
4
6,6
78
,502
(1,8
69,9
52)
Ref
lect
ed i
n i
nco
me
and
exp
ense
acc
ou
nts
Ref
lect
edin
sto
ckh
old
ers’
equ
ity
acco
un
ts–
adju
stm
ent
tom
arke
tva
lue
of
avai
lab
le-f
or-
sale
secu
riti
es (
No
te 2
b)
To
tal
09/3
0/20
0909
/30/
2008
Incr
ease
Rea
liza
tio
n/
reve
rsal
12/3
1/20
08
Pro
visi
on f
or
De
ferr
ed In
com
e T
ax a
nd S
ocia
l Con
trib
utio
n b
ala
nce
and
its c
han
ges
are
show
n as
fol
low
s:
I t a ú U n i b a n c o S . A . – - September 0
122
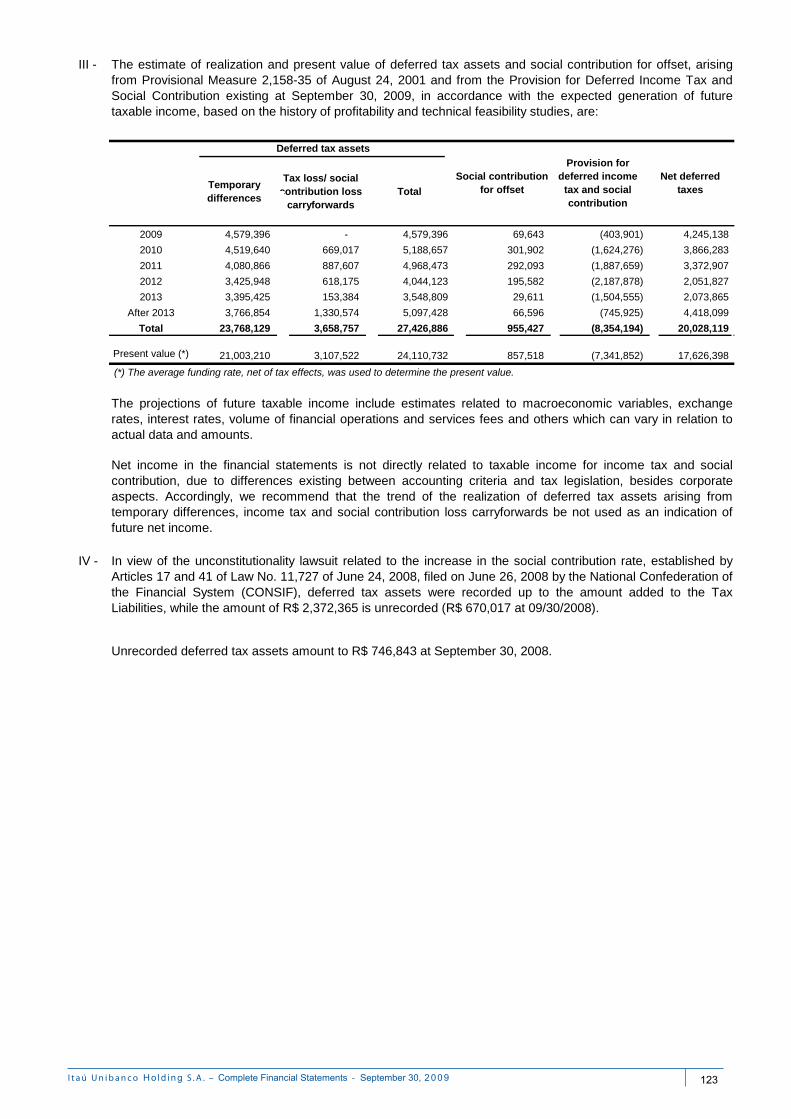
III -
Temporary differences
Tax loss/ social contribution loss
carryforwardsTotal
2009 4,579,396 - 4,579,396 69,643 (403,901) 4,245,138
2010 4,519,640 669,017 5,188,657 301,902 (1,624,276) 3,866,283
2011 4,080,866 887,607 4,968,473 292,093 (1,887,659) 3,372,907
2012 3,425,948 618,175 4,044,123 195,582 (2,187,878) 2,051,827
2013 3,395,425 153,384 3,548,809 29,611 (1,504,555) 2,073,865
After 2013 3,766,854 1,330,574 5,097,428 66,596 (745,925) 4,418,099
Total 23,768,129 3,658,757 27,426,886 955,427 (8,354,194) 20,028,119
Present value (*) 21,003,210 3,107,522 24,110,732 857,518 (7,341,852) 17,626,398
IV -
(*) The average funding rate, net of tax effects, was used to determine the present value.
In view of the unconstitutionality lawsuit related to the increase in the social contribution rate, established byArticles 17 and 41 of Law No. 11,727 of June 24, 2008, filed on June 26, 2008 by the National Confederation ofthe Financial System (CONSIF), deferred tax assets were recorded up to the amount added to the TaxLiabilities, while the amount of R$ 2,372,365 is unrecorded (R$ 670,017 at 09/30/2008).
The projections of future taxable income include estimates related to macroeconomic variables, exchangerates, interest rates, volume of financial operations and services fees and others which can vary in relation toactual data and amounts.
Net income in the financial statements is not directly related to taxable income for income tax and socialcontribution, due to differences existing between accounting criteria and tax legislation, besides corporateaspects. Accordingly, we recommend that the trend of the realization of deferred tax assets arising fromtemporary differences, income tax and social contribution loss carryforwards be not used as an indication offuture net income.
The estimate of realization and present value of deferred tax assets and social contribution for offset, arisingfrom Provisional Measure 2,158-35 of August 24, 2001 and from the Provision for Deferred Income Tax andSocial Contribution existing at September 30, 2009, in accordance with the expected generation of futuretaxable income, based on the history of profitability and technical feasibility studies, are:
Unrecorded deferred tax assets amount to R$ 746,843 at September 30, 2008.
Deferred tax assets
Social contribution for offset
Provision for deferred income
tax and social contribution
Net deferred taxes
I t a ú U n i b a n c o S . A . – - September 0
123
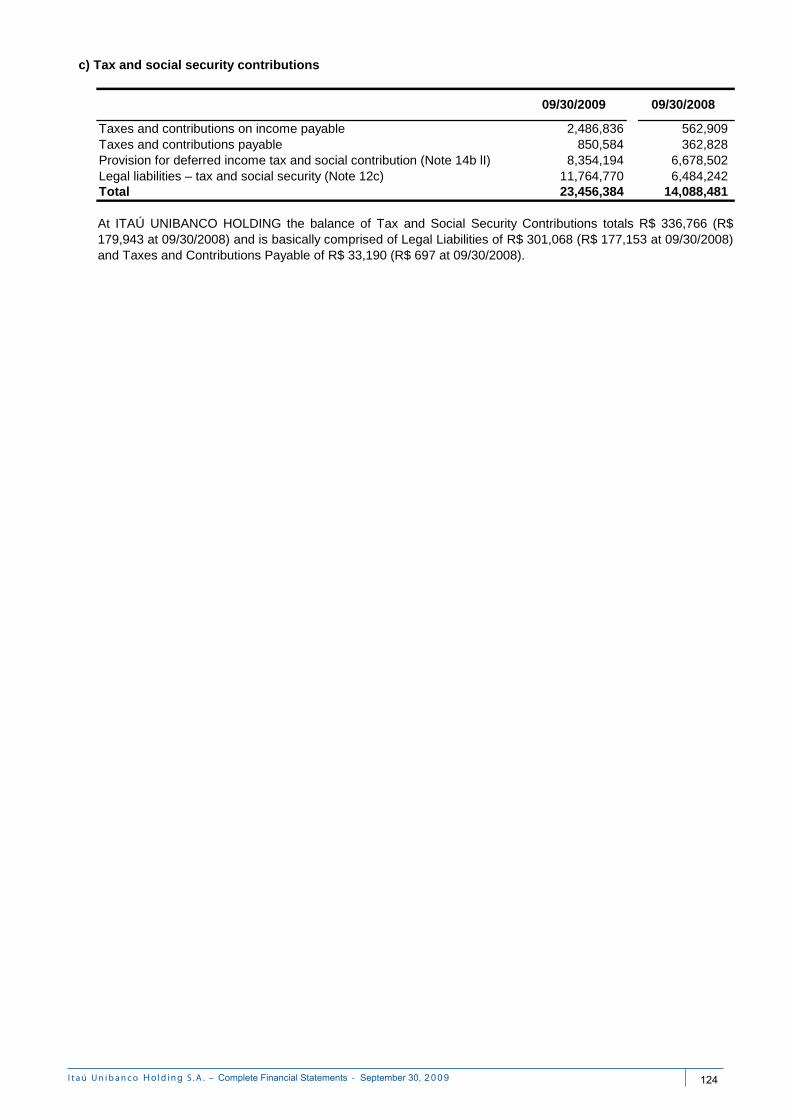
2,486,836 562,909 850,584 362,828
8,354,194 6,678,502 11,764,770 6,484,242 23,456,384 14,088,481
c) Tax and social security contributions
Taxes and contributions payableProvision for deferred income tax and social contribution (Note 14b lI)Legal liabilities – tax and social security (Note 12c)
Taxes and contributions on income payable
Total
At ITAÚ UNIBANCO HOLDING the balance of Tax and Social Security Contributions totals R$ 336,766 (R$179,943 at 09/30/2008) and is basically comprised of Legal Liabilities of R$ 301,068 (R$ 177,153 at 09/30/2008)and Taxes and Contributions Payable of R$ 33,190 (R$ 697 at 09/30/2008).
09/30/2009 09/30/2008
I t a ú U n i b a n c o S . A . – - September 0
124
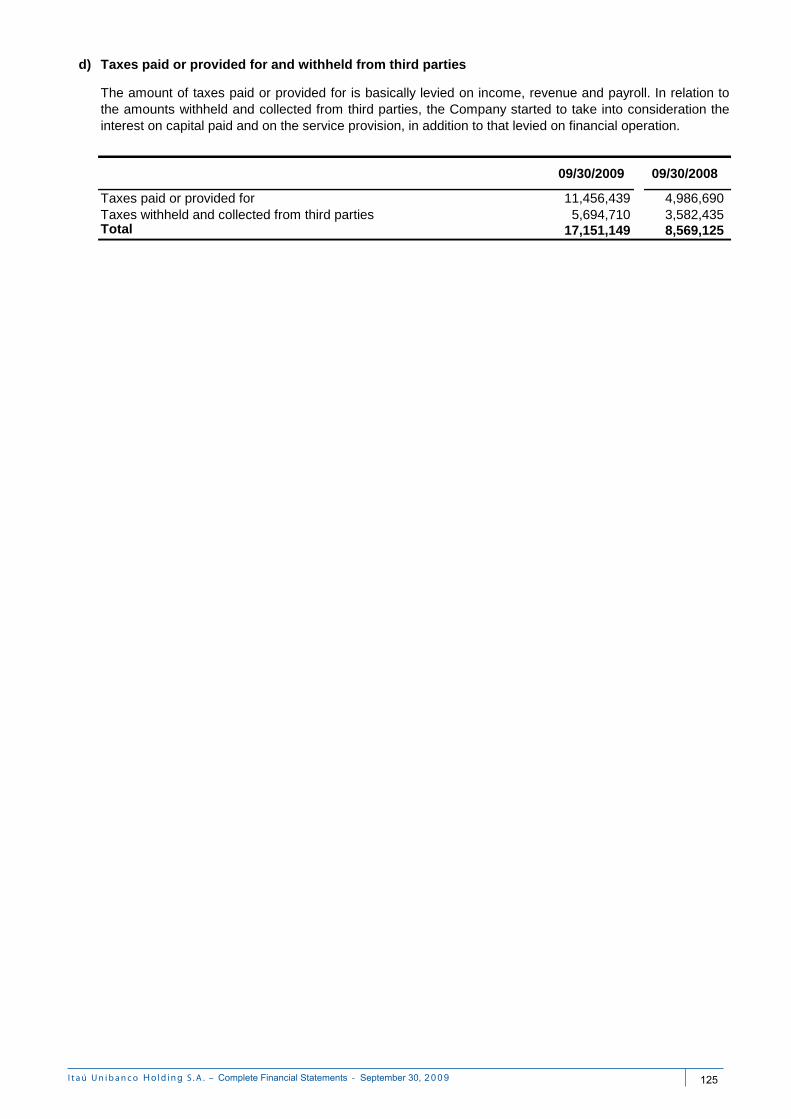
d)
09/30/2009 09/30/2008
Taxes paid or provided for 11,456,439 4,986,690 Taxes withheld and collected from third parties 5,694,710 3,582,435 Total 17,151,149 8,569,125
Taxes paid or provided for and withheld from third parties
The amount of taxes paid or provided for is basically levied on income, revenue and payroll. In relation tothe amounts withheld and collected from third parties, the Company started to take into consideration theinterest on capital paid and on the service provision, in addition to that levied on financial operation.
I t a ú U n i b a n c o S . A . – - September 0
125
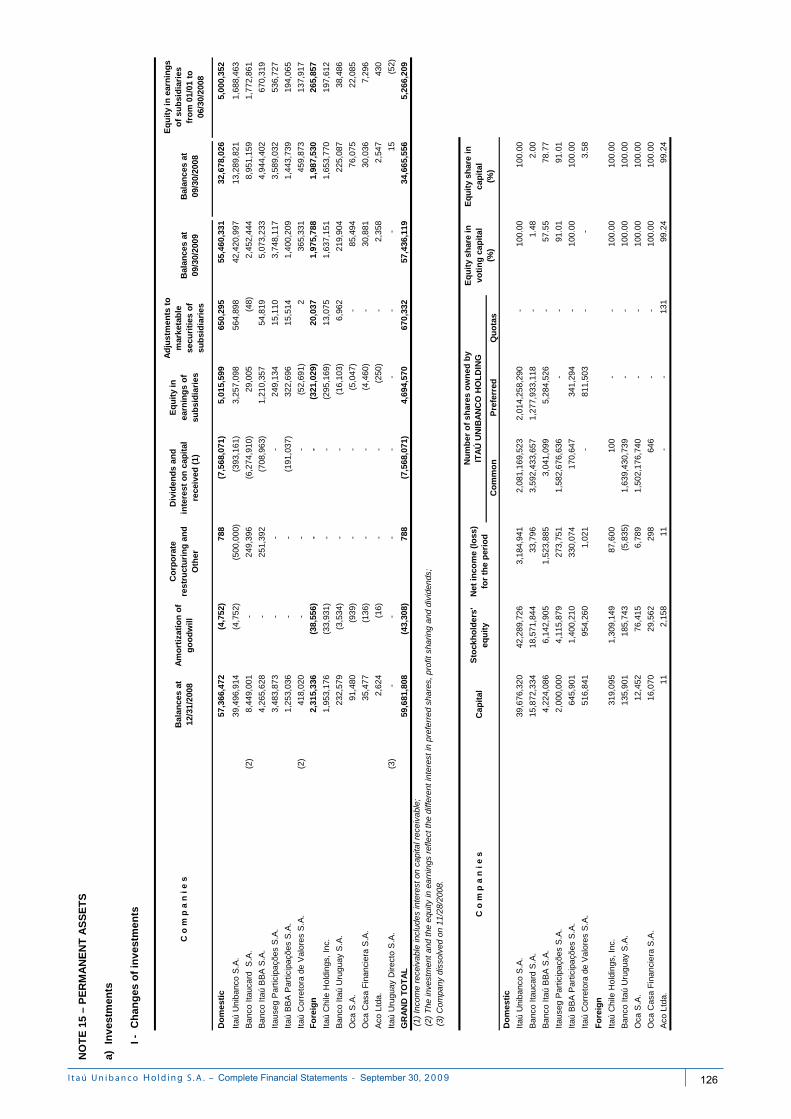
a)
I -
C o
m p
a n
i e
sB
alan
ces
at
12/3
1/20
08A
mo
rtiz
atio
n o
f g
oo
dw
ill
Co
rpo
rate
re
stru
ctu
rin
g a
nd
O
ther
Div
iden
ds
and
in
tere
st o
n c
apit
al
rece
ived
(1)
Eq
uit
y in
ea
rnin
gs
of
sub
sid
iari
es
Ad
just
men
ts t
o
mar
keta
ble
se
curi
ties
of
sub
sid
iari
es
Bal
ance
s at
09
/30/
2009
Bal
ance
s at
09
/30/
2008
Eq
uit
y in
ear
nin
gs
of
sub
sid
iari
es
fro
m 0
1/01
to
06
/30/
2008
Do
mes
tic
57,3
66,4
72
(4
,752
)
78
8
(7
,568
,071
)
5,01
5,59
9
65
0,29
5
55
,460
,331
32,6
78,0
26
5,
000,
352
Itaú
Uni
banc
o S
.A.
39,4
96,9
14
(4
,752
)
(5
00,0
00)
(393
,161
)
3,
257,
098
564,
898
42,4
20,9
97
13
,289
,821
1,68
8,46
3
Ban
co I
tauc
ard
S.A
. (2
)8,
449,
001
-
24
9,39
6
(6,2
74,9
10)
29
,005
(48)
2,45
2,44
4
8,95
1,15
9
1,77
2,86
1
Ban
co I
taú
BB
A S
.A.
4,26
5,62
8
-
251,
392
(7
08,9
63)
1,21
0,35
7
54
,819
5,
073,
233
4,
944,
402
67
0,31
9
Itau
seg
Par
ticip
açõe
s S
.A.
3,48
3,87
3
-
-
-
249,
134
15,1
10
3,74
8,11
7
3,58
9,03
2
536,
727
Itaú
BB
A P
artic
ipaç
ões
S.A
.1,
253,
036
-
-
(1
91,0
37)
322,
696
15,5
14
1,40
0,20
9
1,44
3,73
9
194,
065
Itaú
Cor
reto
ra d
e V
alor
es S
.A.
(2)
418,
020
-
-
-
(5
2,69
1)
2
365,
331
45
9,87
3
137,
917
Fo
reig
n2,
315,
336
(3
8,55
6)
-
-
(321
,029
)
20,0
37
1,97
5,78
8
1,98
7,53
0
265,
857
Itaú
Chi
le H
oldi
ngs,
Inc
.1,
953,
176
(3
3,93
1)
-
-
(295
,169
)
13,0
75
1,63
7,15
1
1,65
3,77
0
197,
612
Ban
co I
taú
Uru
guay
S.A
.23
2,57
9
(3,5
34)
-
-
(16,
103)
6,96
2
21
9,90
4
225,
087
38
,486
Oca
S.A
.91
,480
(939
)
-
-
(5
,047
)
-
85
,494
76,0
75
22
,085
Oca
Cas
a F
inan
cier
a S
.A.
35,4
77
(1
36)
-
-
(4,4
60)
-
30,8
81
30
,036
7,29
6
Aco
Ltd
a.2,
624
(1
6)
-
-
(250
)
-
2,35
8
2,54
7
430
Itaú
Uru
guay
Dire
cto
S.A
.(3
)-
-
-
-
-
-
-
15
(52)
GR
AN
D T
OT
AL
59
,681
,808
(43,
308)
78
8
(7
,568
,071
)
4,69
4,57
0
67
0,33
2
57
,436
,119
34,6
65,5
56
5,
266,
209
Co
mm
on
Pre
ferr
edQ
uo
tas
39,6
76,3
20
42
,289
,726
3,18
4,94
1
2,08
1,16
9,52
3
2,
014,
258,
290
-
100.
00
10
0.00
15,8
72,3
34
18
,571
,844
33,7
96
3,
592,
433,
657
1,27
7,93
3,11
8
-
1.
48
2.
00
4,22
4,08
6
6,14
2,90
5
1,52
3,88
5
3,04
1,09
9
5,28
4,52
6
-
57.5
5
78.7
7
2,00
0,00
0
4,11
5,87
9
273,
751
1,
582,
676,
636
-
-
91
.01
91
.01
645 ,
901
1,
400,
210
33
0,07
4
170,
647
34
1,29
4
-
100.
00
10
0.00
516,
841
95
4,26
0
1,02
1
-
811,
503
-
-
3.
58
319,
095
1,
309,
149
87
,600
100
-
-
10
0.00
100.
00
135,
901
18
5,74
3
(5,8
35)
1,63
9,43
0,73
9
-
-
100.
00
10
0.00
12,4
52
76
,415
6,78
9
1,50
2,17
6,74
0
-
-
100.
00
10
0.00
16,0
70
29
,562
298
646
-
-
10
0.00
100.
00
11
2,15
8
11
-
-
131
99.2
499
.24
Fo
reig
n
(2)
The
inve
stm
ent
and
the
equi
ty in
ear
ning
s re
flect
the
diff
eren
t in
tere
st in
pre
ferr
ed s
hare
s, p
rofit
sha
ring
and
divi
dend
s;
Eq
uit
y sh
are
in
cap
ital
(%
)
Sto
ckh
old
ers'
eq
uit
y
(3)
Com
pany
dis
solv
ed o
n 11
/28/
2008
.
Net
in
com
e (l
oss
) fo
r th
e p
erio
d
Oca
Cas
a F
inan
cier
a S
.A.
Aco
Ltd
a.
Itaú
Uni
banc
o S
.A.
Ban
co I
tauc
ard
S.A
.
Itau
seg
Par
ticip
açõe
s S
.A.
Oca
S.A
.
Itaú
BB
A P
artic
ipaç
ões
S.A
.
Ban
co I
taú
BB
A S
.A.
Itaú
Cor
reto
ra d
e V
alor
es S
.A.
Inv
estm
ents
(1)
Inc
ome
rece
ivab
le in
clud
es in
tere
st o
n ca
pita
l rec
eiva
ble;
NO
TE
15
– P
ER
MA
NE
NT
AS
SE
TS
Ban
co I
taú
Uru
guay
S.A
.
Ch
ang
es o
f in
ves
tmen
ts
Do
mes
tic
Nu
mb
er o
f sh
ares
ow
ned
by
ITA
Ú U
NIB
AN
CO
HO
LD
ING
Eq
uit
y sh
are
in
voti
ng
cap
ital
(%
)C
o m
p a
n i
e s
Cap
ital
Itaú
Chi
le H
oldi
ngs,
Inc
.
I t a ú U n i b a n c o S . A . – - September 0
126
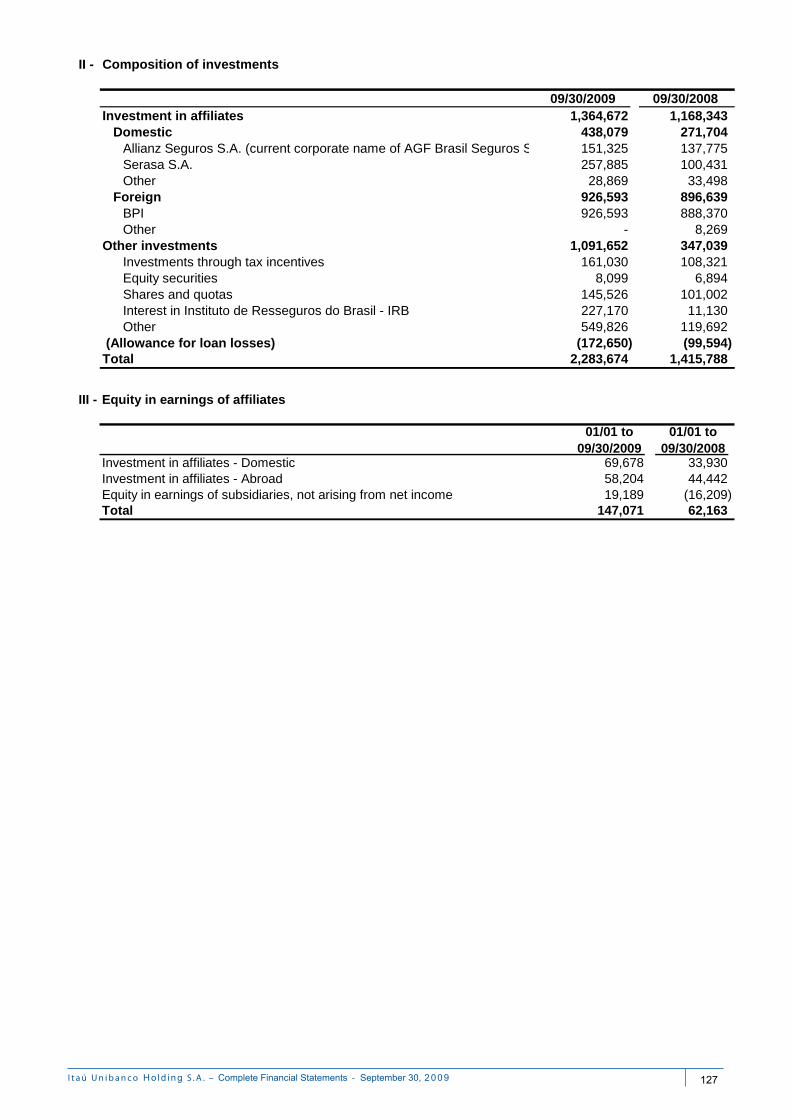
II -
09/30/2009 09/30/20081,364,672 1,168,343
438,079 271,704 Allianz Seguros S.A. (current corporate name of AGF Brasil Seguros S 151,325 137,775 Serasa S.A. 257,885 100,431 Other 28,869 33,498
926,593 896,639 BPI 926,593 888,370 Other - 8,269
Other investments 1,091,652 347,039 Investments through tax incentives 161,030 108,321 Equity securities 8,099 6,894 Shares and quotas 145,526 101,002 Interest in Instituto de Resseguros do Brasil - IRB 227,170 11,130 Other 549,826 119,692
(Allowance for loan losses) (172,650) (99,594) Total 2,283,674 1,415,788
Foreign
Composition of investments
Investment in affiliatesDomestic
III -
01/01 to 09/30/2009
01/01 to 09/30/2008
69,678 33,930 58,204 44,442 19,189 (16,209)
Total 147,071 62,163 Equity in earnings of subsidiaries, not arising from net income
Equity in earnings of affiliates
Investment in affiliates - AbroadInvestment in affiliates - Domestic
I t a ú U n i b a n c o S . A . – - September 0
127
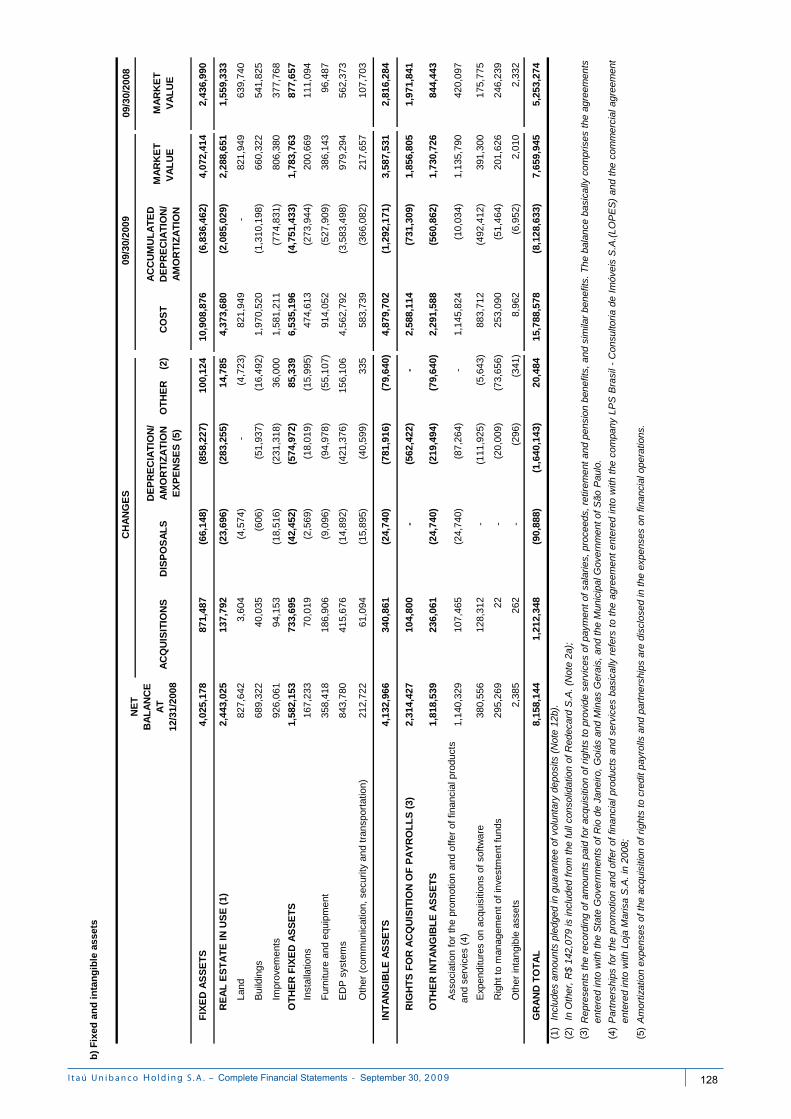
09/3
0/20
08
AC
QU
ISIT
ION
S
DIS
PO
SA
LS
DE
PR
EC
IAT
ION
/ A
MO
RT
IZA
TIO
N
EX
PE
NS
ES
(5)
OT
HE
R
(2
)C
OS
TA
CC
UM
UL
AT
ED
D
EP
RE
CIA
TIO
N/
AM
OR
TIZ
AT
ION
MA
RK
ET
V
AL
UE
MA
RK
ET
V
AL
UE
FIX
ED
AS
SE
TS
4,02
5,17
8
87
1,48
7
(6
6,14
8)
(8
58,2
27)
10
0,12
4
10,9
08,8
76
(6
,836
,462
)
4,
072,
414
2,43
6,99
0
RE
AL
ES
TA
TE
IN
US
E (
1)
2,44
3,02
5
13
7,79
2
(2
3,69
6)
(2
83,2
55)
14
,785
4,37
3,68
0
(2,0
85,0
29)
2,28
8,65
1
1,
559,
333
Lan
d
827,
642
3,
604
(4,5
74)
-
(4,7
23)
821,
949
-
82
1,94
9
639,
740
Bui
ldin
gs
689,
322
40
,035
(6
06)
(5
1,93
7)
(1
6,49
2)
1,97
0,52
0
(1,3
10,1
98)
660,
322
54
1,82
5
Im
prov
emen
ts
926,
061
94
,153
(1
8,51
6)
(2
31,3
18)
36
,000
1,58
1,21
1
(774
,831
)
806,
380
37
7,76
8
OT
HE
R F
IXE
D A
SS
ET
S
1,58
2,15
3
73
3,69
5
(4
2,45
2)
(5
74,9
72)
85
,339
6,53
5,19
6
(4,7
51,4
33)
1,78
3,76
3
87
7,65
7
Ins
talla
tions
16
7,23
3
70,0
19
(2,5
69)
(1
8,01
9)
(1
5,99
5)
474,
613
(273
,944
)
200,
669
11
1,09
4
Fur
nitu
re a
nd e
quip
men
t
358,
418
18
6,90
6
(9
,096
)
(94,
978)
(55,
107)
91
4,05
2
(5
27,9
09)
38
6,14
3
96,4
87
ED
P s
yste
ms
84
3,78
0
415,
676
(14,
892)
(421
,376
)
156,
106
4,
562,
792
(3
,583
,498
)
97
9,29
4
562,
373
Oth
er (
com
mun
icat
ion,
sec
urity
and
tra
nspo
rtat
ion)
21
2,72
2
61,0
94
(15,
895)
(40,
599)
335
583,
739
(366
,082
)
217,
657
10
7,70
3
IN
TA
NG
IBL
E A
SS
ET
S
4,13
2,96
6
34
0,86
1
(2
4,74
0)
(7
81,9
16)
(7
9,64
0)
4,87
9,70
2
(1,2
92,1
71)
3,58
7,53
1
2,
816,
284
RIG
HT
S F
OR
AC
QU
ISIT
ION
OF
PA
YR
OL
LS
(3)
2,
314,
427
104,
800
-
(5
62,4
22)
-
2,
588,
114
(7
31,3
09)
1,
856,
805
1,97
1,84
1
OT
HE
R I
NT
AN
GIB
LE
AS
SE
TS
1,
818,
539
236,
061
(24,
740)
(219
,494
)
(79,
640)
2,
291,
588
(5
60,8
62)
1,
730,
726
844,
443
Ass
ocia
tion
for
the
prom
otio
n an
d of
fer
of f
inan
cial
pro
duct
s an
d se
rvic
es (
4)
1,14
0,32
9
10
7,46
5
(2
4,74
0)
(8
7,26
4)
-
1,
145,
824
(1
0,03
4)
1,
135,
790
420,
097
Exp
endi
ture
s on
acq
uisi
tions
of
soft
war
e
380,
556
12
8,31
2
-
(111
,925
)
(5,6
43)
883,
712
(492
,412
)
391,
300
17
5,77
5
Rig
ht t
o m
anag
emen
t of
inve
stm
ent
fund
s
295,
269
22
-
(2
0,00
9)
(7
3,65
6)
253,
090
(51,
464)
201,
626
24
6,23
9
Oth
er in
tang
ible
ass
ets
2,
385
26
2
-
(2
96)
(3
41)
8,96
2
(6
,952
)
2,01
0
2,33
2
GR
AN
D T
OT
AL
8,
158,
144
1,21
2,34
8
(9
0,88
8)
(1
,640
,143
)
20
,484
15,7
88,5
78
(8
,128
,633
)
7,
659,
945
5,25
3,27
4
(1)
(2)
(3)
(4)
(5)
In
Oth
er,
R$
142,
079
is in
clud
ed f
rom
the
ful
l con
solid
atio
n of
Red
ecar
d S
.A.
(Not
e 2a
);
Inc
lude
s am
ount
s pl
edge
d in
gua
rant
ee o
f vo
lunt
ary
depo
sits
(N
ote
12b)
.
b)
Fix
ed a
nd
in
tan
gib
le a
sset
s
09/3
0/20
09N
ET
B
AL
AN
CE
A
T
12/3
1/20
08
CH
AN
GE
S
Am
ortiz
atio
n ex
pens
es o
f th
e ac
quis
ition
of
right
s to
cre
dit
payr
olls
and
par
tner
ship
s ar
e di
sclo
sed
in t
he e
xpen
ses
on f
inan
cial
ope
ratio
ns.
Par
tner
ship
sfo
rth
epr
omot
ion
and
offe
rof
finan
cial
prod
ucts
and
serv
ices
basi
cally
refe
rsto
the
agre
emen
ten
tere
din
tow
ithth
eco
mpa
nyLP
SB
rasi
l-C
onsu
ltori
ade
Imóv
eis
S.A
.(LO
PE
S)
and
the
com
mer
cial
agre
emen
ten
tere
d in
to w
ith L
oja
Mar
isa
S.A
. in
200
8;
Rep
rese
nts
the
reco
rdin
gof
amou
nts
paid
for
acqu
isiti
onof
right
sto
prov
ide
serv
ices
ofpa
ymen
tof
sala
ries,
proc
eeds
,re
tirem
ent
and
pens
ion
bene
fits,
and
sim
ilar
bene
fits.
The
bala
nce
basi
cally
com
pris
esth
eag
reem
ents
ente
red
into
with
the
Sta
te G
over
nmen
ts o
f R
io d
e Ja
neiro
, G
oiás
and
Min
as G
erai
s, a
nd t
he M
unic
ipal
Gov
ernm
ent
of S
ão P
aulo
.
I t a ú U n i b a n c o S . A . – - September 0
128
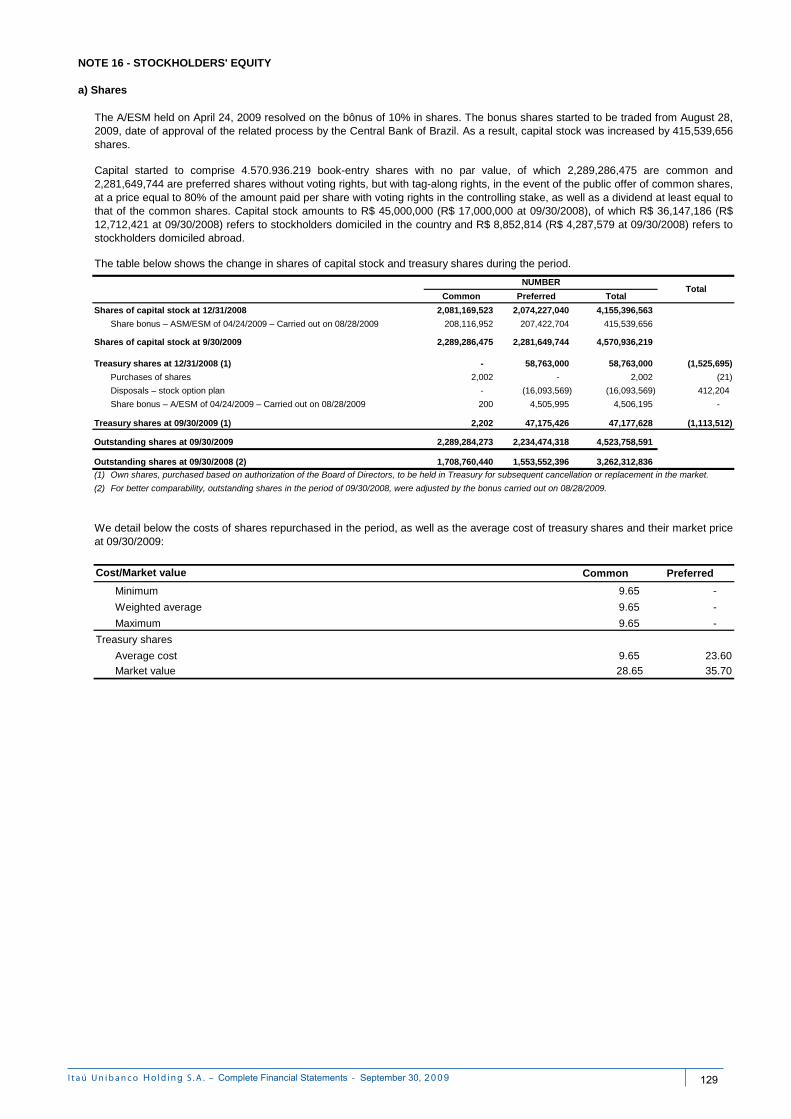
Common Preferred Total
2,081,169,523 2,074,227,040 4,155,396,563
Share bonus – ASM/ESM of 04/24/2009 – Carried out on 08/28/2009 208,116,952 207,422,704 415,539,656
2,289,286,475 2,281,649,744 4,570,936,219
- 58,763,000 58,763,000 (1,525,695)
Purchases of shares 2,002 - 2,002 (21)
Disposals – stock option plan - (16,093,569) (16,093,569) 412,204
Share bonus – A/ESM of 04/24/2009 – Carried out on 08/28/2009 200 4,505,995 4,506,195 -
2,202 47,175,426 47,177,628 (1,113,512)
2,289,284,273 2,234,474,318 4,523,758,591
1,708,760,440 1,553,552,396 3,262,312,836
(1)
(2) For better comparability, outstanding shares in the period of 09/30/2008, were adjusted by the bonus carried out on 08/28/2009.
Own shares, purchased based on authorization of the Board of Directors, to be held in Treasury for subsequent cancellation or replacement in the market.
Shares of capital stock at 9/30/2009
NOTE 16 - STOCKHOLDERS' EQUITY
a) Shares
NUMBER
The A/ESM held on April 24, 2009 resolved on the bônus of 10% in shares. The bonus shares started to be traded from August 28,2009, date of approval of the related process by the Central Bank of Brazil. As a result, capital stock was increased by 415,539,656shares.
We detail below the costs of shares repurchased in the period, as well as the average cost of treasury shares and their market priceat 09/30/2009:
Total
Capital started to comprise 4.570.936.219 book-entry shares with no par value, of which 2,289,286,475 are common and2,281,649,744 are preferred shares without voting rights, but with tag-along rights, in the event of the public offer of common shares,at a price equal to 80% of the amount paid per share with voting rights in the controlling stake, as well as a dividend at least equal tothat of the common shares. Capital stock amounts to R$ 45,000,000 (R$ 17,000,000 at 09/30/2008), of which R$ 36,147,186 (R$12,712,421 at 09/30/2008) refers to stockholders domiciled in the country and R$ 8,852,814 (R$ 4,287,579 at 09/30/2008) refers tostockholders domiciled abroad.
Outstanding shares at 09/30/2009
Treasury shares at 12/31/2008 (1)
Treasury shares at 09/30/2009 (1)
Outstanding shares at 09/30/2008 (2)
Shares of capital stock at 12/31/2008
The table below shows the change in shares of capital stock and treasury shares during the period.
Common Preferred
Minimum 9.65 -
Weighted average 9.65 -
Maximum 9.65 -
Average cost 9.65 23.60
Market value 28.65 35.70
Cost/Market value
Treasury shares
I t a ú U n i b a n c o S . A . – - September 0
129
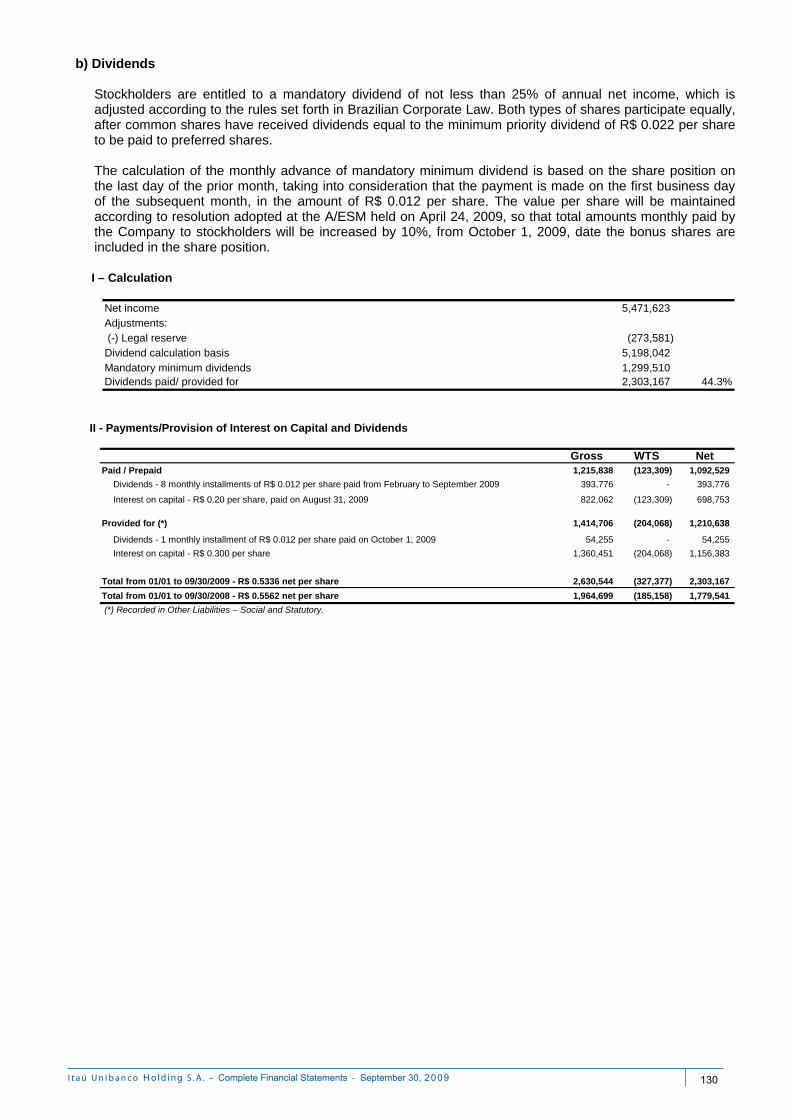
b) Dividends Stockholders are entitled to a mandatory dividend of not less than 25% of annual net income, which is adjusted according to the rules set forth in Brazilian Corporate Law. Both types of shares participate equally, after common shares have received dividends equal to the minimum priority dividend of R$ 0.022 per share to be paid to preferred shares. The calculation of the monthly advance of mandatory minimum dividend is based on the share position on the last day of the prior month, taking into consideration that the payment is made on the first business day of the subsequent month, in the amount of R$ 0.012 per share. The value per share will be maintained according to resolution adopted at the A/ESM held on April 24, 2009, so that total amounts monthly paid by the Company to stockholders will be increased by 10%, from October 1, 2009, date the bonus shares are included in the share position.
5,471,623
(273,581) 5,198,042 1,299,510 2,303,167 44.3%Dividends paid/ provided for
I – Calculation
Net incomeAdjustments: (-) Legal reserveDividend calculation basisMandatory minimum dividends
Gross WTS Net1,215,838 (123,309) 1,092,529
Dividends - 8 monthly installments of R$ 0.012 per share paid from February to September 2009 393,776 - 393,776
Interest on capital - R$ 0.20 per share, paid on August 31, 2009 822,062 (123,309) 698,753
1,414,706 (204,068) 1,210,638
Dividends - 1 monthly installment of R$ 0.012 per share paid on October 1, 2009 54,255 - 54,255
Interest on capital - R$ 0.300 per share 1,360,451 (204,068) 1,156,383
2,630,544 (327,377) 2,303,167
1,964,699 (185,158) 1,779,541
II - Payments/Provision of Interest on Capital and Dividends
(*) Recorded in Other Liabilities – Social and Statutory.
Provided for (*)
Paid / Prepaid
Total from 01/01 to 09/30/2009 - R$ 0.5336 net per share
Total from 01/01 to 09/30/2008 - R$ 0.5562 net per share
I t a ú U n i b a n c o S . A . – - September 0
130
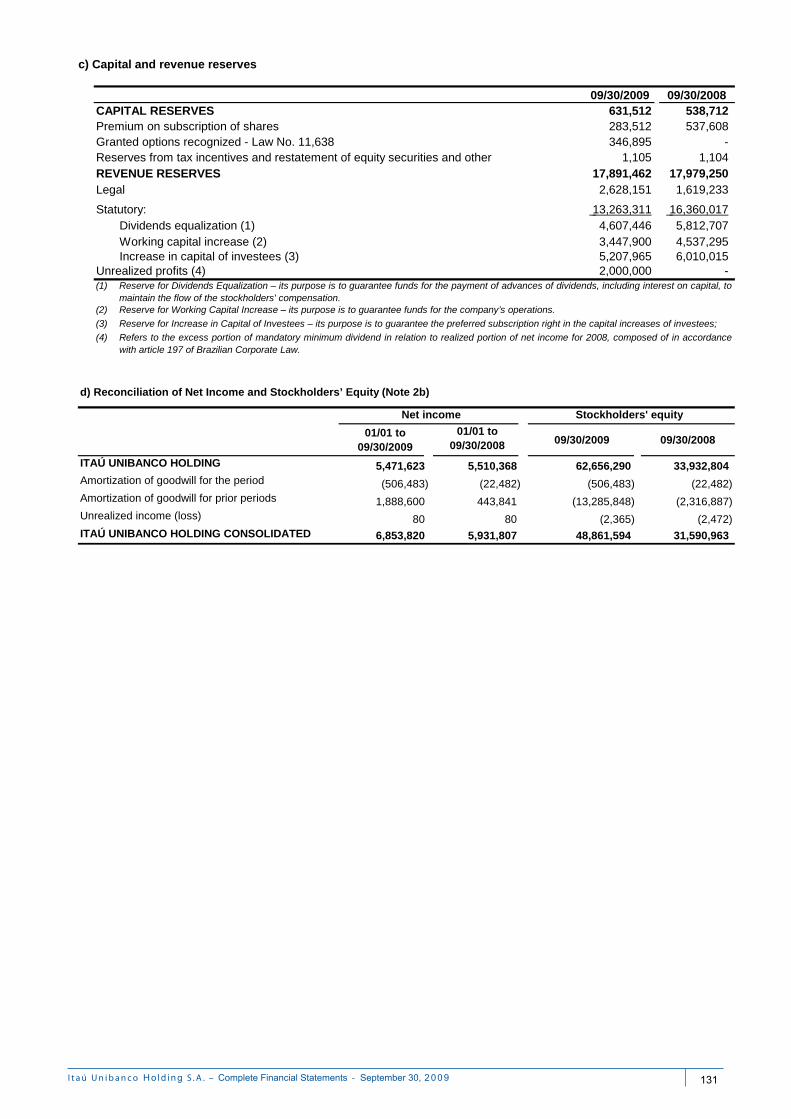
09/30/2009 09/30/2008631,512 538,712 283,512 537,608
Granted options recognized - Law No. 11,638 346,895 - 1,105 1,104
17,891,462 17,979,250 2,628,151 1,619,233
13,263,311 16,360,017 Dividends equalization (1) 4,607,446 5,812,707 Working capital increase (2) 3,447,900 4,537,295 Increase in capital of investees (3) 5,207,965 6,010,015
2,000,000 - (1)
(2)
(3)
(4)
REVENUE RESERVESLegal
Statutory:
Refers to the excess portion of mandatory minimum dividend in relation to realized portion of net income for 2008, composed of in accordancewith article 197 of Brazilian Corporate Law.
Reserve for Working Capital Increase – its purpose is to guarantee funds for the company’s operations.
Reserve for Increase in Capital of Investees – its purpose is to guarantee the preferred subscription right in the capital increases of investees;
c) Capital and revenue reserves
CAPITAL RESERVES
Reserve for Dividends Equalization – its purpose is to guarantee funds for the payment of advances of dividends, including interest on capital, tomaintain the flow of the stockholders' compensation.
Premium on subscription of shares
Reserves from tax incentives and restatement of equity securities and other
Unrealized profits (4)
d) Reconciliation of Net Income and Stockholders’ Equity (Note 2b)
01/01 to 09/30/2009
01/01 to 09/30/2008 09/30/2009 09/30/2008
ITAÚ UNIBANCO HOLDING 5,471,623 5,510,368 62,656,290 33,932,804 Amortization of goodwill for the period (506,483) (22,482) (506,483) (22,482) Amortization of goodwill for prior periods 1,888,600 443,841 (13,285,848) (2,316,887) Unrealized income (loss) 80 80 (2,365) (2,472) ITAÚ UNIBANCO HOLDING CONSOLIDATED 6,853,820 5,931,807 48,861,594 31,590,963
Net income Stockholders' equity
I t a ú U n i b a n c o S . A . – - September 0
131
e) Stock option plan
Before the merger, Itaú and Unibanco had stock-option plans. On April 24, 2009, Itaú’s plan was restructured, and a new program was launched for Itaú Unibanco, also called “Stock Option Plan”. From then on, a stock option will be granted in the prior programs.
I - Stock Option Plan – New ITAÚ UNIBANCO HOLDING Plan
This program aims at involving the officers in the medium and long-term corporate development process. The options are personal and not transferable, and entitle to the subscription of one authorized capital share or, at the discretion of the management, one treasury share which is acquired for replacement purposes. Such options may only be granted in years in which there are sufficient profits to distribute mandatory dividends to stockholders and at a quantity that does not exceed the limit of 0.5% of the total shares held by the stockholders at the base date of the year-end balance sheet. The ITAÚ UNIBANCO HOLDING’s Personnel Committee is responsible for defining the total number of shares to be granted, the eligible officers, the number granted to each officer, the validity of the option series, and the “vesting” and “blackout” periods for exercising the options. Options may be granted to executive officers and Board of Directors members (“Officers”) of ITAÚ UNIBANCO HOLDING and, in exceptional circumstances, to the management of controlled companies or outstanding employees of ITAÚ UNIBANCO HOLDING or the aforementioned companies, and upon the hiring of highly qualified individuals. The exercise price of each series is fixed taking into consideration the average stock price at the São Paulo Stock Exchange over the period from one to three months prior to the issuance of options - subject to a positive or negative adjustment of up to 20% - at the option granting date and restated at the IGP-M until the month prior to the option exercise date. Alternatively, at the Committee’s discretion and by using the performance and leadership evaluation tools, for those executive officers who have potential for outstanding performance, the Committee may offer options which exercise price is to be paid through the performance of positive covenants, supported by the beneficiary’s obligation to invest, in ITAÚ UNIBANCO HOLDING’s shares, the amount of 20% of the net interest in profits and results received in relation to prior year, and keep the ownership of these shares unchanged and without any type of liens from the date shares were granted until its exercise. This plan has not had any option granted so far.
II- Stock Option Plan – Itaú Plan Itau’s original plan, also called “Stock Option Plan”, has characteristics similar to the current plan. The exercise of stock options, pursuant to the Plan’s regulation, resulted in the sale of preferred shares held in treasury thus far. The accounting entries related to the plan are recorded upon the exercise of options, when the amount received from the option exercise price is recorded in Stockholders’ Equity. The dilution percentage of the current stockholders' interest, in the event all granted options not yet exercised were exercised by the end of the vesting period, would be 0.27% for 2009, 0.24% for 2010, 0.23% for 2011, 0.25% for 2012 and 0.38% for 2013. The options had the change below, up to September 30, 2009, taking into account the share bonus effects occurred in each period:
I t a ú U n i b a n c o S . A . – - September 0
132
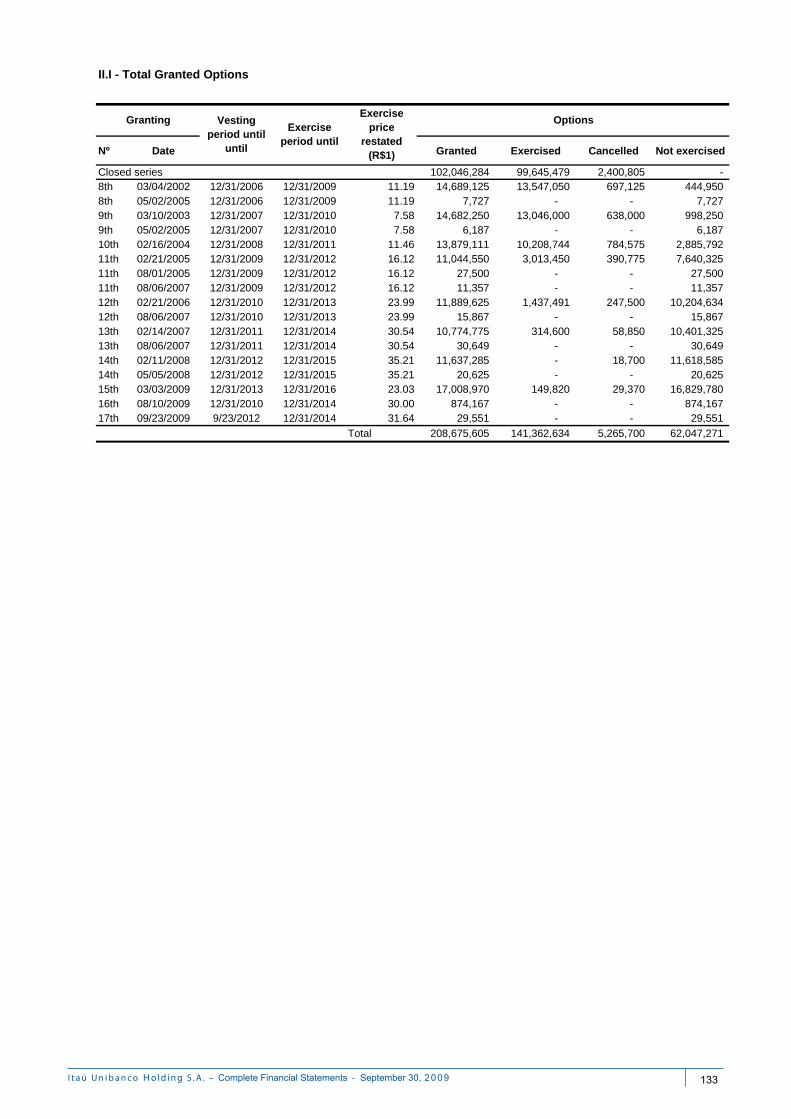
Nº Date Granted Exercised Cancelled Not exercised
Closed series 102,046,284 99,645,479 2,400,805 - 8th 03/04/2002 12/31/2006 12/31/2009 11.19 14,689,125 13,547,050 697,125 444,950 8th 05/02/2005 12/31/2006 12/31/2009 11.19 7,727 - - 7,727 9th 03/10/2003 12/31/2007 12/31/2010 7.58 14,682,250 13,046,000 638,000 998,250 9th 05/02/2005 12/31/2007 12/31/2010 7.58 6,187 - - 6,187 10th 02/16/2004 12/31/2008 12/31/2011 11.46 13,879,111 10,208,744 784,575 2,885,792 11th 02/21/2005 12/31/2009 12/31/2012 16.12 11,044,550 3,013,450 390,775 7,640,325 11th 08/01/2005 12/31/2009 12/31/2012 16.12 27,500 - - 27,500 11th 08/06/2007 12/31/2009 12/31/2012 16.12 11,357 - - 11,357 12th 02/21/2006 12/31/2010 12/31/2013 23.99 11,889,625 1,437,491 247,500 10,204,634 12th 08/06/2007 12/31/2010 12/31/2013 23.99 15,867 - - 15,867 13th 02/14/2007 12/31/2011 12/31/2014 30.54 10,774,775 314,600 58,850 10,401,325 13th 08/06/2007 12/31/2011 12/31/2014 30.54 30,649 - - 30,649 14th 02/11/2008 12/31/2012 12/31/2015 35.21 11,637,285 - 18,700 11,618,585 14th 05/05/2008 12/31/2012 12/31/2015 35.21 20,625 - - 20,625 15th 03/03/2009 12/31/2013 12/31/2016 23.03 17,008,970 149,820 29,370 16,829,780 16th 08/10/2009 12/31/2010 12/31/2014 30.00 874,167 - - 874,167 17th 09/23/2009 9/23/2012 12/31/2014 31.64 29,551 - - 29,551
Total 208,675,605 141,362,634 5,265,700 62,047,271
II.I - Total Granted Options
Exercise period until
Exercise price
restated (R$1)
OptionsGranting Vesting period until
until
I t a ú U n i b a n c o S . A . – - September 0
133
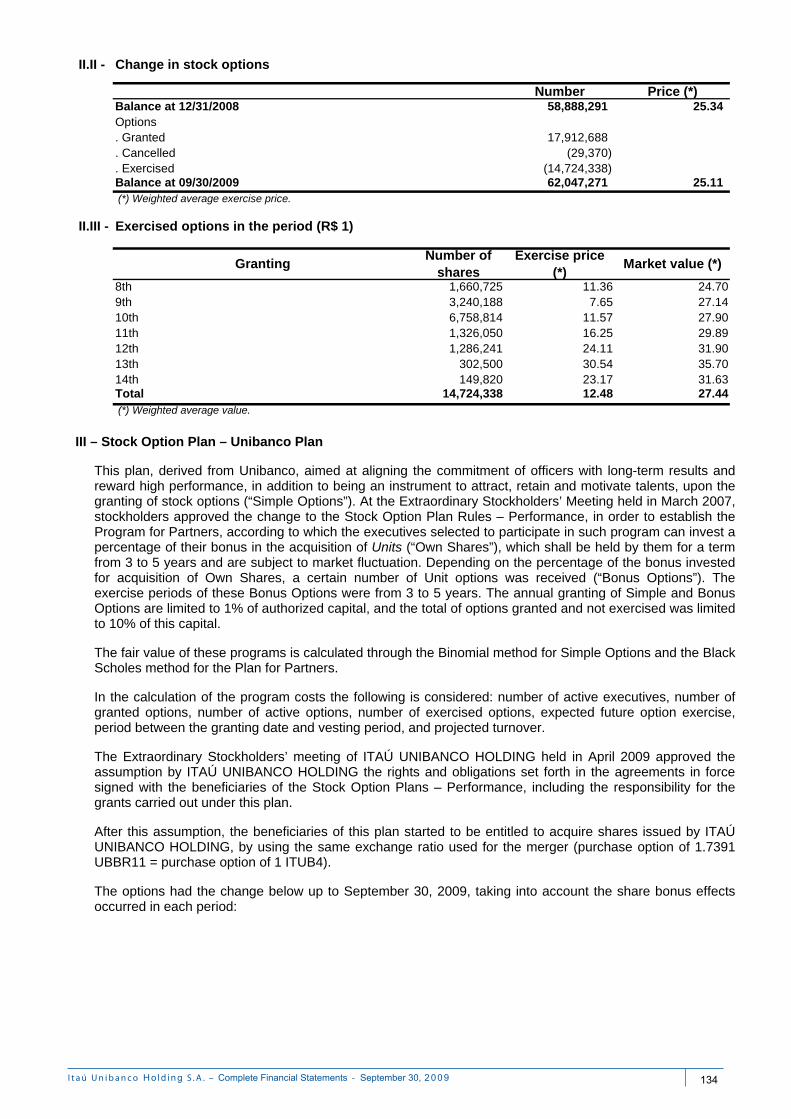
II.II -
Number Price (*)58,888,291 25.34
17,912,688 (29,370)
(14,724,338) 62,047,271 25.11
II.III -
8th 1,660,725 11.36 24.709th 3,240,188 7.65 27.1410th 6,758,814 11.57 27.9011th 1,326,050 16.25 29.8912th 1,286,241 24.11 31.9013th 302,500 30.54 35.7014th 149,820 23.17 31.63Total 14,724,338 12.48 27.44
. Cancelled
Balance at 09/30/2009 (*) Weighted average exercise price.
Balance at 12/31/2008
. Exercised
Options. Granted
Change in stock options
Exercised options in the period (R$ 1)
(*) Weighted average value.
GrantingNumber of
sharesExercise price
(*)Market value (*)
III – Stock Option Plan – Unibanco Plan
This plan, derived from Unibanco, aimed at aligning the commitment of officers with long-term results and reward high performance, in addition to being an instrument to attract, retain and motivate talents, upon the granting of stock options (“Simple Options”). At the Extraordinary Stockholders’ Meeting held in March 2007, stockholders approved the change to the Stock Option Plan Rules – Performance, in order to establish the Program for Partners, according to which the executives selected to participate in such program can invest a percentage of their bonus in the acquisition of Units (“Own Shares”), which shall be held by them for a term from 3 to 5 years and are subject to market fluctuation. Depending on the percentage of the bonus invested for acquisition of Own Shares, a certain number of Unit options was received (“Bonus Options”). The exercise periods of these Bonus Options were from 3 to 5 years. The annual granting of Simple and Bonus Options are limited to 1% of authorized capital, and the total of options granted and not exercised was limited to 10% of this capital.
The fair value of these programs is calculated through the Binomial method for Simple Options and the Black Scholes method for the Plan for Partners. In the calculation of the program costs the following is considered: number of active executives, number of granted options, number of active options, number of exercised options, expected future option exercise, period between the granting date and vesting period, and projected turnover. The Extraordinary Stockholders’ meeting of ITAÚ UNIBANCO HOLDING held in April 2009 approved the assumption by ITAÚ UNIBANCO HOLDING the rights and obligations set forth in the agreements in force signed with the beneficiaries of the Stock Option Plans – Performance, including the responsibility for the grants carried out under this plan. After this assumption, the beneficiaries of this plan started to be entitled to acquire shares issued by ITAÚ UNIBANCO HOLDING, by using the same exchange ratio used for the merger (purchase option of 1.7391 UBBR11 = purchase option of 1 ITUB4). The options had the change below up to September 30, 2009, taking into account the share bonus effects occurred in each period:
I t a ú U n i b a n c o S . A . – - September 0
134
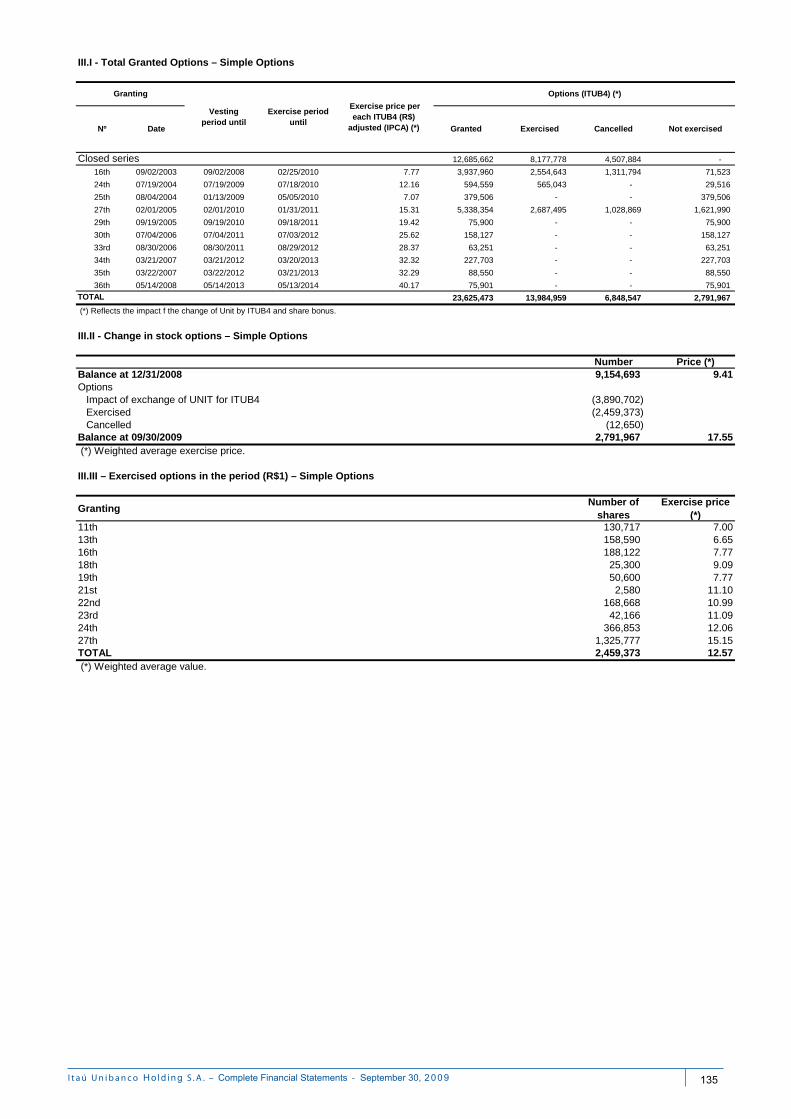
III.I - Total Granted Options – Simple Options
12,685,662 8,177,778 4,507,884 -
16th 09/02/2003 09/02/2008 02/25/2010 7.77 3,937,960 2,554,643 1,311,794 71,523
24th 07/19/2004 07/19/2009 07/18/2010 12.16 594,559 565,043 - 29,516
25th 08/04/2004 01/13/2009 05/05/2010 7.07 379,506 - - 379,506
27th 02/01/2005 02/01/2010 01/31/2011 15.31 5,338,354 2,687,495 1,028,869 1,621,990
29th 09/19/2005 09/19/2010 09/18/2011 19.42 75,900 - - 75,900
30th 07/04/2006 07/04/2011 07/03/2012 25.62 158,127 - - 158,127
33rd 08/30/2006 08/30/2011 08/29/2012 28.37 63,251 - - 63,251
34th 03/21/2007 03/21/2012 03/20/2013 32.32 227,703 - - 227,703
35th 03/22/2007 03/22/2012 03/21/2013 32.29 88,550 - - 88,550
36th 05/14/2008 05/14/2013 05/13/2014 40.17 75,901 - - 75,901
23,625,473 13,984,959 6,848,547 2,791,967
(*) Reflects the impact f the change of Unit by ITUB4 and share bonus.
III.II - Change in stock options – Simple Options
Number Price (*)Balance at 12/31/2008 9,154,693 9.41Options
Impact of exchange of UNIT for ITUB4 (3,890,702) Exercised (2,459,373) Cancelled (12,650)
Balance at 09/30/2009 2,791,967 17.55 (*) Weighted average exercise price.
III.III – Exercised options in the period (R$1) – Simple Options
GrantingNumber of
sharesExercise price
(*)11th 130,717 7.0013th 158,590 6.6516th 188,122 7.7718th 25,300 9.0919th 50,600 7.7721st 2,580 11.1022nd 168,668 10.9923rd 42,166 11.0924th 366,853 12.0627th 1,325,777 15.15TOTAL 2,459,373 12.57 (*) Weighted average value.
Cancelled Not exercisedExercisedNº Date
Exercise price per each ITUB4 (R$)
adjusted (IPCA) (*) Granted
Options (ITUB4) (*)
Closed series
TOTAL
Vesting period until
Exercise period until
Granting
I t a ú U n i b a n c o S . A . – - September 0
135
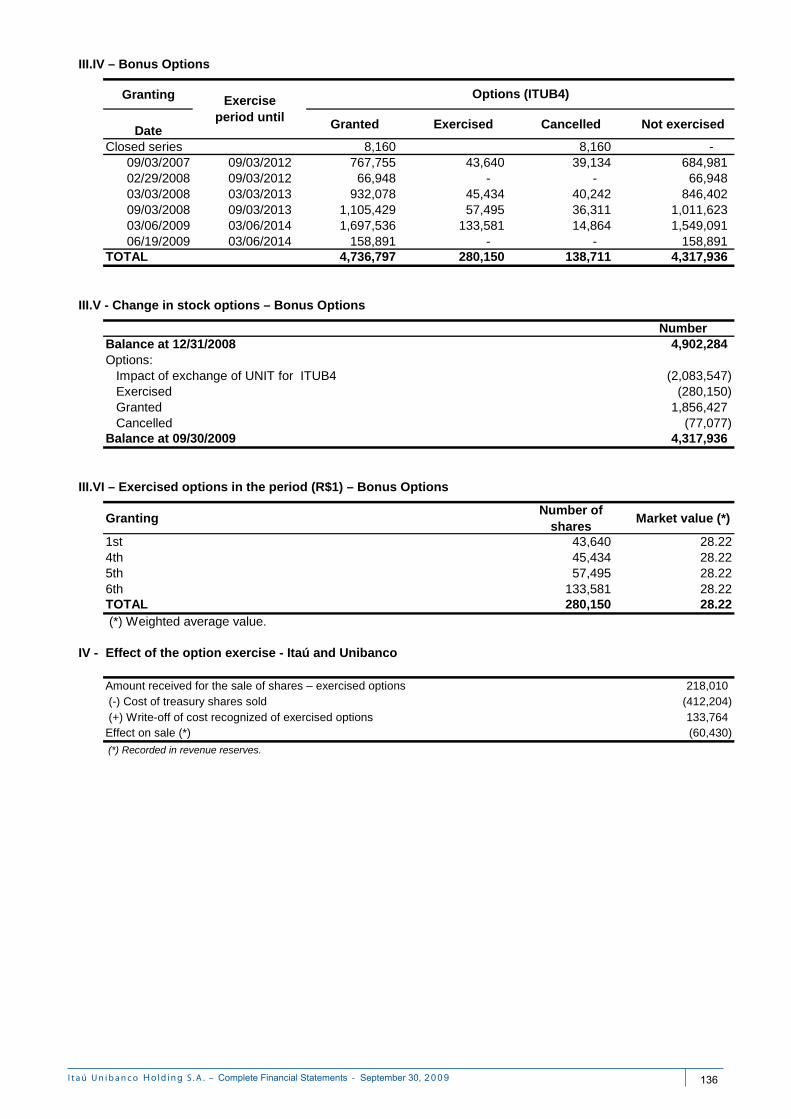
Granting
Date Granted Exercised Cancelled Not exercised
Closed series 8,160 8,160 - 09/03/2007 09/03/2012 767,755 43,640 39,134 684,981 02/29/2008 09/03/2012 66,948 - - 66,948 03/03/2008 03/03/2013 932,078 45,434 40,242 846,402 09/03/2008 09/03/2013 1,105,429 57,495 36,311 1,011,623 03/06/2009 03/06/2014 1,697,536 133,581 14,864 1,549,091 06/19/2009 03/06/2014 158,891 - - 158,891
TOTAL 4,736,797 280,150 138,711 4,317,936
NumberBalance at 12/31/2008 4,902,284 Options:
Impact of exchange of UNIT for ITUB4 (2,083,547) Exercised (280,150) Granted 1,856,427 Cancelled (77,077)
Balance at 09/30/2009 4,317,936
GrantingNumber of
sharesMarket value (*)
1st 43,640 28.224th 45,434 28.225th 57,495 28.226th 133,581 28.22TOTAL 280,150 28.22 (*) Weighted average value.
IV -
218,010 (412,204) 133,764 (60,430)
III.IV – Bonus Options
III.V - Change in stock options – Bonus Options
III.VI – Exercised options in the period (R$1) – Bonus Options
Effect of the option exercise - Itaú and Unibanco
Exercise period until
Options (ITUB4)
Amount received for the sale of shares – exercised options (-) Cost of treasury shares sold (+) Write-off of cost recognized of exercised options
(*) Recorded in revenue reserves.
Effect on sale (*)
I t a ú U n i b a n c o S . A . – - September 0
136
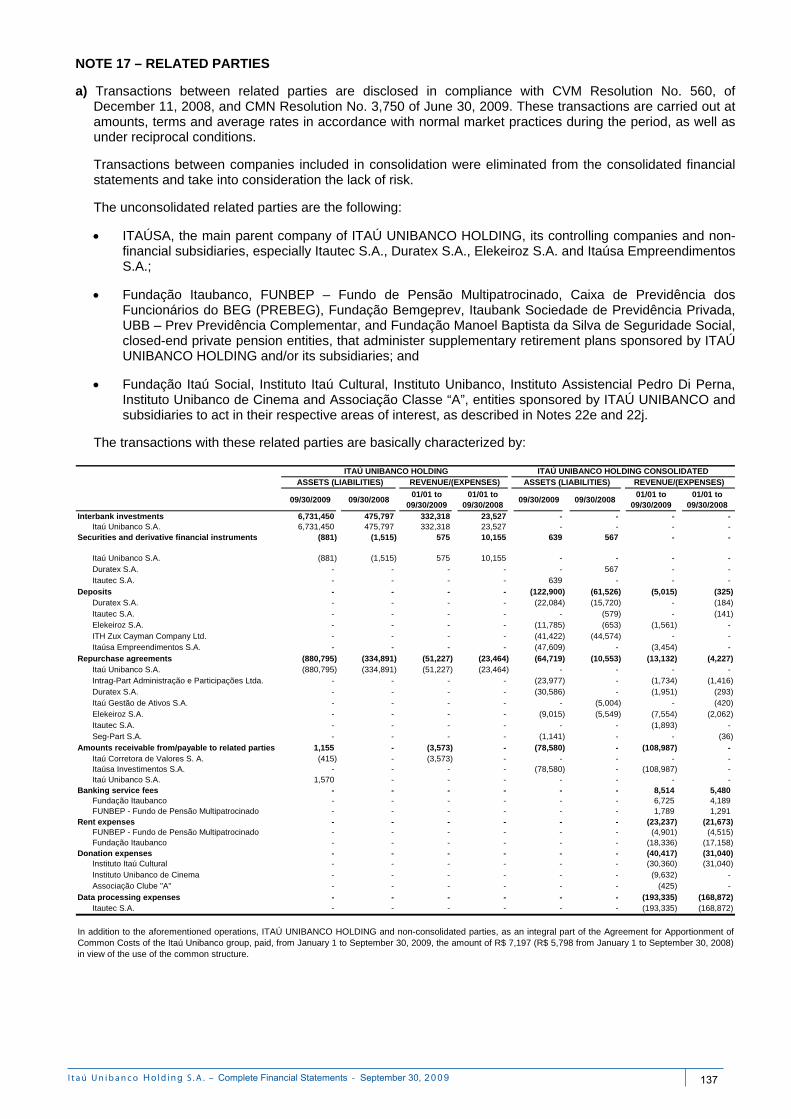
NOTE 17 – RELATED PARTIES a) Transactions between related parties are disclosed in compliance with CVM Resolution No. 560, of
December 11, 2008, and CMN Resolution No. 3,750 of June 30, 2009. These transactions are carried out at amounts, terms and average rates in accordance with normal market practices during the period, as well as under reciprocal conditions.
Transactions between companies included in consolidation were eliminated from the consolidated financial statements and take into consideration the lack of risk.
The unconsolidated related parties are the following:
ITAÚSA, the main parent company of ITAÚ UNIBANCO HOLDING, its controlling companies and non-financial subsidiaries, especially Itautec S.A., Duratex S.A., Elekeiroz S.A. and Itaúsa Empreendimentos S.A.;
Fundação Itaubanco, FUNBEP – Fundo de Pensão Multipatrocinado, Caixa de Previdência dos Funcionários do BEG (PREBEG), Fundação Bemgeprev, Itaubank Sociedade de Previdência Privada, UBB – Prev Previdência Complementar, and Fundação Manoel Baptista da Silva de Seguridade Social, closed-end private pension entities, that administer supplementary retirement plans sponsored by ITAÚ UNIBANCO HOLDING and/or its subsidiaries; and
Fundação Itaú Social, Instituto Itaú Cultural, Instituto Unibanco, Instituto Assistencial Pedro Di Perna, Instituto Unibanco de Cinema and Associação Classe “A”, entities sponsored by ITAÚ UNIBANCO and subsidiaries to act in their respective areas of interest, as described in Notes 22e and 22j.
The transactions with these related parties are basically characterized by:
09/30/2009 09/30/200801/01 to
09/30/200901/01 to
09/30/200809/30/2009 09/30/2008
01/01 to 09/30/2009
01/01 to 09/30/2008
Interbank investments 6,731,450 475,797 332,318 23,527 - - - - Itaú Unibanco S.A. 6,731,450 475,797 332,318 23,527 - - - -
Securities and derivative financial instruments (881) (1,515) 575 10,155 639 567 - -
Itaú Unibanco S.A. (881) (1,515) 575 10,155 - - - - Duratex S.A. - - - - - 567 - - Itautec S.A. - - - - 639 - - -
Deposits - - - - (122,900) (61,526) (5,015) (325) Duratex S.A. - - - - (22,084) (15,720) - (184) Itautec S.A. - - - - - (579) - (141) Elekeiroz S.A. - - - - (11,785) (653) (1,561) - ITH Zux Cayman Company Ltd. - - - - (41,422) (44,574) - - Itaúsa Empreendimentos S.A. - - - - (47,609) - (3,454) -
Repurchase agreements (880,795) (334,891) (51,227) (23,464) (64,719) (10,553) (13,132) (4,227) Itaú Unibanco S.A. (880,795) (334,891) (51,227) (23,464) - - - - Intrag-Part Administração e Participações Ltda. - - - - (23,977) - (1,734) (1,416) Duratex S.A. - - - - (30,586) - (1,951) (293) Itaú Gestão de Ativos S.A. - - - - - (5,004) - (420) Elekeiroz S.A. - - - - (9,015) (5,549) (7,554) (2,062) Itautec S.A. - - - - - - (1,893) - Seg-Part S.A. - - - - (1,141) - - (36)
Amounts receivable from/payable to related parties 1,155 - (3,573) - (78,580) - (108,987) - Itaú Corretora de Valores S. A. (415) - (3,573) - - - - - Itaúsa Investimentos S.A. - - - - (78,580) - (108,987) - Itaú Unibanco S.A. 1,570 - - - - - - -
Banking service fees - - - - - - 8,514 5,480 Fundação Itaubanco - - - - - - 6,725 4,189 FUNBEP - Fundo de Pensão Multipatrocinado - - - - - - 1,789 1,291
Rent expenses - - - - - - (23,237) (21,673) FUNBEP - Fundo de Pensão Multipatrocinado - - - - - - (4,901) (4,515) Fundação Itaubanco - - - - - - (18,336) (17,158)
Donation expenses - - - - - - (40,417) (31,040) Instituto Itaú Cultural - - - - - - (30,360) (31,040) Instituto Unibanco de Cinema - - - - - - (9,632) - Associação Clube "A" - - - - - - (425) -
Data processing expenses - - - - - - (193,335) (168,872) Itautec S.A. - - - - - - (193,335) (168,872)
In addition to the aforementioned operations, ITAÚ UNIBANCO HOLDING and non-consolidated parties, as an integral part of the Agreement for Apportionment ofCommon Costs of the Itaú Unibanco group, paid, from January 1 to September 30, 2009, the amount of R$ 7,197 (R$ 5,798 from January 1 to September 30, 2008)in view of the use of the common structure.
ITAÚ UNIBANCO HOLDING ITAÚ UNIBANCO HOLDING CONSOLIDATEDASSETS (LIABILITIES) REVENUE/(EXPENSES) ASSETS (LIABILITIES) REVENUE/(EXPENSES)
I t a ú U n i b a n c o S . A . – - September 0
137
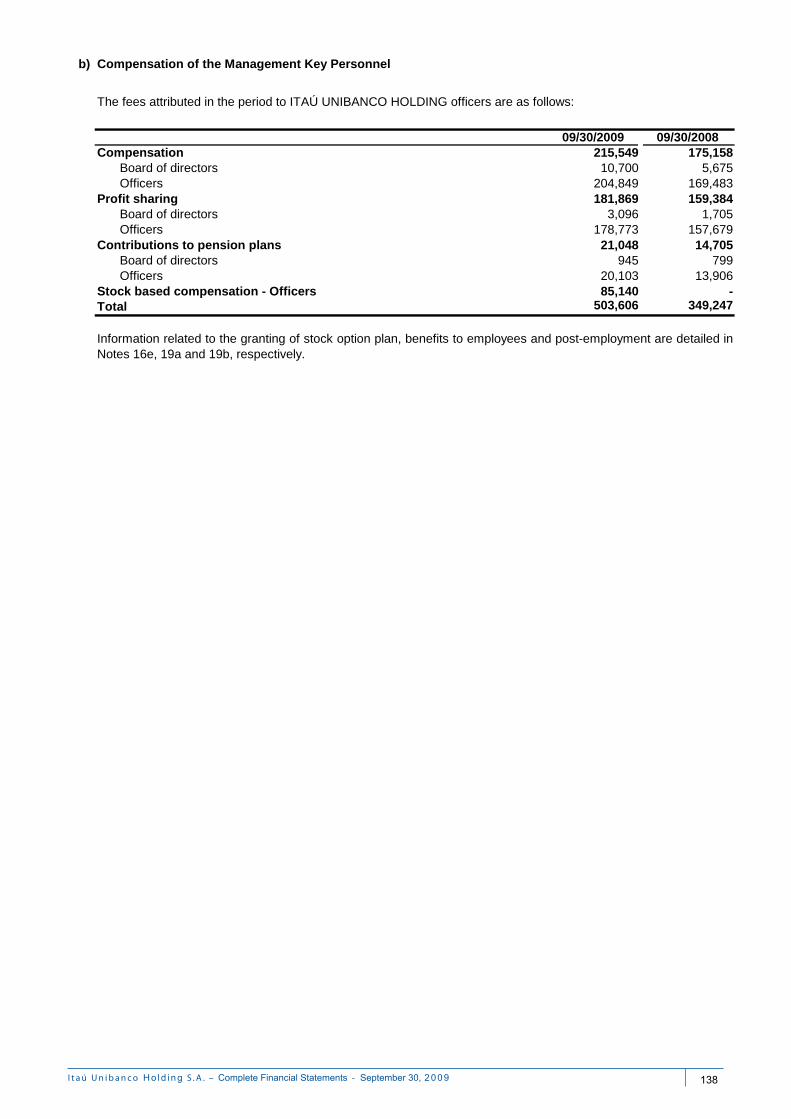
b)
09/30/2009 09/30/2008 215,549 175,158 10,700 5,675 204,849 169,483 181,869 159,384 3,096 1,705 178,773 157,679 21,048 14,705 945 799 20,103 13,906 85,140 - 503,606 349,247
Information related to the granting of stock option plan, benefits to employees and post-employment are detailed inNotes 16e, 19a and 19b, respectively.
Stock based compensation - OfficersTotal
Profit sharing
Officers
Compensation of the Management Key Personnel
CompensationBoard of directors
The fees attributed in the period to ITAÚ UNIBANCO HOLDING officers are as follows:
Officers
Board of directorsOfficers
Board of directorsContributions to pension plans
I t a ú U n i b a n c o S . A . – - September 0
138
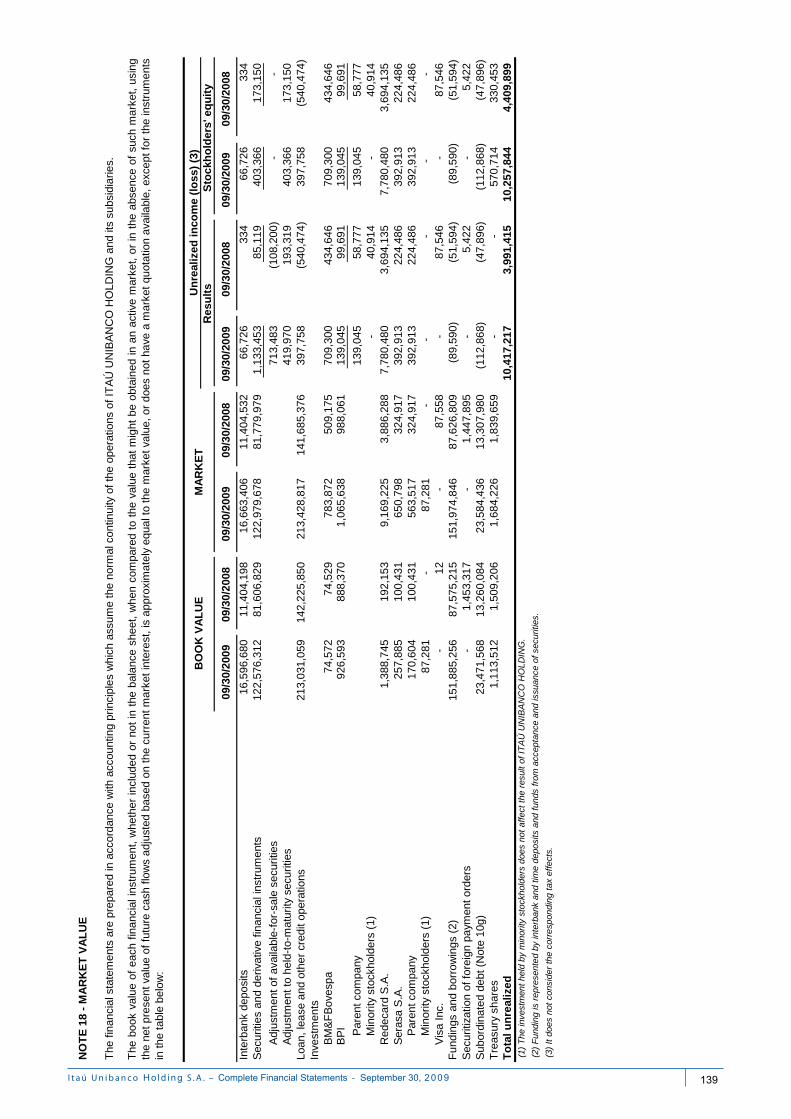
09/3
0/20
0909
/30/
2008
09/3
0/20
0909
/30/
2008
09/3
0/20
0909
/30/
2008
09/3
0/20
0909
/30/
2008
16,5
96,6
80
11
,404
,198
16,6
63,4
06
11
,404
,532
66,
726
33
4
66
,726
334
122,
576,
312
81
,606
,829
122,
979,
678
81,7
79,9
79
1
,133
,453
85,
119
403
,366
173
,150
Adj
ustm
ent o
f av
aila
ble-
for-
sale
sec
uriti
es71
3,48
3
(108
,200
)
-
-
A
djus
tmen
t to
held
-to-
mat
urity
sec
uriti
es41
9,97
0
193,
319
403,
366
173,
150
213,
031,
059
14
2,22
5,85
0
213,
428,
817
141,
685,
376
397,
758
(5
40,4
74)
397,
758
(540
,474
)
In
vest
men
tsB
M&
FB
oves
pa74
,572
74,5
29
78
3,87
2
50
9,17
5
70
9,30
0
434,
646
709,
300
434,
646
BP
I 92
6,59
3
888,
370
1,
065,
638
988,
061
13
9,04
59
9,69
113
9,04
5 9
9,69
1
Par
ent c
ompa
ny13
9,04
5
58,7
77
139,
045
58,7
77
Min
ority
sto
ckho
lder
s (1
) -
40
,914
-
40
,914
R
edec
ard
S.A
.1,
388,
745
192,
153
9,
169,
225
3,
886,
288
7,
780,
480
3,69
4,13
5
7,78
0,48
0
3,69
4,13
5
Ser
asa
S.A
.25
7,88
5
100,
431
65
0,79
8
32
4,91
7
39
2,91
3
224,
486
392,
913
224,
486
Par
ent c
ompa
n y17
0,60
4
100,
431
56
3,51
7
32
4,91
7
39
2,91
3
224,
486
392,
913
224,
486
Min
ority
sto
ckho
lder
s (1
)87
,281
-
87,2
81
-
-
-
-
-
V
isa
Inc.
-
12
-
87
,558
-
87
,546
-
87
,546
15
1,88
5,25
6
87,5
75,2
15
15
1,97
4,84
6
87
,626
,809
(89,
590)
(5
1,59
4)
(8
9,59
0)
(5
1,59
4)
-
1,
453,
317
-
1,44
7,89
5
-
5,42
2
-
5,42
2
23,4
71,5
68
13
,260
,084
23,5
84,4
36
13
,307
,980
(11
2,86
8)
(4
7,89
6)
(1
12,8
68)
(4
7,89
6)
1,
113,
512
1,50
9,20
6
1,
684,
226
1,
839,
659
-
-
57
0,71
4
33
0,45
3
10
,417
,217
3,99
1,41
5
10
,257
,844
4,
409,
899
Un
real
ized
inco
me
(lo
ss)
(3)
(3)
It
does
not
con
side
r th
e co
rres
pond
ing
tax
effe
cts.
Sto
ckh
old
ers'
eq
uit
y
Fun
ding
s an
d bo
rrow
ings
(2)
NO
TE
18
- M
AR
KE
T V
AL
UE
(2)
Fun
ding
is r
epre
sent
ed b
y in
terb
ank
and
time
depo
sits
and
fun
ds f
rom
acc
epta
nce
and
issu
ance
of
secu
ritie
s.
The
book
valu
eof
each
finan
cial
inst
rum
ent,
whe
ther
incl
uded
orno
tin
the
bala
nce
shee
t,w
hen
com
pare
dto
the
valu
eth
atm
ight
beob
tain
edin
anac
tive
mar
ket,
orin
the
abse
nce
ofsu
chm
arke
t,us
ing
the
netp
rese
ntva
lue
offu
ture
cash
flow
sad
just
edba
sed
onth
ecu
rren
tmar
ket
inte
rest
,is
appr
oxim
atel
yeq
ualt
oth
em
arke
tval
ue,
ordo
esno
thav
ea
mar
ket
quot
atio
nav
aila
ble,
exce
ptfo
rth
ein
stru
men
tsin
the
tabl
e be
low
:
The
fin
anci
al s
tate
men
ts a
re p
repa
red
in a
ccor
danc
e w
ith a
ccou
ntin
g pr
inci
ples
whi
ch a
ssum
e th
e no
rmal
con
tinui
ty o
f th
e op
erat
ions
of
ITA
Ú U
NIB
AN
CO
HO
LDIN
G a
nd it
s su
bsid
iarie
s.
BO
OK
VA
LU
EM
AR
KE
T
Sub
ordi
nate
d de
bt (
Not
e 10
g)S
ecur
itiza
tion
of f
orei
gn p
aym
ent o
rder
s
Res
ult
s
Inte
rban
k de
posi
ts
Loan
, le
ase
and
othe
r cr
edit
oper
atio
ns
(1)
The
inve
stm
ent
held
by
min
ority
sto
ckho
lder
s do
es n
ot a
ffec
t th
e re
sult
of I
TA
Ú U
NIB
AN
CO
HO
LDIN
G.
Tre
asur
y sh
ares
Sec
uriti
es a
nd d
eriv
ativ
e fin
anci
al in
stru
men
ts
To
tal u
nre
aliz
ed
I t a ú U n i b a n c o S . A . – - September 0
139
To obtain the market values for these financial instruments, the following criteria were adopted: Interbank investments were determined based on their nominal amounts, monetarily restated to maturity
dates and discounted to present value using future market interest rates and swap market rates for fixed-rate securities and using market interest rates for fixed-rate securities published in the Gazeta Mercantil newspaper on October 1, 2009 for floating-rate securities.
Securities and derivative financial instruments, according to the rules established by Circulars Nos. 3,068
and 3,082 of November 8, 2001 and January 30, 2002, respectively, issued by the Central Bank of Brazil (BACEN), are recorded at their market value, except for those classified as Held to Maturity. Government securities allocated in this category have their market value calculated based on the rates obtained in the market, and validated through the comparison with information provided by the National Association of Financial Market Institutions (ANDIMA). Private securities included in this category have their market value calculated using a criterion similar to the one adopted for Investments in Interbank Deposits, as described above.
Loans with maturity over 90 days, when available, were calculated based on their net present value of future
cash flows discounted at market interest rates effective on the balance sheet date, taking into account the effects of hedges as well (swap contracts).
Investments - in BPI, Redecard S.A., BM&F Bovespa S.A., and Visa Inc. are determined based on stock
market quotations, and in Serasa S.A. are determined based on the last transaction prices. Time and interbank deposits and funds from acceptance and issuance of securities, when available, were
calculated based on their present value determined by future cash flows discounted at futures market interest rates and swap market rates for fixed-rate securities, and for floating-rate securities, market interest rates for fixed-rate securities published in the Gazeta Mercantil newspaper on October 1, 2009. The effects of hedges (swap contracts) are also taken into account.
Securitization of foreign payment orders, based on the net present value of the future cash flows estimated
as from the interest curves of the indexation market places, net of the interest rates practiced in the market on the balance sheet date, considering the credit risk of the issuer, calculated based on the market price of other securities issued by the same.
Subordinated debt, based on the net present value of future fixed or floating cash flows in foreign currency,
net of the interest rates practiced in the market on the balance sheet date and considering the credit risk of the issuer. The floating cash flows are estimated as from the interest curves of the indexation market places.
Treasury shares are valued according to the average quotation available on the last trading day of the month
or, if this is not available, according to the most recent quotation on prior trading days, published in the daily bulletin of each Stock Exchange.
I t a ú U n i b a n c o S . A . – - September 0
140
NOTE 19 - BENEFITS TO EMPLOYEES Under the terms of CVM Resolution No. 371, dated December 13, 2000, we present the policies adopted by ITAÚ UNIBANCO HOLDING and its subsidiaries regarding benefits to employees, as well as the accounting procedures adopted:
a) Supplementary retirement benefits:
ITAÚ UNIBANCO HOLDING and its subsidiary companies sponsor the following supplementary retirement plans:
Entity Benefit Plan
Supplementary retirement plan - PAC (1)Franprev benefit plan - PBF (1)002 Benefit Plan – PB002 (1)Itaulam Basic Plan – PBI (1)Itaulam Supplementary Plan - PSI (2)
Fundação Bemgeprev Supplementary Retirement Plan – Flexible Premium Annuity (ACMV) Funbep I Benefit Plan (1)Funbep II Benefit Plan (2)
Caixa de Previdência dos Funcionários do Banco Beg - Prebeg Prebeg Benefit Plan (1)Credicard Retirement Plan (1)Credicard Supplementary Retirement Plan (2)
Itaubank Sociedade de Previdência Privada Itaubank Retirement Plan (3)Unibanco pension plan (3)Basic Plan (1) IJMS plan (1)Benefit Plan I (1)Benefit Plan II (1)
(1) Defined benefit plan. (2) Variable contribution plan. (3) Defined contribution plan.
Fundação Banorte Manoel Baptista da Silva de Seguridade Social
Fundação Itaubanco
Funbep Fundo de Pensão Multipatrocinado
Citiprevi - Entidade Fechada de Previdência Complementar (Orbitall/Credicard Itaú/Redecard)
UBB-PREV - Previdência Complementar
The basic purpose of the defined benefit and variable contribution plans is to grant a benefit that, as a life annuity benefit (in case of FUNBEP, PREBEG, PB002 and Credicard, UBB Prev and Banorte, also as survivorship annuities), will supplement the pension paid by social security. In case of the defined contribution plan, the benefit is calculated based on the contributions made and its payment is made for an established period, which does not require actuarial calculation.
All of these plans are closed to new participants. As regards the new employees hired after the closing, they have the option to participate in a defined contribution plan (PGBL) managed by Itaú Vida e Previdência S.A.
During the period, the contributions made totaled R$ 35,247 (R$ 29,006 from January 1 to September 30, 2008). The contribution rate increases based on the beneficiary’s age.
b) Post-employment benefits
ITAÚ UNIBANCO HOLDING subsidiaries do not offer other post-employment benefits, except in those cases arising from maintenance obligations according to the acquisition agreements signed by ITAÚ, under the terms and conditions established, in which health plans are totally or partially sponsored for retired workers and beneficiaries. During the period, the contributions made totaled R$ 4,323 (R$ 4,508 from January 1 to September 30, 2008). The contribution rate increases based on the beneficiary’s age.
c) Net amount of assets and actuarial liabilities of the benefit plan: The net assets and actuarial liabilities, which consider the actuarial obligations, calculated in conformity with the criteria established by CVM Resolution No. 371, dated December 13, 2000, are summarized below:
09/30/2009 09/30/2008Net assets of the plans 13,829,203 13,101,809 Actuarial liabilities (12,011,119) (9,982,207)Surplus (*) 1,818,084 3,119,602 (*) According to paragraph 49g of the attachment to CVM Resolution No. 371 of December 13, 2000, the net asset was not
In addition to the reserves recorded by the plans, the sponsors record provisions in the amount of R$121,674 (R$ 27,114 at September 30, 2008) (Note 13c) to cover possible actuarial liabilities.
I t a ú U n i b a n c o S . A . – - September 0
141
AssetsActuarial liabilities Surplus Assets
Actuarial liabilities Surplus
12,775,978 (11,223,791) 1,552,187 12,583,353 (9,440,841) 3,142,512
- (127,661) (127,661) - - -
1,157,681 (1,063,789) 93,892 1,152,288 (873,330) 278,958
(404,122) 404,122 - (331,964) 331,964 -
79,690 - 79,690 43,463 - 43,463
219,976 - 219,976 (345,331) - (345,331) 13,829,203 (12,011,119) 1,818,084 13,101,809 (9,982,207) 3,119,602
(1)
(2)
Contributions of sponsors/participants
Gains/(losses) in the period (2)
Adjustments in the period (1)
Gains/(losses) in assets correspond to the actual earnings obtained above (below) the expected return rate of assets.
d) Changes in net assets, actuarial liabilities, and surplus
01/01 to 09/30/200801/01 to 09/30/2009
Present value – beginning of the period
Present value – end of the periodEffect corresponding to the reclassification of the option of former employees.
Expected return on assets/ Cost of current service + interest
Benefits paid
e)
10.24% p.a.
12.32 % p.a.
AT-2000
Itaú Exp. 2003/2004
7.12 % p.a.
4.00 % p.a.
4.00 % p.a.Projected Unit Credit (3)
(1)
(2)
(3) Using the Projected Unit Credit, the mathematical reserve is determined by the current projected benefit amount multiplied by the ratiobetween the length of service in the company at the assessment date and the length of service that will be reached at the date whenthe benefit is granted. The cost is determined taking into account the current projected benefit amount distributed over the years thateach participant is employed.
The mortality tables adopted correspond to those disclosed by SOA – Society of Actuaries, the North-American Entity whichcorresponds to IBA – Brazilian Institute of Actuarial Science, which reflects a 10% increase in the probabilities of survival ascompared to the respective basic tables.
Actuarial methodInflation
Expected return rate on assets
Discount rate
Main assumptions used in actuarial evaluation
The turnover assumption is based on the effective experience of ITAÚ UNIBANCO HOLDING, resulting in an average of 1.2% p.a.based on 2003/2004 experience.
Growth of the pension fund and social security benefits
Future salary growth
Turnover (2)
Mortality table (1)
I t a ú U n i b a n c o S . A . – - September 0
142
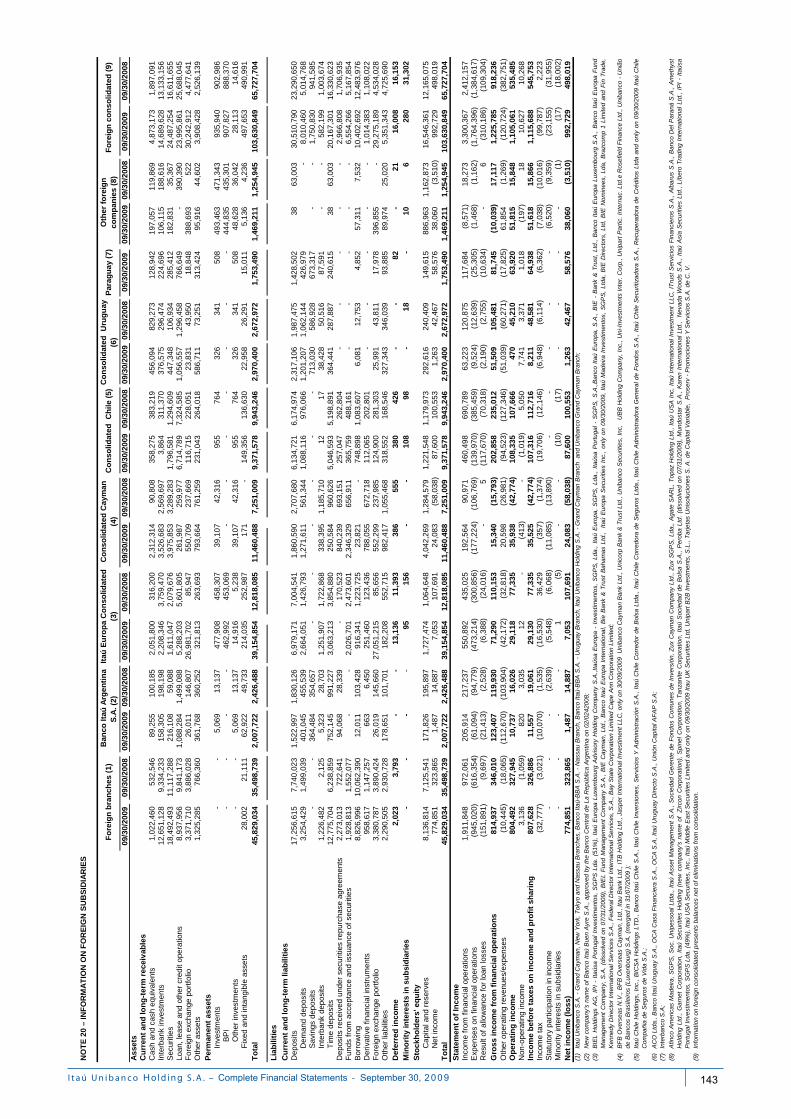
09/3
0/20
0909
/30/
2008
09/3
0/20
0909
/30/
2008
09/3
0/20
0909
/30/
2008
09/3
0/20
0909
/30/
2008
09/3
0/20
0909
/30/
2008
09/3
0/20
0909
/30/
2008
09/3
0/2
009
09/3
0/20
0909
/30/
2008
09/3
0/20
0909
/30/
2008
1,02
2,46
0
53
2,54
6
89
,255
100,
185
2,
051,
800
31
6,20
0
2,
312,
314
90
,808
358,
275
383,
219
45
6,09
4
829,
273
12
8,94
2
19
7,05
7
119,
869
4,
873,
173
1,89
7,09
1
12
,651
,128
9,
334,
233
158,
305
19
8,19
8
2,20
8,34
6
3,75
9,47
0
3,52
6,68
3
2,56
9,69
73,
864
31
1,37
0
376,
575
29
6,47
4
224,
696
106,
115
18
8,61
6
14,6
89,6
28
13,1
33,1
56
18,4
92,4
93
11,1
17,2
88
216,
108
59
,088
1,61
1,04
7
2,07
9,67
6
3,97
5,85
3
3,28
9,28
31,
796,
581
1,
294,
609
447,
348
10
6,93
4
285,
412
182,
831
35
,367
24,4
87,2
54
16,6
11,6
55
8,93
7,95
6
9,
841,
173
1,08
8,28
41,
499,
088
5,28
8,20
3
5,60
1,80
5
261,
987
259,
977
6,
714,
789
7,
324,
585
1,05
6,55
71,
296,
458
766,
649
-
390,
390
23
,995
,861
25
,688
,045
3,
371,
710
3,88
6,02
8
26
,011
146,
807
26
,981
,702
85,9
47
550,
709
237,
669
11
6,71
5
22
8,05
1
23,8
31
43
,950
18,8
48
388,
693
52
2
30
,242
,912
4,
477,
641
1,32
5,28
5
76
6,36
0
36
1,76
8
360,
252
32
1,81
3
26
3,69
3
79
3,66
4
76
1,25
9
231,
043
264,
018
58
6,71
1
73,2
51
31
3,42
4
95
,916
44,6
02
3,
908,
428
2,52
6,13
9
Inve
stm
ents
-
-
5,
069
13
,137
477,
908
458,
307
39,1
07
42,3
16
95
5
76
4
32
6
34
1
50
8
493,
463
47
1,34
3
935,
940
90
2,98
6
BP
I-
-
-
-
46
2,99
2
45
3,06
9
-
-
-
-
-
-
-
44
4,83
5
435,
301
90
7,82
7
888,
370
O
ther
inve
stm
ents
-
-
5,06
9
13,1
37
14
,916
5,
238
39
,107
42
,316
955
764
326
341
508
48
,628
36,0
42
28
,113
14,6
16
Fix
ed a
nd in
tang
ible
ass
ets
28,0
02
21,1
11
62,9
22
49
,733
214,
035
252,
987
171
-
149,
356
136,
630
22
,958
26,2
91
15
,011
5,
136
4,
236
49
7,65
3
490,
991
45
,829
,034
35
,498
,739
2,
007,
722
2,
426,
488
39
,154
,854
12
,818
,085
11
,460
,488
7,
251,
009
9,
371,
578
9,
943,
246
2,
970,
400
2,
672,
972
1,
753,
490
1,46
9,21
1
1,25
4,94
5
103,
630,
849
65
,727
,704
17,2
56,6
15
7,74
0,02
3
1,
522,
997
1,83
0,12
66,
979,
171
7,
004,
541
1,
860,
590
2,
707,
680
6,13
4,72
1
6,17
4,97
42,
317,
106
1,98
7,47
51,
428,
502
38
63,0
03
30
,510
,790
23
,290
,650
D
eman
d de
posi
ts3,
254,
429
1,49
9,03
9
40
1,04
5
455,
539
2,
664,
051
1,
426,
793
1,
271,
611
56
1,34
4
1,08
8,11
6
976,
066
1,
201,
207
1,06
2,14
442
6,97
9
-
8,
010,
460
5,01
4,76
8
S
avin
gs d
epos
its-
-
36
4,48
4
354,
657
-
-
-
-
-
-
713,
030
58
6,92
8
673,
317
-
-
1,75
0,83
0
94
1,58
5
Inte
rban
k de
posi
ts1,
226,
482
2,12
5
5,
323
28
,703
1,25
1,90
7
1,72
2,86
8
338,
395
1,18
5,71
012
17
38,4
28
50
,516
87,5
91
-
-
582,
199
1,
003,
674
Tim
e de
posi
ts12
,775
,704
6,
238,
859
752,
145
99
1,22
7
3,06
3,21
3
3,85
4,88
0
250,
584
960,
626
5,
046,
593
5,
198,
891
364,
441
28
7,88
7
240,
615
38
63
,003
20,1
67,3
01
16,3
30,6
23
2,27
3,01
3
72
2,64
1
94
,068
28,3
39
-
170,
523
840,
239
693,
151
25
7,04
7
26
2,80
4
-
-
-
-
-
2,
966,
808
1,70
6,93
5
1,
928,
813
1,55
2,07
7
-
-
2,
026,
701
2,
473,
601
2,
346,
329
65
6,91
1
365,
759
488,
161
-
-
-
-
-
6,55
4,26
6
5,
1 67,
854
8,82
6,99
6
10
,062
,390
12
,011
103,
428
91
6,34
1
1,
223,
725
23
,821
-
74
8,89
8
1,
083,
607
6,08
1
12,7
53
4,
852
57,3
11
7,
532
10
,402
,692
12
,483
,976
95
8,61
7
1,14
7,25
7
66
3
6,
450
25
1,46
0
12
3,43
6
78
8,05
5
67
2,71
8
112,
065
202,
801
-
-
-
-
-
1,01
4,38
3
1,
108,
022
3,38
0,78
7
3,
890,
424
26,0
19
14
5,66
0
27,0
51,2
1585
,656
55
2,29
9
23
7,98
5
124,
900
281,
303
25
,991
43,8
11
17
,978
39
6,85
5
-
29,2
75,1
89
4,53
4,02
8
2,
290,
505
2,93
0,72
8
17
8,65
1
101,
701
18
2,20
8
55
2,71
5
98
2,41
7
1,
055,
468
318,
552
168,
546
32
7,34
3
346,
039
93
,885
89
,974
25,0
20
5,
351,
343
4,72
5,69
0
2,
023
3,79
3
-
-
13
,136
11
,393
38
6
555
380
426
-
-
82
-
21
16,0
08
16
,153
-
-
-
-
95
156
-
-
10
8
98
-
18
-
10
6
28
0
31
,302
Cap
ital a
nd r
eser
ves
8,13
6,81
4
7,
125,
541
171,
826
19
5,89
7
1,72
7,47
4
1,06
4,64
8
4,04
2,26
9
1,28
4,57
91,
221,
548
1,
179,
973
292,
616
24
0,40
9
149,
615
886,
963
1,
162,
873
16,5
46,3
61
12,1
65,0
75
Net
inco
me
774,
851
32
3,86
5
1,
487
14
,887
7,05
3
107,
691
24,0
83
(58,
038)
87,6
00
10
0,55
3
1,26
3
42,4
67
58
,576
38
,060
(3,5
10)
992,
729
49
8,01
9
45,8
29,0
34
35,4
98,7
39
2,00
7,72
2
2,42
6,48
8
39,1
54,8
54
12,8
18,0
85
11,4
60,4
88
7,25
1,00
9
9,37
1,57
8
9,94
3,24
6
2,97
0,40
0
2,67
2,97
2
1,75
3,49
0
1,
469,
211
1,
254,
945
10
3,63
0,84
9
65,7
27,7
04
Inco
me
from
fin
anci
al o
pera
tions
1,91
1,84
8
97
2,06
1
20
5,91
4
217,
237
55
0,89
2
43
5,02
5
19
2,56
4
90
,971
460,
498
690,
789
63
,223
120,
875
11
7,68
4
(8
,571
)
18
,273
3,30
0,36
7
2,
412,
157
Exp
ense
s on
fin
anci
al o
pera
tions
(945
,020
)
(6
16,3
54)
(61,
094)
(9
4,77
9)
(473
,214
)
(300
,856
)
(177
,224
)
(106
,769
)
(139
,970
)
(385
,459
)
(9,5
24)
(12,
639)
(2
5,30
5)
(1,4
68)
(1,1
62)
(1,7
64,3
96)
(1
,384
,617
)
Res
ult o
f al
low
ance
for
loan
loss
es
(151
,891
)
(9
,697
)
(21,
413)
(2
,528
)
(6
,388
)
(24,
016)
-
5
(1
17,6
70)
(7
0,31
8)
(2,1
90)
(2,7
55)
(10,
634)
-
6
(3
10,1
86)
(109
,304
)
G
ross
inco
me
fro
m f
inan
cial
op
erat
ion
s81
4,93
7
346,
010
12
3,40
7
11
9,93
0
71
,290
11
0,15
3
15,3
40
(15,
793)
202,
858
235,
012
51,5
09
105,
481
81,7
45
(1
0,03
9)
17
,117
1,
225,
785
918,
236
O
ther
ope
ratin
g re
venu
es/e
xpen
ses
(10,
445)
(1
8,06
5)
(112
,670
)
(103
,904
)
(42,
172)
(3
2,81
8)
20,5
98
(26,
981)
(94,
523)
(127
,346
)
(51,
039)
(60,
271)
(17,
825)
61
,854
(1
,269
)
(120
,724
)
(382
,751
)
O
per
atin
g in
com
e80
4,49
2
327,
945
10,7
37
16
,026
29,1
18
77,3
35
35,9
38
(42,
774)
10
8,33
5
10
7,66
6
470
45,2
10
63
,920
51
,815
15,8
48
1,
105,
061
535,
485
N
on-o
pera
ting
inco
me
3,13
6
(1
,059
)
820
3,03
5
12
-
(4
13)
-
(1,0
19)
5,05
0
7,74
1
3,37
1
1,01
8
(1
97)
18
10,6
27
10
,268
In
com
e b
efo
re t
axes
on
inco
me
and
pro
fit
shar
ing
807,
628
32
6,88
6
11
,557
19,0
61
29
,130
77
,335
35
,525
(4
2,77
4)
107,
316
112,
716
8,
211
48
,581
64,9
38
51,6
18
15
,866
1,11
5,68
8
54
5,75
3
Inco
me
tax
(32,
777)
(3
,021
)
(10,
070)
(1
,535
)
(1
6,53
0)
36
,429
(3
57)
(1,3
74)
(19,
706)
(12,
146)
(6
,948
)
(6
,114
)
(6
,362
)
(7,0
38)
(10,
016)
(9
9,78
7)
2,22
3
S
tatu
tory
par
ticip
atio
n in
inco
me
-
-
-
(2,6
39)
(5,5
48)
(6
,068
)
(11,
085)
(13,
890)
-
-
-
-
-
(6,5
20)
(9,3
59)
(23,
155)
(3
1,95
5)
Min
ority
inte
rest
s in
sub
sidi
arie
s-
-
-
-
1
(5)
-
-
(10)
(17)
-
-
-
-
(1
)
(1
7)
(18,
002)
77
4,85
1
323,
865
1,
487
14
,887
7,
053
107,
691
24
,083
(5
8,03
8)
87
,600
10
0,55
3
1,
263
42
,467
58
,576
38,0
60
(3,5
10)
99
2,72
9
498,
019
(1
)
(2)
(3)
(4)
(5)
(6)
(7)
(8)
(9)
Loan
, lea
se a
nd o
ther
cre
dit o
pera
tions
For
eign
exc
hang
e po
rtfo
lio
Dep
osits
rec
eive
d un
der
secu
ritie
s re
purc
hase
agr
eem
ents
Dep
osits
Oth
er a
sset
s
To
tal
Per
man
ent
asse
ts
BF
BO
vers
eas
N.V
.,B
FB
Ove
rsea
sC
aym
an,
Ltd
.,It
auB
ank
Ltd
.,IT
BH
oldi
ngLt
d.,
Jasp
erIn
tern
atio
nalI
nves
timen
tLL
C,
onl
yon
30/0
9/20
09
Uni
ban
coC
aym
an
Ban
kLt
d.,
Uni
corp
Ban
k&
Tru
stL
td.,
Un
iban
coS
ecur
itie
s,In
c,U
BB
Hol
ding
Com
pan
y,In
c.,
Uni
-Inv
estm
ents
Inte
r.C
orp.
,U
nip
art
Par
tic.
Inte
rnac
.L
td.e
Ro
sefie
ldF
ina
nce
Ltd
.,U
niba
nco
-U
niã
ode
Ba
ncos
Bra
sile
iros
(Lux
enb
ourg
) S
.A.
(me
rged
in 3
1/0
7/2
009
);
Oth
er li
abili
ties
Lia
bili
ties
Cu
rren
t a
nd
lo
ng
-te
rm l
iab
ilit
ies
Net
inco
me
(lo
ss)
For
eign
exc
hang
e po
rtfo
lioD
eriv
ativ
e fin
anci
al in
stru
men
tsB
orro
win
gF
unds
fro
m a
ccep
tanc
e an
d is
suan
ce o
f se
curit
ies
Sta
tem
ent
of
Inco
me
Ita
ú U
nib
anco
S.A
. -
Gra
nd
Ca
yman
, N
ew Y
ork
, T
okyo
and
Na
ssa
u B
ranc
hes
, B
anco
Ita
ú-B
BA
S.A
. -
Na
ssa
u B
ran
ch,
Ban
co I
taú-
BB
A S
.A.
- U
rug
uay
Bra
nch
, It
aú U
nib
anco
Hol
ding
S.A
. -
Gra
nd
Ca
yman
Bra
nch
an
d U
niba
nco
Gra
nd C
aym
an B
ranc
h;
New
com
pan
y's
nam
e of
Ba
nco
Itaú
Bue
n A
yre
S.A
., a
ppro
ved
by t
he
Ban
co C
ent
ral d
e L
a R
epú
blic
a A
rge
ntin
a o
n 0
2/0
242
008
;B
IEL
Ho
ldin
gsA
G,
IPI
-It
aús
aP
ort
uga
lIn
vest
imen
tos,
SG
PS
Lda
.(5
1%),
Itaú
Eur
opa
Lux
embo
urg
Adv
isor
yH
oldi
ngC
om
pany
S.A
.,It
aúsa
Eur
opa
-In
vest
ime
nto
s,S
GP
S,
Lda.
,It
aú
Eur
opa
,S
GP
S,
Lda
.,It
aúsa
Por
tuga
l-
SG
PS
,S
.A.,
Ban
coIt
aúE
urop
a,
S.A
.,B
IE-
Ban
k&
Tru
st,
Ltd
.,B
anc
oIt
aú
Eur
opa
Luxe
mbo
urg
S.A
.,B
anco
Itaú
Eur
opa
Fun
dM
ana
gem
ent
Com
pan
y,S
.A.
(dis
solv
ed
on07
/31
/20
09),
BIE
LF
und
Man
age
men
tC
om
pany
S.A
.,B
IEC
aym
an,
Ltd
.,B
anc
oIt
aúE
urop
aIn
tern
atio
nal,
Bie
Ba
nk&
Tru
stB
aha
mas
Ltd.
,It
aúE
uro
paS
ecur
itie
sIn
c.,
only
on0
9/30
/20
09,
Ita
úM
adei
raIn
vest
imen
tos,
SG
PS
,L
tda
,B
IED
irec
tors
,Lt
d,
BIE
No
min
ees,
Lda
,B
razc
omp
1L
imite
dan
dF
inT
rad
e,K
enn
edy
Dire
cto
r In
tern
atio
nal S
ervi
ces
S.A
., F
ede
ral D
irect
or I
nte
rna
tiona
l Se
rvic
es,
S.A
., B
ay S
tate
Co
rpor
atio
n L
imite
d C
ape
Ann
Cor
por
atio
n L
imite
d;
Def
erre
d in
com
eM
ino
rity
inte
rest
s in
su
bsi
dia
ries
Sto
ckh
old
ers'
eq
uit
y
To
tal
Par
agu
ay (
7)
NO
TE
20
– IN
FO
RM
AT
ION
ON
FO
RE
IGN
SU
BS
IDIA
RIE
S
Fo
reig
n b
ran
ches
(1)
Ban
co It
aú A
rgen
tin
a S
.A. (
2)
Itaú
Eu
rop
a C
on
solid
ated
(3
)
Sec
uriti
es
Fo
reig
n c
on
solid
ated
(9)
Co
nso
lidat
ed C
hile
(5)
Co
nso
lidat
ed U
rug
uay
(6
)
Ass
ets
Cu
rren
t an
d lo
ng
-ter
m r
ecei
vab
les
Cas
h an
d ca
sh e
quiv
alen
tsIn
terb
ank
inve
stm
ents
Co
nso
lidat
ed C
aym
an
(4)
Oth
er f
ore
ign
co
mp
anie
s (8
)
Info
rmat
ion
on
fore
ign
cons
olid
ate
d p
rese
nts
ba
lanc
es n
et o
f e
limin
atio
ns f
rom
co
nsol
idat
ion
.
Ita
úC
hile
Ho
ldin
gs,
Inc.
,B
ICS
AH
oldi
ngs
LTD
.,B
anco
Ita
úC
hile
S.A
.,It
aúC
hile
Inve
rsio
nes,
Se
rvic
ios
YA
dmin
istr
ació
nS
.A.,
Ita
úC
hile
Co
rre
dor
deB
ols
aL
tda
.,It
aúC
hile
Cor
redo
rade
Se
guro
sL
tda
.,It
aúC
hile
Adm
inis
tra
dora
Ge
nera
ld
eF
ondo
sS
.A.,
Itaú
Chi
leS
ecu
ritiz
ado
raS
.A.,
Re
cupe
rado
rad
eC
rédi
tos
Ltda
and
onl
yon
09/
30/
200
9It
aú
Ch
ileC
ompa
ñia
de
Seg
uro
s de
Vid
a S
.A.;
AC
O L
tda.
, B
anco
Ita
ú U
rugu
ay
S.A
., O
CA
Cas
a F
inan
cier
a S
.A.,
OC
A S
.A,
Itaú
Uru
gua
y D
irect
o S
.A.,
Uni
ón C
api
tal A
FA
P S
.A;
Afin
coA
mer
ica
sM
adei
ra,
SG
PS
,S
oc.
Uni
pess
oal
Ltd
a.,
Itaú
Ass
etM
ana
gem
ent
S.A
.,S
oci
eda
dG
ere
nte
deF
ondo
sC
om
une
sde
Inve
rsió
n,Z
ux
Ca
yman
Com
pan
yL
td.,
Zux
SG
PS
,Ld
a,,
Aga
teS
AR
L,T
opa
zH
oldi
ngLt
d.,
Itaú
US
AIn
c,It
aúIn
tern
atio
nal
Inve
stm
ent
LLC
,IT
rust
Ser
vici
osF
inan
cier
osS
.A.,
Alb
aru
sS
.A.,
Ban
coD
elP
ara
náS
.A.,
Am
eth
yst
Hol
ding
Ltd
.,G
arn
etC
orpo
ratio
n,It
aúS
ecur
itie
sH
oldi
ng(n
ew
com
pany
'sna
me
ofZ
ircon
Cor
pora
tion)
,S
pine
lC
orpo
ratio
n,T
anza
nite
Cor
pora
tion,
Itaú
Soc
ieda
dde
Bo
lsa
S.A
.,P
erob
aLt
d.
(dis
solv
ed
on07
/31
/20
09),
Mun
dost
ar
S.A
.,K
aren
Inte
rnat
ion
alLt
d.,
Nev
ada
Woo
dsS
.A.,
Itaú
Asi
aS
ecur
ities
Ltd.
,L
íbe
roT
rad
ing
Inte
rna
tiona
lL
td.,
IPI
-It
aús
aP
ort
ugal
Inv
est
imen
tos,
SG
PS
Lda
. (4
9%),
Ita
ú U
SA
Sec
uriti
es,
In
c.,
Itaú
Mid
dle
Eas
t S
ecu
ritie
s L
imite
d an
d o
nly
on
09/
30/
200
9 I
tau
UK
Sec
uriti
es
Ltd
, U
nip
art
B2
B I
nves
tmen
ts,
S.L
., T
arje
tas
Uni
solu
cion
es S
. A
. de
Cap
ital V
aria
ble
, P
rose
rv -
Pro
moc
ione
s Y
Ser
vici
os S
.A.
de
C.
V.
Inte
rban
co S
.A;
I t a ú U n i b a n c o S . A . – - September 0
143
NOTE 21 – RISK MANAGEMENT
Risk management is considered an essential tool for optimizing the use of capital and selecting the best business opportunities, in order to obtain the best risk and return ratio for its stockholders, being performed by ITAÚ UNIBANCO HOLDING through its Management Committees. The risk appetite management is centralized in one of these committees, being responsible for releasing general policies and the consolidated risk assessment, whereas the operational management is carried out by committees specific to each type of risk that establish parameters to be followed by the business areas, which in turn are monitored independently by the control area.
This process is continuous, permanently reviewed and supports the Group’s strategies.
Further details on the risk control process can be found on the website (www.itau-unibanco.com/ir), in the following route Corporate Governance/Risk Management. I – Market Risk
This is the risk associated with the probability that a variation in the value of assets and liabilities, caused by uncertainties about changes in prices and market rates, incurs losses for the company.
The risk control process starts with the setting of limits, approved by the Financial Risk Management Committee, responsible for the market risk management, based on the risk appetite and financial capacity of each main unit. The market risk is controlled by the centralized risk control area, which carries out daily measurement, assessment and report activities by way of control units set in the Legal Entities.
Additionally, it carries out the consolidated monitoring, assessment and report of market risk information, aiming at providing input for the Management Committee’s follow-up and compliance with the Brazilian regulatory body.
The market risk control and management process is submitted to periodic reviews aimed at keeping it aligned with the best market practices and adhering to the continuous improvement processes at ITAÚ UNIBANCO HOLDING.
Value at Risk (VaR)
The risk assessment process quantifies the exposure to and the appetite for risk using the risk limits based on statistical criteria (VaR Statistical: level of confidence at 99% - is a statistical measure that estimates the expected potential maximum economic loss under regular market conditions, taking into consideration the time period and confidence level), Stress simulations (Var Stress – is a measure that estimates the loss under extreme market conditions based on stress scenarios) and allocated economic capital.
The transactions of commercial bank activities and strategic positions are managed using assessments of economic risk and simulations of accounting exposures Directional trading operations (operations aimed at finding the best market options, in order to take advantage of imperfections in the definition of prices and rates, in relation to the company's expectations), performed by proprietary desks, are mainly controlled by VaR Stress measures and loss prevention limits.
The limits and exposure to market risks are relatively low as compared to the company’s stockholders’ equity, according to the diversified management of risks. In September 2009 the Total VaR Global of ITAÚ UNIBANCO HOLDING was R$ 158 million (R$ 193 million in June 2009).
Susceptibility of portfolio in relation to market risk factors
In compliance with CVM Instruction No. 475 of December 17, 2008, Itaú Unibanco Holding carried out a sensitivity analysis by market risk factors considered relevant to which the group was exposed at September 30, 2009 (Note 7j). Each market risk factor was subject to a sensitivity level, with shock applications in approximately 25% (scenario I) and approximately 50% (scenario II), and the biggest losses arising, by risk factor, in each scenario, were stated in result, net of tax effects, by providing a vision of the ITAÚ UNIBANCO HOLDING exposure in derivatives under exceptional scenarios.
In accordance with the operations classification criteria set forth in BACEN Resolution No. 3,464/07 and Circular No. 3,354/07 and in the New Capital Accord – Basel II, the analysis was fully applied to the trading and banking portfolios, which exposures will have significant impacts on the company’s current result.
I t a ú U n i b a n c o S . A . – - September 0
144
The outcome of the sensitivity analysis, with correlation effects among the risk factors in the trading portfolio and net of tax effects, points out to a mark-to-market sensitivity of R$ 486 million and R$ 1.046 million for those scenarios with variations of 25% and 50%, respectively. In the consolidated portfolio (trading + banking), sensitivity is R$ 1.238 million and R$ 2.497 million for those scenarios with variations of 25% and 50%, respectively.
The sensitivity analyses shown above do not predict the dynamics of the operation of the risk and treasury areas, because once loss related to positions is found, risk mitigating measures are quickly taken, minimizing the possibility of significant losses.
The method, parameters and assumptions are in the Management Discussion and Analysis Report (www.itau-unibanco.com/ir).
ITAÚ UNIBANCO HOLDING’s Market Risk Management Policy, based on BACEN’s guidelines and the Basel Committee’s concepts, is a set of principles that drive its strategy towards control and management of market risk of all Business Units and Legal Entities of the Group. It is in the website (www.itau-unibanco.com/ir) in the route: Corporate Governance/Regulations and Policies/Market Risk Management Policy.
II – Credit Risk
This is the risk of a debtor or borrower failing to fulfill the financial obligations of any agreement with the organization, or alternatively, failing to fulfill any agreed-upon provisions.
ITAÚ UNIBANCO HOLDING’s management is performed with the objective of maximizing the risk and return ratio of its assets, maintaining the credit portfolio quality at levels appropriate to the market segments in which it is operating. The strategy is aimed at creating value to its stockholders at levels higher than the minimum return value adjusted to risk.
ITAÚ UNIBANCO HOLDING establishes its credit policy based on internal factors, such as the client rating criteria and the portfolio development analysis, the registered default levels, the incurred return rates, the portfolio quality and the allocated economic capital; and external factors, related to the economic environment in Brazil and abroad, including market share, interest rates, market default indicators, inflation, consumption increase/decrease.
ITAÚ UNIBANCO HOLDING’s centralized process for making decisions and establishing a credit policy guarantees the synchrony of credit actions and optimization of business opportunities. In retail, decisions are made based on scoring models that are continuously followed up by evaluating the result of their application in groups to which credits were granted. In wholesale, the several committees are subordinated to the Management Committee, responsible for the credit risk management through a structure of approval levels that ensures the detailed observation of transaction risk, as well as the necessary timing and flexibility of its approval.
To protect the institution against losses arising from loan operations, ITAÚ UNIBANCO HOLDING determines a provision level commensurate with the risk incurred in each operation through analyses that consider the aspects which determine the client’s credit risk. For each operation, the assessment and rating of the client/economic group, the operation rating, and status of the operation default are taken into account.
Additionally, ITAÚ UNIBANCO HOLDING recognizes a provision to cover possible additional losses that may arise due to any reversal of the economic cycle. This provision is usually recognized based on the company’s historic default cycle. In view of the worsened economic scenario in the 4th quarter of 2008, the default cycle used for calculating the additional provision was widened to include the expected effects of the new scenario.
The set of exposures, probabilities of default and the expected recovery of transactions are included in a capital model that calculates for extreme situations the Group’s capital requirement at a safety level of 99.99%.
III – Operational Risk
It is defined as the possibility of occurring losses resulting from flaw, deficiency or inadequacy of internal processes, people and systems, or external events.
I t a ú U n i b a n c o S . A . – - September 0
145
The increasing sophistication of banking business environment and the development of technology make the risk profiles of organizations more complex, clearly outlining this operational risk class, which management is not a new practice, but requires now a specific structure, different from those traditionally adopted for credit and market risks. In line with the principles of CMN Resolution No. 3,380, of June 29, 2006, ITAÚ UNIBANCO HOLDING formulated a policy on operational risk management, approved by its Audit Committee and ratified by its Board of Directors, to be followed by its local and foreign subsidiaries. The policy comprises a set of principles, procedures and tools to enable the company to make permanent adjustments to management in view of the nature and complexity of products, services, activities, processes and systems. The structure formalized in this policy establishes procedures for the identification, assessment, monitoring, control, mitigation and communications related to operational risks, and the roles and responsibilities of the bodies that participate in this structure. The Central Bank of Brazil's legislation compelling financial institutions to allocate capital for operating capital for operating risk came into effect as from July 1, 2008. ITAÚ UNIBANCO HOLDING opted for the use of the Alternative Standardized Approach. In addition to this structure, ITAÚ UNIBANCO HOLDING uses the managerial model of economic assessment by business line with the quantification of operational risks incurred through statistical models that enables the recognition of a provision for expected losses and capital allocation for unexpected losses (VaR at a confidence level of 99.9%). The description of the structure for the operational risk management is available on the website (www.itau-unibanco.com/ir), in the route: Corporate Governance/Regulations and Policies/Operating Risk Management Policy.
IV – Liquidity Risk
It is the risk of the company not having sufficient liquidity to meet its financial obligations, as a result of the mismatching of terms or volumes between scheduled receipts and payments. For managing cash liquidity in local and foreign currency, the company makes assumptions about future disbursements and receipts, based on statistical and economic and financial models, daily monitored by the control and liquidity management areas. As part of the daily controls, limits for minimum cash and liabilities concentration are established to anticipate actions to ensure comfortable and profitable cash levels.
V – Subscription Risk
It is the risk of variation in actuarial assumptions used in insurance, pension plan and capitalization products, which may cause changes in the reserves required for such products. Analogous to Basel II, the International Association of Insurance Supervisors (IAIS) instructs that insurance companies should have a risk management system to supplement the system of minimum capital and solvency margin. ITAÚ UNIBANCO HOLDING has been using models for managing its insurance operations since 2006 and anticipated the capital allocation legislation, SUSEP Resolution No. 178, which privileges institutions to adopt the internal modes of risk management. The comprehensiveness of internal models goes beyond the lines set forth by the regulatory body, and practically includes the whole universe of insurance-related products.
I t a ú U n i b a n c o S . A . – - September 0
146
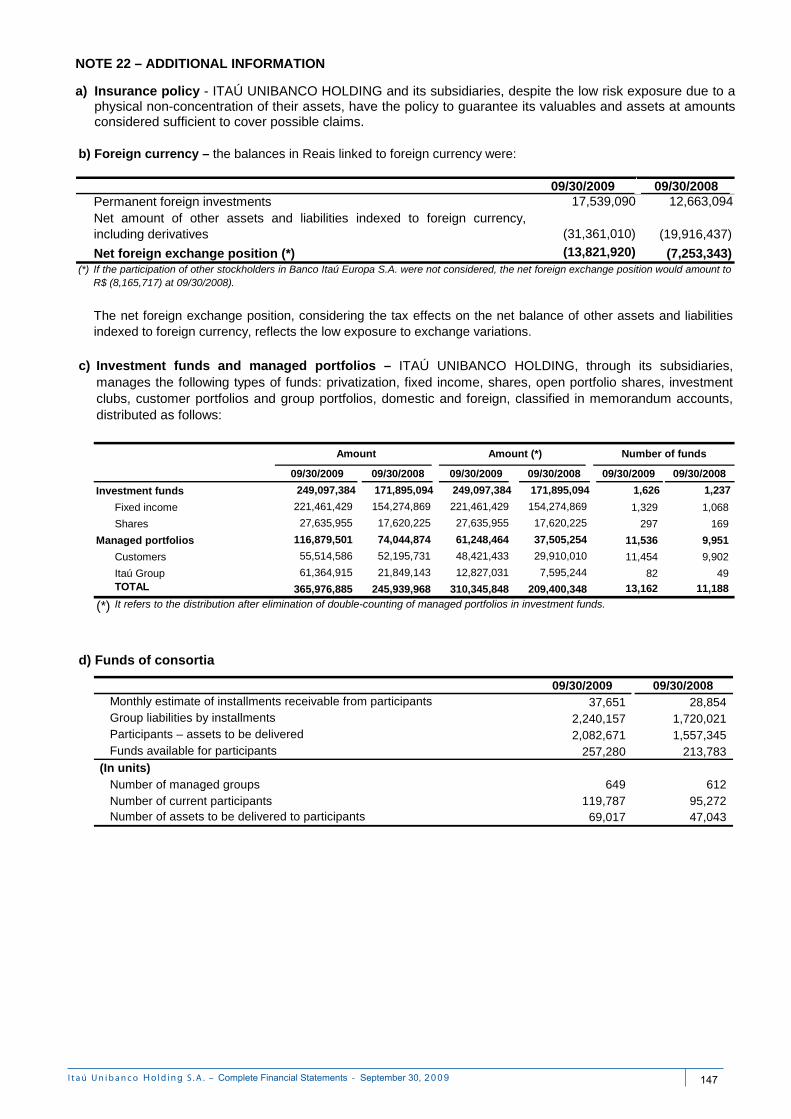
NOTE 22 – ADDITIONAL INFORMATION a) Insurance policy - ITAÚ UNIBANCO HOLDING and its subsidiaries, despite the low risk exposure due to a
physical non-concentration of their assets, have the policy to guarantee its valuables and assets at amounts considered sufficient to cover possible claims.
09/30/2009 09/30/2008 17,539,090 12,663,094
(31,361,010) (19,916,437) (13,821,920) (7,253,343)
(*)
b) Foreign currency – the balances in Reais linked to foreign currency were:
The net foreign exchange position, considering the tax effects on the net balance of other assets and liabilitiesindexed to foreign currency, reflects the low exposure to exchange variations.
Permanent foreign investmentsNet amount of other assets and liabilities indexed to foreign currency,including derivatives
Net foreign exchange position (*)If the participation of other stockholders in Banco Itaú Europa S.A. were not considered, the net foreign exchange position would amount toR$ (8,165,717) at 09/30/2008).
c)
09/30/2009 09/30/2008 09/30/2009 09/30/2008 09/30/2009 09/30/2008
249,097,384 171,895,094 249,097,384 171,895,094 1,626 1,237
Fixed income 221,461,429 154,274,869 221,461,429 154,274,869 1,329 1,068
Shares 27,635,955 17,620,225 27,635,955 17,620,225 297 169
116,879,501 74,044,874 61,248,464 37,505,254 11,536 9,951
Customers 55,514,586 52,195,731 48,421,433 29,910,010 11,454 9,902
Itaú Group 61,364,915 21,849,143 12,827,031 7,595,244 82 49 TOTAL 365,976,885 245,939,968 310,345,848 209,400,348 13,162 11,188
(*)
Investment funds and managed portfolios – ITAÚ UNIBANCO HOLDING, through its subsidiaries,manages the following types of funds: privatization, fixed income, shares, open portfolio shares, investmentclubs, customer portfolios and group portfolios, domestic and foreign, classified in memorandum accounts,distributed as follows:
Investment funds
Managed portfolios
It refers to the distribution after elimination of double-counting of managed portfolios in investment funds.
Amount Amount (*) Number of funds
09/30/2009 09/30/2008Monthly estimate of installments receivable from participants 37,651 28,854 Group liabilities by installments 2,240,157 1,720,021 Participants – assets to be delivered 2,082,671 1,557,345 Funds available for participants 257,280 213,783
Number of managed groups 649 612 Number of current participants 119,787 95,272 Number of assets to be delivered to participants 69,017 47,043
(In units)
d) Funds of consortia
I t a ú U n i b a n c o S . A . – - September 0
147
e) Fundação Itaú Social - ITAÚ UNIBANCO HOLDING and its subsidiaries are the main sponsors of Fundação Itaú Social, the objectives of which are: 1) managing the “Itaú Social Program”, which aims at coordinating the organization’s role in projects of interest to the community by supporting or developing social, scientific and cultural projects, mainly in the elementary education and health areas; 2) supporting projects or initiatives in progress, supported or sponsored by entities qualified to work in the ”Itaú Social Program”; and 3) providing food and other similar benefits to the employees of ITAÚ UNIBANCO HOLDING and other companies of the group.
Donations made by the consolidated companies totaled R$ 378 (R$ 226 at 09/30/2008) in the period, and the Foundation’s social net assets totaled R$ 481,634 (R$ 620,243 at 09/30/2008). The income arising from its investments will be used to achieve the Foundation’s social purposes.
f) Instituto Itaú Cultural – IIC - ITAÚ UNIBANCO HOLDING and its subsidiaries are supporters of Instituto Itaú Cultural - IIC, an entity formed to grant incentives, promote and preserve Brazil’s cultural heritage. During the period, the consolidated companies donated the amount of R$ 30,360 (R$ 31,040 from January 1 to September 30, 2008).
g) Instituto Unibanco - ITAÚ UNIBANCO HOLDING and subsidiaries sponsor Instituto Unibanco, an institution
whose objective is to support projects on social assistance, particularly education, culture, promotion of integration to labor market, and environmental protection, directly or supplementarily, through the civil society’s institutions.
h) Instituto Unibanco de Cinema - ITAÚ UNIBANCO HOLDING and its subsidiaries sponsor Instituto
Unibanco de Cinema, an entity whose objective is (i) the fostering of culture in general; and (ii) providing access of low-income population to cinematography, videography and similar productions, for which it shall maintain movie theaters owned or managed by itself, and theaters to screen art films, videos, video-laser discs and other related activities, as well as to screen and divulge films of great importance, especially those produced in Brazil. During the period from January 1 to September 30, 2009, the consolidated companies donated the amount of R$ 9,632.
i) Associação Clube “A” - ITAÚ UNIBANCO HOLDING and is subsidiaries sponsor Associação Clube “A”, an
entity whose objective is the provision of social services for the welfare of beneficiaries, in the way and conditions established by its Internal Rules, and according to the funds available. These services may include, among others, the promotion of cultural, educational, sports, entertainment and health care activities. During the period from January 1 to September 30, 2009, the consolidated companies donated the amount of R$ 425.
j) Instituto Assistencial Pedro di Perna - ITAÚ UNIBANCO HOLDING and its subsidiaries sponsor Instituto
Assistencial Pedro di Perna, an entity whose objective is the provision of social services, stimulate sport activities, and promote recreation, aimed at the welfare of its members, in the way and conditions established by its Internal Rules, and according to the funds available.
I t a ú U n i b a n c o S . A . – - September 0
148
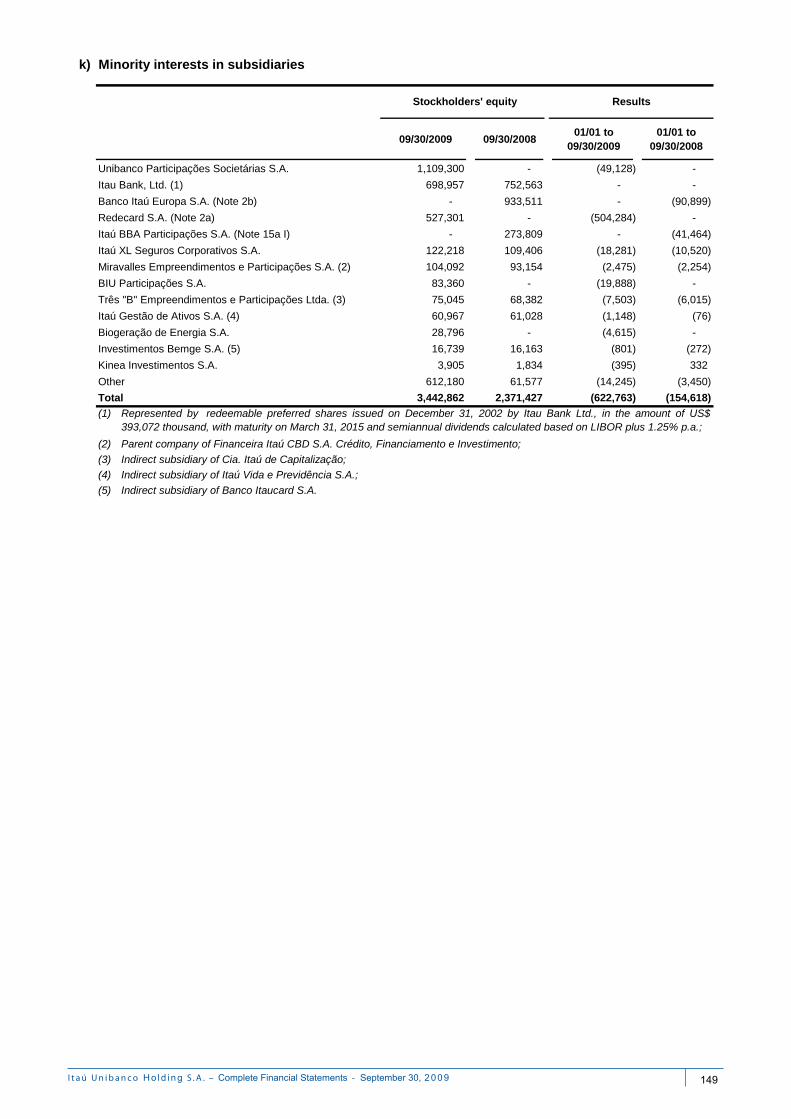
k)
09/30/2009 09/30/200801/01 to
09/30/200901/01 to
09/30/2008
1,109,300 - (49,128) -
698,957 752,563 - -
- 933,511 - (90,899)
Redecard S.A. (Note 2a) 527,301 - (504,284) -
- 273,809 - (41,464)
122,218 109,406 (18,281) (10,520)
104,092 93,154 (2,475) (2,254)
BIU Participações S.A. 83,360 - (19,888) -
75,045 68,382 (7,503) (6,015)
60,967 61,028 (1,148) (76)
28,796 - (4,615) -
16,739 16,163 (801) (272)
3,905 1,834 (395) 332
612,180 61,577 (14,245) (3,450)
3,442,862 2,371,427 (622,763) (154,618)
(1)
(2)
(3)
(4)
(5)
Parent company of Financeira Itaú CBD S.A. Crédito, Financiamento e Investimento;
Indirect subsidiary of Cia. Itaú de Capitalização;
Indirect subsidiary of Itaú Vida e Previdência S.A.;
Indirect subsidiary of Banco Itaucard S.A.
Itaú XL Seguros Corporativos S.A.
Banco Itaú Europa S.A. (Note 2b)
Itaú BBA Participações S.A. (Note 15a I)
Minority interests in subsidiaries
Itau Bank, Ltd. (1)
Stockholders' equity Results
Unibanco Participações Societárias S.A.
Represented by redeemable preferred shares issued on December 31, 2002 by Itau Bank Ltd., in the amount of US$393,072 thousand, with maturity on March 31, 2015 and semiannual dividends calculated based on LIBOR plus 1.25% p.a.;
Itaú Gestão de Ativos S.A. (4)
Total
Other
Biogeração de Energia S.A.
Três "B" Empreendimentos e Participações Ltda. (3)
Miravalles Empreendimentos e Participações S.A. (2)
Investimentos Bemge S.A. (5)
Kinea Investimentos S.A.
I t a ú U n i b a n c o S . A . – - September 0
149
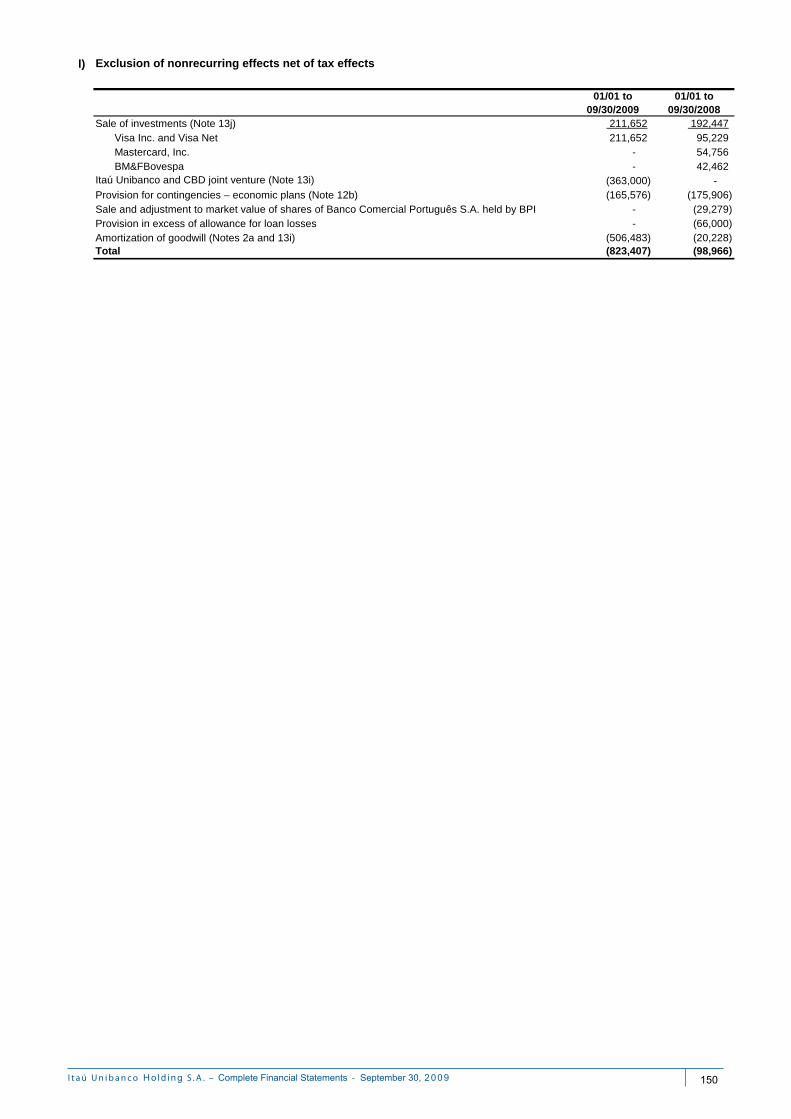
l)
01/01 to 09/30/2009
01/01 to 09/30/2008
211,652 192,447211,652 95,229
- 54,756 - 42,462
(363,000) - (165,576) (175,906)
- (29,279) - (66,000)
(506,483) (20,228)(823,407) (98,966) Total
Amortization of goodwill (Notes 2a and 13i)
Sale and adjustment to market value of shares of Banco Comercial Português S.A. held by BPI
Itaú Unibanco and CBD joint venture (Note 13i)
Provision in excess of allowance for loan losses
Mastercard, Inc.
Provision for contingencies – economic plans (Note 12b)
BM&FBovespa
Exclusion of nonrecurring effects net of tax effects
Sale of investments (Note 13j)Visa Inc. and Visa Net
I t a ú U n i b a n c o S . A . – - September 0
150
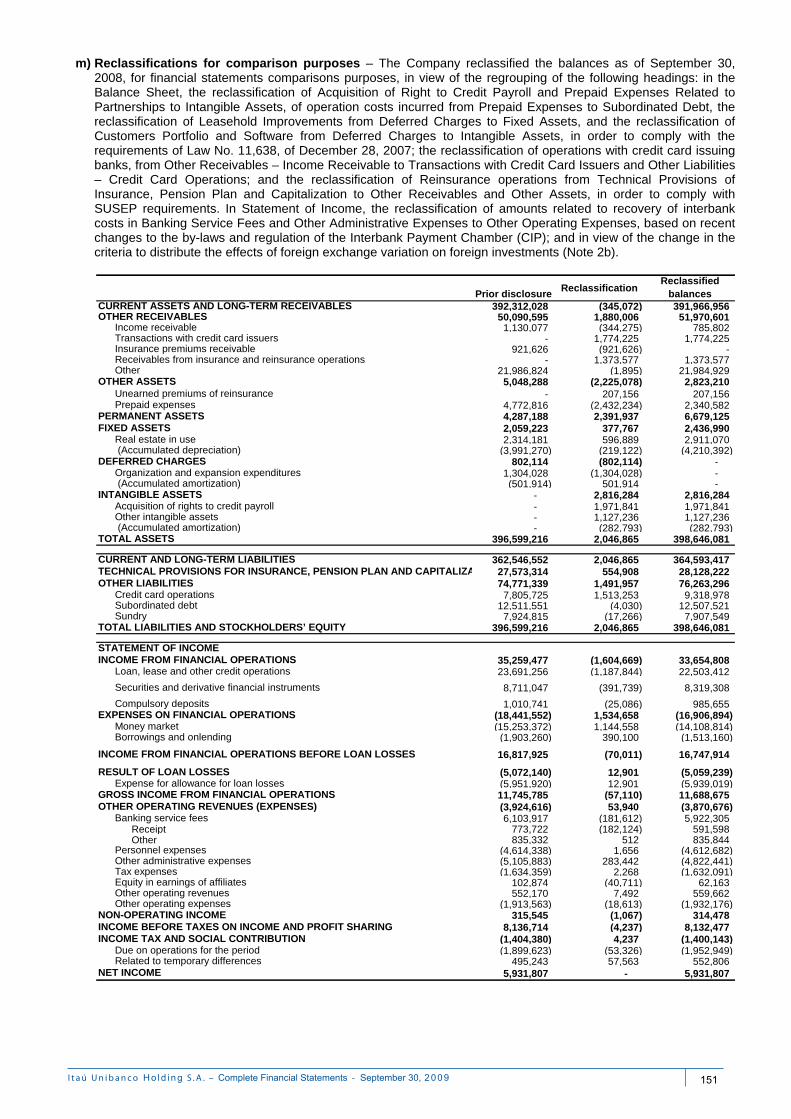
m) Reclassifications for comparison purposes – The Company reclassified the balances as of September 30, 2008, for financial statements comparisons purposes, in view of the regrouping of the following headings: in the Balance Sheet, the reclassification of Acquisition of Right to Credit Payroll and Prepaid Expenses Related to Partnerships to Intangible Assets, of operation costs incurred from Prepaid Expenses to Subordinated Debt, the reclassification of Leasehold Improvements from Deferred Charges to Fixed Assets, and the reclassification of Customers Portfolio and Software from Deferred Charges to Intangible Assets, in order to comply with the requirements of Law No. 11,638, of December 28, 2007; the reclassification of operations with credit card issuing banks, from Other Receivables – Income Receivable to Transactions with Credit Card Issuers and Other Liabilities – Credit Card Operations; and the reclassification of Reinsurance operations from Technical Provisions of Insurance, Pension Plan and Capitalization to Other Receivables and Other Assets, in order to comply with SUSEP requirements. In Statement of Income, the reclassification of amounts related to recovery of interbank costs in Banking Service Fees and Other Administrative Expenses to Other Operating Expenses, based on recent changes to the by-laws and regulation of the Interbank Payment Chamber (CIP); and in view of the change in the criteria to distribute the effects of foreign exchange variation on foreign investments (Note 2b).
Prior disclosureReclassification
Reclassified balances
392,312,028 (345,072) 391,966,956 50,090,595 1,880,006 51,970,601
1,130,077 (344,275) 785,802 - 1,774,225 1,774,225
921,626 (921,626) - - 1,373,577 1,373,577
21,986,824 (1,895) 21,984,929 5,048,288 (2,225,078) 2,823,210
- 207,156 207,156 4,772,816 (2,432,234) 2,340,582 4,287,188 2,391,937 6,679,125 2,059,223 377,767 2,436,990 2,314,181 596,889 2,911,070
(3,991,270) (219,122) (4,210,392) 802,114 (802,114) -
1,304,028 (1,304,028) - (501,914) 501,914 -
- 2,816,284 2,816,284 - 1,971,841 1,971,841 - 1,127,236 1,127,236 - (282,793) (282,793)
396,599,216 2,046,865 398,646,081
362,546,552 2,046,865 364,593,417 27,573,314 554,908 28,128,222 74,771,339 1,491,957 76,263,296
7,805,725 1,513,253 9,318,978 12,511,551 (4,030) 12,507,521
7,924,815 (17,266) 7,907,549 396,599,216 2,046,865 398,646,081
35,259,477 (1,604,669) 33,654,808 23,691,256 (1,187,844) 22,503,412
8,711,047 (391,739) 8,319,308
1,010,741 (25,086) 985,655 (18,441,552) 1,534,658 (16,906,894) (15,253,372) 1,144,558 (14,108,814) (1,903,260) 390,100 (1,513,160)
16,817,925 (70,011) 16,747,914
(5,072,140) 12,901 (5,059,239) (5,951,920) 12,901 (5,939,019) 11,745,785 (57,110) 11,688,675 (3,924,616) 53,940 (3,870,676) 6,103,917 (181,612) 5,922,305
Receipt 773,722 (182,124) 591,598 Other 835,332 512 835,844
(4,614,338) 1,656 (4,612,682) (5,105,883) 283,442 (4,822,441) (1,634,359) 2,268 (1,632,091)
102,874 (40,711) 62,163 552,170 7,492 559,662
(1,913,563) (18,613) (1,932,176) 315,545 (1,067) 314,478
8,136,714 (4,237) 8,132,477 (1,404,380) 4,237 (1,400,143) (1,899,623) (53,326) (1,952,949)
495,243 57,563 552,806 5,931,807 - 5,931,807
DEFERRED CHARGESOrganization and expansion expenditures (Accumulated amortization)
Subordinated debt
INTANGIBLE ASSETSAcquisition of rights to credit payrollOther intangible assets (Accumulated amortization)
GROSS INCOME FROM FINANCIAL OPERATIONS
Loan, lease and other credit operations
Securities and derivative financial instruments
Compulsory deposits
Money marketBorrowings and onlending
Expense for allowance for loan lossesRESULT OF LOAN LOSSES
NET INCOME
OTHER OPERATING REVENUES (EXPENSES)Banking service fees
Due on operations for the periodRelated to temporary differences
NON-OPERATING INCOME
Other operating revenues
INCOME BEFORE TAXES ON INCOME AND PROFIT SHARINGINCOME TAX AND SOCIAL CONTRIBUTION
Personnel expenses
OTHER ASSETS
Prepaid expenses
TOTAL ASSETS
CURRENT ASSETS AND LONG-TERM RECEIVABLESOTHER RECEIVABLES
Income receivable
Insurance premiums receivableReceivables from insurance and reinsurance operationsOther
Other administrative expensesTax expensesEquity in earnings of affiliates
Other operating expenses
INCOME FROM FINANCIAL OPERATIONS
EXPENSES ON FINANCIAL OPERATIONS
INCOME FROM FINANCIAL OPERATIONS BEFORE LOAN LOSSES
SundryTOTAL LIABILITIES AND STOCKHOLDERS’ EQUITY
STATEMENT OF INCOME
Transactions with credit card issuers
OTHER LIABILITIESCredit card operations
CURRENT AND LONG-TERM LIABILITIESTECHNICAL PROVISIONS FOR INSURANCE, PENSION PLAN AND CAPITALIZA
FIXED ASSETSPERMANENT ASSETS
Real estate in use
Unearned premiums of reinsurance
(Accumulated depreciation)
I t a ú U n i b a n c o S . A . – - September 0
151
n) Law Nos. 11,638 and 11,941
Laws Nos. 6,404, of December 15, 1976, and 6,385, of December 7, 1976, were amended by Laws Nos. 11,638, of December 28, 2007, and 11,941, of May 27, 2009, on aspects related to accounting practices, preparation and disclosure of financial statements, effective as from January 1, 2008. The Law sets forth that the rules issued by CVM shall be prepared in conformity with international accounting standards.
The main changes arising from the Law are already included in these financial statements, including CVM regulations that do not conflict with those of BACEN’s, such as: disclosure on related parties, transaction costs, and premium on issuance of securities, statement of added value and share-based payment. However, the standards below still await BACEN’s regulation to come into effect: Effects on changes in foreign exchange rates and conversion of financial statements;
Adjustment to present value of long-term asset and liability operations, and of significant short-term
operations; o) Subsequent Events
I - Alliance with Porto Seguro
On August 23, 2009 ITAÚ UNIBANCO HOLDING and Porto Seguro S.A. (PORTO SEGURO) entered into an alliance aimed at the unification of their residence and automobile insurance operations, in addition to an Operational Agreement for the exclusive offer and distribution of residence and automobile insurance products to the customers of the ITAÚ UNIBANCO branch network in Brazil and Uruguay.
Such alliance will be implemented through a corporate restructuring, in which ITAÚ UNIBANCO HOLDING will transfer to PORTO SEGURO all the assets and liabilities related to its current portfolio of residence and automobile insurance equivalent to a Stockholders’ Equity of R$ 950 million. In its turn, PORTO SEGURO will issue shares representing 30% (thirty percent) of its new capital stock, which will be delivered to ITAÚ UNIBANCO HOLDING, which will then proportionally consolidate its interest in PORTO SEGURO. Therefore, no significant changes are expected in ITAÚ UNIBANCO HOLDING’s balance sheet. For accounting purposes, the alliance will be concluded when the operation is approved at PORTO SEGURO's stockholders’ meeting and the by the Brazilian Antitrust System (SBDC), which is scheduled to take place in the fourth quarter of 2009. On October 16, 2009, SUSEP granted prior authorization for the corporate acts related to this alliance.
II - Transfer of Unibanco Saúde Seguradora’s capital to Tempo Participações
On September 24, ITAÚ UNIBANCO HOLDING and Tempo Participações S.A. (TEMPO) signed a Memorandum of Understanding aimed at transferring 100% of Unibanco Saúde Seguradora’s capital to TEMPO. Accordingly, TEMPO will pay the amount of R$ 55 million on the stock transfer date. In view of the performance of Unibanco Saúde’s operations in the subsequent 12 months, ITAÚ UNIBANCO HOLDING will be entitled to an additional payment of up to R$ 45 million. This transaction is not expected to give rise to significant effects on the company’s balance sheet and results.
In the coming 90 days, TEMPO and ITAÚ UNIBANCO HOLDING will execute a definitive documentation detailing the rules outlined in the Memorandum of Understanding and will subject this agreement to the approval of the bodies in charge, including the ANS (Brazilian Health Agency – the health market regulator) and SBDC.
The effects of this operation will be recorded in the financial statements after the above-mentioned approval.
I t a ú U n i b a n c o S . A . – - September 0
152
Report of Independent Accountants on Limited Reviews To the Board of Directors and Stockholders Itaú Unibanco Holding S.A. (formerly Itaú Unibanco Banco Múltiplo S.A.) 1 We have carried out limited reviews of the balance sheets of Itaú Unibanco Holding S.A. (Bank) and Itaú
Unibanco Holding S.A. and its subsidiary companies (consolidated) as of September 30, 2009 and 2008, and the related statements of income, of changes in stockholders´ equity, of cash flows and of added value, as well as the consolidated statements of income, of cash flows and of added value for the nine-month periods then ended. These financial statements are the responsibility of the Bank´s management. Our responsibility is to issue a report on these financial statements.
2 Our reviews were conducted in accordance with specific standards established by the Institute of
Independent Auditors of Brazil (IBRACON), in conjunction with the Federal Accounting Council (CFC), and mainly comprised: (a) inquiries of and discussions with management responsible for the accounting, financial and operating areas of the Bank and its subsidiaries with regard to the main criteria adopted for the preparation of the financial statements and (b) a review of the significant information and of the subsequent events which have, or could have, significant effects on the financial position and operations of the Bank and its subsidiaries.
3 Based on our limited reviews, we are not aware of any material modifications that should be made to the
financial statements referred to above for them to be stated in accordance with accounting practices adopted in Brazil.
São Paulo, October 30, 2009 PricewaterhouseCoopers Paulo Sergio Miron Auditores Independentes Contador CRC 1SP173647/O-5 CRC 2SP000160/O-5
I t a ú U n i b a n c o S . A . – - September 0
153
ITAÚ UNIBANCO HOLDING S.A.
CNPJ. 60.872.504/0001-23 Public company NIRE. 35300010230
OPINION OF THE FISCAL COUNCIL
The effective members of the Fiscal Council of ITAÚ UNIBANCO HOLDING S.A., having reviewed the financial statements for the period from January to September 2009, have verified the accuracy of all items examined and, in view of the unqualified opinion of PricewaterhouseCoopers Auditores Independentes, understand that they adequately reflect the company’s capital structure, financial position and the activities conducted during the period. São Paulo, October 30, 2009. IRAN SIQUEIRA LIMA President ALBERTO SOZIN FURUGUEM Member ARTEMIO BERTHOLINI Member
I t a ú U n i b a n c o S . A . – - September 0
154