Embed Size (px)
Citation preview
PREDICTING BUSINESS FAILURE IN THE HOSPITALITY INDUSTRY: AN
APPLICATION OF LOGIT MODEL
by
Min-ho Cho
Dissertation submitted to the Faculty of the
Virginia Polytechnic Institute and State University
In partial fulfillment of Requirements for the degree of
Doctor of Philosophy
in
Hospitality and Tourism Management
APPROVED:
GCounecs A. thrm—ae [1 ehaLl) Tb. Dr. Francis A. Kwansa Dr. " Michael D. Olsen
(Co-Chair) (Co-Chair)
Lala Mees} Dr. HIN za C. Tse Dr. Thomas L. fan tyke
1994
Blacksburg, Virginia.
PREDICTING BUSINESS FAILURE IN THE HOSPITALITY INDUSTRY: AN
APPLICATION OF LOGIT MODEL
by
Min-Ho Cho
Committee Co-Chairs: Dr. Francis A. Kwansa
Dr. Michael D. Olsen
Hospitality and Tourism Management
(ABSTRACT)
The phenomenon of business failure has attracted research
interest in finance literature partly because of its impact on
the U.S economy. Whereas an impressive body of knowledge has
been accumulated on this subject thus far, the hospitality
literature has lacked empirical studies that seek to explain
the nature of this phenomenon in the hospitality industry.
The restaurant industry has consistently had the most
business failures of any single segment within the retail
trade sector in the eighties. Therefore, there were three
purposes in this study: 1) to develop a model for predicting
business failure which can be a useful tool in helping
researchers and industry practitioners to identify warning
signs of business failure in the restaurant industry, 2) to
determine whether the financial variables of a predictive
model for business failure in the restaurant industry are the
same as in the hotel industry, and 3) to determine whether the
financial variables that are associated with reorganization
are different from those that are associated with liquidation

in the restaurant industry.
The sample consisted of 23 failed and 23 non-failed
restaurant firms, and 15 failed and 15 non-failed hotel firms
within the period of 1982-1993. The predictive business
failure models were developed through logistic regression
analysis employing 8 financial variables based on one year
prior to business failure.
The models were tested at two and three years prior to
business failure. The empirical evidence illustrated that the
business failure model developed for the restaurant industry
is capable of predicting business failure, and even bankruptcy
with high classification accuracy.
The relationship between reorganization and liquidation
was investigated through logistic regression analysis
employing two sets of indicators for capital structure and
profitability. The sample consisted of 14 reorganizers and 10
liquidators from the restaurant industry.
The empirical evidence showed that reorganization and
liquidation are not dependent on each other, that is,
reorganization and liquidation cannot be determined by both
Capital structure and profitability in the restaurant a failed

ACKNOWLEDGEMENTS
I would like to express my sincere appreciation to a
number of people who both provided valuable help during the
long and arduous process of preparing this dissertation and
made significant contributions towards completion of this
dissertation.
I would like to thank my Co-chairs, Dr. Francis A. Kwansa
and Michael D. Olsen who have provided me with much needed
inspiration, advice, and encouragement during my graduate
study and especially with this dissertation. I am indebted to
Dr. Olsen for introducing me to the subject of finance. Most
importantly, I am especially grateful to Dr. Francis Kwansa
for nurturing my interest in the subject along the way and for
allowing me to benefit from his deep knowledge of finance.
His kindness and endless support made this odyssey much more
enjoyable. ae
Appreciation is also extended to Drs. Eliza C. Tse,
Thomas L. VanDyke, and Young-Seock Shin. Their guidance and
assistance have been invaluable. I am sincerely thankful to
them for their comments, questions and suggestions for
improving this dissertation.
Finally, I would like to dedicate this dissertation to my
parents whose support, encouragement, and sacrifice have been
the driving force through all my scholarly efforts, and I hope
this dissertation makes them proud.
iv
TABLE OF CONTENTS Page
INTRODUCTION
1.1 INTRODUCTION. ........... cee ee ec ce ee ee te tt te ee eens 1
1.2 CONTEXT OF THE STUDY........... 2.22. cee cc ee ee ee ee eee 4
1.3 JUSTIFICATION OF RESEARCH............. 2.2... 2 2 ee ee eee ees 10 1.4 PURPOSE OF THE STUDY
1.4.1 The Prediction Model for the Restaurant Industry.. 13 1.4.2 The Comparison of the Restaurant Model with
the Hotel Model.............. eee ee ee eee ee ee ee 14 1.4.3 The Relationship between Reorganization
and Liquidation. ............. eee eee ee ee ees 16 1.5 RESEARCH QUESTIONS.......... 2... 0. eee eee ee ee te eee ee es 18
1.6 SIGNIFICANCE OF THE STUDY...............2. 2.2222 e eee ees 18 1.7 OUTLINE OF DISSERTATION................ 2.2.02 eee eee eee 20
LITERATURE REVIEW
2.1 REVIEW OF EMPIRICAL STUDIES ON BUSINESS FAILURE
2.1.1 Ratio Approach............... ee ee ee ee ees 21 2.1.2 Events Approach........... ee ee ee ee eee ee ees 32 2.1.3 Combination of Ratio and Events Approach.......... 35
2.2 INDUSTRY FINANCIAL CHARACTERISTICS AND
THEIR INFLUENCE ON BUSINESS FAILURE
2.2.1 Working Capital............ eee ee eee eee eee 38 2.2.2 Capital Structure........... eee 39 2.2.3 Profitability. ........ ee eee ee eee 41 2.2.4 Asset Structure: Fixed Asset...................2... 42 2.2.5 Systematic Risk.... 2... ee ee ee ne 43 2.2.6 Leveraged Buyout........... ee ee eee ee ee ees 45
2.3 REVIEW OF STUDIES ON BUSINESS FAILURE IN
THE HOSPITALITY INDUSTRY
2.3.1 Ratio Approach....... ee ee eee 49 2.3.2 Events Approach............... eee ee ee eee 51
2.4 REORGANIZATION AND LIQUIDATION
2.4.1 Independence of Reorganization and Liquidation.... 56 2.4.2 Dependence of Reorganization and Liquidation...... 57 2.4.3 Bankruptcy CoSts.............. cee eee eee ete 58
2.5 SUMMARY... 2... ee eee eee eee 62
RESEARCH METHODOLOGY
3.1 RESEARCH QUESTIONS........ 2... 0... ccc eee eee eee ee tees 69
3.2 HYPOTHESES... .. eens 70 3.3 METHODOLOGICAL REVIEW
3.3.1 Justification of Research Methodology............. 73 3.3.2 Justification of Research Method.................. 74 3.3.3 Choice of Classification and Prediction Method.... 75 3.3.4 Logistic Regression AnalySisS.................00045 76
3.4 METHODOLOGICAL ISSUES
3.4.1 Definition of Business Failure.................... 80
V
4.2 Definition of Reorganization and Liquidation...... 4.3 Sample ConsStruction........ cee ee eee RESEARCH METHODS
5.1 Classifying and Predicting Business Failure A. Sample Selection.............. 2.2. ee ee ee eee B. Independent Variables Selection..................
. Statistical-Analytical Method....................
. Validation: Testing the Models................... Comparing the Restaurant Industry with the Hotel Industry
. Sample Selection... .... ee ee ee ee ee ns
. Independent Variables Selection....... Lee eee eee
. Statistical-Analytical Method.................... Applying the Prediction Model for Business Failure to Bankrupt Firms
. Sample Selection... ... ee ee ee ee ees
. Independent Variables Selection..................
. Statistical-Analytical Method.................... Determining the Relationship between Reorganization and Liquidation
A. Sample Selection......... 2.2.2... eee ee ene B. Independent Variables Selection.................. C. Statistical-Analytical Method....................
3.6 SUMMARY... 2... ce ee tee ete ee ene
3. 3.
3.5 3
WOW
NUA
Aw
RESULTS AND DISCUSSION 4.1 RESULTS
.1.1 The Restaurant Industry...................2.220 00 ee
.1.2 The Hotel Industry......... 2... ... eee ee ee eee
.1.3 Application of the Model to Bankrupt Firms........
.1.4 The Relationship of Reorganization and Liquidation....................
HYPOTHESIS TESTING... 2... 2.2.0... te ee eee DISCUSSION
3.1 The First Research Question................000000- 3 3
Pp
_ PE
.2 The Second Research Question...................0.4.-
4.2 4.3
4
4
4.3.3 The Third Research Question.......................
CONCLUSIONS 5.1 Summary of the Study............. 2... 20... eee eee ee eee 5.2 Implications of the Study.............. 2... ee eee eee 5.3 Limitations of the Study........... 0... ce eee ee eee
BIBLIOGRAPHY... 2... 2... ce ee ee ee eee eee
vi

LIST OF TABLES
Table
Table
Table
Table
Table
Table
Table
Table
Table
Table
Table
Table
Table
Table
1.
10.
11.
12.
13.
14.
Page
Business Failures, Liabilities, and Failure Rates
(1971-1991) 2. ee eee ee teens 6
Business Failure by Industry Sectors (1984-1992) 2... LL et tee etn 7
Business Failure in the Retail Sector (1984-1992)... ee tee ee eee 8
Total Bankruptcy Case Filings (1980-1991)........ 9
The Summary of Business Failure Studies through Ratio Approach................. 22 eee eee 65
Research Question, Hypothesis and Theoretical Underpinning..................44-. 72
The List of Failed and Non-Failed Firms in the Restaurant Industry During the Period of 1982-1993. LL cc ee tee ee ee eee eens 87
The List of Failed and Non-Failed Firms in the Hotel Industry During the Period of 1982-1993... cc ee ee ee eee ee ee ees 88
The Independent Variables and TheirDefinitions......... eee ee ee ee eee 95
The List of Reorganizers and Liquidators in the Restaurant Industry During the Period of 1980-1994... ce ee tee eens 100
The Capital Structure and Profitability Indicators and their Definitions................ 105
The Logistic Regression Analysis in the Restaurant Industry...................0-- 110
The Correlation Matrices for the Restaurant and Hotel Samples................ 112
Probability and Prediction of Business Failure in the Restaurant Industry (t-1)................ 115
Vil
Table
Table
Table
Table
Table
Table
Table
Table
Table
Table
Table
Table
Table
15.
16.
17.
18.
19.
20.
21.
22.
23.
24.
25.
26.
27.
Probability and Prediction of Business Failure in the Restaurant Industry (t-2) eo © © © © © © © © © © e © ee ©
Probability and Prediction of Business in the Restaurant Industry (t-3)................
Logistic Regression Analysis in the Hotel Industry.......................2.--.
Probability and Prediction of Business in the Hotel Industry (t-1) oe 8 © © © © © © © © © © &F © ee ee ew
Probability and Prediction of Business in the Hotel Industry (t-2).....................
Probability and Prediction of Business in the Hotel Industry (t-3) oe 0e © © © © © © © © © © © © © © © © eo
Probability and Prediction of Bankruptcy in the Restaurant Industry (t-1)................
Probability and Prediction of Bankruptcy in the Restaurant Industry (t-2)................
Probability and Prediction of Bankruptcy in the Restaurant Industry (t-3)................
The Analysis of Bankruptcy Probability for the Common Firms in the Restaurant Industry.....
The Analysis of Relationship Between Reorganization and Liquidation in the Restaurant Industry (t-1) eee 8 © © © © © © © © © &e © ©
The Analysis of Relationship Between Reorganization and Liquidation in the Restaurant Industry (t-2)................
The Analysis of Relationship Between Reorganization and Liquidation in the Restaurant Industry (t-3) oe © © © © © © © © © © © © ©
viii
LIST OF FIGURES Page
Figure 1. The Plot of Pearson Residual in the Restaurant Sample........................ 113
Figure 2. The Plot of Deviance Residual in the Restaurant Sample........................ 114
Figure 3. The Plot of Pearson Residual in the Hotel Sample...................-.-- 0-008 121
Figure 4. The Plot of Deviance Residual in the Hotel Sample............... 0.2... 122
1x
CHAPTER 1
INTRODUCTION
1.1 INTRODUCTION
Between the 1930s and the early 1980s, the business
failure rate for the U.S. was always below one percent (or 100
per 10,000 firms) per year and usually below one half of a
percentage point per year. However, from 1983 to 1987, the
failure rate was above one percent. The failure rate rose
dramatically during the recession of the early eighties and
has remained high in recent years even as the economy has
(_mecoveres (Dun & Bradstreet, 1991). Reasons often cited for
business failure include neglect, disaster, fraud, economic,
| anexperience, financial and strategic (Platt, 1985).
a Business failure is an important economic phenomenon,
because it is not costless. Indeed, the consequences due to
such failure include hardships such as investors' loss of
equity and dividends, creditors' loss of principal and
\ interest, and employees' loss of jobs (Altman, Avery,
_\Blsenbeis & Sinkey, 1981). Since business failure is of vital
concern to corporate managers, security analysts, investors,
\ and lenders, there has been a substantial amount of research
‘conducted on the topic.
In the hospitality industry, especially the restaurant
industry, business failure has become an important issue for
‘. survival since the industry is considered to be saturated.
1
Many restaurant firms have liquidated due to the high level of
competition in the industry. What is needed are tools or
techniques that will help the restaurant industry identify
early warning signs of impending business failure, so as to
save businesses from eventual liquidation.
Business failure is a term which is used in a variety of
contexts. Keown, Scott, Martin & Petty (1985) offer three
terms that are used to represent business failure. Economic
failure, which is indicative of business expenses exceeding
revenues, can be viewed as a mild form of failure which may be
temporary for many firms. Technical insolvency describes a
situation where the firm has positive net worth but has
insufficient liquidity to meet current liabilities. Lastly,
at the other extreme, is bankruptcy. In this state, the firm
shows negative net worth as well as illiquidity.
Bankruptcy is the most critical type of business failure,
and the most well known types of bankruptcy are liquidation
and reorganization (these are also referred to as chapter 7
and chapter 11, respectively, of the Bankruptcy Code).
Liquidation can be voluntary or involuntary. Both voluntary
and involuntary liquidation involve selling off all of the
‘firm's assets for cash, paying all outstanding debts from the
proceeds, and distributing the remaining funds to stockholders
as liquidating dividends. The corporate entity of the
liquidating firm ceases to exist after liquidation (Kudla,
2
1988). Reorganization also can be voluntary or involuntary.
The purpose of having voluntary and involuntary reorganization
as an alternative to liquidation is to emphasize the fact that
it is often better to encourage and facilitate the
rehabilitation of a business in financial distress than to
liquidate it.
There have been two distinct arguments presented
regarding the relationship between liquidation and
reorganization. One group of authors believes’ that
reorganization and liquidation are independent of each other,
that is, reorganization and liquidation can be determined
respectively by capital structure and profitability (Haugen &
Senbet, 1978; 1988; Senbet & Seward, 1993). Another group
believes that reorganization and liquidation are dependent on
each other, that is reorganization and liquidation can be
determined by both capital structure and profitability (Bulow,
1978; Shapiro & Peitzman, 1984; Titman, 1984; White, 1984;
Morris, 1986; Casey, McGee & Stickney, 1986).
No empirical study has focused on the relationship
between reorganization and liquidation from the point of view
of the financial factors which determine them. Thus, there is
a need to investigate the relationship between reorganization
and liquidation to help restauranteurs make the appropriate
business decision when faced with the prospect of choosing one
or the other.
1.2 CONTEXT OF THE STUDY
Although business failure is not a recent phenomenon, it
is mostly identified with the 1980s because of the existence
of chronically sick industries (e.g., agriculture), high real
interest rates, international competition, increased
leveraging of corporate America, deregulating of key
industries (e.g., financial services) and relatively high new
business formation rates (Altman, 1993) present during this
period. Table 1 provides a summary of business failures,
liabilities and failure rates in the U.S. from 1971 to 1991,
and it shows, for example, that business failure rate (100 per
10,000) was over one percent during 1984 to 1987. The number
of failures surged dramatically in 1991 with the rate reaching
1.6 percent and failure liabilities topping one hundred
billion for the first time. Increasing failure rates have
generated significant research interest in prediction models
that attempt to predict the likelihood of failure.
Business failure in the restaurant industry is also
mostly identified with 1980s because it is commonly accepted
that the industry entered maturity in its life cycle during
this period. Some of the indicators which generally confirm
the industry's overall maturity are: 1) lower profit margins
resulting from stagnation of industry sales, 2) price
competition, 3) competitor shakeout, 4) over capacity, 5)
market segmentation, 6) broadening of product line, and 7)
4
increased emphasis on service (West, 1988).
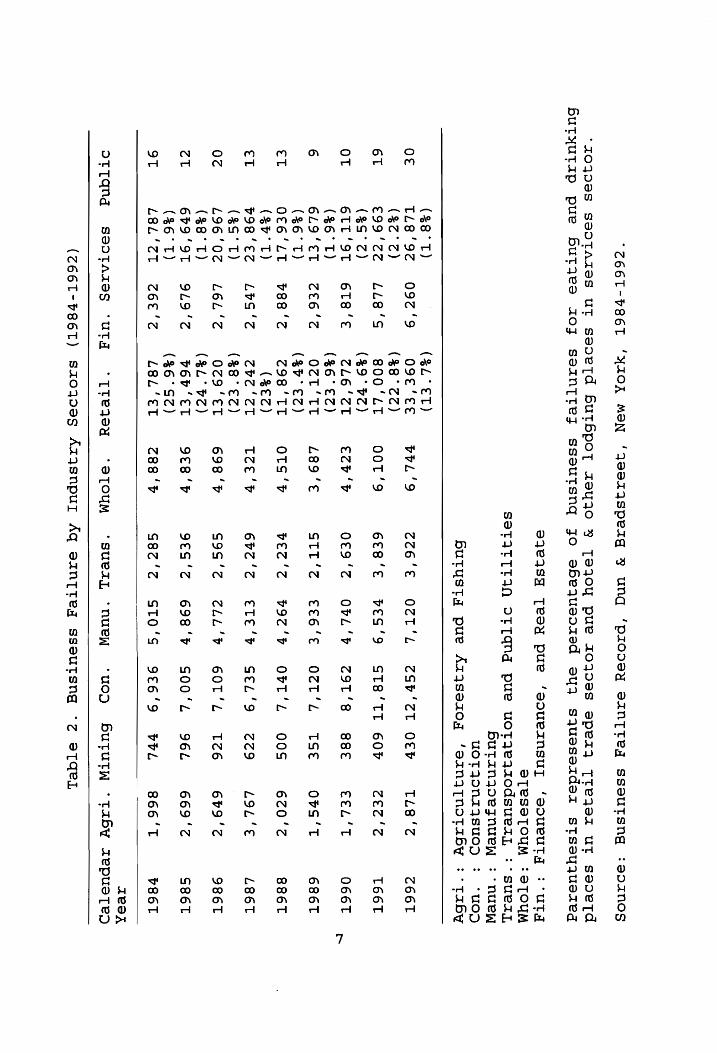
Table 2 provides a summary of business failures by
industry sectors. Compared to all other sectors most business
failures between 1984 and 1992 occurred in the retail trade
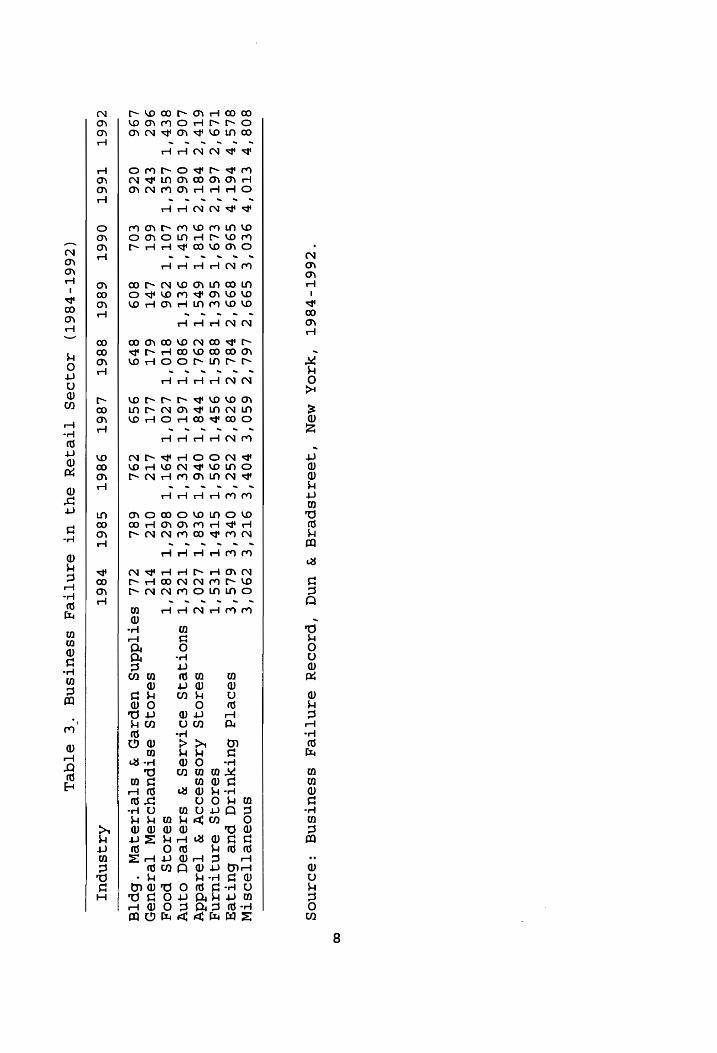
and services sector. Table 3 provides a summary of business
failures in the retail trade sector, and within this sector,
the number of business failures in the restaurant industry
(eating and drinking places) peaked in 1984 and has since
remained highest in the retail trade sector.
Bankruptcy is the mechanism through which failed firms
frequently leave the market. The number of firms filing for
bankruptcy along with their total liabilities rose rapidly
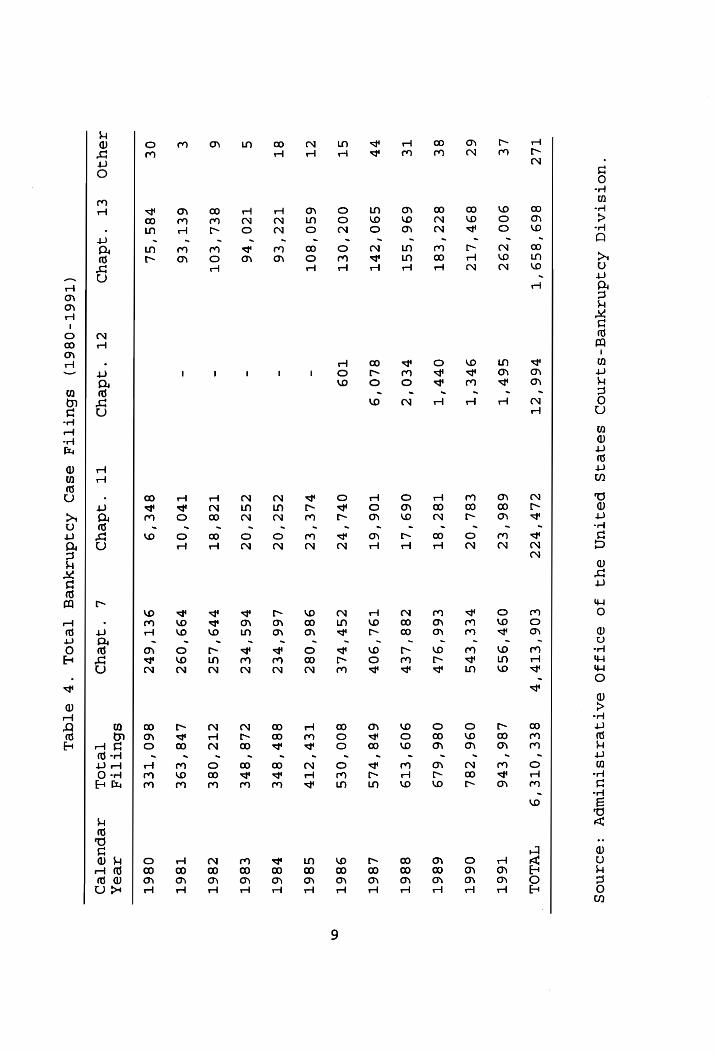
throughout the eighties (Logue, 1990). Table 4 provides a
summary of total bankruptcy case filings from 1980 to 1991.
As indicated by White (1983), there were more liquidations and
fewer reorganizations during this period. He argued that the
Reform Act of 1978 made the bankruptcy process more efficient
by making reorganization more difficult.
/ As business failure rates and bankruptcies are expected
; to increase, a reflection and evaluation of the consequences
of these events will provide pertinent information for future
planning by managers, security analysts, investors, and
\tendere in the restaurant industry.
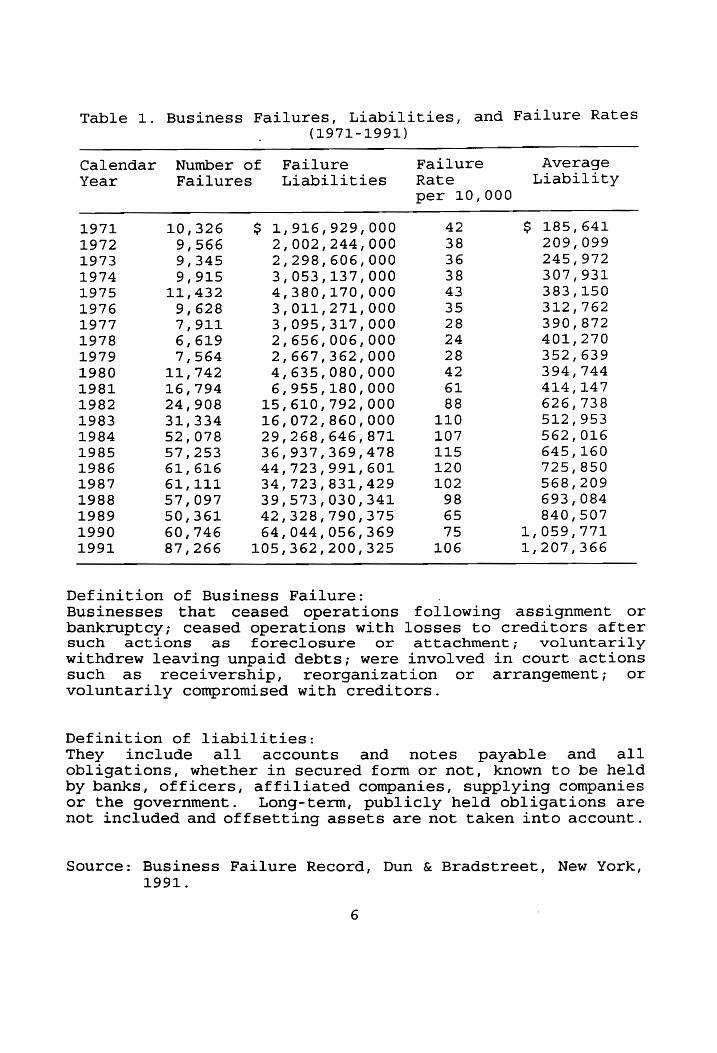
Table 1. Business Failures, Liabilities, and Failure Rates
(1971-1991)
Calendar Number of Failure Failure Average
Year Failures Liabilities Rate Liability per 10,000
1971 10,326 $ 1,916,929,000 42 S$ 185,641
1972 9,566 2,002,244,000 38 209,099 1973 9,345 2,298,606, 000 36 245,972
1974 9,915 3,053,137,000 38 307,931 1975 11,432 4,380,170,000 43 383,150
1976 9,628 3,011,271,000 35 312,762 1977 7,911 3,095,317,000 28 390,872
1978 6,619 2,656,006, 000 24 401,270 1979 7,564 2,667,362,000 28 352,639 1980 11,742 4,635,080,000 42 394,744 1981 16,794 6,955,180,000 61 414,147 1982 24,908 15,610, 792,000 88 626,738 1983 31,334 16,072,860,000 110 512,953 1984 52,078 29,268,646, 871 107 562,016 1985 57,253 36,937,369,478 115 645,160
1986 61,616 44,723,991,601 120 725,850 1987 61,111 34,723,831,429 102 568,209
1988 57,097 39,573,030,341 98 693,084 1989 50,361 42,328,790,375 65 840,507 1990 60,746 64,044,056, 369 75 1,059,771 1991 87,266 105,362,200,325 106 1,207,366
Definition of Business Failure: . Businesses that ceased operations following assignment or bankruptcy; ceased operations with losses to creditors after such actions as foreclosure or attachment; voluntarily
withdrew leaving unpaid debts; were involved in court actions such as receivership, reorganization or arrangement; or voluntarily compromised with creditors.
Definition of liabilities: They include all accounts and notes payable and all obligations, whether in secured form or not, known to be held by banks, officers, affiliated companies, supplying companies or the government. Long-term, publicly held obligations are not included and offsetting assets are not taken into account.
Source: Business Failure Record, Dun & Bradstreet, New York, 1991.
“Z66L-P86L
‘HAOK
MON
‘QOSASpeAG
¥ und
‘pxzOdSyYy SANTTe_
sseutsng
:ediznosg
"ZO40eS
SedTAZTES
UT seoeTd
Hbutbpot
zey
jo ¥
TSejOY pue
10IDSS
Spezq
Ttejezr
ut seodetd
6utyUuUTIp pue
BHbutqjea A0J
sazn{[tejy sssautsnq
jo sebequeozed
sy
squeserzdsez stsayquezeg
e7eIqSsH
Tesy
pue
‘soueAnsulL
‘soueUTYA
:‘uUTY
STeSSTOUM
*3TOUM
SOTITTITIN
OT[Tqnd
pue
uoTIeAAOdsuezlL
:°suelzAL Butanjoejznuey
: “nuew
uot yoONAASUOD
: ‘udD
Bbutysta
pue
Azqsez0q
‘eznq[notzby
:° tabby
($8°T) ($L°€T)
O€ TL8‘'92@
092'9
O9E‘'EE PPL‘
ZZ6‘'E€ OCT'L
ZSH'ZT
OCF TL8'Z
Z66T ($Z°Z)
($8°2Z)
6T €99'Z2
LLE8'S 800‘LT
OOT‘9
6€8‘E€ vEs'o
ST8‘'TT 60P
ZET ‘2
T66T (35°72)
(49° OZ)
OT 6TT‘9T
6T8'E
7L6 ‘CT
CC?
0€9‘'Z OPL'b
Z9IT‘S BBE
EEL'T
O66T (%6°T)
(%6°€Z)
6 6L9'ET
72£6'Z OZT‘IT
L89'€
GTT‘Z
€€6'€
OZT‘'L TSE
Ors'T
686T ($6°T)
(%$0°€Z) ET
O€6‘'LT 788'Z
798 ‘TT OTS'?
vEerT'2 79%'b
OFPT'L OOS
620'Z
886T (30°
T) (%€Z)
€T p98‘ert
LS’?
CHC ‘CT
TZe'*? 60c2'Z
ETE'R
SEL'ID 2zZ9
LOL‘'E L86T
(3S°T) (%8°€Z)
0Z 4£96'02
L6L‘Z
OZ9'ET
698 '% S9S‘Z
ZLL'Y
G6OT‘'L TZ6E
6t9'Z
986T ($8°T)
($L°%Z)
ZT 679'9T
9L19'Z P60'ET
9€8'P
9€S‘'Z 698'F
S00‘L
96L 669'Z
G86T (36°T)
(%6°SZ)
OT L8L‘ZT
26e'Z
LEL‘ET
788‘ S8z‘'Z
STO'S
9£€6'9 FPL
866 ‘T
V86T
TeaK
OTTQNG
SeotTAAS
‘UTA ‘“[TeIey
‘sTOuUM ‘SUeTL
‘nueWm ‘uoD
Hututw
‘“tabw zepueted
(Z66T-P86T)
Szt0QR9Deg AzASnpuL
Aq sAN{Tteg
sseutTsng
°Z eTqeL
"Z66L-P86L
‘'HAOK MON
‘QeeaTASperzg ¥F
UNd ‘pzODey
seAn{Tteqy sseutsng
:eo1no0g
808'P
ETO’
9E0’E
S$99'Z LEL'Z
650'E
HOH‘E
O9TZ‘E Z90'E
SNOSsULTTSOStW
8LS'b
PET’
S96'Z
899'Z2 PBL'Z
928'Z
ZGzZ‘E OPE‘E
GLG‘E
seoetqd Butyutad
pue butyzeg
TL9‘'Z L6T‘'Z
ELO‘T
G6E‘T
88S‘T
9Sb‘T
09G‘T
STP‘T
TES’T
sez0qg
sanqtuazng
61'S
PET'S
9T8‘'T 6HS'T
Z9L'T
FHB'T
OFE‘'T 9EB‘T
LZ0'Z
sezojs
Azossaooy
¥y Terzeddy
LO6‘'T 066‘T
€SP'T
9ET‘T
980'T
LET‘T
TZE‘T
O6€‘T
TZE’T
SUOTIeIS
SOTAATSS ¥%
SASTesqd Oo 4nY
8EP'T
LSE'T
LOT’T
296 8TO'T
LZO‘'T P9T‘T
86Z2‘T T8Z'T
se103S
poog
962 €vz
66T LUT
6LT LLT
LTZ OTZ
P12 Se8109§
ssTpueyorsW
TersuseH L96
026 EOL
809 8h9
999 ZOL
68L ZLL
sattddns
usepze5 %
sTetzejeW
‘Spta
c66T
T66T
O66T
686T
B886T LBET
YBET
S8ET
FHB86T Aa
Asnpul
(Z66L-P86T)
AOQOSS
[tejey
Sy. UT
SANTTe_A sseutsng
“€ eTqeL
‘uotstatq
Aojdnazayueg-sjAznoD
saqeqsg peqtun
syq Jo
sdoTJJO SaTAeAASTUTWPY
:e07NOCS
869'8S9'‘T
TLZ v66‘'2T
CLY'bC7
€O6'ETH'D
gsee‘OTE'9 TWLOL
LE 900‘z9z
G6P'T 686‘€2
09%'9S9 L86'€b6
T66T
¥4 89b'LTZ
9bEe'T €8L‘0Z
VEE'EDS 096'28L
O66T
8 8Zz‘E8T
OvP'T T8z‘8t
€66'9LP 086‘6L9
686T
TE 696
‘SST PEO'Z
069‘LT Z88'LED
909‘€T9 886T
bP S90‘ZPT
840'9 TO6‘6T
T9L'90F 608
‘PLS L86T
ST 00Z‘OET
TO9 OVL'bZ
Sb‘ PLE
800‘0€S 986T
ZT 6S0‘80T
- PLE'EZ
986'08Z Ler‘
2tp S86T
8T TZZ‘€6
- ZSZ
‘OZ L66'VEZ
88P ‘Ste V86T
S TZ0
‘v6 -
ZSZ‘0Z P6S'PEZ
ZLE'SPE €86T
6 8EL'EOT
- Tze
‘8st Vv9'LSZ
ZT? ‘OSE
Z86T
€ 6ET'€6
- TvO ‘OT
799'09Z Lv8‘E9E
T86T
O€ 78S ‘SL
8bE'9 9ET'6HZ
860 ‘TEE
O86T
SbuTTta
AeZK
AJay30 «=—ET
«(dey
‘adeyo "adeyd
‘qdeyo TeIOL
<AepueTepD
(T66T-O86T)
sbut{tta
esep
Aojdnzyueg
[TeIOL ‘Fy
STaeL
ae
1.3 JUSTIFICATION FOR RESEARCH
ae
_-~ A number of studies focusing on business failure have
validated the use of prediction models to identify the warning
“Signs of business failure. For example, when GTI (a Cc
\ i
1 manufacturer) was hovering on the edge of bankruptcy, the firm
was able to accomplish a turnaround with the help of a
corporate strategy designed by a predictive business failure
model (Altman, 1981). There is enough evidence (Platt, 1989;
Wight, 1985; White, 1984; Rutledge, 1985), however, to suggest
that prediction models for business failure are not
homogeneous across all industries, and the different
prediction models are the result of different characteristics
that are unique to specific industries. For example,
industries have different levels of business risk arising from
differences in demand variability, sales price variability,
input cost variability, ability to adjust output price for
changes in input costs, and operating leverage (Brigham &
Gapenski, 1990). |
~~ “In addition, although it has been suggested (Platt, 1989;
Wight, 1985; White, 1984; Rutledge, 1985) that each industry
needs its own business failure prediction model due to the
different characteristics that are unique to the industry, it
has not been shown empirically that the business failure
prediction model for one industry is significantly different
from a model for another. This means then that applying an
10
| aggregate business failure model, such as Altman's, to a
single industry may result in wrongly categorizing a failed
\¢irm as non-failed or vice-versa.
Further, this study will serve another need, that is, it
will attempt to resolve the controversy in the literature
regarding the relationship, or lack thereof, between
reorganization and liquidation. One school of thought
believes that different circumstances direct a firm's decision
to select reorganization or liquidation when facing financial
distress, and as a result, the two events are considered to be
independent (Haugen & Senbet, 1978;1988; Senbet & Seward,
1993). This means a firm experiencing a capital structure
problem may opt to reorganize without critically assessing its
ability to continue operating profitably. Similarly a firm
experiencing profitability problems may opt to liquidate
without regard to the opportunities that a change in capital
structure may offer.
The independent relationship also suggests that, in
estimating bankruptcy costs for reorganized firms, these
estimates cannot be based on lost profits (that is, how much
profits will decline as a result of reorganization). Rather
the estimates will have to be based on costs related to
Capital structure such as the increased cost of capital
resulting from reorganization. Therefore, proponents of this
school of thought consider the use of lost profits in
11
estimating indirect costs of reorganization to be
inappropriate [see Altman's (1984) study].
The opposing perspective regarding the relationship
between reorganization and liquidation believes that there are
similar factors which direct a firm's decision to reorganize
or liquidate. Indeed, some point to the fact that bankruptcy
data shows that more than two-thirds of firms filing for
reorganization eventually liquidate which suggests that many
of the reorganizing firms may not have been worth saving in
the first place (Altman, 1983; LoPucki, 1983). Therefore,
when a firm is facing the choice of reorganization versus
liquidation a common set of factors must be considered in that
decision. In this regard, Titman (1984) and Altman (1984)
suggest that the indirect bankruptcy costs for the reorganized
firms may be based on profitability (that is, how much the
firm would lose if reorganized) since reorganization and
liquidation are dependent on each other.
This study will provide a more comprehensive, and
empirical look at business failure compared to an earlier
study by Ventrice (1982), and further offer the first
empirical look at the relationship between reorganization and
liquidation in the restaurant industry.
12
1.4 PURPOSE OF THE STUDY
1.4.1 The Prediction Model for the Restaurant Industry
According to Dun and Bradstreet's business failure
reports, most business failures between 1984 and 1992,
compared to all other sectors, occurred in the retail and
services sector. Within the retail trade sector, the segment
consisting of eating and drinking establishments has
consistently had the most business failures of any single
segment between 1984 and 1992 (Dun & Bradstreet, 1984-1992).
In spite of the number of research studies (Beaver, 1967;
Altman, 1968; Deakin, 1972; Ohlson, 1980; Lincoln, 1984)
conducted to explain and predict business failure, research
focusing on the restaurant industry is very limited. One of
the reasons for this lack of research may be that some
researchers believe that inter-industry differences in
business failure are negligible. Another reason has been that
the criteria for sample selection for most of the studies tend
to be biased towards large firms. For example, the average
asset size of Altman, Haldeman & Narayanan's study (1977) was
approximately $100 million. Within that study, no firm had
| less than $20 million in assets. Many of the restaurant firms
| that have failed, however, do not have asset sizes that large.
Developing a business failure model that utilizes firms with
relatively smaller asset sizes is necessary because small
firms, as opposed to the large ones, tend to be more
13
| vulnerable to financial distress due to their size.
—_ Bettinger (1981) and others suggested that it is
“necessary to consider that a business failure predictive model
‘should reflect the unique nature of a given industry (Platt,
1989; Wight, 1985; White, 1984; Rutledge, 1985). Therefore
Altman's model (1977), which is the earliest and best known of
‘the prediction models for business failure in manufacturing
‘and/or retail sectors, is hardly universal for all industries.
‘This study will develop an appropriate and reliable business
failure model useful in predicting the occurrence of business
failure in the restaurant industry.
1.4.2 The Comparison of the Restaurant Model with the Hotel
Model
Since general business failure predictive studies may not
be universal for all industries, Altman (1973), Cleverly &
Nilsen (1980), and Olsen, Bellas & Kish (1983), respectively,
conducted business failure predictive studies for railroads,
hospital firms, and restaurant firms while simultaneously
taking into consideration characteristics of the types of
' firms being analyzed. In Altman's study, the profitability
and leverage ratios were found to be important predictors.
However, liquidity ratios were not important in distinguishing
between financially distressed and healthy firms in the
"railroad industry. In Cleverly & Nilsen's study, the
14
| a
financially distressed firms had unfavorable liquidity and
‘profitability ratios, little long-term debt, and favorable and
improving activity ratios in the hospital industry. Olsen et
al.'s study showed that liquidity ratios provided a 5 to 10
months advance warning and profitability ratios provided a 7
to 10 months advance warning of business failure in the
restaurant industry. Therefore, this study will compare the
hotel industry's business failure prediction model to the
restaurant industry's model in order to determine whether the
~.predictive model for the restaurant industry is unique.
The hotel industry is a major part of the hospitality
industry and has similar characteristics to the restaurant
-~ industry. Andrew (1984) indicated that several financial
characteristics set the hospitality industry apart from other
industries. These characteristics are lack of working
| Capital, high reliance on fixed assets, variability of \
operating cash flow, and seasonality of revenue. Given that
the hotel and restaurant industries have similar financial
characteristics, if the predictors of business failure for the
two industries are:different, then this will provide further
evidence to support the need for industry-specific failure
models.
15

1.4.3 The Relationship between Reorganization and Liquidation
According to the Administrative Office of the United
States Courts-Bankruptcy Division, there were 6,310,338
bankruptcy filings from 1980 to 1991. Liquidation and
reorganization, respectively, represented 70% and 4% of the
total bankruptcy filings for these years (Administrative
Office of the United States Courts-Bankruptcy Division, 1991).
When it is deemed that there is no hope for
rehabilitation or if prospects are so poor as to make it
unreasonable to invest further efforts, costs, and time, the
only remaining alternative is liquidation. Economically,
liquidation is justified when the value of the assets sold
individually exceeds the capitalization value of the assets in
the market place.
The reorganization procedure in bankruptcy is designed to
enable firms in temporary financial difficulty which are still
worth saving to continue operating while the claims of
creditors are settled using a collective procedure. A
drawback of this procedure is that sometimes firms that are
not worth saving from an economic efficiency standpoint may be
reorganized (Logue, 1990).
This study will provide empirical evidence regarding
reorganization and liquidation with respect to their
independence from or dependence on each other. The empirical
evidence of the relationship can facilitate a firm's decision
16
to reorganize or liquidate. That is, if the results of the
study show that there is no differences in the determinants of
liquidation versus reorganization, then firms can _ be
indifferent in their choice of bankruptcy type. Further, the
evidence can be used with respect to the controversial issue
of relevant indirect bankruptcy costs for the reorganized
firms.
In summary, the purposes of this study are three-fold:
1. To develop a predictive model for business failure which
can be a useful tool in helping researchers and industry
practitioners to identify warning signs of business failure in
the restaurant industry.
2. To determine whether the financial variables of a
prediction model for business failure in the restaurant
industry are unique when compared to the hotel industry.
3. To determine whether the financial variables that are
associated with reorganization are different from those that
are associated with liquidation in the restaurant industry.
17
1.5 RESEARCH QUESTIONS
Given that 1) the restaurant industry has consistently
had the most business failures within the retail sector from
1984 to 1992, 2) each industry needs its own prediction model
for business failure, and 3) there have been arguments with
respect to the relationship between reorganization and
liquidation, the following questions are of empirical
interest:
(2) Can business failure be predicted and which financial
“Variables can predict business failure in the restaurant
industry?
( 2) Are there differences in the financial variables which
‘predict business failure for the restaurant industry on one
hand and the hotel industry on the other? ’
3. Are the financial variables that Setérmine reorganization
different from those that determine liquidation in the
restaurant industry?
1.6 SIGNIFICANCE OF THE STUDY
-~ Previous studies provide empirical evidence that
characteristics of business failure can be determined and
examined. Furthermore these characteristics are unique to
| failed firms when compared to non-failed firms (Altman, 1968;
\ciroux & Wiggins, 1983; Flagg, Giroux & Wiggins, 1991). Platt
(1989) stated that each industry has different business
18
failure rate elasticities and these differences were shown to
be attributable to industry financial conditions. However,
many of the previous studies did not consider industry
differences, for firms from different industries were simply
aggregated for purposes of business failure prediction.
Although a few studies (Altman, 1973; Cleverly & Nilsen, 1980;
Ventrice, 1982; Olsen, Bellas & Kish, 1983) considered
industry differences, they did not show whether or not their
prediction models were applicable to the specific industry
only.
Also, some prior studies have provided the factors that
distinguish bankrupt firms that successfully reorganize from
those that liquidate (LoPucki, 1983; Casey, McGee & Stickney,
1986; Badden-Fuller, 1989; Schary, 1991). These factors were:
financial characteristics, strategy, age and type of the
business, geographic location, size and the existence of
creditor opposition to reorganization plan. However, there
has not been further investigation into whether, on the basis
of the financial factors determining them, reorganization and
liquidation can be explained by the same (dependence) or
different (independence) factors.
This study can provide additional information
complementary to the body of knowledge with respect to
business failure by investigating 1) what financial variables
determine business failure, 2) whether these financial
19

variables are different for the restaurant and _ hotel
industries, and 3) how capital structure and profitability
variables can play an important role in the decision to
reorganize or liquidate in the restaurant industry.
1.7 OUTLINE OF DISSERTATION
The following chapter will focus on a review of the
literature on business failure and the relationship between
reorganization and liquidation.
Chapter 3 will be devoted to the methodology to be used
for this study. Chapter 4 will cover the presentation and
discussion of the results of this study. Finally, Chapter 5
will highlight the conclusions of the study as well as any
attendant limitations.
20

CHAPTER 2
LITERATURE REVIEW ~ o\
2.1 REVIEW OF EMPIRICAL STUDIES ON BUSINESS FAILURE
ees
\ \
Business failure studies have taken one of two approaches
with regard to types of variables. One approach has been to
use accounting and financial ratios as predictors of business
failure. The other approach, which focuses more on the
process of failure, attempts to identify events in the firm's
pre-failure life which significantly explain the failure
phenomenon. This section will describe the two approaches.
(2.1.1 \Ratio Approach
Many of the studies employing accounting and financial
ratios (hereafter referred to as ratios) are designed to
explain and predict business failure by developing models
which classify firms as failed or non-failed. Beaver (1967),
who is considered to have pioneered the stream of research in
business failure, defined failure in a broad context. Failure
was defined in his study as a business defaulting on interest
payments on its debt, overdrawing its bank account, missing
preferred dividend payments, or declaring bankruptcy by filing
chapter 11 during the period of 1954-1964. / Fhe,
Of the 30 ratios examined in his study, he found six) to NS
be best in predicting business failure. They are net
income/total assets, net income/total debt, current plus long
21
term liabilities/total assets, working capital to total
assets, no-credit interval (the period which no credit is
offered from lenders) and current ratio. He was able to
accurately classify 78% ot the sample of firms from 38
industries five years before business failure. The analysis
conducted in his study was a univariate analysis, that is, it
examined the predictive ability of ratios, one at a time.
It is possible that a multivariate ratio analysis would
predict business failure even better than the single ratio
analysis because business failure is viewed as a complex
process which requires more than one variable to capture all
the facts of the firm. Consequently, several techniques have
been developed to study the phenomenon.
Altman (1968) is credited with the initial work in
establishing a multivariate firm bankruptcy model which helps
in determining and identifying manufacturing firms that may be
on the brink of failure. His study was based on a sample of
66 firms of which 33 were bankrupt and 33 were non-bankrupt
for the period of 1946-1965. The term failure was defined to Sa A Mec ta re a een Ht one
include only those firms which filed for chapter 11, and 22
ratios were tested in his study. His model is based on a
~~ multiple discriminant analysis (hereafter referred to as/ MDA) )
\ / e a a . i} . : <
“yencorporating the following five ratios: working capital/total
| assets, retained earnings/total assets, earnings before
interest and taxes/total assets, market value of equity/book
22

N
VN a nm s 9 \ “rie e
aot Q09%*
_value of total assets, and sales/total assets. A score is
subsequently derived that indicates whether a firm is
bankrupt, non-bankrupt or in a neutral category referred to as
the zone of ignorance. His model's predictive accuracy was
(95% )during the first year prior to failure and 36% in the
fifth year. | :
To develop an alternative to the Beaver (1967) and Altman
(1968) models, Deakin (1972) analyzed 32 firms that failed et en ng,
| ~ \ | between 1964 and 1970. The term failure ) was defined to
include only those firms which experienced financial
\ reorganization, insolvency, or were otherwise liquidated for
the benefit of creditors. /
/ A paired sample of non-failed firms was matched by
I industry classification. The MDA model consisting of Beaver's
14 ratios (1967) could accurately classify 85% of the sample
\ of firms five years before failure. Compared to Beaver's
» study (1967), this study consistently showed better results.
Mergers of competitors often violate antitrust laws. One
of the few possible defenses to a merger prosecution is the
Failing Company Doctrine. This defense can be invoked when
one of two merging firms is failing and the failing firm
receives no offer to merge from a firm with which a merger
would have been legal.
(sum) 978 constructed a failing firm model using( MDA \to \
aid in assessing the probability of business failure. He
23
\ i
a
defined /failurd in his study in accordance with the meaning Sa < a ar
“ en
the courts have given to it in the context of antitrust
defense. This analysis was applied to a paired sample of 115
failed and 115 non-failed firms in accordance to industry
classification for the period of 1954-1968. A 12 ratio model
with emphasis upon liquidity, profitability, and variability
(standard deviation) was developed. The firm model predicted
failed firms to fail and non-failed firms not to fail with an ms
accuracy of 93 to 95% jat_ the first year before failure. . wif
Predictive accuracy was 80% at the second year and was 70% at
“the third, fourth and fifth years before failure.
In order to jointly evaluate 1) the predictive power of
ratio information and 2) the ability of loan officers to
evaluate ratio information in a failure predictive framework,
Libby (1975) employed Deakin's sample and ratios.
Using Principal components analysis, he identified 5
independent sources of variation with the 14 ratios from
Deakin's (1972) sample. The 5 dimensions were labeled 1)
profitability, 2) activity, 3) liquidity, 4) asset balance,
and 5) cash position. Through analysis of the rotated factor
matrix, net income/total assets, current assets/sales, current
assets/current liabilities, current assets/total assets, and
cash/total assets were chosen respectively to represent the
five dimensions. The 5 dimensions set was only slightly less
accurate than the 14 ratio set for predicting failure. The 5
24
retail groups ,,
dimensions set predicted 51 and 43 correct out of 60
observations based upon sample and double cross-validation
respectively.
He used the five dimensions set for his experiment. The
usefulness of the information was judged on the basis of the
accuracy of the loan officers' predictions. Each firm
required the loan officers to classify the firm as a failure
or non-failure within three years of the statement date and
rate his/her confidence in his/her prediction on a three point
scale. As measured by the number of agreements on the fail-
not fail scale, interrater reliability ranged from 31 to 57
agreements out of 60 predictions and averaged 48 of 60.
This study illustrated the usefulness of principal
components analysis regarding the dimensionality of a data set
and showed that ratios enabled bankers to make highly accurate
and reliable predictions of business failure.
Altman, Haldeman & Narayanan (1977) employed poth (inear) en cos
and quadratic MDA jro construct, analyze and test a new Peal
bankruptcy classification model by incorporating 28 ratios.
Two samples of firms consisted of 53 bankrupt firms and 58
non-bankrupt firms for the period of 1969-1975., The latter
was matched to the failed group by industry classification.
This sample was divided almost equally into manufacturers and
The model consisted of seven ratios:.return of assets, ws ™
. a .
Stability of earnings, debt service, cumulative profitability,
iquidity, capitalization and size. This model outperformed R
“Altman's model (1968). The new model appeared to be quite
accurate for up to five years prior to failure with successful
classification of well over 90% of the sample one year and 70
% accuracy up to five years prior bankruptcy. The linear MDA
slightly outperformed the quadratic MDA.
Ohlson (1980) presented some empirical results of a study
and in turn predicted failure as evidenced by the event of
bankruptcy. The sample consisted of 105 bankrupt firms and
2,058 non-bankrupt industrial firms, excluding utilities,
transportation, and financial services, for the period of
1970-1976.
~- The( logistic )regression analysis was chosen to avoid a_ a:
| fairly well known problem associated with multiple | discriminant analysis, that is, the variance-covariance
| matrices of the predictors should be the same for both groups
| (failed and non-failed firms) } Models 1-3 composed of an
intercept and nine independent ratios; model 1 predicted
. bankruptcy within one year with classification accuracy of
96%, model 2 predicted bankruptcy within two years with
. Classification accuracy of 92%, given that the firm did not
fail within the subsequent years, and model 3 predicted
‘bankruptcy within one or two years with classification of 95%.
Dambolena & Khoury (1980) suggested that the standard
26
deviations of ratios over time appeared to be the strongest
measure of ratio stability, and the inclusion of the stability
of ratios improved the ability of the discriminant function to
predict failure.
They selected 19 ratios and computed each ratio's
Stability by standard deviation for both the bankrupt and the
non-bankrupt firms. The sample consisted of 68 firms which
were almost equally divided between retail and manufacturing
sectors for the period of 1969-1975. |
a The MDA model of best ratios correctly predicted 91% of
| the sample in the first year, 84% in the second year, 83% in
| the third year and 89% in the fourth year before bankruptcy.
| This model included the ratios of net profit/sales, net
profits/total assets, fixed assets/net worth, funded debt/net
working capital, total debt/total assets, the standard
deviation of inventory/net working capital, and standard
~ deviation of fixed assets/net worth.
Casey & Bartczak (1985) provide evidence as to whether
operating cash flow data can increase the accuracy of accrual
based MDA and logistic regression analysis models’ to
distinguish between bankrupt and non-bankrupt firms). Sixty
firms were selected that had petitioned for bankruptcy and a
sample of 230 non-failed firms was chosen during the period of
1971-1982. The non-failed firms were selected to match the
industrial classification of the failed firms.
27
The 6 accrual based ratios were cash/total assets,
current assets/total assets, current assets/current
liabilities, sales/current assets, net income/total assets,
and total liabilities/owners' equity in this study. The 3
cash flow ratios examined in this study were CFO (cash flow
from operation), CFO divided by current liabilities, and CFO
divided by total liabilities.
Since there were no differences between model 1 (6
accrual based ratios alone) and model 2 (6 accrual based
ratios and 3 cash flow ratios) for both MDA and logistic
regression analysis in terms of the accuracy of
classification, they concluded that operating cash flow data
did not provide incremental power over accrual based ratios.
The average of five year's classification accuracy
through MDA was 77% and 76% for model 1 and model 2,
respectively. The average of five year's classification
accuracy through logistic regression analysis was 83% and 84%
for model 1 and model 2, respectively. -
In their study, Frydman, Altman & Kao (1985) employed
recursive partitioning analysis which is a nonparametric
technique. One of the primary differences from MDA and
logistic regression analysis is the manner in which they
partition the dependent variable space into classification
regions. The recursive partitioning analysis classification
rule partitions dependent variable space, in general, into a
28
number of rectangular regions. The two group MDA or logistic
regression analysis, on the other hand, partitions dependent
variable space into only two half-plane regions (fail or non-
\ fail).
The sample of their study consisted of 58 bankrupt and
142 non-bankrupt manufacturing and retailing firms for the
period of 1971-1981. Of 20 ratios, there were six ratio
terminal nodes where firms were classified as either bankrupt
or non-bankrupt from the analysis of univariate splits. They
were cash flow/total debt, cash/total sales, total debt/total
assets, market value of equity/total capitalization, interest
coverage, and quick assets/total assets.
Coasts & Fant (1993) employed the neutral network tool.
This tool consisted of input layer, hidden node, and output
layer. The input layer was composed of pieces of ratios. The
output layer was composed of a single response or combination
node which reflects the situation's known outcome, health or
distressed firms.
Depending on the complexity of the pattern in the input
data there can be any number of hidden nodes. Each hidden
node is fully connected from all input nodes to all output
nodes. Training is the process of creating and installing new
hidden nodes until the residual forecast errors are eliminated
or made tolerable.
The sample of their study consisted of 94 distressed
29

firms which were defined by auditors' reports during the
period of 1970-1989. To serve aS counter examples to the
distressed firms, a group of 188 viable firms (two viable
firms for every one by industry classification) was chosen for
the same period. They used the same ratios found from
Altman's study (1968). Their model consistently correctly
predicted auditors' findings of distress at least,80% of the
time over an effective lead time of up to five years. —
oo
In summary, the previous studies provide empirical
evidence that characteristics of business failure can be
determined and examined through the use of accounting and
financial ratios. Furthermore, the studies show that these
characteristics are unique to failed firms when compared to
non-failed firms. Another summarizing observation, however,
is that these studies did not consider industry differences.
The samples of these studies consisted of aggregate
industries. Therefore it is not known whether the models from
these studies may be directly applicable to a single industry,
and whether the same ratios would be found useful in
_.predicting business failure in specific industries. —
—— Two studies have attempted to depart from the aggregate
| industries sample and subsequently focused on a few selected
industry groups. Edmister (1972) hypothesized that the
relative level of a borrower's ratio to the average ratio of
other small businesses in the same industry can be a predictor
30
lof small business’ failure. To test this hypothesis
empirically, ratios denoted as RMA (Robert Morris Associates)
relative were calculated by dividing the original ratios from
Robert Morris Associates' annual statement studies by average
ratios for firms in similar industries. SBA relative ratios
were likewise computed using Standard Industrial
Classification averages compiled from 45,000 statements
submitted by Small Business Administration borrowers.
MDA was employed to select a set of ratios. The sample
consisted of 48 borrowers who had three consecutive annual
statements available prior to the date when the loan was
granted, and contained an equal number of loss and non-loss
cases from the period of 1954-1969. .
He found seven out of nineteen ratios denoted as RMA or
SBA to be good predictors of small business failure. The
seven ratio model consisting of RMA and SBA relative ratios
correctly discriminated firms in 39 out of 42 cases. While
this study concentrated on small business failure, the
previous studies focused on predicting business failure of
medium and large asset size firms while ignoring small
businesses.
Lincoln's (1984) objective was to develop models from 39
ratios to measure the levels of insolvency risk for firms in
selected industry sectors. The ninety non-bankrupt firms
selected included 39 manufacturing, 19 retail, 20 property
31
and 12 finance firms, and they were compared to 41 bankrupt
firms for the period of 1969-1978.
Since the significance of ratios can vary from industry :
Ito industry, each MDA model for each industry sector showed a
different accuracy of classification and each model consisted
| ot different ratios. The average of 5 years of classification
| accuracy was 85, 93, 71, 73% for manufacturing, retail,
property, and finance, respectively.
Although both studies recognized the importance of
industry differences, very few studies have fully isolated an
industry from an SIC sector for analysis and prediction.
2.1.2 Events Approach
J The events approach to business failure is indeed an ex
etree:
f fpost facto research design which seeks not to predict
bankruptcy but to determine the characteristics of the failure een nate Se MCLEE pg OE ATE meer og eet SN ea
process. In this regard, this approach represents a departure
from the methodology adopted in prior research. The
underlying rationale for this approach is that prior to
bankruptcy (the most critical event of business failure), when
\ 2 firm is in financial distress, several actions are usually
‘taken by management to stave off this phenomenon.
These actions may not be captured by accounting and ae see nen NT Har te mT npn eee pee eer ge nuance sn nent A OTT A a 5
financial ratios as indicated by Johnson (1970). He argued a pena RN NI
that accounting and financial ratios do not’ contain
32 35
information about underlying economic factors and decision
processes such as management reorganization, mergers, and
deferral of payments.
Giroux & Wiggins (1983) suggested that there may be
specific events that occur before bankruptcy, not captured by
accounting and financial ratios, that may help explain why
Many apparent bankruptcy candidates are able to avoid
bankruptcy court.
They described the failure process and demonstrated it
using two well known bankruptcies: W.T. Grant and Interstate
Stores. The first signal of financial problems for W.T. Grant
was negative cash flows from beginning in 1966. W.T. Grant
first reported a net loss in 1972. The next failure event for
W.T. Grant occurred in 1973 when Standard and Poors
acknowledged W.T. Grant's financial problems by down-grading
its rating of W.T. Grant's debt instruments. Afterward, W.T.
Grant faced several events, such as reduction and elimination
of dividend, debt accommodation, and management
reorganization. W.T. Grant filed for chapter 11 in 1975 and
eventually liquidated in 1976.
Interstate Stores faced similar events before filing for
chapter 11 in 1974 and eventually successfully reorganized in
1978. In each case, the entire process lasted about a decade
and each firm exhibited the same basic events’ before
bankruptcy.
33

Giroux & Wiggins (1984) extended their 1983 study. They
developed a failure process model that established an
analytical framework for evaluating the financial
deterioration of failing firms. The primary objective of this
study was to determine the usefulness of the events approach
in discriminating between bankrupt and non-bankrupt firms by
showing that certain economic events are unique to bankrupt
firms but not to non-bankrupt ones. A sample of firms that
declared bankruptcy during the period of 1970-1980 was
selected. A matching sample of comparable non-bankrupt
industrial firms was selected for the same period.
Seven events-net losses, dividend reduction/elimination,
bond rating downgrading, discontinued operations, management
reorganization, debt accommodation, and loan default-were
identified as potential significant failure events from their
previous study.
The timing sequence revealed that: 1) debt accommodation,
discontinued operation and downgrading of bonds typically
occurred in the year of bankruptcy; 2) loan defaults and
Management reorganizations tended to occur either in the year
of bankruptcy or in the year preceding bankruptcy; and 3) net
losses most often began one or two years before the year of
bankruptcy. Nonetheless, the authors indicated there was so
much variation in the timing pattern of events for all the
bankrupt firms that a recurring pattern was difficult to
34

discern.
Four of the events were tested to determine if there were
statistical differences between the number of surviving firms
and the number of bankrupt firms reporting net losses, debt
accommodations, loan defaults, and discontinued operations.
No tests were run on other events because they were rarely
reported events. Chi-Square tests indicated statistically
significant differences (at the 0.001 level) for the first
three events such as net losses, debt accommodations and loan
default.
In summary, the events approach is a viable alternative
approach for business failure. However, it has not been used
widely due to lack of predictive power. The preceding studies
did not consider industry differences therefore did not
capture the events which may be unique to an industry.
2.1.3 Combination of ratio and events approach
Argenti (1976) argued that non-financial symptoms may be
needed to achieve a reasonable level of prediction accuracy.
The major objective of Keasey & Watson (1987) was to determine
whether a model utilizing a number of non-financial variables,
either alone or in conjunction with accounting and financial
ratios, is able to predict business failure more accurately
than models based solely upon accounting and financial ratios.
The unit of analysis of this study was based on firms
35
that were independently owned with a single plant and located
in the Northeast of England. A sample of 73 failed firms and
73 non- failed firms was constructed by industry
classification for the period of 1970 to 1983. They used 28
accounting and financial ratios and 18 non-financial
variables. Logistic regression analysis was employed for the
models.
Models 1, 2, and 3 were constructed using accounting and
financial ratios only, non-financial variables only, and both
accounting and financial ratios and non-financial variables,
respectively. Model 1 (consisting of 5 accounting and
financial ratios), model 2 (consisting of 5 non-financial
variables), and model 3 (consisting of 4 accounting and
financial ratios and 3 non-financial variables), respectively,
had 55, 65, and 65% classification accuracy 3 years prior to
business failure.
Flagg, Giroux & Wiggins (1991) combined the postulated
events with accounting and financial ratios in a single model
so as to predict which failing firms would ultimately go into
bankruptcy. A firm is considered to have entered the failure
process if it had an initial net operating loss following at
least three consecutive years of profitability (net income
greater than zero) for the period of 1975-1981. The sample in
their study consisted of 202 failing firms in total, excluding
utility, transportation, and financial service industries. Of
36
Q these 26 (13%) went bankrupt and 176 (87%) survived over the
five year examination period.
Four events and six accounting and financial ratios were
investigated through logistic regression analysis. This
model, which consisted of 2 events and 4 accounting and
financial ratios, correctly classified 94% of the sample as
bankrupt or non-bankrupt. In summary, although the previous
studies proposed a model based on both failure events and
accounting and financial ratios, these studies did not
consider industry differences.
The following section will focus on industry differences
and explore the notion that contemporary business failure
studies should focus more on firms in a specific industry in
order to provide additional information complementary to the
body of knowledge accumulated through cross-sectional and
aggregate industries studies.
“2.2)mwwoseey rrmwcral CHARACTERISTICS AND THEIR INFLUENCES ON
pee
T
BUSINESS FAILURE
Platt (1989) suggested that industry failure rates were heen ereeeerenranalt
related to differences in industry financial conditions and
SRSA rate etatneeninn Rammer nN EL Are tn ny ce mae A EAR Oa AT remeron
that each industry has different failure rate elasticities an eee
_oee ne ae ones we
with respect to financial conditions. Financial conditions ~ ee penn nent Ment a PEE ence
- such as working capital, capital structure, profitability,
“asset structure, systematic risk and leveraged buyout will be
3 7 —{> ones
| reviewed with respect to industry differences and their
~influences on business failure.
2.2.1 Working Capital
Working capital is funds invested in a firm's cash,
accounts receivable, inventory, and other current assets.
Working capital management is concerned with the problems that
arise in attempting to manage current assets, current
liabilities, as well as the inter-relationships between them.
Working capital investment and policies tend to vary with the
type of industry. After examining a sample of 1,881 firms
from 36 industries over a period of 19 years (1960-1979),
Hawawini, et.al. (1986) concluded that 1) there was indeed a
Significant and persistent industry effect on a firm's
investment in working capital which was measured by the
working capital/sales ratio and 2) firms adhered to definite
industry benchmarks when setting their working capital
investment policies.
Clifton-Steele (1985) argued that one of the major causes
of business failure is insufficient attention to the
requirements of working capital management. Excessive
investment in non-productive working capital sacrifices the
potential for maximizing return from productive investments
(Wight, 1985). Furthermore, too little working capital leads
to an inability to pay current liabilities (Sprague and
38
Bellows, 1975; Clark & Newman, 1986).
2.2.2 Capital Structure
Capital structure has been widely debated in finance
literature. In their pathbreaking paper, Modigliani & Miller
(1958) suggested that in a world without taxes, both the value
of a firm and its overall cost of capital are unaffected by
its capital structure. They argued, however, in a world with
corporate taxes, financial leverage does determine firm value
and cost of capital (Modigliani & Miller, 1963). Kane, Marcus
& McDonald (1985) showed that a meaningful measure of the
advantage of debt use is the extra rate of return, net of a
market premium for bankruptcy risk, earned by a leveraged firm
relative to an otherwise-identical unleveraged firm.
Miller and Modigliani also recognized the need for the
firm to maintain a substantial reserve on untapped borrowing
power in order to provide it with some flexibility since over-
leveraging tended to reduce the firm's options in capital
structure decisions. One of the effects of over-leveraging is
that larger fixed interest charges from the greater use of
debt financing leads to a high probability that a decline in
the firm's earnings will cause financial distress. Thus
capital structure decisions can contribute to the risk of
bankruptcy.
Having recognized the benefits and pitfalls of leverage
39
to a firm in the preceding discussion, it is important to note
that the pattern of capital structure tends to be more
identical within industries and less identical across
industries. Earlier on Donaldson (1957) had assumed the
existence of relatively standard industry debt ratios. The
reasoning behind this assumption was based on the idea that an
important determinant of the ability of a firm tg carry debt
is the stability of its operating earnings. Firms in the same
industry presumably face similar supply and demand conditions
and similar technology. It seems reasonable to suppose that
equally competent managers facing similar circumstances would
arrive at roughly similar judgements as to the prudent amount
of debt appropriate to that set of conditions (Cherry &
Spradley, 1990). Therefore, it would appear unwise to
disregard industry classification in capital structure
analysis or in the analysis of incidence and prediction of
business failure.
Previous empirical studies supported the finding that the
pattern of capital structure of a firm within a given industry
classification differs significantly from the pattern of
Capital structure of a firm belonging to another industry
classification. These studies also suggested that firms
within a given industry classification develop the pattern of
Capital structure that are optimal for their operational risk
and asset structure (Schwartz & Arsonson, 1967; Scott, 1972;
40
Scott & Martin, 1975; Bowen, Daley & Huber, 1982; Martin &
Henderson, 1984).
The pattern of capital structure was measured in these
Studies by such ratios as equity/total capitalization, long
term debt/equity, times-interest earned and equity ratios
through parametric and/or nonparametric techniques for the
various periods.
2.2.3 Profitability
Profitability is one of the most important factors that
can cause business failure. Such terms as economic failure,
technical insolvency, and bankruptcy can be explained by
profitability.
With regard to bankruptcy, past or future profitability
can impact such exit modes as reorganization and liquidation.
White (1984) suggested that firms expected to operate in the
near future should be able to generate funds internally in
order to successfully emerge from bankruptcy.
On the other hand, Casey, McGee & Stickney (1986)
indicated past profitability (the retained earnings/total
assets ratio) as well as the change in total assets and the
free assets (assets not secured) as discriminators between
successful reorganization and liquidation. Whether it
concerns past or future profitability, these studies showed
that profitability is an important factor for the exit modes
41
of bankruptcy.
Profitability patterns are not identical across
industries. Kessides (1990) indicated that industry effect
was statistically significant and quantitatively important,
and it accounted for a significant portion of the variance in
business unit profit margins of 1,775 business units operated
by 456 firms in 242 industries listed in the 1975 Federal |
Trade Commission Line of Business Data. A similar result was
found by Amato & Wider (1990). They showed that the industry
effect emerged as the dominant effect in explaining variation
in profitability, measured by return on assets, through 256
consistent observations in 40 industries from the Internal
Revenue Service Sourcebook of Corporate Statistics of Income
for the years 1966 and 1975.
2.2.4 Asset Structure: Fixed Asset
Fixed assets consist of 1) land and buildings, 2) plant
and machinery, 3) fixtures, fittings and equipment, and 4)
payments on account and assets in the course of construction.
These assets are associated with production and marketing
methods used by firms.
Production process and marketing methods are not
identical across industries. Therefore the pattern of fixed
assets is different from industry to industry. For example,
on average, production processes in primary goods industries
42
tend to be more capital intensive than those found in
secondary goods industries. Therefore primary goods
industries probably have a higher concentration in fixed
assets than do secondary goods industries (Rudolph, 1979).
Rudolph (1979) investigated asset structures for 311
firms during the period of 1964-1974. These firms were
divided into primary and secondary goods industries. The
results showed that primary goods industries were in the upper
extreme in the ownership of fixed assets while the secondary
goods industries were in the lower extreme, as measured by
fixed assets/total assets ratio.
The probability of business failure is higher if firms
which used internal and/or external financing, either go on
Capital spending binges in managing their fixed assets or
allow their fixed assets to become obsolete (McKinlay, 1979).
Debts taken on to acquire these assets must be repaid.
Eventually, these debts can come into line with these asset
values. This likely will be accomplished through write-offs,
bankruptcies, and rescheduling (Rutledge, 1985).
2.2.5 Systematic Risk
Systematic risk, also known as market risk, is common to
all securities and cannot be eliminated by diversification.
The measure of systematic risk for stocks is the beta
coefficient (hereafter referred to as beta).
43
It can be suggested that consideration be given to
industry differences in a effort to explain differences ina
firm's systematic risk. Fabozzi & Francis (1979) showed that
Significant industry effect could either increase or decrease
the systematic risk of stocks in any particular industry.
They also showed that holding the industry effect
constant enabled more exact and meaningful measurements to be
made for the determinants of systematic risk such as leverage
and earnings variance through the sample of 1,218 firms in 24
different industries.
Several studies have been conducted with respect to beta.
Beaver, Kettler & Scholes et.al. (1970) showed that betas for
a given period could be predicted by using a few financial
ratios, such as dividend payout ratio, a financial leverage
ratio, and an earnings variance measure, more accurately than
they could by simply using the preceding period's beta as a
predictor.
Hamada (1972) analyzed corporate financial structures and
showed evidence that leverage should exert a positive
influence on betas. Therefore beta captures some information
such as financial leverage and earning variance which can be
causes of business failure.
Market data such as systematic risk can provide a
Satisfying theoretical basis for analyzing corporate
bankruptcy in that investors' expectation should be reflected
44
in market risk-return measures (Aharony, 1980).
Castagna & Matolcsy (1981) suggested that failed firms
have a higher systematic risk than the apriori value of one,
and that the market on average adjusts the prices of failed
firms upwards prior to failure occurring. Ro, Zavgren & Hsieh
(1992) also suggested that the systematic risk of failing
firms is much higher than that of healthy firms and continues
to increase prior to bankruptcy. These studies indicated a
positive relationship between systematic risk and business
failure.
2.2.6 Leveraged Buyout
Leveraged buyout (hereafter referred to as LBO) is a
financial mechanism to take over a firm using borrowed funds.
Most often, the target firm's assets serve as security for the
loan taken out by the acquiring firm which repays the loans
out of the cash flow of the acquired company. Management may
use this technique to retain control by converting a firm from
public to private. A limited number of investors own the
stock of a privately held firm, and public shareholders
receive a premium over the current market value for their
shares (Cooke, 1988).
LBO, also called management buyout, can be motivated by
the presence of divisions that no longer fit the corporate
Strategies and have lower productivity. Therefore parent
45
companies may decide to divest resources by spinning off these
unwanted divisions (Moncarz, 1985).
Some industries may be more likely to have LBOs than
others due to the differences in growth rates, free cash flow,
debt capacity, and returns, and firms with management or
operating inefficiency are more likely to have LBOs than
others in the same industry. Consequently, some industries
and some firms with inefficiencies may tend to employ LBOs to
prevent business failure. Theoretical factors for explaining
the motivations for taking a firm private can be grouped under
two competing hypothesis. The first, the firm specific
effects hypothesis, states that firm-specific characteristics,
such as management or operating inefficiency, are the primary
motivation for taking a firm private. The second, called the
industry effect hypothesis, states that factors in common to
the firm's industry are the primary motivation for taking a
firm private (Ambrose & Winters, 1992).
They found weak evidence to support the industry effect
hypothesis, for only statistically weak nonparametric tests
supported this hypothesis. They concluded that firm specific
factors were the primary motivating forces for most LBOs. The
industry in which a firm operates is the secondary factor
contributing to whether a firm becomes the target of a LBO.
The sample used in this study consisted of 263 successful
going-private LBO transactions in 62 industries from 1980
46
through 1987.
The industry effect hypothesis suggests that certain
industries are more likely to have LBO activity. For there to
be a concentration of LBOs in an industry, most firms in the
industry must generate enough cash flow above their needs to
service the debt used in the LBOs. Jensen (1989) pointed out
that some of the best examples of this occurred in the oil,
tire, and tobacco industries. Lehn, Netter & Poulsen (1990)
supported the industry effect hypothesis and reported that
LBOs occurred for firms in industries that are faced with
slower growth prospects and lower research and development
expenses.
Shrieves & Stevens (1979) suggested a bankruptcy
avoidance rationale for mergers and acquisitions, that is,
target firms tend to be near bankruptcy at the time they were
acquired.
The whole emphasis of LBO, or management buyout, is on
Management involvement and motivation since owner-managers
stand to benefit the most. As a result, they become more
committed and generate increased productivity for the firm.
Therefore firms may prevent possible business failure with an
increase in productivity. There has been much study of
corporate control activity, and, although the results of such
studies have not been uniform, the evidence indicates control
transactions generate value for shareholders. The evidence
47
also suggests that this value comes from real increases in
productivity. LBOs are an interesting example of control
transfers that highlight the effect of changes in organization
form and incentives on productivity (Jensen, 1989).
In summary, many previous studies not only suggested that
the industry effect is an important determinant of some
financial characteristics such as working capital, capital
Structure, profitability, asset structure, systematic risk,
and leveraged buyout but also indicated that these financial
characteristics are related to business failure phenomena. In
the next section, studies on business failure in the
restaurant and hotel industries is reviewed.
2.3 paveme OF BUSINESS FAILURE IN THE RESTAURANT AND HOTEL
INDUSTRIES
ao The restaurant and hotel industries entered the 1990s |
with a series of challenges that threaten the survival of a
Significant number of firms. Although in some cases,
occurrences beyond human control have made some business
failures inevitable, the pursuit of knowledge about: business
failure has been worthwhile. In this section studies about
cect n
ena
eens tne AA
business failure in the restaurant and hotel industries will
be reviewed. These studies would be classified as ratio and
events approach studies.
48
bs. ‘2.3.1 Ratio Approach \ _ es
The purpose of Olsen, Bellas & Kish's study (1983) was to
describe some of the approaches to developing an early warning
system for business failure and present evidence to support
the use of several key warning signals developed for the
restaurant industry. This study was the first attempt to test
the applicability of business failure prediction studies
through ratio approach in the restaurant industry.
A failure was defined as a restaurant which for six
consecutive months had a cumulative negative cash flow. This
study concentrated on three multi-unit food service
organizations: a franchised steak house concept ; a multi-unit,
multi-concept full service restaurant chain; and a franchised,
limited menu, medium priced regional chain. A total of 19
restaurant units from the three organizations provided data
for the analysis. Of the 19, 12 were considered non-failed
while 7 were considered failed.
12 ratios were obtained for both the failed and non-
failed firms within each restaurant organization and the
differences were compared over the time periods prior to
failure. From this comparison the ratios which demonstrated
large differences between the pairings of failed and non-
failed firms were considered the most useful indicators. The
time period of their effective usefulness was demonstrated in
! this study.
Ratios such as current asset/current liabilities, working
capital/total assets, earnings before interest and taxes/total
assets, earnings before interest and taxes/revenues, total
assets/revenue, and working capital/revenue appeared to be the
most useful indicators for predicting failure. The liquidity
ratios provided 5 and 10 months advance warning, but the
profitability ratios provided a longer lead time (7-18 months
advance warning). Only one asset utilization ratio, working
Capital to revenue, appeared to have predictive capabilities
(6-9 months advance warning) as good as liquidity ratios.
Liquidity is an overriding concern for hotel firms. The
firms that prosper in the present environment will likely be
those that have made the most of their financial resources
(Swanson, 1991). Swanson investigated the liquidity measure,
Emery's Lambda, in order to provide financial managers and
other stakeholders a way of analyzing their firm's financial
performance. Emery's Lambda is defined as the sum of the
initial liquid reserve plus the total anticipated cash flow
divided by the uncertainty about net cash flow. Initial
liquid reserve is all sources of liquidity, such as cash,
marketable securities, and lines of credit. The uncertainty
factor is measured by the standard deviation of net cash
flows. Emery's Lambda can be considered a measure of a firm's
ability to bring all resources to bear on unexpected demands
for cash. The higher the value of Lambda, the more able a
50
firm is to meet such demands for liquidity and the less likely
the firm is to experience temporary insolvency.
Six firms, Divi, Hilton, Holiday, Marriott, Motel 6, and
Prime Motor Inns were selected for Swanson's study. Each firm
was analyzed using Emery's Lambda in order to show how
effective this measure was in determining each firm's health.
Among six firms, Divi and Prime Motor Inns showed lower
Emery's Lambda than others. He suggested that the traditional
measure of liquidity cannot assign probability to the
likelihood of insolvency, but indeed Emery's Lambda can be
employed to investigate liquidity positions of firms with a
high degree of confidence for the likelihood of business
failure.
2.3.2 Events Approach
Tavlin, Moncarz & Dumont (1989) examined several firms in
the restaurant industry that had experienced varying degrees
of financial success in order to investigate the reasons for
business failure. Some events from the business failure
process that were common within all the firms examined can be
deduced from this study as the selected firms approached
business failure. Some of these events are operating losses,
realignment charge for the disposition of unprofitable company
owned units, couponing or discounting, costly lease-purchase
arrangements, exchange of both common and preferred stock for
51
reduction in long term debt and interest expenses, and
leveraged buyout.
Kwansa & Parsa (1990) used the events approach to
identify and present a series of events which characterize the
business failure process in the restaurant industry.
Publicly-traded firms were selected for this study. An
initial sample of 12 bankrupt firms was obtained from the Wall
Street Journal Index, New York Times Index and Trade Journals.
Further, a control sample of non-bankrupt firms was also
selected from the same sources between the period 1970-1988.
All bankrupt firms were analyzed for the occurrence of failure
events with a focus on the two years preceding the actual
bankruptcy filing. The sample of bankrupt firms was compared
to the non-bankrupt sample to determine if the failure events
identified were unique to the bankrupt firms. Seven failure
events which were identified as significant in Giroux &
Wiggins's study (1984) were used in this study. In addition
to these events, 6 other events which had been previously
identified in a study by Tavlin, Moncarz & Dumont (1989) were
included.
seven events from the above study appeared to be unique
in the bankrupt process of the restaurant firms examined.
These were net losses, management turnover, loan default,
royalty default, credit accommodation, decline in unit sales,
and renegotiation of franchise contract. All these events
52
observed in the bankrupt firms occurred within two years of
their filing for bankruptcy. They suggested that some of the
events observed, such as royalty default, renegotiation of
franchise contract, and decline in unit sales, are
characteristic of industries in which franchising exists.
Business failure events in the hotel industry was
examined by Moncarz (1992). She focused on Prime Motor Inns'
(hereafter referred to as Prime) initial success and the
principal causes of its failure which resulted in the filing
of protection from creditors in Federal Bankruptcy Court.
The first event occurring two years prior to bankruptcy was
the decline in quality of earnings. Prime's unusual gains
resulted from transactions involving the sale of hotels, and
interest income. However, per share income from its basic
business of lodging, food and beverage, and hotel franchise
was declining. The next event was divestiture of unprofitable
units. Prime signed an agreement to sell 65% of Howard
Johnson and Ramada to Blackstone Capital Partners. Prime also
extended FCD Hospitality Company's loan repayment dates.
Finally Prime attempted to restructure its debt while
preparing to file for bankruptcy.
In summary, the challenge of the last two decades was
managing and financing rapid, unsustainable growth in
restaurant and hotel industries. The 1990s will likely be a
decade of effective survival management requiring careful
53
monitoring of businesses to identify and recognize the warning
Signals of business failure.
The previous researchers in the restaurant and hotel
industries believed that the warning signals of possible
business failure could be detected much earlier through ratio
analysis or events approach. Although these techniques exist
many restaurant and hotel firms continue to be threatened by
bankruptcy. Therefore the investigation of factors which
determine the decision to reorganize or liquidate is as
critical as the identification of early warning signals for
business failure. The next section will review reorganization
and liquidation.
2.4 REORGANIZATION AND LIQUIDATION
Only 30 percent of publicly-traded bankrupt firms
successfully reorganize (Altman, 1983; LoPucki, 1983).
LoPucki (1983) presented empirical evidence showing that the
success rate of firms entering reorganization since the new
Bankruptcy Code became effective in October 1979 was lower
than it was ten years before.
Several studies have been conducted to explain the
diminishing success rate by identifying the factors that
distinguish bankrupt firms that successfully reorganize from
those that liquidate. The purpose of these studies (LoPucki,
1983; Casey, McGee & Stickney, 1986; Badden-Fuller, 1989;
54
Schary, 1991) has been to identify factors which contribute to
a firm's selection of bankruptcy type. The factors employed
in these studies can be categorized as financial
characteristics, strategy, age and type of the business,
geographic location, size, and the existence of creditor
opposition to reorganization plan.
However, these studies did not investigate whether the
relationship between reorganization and liquidation is
dependent on each other or independent of each other.
Bankruptcy attorneys estimate that perhaps 8 out of 10 firms
that file for reorganization wind up being liquidated
(Chatterjee & Scott, 1989). Therefore, it can be suggested
that there is a progressional relationship between the process
of reorganization and liquidation. This is an important issue
because the existence of such a relationship would not only
contribute to the decision concerning reorganization or
liquidation from the point of view of financial factors but
also to the controversial issue of relevant bankruptcy costs.
This section will review the relationship between
reorganization and liquidation followed by bankruptcy costs.
55
2.4.1 Independence of reorganization and liquidation
Reorganization occurs when fixed obligations cannot be
met. In this case there is a formal reorganization of the
capital structure of the firm through court action in order to
avoid transfer of ownership. Liquidation occurs when the
market value of the dismantled assets exceeds their value as
a reorganized, on-going firm (Haugen & Senbet, 1978; 1988).
Haugen and Senbet suggest that liquidation, unlike
reorganization, should be viewed as a capital budgeting
decision and as such should be independent of the manner in
which the firm is’ financed. Therefore liquidation and
reorganization are separate, independent events. An
unprofitable firm may be liquidated even if it has no debt in
its capital structure.
There is no necessary linkage between reorganization
(financial distress due to capital structure) and a firm's
operating profitability (economic distress). It is tempting
to point to new stories of distressed firms as evidence of a
causal relationship between impending reorganization and a
deterioration in profitability or decrease in product demand
(Senbet & Seward, 1993). The crucial consideration is whether
an identical but otherwise non-distressed firm (due to lower
financial leverage) would face a similar deterioration in its
performance. It can be suggested that there is a distinction
between reorganization and liquidation (economic distress due
56
to profitability) (Senbet & Seward, 1993).
In summary, reorganization can be determined by capital
structure (how the firm is financed), whereas liquidation can
be determined by profitability (how well the firm is
operated) . Therefore reorganization and liquidation are
independent of each other.
2.4.2 Dependence of Reorganization and Liquidation
White (1984) and Casey, McGee & Stickney (1986) indicated
that there were differences between successful reorganizers
and liquidators. Their models incorporated capital structure
variables, indicated by free assets (these are non-
collaterized tangible assets and tend to decrease as a firm
increases its debt level), and profitability variables, which
are indicated by net income and retained earnings divided by
total assets. These two studies suggested that capital
structure and profitability variables were important
discriminators between successful reorganizers and
liquidators.
Titman (1984) suggested 1) that a firm's’ capital
structure determines the future liquidation decision and 2)
that this, in turn, affects the manner in which the firm
conducts business with its customers, workers, and suppliers.
An increase in a firm's debt level, which increases its
possibility of reorganization, may thus worsen the terms of
57
trade with the external environment resulting in an increased
probability of liquidation.
From these studies it may be concluded that liquidation
can be determined by capital structure and profitability
together. Several studies (Bulow, 1978; Shapiro & Peitzman,
1984; Morris, 1986) have suggested many variables to be
considered in a firm's decision to reorganize. The common
variables suggested in these studies were capital structure
and profitability.
In summary, the decision to reorganize or liquidate is
inter-related with respect to capital structure = and
profitability, and, therefore, reorganization and liquidation
decisions are dependent on each other.
2.4.3 Bankruptcy Costs
Bankruptcy costs are both direct and indirect. Direct
costs encompass legal and administrative fees which include
the cost of lawyers, accountants, and other professionals
involved in the bankruptcy filing. There is little
controversy with respect to the measurement of direct
bankruptcy costs because those costs tend not to be
Significant.
A study of railroad bankruptcies between 1933 and 1935 by
Warner (1977) provided evidence of the magnitude of direct
costs. He found that these costs averaged about four percent
58
of the firm's aggregate market value measured just prior to
declaring reorganization. He noted that direct costs of this
Magnitude were unlikely to affect the pricing of debt claims
and optimality of capital structure at the time of debt
issuance.
Weiss (1990) also indicated that direct costs had
virtually no impact on the pricing of claims and capital
Structure prior to bankruptcy. He found that direct costs
averaged 3.1 percent of the book value of debt plus the market
value of equity within a sample of 35 reorganized and 2
liquidated firms from various industries between 1979 and
1986. Ang, Chua & McConnell (1982) showed similar results in
their study which found that direct costs averaged 7.5 percent
of the liquidated value of the firm. fThus, they concluded
that the direct costs appeared to be insufficient relative to
the alleged tax advantage of debt within the Modglinai and
Miller tax model used to explain observed capital structure.
The sample consisted of 55 liquidated firms from various
industries for the period of 1963-1978.
These studies suggest that direct costs are unlikely to
represent a significant determinant of capital structure
decisions within reorganized and/or liquidated samples.
Both direct and indirect costs should be considered in
order to measure the significance of the magnitude of
bankruptcy costs (Stone, 1977). Potentially more significant
59
and substantial are the indirect costs (Chatterjee & Scott,
1989).
The indirect costs are opportunity costs which include
lost sales, increased operating costs, and a reduction in the
firm's competitiveness (Davis, 1992).
Altman (1984) measured the indirect costs as the
differences between the earnings realized in each of the three
years prior to the firm's reorganization and the earnings that
could have been expected at the beginning of each of those
years.
He found that, on average, indirect costs ranged from 11
percent to 17 percent of the firm value up to three years
before reorganization within the sample consisting of 19
industrial firms over the period of 1970-1978. He concluded
that the present value of expected bankruptcy costs for many
of the reorganized firms were found to exceed the present
value of tax benefits derived from leverage. These
conclusions implied that 1) the firms were over-leveraged and
2) a potentially important ingredient in the discussion of
optimal capital structure was indeed the bankruptcy cost
factor.
Haugen & Senbet (1988) criticized Altman's procedure
(1984) because his study had confused the indirect costs of
liquidation with the indirect costs associated with
reorganization. As an example, they illustrated that when a
60
firm is confronted with the introduction of a dominant product
by a competing firm, the event has an adverse impact on the
realized earnings through reductions in sales and increase in
costs. This, in turn, suggests that Altman's procedure (1984)
measured such negative deviations as part of indirect
bankruptcy-reorganization costs. When they were, in fact,
unrelated to the way the firm is financed.
Titman (1984) suggested that liquidation costs have
important implications, which are related to the theory of
Capital structure. An increase in a firm debt level, which
increases its probability of reorganization, will thus worsen
the terms of trade to reflect the increased probability of
liquidation as the firm does business with its customers,
workers, and suppliers. The less favorable terms of trade are
a cost of debt financing which is relevant to the firm's
Capital structure.
In summary, the controversy surrounding relevant indirect
bankruptcy costs results from the relationship of
reorganization and liquidation. If reorganization and
liquidation are dependent on each other, the indirect
bankruptcy costs for the reorganized firms may not be
confounded with liquidation costs. In other words, the
indirect costs for the reorganized firms cannot be based on
profitability (how much the firm would lose if reorganized)
which is the determinant of liquidation. If reorganization
61
and liquidation are dependent on each other, the indirect
bankruptcy costs for the reorganized firms may be based on
profitability (how much the firm would lose if reorganized) .
2.5 SUMMARY
The previous studies provide empirical evidence
illustrating that chara&éteristics of business failure can be
determined and examined through ratio, events and the
combination of ratio and events approach (Altman, 1968; Giroux
& Wiggins, 1984; Flagg, Giroux & wiggins, 1991). Table 5
provides the summary of business failure studies using ratio
approach. However, most of these studies did not consider
industry differences. Therefore it is not known whether the
models from these studies may be directly applicable to a
Single industry.
Many previous stydies not only suggested that the
industry effect is an important determinant of some financial
characteristics such as working capital, capital structure,
profitability, asset structure, systematic risk, and leveraged
buyout but also indicated that these financial characteristics
are related to business failure phenomena (Platt, 1989; Wight,
1985; White, 1984, Casey, McGee & Stickney, 1986). Therefore
it can be suggested that contemporary business failure studies
focus more on firms in a single industry in order to provide
additional information @omplementary to the body of knowledge
62
accumulated through cross-sectional and aggregate industries
studies.
Although business failure can be predicted by the early
warning Signs, some firms still eventually file for
bankruptcy. Bankruptcy is the most critical type of business
failure, and the most well known types of bankruptcy are
liquidation (chapter 7) and reorganization (chapter 11).
However, there have been arguments regarding the relationship
between liquidation and reorganization.
One group of authors believes that reorganization and
liquidation are independent of each other, that is,
reorganization and liquidation can be determined respectively
by capital structure and profitability (Haugen & Senbet,
1978;1988; Senbet & Seward, 1993). Another group believes
that reorganization and liquidation are dependent on each
other, that is, reorganization and liquidation can be
determined by both capital structure and profitability (Bulow,
1978, Shapiro & Peitzman, 1984; Titman, 1984; White, 1984;
Morris, 1986; Casey, McGee & Stickney, 1986).
If reorganization and liquidation are independent of each
other, the indirect bankruptcy costs for the reorganized firms
may not be confounded with liquidation costs (Haugen & Senbet,
1978; Senbet & Seward, 1993). However, if reorganization and
liquidation are dependent on each other, the indirect
bankruptcy costs for the reorganized firms may be based on
63
profitability (Titman, 1984).
The investigation of these relationships would not only
contribute to the decision concerning reorganization or
liquidation from the point of view based on financial factors
but also to the controversial issue of relevant indirect
bankruptcy costs.
64
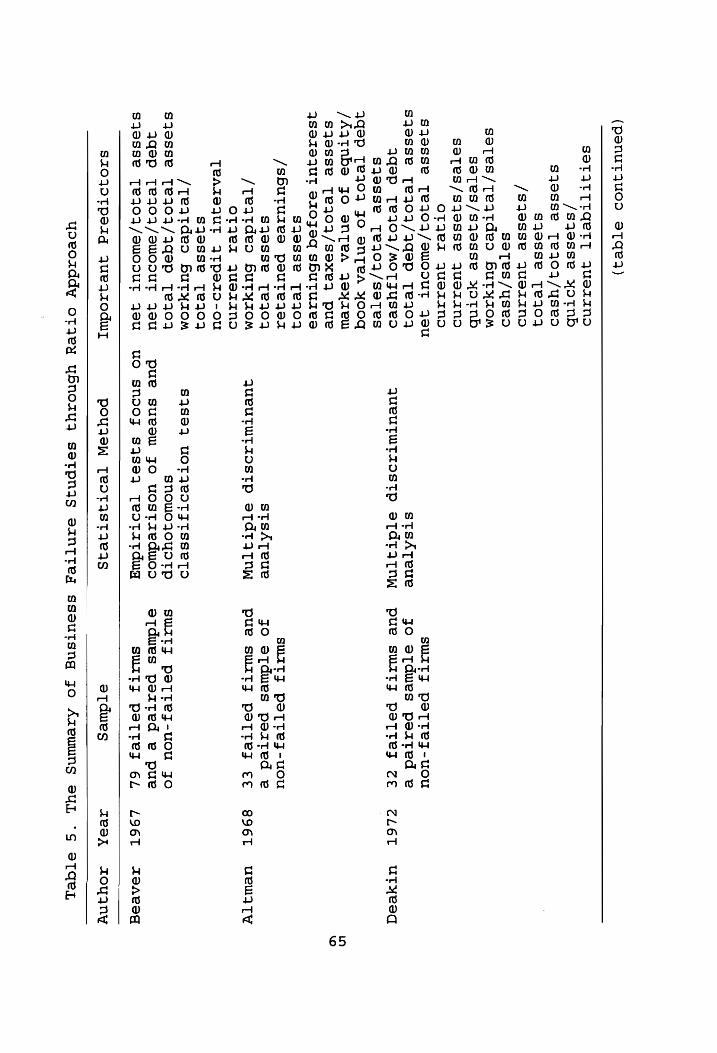
(penutquos eTqed)
SeTITTTqet—T
JuerAznd /sjesse
yotnb
sqesse
[Te jo j
/yseo
sqesse
[eq0oj /sjesse
qusezind
setTes/yseo
soetes/Teqtdes
butyz0Mm
setTes/sqesse
yotnb
seTes/sjesse
quezino
otqext QuezazNnd
sjesse
Teqjoq/swoout
you
sqesse [Tej09/I3qGep
TeIOR aqep
TeI09/MoTIJYseo
SWITJ
peTTejy-uoUu
stsATeue
jo etTdwes
peated
e
qQUeUTWTIDSTp
STdtja[nW
pue swztj
peTtesy ze
ZCL6L utTyYHeeq
Ssjesse [ejI0O7/setTes
3aqep Te
{OR FO
snTea
Yyood /Aatnbs
jo enjTea
Jexzew
sjesse
[eq07q/sexeq
pue
qseraqut
ezr0jseq sbhuturzes
sqesse
[eq0 4
/sbutuzes
poeuteqjea SWITJ
PSeTTejz-uou
sqjesse [eo
stsATeue
JO oTdwes
perzted
e
/Teatdes Butyr10m
qUeUTWTADSTp
SeTAdTITNW pue
SswATJ peTTey
€€ 896T
UeWITY OTQeAT
QUeAAND
TReATSAUT 4Tperzd-ou
sqesse
[Te 03
/Teatdes
Bbutyrz0Mm $]S0]
uOoTJeOTIJTSSeTO
sqesse
[Te,049/AGep Te
Io04 snowojOYydotp
SWITJ
peTtTejz-uou jo
aqep TejO
7 /sawosuT yeu
pue sueew
jo uostzedwoo
etTdwes pezted
e pue
Ssqjesse Teqoq/swoouTt
Jeu uo
sndojz sqseq
Teotazatdwy SWITJ
PeTTes
6L LI6T
AdAVCd
SZ0}9OTperzq JQueqrodwuy
pouyeW
Teotastyeqjs
aTdues
zeaR
xrOUIANW
yoeorzddy
otjey
ybnozyy
setpnis
eantteq
sseutsng
jo Azewwns
seuL °S
eTqez
65
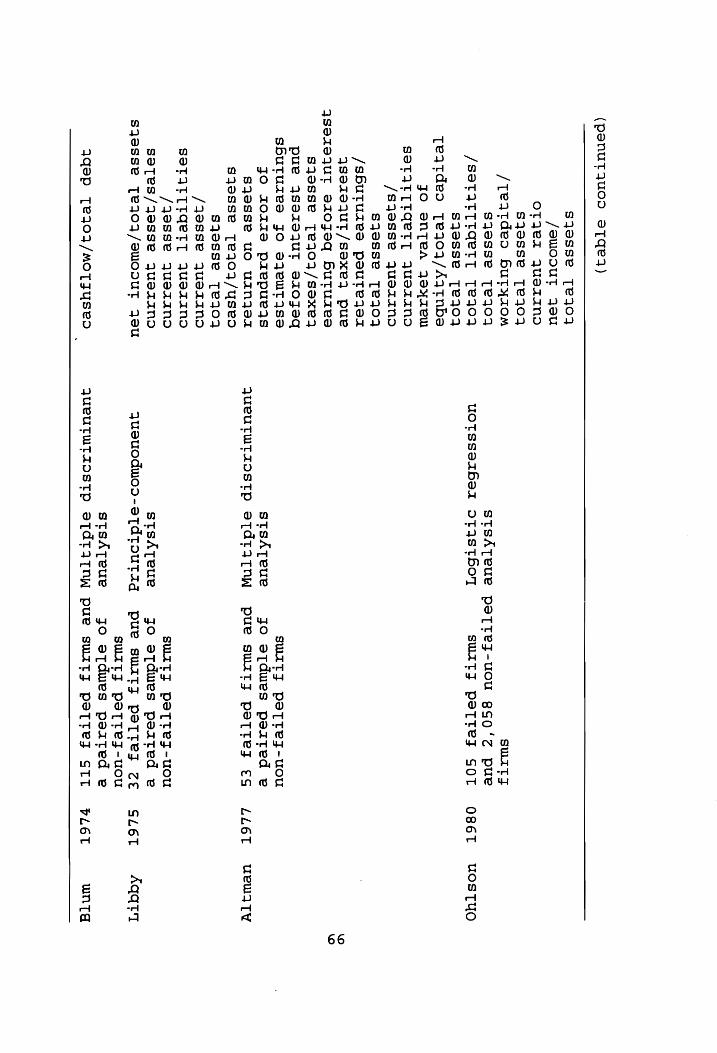
(penutquos atqed)
Ssjesse [eqoj
/swoosuTt 3eu
OTqezA QUuSerZAND
sjesse
Tej0
/Teatdes
butyz0m
sqjesse [eqoOR
/SETATTTGeTT
Teq4oOF sqesse
[Te 0
Teatdes
j,eq04/Aqtnbs
JO OeNnTeA
JoeyYrAewW SSTATTTGQetT{T
quezrNd
/syjesse quezind
sjesse
[e074
/sbutuzes
peutejer
qsezequt/sexeq
pue
qsezequt
ez0jeq
Hutuzes
sjesse
[Te 079/sexeq
pue 4sezsQqUT
sz0jeq
sbutuzes
jo sqjewtq4ss
jO 701719
pzepueqs
sqjoesse uo
urznjez sjesse
[Teq03/yseo
sjesse
[Te 0}
/ jesse
quezINd
SOTITTTQeTT
quezaznod / j
esse
quezrnd
sotTes/jesse
quezinod
sqjesse
[TeIO/swooUT
Jou
qqep TeI03/moTFYySeD
SWAT F
stsAjTeue
petTtejs-uou gsgo’‘z
pue uotTSserberz
OTASTboT
SWITJ
PeSeTTeT SOT
SWITJ
PeTTez-uoU
JO aTdwes
peated
e
pue swity
peTtteFz €S
stsATeue
qQUeUTWTIOSTp
aeTdt3atnw
SWITJ
POTTes-uoU
yO eTdwes
paeizated e
pue swraTy
peTtesy Ze
SwITJ
POTTezJ-uoCU
stsATeue
JO sTdwes
peited
e QUBEUTWTAOSTp
STdti{[nwW pue
swxzatjy peTtez
SIT
stsATeue
quseuodwos -atdtoutszg
O86T
LL6T
SL6T
vVL6T
uosTyO
uewd ly
Aqqtt
wnt@
66
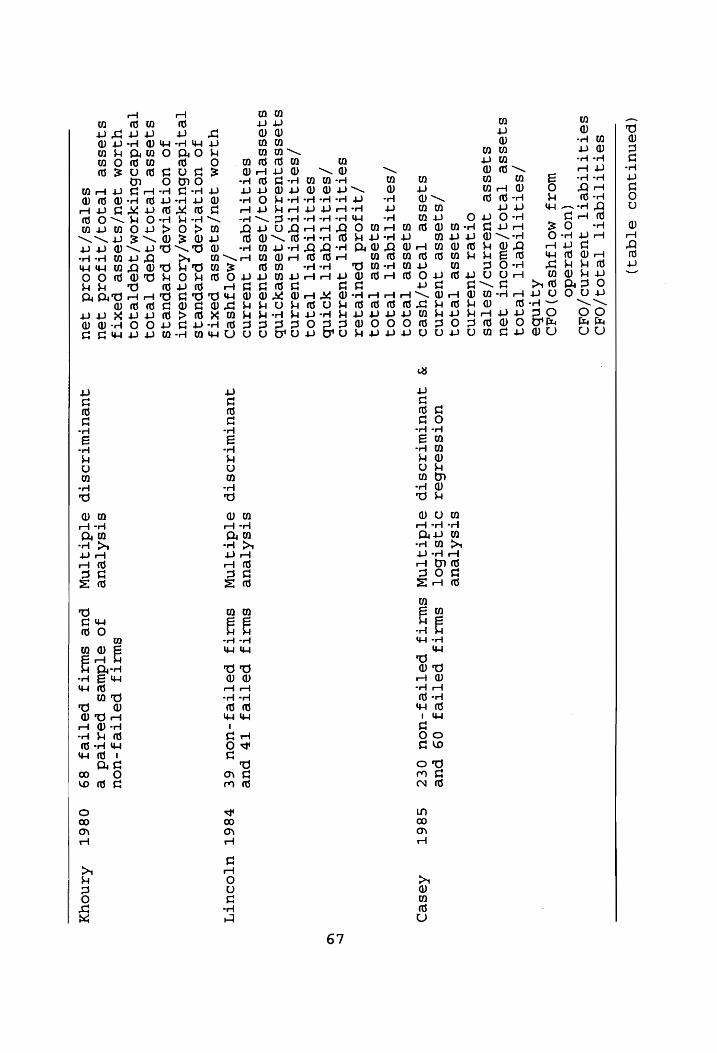
(penutqAuod
seTqe4)
SSTAITTTQeTT 1TeI303/0d4d
SOTATTTqQetT{T
querzznd/OddD
(uot jezedo
wots
MOTIUSED) OAD
Aytnbe
/SETATTTGeTT
TeqOF sqesse
[eq0R/swooUT
Jou
sjesse
quezind/setes
OTqeT
AUezAND
sjesse
T[eqo 4
/syjesse
JuerziNd
sqjesse
[Te 04/used
sqesse
T[eqoOR
/SETATTTGeTT
TeqoOF sqjosse
[Te qo
/atyoad
peuteqjez
SOTATTTGQeTT
Juer7AND
/SeTAtTtgqettT yotnb
SeTatrTtqerT
[eso
/SeETATTTGQeTT
4uerAANd
Sqossequerzind/qjesseyxyotnb
sjessertejoj/qjessequezizno
SOTAITTTGetT—T quezaznd
/MOTIUSED
YAIOM
Joeu/Sjesse
pexTy
JO UOTISTASP
pzepueqs
Teatdeobuty170m/ATOAUSAUT
JO uOTIeTASp
pzepueqs
sjesse Tejoj/jqep
Te I04
Teatdeobutyrz0m/ 4qeptejo4
YIAIOM
Jsu/syesse
paexTs
Sqesse
[Teq09/qtTjorzd
jeu
setes/qrjyoad
yeu
stsATeue
uoTSserber
DTASTBOT
Sswazty Pettey
09 pue
8 JUCUTWTAOSTp
eTATITNW
SWATJ peTTez-uou
EZ
stsATeue
qUeUTWTAODSTp
sTdtyaTnW
stsAtTeue
QUCUTWTADSTp
seTdtyATnw
SWITJ PeTTeJ
Tp pue
SwITJ PeTTejJ-uou
6¢
SWwITJ PoeTtejz-uou
JO eTdwes
peated
e
pue swaty
peTtez
89
S86T Assep
y8EeT UTOOUTT
os6t Arnoyy
67

‘petytoeds
estmzeyjo
ezem
AsyQ
ssetun
swatz
Tetzysnput
10 Hutanjoejnuew
ezemM satdwes
eyj ut
swaATjJ peTtejy-uou
pue pe[tejy
sul
MOTjYUSeD
JO uoTRIeTASp
piepuejs
Aq paptatp
mOoTsJUSeO paqedtotque
sn{td eazesezt
ptnbtt
Tetaturt fo
wns sy4
anuspAsa /Teatdes
Bburyz0m
enusAeit/sjesse
[Teo
enusAe1t/sexeq
pue
qsezequt
szOjJeq
Hbururzes Sjesse
[Te ,09/sexeqj
pue
qsezequt
ez0jeq
Bbuturzes sqoesse
[eo 4
/tTeatdes
Buty70m
OTQqeX QuezAND
sjesse
[Te }070/seTes
Aqep
TejOQq Jo
sentTea yoog
/Aytnbs
jo enTtea
Jexzew
Sjesse
[Te jOq/sexeq
pue
qJsezaqUT
szO0Jeq sbutuzes
sqosse
[Te I0
3 /Teatdes
butyx70m
sqoesse
[eq 09/sqjesse yotnb
SBbezxaao0d 4serSqut
uoTzeztTeqtdes
Teqoq
/Aatnbsa
jo antea
jyoxzeEw
Sjesse [e}07/AGep
TejOC} sotTes
Te 079/yseo
aqep [Te jOIj/moTyYyseo
epquey
s,Azawy
SANTTez
OF azotad
spotied
swtqj zaa0
suesw
jo uostzedwod
uo snooj
sqseq
Teotatdwuy
TOO} yAOMASU
TerANEeN
stsATeue
Butuotiatqyzed
satsanosy
SswITJ TEeqIOU
L
switj
Jueineqsez
Pettey
£4 pue
swaty
queaneqjsert pettey
2t
SWAITF PSTTeF-uoU
SgT pue
switjy PeTtez
6
SWATJ
PeTTeJ-uoU
ZFT pue
switjy peTtezy
g¢
T66T uosueMsS
C
€86T uaesto
€66T
8s 3eOD
S86T uewpArg
CHAPTER 3
RESEARCH METHODOLOGY
3.1 RESEARCH QUESTIONS
According to Dun and Bradstreet's business failure
reports, in comparison to all other industries most business
failures between 1984 and 1992 occurred in the retail and
service sector. Within the retail trade sector, the eating
and drinking places segment has consistently had the most
business failures of any single segment between 1984 and 1992
(Dun & Bradstreet, 1984-1992).
Financial conditions such as working capital, capital
structure, profitability, asset structure (fixed assets),
systematic risk and leveraged buyouts are related to business
failure. Each industry has different business failure rate
elasticities with respect to these financial conditions.
Therefore empirical work in the area of business failure
cannot assume that industries are homogeneous.
Bankruptcy is the most critical type of business failure,
and the most well known types of bankruptcy are reorganization
and liquidation. Although there have been conflicting
arguments with respect to the relationship between
reorganization and liquidation, no empirical research has been
conducted.
Given that 1) the restaurant industry has consistently
had the most business failures within the retail sector from
69
1984 to 1992, 2) each industry needs its own prediction model
for business failure which reflects the industry's unique
nature, and 3) there have been arguments with respect to the
relationship between reorganization and liquidation, the
following questions are of empirical interest:
1. Can business failure be predicted and which financial
variables can predict business failure in the restaurant
industry?
2. Are there differences in the financial variables which
predict business failure for the restaurant industry on one
hand and the hotel industry on the other?
3. Are the financial variables that determine reorganization
different from those that determine liquidation in the
restaurant industry?
3.2 HYPOTHESES
Three null hypotheses can be developed from the research
questions and the theoretical underpinnings. Table 6
summarizes research questions, hypotheses, and theoretical
underpinnings.
First null hypothesis:
Business failure cannot be predicted in the restaurant
industry at the 0.05 level.
There are 8 sub-hypotheses (at the 0.05 level) under the first
null hypothesis as follows:
70
1. Business failure is not determined by current ratio.
2. Business failure is not determined by cashflow per share.
3. Business failure is not determined by total assets
turnover.
4. Business failure is not determined by operating cycle days.
5. Business failure is not determined by sales/net property,
plant and equipment.
6. Business failure is not determined by long-term debt /common
equity.
7. Business failure is not determined by total debt/invested
Capital.
8. Business failure is not determined by total assets/common
equity.
The second null hypothesis:
There are no differences in the predictors for business
failure between the restaurant industry and the hotel
industry.
The third null hypothesis:
Capital structure and profitability do not determine
reorganization and liquidation.
71
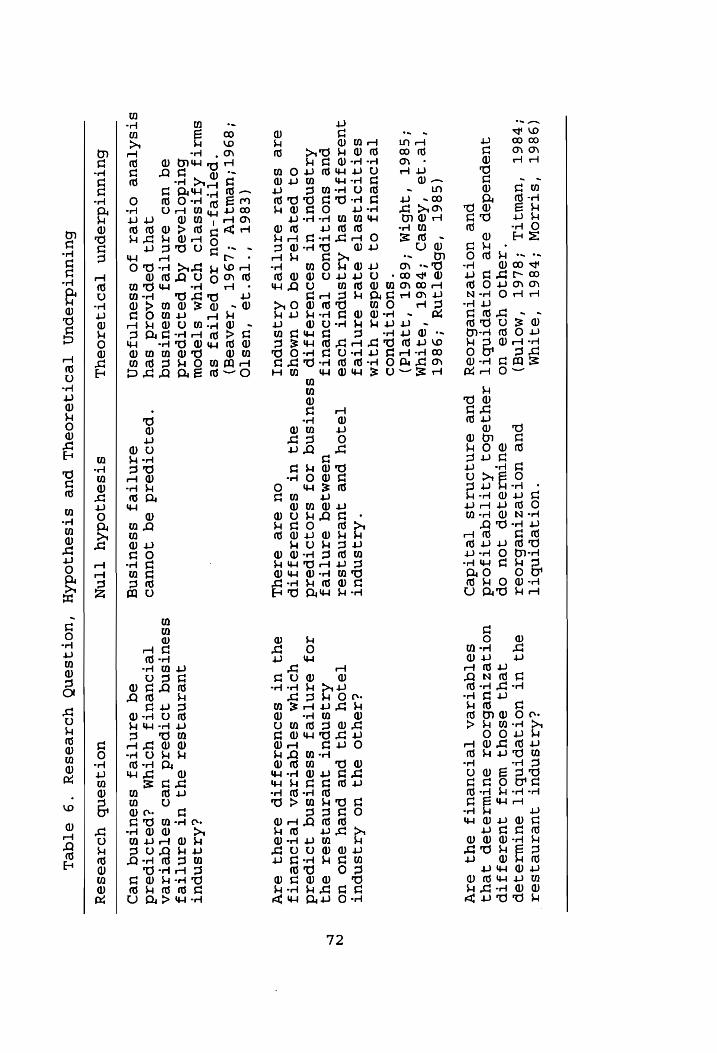
(986T
'PB6T ‘STATON
‘P86T ‘OITUM
‘uewITL ‘8L6T
‘MOTNd) ‘ZsyIO
Yyoes uo
quepuedep
ere
uoTtTjAeptnbttT pue
uot jeztuebirosy
(ss6t ‘ebpetana
‘/986T ‘te'qe
‘Asse
‘7e6et ‘eaTUM
‘og6t ‘3u5tTM
‘686T ‘'33€Td)
*SuOTATpPUOD
TetToueuty
Of Woodserz
YATM
SOETITOTISETS
a3erT SANTTeF
quezssjtp
sey Aaqsnput
yora
pue suotytTpuods
Tetoueutgz
‘uot JepTnbtTT
pue uot
jeztuebr0e2
SuTWISIep
Jou op
azeyyje5o0q AAtTtqeqytjyozd
pue einjonizqjs
Teqtded
*ATAsnput
Tae,oy pue
Juerznejse2z Us9MIeEq
SANTTeZ
AZASNpuT
UT saouerSFJIp
sseutsnq
AoZ sxz0jq0Tpezd
0} peqweTezr
oq Of
UMOUS
eaze saqez
orznttez
AzASNpuUl
(€8s6T ‘Te’
We ‘uesTO
‘896T‘UBWITY
“L96T ‘1eAedq)
‘peTtej-uou
10 paeTtez
se swity
AJTSSeTO
yoOTymM STepow
Butdoteasp
Aq peqotpezd
aq ued
eAINTtejs sseutsnq
eu
peptaord
sey
stsATeue
otTqezr JO
ssouTnyesn
Butuutdzspun
TeotqArz098uL
butuutdzspun
[TeotqyezoayuL
pue
stseyjodAy
ay. UT
sedUeZezZIIp
OU ere
sTSZUL
‘peqotperzd
eq Jouued
SANTtej
sssutTsng
StseyjodAy
TInN
é¢AATASNpPuT Juerzneqysserz
ayy UT
UOTIepTNHtT
sutwirzsyaep Rey
SsoYyR wWOrAF
qUseASeTJTp uoTAeztuebszo0ez
suTWASeJEp
7eYyy S2eTQetTzAeA
TeTOUeUTJ
SY
2A
éteyjo
3yq
uo ArAsnput
Tej7oYy sy
pue pueYy
suo UO
AZASNpuT
Juerzaneqjsser 3yy
IO} SANTTezZ
ssoeutsnq
AotTpead
YOTYM
SOeTqetzen
TeToOUueUTs 84
UT SsdUaezZeTITp
ezeyQ
sav
égATASNPUT
querneyser
oY
UT
eANTTtTesZ
ssosutsnq
4otperzd
ued
sseTqetzea
Tetoueutz YOTUM
<~EpeqoTpeid eq
eANn{Ttez sssutsnq
ue)
uotqjsenb
yoreesay
‘uoT4AsenoO
yorewsessy
°9 STQqeL
72

3.3 METHODOLOGICAL REVIEW
3.3.1 Justification of Research Methodology
Leedy (1993) asserts that the nature of the data dictates
the research methodology. If the data is verbal, the method
is qualitative; if it is numerical, the method is
quantitative. However, aS an alternative to this strict
dichotomy, there is triangulation consisting of a hybrid
variation. Leedy, therefore, classifies, all research
methodologies under one of these categories.
Qualitative research can be primarily an inductive
approach to data analysis and results in theory development
(Parse, Coyne & Smith, 1985; Kirk & Miller, 1986; Cobb &
Hagemaster, 1987). Conversely, quantitative research can be
primarily a deductive approach to data analysis. Researchers
construct and test null hypotheses so as to either support or
reject these hypotheses at some level of statistical
probability (Ramer, 1989). Goodwin & Goodwin (1984) suggested
that many studies could be enhanced if they combined both
qualitative and quantitative approaches. Triangulation
research is the use of two or more methods of data collection
procedures within a single study (Duffy, 1987).
In this study, the type of methodology was determined by
the nature of the data (ratios) derived from the research
questions. Therefore the quantitative methodology was
employed.
73
3.3.2 Justification of Research Method
A method is a way of accomplishing an end result, and it
indeed depends on the methodology. Descriptive, survey,
historical and case studies are examples often used in
qualitative research while experimental, quasi-experimental
and statistical-analytical studies are examples usually
employed in quantitative research. A combination of methods
from both the qualitative and quantitative methodologies
describes triangulation research (Leedy, 1993).
In this study, the statistical-analytical method was
employed due to the nature of the research questions. The
experimental method and quasi-experimental methods deal with
the phenomenon of cause and effect within a closed system of
controlled conditions. However, the research questions in
this study do not determine cause and effect relationships
within the context of business failure but instead classify
and predict business failure.
The research questions can be investigated by using an
analysis of financial ratios, an events approach, and the
combination of the two. Since the purpose of the events
approach is not to classify and predict but to determine the
characteristics of the failure process, the events approach is
not appropriate to the research questions.
Although the combination approach may increase
understanding of the failure process and improve business
74

failure prediction, there can be collinearity between ratios
and events. For example, lower profitability and higher
capital structure may be highly correlated with some events
such as reduction in dividends, violation of debt covenants,
troubled debt restructuring or going concern qualified audit
opinions. Therefore the ratio approach was employed in this
study. In the next section, the various statistical-
analytical methods employing the ratio approach will be
briefly reviewed.
3.3.3 Choice of Classification and Prediction Method
Many of the studies employing accounting and financial
ratios as independent variables predict business failure using
methods which classify firms as failed or non-failed. In
order to assess how well the method works, it is common to
compare predictions of business failure to the observed
outcomes by estimating classification accuracy percentages
which are generally reported in matrix form.
There are several methods such as the univariate
analysis, multiple discriminant analysis, logistic regression
analysis, recursive partitioning analysis, and neural network
artificial intelligence. In reviewing the nature of the data
in the context of the research questions, it was determined
that logistic regression analysis would be the best analytical
tool in this case.
75
Efficient computer programs for fitting the logistic
regression model have now removed computational cost as a
barrier to an appropriate analysis of data not meeting the
basic assumptions of multiple discriminant analysis (Fienberg,
1981). Press & Wilson (1978) describe the superiority of
logistic regression analysis over multiple discriminant
analysis through two empirical illustrations. Their study
showed that logistic regression analysis was more superior to
multiple discriminant analysis in terms of classification and
prediction procedure.
In this study, logistic regression analysis was employed
as a classification and prediction method since it is robust
and superior to multiple discriminant analysis. In the next
section, more detailed aspects of logistic regression analysis
will be reviewed.
3.3.4 Logistic Regression Analysis
Logistic regression analysis can be applied when
observations can be classified into two groups where the
presence or absence of a phenomenon or event is considered a
dependent variable. The objectives of logistic regression
analysis are to 1) develop a model which summarizes the
relationship between a dichotomous dependent variable and a
set of independent variables, 2) determine which independent
variables are useful for prediction, and 3) predict the value
76
for the dependent variable from the values of the independent
variables (Hosmer & Lemeshow, 1989).
Logistic regression analysis is a parametric procedure
similar to discriminant analysis that poses less rigorous
constraints on the estimator variables. This method assumes
the applicability of a logistic curve. If the logistic
regression model is written in terms of the log of the odds,
it is called a logit model and is represented as follows:
Prob(event) lo = B.+B,X,+ ... +BYX. (3.3.4a)
g( Prob(no event) O0wri p''P
where,
B,, B, : coefficients estimated from the data
X : independent variable
Since it iS easier to think of odds, rather than log odds,
the above equation can be written in terms of odds as follows:
Prob(event) By+B,X,+ ... +ByX, =e
Prob(no event) (3.3.4b)
= @%e3% -., eF rtp
where, e is the base of the natural logarithms.
The way of assessing the goodness of fit of the model is
to examine how likely the sample results are given the
parameter estimates. It is customary to use -2 times the log
of the likelihood (-2LL) as a measure of how well the
estimated model fits the data. This is to test the null
hypothesis that the observed likelihood does not differ from
77

1 (the value of the likelihood for a model fits perfectly).
If the observed significance level is large, the null
hypothesis that the model fits cannot be rejected. Another
way to assess how well the model fits is to compare the
predictions to the observed outcomes. The classification
table shows how many observations are correctly or incorrectly
predicted by the selected independent variables.
The test that a coefficient is zero can be based on the
Wald statistic, which has a chi-square distribution. The Wald
Statistic is the square of the ratio of the coefficient to its
standard error. If the coefficient is positive, the odds are
increased; if the coefficient is negative the odds are
decreased; and if the coefficient is zero, the odds are
unchanged.
Stepwise logistic selection is the procedure to enter
important variables which can classify and predict the groups
into a model. A crucial aspect of using stepwise logistic
selection is the choice of an alpha level (probability of
enter) to judge the importance of variables. Several
researchers have studied the choice of probability of entry.
They concluded that choosing a value for probability of entry
in the range of 0.10 to 0.20 was more highly recommended since
the choice of 0.05 is too stringent and often excludes
important variables from the model (Bendel & Afifi, 1977;
Costanza & Afifi, 1979).
78
In logistic regression analysis, there are comparable
diagnostics that can be used to examine the adequacy of the
resulting model. The diagnostics are known as Pearson and
deviance residuals. The Pearson residual is the residual
divided by an estimate of its standard deviation as follows:
Residual, 2. = (3.3.4c)
y (Pred. Prob. ;) (1-Pred. Prob. ;)
where the residual is the difference between the observed
probability of the event and the predicted probability of the
event based on the model. The deviance residual compares the
predicted probability of being in the correct group which is
based on the model to the perfect prediction of 1 as follows:
-2 x log(L0/L1) (3.3.4d)
where Ll is always 1, since the likelihood of the correct
prediction in a perfect model is 1, and LO is the predicted
probability of membership in the correct group.
It is calculated by taking the square root of the above
statistic and attaching a negative sign if the event did not
occur for that case.
719

3.4 METHODOLOGICAL ISSUES
Some methodological issues can be considered in order to
increase the reliability of classification and prediction of
business failure. This section will describe the
methodological issues.
3.4.1.Definition of Business Failure
Business failure is a term which is used in a variety of
contexts. Keown, Scott, Martin & Petty (1985) offer three
terminologies that are used to represent business failure.
Economic failure, which is indicative of business expenses
exceeding revenues, can be viewed as a mild form of failure.
Technical insolvency describes a situation where the firms
have positive net worth but have insufficient liquidity to
meet current liabilities. The term bankruptcy represents the
opposite extreme in which the firm shows negative net worth as
well as negative liquidity.
In determining business failure with respect’ to
classification and prediction, researchers have defined
failure based on the legal context (i.e., reorganization and
liquidation ). It has also been defined based on the
characteristics of the business failure process (i.e.,
defaulting on interest payments concerning current
obligations, overdrawing bank accounts, missing preferred
dividend payments, negative cash flow and net loss). These
80 ae
characteristics of the business failure process are indicators
(direct or indirect) of economic failure or technical
insolvency.
The studies employing the legal context investigate these
warning signals by matching actual bankrupt firms with non-
bankrupt firms while the studies employing the characteristics
of the business failure process investigate the warning
Signals by matching failed firms with non-failed firms. One
advantage for using the legal definition is that all
uncertainties about the status of a firm are resolved. In
other words, a firm is either bankrupt or non-bankrupt. The
failure process model has the advantage of providing more
comprehensive information regarding business failure than the
traditional models. This is possible because, in addition to
classifying firms into failed versus non-failed, the model is
also capable of determining which failed and non-failed firms
will ultimately go bankrupt. Consequently, this model offers
early warning signals to firms to help them avoid bankruptcy.
Among the characteristics of the business failure
process, net income has been widely used in order to define
business failure. Schwartz & Menon (1985) used the reporting
of net loss or negative net income as an indication that a
firm was having financial difficulty. A firm was considered
to have entered the failure process if it had an initial net
operating loss following at least three consecutive years of
81
profitability which is defined as net income greater than zero
(Flagg, Giroux & Wiggins, 1991). In this study, negative net
income for three or more consecutive years was employed as the
definition of business failure.
The three business failure terminologies suggest that a
continuum exists in business failure. Most firms may not
suddenly face technical insolvency or bankruptcy. Usually
they tend to move from economic failure to _ technical
insolvency, and lastly to bankruptcy. The negative net income
is a direct indicator of economic failure. Therefore business
failure studies defined by negative net income can provide
early warning signs to firms to help them avoid other business
failures in the continuum. The three or more consecutive
years restriction was applied in order to assure that non-
failed firms were reasonably healthy at the outset and not
already in some stage of the failure process.
3.4.2 Definition of Reorganization and Liquidation
Once a firm files for bankruptcy, there are two
alternative procedures. The first, liquidation (chapter 7),
occurs when the firm ceases operation, its assets are sold,
and the proceeds distributed to creditors. The corporate
entity of the liquidating firm ceases to exist after
liquidation. The second, reorganization (chapter 11), occurs
when the firm continues to operate after the bankruptcy
82
filing, and it agrees to compensate creditors partially for
their claims (Logue, 1990).
In this study, reorganization was defined by the event of
filing for reorganization (chapter 11), while liquidation was
defined from the view-point of asset liquidation, cessation of
operations and/or acquisitions by an operating firm(s) or
financial investor(s). Although the definition of liquidation
in this study was not based on the event of filing for
liquidation (chapter 7), the final effect of this definition
would be the same as the event of filing for liquidation
because the firms filing for liquidation eventually cease to
exist by the various liquidation methods.
Faced with a bankruptcy decision, rarely would a firm
file for chapter 7 bankruptcy liquidation unless the firm has
already exhausted all other possibilities. Even after
exhausting all other possibilities, the firm tends to cease to
exist by the various liquidation methods and not by legally
filing for liquidation.
3.4.3 Sample Construction
Researchers typically estimate the classification and
prediction of business failure on nonrandom’ samples.
Estimating the classification and prediction of business
failure on such samples may result in biased parameter and
probability estimates due to unequal probability and
83
incomplete data (Zmijewski, 1985). Similar issues are also
relevant to other research settings that involve binary state
classification and prediction models (Palepu, 1986).
First, the observed result of unequal probability bias is
that since there are more non-bankrupt firms than bankrupt
firms, the probability for a non-bankrupt firm to be in the
sample is higher than that of a bankrupt firm. Therefore the
bankrupt group (non-bankrupt group) may underestimate
(overestimate) the classification and prediction error rates.
Second, bias results from including in the sample only firms
with complete financial data. Bankrupt firms have, on
average, low probabilities of being selected for the sample
because bankrupt firms are more likely to have incomplete
data.
The definition of business failure, was three or more
years of consecutive negative net income in this study. There
are many more failed firms (i.e., negative net income for
three or more consecutive years) than bankrupt firms, and
these failed firms may have better and more complete data than
bankrupt firms. Therefore by using failed firms rather than
bankrupt firms the biases could be reduced in this study.
84
3.5 RESEARCH METHODS
3.5.1 Classifying and Predicting Business Failure in the
Restaurant and Hotel Industries
A. Sample
A preliminary search identified 122 publicly-traded
restaurant firms and 36 hotel firms from COMPUSTAT by the four
digit SIC codes. The four digit SIC codes for the restaurant
and hotel industry are respectively 5812 and 7011. The period
of 1982-1993 was selected because of the significant business
failures that characterized this period in the restaurant
industry. The same period was also selected for the hotel
industry for comparative purposes. Among 122 restaurant firms
23 firms were identified as failed based on the definition of
business failure in this study. Twenty-three firms out of 99
firms were randomly paired with the failed firms. These 23
non-failed firms were selected based on the following rules:
1) these firms did not have negative net income for three or
more consecutive years and 2) if the firm had more positive
consecutive net income years, it had priority to be selected
as one of the non-failed firms. For example, if firm A had 7
years of consecutive positive net income, firm B had 2 years
of consecutive positive net income, and both firms did not
have negative income for three or more consecutive years, firm
A was selected as one of the non-failed firms. This manner of
sample selection was used in order to provide a sharp contrast
85
between failed and non-failed firms.
Table 7 shows the list of failed and non-failed firms in
the restaurant industry. Among 23 failed firms, 7 firms were
defined as failed from 1986 to 1989, and 16 firms were defined
as failed from 1990 to 1993. Five actual bankrupt firms were
in the failed group. The average years of negative net income
were 4.5 years.
The same procedures were followed for the hotel industry
sample. Among 36 hotel firms listed on COMPUSTAT in the hotel
industry, 15 firms were identified as failed based on the
definition of business failure in this study, and another 15
firms were selected as non-failed.
Table 8 shows the list of failed and non-failed firms in
the hotel industry. Among 15 failed firms, 4 firms were
defined as failed from 1988 to 1989, and 11 firms were defined
as failed from 1990 to 1993. Two actual bankrupt firms were
in the failed group. The failed and non-failed event was
employed as the dependent variable.
86
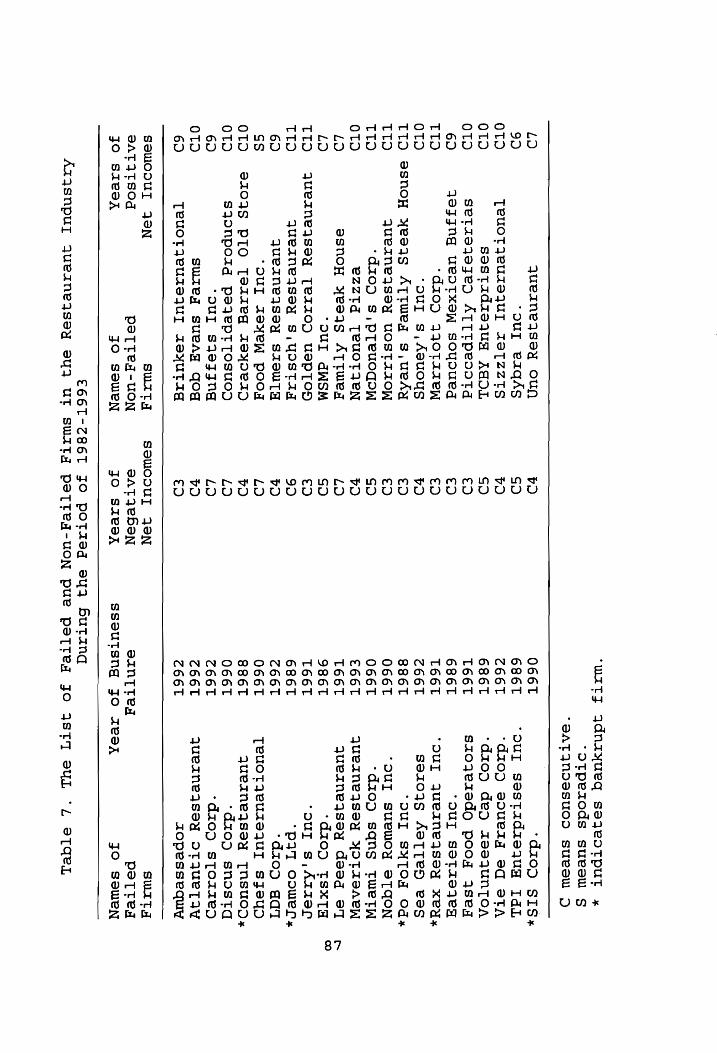
‘WATZ
Adnayueq
SaqyeoTpuT
+ ‘Otpezods
suesew §
“SATANDSSUOD
suRSU
D
LO queinejsey
oun vO
O66T ‘di0D
SIS+ 9D
‘pur eaqds
GO 686T
‘“oUT sestadzsequyq
IdL OTD
TeuotyeursquL
AeTZZts
PD Z66L
‘dz0D
souezgqg
oq
STA
OTD sestadzequg APL
SD 686T
‘dzop dep
azsequntoan OTD
setiseqyeszep ATTtpesotg
€D T661
szojezedo
poog
Ase
6D qezggjng ueoTXeW
soyouedg
€D 686L
“DUI
SaTtzsejzeg
TTD ‘dzo0p
390T172eW €D
T66T ‘DUI
JUeANe sey
xeys OTD
‘our s,Aauoys
PO Z66T
se10qg AeTrTep
eas TID
esnoq yeeqs
ATtweq
s,ueky
€9 S86T
"OUI SYTOT
Od
Tto
queraneqssy
UOsTrAAOW
€D O66T
“SUI
SUBWOY
STGON
TIO "dz0p
s,pTeuoqgow SO
O66T *“dzoD
sqng twetw
OTD
eZZTqd
TeUOTIEN
vd €66T
queineqyssy
YOTASASCW
LD esnoy
yeeqs
ATtTweyg
LD T66T
querneqssey
deeg
e7
LO ‘DUI
dWSM SO
986T ‘dioD
tsxTa TID
JWueaneqsey
[TeAIOD
UsSpTOH
€D T66T
‘our
s,Azzac
TTD queinejsey
s,yostag
99 686T
"pa
cower.
60 queanejssy
sisw Tg
PO Z66T
‘dz0D dat
ss “SUI
7eyeW poog
LO O66T
Teuotjeurequy
syeyD OTD
827038 PTO
Terzzeg TAaYyDeITD
vO 886T
queineqsey
[TNSuoD, OTD
sjonpoig
pe jeptTosuo)
LO O66T
‘dzop snostq
60 ‘OUI
sqezgng
LO Z66T
‘dzop sjTorzzep)
OTD swieqg
sueaAg qog
vO Z66T
queaneqysey oTIUeTIW
6D TeuoTtyeurAsUuyr
AsyuTAg
€D Z66L
zopessequy
SQWODUI
JON
Swit
SSWOdSUL
AON
SUIT A
SATITSOd
peTted-uoNn SAT
eHbaN san,
Ted petted
JO
STBDZA
JO
SOWweN
3O
STePDZ
ssoutsng
Jo
rAeeR
Jo sowen
€66T-7Z86T
JO POTregq
eyQ Hutang
Azysnpul
4ueizinejssey sy.
UT swATy
peTteg_¥-uoN pue
petted JO
ASTI SeUuL
‘4 STQeL
87
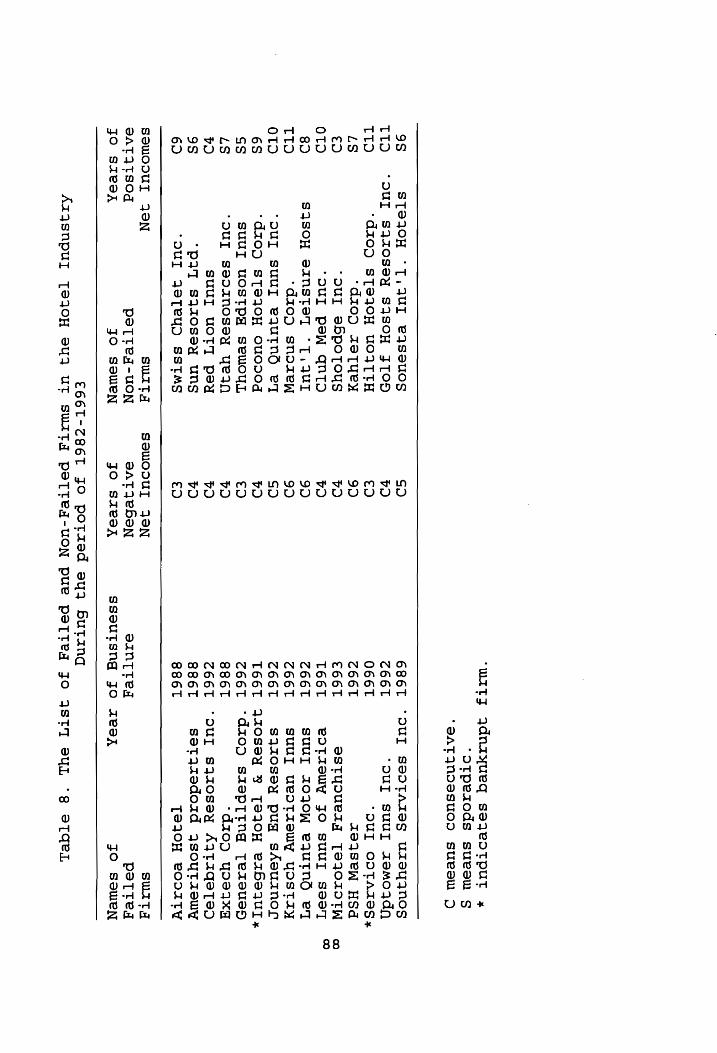
"wiTZ
Adnzyueq
saqeoTpuTt
‘otpezods
suesw
s ‘SATINDesuOD
sueseW Dd
9S STSIOH
°T,3UI
eyAseUuOCS SD
686LT “OUI
SeoTATSS
urASYANOS
TTD ‘OUI
SqZOSaYyY SAISOH
JTOD vO
C66T ‘DUI
suurT remo
jdn TID
‘di0D ST230H
UOITTH
ED O66T
‘DUI ODTATSS»
LS ‘dioD
zeTyey
9D Z66T
AeAseW
HSd €D
‘DUI ebpotous
vO €66T
estyouerzy TSIOTOTN
ow OTD
‘DUI PEW
ANT) vO
T66T edoTrAeWY
JO suUT
sea T
7 8D
SYSOH 9ANSsTeT
*T,4UrI 99
Z66T SUUT
ZOIOW eSAUTNO
eT TID
‘dz0op
snoreW
9D Z66L
SUUI
UeOTASWW
YOSTAY
OTD "DUI
SUUT
eqUuTNo
eT GO
Z66T
sjqiosey
pug
sAsurznor
6S ‘dzi0D
sTeqOH
OCUoCD0g 2)
T66L
J1z0Ssey %
TeqIoOH erbsaqut,
SS SsuurI
UOSTpY
sSewouL
€D Z66L
‘G210D
SAepttIng
Tezsausy
LS ‘DUI
sedAinosey yeqn
vO 886T
‘dzop yoo
qx vO
SUUI UOTT
pey vO
Z66T ‘OUT
sqzosey
AATAzAqGeTED 9S
"PAT sqzosey
uns PO
886T set
zzedoid Asoytiewy
62 ‘DUI
JeTeYD SSTMS
ED 886T
TSIOH BODIATY
SOWOdOUL
ASN
suit
A SOWoOdUuUrT
JON
SWAT J
SATATSOd
PeTTedy-uoNn
BAT IeHON
sInT Teg
petted
JO
SA7PDR
JO
SOWeEN
3O
STeCDR
Sssutsng
JO
Ae9ZR
JO
SOWeN
E66T-Z86T
JO potized
eyy butang
ATASNpUuL TSIOH
SY
UT SWATA
PeTTed-uON
pue peTteq
JO ASTT
SUL °8
STqeL
B. Independent Variables
Although no two researchers have used exactly the same
independent variables with respect to business failure, the
variables used represent the common financial ratios
categories of liquidity, activity, performance, profitability,
and leverage (Mensah, 1984).
There were 26 accounting and financial ratios from
COMPUSTAT. Current ratio, quick ratio, working capital per
share, cash flow per share are the indicators for liquidity.
Inventory turnover, receivables turnover, total asset
turnover, average collection period, days to sell inventory,
and operating cycle are the indicators for activity.
Sales/net property, plant & equipment and sales/stockholder
equity are the indicators for performance. Operating margin
before depreciation, operating margin after depreciation,
pretax profit margin, net profit margin, return on assets,
return on equity, return on investment are the indicators for
profitability. Interest coverage before tax, interest
coverage after tax, long-term debt/common equity, long-term
debt/shareholder equity, total debt/invested capital, total
debt/total assets, and total assets/common equity are the
indicators for leverage.
All ratios from COMPUSTAT were not used as independent
variables due to the following reasons:
1. The redundant variables, which are inventory turnover,
89
receivables turnover, average collection period, and days to
sell inventory were deleted, because operating cycle does
capture the information contained in these variables.
2. Quick ratio, working capital per share, sales/stockholder
equity, interest coverage before tax, interest coverage after
tax, long-term debt/shareholder equity, and total debt/total
assets were deleted because these ratios could not converge.
If variables cannot converge, logistic regression analysis
cannot be accomplished.
3. Since the definition for dependent variable is based on
profitability in this study, the indicators for profitability
were not selected as independent variables. In addition,
these indicators also caused a convergence problem as
previously explained.
Table 9 shows 8 accounting and financial ratios along
with their definitions, used as independent variables for both
the restaurant and hotel industry.
1. Current ratio
Owners and stockholders normally prefer a low current
ratio to a high one because stockholders view investments in
most current assets as less productive than investments in
noncurrent assets. Conversely, creditors normally prefer a
relatively high current ratio, as this provides assurance that
they will receive timely payments. This ratio was found to be
significant predictor with respect to business failure studies
90

(Beaver, 1967; Libby, 1975; Altman, 1977; Ohlson, 1980; Casey
& Bartczack, 1985). Further, this ratio was also found to be
a significant predictor in the restaurant industry (Olsen,
Bellas & Kish, 1983).
2. Cashflow per share
Users of financial statements have been showing an
increased interest in cashflow information (Gombola, Haskins,
Ketz & Williams, 1987). Cashflow divided by total liabilities
was found to be a significant predictor with respect to
business failure (Deakin, 1972; Blum, 1974; Frydman, Altman,
Kao, 1985; Casey & Bartczak, 1985). Further, Casey & Bartczak
(1985) and Lincoln (1984) found cashflow divided by current
liabilities to be a significant predictor of business failure
as well.
These studies examined whether operations provided
sufficient cash to pay a firm's liabilities from the
creditor's perspective. However, investors tend to focus on
cashflow per share because of their concern with a firm's
ability to pay dividends. Although cashflow per share is a
fairly new ratio, it can capture the information with respect
to business failure from the investors' standpoint-information
which previously has not been obtained through earlier
studies.
3. Total asset turnover
Total asset turnover measures management's effective
91
utilization of the firm's assets. This ratio was found to be
a significant predictor with respect to business failure
(Altman, 1968; Coats & Fant, 1993). For most hospitality
establishments, especially lodging businesses, fixed assets
constitute the majority of the operation's total assets. The
total asset turnover ratio is relatively low for most
hospitality segments, especially for the lodging segment. The
relative low ratio is due to the hospitality industry's high
dependence on fixed assets and its inability to quickly
increase output to meet maximum demand.
4. Operating cycle
The average collection period can be calculated by
dividing 365 by receivables turnover which is calculated by
sales divided by the average of the current year's receivables
and the prior year's receivables. In hospitality operations
that extend credit to guests, receivables are generally the
largest current assets. Therefore, an examination of the
quality of its receivables must be considered.
Days to sell inventory can be calculated by dividing 365
by inventory turnover which is the cost of goods sold divided
by the average of the current year's total inventory and the
prior year's total inventory. The inventory turnover shows
how quickly the inventory is being used. All things being the
same, generally, the quicker the inventory turnover the better
because inventory can be expensive to maintain. Further it
92
should be noted that inventory held by hospitality operations
is highly susceptible to theft and must be carefully
controlled to meet seasonal sales fluctuations.
Finally, the operating cycle, which measures a firm's
speed to convert inventory and receivable accounts to cash,
can be calculated by the average collection period plus days
to sell inventory.
5. Sales divided by net property, plant & equipment
High fixed costs are generally associated with more
capital intensive industries such as the hospitality industry.
Business risk depends in part on the extent to which a firm
incorporates fixed costs into its operation. If fixed costs
are high, even a small decline in sales can lead to a large
decline in profitability. Therefore, when all else is held
constant, the higher a firm's fixed costs, the greater its
business risk. Ultimately, this ratio can capture in part the
information of business risk.
6. Leverage ratios
The leverage predictor most often found to be significant
in business failure research was total debt divided by total
assets (Beaver, 1967; Deakin, 1972; Dambolena & Khoury, 1980;
Ohlson, 1980; Lincoln, 1984; Frydman, Altman & Kao, 1985).
One of limitations of this ratio is that it cannot capture
more comprehensive leverage information from the perspective
of investors and creditors.
93

Since it is known that the hospitality industry may not
be attractive to both investors and creditors, long-term debt
divided by common equity, total debt divided by invested
Capital, and total assets divided by common equity were used
in order to capture more comprehensive leverage information
from the perspective of both investors and creditors.
94
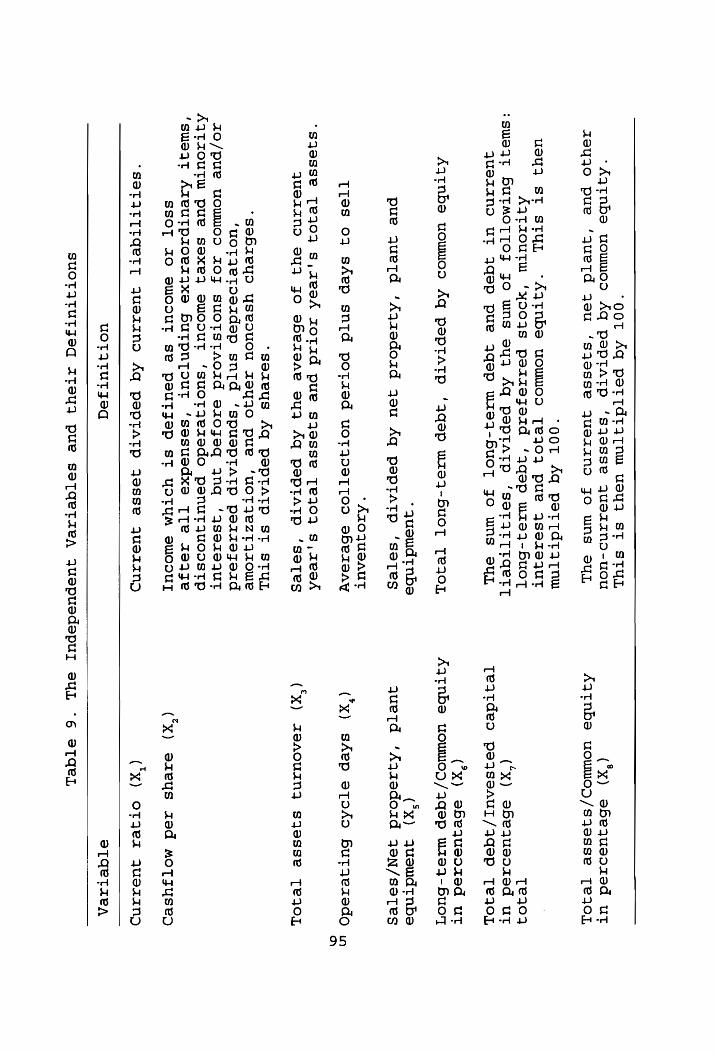
"oot Aq
paetTdtatnw useyy
st sStuL
“Aqytnbs uowwoo.
Aq peptatp
‘sjesse
quez7Nd-uou
qzeujo pue
‘quetd
jou
‘sjesse
qQuezind
jo wns
dsuL
"o00T Aq
paetTdt3atnw uayq
Sst stuy
‘Aqtnbs
uowwod
[ejoj
pue 4sezaqUT
Ajytizoutu
‘yoo
4s parzzajeazad
‘qjqep wre q-buot
:Sswoqt butmoT [oz
jo wns
93yq Aq
peptatp
‘SeTITITqeTT
quezand
ut 4yqep
pue Aqep
wz3q-Huo,t
jo wns
suyL
Ajztnbs
uowwoos
Aq peptatp
‘jAqep wizsq-buot
TeqOL
*quewdtnbs
pue
quetd
‘Aqzsedozd
yeu
Aq paeptatp
‘sates
*AZOJUSAUT
Tres
of shep
sntd
potzsed
uotqAo.aeT{Too sebezaay
“sqesse
[Teqj0q s,zeahk
z0tTazd pue
sjasse
[TeI0R Ss,rAesh
quezind
9syq jo
sbezaae
ayq
Aq peptatp
‘setes
‘sezeys Aq
PeptTATP ST
STUL ‘sebzeyo
yseouou
zeyqO
pue ‘UOT
IezTIAAOWe
‘uoTjetoeazdep
sntd
‘spuaptatp
perzzazeird
ao/pue
uowmwo0ds 103
suotstaorzd
ezojeq
4nq ‘4sez79qUT
Ajytzoutw
pue saxeqj
swoout
‘suotjexzsdo
penutquoostp
‘sweqgt Azeutpzoe1zqyxs
Hutpnptout
‘sesuedxse
[Te rqAze
SSOT 210
aWOoUT
se pPseUTJep
St YOTYM
swoduUT
"SOTITTITQeETT quezino
Aq peptaATp
jesse 4uezaNnD
uoT ITUTIJEd
(*x) eBequeoszed
ut Aytnbsa
uowwop/sjesse
[TeIOL
TeqAOF (“x)
eBequeozed
ut Teatdea
peqsaaul/jqep
TeIoOL
("x) eBequeorzed
ut Aqtnbs
uowuwop/aqep
w17z94q- buoy
("x) quewdtnbs
quetd
‘Aqzedorzd
4yan/setes
(x) sAep
atofo Butjqeszedo
(‘x) zeaouzng
sjesse TejIOL
(*x) azeyus
zed motsyseo
("x) oOTQez
QuezimNn5
STACTICA
SUOTITUTJEaqC ATeYy]
pue seTqeTize,
Juepusdepul euL
“6 STAeL
95

C. Statistical-Analytical Method
In pairing the failed versus non-failed firms for both
restaurant and hotel samples, it was determined that if a firm
failed in 1990 (this failed firm would have had negative net
income for three or more consecutive years prior to 1990),
then its 8 independent variables one year prior to 1990 (t-1),
namely 1989, were compared to a non-failed firm.
The prediction model was created for each industry
through logistic regression analysis based on the data of one
year prior to business failure.
D. Validation:Testing of the Models
In order to test whether the model based on the data of
one year prior to business failure (t-1) is valid, the
following technique was employed:
The model was tested for the two and three years prior to
business failure (t-2 and t-3) by determining the
classification percentage.
3.5.2 Comparing the Restaurant Industry with the Hotel
Industry
A. Sample
The same groups (failed and non-failed) as described in
the previous section were employed for each industry as the
dependent variable. As previously mentioned, the same period
of 1982 to 1993 was selected for both restaurant and hotel
96

samples. A reason for this is that the characteristics of
external economic environments which are expected to affect
the financial conditions of firms change over time (Mensah,
1984). Therefore if different periods were employed for each
industry the comparison would be the biased.
B. Independent Variables
In order to compare the restaurant industry with the
hotel industry, the independent variables that emerged as
significant in the model for each industry were utilized as
independent variables.
C. Statistical-Analytical Method
In order to compare the restaurant industry with the
hotel industry, the independent variable(s) that were not
present in the restaurant industry model but were in the hotel
industry model were investigated.
Two possible scenarios can be expected in this
investigation: 1) the independent variables that emerge as
Significant will not be the same for each industry, or 2) the
same independent variables will be present in both industry
models. In the case of the first scenario, the conclusion
would be that the restaurant industry model is different from
the hotel industry model. In the case of the second scenario,
the conclusion would be that the two models are possibly
identical. In other words, if the coefficient of the
independent variable(s) is not significantly different from
97

zero, the restaurant industry model would be considered the
same as the hotel industry model. Conversely, if the
coefficient of the independent variable(s) is significantly
different from zero, the restaurant industry model would be
considered different from the hotel industry model.
3.5.3 Applying the Prediction Model for Business Failure to
bankrupt firms in the Restaurant Industry
A. Sample
In order to determine whether the prediction model for
business failure can be useful in predicting bankruptcy in the
restaurant industry, the model was applied to bankrupt firms.
The bankrupt firms were selected based on the definitions of
reorganization and liquidation in this study. A sample of
restaurant firms which filed for reorganization (chapter 11)
between 1980 and 1993 was obtained from the following three
sources: 1) Predicasts Overview of Market and Technology, 2)
Funk and Scott (F&S) Index, and 3) the Wall Street Journal,
Nations Restaurant News, and other trade journals. The
financial data for the bankrupt firms was obtained from
COMPUSTAT, Compact-disclosure, and/or 10k-reports.
Restaurant firms which did not file for bankruptcy but
liquidated their assets, ceased operation, or were acquired
between 1980 and 1993 were also included in the sample.
The period of 1980-1993 was selected because the restaurant
98
industry has consistently had the most business failures of
any Single segment within the retail trade sector between 1984
and 1992. Thus, it would be expected that the most
reorganizations and liquidations in the restaurant industry
would occur during this period (1980-1993). Table 10 provides
the list of bankrupt firms in the restaurant industry. Five
bankrupt firms defined as failed were included in this sample.
99
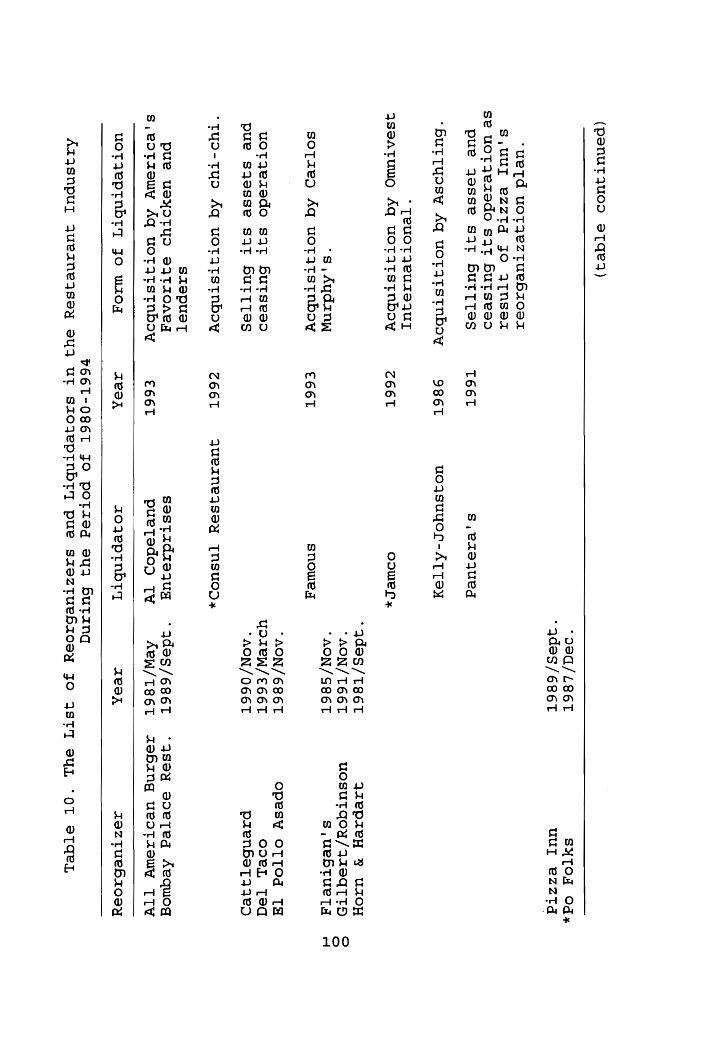
(penutjuoD
eTqe4)
"28q/L86T
SATOH
Od+
‘ydes/686T
uul e22Td
‘ueTd uotjeztuebioe.r
§$,UUI BzZzzTq@
JO 4[NSsez
se uot
jerzsedo sqt
butseso
pue
jesse
sqt HbutTptsas
I661L § ,ezequeg
‘ButTyosw
Aq uotytstnboy
986T
uojsuyor-AT
Tey
*TeuoTtT AeurSqUL
qseatuwo
Aq uot ytTstTnboy
Z66L
oower,
‘ades/T8ét
qzepzeH
¥% UTOH
"AON/T66T
uOSUTQOY/AAEqTTH
*s ,Ayudanw
*“AON/S86T
s ,uebtuetTa
sojTzep
Aq uot ytstnbow
€66L
snowe7
“AON/686T
Opesyw
OTTOd
TH uotjzezedo
sq4t Bbutsead
YDIeW/E66T
ooePL Ted
pue
sqjesse
sqt Hut{Ttes
“AON/O66T
paenbseTt33e5
‘Tyo-tyo
Aq uotytTstnbow
Z66L queineqjssy
[NSUuOD»s
SISpueT
pue
uayoTYS
asqtTr0OAey sestadzequg
‘jdes/6s6ét
‘3Asew soetTeq
Aequog
s,eotzewy
Aq uotqjtstnboy
E66T
puejtedo)
Tw AeCW/T86T
Aebang
ueotzoww
TIwW
uot3yeptnbty]
Jo w1z0¥
TeaK
zoyeptnbty
TeaK
Zaztuebs0ay
V66T-O86T
JO pOoTtzseq
ayy
Hbutang
AZAsnpul
Jqueineqsey
sy
ut szojeptnbty
pue szeztuebsacey
Jo ASTI
suL ‘OT
eTIeL
100
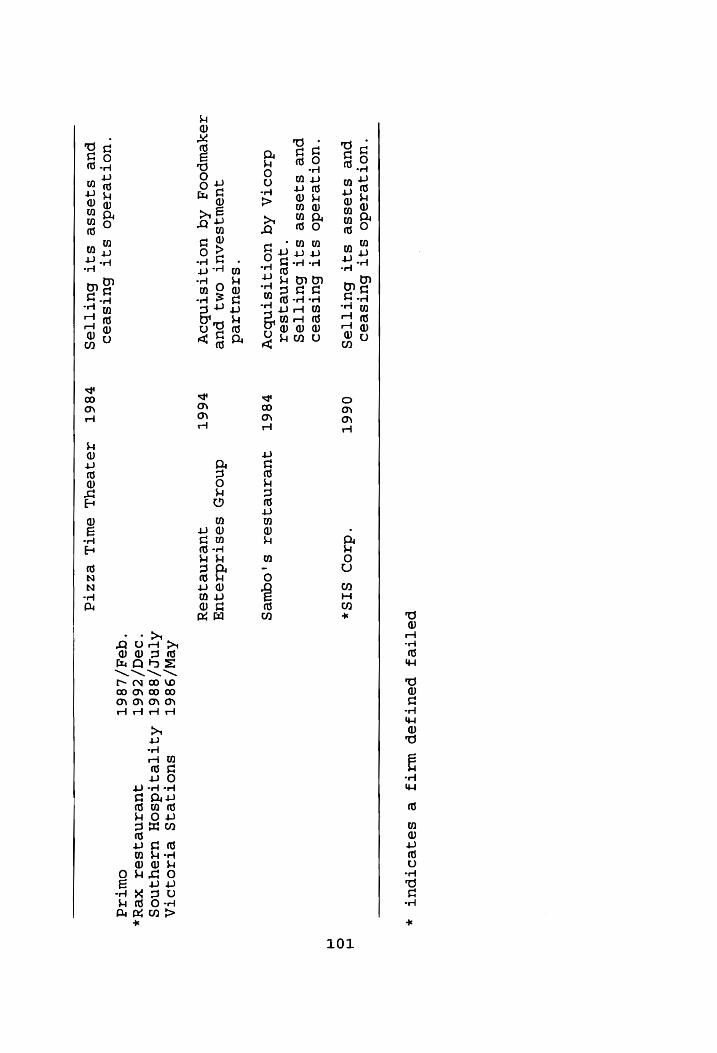
PeTTeJ peuTjJep
WATjZ e
SaqeoTpUT +
‘uot jertedo
sqt Hbutsesas
pue
sjesse
sqt Butt t
tes
“uotjerzedo
sqt butseso
pue
sjesse
sqt BUTT
Tas ‘querneqse1z
dzoota
Aq uotytstnboy
*szsuqzed
quaWwISesAUT OM]
pue zayeupoog
Aq uotytTstnbow
‘uotqjerzsdo sqt
Bbutseas
pue sqesse
sqt But{ttses
O66T
“diop
SIS*
7V86T JuUeANe ASST
s,oques
dnoazy
sestadizsjug
v66T
qQuezANeASSYy
P86T
A9RZeoUL
swtL
ezZztd
AeW/986T SuUOTIeIS
STIOIOTA Atne/ss6t
Aatteatdsoy
uzeyyjnos °"99q/Z66T
qUeANeASSA
Xe%Ax
"dea /L86T
outid
101
B. Independent Variables
The same variables utilized in the model for business
failure in the restaurant industry were employed as the
independent variables in order to investigate whether the
predictors from the business failure model can be applicable
to bankrupt firms.
C. Statistical-Analytical Method
The prediction model for business failure was tested at
intervals of one, two, and three years prior to bankruptcy (t-
1, t-2, and t-3) by examining the classification percentages,
based on data for bankrupt firms in the sample.
3.5.4. Determining the Relationship between Reorganization and
Liquidation in the Restaurant Industry
A. Sample
As indicated in table 10, there were 14 reorganizers and 10
liquidators in the restaurant industry. The events of
reorganization and liquidation represented the dependent
variable.
B. Independent Variables
In order to investigate whether reorganization (how the
firm is financed) and liquidation (how well the firm is
Operated) are dependent on each other, two sets of variables
representing capital structure and profitability were selected
as indicators of reorganization and liquidation. Long-term
102

debt to equity, total debt to total assets, total debt to
invested capital, and interest coverage were selected as
proxies for capital structure. Also return on assets, return
on equity, return on invested capital, net profit margin, and
cashflow per share were selected as proxies for profitability.
Table 11 shows the list of the indicators as well as their
definitions.
Twenty interaction terms consisting of pairs of ratios
representing capital structure and profitability were
investigated through logistic regression analysis in order to
determine whether reorganization and liquidation are dependent
on each other. That is, each regression model consisted of
three independent variables: a capital structure ratio, a
profitability ratio and an interaction term representing
Capital structure and profitability. The non-significance or
Significance of the interaction term will allow for the
rejection or acceptance of the null hypothesis. For the first
research objective, there is one independent variable serving
aS an indicator for profitability (cashflow per share) and
three independent variables serving as indicators for capital
structure (long-term debt divided by common equity, total debt
divided by invested capital, and total assets divided by
common equity).
103
C. Statistical-Analytical Method
There were 20 models with profitability and capital
Structure variables and interaction terms. If the coefficient
of the interaction term is significantly different from zero,
then it implies that both capital structure and profitability
can determine reorganization and liquidation. Therefore
reorganization and liquidation are dependent on each other.
This investigation was extended up to three years prior
to reorganization or liquidation (t-3). If reorganization and
liquidation are dependent on each other this extension of
examination can provide further information, that is, which
year (t-1, t-2 and/or t-3) the relationship was indeed
Significant.
104
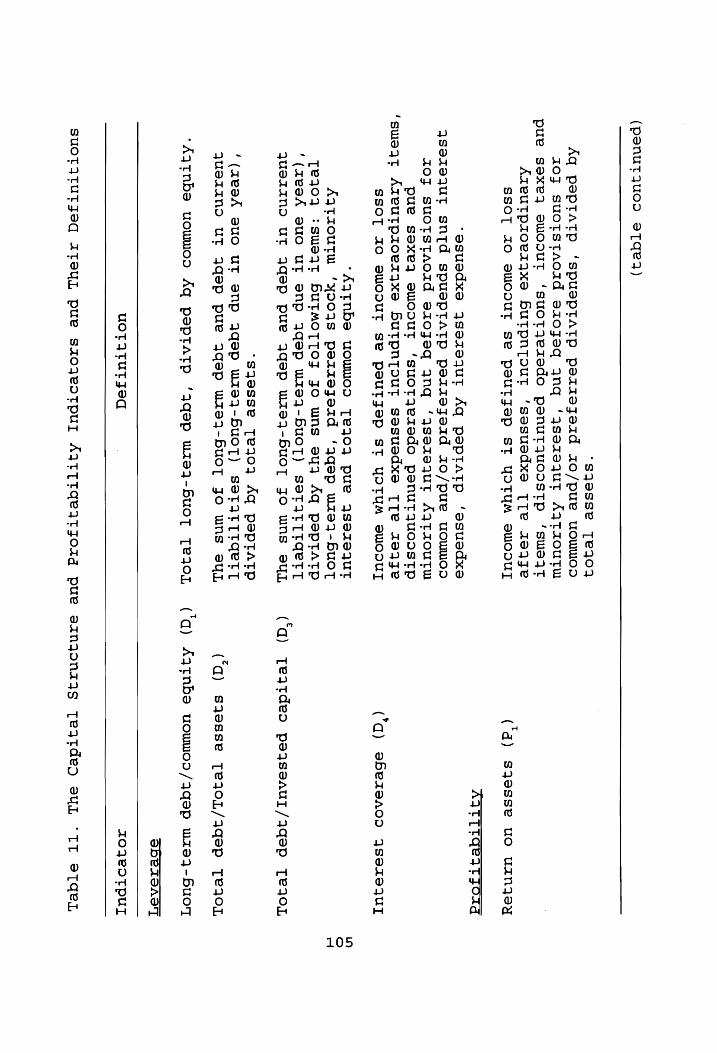
(penutquos
atqe)
‘sqesse
[TeqoO 4 Aq
Peptatp
‘SpuepTATp
pezrezerzd
20/pue
uowwod
ZOjJ suotstaozd
azojeq
janq ‘jJsezequt
AQTAOCUTUW pue
sexe}
swoout
‘suotjezedo
poenutquoostp
‘sweqt
ATeuTpsA0eAAXS
Hutpnytout
‘sesuedxe
[Te zaqze
SSOT 210
SsWODUT Se
pauTJop
ST YOTYM
BWwodUT
‘asuedxs
4sezequt
Aq peptatp
‘asusedxs
qsezequt
sn{td spueptatp
pezzejyerzd
2z0/pue
uowwod
ZOJ suotstaozd
azojyeq janq
‘yAsezsequt AqAtzouTW
pue sexeq
suodut
‘suotjezedo
paenutquocostp
‘suweqt AzeutTpzoez4xs
KHutpnpTout
sesusedxe
[Te rzaqze
SSOT ZO
swWOdUT Sse
pseUTJep
St YOTYM
sWodUT
*Aqtnbs
uowwod
Te joj
pue ASseASAQUT
Ajytszoutw ‘yoo
4s perzrzazjerzd
‘Aqep w1zsq-buot
TeIOR
:Sweqt
HutMoT{ToOF
jo wns
9yq Aq
peptatp
‘(zeasA Buo
ut anp
jAqep wxz9q-HuoT)
SeTtAtT{TtTqetT quezind
ut Aqsep
pue Aqsep
wzsq-bHuotT jo
wns sy
‘sqesse [e
0} Aq
paeptatp ‘(zeaX
suo
ut enp
jaqaep wizsy-HuoTt)
SetTAT{TTqett
quezind
ut Aqep
pue Aqep
wizsq-Huot
jo wns
sus
“Aqtnbse
uowuwods Aq
peptatp
‘jaqep wizeq-Huot
TeqoL
(‘d) sqesse
uo uaznqey
AWTTTqeat Ford
("q) abezenod
Asezequy
(‘a) teatdeo
peysaaul/jzqep
TeIoOL
("q) sqesse
TeqOL/jqep TeIOL
(a) Aatnbe
uowwoo/jqep
w1ze4-buo7
SbeaoAe yl
uoTATUT Fed
IOJeOTpPUL
SUOTITUTJOqQ ATSYUL
pue SAOQeOTpUL
AQTTIqeqtjorzq
pue sxznjonz4g
Teatded
suL “IT
etqez
105
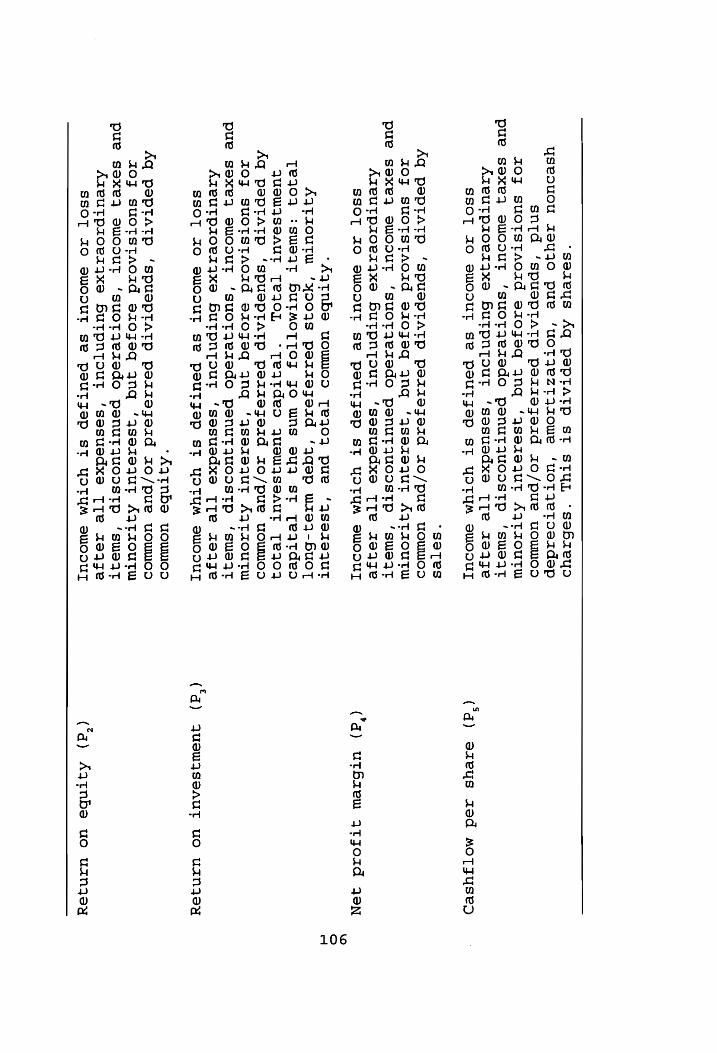
‘sezeyus
Aq peptATp
St STUL
*“Sebsreyo yseouou
zAsyIO pue
‘UOCTIeZzTAAOWe
‘UOTIeTOeAdap
sntd
‘spueptatp
pezzaejerzd
20/pue
uowwod
ZToJZ suotstaozd
aezojgeq ynq
‘Asezequt
AAtTzoutTu pue
soexeq awoout
‘suotjezedo
panutquoostp
‘swe qt
Azeutpzoeizyxs
Hutpnjtout
‘sesuedxe
[Te rzaeqze
SSO[T 2O
SWODSUT Se
pPaUTJep
St yoOTYyM
SWOdUT
*sotes
Aq PeptATp
‘SpueptaAtp
pezzszerzd
1z0/pue
uowwod
ZOJ suotstaozd
szozeq
Anq
‘Asazequt
AAtTzr0OUTW
pue
sexe
swoout
‘suotjezsdo
penutquoostp
‘sweqt
Azeutpzo0ez4yxs
Hutpn pout
‘sesuedxe
[Te zeqje
SSO[T 1O
SsWODUT
Se pPeUTJep
ST YOTYM
SwWwodUrL
‘Aqtnbse
uowwod
[Te joj
pue
‘AsezSsquT
Aytzoutw
‘yoo 4s
perzzezjerad ‘jaqep
wire q-buot
TeqIOQW :sweqt
HutMoT{ToOF FO
wns sy
st Teqtdeo
quewqyseaUuT TeROL
‘TeqAtded quewqAseauT
T[eqj0 4 Aq
peptatp
‘spueptatp
pezzezerzd
20/pue
uowwos
ZOZ Suotstaoirzd
ezojeq
Anq ‘jAsezequtT
AATAOUTW
pue
saxeq
swoout
‘suotjezsedo
penutquodstp
‘swe qt
Azeutpzoezyxs
HutpnpTout
‘sesuedxs
[Te zeqge
SSOT 10
sWOoUT
Se pPeUTJep
ST YOTYM
Bwooduyt
‘Aqtnbs
uowwood Aq
PepTtATp
‘SspuspTatp
peazzazerzd z0/pue
uowwood AJOJ
suotstaozd
sezojzeq yjnq
‘Asezaqut
AATzouTwW
pue
sexeq
swoout
‘suotjezsdo
penutquoostp
‘swe jt
Azeutpizoerzyxe
Hutpntout
‘sesuedxse
[Te zeqjze
SSOT 10
SWODUT
Se pPsUTJep
ST YOTYM
swWOodUT
(7a) aezeys
zed mo
tyuseo
(4) utBazew
Aatjozd
4eN
(“q@) QuewjseauT
uo uanqey
(‘a) Aqtnbe
uo uanjey
106
3.6 SUMMARY
In order to develop a predictive model for business
failure in the restaurant industry and simultaneously
determine whether the financial variables of a predictive
model for business failure in the restaurant industry are the
same as in the hotel industry, the samples consisting of 23
failed and 23 non-failed restaurant firms along with 15 failed
and 15 non-failed hotel firms, all within the period of 1982-
1993, were constructed. The predictive business models were
developed through logistic regression analysis employing 8
financial variables based on one year prior to business
failure.
The model for each industry was tested at two and three
years prior to business failure. Also the model for the
restaurant industry was applied to actual bankrupt firms in
order to investigate whether the prediction model for business
failure can be applied to actual bankrupt firms in the
restaurant industry. The above tasks were pursued as as a
means of validating the models.
Finally, in order to determine whether the financial
variables that are associated with reorganization in the
restaurant industry are different from those that are
associated with liquidation, the sample consisting of 14
reorganizers and 10 liquidators in the restaurant industry was
constructed. The relationship between reorganization and
107
liquidation was investigated through logistic regression
analysis employing two sets of indicators for capital
structure and profitability.
There were 4 indicators for capital structure and 5
indicators for profitability. This method was used to capture
the information which may be difficult to obtain if one
indicator for capital structure and one for profitability were
employed.
108
CHAPTER 4
RESULTS AND DISCUSSION
4.1 RESULTS
4.1.1 The Restaurant Industry
In order to investigate whether business failure can be
predicted and which financial variables can predict business
failure in the restaurant industry, logistic regression
analysis was conducted employing the dependent variable
(failed and non-failed group) and 8 independent variables.
Table 12 provides the results of the full model
consisting of all independent variables as well as the model
consisting of variables selected through stepwise logistic
regression. Since there was no indication which variables
were important from the full model, stepwise logistic
regression was employed.
Although two models were significant at 0.05 level as
indicated by -2LL (-2 times log of likelihood), the model
consisting of two variables (cashflow per share and total debt
divided by invested capital) was selected as the prediction
model for business failure in the restaurant industry. It was
chosen because it offered a higher classification accuracy
(exceeding 90%), compared to the full model which had a
classification accuracy of 81%.
109

Table 12. Logistic Regression Analysis in the Restaurant Industry
Full Model:
-2LL = 56.247 (Probability, 0.0001)
Classification accuracy: 81.80%
Variable Parameter Standard Wald Probability Estimate Error Chi-Square
Xx, -19.1586 31.5904 0.3678 0.5442
X, -~12.9585 16.4282 0.6222 0.4302
X, -10.9077 19.7527 0.3049 0.5808
X, 0.4703 0.6928 0.4608 0.4973
X,. 12.5555 21.7272 0.3339 0.5634
X, 0.0208 0.0443 0.2213 0.6381
X, 0.1158 0.1779 0.4241 0.5149
X, -1.4961 2.9518 0.2569 0.6123
Model through stepwise logistic selection (Probability, 0.1)
-2LL = 39.881 (Probability, 0.0001) Classification accuracy: 90.90%
Variable Parameter Standard Wald Probability Estimate Error Chi-Square
X, -2.9902 0.97 9.40 0.0022
X, 0.0405 0.02 6.62 0.0101
Current ratio X_:
X,: Cashflow per share X,: Total asset turnover X,: Operating cycle X,: Sales divided by net property, plant, & equipment X,: Long-term debt divided by common equity X,: Total debt divided by invested capital X,: Total assets divided by common equity
1. Intercepts were not included in the models because logistic regression analyses could not converge with intercepts
110
The model is presented as follows:
Y = -2.9902X, + 0.0405xX, (4.1.1a)
Where,
Y: business failed or non-failed group X,: cashflow per share X_: total debt divided by invested capital
Coefficient of cashflow per share was -2.9902, and
coefficient of total debt divided by invested capital was
0.0405. As indicated in table 13 these two variables are not
highly correlated. Figures 1-2 provide Pearson and deviance
residuals for the restaurant sample. These diagnostics
illustrate the adequacy of the model and which firms cannot
fit the model. The cases which had Pearson and deviance
residuals extremely distant from zero can be considered the
firms which cannot fit the model well.
Probability of business failure of the sample and summary
of classification accuracy at one, two, and three years prior
to business failure are shown in tables 14-16. Classification
accuracy was 90%, 88%, and 75%, respectively, at one, two, and
three years prior to business failure. As indicated in tables
14-16, 5 bankrupt firms were included in the failed group.
In summary, two financial variables, cashflow per share
along with total debt divided by invested capital, can predict
business failure with 90%, 88%, and 75% accuracy at one, two,
and three years, respectively, prior to business failure in
the restaurant industry.
111
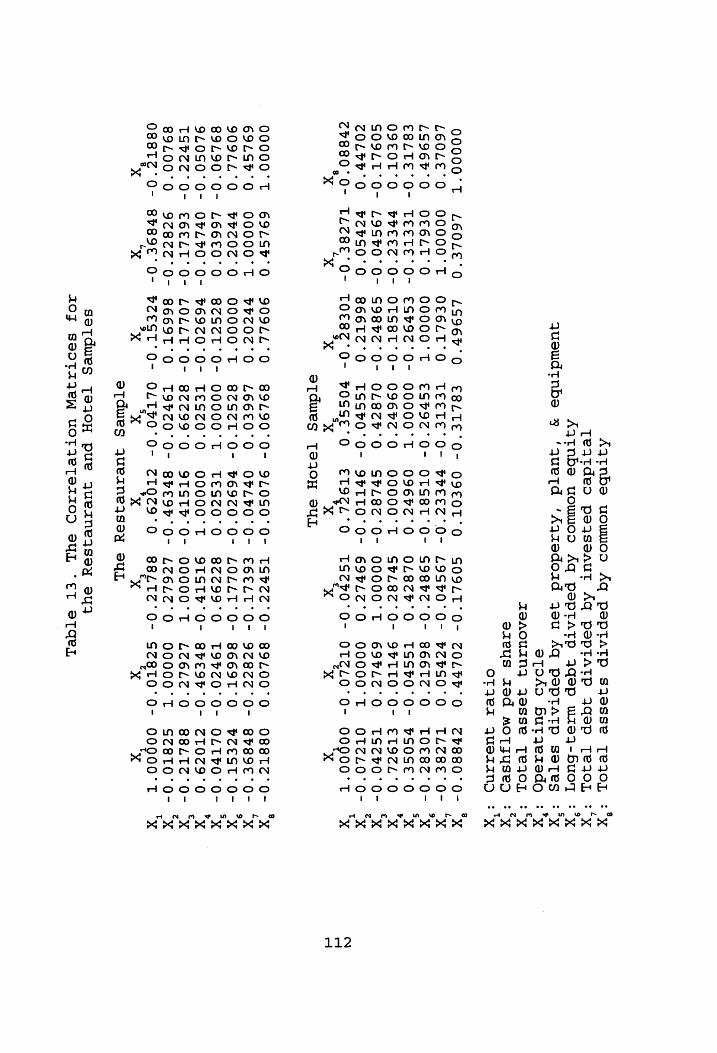
O0000°T
L60LE'O
L60LE°O
O0000'°T
LS96%°O0
O€6LT’O
CB8LTE°O-
TEeete’ 0-
O9E0T°O
PvVEET'O-
SO9LT°O-
L9S%0°0-
COLVV'O
vZ2v7S0'0 cv880 O- TLZ8t
' 0-
X X
O0000°T
69L457°0
69LS%7°0
O0000'°T
909LL°0
vPZ0Z'O
89L90°0O-
L66£0°0
9L0S0°0-
OVL~0’O-
TSVZZ°O-
C6ELT’O-
89L00°O0
928722°0-
O88T¢'0-
B8P89t O-
Xx x
Ajytnbe
uowwod
Aq pepTtaTp
syesse
Teo]
Teqtdes
paeyseaut
Aq peptATtp
jAqep Teo,
Ajtnbe
uowuods
Aq paptatp
3qep
wrzseq-buoy
queudtnbs
¥
LS960°O0
t8ZLTE
x Xx
aTdwes
90944°0
89490°
vvcO~°0
+ L66E0°
OO000°T
82eS2T° 8cS7T°O-
00000°
pv6e9gzco°O- TESZo°
LOLLT’°O-
82299"
8669T°O
T9VZO’
veeSt O-
OLTHO™
x x
‘quetd
‘Aqazedoad
yeu Aq
peptatp
setes
aToAD
Hbutqjezedo ZsaournN,
Jaesse Teo]
azeys
ted
motTyuseo
OTqerA quaezIND
°O- O9C0T°O
SO9LT°O-
COLVP'O
Z2v880'°0- Oft6LT°O
TEETE’
OO0000°T
e509"
eSv9z*O0-
00000°
OTS8T°O-
09602"
S980Z°O-
OL8BZT’ 866TZ°O
TSSF0°
TOtBC
O- vOSSE”
O- VPEEZT’
O- LOGVO’O-
HZPVSO0°O TLZ8E'°0-
O- OTS8T°O-
S98BHZ°O-
866TCZ°O
TOEBC'O-
tT 09672°O
OL8ZtV°O
TSS70'O-
BSOSE'O
0 O0000°T
SVLEB7°O-
9PTTO°O-
ET9TL'O
0 SbLE8~Z°O-
OOO00’T
69%7L2°O
TSZt0'0-
O- 9PTTO°O-
697L7°O
QOOO00'T
OTZL0'°O-
0 eT9¢4°O0
TSePO'O-
OTZL0°O-
OO0O00'T
X xX
X X
TS30H
SUL
O- 9L0SO0°O-
TSPZZ°O-
B89L00°O
O88TZe'0-
0 OVLPO'O-
C6ELT’O-
928727T°O- BPB9E'O-
O- b697Z0°0-
LOLLT’°O-
8669T°O
He2EST’O-
T TEsSztO° 0
822c99°O0 T9'2Z0'O-
OLTVO'O-
O OO0000°T
Y9TSTV’O-
8PE9F'O-
Z2T0Z9'D
O 9TSTV'O-
OO000'T
Le6L72°O
B88LTZ'O-
O- 87t90'0-
L76L7°O
OND0DO'T
S2sTto’o-
O- €TQZ9°O
S88LTC
O- S2gTo'O-
00000'T
Xx X
X X
aTdwes
jqueimneqssy sul
soeTdues
[ae qoH
pue queaznejsey
ou3 AOJ
SOOAQVEW
UOTRIeTSAAOD
SUL ‘ET
STAeL
oe ef 96 oe 00 of
aA Nem YF HO EF @
oo fe
Ps PS PS OS PS OS aA nn fF wm DO @
mS Pe OS OS PS OS AH ON OMh HTH OE @
PS PSP PS OS OS PS PS
112
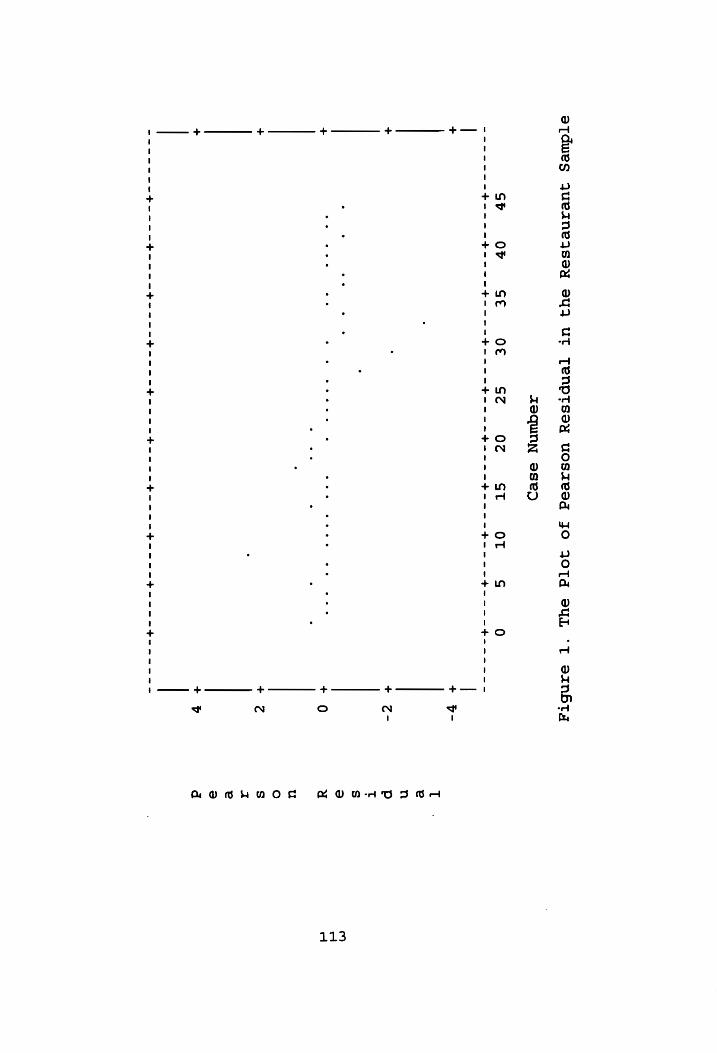
atTdwesg jueineqjsey
ey. UT
TeNptTsey
uoszeeq
JO 3OTd
SUL ‘T
eaznbty
zequnn
esep
SY Ov
St Of
G2 Oc
ST OT
S 0
-~------ $m
ante
te
a te
ti
ee et
te
t _
+ +
Z-
+
eee
eee
° cr
neers
me
+
0
+ +
2
+ +
C~SouvnAD SORA aAVeHNOE
113
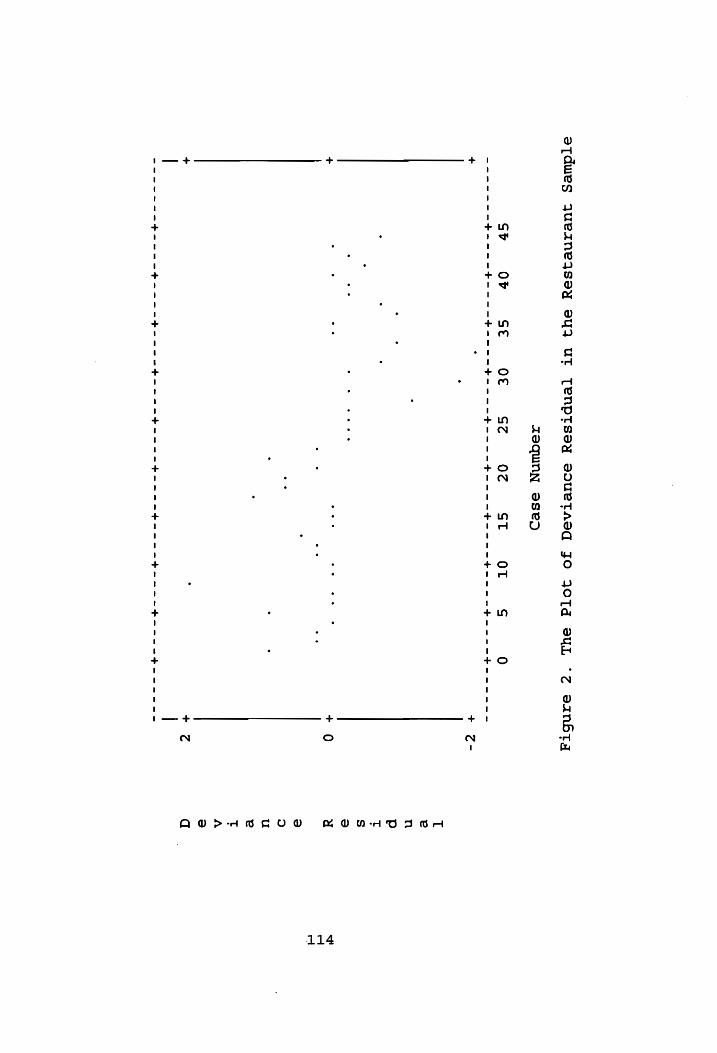
etTdwes Jueine sey
sy
uT [TenptTsey
soueTASeq
Jo 40Ta
SUL ‘Zz
eanbty
zequnn
eseo
SP? Ov
St Of
SZ Oc
ST OT
S 0
------- t----t---- 4-5-4
$e
ee ee $e et
- - -
+ °
+ Z-
+
rf
e °*
* e
CJ
° e
. *.
° +
0
+ °
+ Z
~MCVNHHUDSA OAH AVDVrPvAH woe YD
114
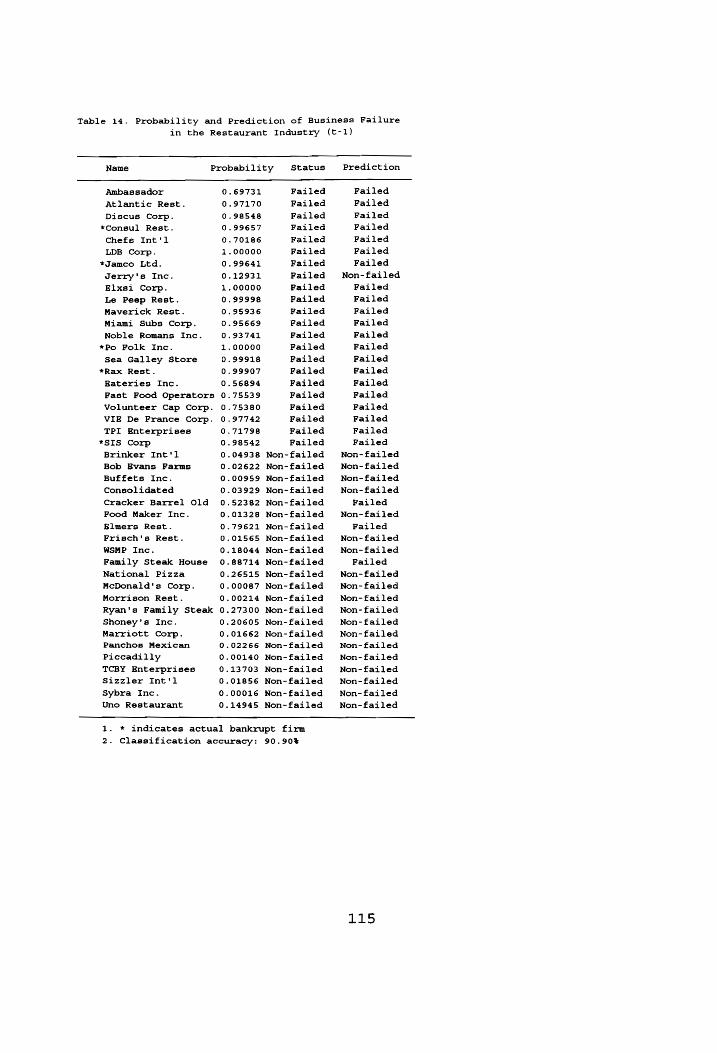
Table 14. Probability and Prediction of Business Failure
in the Restaurant Industry (t-1)
Name Probability Status Prediction
Ambassador 0.69731 Failed Failed
Atlantic Rest. 0.97170 Failed Failed
Discus Corp. 0.98548 Failed Failed
*Consul Rest. 0.99657 Pailed Failed
Chefs Int'l 0.70186 Failed Failed
LDB Corp. 1.00000 Failed Pailed
*Jamco Ltd. 0.99641 Failed Failed
Jerry's Inc. 0.12931 Failed Non-failed
Elxsi Corp. 1.00000 Failed Failed
Le Peep Rest. 0.99998 Failed Failed
Maverick Rest. 0.95936 Failed Pailed
Miami Subs Corp. 0.95669 Failed Failed
Noble Romans Inc. 0.93741 Failed Failed
*Po Polk Inc. 1.00000 Failed Failed
Sea Galley Store 0.99918 Failed Failed
*Rax Rest. 0.99907 Failed Failed
Bateries Inc. 0.56894 Failed Pailed
Fast Food Operators 0.75533 Failed Failed
Volunteer Cap Corp. 0.75380 Failed Failed
VIE De France Corp. 0.97742 Failed Failed
TPI Enterprises 0.71798 Failed Failed
*SIS Corp 0.98542 Pailed Failed
Brinker Int'l 0.04938 Non-failed Non- failed
Bob Evans Farms 0.02622 Non-failed Non-failed
Buffets Inc. 0.00959 Non-failed Non- failed
Consolidated 0.03929 Non-failed Non-failed
Cracker Barrel Old 0.52382 Non-failed Failed
Food Maker Inc. 0.01328 Non-failed Non- failed
Elmers Rest. 0.79621 Non-failed Failed
Frisch's Rest. 0.01565 Non-failed Non- failed
WSMP Inc. 0.18044 Non-failed Non- failed
Family Steak House 0.88714 Non-failed Failed
National Pizza 0.26515 Non-failed Non- failed
McDonald's Corp. 0.00087 Non-failed Non-failed
Morrison Rest. 0.00214 Non-failed Non-failed
Ryan's Family Steak 0.27300 Non-failed Non-failed
Shoney's Inc. 0.20605 Non-failed Non-failed
Marriott Corp. 0.01662 Non-failed Non-failed Panchos Mexican 0.02266 Non-failed Non- failed
Piccadilly 0.00140 Non-failed Non-failed
TCBY Enterprises 0.13703 Non-failed Non-failed
Sizzler Int'l 0.01856 Non-failed Non- failed
Sybra Inc. 0.00016 Non-failed Non-failed
Uno Restaurant 0.14945 Non-failed Non- failed
1. * indicates actual
2. Classification accuracy: 90.90%
bankrupt firm
115
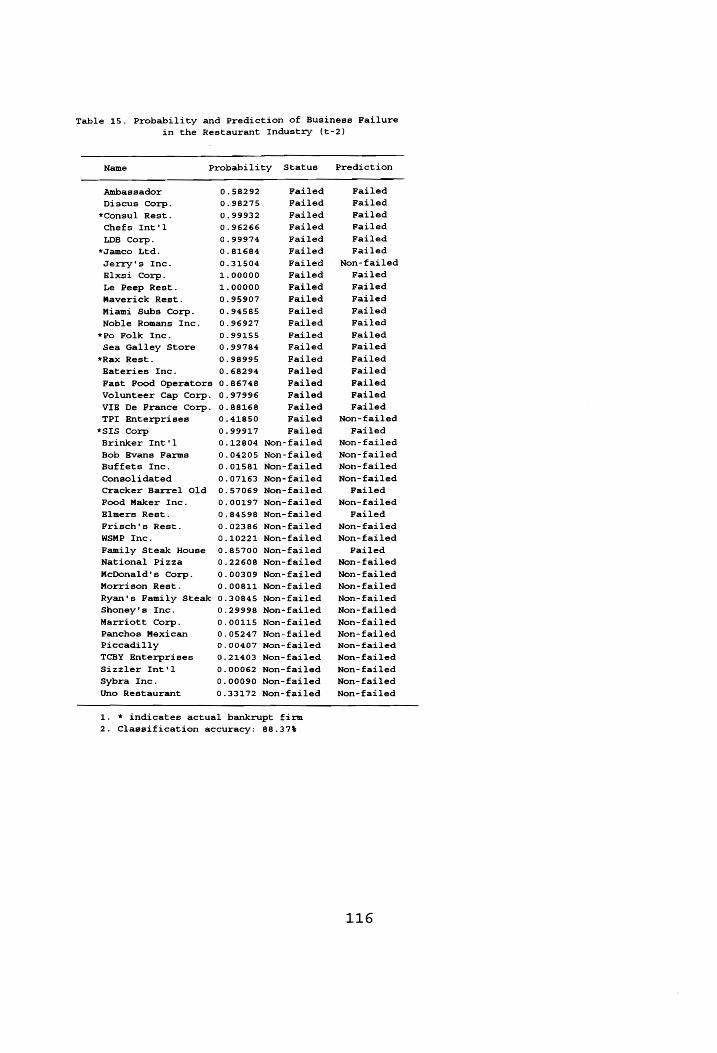
Table 15. Probability and Prediction of Business Failure in the Restaurant Industry (t-2)
Name Probability Status Prediction
Ambassador 0.58292 Failed Failed
Discus Corp. 0.98275 Pailed Failed
*Consul Rest. 0.99932 Failed Failed
Chefs Int'l 0.96266 Failed Failed
LDB Corp. 0.99974 Failed Failed
*Jamco Ltd. 0.81684 Failed Failed
Jerry's Inc. 0.31504 Pailed Non-failed
Elxsi Corp. 1.00000 Failed Failed
Le Peep Rest. 1.00000 Failed Failed
Maverick Rest. 0.95907 Failed Pailed
Miami Subs Corp. 0.94585 Failed Failed
Noble Romans Inc. 0.96927 Failed Failed
*Po Folk Inc. 0.99155 Failed Failed
Sea Galley Store 0.99784 Failed Failed
*Rax Rest. 0.98995 Failed Failed
Rateries Inc. 0.68294 Failed Failed
Fast Food Operators 0.86748 Failed Failed
Volunteer Cap Corp. 0.97996 Failed Failed
VIE De France Corp. 0.88168 Failed Failed
TPI Enterprises 0.41850 Failed Non-failed
*SIS Corp 0.99917 Failed Failed
Brinker Int'l 0.12804 Non-failed Non- failed
Bob Evans Farms 0.04205 Non-failed Non- failed
Buffets Inc. 0.01581 Non-failed Non- failed
Consolidated 0.07163 Non-failed Non- failed
Cracker Barrel Old 0.57069 Non-failed Failed
Food Maker Inc. 0.00197 Non-failed Non- failed
Elmers Rest. 0.84598 Non-failed Failed
Prisch's Rest. 0.02386 Non-failed Non-failed
WSMP Inc. 0.10221 Non-failed Non- failed
Family Steak House 0.85700 Non-failed Failed
National Pizza 0.22608 Non-failed Non- failed
McDonald's Corp. 0.00309 Non-failed Non-failed
Morrison Rest. 6.00811 Non-failed Non- failed
Ryan's Family Steak 0.30845 Non-failed Non-failed
Shoney's Inc. 0.29998 Non-failed Non-failed
Marriott Corp. 0.00115 Non-failed Non-failed
Panchos Mexican 0.05247 Non-failed Non-failed
Piccadilly 0.00407 Non-failed Non-failed
TCBY Enterprises 0.21403 Non-failed Non- failed
Sizzler Int'l 0.00062 Non-failed Non- failed
Sybra Inc. 0.00090 Non-failed Non-failed
Uno Restaurant 0.33172 Non-failed Non-failed
1. * indicates actual bankrupt firm
2. Classification accuracy: 88.37%
116

Table 16. Probability and Prediction of Business Failure
ain the Restaurant Industry (t-3)
Name Probability Status Prediction
Ambassador 0.31461 Failed Non-failed
Atlantic Rest. 0.93857 Pailed Failed
Discus Corp. 0.98930 Failed Pailed
*Consul Rest. 0.99999 Pailed Failed
Chefs Int'l 0.75451 Failed Failed
LDB Corp. 0.48245 Failed Non-failed
*Jamco Ltd. 0.98158 Failed Failed
Jerry's Inc. 0.01257 Failed Non-failed
Elxsi Corp. 1.00000 Failed Failed
Le Peep Rest. 0.99898 Failed Pailed
Maverick Rest. 0.96973 Failed Failed
Miami Subs Corp. 0.82440 Failed Pailed
Noble Romans Inc. 0.39403 Failed Non-failed
*Po Folk Inc. 0.06666 Failed Non- failed
Sea Galley Store 0.99966 Pailed Pailed
*Rax Rest. 0.25466 Failed Non-failed
Bateries Inc. 0.42613 Failed Non-failed
Fast Food Operators 0.68551 Failed Pailed
Volunteer Cap Corp. 0.48296 Failed Non-failed
VIE De France Inc. 0.81051 Failed Failed
TPI Enterprises 0.67924 Failed Failed
*SIS Corp 0.96118 Failed Failed
Brinker Int'l 0.30955 Non-failed Non- failed
Bob Evans Farms 0.03681 Non-failed Non- failed
Buffets Inc. 0.35089 Non-failed Non-failed
Consolidated 0.03919 Non-failed Non-failed
Cracker Barrel Old 0.63169 Non-failed Failed
Pood Maker Inc. 0.01396 Non-failed Non- failed
Elmers Rest. 0.88008 Non-failed Failed
Prisch's Rest. 0.02718 Non-failed Non-failed
WSMP Inc. 0.15764 Non-failed Non-failed
Family Steak House 0.86309 Non-failed Failed
National Pizza 0.33382 Non-failed Non- failed
McDonald's Corp. 0.00943 Non-failed Non-failed
Morrison Rest. 0.02321 Non-failed Non- failed
Ryan's Family Steak 0.41688 Non-failed Non-failed
Shoney's Inc. 0.48998 Non-failed Non-failed
Marriott Corp. 0.00027 Non-failed Non- failed
Panchos Mexican 0.04596 Non-failed Non-failed
Piccadilly 0.00284 Non-failed Non-failed
TCBY Enterprises 0.40645 Non-failed Non-failed
Sizzler Int'l 0.00109 Non-failed Non- failed
Sybra Inc. 0.00637 Non-failed Non-failed
Uno Restaurant 0.27155 Non-failed Non- failed
1. * indicates actual
2. Classification accuracy:
bankrupt firm
75.00%
117
4.1.2 The Hotel Industry
In order to identify which financial variables can
predict business failure in the hotel industry, the dependent
variable (failed and non-failed group) and 8 independent
variables were analyzed through logistic regression analysis.
Table 17 provides the results of the full model consisting of
all independent variables and the model consisting of cashflow
per share (its p-value was 0.07 from the full model).
Although two models were significant at 0.05 level as
indicated by -2LL (-2 times log of likelihood), the model
consisting of cashflow per share was selected as_ the
prediction model for business failure in the hotel industry.
That model was selected because it showed a classification
accuracy (92%) superior to the full model's classification
accuracy of 68%.
The model is presented as follows:
Y = -2.0319X, (4.1.2a)
where,
Y: business failed or non-failed group X,: cashflow per share
118
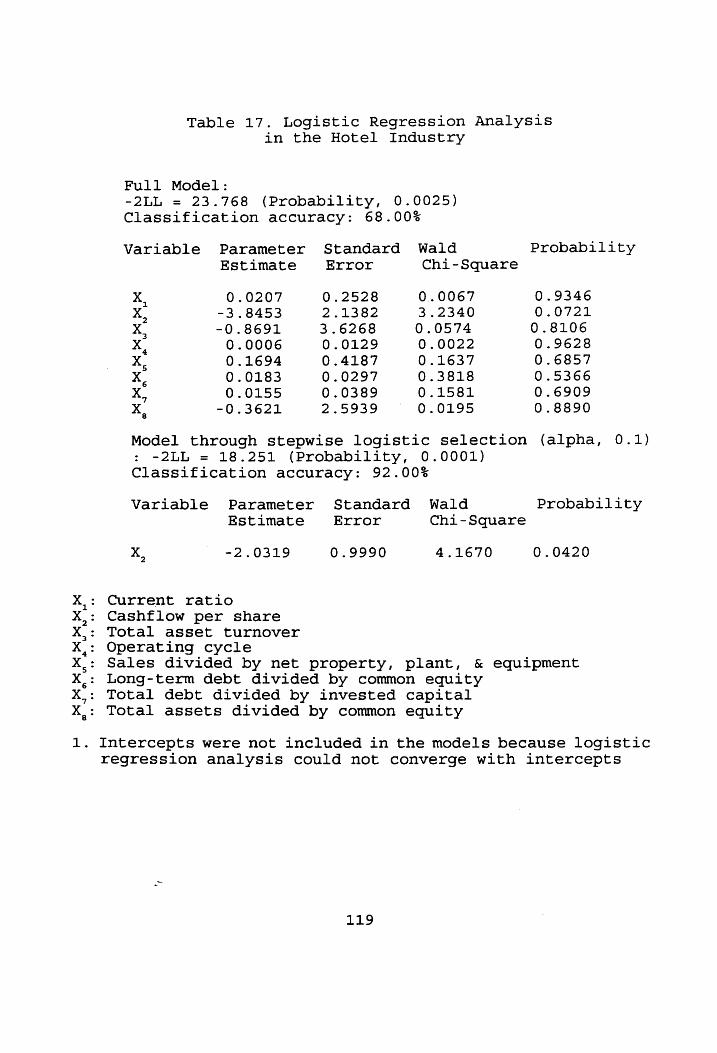
Table 17. Logistic Regression Analysis in the Hotel Industry
Full Model: -2LL = 23.768 (Probability, 0.0025) Classification accuracy: 68.00%
Variable Parameter Standard Wald Probability Estimate Error Chi-Square
xX, 0.0207 0.2528 0.0067 0.9346 X, -~3.8453 2.1382 3.2340 0.0721 X, ~0.8691 3.6268 0.0574 0.8106 X, 0.0006 0.0129 0.0022 0.9628 X, 0.1694 0.4187 0.1637 0.6857 X. 0.0183 0.0297 0.3818 0.5366 X, 0.0155 0.0389 0.1581 0.6909 X, ~-0.3621 2.5939 0.0195 0.8890
Model through stepwise logistic selection (alpha, 0.1) -2LL = 18.251 (Probability, 0.0001)
Classification accuracy: 92.00%
Variable Parameter Standard Wald Probability Estimate Error Chi-Square
X -2.0319 0.9990 4.1670 0.0420
Current ratio Cashflow per share Total asset turnover Operating cycle Sales divided by net property, plant, & equipment Long-term debt divided by common equity Total debt divided by invested capital Total assets divided by common equity Po
PSS
OM
OM O
M ost
NH
HW Fk
WwW
ND
PH
oe
66
€8
08
Ff #0
ef
8
1. Intercepts were not included in the models because logistic regression analysis could not converge with intercepts
119
The coefficient of cashflow per share was -2.0319.
Figures 3-4 provide Pearson and deviance residuals for the
hotel sample. These diagnostics illustrate the model's
adequacy and which firms cannot fit the model. The cases
which had Pearson and deviance residuals extremely distant
from zero can be considered the firms which cannot fit the
model well. e
Probability of business failure of the sample and summary
of classification accuracy at one, two, and three years prior
to business failure are shown in tables 18-20. Classification
accuracy was 92%, 86%, and 75%, respectively, at one, two, and
three years prior to business failure. As indicated in tables
18-20 two bankrupt firms were included in the failed group.
In summary, the financial variable, cashflow per share
(coefficient: -2.0319), can predict business failure with 92%,
86%, and 75% accuracy@at one, two, and three years,
respectively, prior to business failure in the hotel industry.
120
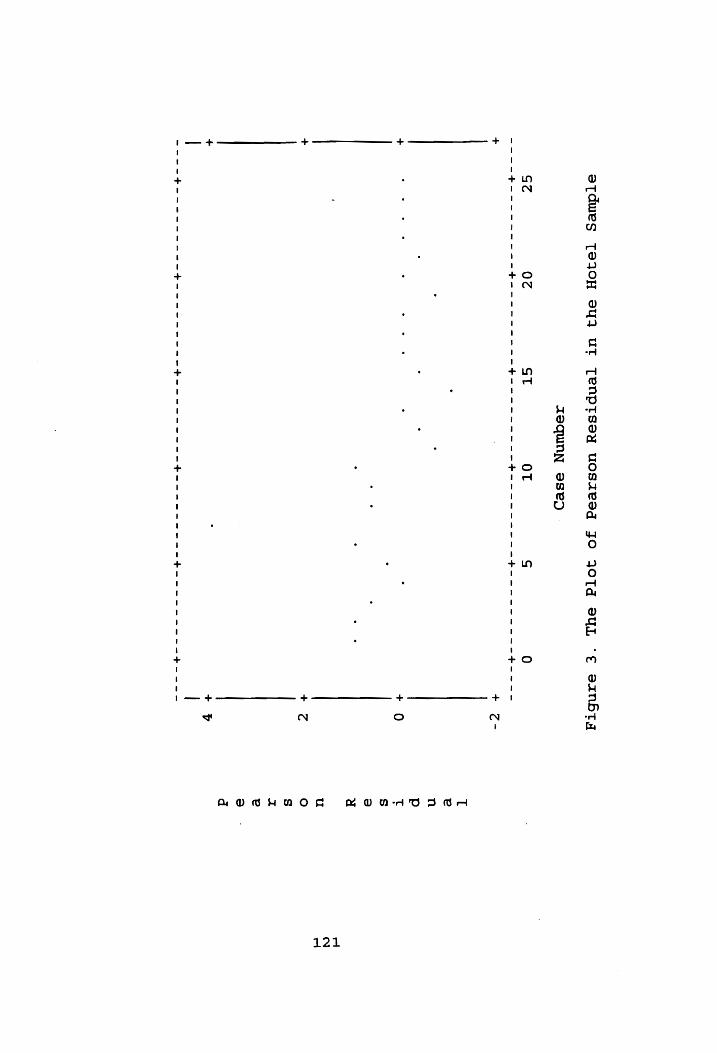
aTdwes
[TeIOH eyQ
UT TeNpTsaey
uoszeded
JO AOTd
suL
‘€ eArNbry
zequnyn eseo
SZ 0c
ST OT
S 0
~---4$--------- +--------- $--------- +--------- $--------- +----
+ +
Z-
+ ae
. woe
. +0
+ tc
+ +
%
wenn Oa we AVegeHaog
121
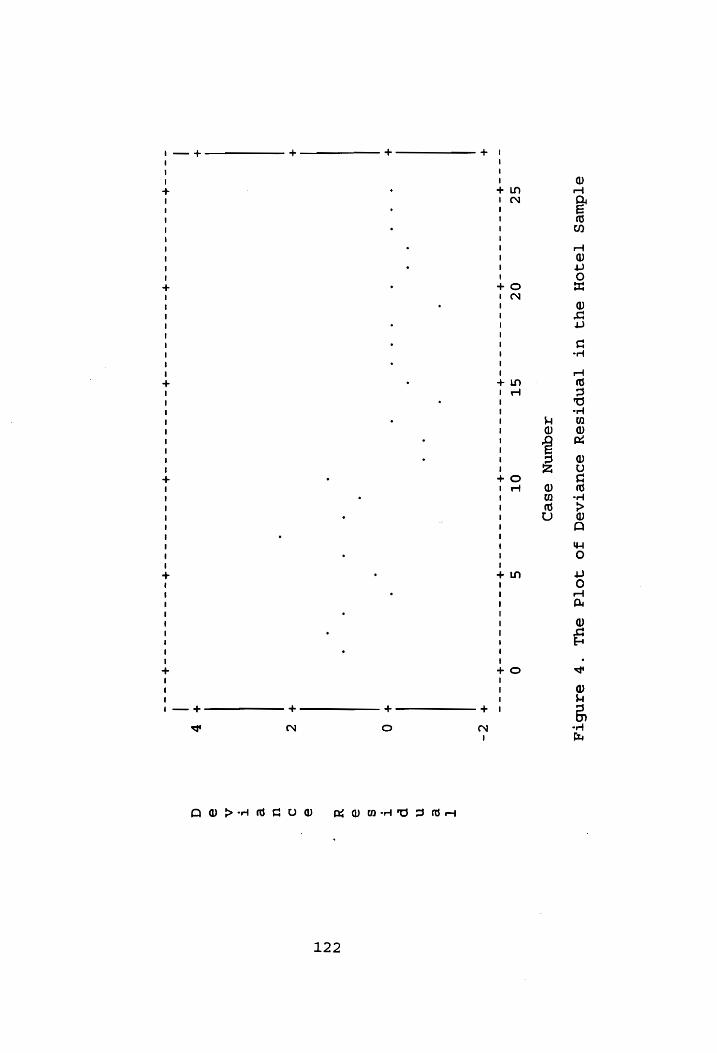
etTdwes [TeIOH
sy
UT TeNptsey
souetasag
Jo 4OTd
SUL °F
eANbty
zequnn
eased
SZ 0c
ST OT
S 0
----4-------+-- $--------- $-+------- +--------- $--------+-
+---- +
+ Z-
+ Lone
. .
+ 0
+ +
¢
+ +
¥
MBVNoHATDS OH AWYrPaAweUY
122
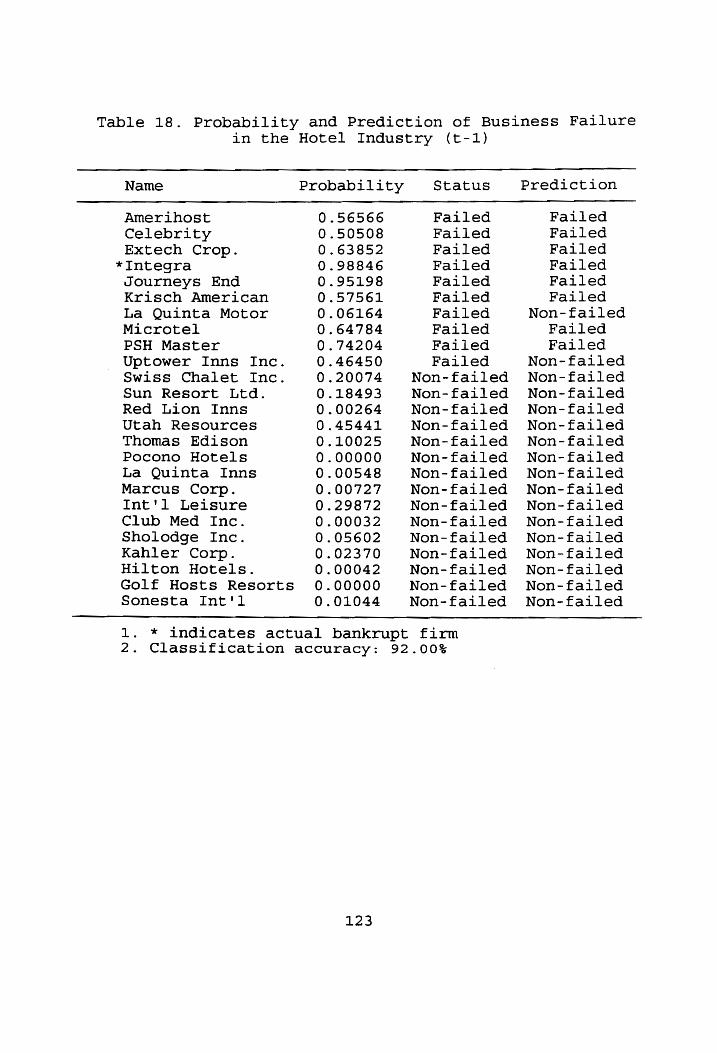
in the Hotel Industry (t-1) Table 18. Probability and Prediction of Business Failure
Name Probability Status Prediction
Amerihost 0.56566 Failed Failed Celebrity 0.50508 Failed Failed Extech Crop. 0.63852 Failed Failed
*Integra 0.98846 Failed Failed Journeys End 0.95198 Failed Failed Krisch American 0.57561 Failed Failed La Quinta Motor 0.06164 Failed Non- failed Microtel 0.64784 Failed Failed PSH Master 0.74204 Failed Failed Uptower Inns Inc. 0.46450 Failed Non-failed Swiss Chalet Inc. 0.20074 Non-failed Non-failed Sun Resort Ltd. 0.18493 Non-failed Non-failed Red Lion Inns 0.00264 Non-failed Non-failed Utah Resources 0.45441 Non-failed Non-failed Thomas Edison 0.10025 Non-failed Non-failed Pocono Hotels 0.00000 Non-failed Non-failed La Quinta Inns 0.00548 Non-failed Non-failed Marcus Corp. 0.00727 Non-failed Non-failed Int'l Leisure 0.29872 Non-failed Non-failed Club Med Inc. 0.00032 Non-failed Non-failed Sholodge Inc. 0.05602 Non-failed Non-failed Kahler Corp. 0.02370 Non-failed Non-failed Hilton Hotels. 0.00042 Non-failed Non-failed Golf Hosts Resorts 0.00000 Non-failed Non-failed Sonesta Int'l 0.01044 Non-failed Non-failed
1. * indicates actual 2. Classification accuracy:
123
bankrupt firm 92.00%
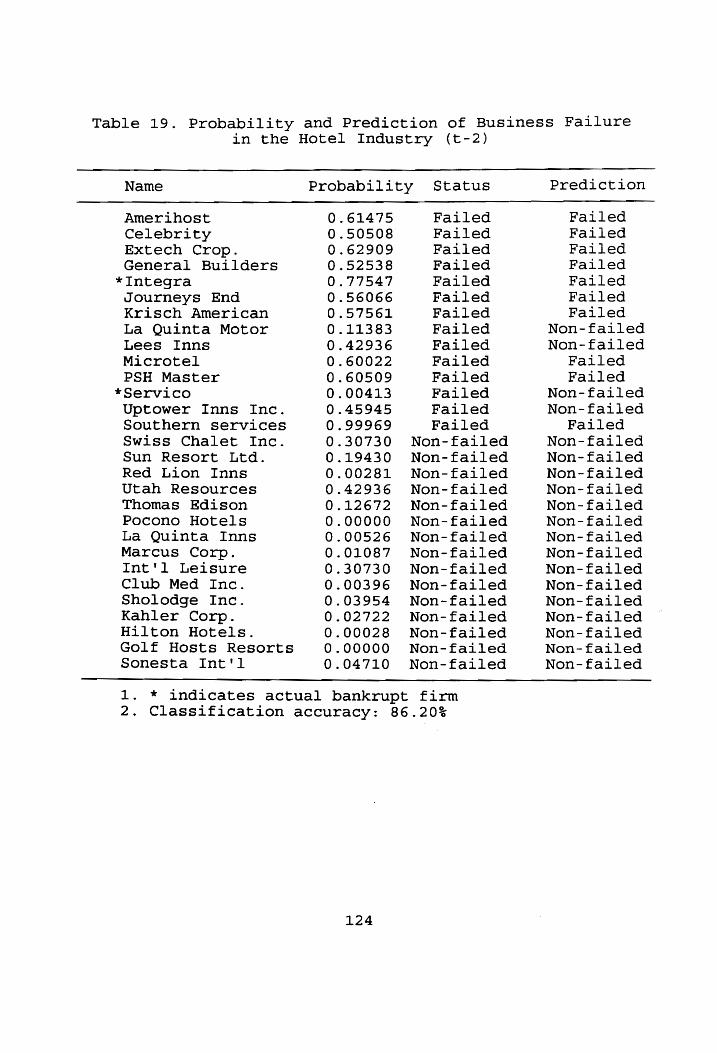
in the Hotel Industry (t-2) Table 19. Probability and Prediction of Business Failure
Name Probability Status Prediction
Amerihost 0.61475 Failed Failed Celebrity 0.50508 Failed Failed Extech Crop. 0.62909 Failed Failed General Builders 0.52538 Failed Failed
*Integra 0.77547 Failed Failed Journeys End 0.56066 Failed Failed Krisch American 0.57561 Failed Failed La Quinta Motor 0.11383 Failed Non-failed Lees Inns 0.42936 Failed Non-failed Microtel 0.60022 Failed Failed PSH Master 0.60509 Failed Failed
*Servico 0.00413 Failed Non-failed Uptower Inns Inc. 0.45945 Failed Non-failed Southern services 0.99969 Failed Failed Swiss Chalet Inc. 0.30730 Non-failed Non-failed Sun Resort Ltd. 0.19430 Non-failed Non- failed Red Lion Inns 0.00281 Non-failed Non-failed Utah Resources 0.42936 Non-failed Non-failed Thomas Edison 0.12672 Non-failed Non-failed Pocono Hotels 0.00000 Non-failed Non-failed La Quinta Inns 0.00526 Non-failed Non-failed Marcus Corp. 0.01087 Non-failed Non-failed Int'l Leisure 0.30730 Non-failed Non-failed Club Med Inc. 0.00396 Non-failed Non-failed Sholodge Inc. 0.03954 Non-failed Non- failed Kahler Corp. 0.02722 Non-failed Non-failed Hilton Hotels. 0.00028 Non-failed Non-failed Golf Hosts Resorts 0.00000 Non-failed Non-failed
Sonesta Int'l 0.04710 Non-failed Non- failed
1. * indicates actual bankrupt firm 2. Classification accuracy: 86.20%
124
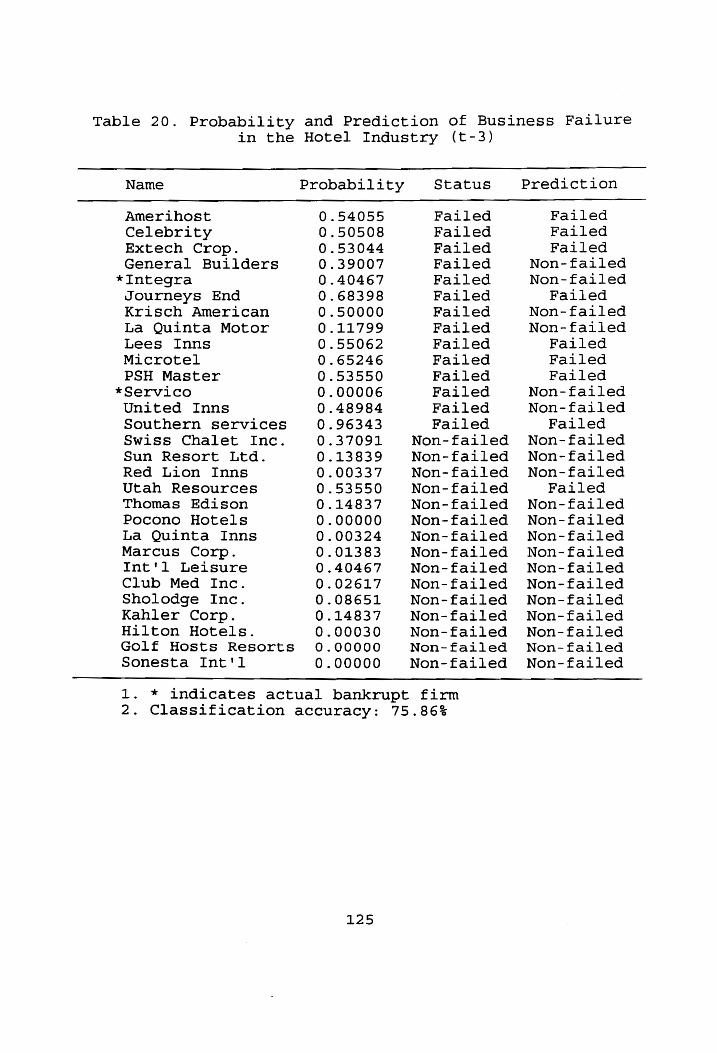
in the Hotel Industry (t-3) Table 20. Probability and Prediction of Business Failure
Name Probability Status Prediction
Amerihost 0.54055 Failed Failed Celebrity 0.50508 Failed Failed Extech Crop. 0.53044 Failed Failed General Builders 0.39007 Failed Non-failed
*Integra 0.40467 Failed Non-failed Journeys End 0.68398 Failed Failed Krisch American 0.50000 Failed Non-failed La Quinta Motor 0.11799 Failed Non-failed Lees Inns 0.55062 Failed Failed Microtel 0.65246 Failed Failed PSH Master 0.53550 Failed Failed
*Servico 0.00006 Failed Non-failed United Inns 0.48984 Failed Non-failed Southern services 0.96343 Failed Failed Swiss Chalet Inc. 0.37091 Non-failed Non-failed Sun Resort Ltd. 0.13839 Non-failed Non-failed Red Lion Inns 0.00337 Non-failed Non-failed Utah Resources 0.53550 Non-failed Failed Thomas Edison 0.14837 Non-failed Non-failed Pocono Hotels 0.00000 Non-failed Non-failed La Quinta Inns 0.00324 Non-failed Non-failed Marcus Corp. 0.01383 Non-failed Non-failed Int'l Leisure 0.40467 Non-failed Non-failed Club Med Inc. 0.02617 Non-failed Non-failed Sholodge Inc. 0.08651 Non-failed Non-failed Kahler Corp. 0.14837 Non-failed Non-failed Hilton Hotels. 0.00030 Non-failed Non-failed Golf Hosts Resorts 0.00000 Non-failed Non-failed
Sonesta Int'l 0.00000 Non-failed Non-failed
1. * indicates actual bankrupt firm 2. Classification accuracy: 75.86%
125

4.1.3 Application of the Model to bankrupt firms in the
Restaurant Industry
In order to investigate whether the predictive business
failure model can be applied to bankrupt firms in the
restaurant industry, the dependent variable (one group of
bankrupt firms) and two independent variables (cashflow per
share and total debt divided by invested capital) were
analyzed through logistic regression analysis. Of the 24
bankrupt firms not all of them had complete financial data for
each of the time periods under investigation. Thus the number
of bankrupt firms analyzed at t-1, t-2 and t-3 were not the
same .
The probability of bankruptcy for the sample of bankrupt
firms and summary of classification accuracy at one, two, and
three years prior to bankruptcy are shown in tables 21-23.
Classification accuracy was 100%, 46%, and 35%, respectively,
at one, two, and three years prior to bankruptcy.
Table 24 illustrates the probability of bankruptcy for
the bankrupt firms which had complete financial data at
intervals of one, two, and three years prior to bankruptcy.
Since some firms were deleted due to missing data for the
independent variables at different time periods, inferences
cannot be made about the probability of bankruptcy for these
firms.
In summary, the predictive business failure model
126
consisting of cashflow per share and total debt divided by
invested capital can predict bankruptcy with 100%, 46%, and
35% accuracy at one, two, and three years, respectively, prior
to bankruptcy for bankrupt firms in the restaurant industry.
127

Table 21. Probability and Prediction of Bankruptcy in the Restaurant Industry (t-1)
Name Probability Status Prediction
All American Burger 0.73505 Bankrupt Bankrupt Cattleguard 0.67864 Bankrupt Bankrupt
*Consul Restaurant 0.79815 Bankrupt Bankrupt El Pollo Asado 0.99557 Bankrupt Bankrupt Flanigan's 0.78807 Bankrupt Bankrupt Pizza Time Theater 1.00000 Bankrupt Bankrupt
*Po Folks 0.73212 Bankrupt Bankrupt *Rax Restaurant 0.64124 Bankrupt Bankrupt Southern Hospitality 0.97418 Bankrupt Bankrupt Victoria Stations 0.96955 Bankrupt Bankrupt
1. * indicates firms included in the failed group 2. Fourteen firms were excluded due to missing values for
independent variables 3. Classification accuracy: 100%
128
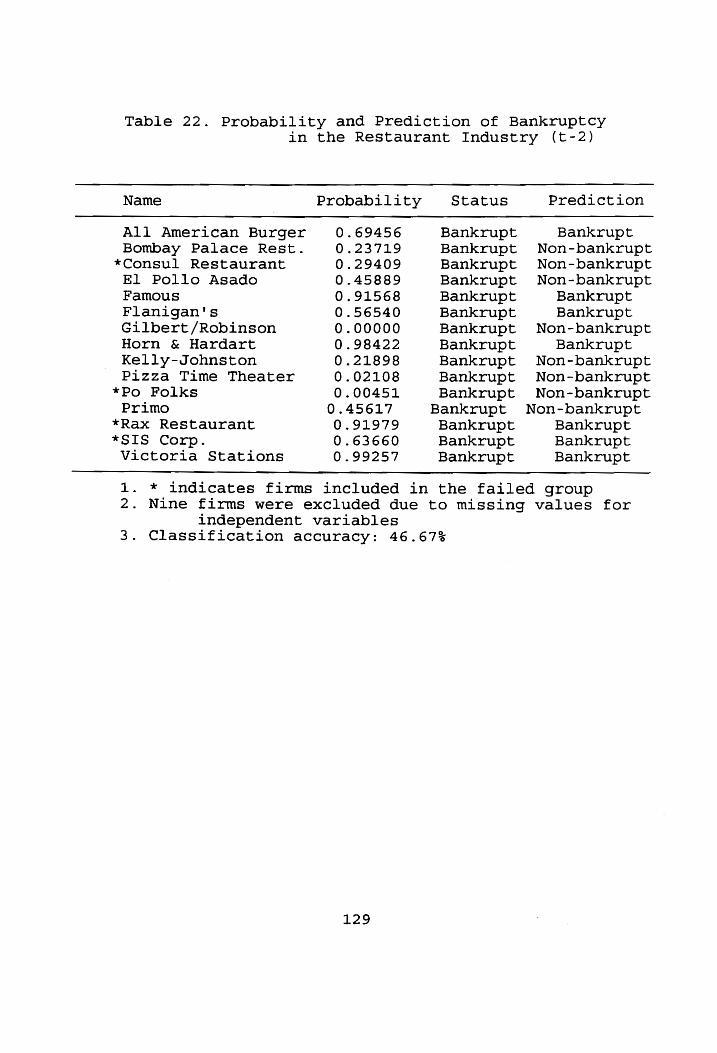
Table 22. Probability and Prediction of Bankruptcy
in the Restaurant Industry (t-2)
Name Probability Status Prediction
All American Burger 0.69456 Bankrupt Bankrupt Bombay Palace Rest. 0.23719 Bankrupt Non-bankrupt
*Consul Restaurant 0.29409 Bankrupt Non-bankrupt El Pollo Asado 0.45889 Bankrupt Non-bankrupt Famous 0.91568 Bankrupt Bankrupt Flanigan's 0.56540 Bankrupt Bankrupt Gilbert /Robinson 0.00000 Bankrupt Non-bankrupt Horn & Hardart 0.98422 Bankrupt Bankrupt Kelly-Johnston 0.21898 Bankrupt Non-bankrupt Pizza Time Theater 0.02108 Bankrupt Non-bankrupt
*Po Folks 0.00451 Bankrupt Non-bankrupt Primo 0.45617 Bankrupt Non-bankrupt
*Rax Restaurant 0.91979 Bankrupt Bankrupt *SIS Corp. 0.63660 Bankrupt Bankrupt Victoria Stations 0.99257 Bankrupt Bankrupt
1. * indicates firms included in the failed group 2. Nine firms were excluded due to missing values for
independent variables 3. Classification accuracy: 46.67%
129
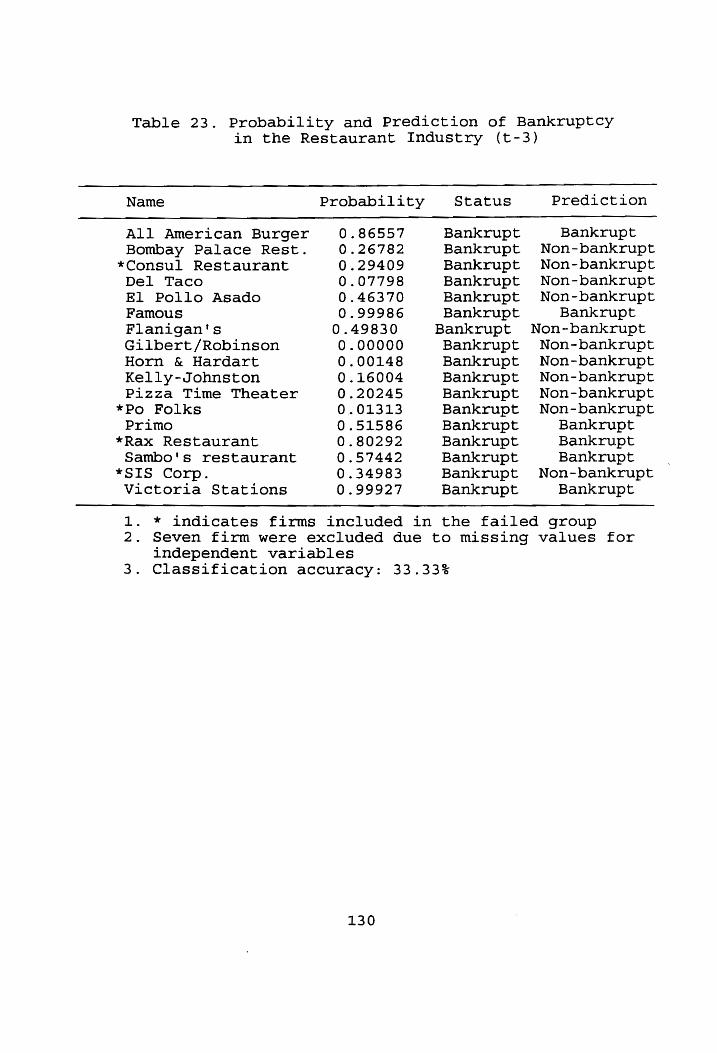
Table 23. Probability and Prediction of Bankruptcy in the Restaurant Industry (t-3)
Name Probability Status Prediction
All American Burger 0.86557 Bankrupt Bankrupt Bombay Palace Rest. 0.26782 Bankrupt Non-bankrupt
*Consul Restaurant 0.29409 Bankrupt Non-bankrupt Del Taco 0.07798 Bankrupt Non-bankrupt El Pollo Asado 0.46370 Bankrupt Non-bankrupt Famous 0.99986 Bankrupt Bankrupt Flanigan's 0.49830 Bankrupt Non-bankrupt Gilbert /Robinson 0.00000 Bankrupt Non-bankrupt Horn & Hardart 0.00148 Bankrupt Non-bankrupt Kelly-Johnston 0.16004 Bankrupt Non-bankrupt Pizza Time Theater 0.20245 Bankrupt Non-bankrupt
*Po Folks 0.01313 Bankrupt Non-bankrupt Primo 0.51586 Bankrupt Bankrupt
*Rax Restaurant 0.80292 Bankrupt Bankrupt Sambo's restaurant 0.57442 Bankrupt Bankrupt
*SIS Corp. 0.34983 Bankrupt Non-bankrupt Victoria Stations 0.99927 Bankrupt Bankrupt
1. * indicates firms included in the failed group 2. Seven firm were excluded due to missing values for
independent variables 3. Classification accuracy: 33.33%
130
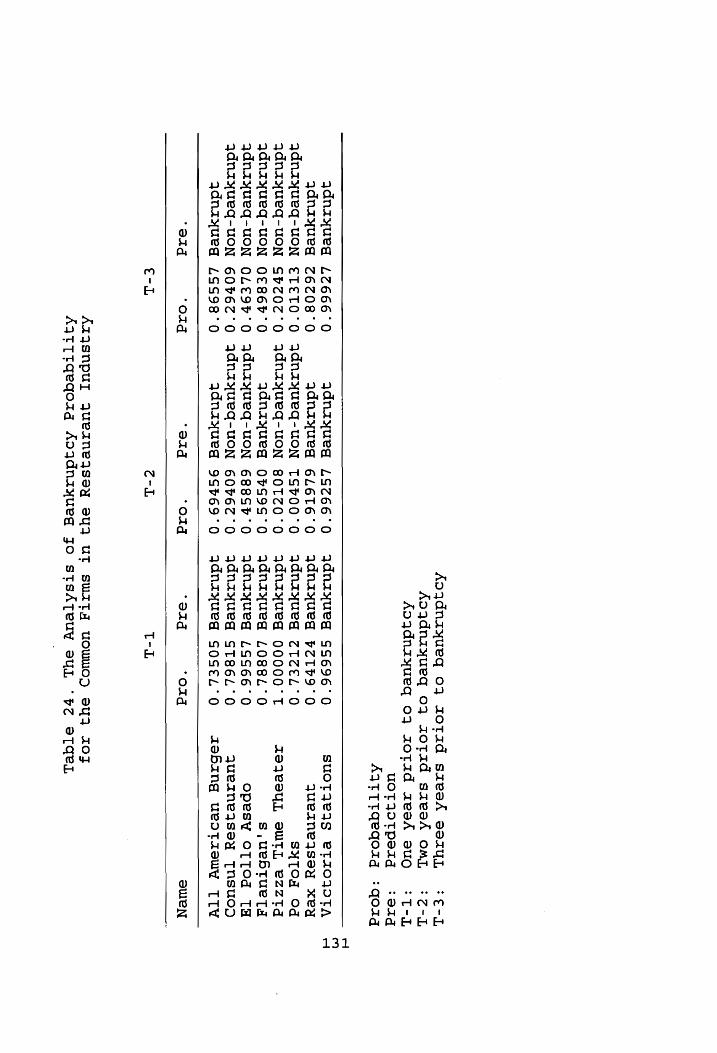
Aoqdnazyueq
of Aotad
sazestk soerzyL
Aoqdnazyueq
of A0otzd
szesd
om], Aoqdnayueq
of z0TAd
azesk suo
Od NM i
Ahh
UOTIOIpergd :
Aatttqeqozq :qozd
ydnzyueg
17666°0
qdnayueg
L96766°0 y4dnzyueg
$S9696°0 suotjeqs
eTzAOIOTA qdnayueg
76Z08°0
qdnayueg
64616°0
ydnayueg P71b9'0
queineqssy
xey qdnayueq-uon
€TE€TO'O A3dnazyueq-uUON
TS~00°'O0 yAdnazayueg
ZTZEL‘O SYTOd
Od qdnayueq-uon
¢7z0z°'O Adnayueq-UON
80TZ0°O
ydnayUeg 00000°T
ZazesyL
swtL ezztd
adnayueq-uoN
O€86b'0
qdnayueg
07S9S°0
yAdnazyuReg 1088L°0
Ss ,uebtueTa
qdnayueq-uon
O0L€9~'O Adnazyueq-uON
688Sb'0 Adnazayueg
19966°0
opesy OTTOd
TH qdnayueq-uonN
60%62°0
Jdnazayueq-uon 60'67°0
Adnayueg
ST86L'0 queineqssy
[NnsuoD qdnayueg
149998°0 qdnayueg
99769°0
aAdnayueg SOSEL°'0
2ebazng ueotzswy
TIW
mel
“Olg
“otd
‘Old
“3id
“Old
SUWeN
t-d f-L
T-L
AarAsnpul
querzneqyssy
v4
ut
swatyg
wuowwmop
suyuy aAogJ
Aqatttqeqorzg Aoqdnayueg
Jo stsATeuy
syuL “FZ
eTqeL
131
4.1.4 The relationship of Reorganization and Liquidation in
the Restaurant Industry
In order to investigate whether reorganization and
liquidation are dependent on each other, the dependent
variable (reorganizers and liquidators) and independent
variables (indicators of capital structure, profitability ,and
their interaction term) were analyzed through logistic
regression analysis. The significance of the coefficients of
interaction terms at one, two, and three years prior to
bankruptcy (reorganization or liquidation) are shown in tables
25-27.
In summary, the 20 interaction terms of a set of 4
indicators of capital structure and a set of 5 indicators of
profitability were not consistently significant at intervals
of one, two, and three years prior to bankruptcy at 0.05
level.
132
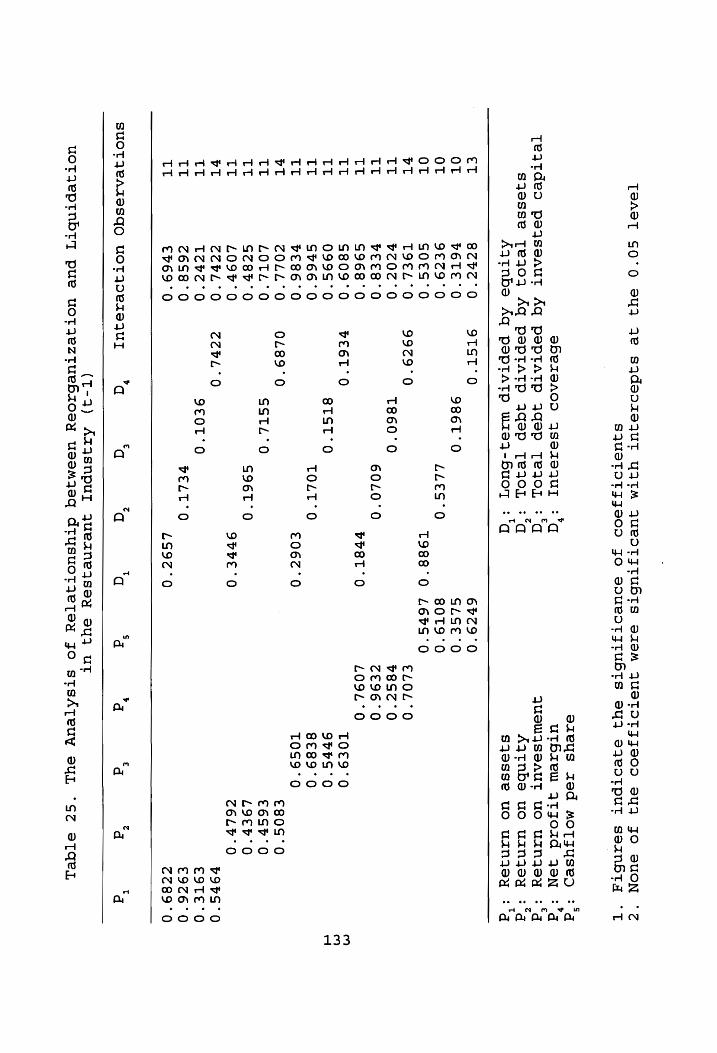
TPAST
SO'O Sy
2e SqdedreqUT
YATM
4UeOTJTUBTS
|e7aM JUSTOTJJSOO
|syq JO
SuUON °Z
SJUSTOTJJSOO
JO soOueOTIJTUBIS
sy
aeAeotTput seanbtq
‘T
areus Ted
moTjyused :*d
eaBereaod
ysezequy
:"q utbzew
3atjgozd jen
:"a Teqatdeo
peqseaut
Aq peptatp
jqep TeqoL
:‘a quewjseauTt
uo uanjey
:‘g sjqesse
Tej0q
Aq peptatp
ajaqep TeqoL
:‘q Aytnbe
uo uanqay
:‘q Aatnbe
Aq paptatp
wieq-fuo7q :'q
sjesse uo
uinjey
:‘g
CT 82772
0
9TST’O
67290
OT p6eTte’O
SZ£S¢°0O OT
9¢79°0
LLesS’ 0
80T9°0O
OT soes’o
T988°0
L67S°0
VL T9EL’O
9929'°0
tLOL°O
TT yZ0Z 0
y8sz'o
TT pees’
O 6040°0
7£96°0
TT $968°0
vVvsST’ LO9L‘*O
TT S809°0
vE6T’O
TOE9'O
TT 099S°0
9~77S'°0 TT
S7v66°0
TOLT’O
8¢89°0
TT ves6'0
€06Z°
TOS9°O
as COLL’
O 0489°0
€80S°0
TT LOTL’O
c6SP7°0
TT Sc8V 0
S96T°O
L9CVvV'O TT
LO97°0
90TEC Z6LP°O
VL CZVL'O
CCVL'O
v9vs’oO
TT TCV?
OO c9Te'O
TT 76S8°0
vEeLTt’ oO
€9726°0
TT tv69°0
LS9Z°
7789 O
SuOTJeATESGO
UoTAOeZEeQqUI «O'G
a ‘a
"a “a
“da ‘a
(T-3) Az
Asnpul
Auerzaneqjsey
sayy ut
uoTjeptnbty
pue uotqeztuebzoey
usemjeq
dtysuotjejtey
go stsATeuw
suL
“St STqeL
133

TSAST
GO°O
BUR Je
SAdadAQUT
YATM
AUSOTFJTUBTS
279M
YUSTOTJJSOO
SyQ JO
SuUON °Z
SqUSTOTFFJSOO
JO sOueOTIJTUBTS
ayQ
sqzedtput
seaznbty
‘Tt
azeys zed
motyuse
:*q abezreaod
4sezejur
:"q utbazew
4tjozd
.eN
:"a
Teqatdeo peyseaut
Aq peptatp
aqep
TejoL, :‘q
quewjseaut
uo uanjey
:‘g sqosse
[Te 03
Aq peapTATp
Aqap
TeIOoL :°q
Aqtnbs
uo urznqey
:°q Ajytnbse
Aq peptatp
w1z34-buoy
:"q sqjesse
uo uanjey
:'g
TT 0002°0
LTLZ°O
75790
eT L808°0
Z7SS
‘0
eT 977L°O
67EL°0
6926°0
PT 9TEZ°O
T2vS'°O
T86T'O
ST 0694°0
89S2°0
9068°0
9T €c9S°0
S6972°0
9T O£8c°o
£€096°0
CvVZZ OO
wT 8P7LL'°O
887L°0
86S¢e°0
9T T9T8°O
8tTcet'O
TZ2SV'0O
9T BE9T°O
C8zTt°O
OT S9S7°0
7L69°0
S6ce°0O
LT v6cr7
0
8997 °0
L2LL°0
8ST T6S7°0
trp.c'O
9TPL’O
9T StL_t’oO
60%T°O
9T OFTZ'O
S$t06°0
ELEZ°O
LT T729C°O
S87v'O
6£9Z7°0
BT OceL'O
S68T°0O
OT68°0
9T 8682 °0
9LLT’O
9T 988T°0O
00278 °0
ELZT’O
LT 8S77'0
LTS¥°O
L9SE°O
SUOTJeATASGO UOTIOeAeqUI
Oo’ ‘a
‘a ‘d
"a ‘a
“d ‘d
(7-3) Azasnpul
juernejsay
ayy UT
uoTIeptTNbtT
pue uotjzeztuehbazoey
usemjeq
dtysuotjetey
jo stsATeuy
auL “9%
STAeL
134
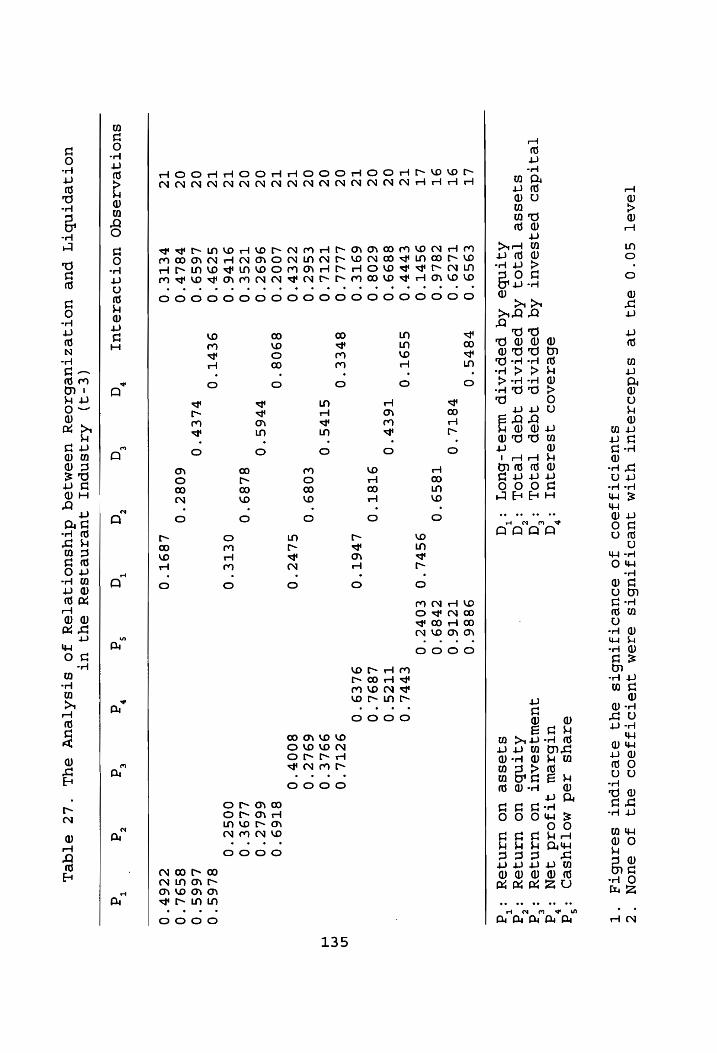
T@A2PT SO°O
aUua Ae
SAdeorequT YATM
AUeOTITUBTIS eam
JUeTOTIJe0D ayy
Jo suoN
°*Z SJUSTOTJJSOOD
JO aodueoOTITUBTS
ayy eqeotput
seaznhta ‘T
azeus zed
motTzyyseD :*d
ebezaaod
yAsaazaqui :"a
ut6zew
4tjorid yen
:'4 Teqtdes
paqseaut
Aq peptatp
3aqgep TeqoL
:‘a quewjseaut
uo uznqey
:‘a sjesse
Tej03
Aq peptatp
jqep
Tes0L
: ‘a Aatnbse
uo uznjay
:“¢ Aqtnbse
Aq peptatp
wazeqj-Buot :‘q
sjesse uo
uinjey
:'g
LT €959°0
v8rvs’ 0
9886°0
9T TLZ9°0O
V8TL’O
TZ2T6°0
9T 78L6°0
T8S9°0
7789 0
LT 9S7T°O
9S~7L°O
t£0PZ'O
TZ CvVy
Oo SS9T°O
CvpvL'O
02 8899°0
T6¢7°0
TTCS°O
02 6208°0
9T8T°O
L89L°0
TZ? 69TeL*O
Lv6T’°O
9L€9°0
OZ LLLL’O
B8PEC'O
9ZTL‘O
02 TCTL'O
STVvS’°O 99LE°0
02 €S6Z°0
£089°0
69LZ2°0
TZ 7ZLD'O
SL>Z°O
8007 °0
TZ L00Z2°0
8908°0
8T69°0
0Z 9692°0
vv6s 0
66L7°0
02 TZSE°O
8L489°0
LL9OEC°O
TZ 9Tv6°O
O€Te'O
00S2°0
TZ SZ9Pv'°0
9tP7T'O
8L46S°0
OZ L£659°0
PLED'O
L66S'°0
0Z vV8L7°0
6082 °0
8S9L°0
TZ veTe’
oO L89T°O
cCOV 0
suoTqeazesgo uoTjoezeqUI
"a “a
‘a ‘a
“a d
a “d
‘d
uoTJepTNbty
pue uotjyeztuebszoay
ussemjseq dtysuotjerey
jo stsATeuy
euL (€-4)
Az 4snpult
queraneqyssy
su
ut
“LO STAeL
135
4.2 HYPOTHESES TESTING
The first null hypothesis is that business failure cannot
be predicted in the restaurant industry at the 0.05 level. To
test the null hypothesis the value of -2LL was investigated .
Since the value of -2LL (39.881) from the predictive business
failure model for the restaurant industry is significant at
the 0.05 level, it can be concluded that the observed
likelihood does not differ from 1 (the value of the likelihood
for a model that fits perfectly). Consequently it can be
concluded that business failure can be predicted which leads
to the rejection of the null hypothesis.
There are 8 sub-hypotheses under the first null
hypothesis. Since cashflow per share and total debt divided
by invested capital were significant at the 0.05 level, the
second and the seventh sub-hypotheses are rejected while the
other sub-hypotheses fail to be rejected.
The second null hypothesis is that there are no
differences in the predictors for business failure between
restaurant and hotel industry at the 0.05 level. The
predictive business failure model for the restaurant industry
consisting of cashflow per share and total debt divided by
invested capital was significant at the 0.05 level, and the
predictors were significant at the 0.05 level. The predictive
business failure model for the hotel industry consisting of
cashflow per share was significant at 0.05 level, and the
136
predictor was significant at the 0.05 level. Therefore it can
be concluded that there are differences in the financial
variables which predict business failure for the restaurant
industry on one hand and the hotel industry on the other,
which in turn leads to the rejection of the null
hypothesis.
The third null hypothesis is that capital structure
(indicated by total debt divided by invested capital) and
profitability (indicated by cashflow per share) together do
not determine reorganization and liquidation at the 0.05
level. Since the interaction terms of these indicators were
not significant at the 0.05 level at intervals of one, two,
and three years prior to bankruptcy, the null hypothesis fails
to be rejected.
4.3 DISCUSSION
4.3.1 The First Research Question
The first research question addressed the predictability
of business failure and which financial variables can predict
such failure in the restaurant industry. Out of the 26 ratios
obtained from COMPUSTAT, only 8 ratios were investigated due
to the issues of redundancy and convergence as mentioned in
the section of 3.5.1.B.
The significant variables predicting business failure
were cashflow per share and total debt divided by invested
137
capital, and the magnitude (coefficient) of cashflow per share
and total debt divided by invested capital was -2.9902 and
0.0405, respectively. The other 6 ratios were found not to be
significant in predicting business failure in the restaurant
industry.
The negative sign of cashflow per share indicates that
the more cashflow per share the firms have, the lower the
probability that they will fail. The positive sign of total
debt divided by invested capital indicates that the more debt
divided by invested capital the firms have, the higher
probability of failure. As expected, the classification
accuracy percentage declined the farther away the firm was
from the incidence of business failure. The same pattern was
also found in previous studies (Altman, 1968; Blum, 1974;
Altman, Haldeman & Narayaman, 1977). It can be suggested that
the two variables can be used as early warning signals for
business failure in the restaurant industry because of the
high classification accuracy of the prediction model.
Five bankrupt firms were in the failed group. Both Consul
Restaurant and Jamco Ltd., which were predicted as failed
respectively in 1987 and 1988, actually liquidated in 1992.
Also SIS Corp., which was predicted as failed in 1989,
actually liquidated in 1990. Rax Restaurant and Po Folks
Inc., which were predicted as failed respectively in 1990 and
1986, filed for reorganization in 1992 and 1987, respectively.
138
Flagg, Giroux & Wiggins (1991) also had similar results. They
found that bankrupt and non-bankrupt firms could be correctly
classified when the sample consisted of only business firms
which had failed. It can be concluded that the model is
capable of determining which failed firms will ultimately go
bankrupt, and, consequently, this model offers early warning
Signals to firms to help them avoid bankruptcy.
Some firms having a higher probability of failure at
intervals of one, two, and three years prior to business
failure have continued to survive in the industry, while
others with similar probability of failure at intervals of
one, two, and three years prior to business failure went
bankrupt. It can be predicted that these firms with a higher
probability of failure and which have managed to survive in
the industry will eventually go bankrupt. This prediction can
be supported by the actual cases of Consul Restaurant, Jamco
Ltd, Po Folks Inc, Rax Restaurant, and SIS corp. They hada
higher probability of potential failure and indeed eventually
went bankrupt.
Further research was conducted in order to investigate
whether the model can be applied to actual bankrupt firms by
adding bankrupt firms which were not included in the failed
group. As expected the classification accuracy of the
bankrupt firms was higher the closer the firms were to
bankruptcy. This indicates that these variables of the
139
prediction model for business failure can be used as warning
signs in order to prevent bankruptcy.
With respect to the 7 bankrupt firms which had complete
data at the different time periods, there were two general
patterns which emerged. Some firms had a lower probability of
bankruptcy at two and/or three years prior to bankruptcy, and
eventually had a higher probability of going bankrupt at one
year prior to bankruptcy. Other firms consistently had a
higher probability of becoming bankrupt at intervals of one,
two, and three years prior to bankruptcy. In both patterns,
it can be suggested that the firms should have recognized the
imminence of bankruptcy sooner than they did, and with the
help of these early warning signs combined with good corporate
(or business) strategy they may have been able to avoid
bankruptcy.
In summary, the predictive business failure model
consisting of cashflow per share and total debt divided by
invested capital can predict business failure with high
classification accuracy, and this classification accuracy
increases as firms move closer toward business failure. Also
when this predictive business failure model was applied to
bankrupt firms (bankruptcy is the most critical type of
business failure), the same pattern appeared. The empirical
evidence suggests that the model for business failure can
provide more comprehensive information as well as greater lead
140
time.
4.3.2 The Second Research Question
The second research question was whether there are
differences in the financial variables which predict business
failure for the restaurant industry on one hand and the hotel
industry on the other.
The significant variable predicting business failure was
cashflow per share, and the magnitude (coefficient) of
cashflow per share was -2.0319 in the hotel industry. The
negative sign of cashflow per share indicates that the more
cashflow per share the firms have, the lower the probability
of business failure.
As expected, the correct classification percentage was
lower as the firms were farther from business failure, while
higher the closer they were to business failure. This
indicates that the ability of the variable in the hotel model
to predict business failure increases with proximity to
business failure event suggesting that the variable can be
used as an early warning signal of business failure in the
hotel industry. This finding is similar to that found with
respect to the restaurant industry.
Two bankrupt firms were in the failed group. Integra
Hotel & Resort, which was predicted failed in 1990, was
actually bankrupt in 1992. Also Servico, which was predicted
141
failed in 1990, was actually bankrupt in 1990.
It can be concluded that the predictive business failure
model can offer early warning signal to firms to help them
avoid bankruptcy. Consequently, it can be predicted that some
firms having a higher probability of failure will have a great
likelihood of becoming bankrupt. Similar conclusions were
mentioned with respect to the restaurant industry.
It is known that the hospitality industry (the restaurant
and hotel industries) may not be attractive to both equity and
debt investors. Andrew (1984) indicated that the hospitality
industry has a risky image due to variability of operating
cashflow and capital intensive fixed assets. Elwood & Kwansa
(1990) also have determined that venture capitalists consider
the hospitality industry unattractive.
The two financial variables, cashflow per share and total
debt divided by invested capital, were important predictors of
business failure in the restaurant industry. These two
financial variables also emerged as important in the previous
Studies using the events approach (Tavlin, Moncarz & Dumont,
1989; Kwansa & Parsa, 1990). The studies indicated that net
loss and debt restructuring which were observed in the
bankrupt firms occurred within one or two years of their
filing for bankruptcy.
Equity investors may consider the financial variable,
cashflow per share an important predictor because of a concern
142
with a firm's ability to pay dividends. On the other hand,
creditors may consider the financial variable, the total debt
divided by invested capital, an important predictor because of
a concern with a firm's ability to pay principal and interest
in the restaurant industry.
Cashflow per share was an important predictor for
business failure in the hotel industry. It was also found to
be an important predictor in Moncarz's study (1992). In the
case of Prime Motor Inns, she indicated that the first event
was the decline in cashflow per _ share. The important
determinant of the ability of a firm to carry debt is the
Stability of its operating earnings (Cherry and Spradley,
1990). This suggests that profitability and capital structure
may be complementary to each other. Indeed, when they are not
complementary to each other, firms tend to be in financial
distress. This suggestion, though valid for the restaurant
industry, may not hold true for the hotel industry because
none of the capital structure variables were found to be
Significant with respect to the hotel industry.
Although the indicators of capital structure may be
important predictors for business failure none of indicators
were found to be significant in the hotel industry. The
reason for their insignificance may be that the profitability
variable alone (cashflow per share) was significant enough to
explain and predict business failure in the hotel industry.
143
In summary, it was found that the combination of these two
variables can predict business failure with high
Classification accuracy for the restaurant industry while
cashflow per share can predict business failure with high
classification accuracy for the hotel industry.
4.3.3. The Third Research Question
The third research question was whether the financial
variables that determine reorganization are different from
those that determine liquidation in the restaurant industry.
Previous researchers in the restaurant industry believed that
the warning signals of possible business failure can be
detected much earlier using empirically supported techniques
(Olsen, Bellas & Kish, 1983; Tavlin, Moncarz & Dumont, 1989;
Kwansa & Parsa, 1990).
Two financial variables, cashflow per share and total
debt divided by invested capital, were found in this study to
be important predictors of business failure in the restaurant
industry. Although business failure can be predicted by these
early warning signals, some firms still eventually face
bankruptcy. In this case, the investigation of the
relationship between reorganization and liquidation can help
firms in deciding whether to reorganize or liquidate.
Although the profitability indicator (cashflow per share) and
capital structure indicator (total debt divided by invested
144
Capital) were important predictors for business failure, the
interaction terms of these variables were not significant for
reorganized and liquidated samples at intervals of one, two,
and three years prior to bankruptcy. This suggests that these
two variables are not dependent with respect to the decision
to file bankruptcy (reorganization or liquidation).
Furthermore, the interaction terms of other indicators
were not consistently significant at intervals of one, two,
and three years prior to bankruptcy. This evidence suggests
strongly that reorganization and liquidation are not dependent
on each other, that is, reorganization and liquidation cannot
be determined by the combination of capital structure and
profitability.
In this context, it can be suggested that reorganization
and liquidation may be independent of each other, that is,
reorganization and liquidation may be determined respectively
by capital structure and profitability. It is recommended
that liquidation be the first choice. Indeed, if the going-
concern value of the firm exceeds its liquidation value,
reorganization, rather than liquidation, can be considered.
However, only a few firms are able to successfully reorganize
(Altman, 1983; LoPucki, 1983). Furthermore, the success rate
at turnarounds for firms entering into reorganizations since
the new Bankruptcy Code became effective in October of 1979
was lower than it was ten years prior (LoPucki, 1983). In
145
addition, a non-trivial number of firms emerging from
reorganization file for reorganization again (Altman, 1993).
For example, in the restaurant industry, All American Burger,
which had filed for reorganization in 1977, filed for
reorganization again in 1981.
Further, indirect bankruptcy costs for the reorganized
firms may not be confounded with liquidation costs. The
indirect costs for the reorganized firms may not be based on
the profitability variable (how much the firm would lose if
reorganized) which is the hypothesized determinant of
liquidation. Therefore, the only relevant indirect bankruptcy
costs may be considered liquidation costs because indirect
costs are opportunity costs from profits which cannot be
captured as Haugen & Senbet (1978; 1988) and Senbet & Seward
(1993) indicated.
In summary, when there is lack of lead time to prevent
business failure, firms eventually face bankruptcy. The
empirical evidence provides that reorganization and
liquidation are not dependent on each other, that is,
reorganization and liquidation cannot be determined by both
Capital structure and profitability. It is recommended that
liquidation be considered the first choice, and that the
relevant indirect bankruptcy costs be liquidation costs.
146
CHAPTER 5
CONCLUSIONS
5.1 SUMMARY OF THE STUDY
Questions regarding business failure have occupied the
attention of researchers consistently over the past two
decades. In response to these questions, many empirical
studies have been conducted using firms across industries.
Industry failure rates are shown to be related to
differences in industry financial conditions, and each
industry has different failure rate elasticities with respect
to financial conditions. This has left unanswered the
question as to whether the predictive business failure models
based on the aggregated sample of all firms across industries
can be useful for specific industries.
The restaurant industry has consistently had the most
business failures of any single segment within the retail
sector in the eighties. Therefore a predictive model for
business failure which can be a useful tool in helping
researchers and industry practitioners to identify warning
signs of business failure in this industry was developed. The
sample consisted of 23 failed and 23 non-failed restaurant
firms between 1982-1983. The predictive business failure
model was developed through logistic regression analysis,
which employed 8 financial variables, one year prior to
business failure. The predictive business failure model
147
consisting of cashflow per share and total debt divided by
invested capital can predict business failure 90%, 88%, and
75% at one, two , and three years, respectively, prior to
business failure in the restaurant industry.
Some bankrupt firms which were in the failed group were
predicted to fail and eventually went bankrupt. Consequently,
it may be predicted that some firms, which have a higher
probability of failure at intervals of one, two, and three
years prior to business failure but are not bankrupt, will
eventually go bankrupt. In addition, the predictive business
failure model was applied to actual bankrupt firms by adding
more bankrupt firms which were not included in the failed
group for the restaurant industry. The model can predict
bankruptcy 100%, 46%, and 35% at one, two, and three years,
respectively, prior to bankruptcy. With respect to the 7
bankrupt restaurant firms which had complete data at the
different time periods, it can be suggested that the firms
Should have recognized earlier than they did that they were
near bankruptcy, and by recognizing the early warning signs
combined with a good strategic plan they may have been able to
avoid bankruptcy.
The second research question was to determine whether the
financial variables in a predictive model for business failure
in the restaurant industry are the same as in the hotel
industry. Andrew (1984) indicated that several financial
148
characteristics set the hospitality industry apart from other
industries. Elwood & Kwansa also (1990) have determined that
venture capitalists consider the hospitality unattractive.
Therefore, considering the similarity of the hotel and
restaurant industries, if the business failure predictive
model for the restaurant industry is not applicable to the
hotel industry, then it can be suggested that the model for
the restaurant industry is unique. Consequently, the
predictive business failure model for the hotel industry was
developed through logistic regression analysis, which employed
the same 8 financial variables as were used in the restaurant
model, one year prior to business failure. The sample
consisted of 15 failed and 15 non-failed firms between 1982-
1993. The predictive business failure model consisting of
cashflow per share can predict business failure 92%, 86%, and
75% at one, two, and three years, respectively, prior to
business failure in the hotel industry. Some bankrupt firms
were in the failed group. All of them were predicted failed
and eventually went bankrupt. Consequently, it may be
predicted that some firms, which have a higher probability of
failure at intervals of one, two, and three years prior to
business failure but are not bankrupt, will eventually go
bankrupt.
The important determinant of the ability of a firm to
carry debt is the stability of its operating earnings. This
149
suggests that profitability and capital structure are
complementary to each other. Indeed, when they are not
complementary to each other, firms tend to experience
financial distress. This suggestion, though valid for the
restaurant industry, may not hold true for the hotel industry
because none of the capital structure variables were found to
be significant with respect to the hotel industry.
The third research question was to determine whether the
financial variables that are associated with reorganization
are different from those that are associated with liquidation
in the restaurant industry. Although business failure can be
predicted by the early warning signs, some firms still
eventually file for bankruptcy. In this case, the
investigation of the relationship between reorganization and
liquidation can help in deciding whether to reorganize or
liquidate.
There have been arguments regarding the relationship
between liquidation and reorganization. One group of authors
believes that reorganization and liquidation can be determined
respectively by capital structure and profitability (Haugen &
Senbet, 1978; 1988; Senbet & Seward, 1993). The other group
believes that reorganization and liquidation can be determined
by both capital structure and profitability (Bulow, 1978;
Shapiro & Peitzman, 1984; Titman, 1984; White, 1984; Morris,
1986; Casey, McGee & Stickney, 1986). The relationship
150
between reorganization and liquidation was investigated
through logistic regression analysis employing two sets of
indicators for capital structure and profitability. The
sample consisted of 14 reorganizers and 10 liquidators in the
restaurant industry.
The empirical evidence indicates that reorganization and
liquidation are not dependent on each other, that is,
reorganization and liquidation cannot be determined by both
Capital structure and profitability in the restaurant
industry. It is recommended that liquidation be the first
choice because the constraints related to the development of
new Bankruptcy Code in October of 1979 and the fact that
continuing refiling has negative long term effects on the
industry.
In addition, the indirect bankruptcy costs’ for
reorganized firms should not be based on profitability which
is the determinant of liquidation. Since indirect costs are
opportunity costs, the relevant indirect bankruptcy costs
should be liquidation costs.
Consequences of the study are related to business
valuation. Determining the value of a firm is important to
buyers, sellers, potential merger & acquisition partners,
lending institutions, and tax authorities.
There are three approaches with respect to business
valuation: costs, sales, and net income-capitalization. Of
151

the three valuation approaches available to the appraiser, the
net income-capitalization approach generally provides the most
persuaSive and supportable conclusions (Rushmore, 1984;
Fisher, 1991).
There are two basic components with respect to net
income-capitalization business valuation. They are
maintainable net income and cost of capital (Rushmore, 1984;
Fisher, 1991). These two components can be measured in the
past or future context. The appraisers can estimate
Maintainable net income and cost of capital in order to
appreciate the business value for a specific property. In
addition, they can estimate the probability of business
failure employing the developed predictive business failure
model .
If the probability of business failure is higher it is
suggested that the maintainable net income and cost of capital
be adjusted to reflect high business failure risk. On the
other hand, if the probability of business failure is lower,
it is suggested that the maintainable net income and cost of
Capital be adjusted to reflect low business failure risk.
This adjustment is based on the idea that cost of capital
along with maintainable net income should not be universal for
all properties even within the same industry.
Therefore the predictive business failure model can be
used to provide more additional information to buyers,
152
sellers, potential merger & acquisition partners, lending
institutions, and tax authorities with respect to business
valuation.
5.2 IMPLICATIONS OF THE STUDY
The predictive business failure model developed in this
study has relevance to many research questions such as
business failure and valuation.
The industry researchers and practitioners can estimate
the probability of business failure through the predictive
business failure model. This estimation can be employed as a
tool to diagnose the financial distress and can be used to
prevent it with lead time if indeed they are in financial
distress. Also this tool can be employed to provide more
additional information with respect to business valuation.
Since reorganization and liquidation are not dependent on
each other, reorganization may be determined by capital
structure and liquidation may be determined by profitability.
With respect to the decision to file bankruptcy, liquidation
can be the first choice because the restaurant industry is
mature and competitive. Furthermore the success rate of
turnarounds for firms entering into reorganization since the
new Bankruptcy Code became effective in October 1979 was lower
than it was ten years prior.
With respect to indirect bankruptcy costs, the industry
153

researchers and practitioners can estimate these costs based
on the loss of profitability if firms are liquidated. These
estimated indirect costs can be compared with the market value
of the dismantled asset. If the market value of the
dismantled assets exceeds the indirect costs, liquidation can
be the choice.
5.3 LIMITATIONS OF THE STUDY
It may not be possible to consider the samples of
restaurant and hotel firms as representative of their
industries. The sample sizes were 46 firms and 30 firms
respectively for the restaurant and hotel industries. In
addition, only publicly traded firms were included, and most
of them were chains in both samples obtained from COMPUSTAT.
The corollary to this observation is whether or not the
predictive business failure models from this study can be
generalized to the hospitality industry.
There is a need to investigate whether the predictive
model can be useful for private firms, independent operators,
firms from different regions, or different types of properties
for future research.
The relationship between reorganization and liquidation
was not investigated for the hotel industry, in part, because
there were fewer bankrupt firms in the hotel industry. The
small number of hotel firms would have prevented the use of
154
parametric techniques of statistical analysis. However,
although nonparametric techniques are statistically weaker,
the relationship between reorganization and liquidations could
be investigated for the hotel sample employing nonparametric
techniques which apply to logistic regression analysis.
Future research can provide additional information
complementary to the results of this study with respect to
business failure in the hospitality industry.
155
BIBLIOGRAPHY
Administrative Office of the United States Courts.
Aharony, Joseph, Charles P. Jones, and Itzhak Swary. (1980) An analysis of risk and return characteristics of corporate bankruptcy using capital market return. Journal of Finance, 35, 1001-1016.
Altman, Edward, I. (1968). Financial ratios, discriminant analysis and the prediction of corporate bankruptcy. Journal of Finance, 23, 589-607.
Altman, Edward, I. (1973). Predicting railroad bankruptcies in America. Bell Journal of Economics and Management Science,
4, 184-211.
Altman, Edward, I., G. Haldeman, and P. Narayanan. (1977). Zeta Analysis: A new model to identify bankruptcy risk of corporations. Journal of Banking and Finance, 1, 29-54.
Altman, Edward, I. and James K. La Fleur. (1981). Managing a return to financial healthy. Journal of Business Strategy, 2, 31-38.
Altman, Edward, I., R. B. Avery, R. A. Elsenbeis, J. S. Sinkey. (1981). Application of Classification Techniques in Business, Banking and Finance. Greenwich, Connecticut: JAI Press.
Altman, Edward, I. (1983). Corporate Financial Distress. NewYork: John Wiley & Sons.
Altman, Edward, I. (1984). A further empirical investigation of the bankruptcy cost question. Journal of Finance, 39, 1067-1088.
Altman, Edward, I. (1993). Corporate Financial Distress and Bankruptcy. NewYork: John Wilely & Sons.
Amato, Louis and Ronald Wider. (1990). Firm and industry effects in industrial economics. Southern Economic Journal, 57, 93-105.
Ambrose, Brent, W. and Drew B. Winters. (1992). Does an industry effect exist for leveraged buyouts. Financial Management Journal, 21, 89-101.
156
Andrew, William, P. (1984). Lender's perspective: the key to
successful borrowing. Cornell Hotel and Restaurant
Administration Quarterly, 24, 37-43.
Ang, James, S., Jess H. Chua, and John J. McConnell. (1982). The administrative costs of corporate bankruptcy: a note. Journal of Finance, 37, 219-226.
Argenti, John. (1976). Corporate Collapse: The Causes and
Symptoms. NewYork: John Wiley & Sons.
Baden-Fuller, C.W.F. (1989). Exit from declining industries and the case of steel castings. The Economic Journal, 99, 949-961.
Beaver, William, H. (1966). Financial ratios as predictors of failure, empirical research in accounting selected studies. Journal of Accounting Research, 4, 71-111.
Beaver, William, Paul Kettler, and Myron Scholes. (1970). The association between market determined and accounting determined risk measures. Accounting Review, 45, 654-682.
Bettinger, Cass. (1981). Bankruptcy prediction as a tool for commercial lenders. Journal of Commercial Bank Lending, 63,
18-28.
Blum, Marc. (1974). Failing company discriminant analysis. Journal of Accounting Research, 12, 1-25.
Bowen, Robert, M., Lane A. Daley, and Charles C. Huber. (1982). Evidence on the existence and determinants of inter-
industry differences in leverage. Financial Management, 4, 10-20.
Brigham, Eugene, F. and Louis C. Gapenski. (1990). Intermediate Financial Management. Orlando, Florida: Dryden Press.
Bulow, Jeremy, I. (1978). The bankruptcy decision. Bell Journal of Economics, 9, 437-456.
Casey, Cornelius and Norman Bartczak. (1985). Using operating cash flow data to predict financial distress: some extensions. Journal of Accounting Research, 23, 384-401.
Casey, Cornelius, J., Victor E. McGee, and Clyde P. Stickney. (1986) . Discriminating between reorganized and liquidated firms in bankruptcy. Accounting Review, 61, 249-262.
157

Castagna, A.D. and Z.P. Matolcsy. (1981). The market
characteristics of failed companies: extensions and further
evidence. Journal of Business Finance and Accounting, 8, 467-
483.
Chatterjee, Sris and James H. Scott. (1989). Explaining differences in corporate capital structure. Journal of Banking and Finance, 13, 283-309.
Cherry, Richard, T. and Larry W. Spradley. (1990). Further tests of industry influence on capital structure. Review of Business and Economic Research, 25, 58-66.
Clark, Ronald, L. and Maurice S. Newman. (1986). Evaluating continued existence. CPA Journal, 56, 22-30.
Cleverley, William, O. and Karen Nilsen. (1980). Assessing financial position with 29 key ratios. Hospital Financial Management, 34, 30-36.
Clifton-Steele, Rob. (1985). Making working capital work. The Australian Accountant, 55, 40-46.
Coats, Pamela, K. and L. Franklin Fant. (1993). Recognizing financial distress patterns using a neural network tool. Financial Management, 22, 142-155.
Cobb, A.K. and J.N. Hagemaster. (1987). Ten criteria for evaluating qualitative research proposals. Journal of Nursing Education, 26, 138-143.
Cooke, Jay. (1988). Should your company go private. Management Review, 77, 20-22.
Dambolena, Ismael, G. and Sarkin J. Khoury. (1980). Ratio Stability and corporate failure. Journal of Finance, 35, 1017-1026.
Davis, E.P. (1992). Debt, Financial, Fragility, and
Systematic Risk. NewYork: Clarendon Press.
Deakin, Edward, B. (1972). A discriminant analysis of predictors of business failure. Journal of Accounting Review, 10, 167-197.
Donaldson, Elvin, F. (1957). Corporate Finance. NewYork: Ronald Press.
158
Duffy, Mary, E. (1987). Methodological triangulation: a vehicle for merging quantitative and qualitative research methods. IMAGE: Journal of Nursing Scholarship, 19, 130-133.
Dun and Bradstreet.
Edmister, Robert, O. (1972). An empirical test of financial ratio analysis for small business failure prediction. Journal of Financial and Quantitative Analysis, 7, 1477-1493.
Elwood, Clare, M. and Francis A. Kwansa (1990). Venture capital: for the hospitality industry. Hospitality Education and Research Journal, 14, 519-538.
Fabozzi, Frank, J. and Jack C. Francis. (1979). Industry effects and determinants of beta. Quarterly Review of Economics and Business, 19, 61-74.
Fienberg, Stephen, E. (1981). The Analysis of Cross- Classified Categorical Data. Cambridge, Ma.: MIT Press.
Fisher, Douglas, P. (1991). Restaurant valuation: a financial approach. Cornell Hotel and Restaurant Administration Quarterly, 31, 89-92.
Flagg, James C., Gary A. Giroux, and Casper E. Wiggins. (1991). Predicting corporate bankruptcy using failing firms. Review of Financial Economics, 1, 67-78.
Frydman, H., E.I. Altman, and D. Kao. (1985). Introducing recursive partitioning for financial classification: The case of financial distress. Journal of Finance, 40, 269-291.
Giroux, G. and C. Wiggins. (1983). Chapter 11 and corporate resuscitation. Financial Executive, 51, 37-41.
Giroux, G. and C. Wiggins. (1984). An events approach to corporate bankruptcy. Journal of Bank Research, 15, 179-187.
Gombola, M. I., Mark E. Haskins, J. Edward Ketz, and David D. Williams. (1987). Cash flow in bankruptcy prediction. Financial Management, 16, 55-65.
Goodwin, L. and W. Goodwin. (1984). Qualitative vs. quantitative research or qualitative and quantitative research. Nursing Research, 33, 378-380.
Green, P.E. (1978). Analyzing Multivariate Data. Hinsdale,
Il1l.: Holt, Rinehart, and Winston.
159
Hamada, Robert S. (1972). The Effect of the firm's capital
structure on the systematic risk of common stocks. Journal of
Finance, 27, 435-451.
Harris, R.J. (1975). A Primer of Multivariate Statistics.
NewYork: Academic Press.
Haugen, Robert, A. and Lemma W. Senbet. (1978). The insignificance of bankruptcy costs to the theory of optimal capital structure. Journal of Finance, 33, 383-392.
Haugen, Robert, A. and Lemma W. Senbet. (1988). Bankruptcy and agency Costs: their significance to the theory of optimal capital structure. Journal of Financial and Qualitative
Analysis, 23, 27-38.
Hawawini, Gabriel, Claude Viallet, and Ashok Vora. (1986). Industry influence on corporate working capital decision. Sloan Management Review, 27, 15-24.
Hosmer, D.W. and S. Lemeshow. (1989). Applied Logistic Regression. NewYork: John Wiley & Sons.
Jensen, Michael C. (1989). Active investors, LBOs, and the privatization of bankruptcy. Continental Bank Journal of Applied Corporate Finance, 2, 35-44.
Johnson, Craig G. (1970). Ratio analysis and the prediction of firms failure. Journal of Finance, 25, 1166-1168.
Kane, Alex, Alan J. Marcus, and Robert L. McDonald. (1985). Debt policy and rate of return premium to leverage. Journal of Financial and Quantitative Analysis, 20, 479-499.
Keasey, K. and R. Watson. (1987). Non-financial symptoms and the prediction of small company failure: A test of argenti's hypothesis. Journal of Business Finance and Accounting, 14, 335-354.
Keown, Arthur, J., David F. Scott, John D. Martin, and J. William Petty. (1985). Basic Financial Management. Englewood Cliffs, New Jersey: Prentice-Hall.
Kessides, Ioannis, N. (1990). Internal versus external market conditions and firm profitability: an exploratory model. The Economic Journal, 100, 773-792.
Kirk, J. and M.L. Miller. (1986). Reliability and Validity in
Qualitative Research. Beverly Hills, Ca.: Sage.
160
Kudla, Ronald, J. (1988). Voluntary Corporate Liquidations.
Westpoint, Conne.: Greenwood Press.
Kwansa, Francis, A. and H.G. Parsa (1990). Business failure
analysis: an event approach. Hospitality Education and
Research Journal, 14, 23-34.
Leedy, Paul, D. (1993). Practical Research: Planning and Design. New York: Macmillan Publishing Company.
Lehn, K., J. Netter, and A. Poulsen. (1990). Consolidating corporate control: the choice between dual-class recapitalizations and leveraged buyouts. University of Chicago Working Paper.
Libby, Robert. (1975). Accounting ratios and the prediction of failure: some behavioral evidence. Journal of Accounting Research, 13, 150-161.
Lincoln, Merryn. (1984). An empirical study of the usefulness of accounting ratios to describe levels of insolvency risk. Journal of Banking and Finance, 8, 321-340.
Litzenberger, Robert, H. (1986). Some observation on capital structure and the impact of recent recapitalization on share prices. Journal of Financial and Quantitative Analysis, 21, 59-71.
LoPucki, L. M. (1983). The debtor in full control-systems failure under chapter 11 of the bankruptcy code. American Bankruptcy Law Journal, 57, 99-126.
Logue, Dennis, E. (1990). Handbook of Modern Finance. Boston, Ma: Warren, Gorham & Lamont Press.
Martin, Linda, J. and Glenn V. Henderson. (1984). Industry influence on financial structure: another of interpretation. Review of Business and Economic Research, 19, 57-67.
Mckinlay, R.A. (1979). Some reasons for business failure in Canada. RIA Cost and Management, 53, 17-21.
Modigliani, Franco and Metron H. Miller. (1958). The cost of Capital, corporation finance and the theory of investment. American Economic Review, 68, 261-297.
Modigliani, Franco and Metron H. Miller. (1963). Corporate income taxes and the cost of capital: a correction. American Economic Review, 53, 433-443.
161
Moncarz, Elisa, S. (1985). Leveraged buyouts: opportunities and risks. FIU Hospitality Review, 3, 15-29.
Moncarz, Elisa, S. (1992). Financial failure in the 1990s: the case of Prime Motor Inns. FIU Hospitality Review, 10, 49-
64.
Morris, Timothy. (1986). A different approach to a customer's bankruptcy reorganization. Corporate Accounting, 4, 39-44.
Ohlson, James, A. (1980). Financial ratios and the probabilistic prediction of bankruptcy. Journal of Accounting Research, 18, 109-131.
Olsen, M.D., C. Bellas and L.V. Kish. (1983). Improving the prediction of restaurant failure through ratio analysis. International Journal of Hospitality Management, 2, 187-194.
Palepu, K.G. (1986). Predicting takeover targets: a methodological and empirical analysis. Journal of Accounting and Economics, 8, 3-35.
Parse, R.R., A.B. Coyne and M.J. Smith. (1985). Nursing Research: Qualitative Methods. Bowie, Md.: Brady.
Platt, Harlan, D. (1985). Why Companies Fail. Lexington, Ma: D.C. Heath and Company.
Platt, Harlan, D. (1989). The determinants of inter-industry failure. Journal of Economic and Business, 41, 107-126.
Press, S.J. and S. Wilson. (1978). Chosing between logistic regression and discriminant analysis. Journal of America Statistics Association, 73, 699-705.
Ramer, Leath. (1989). Quantitative versus qualitative research. Journal of Obstetric, Gynecologic, and Neonatal
Nursing, 18, 7-8.
Ro, Byung, T., Christine V. Zavgren, and Su-Jane Hsieh. (1992). The effect of bankruptcy on systematic risk of common stock: an empirical assessment. Journal of Business Finance and Accounting, 19, 309-328.
Rudolph, Patricia, M. (1979). Some industry effects on the balance sheet structure. Journal of Economics and Business,
31, 138-144.
162
Rushmore, Stephen. (1984). The appraisal of lodging
facilities-update. Cornell Hotel and Restaurant
Administration Quarterly, 25, 35-46.
Rutledge, John. (1985). Restructuring: unload those assets.
Chief Executive, 33, 36-38.
Schary, Martha, A. (1991). The probability of exit. RAND Journal of Economics, 22, 339-353.
Schwartz, Eli and J. Richard Aronson. (1967). Some surrogate
evidence in support of the concept of optimal financial structure. Journal of Finance, 22, 10-19.
Schwartz, K. and K. Menon. (1985). Auditor switches by failed firms. The Accounting Review, 60, 248-261.
Scott, David, F. (1972). Evidence on the importance of financial structure. Financial Management, 1, 45-50.
Scott, David, F. and John D. Martin. (1975). Industry influence on financial structure. Financial Management, 4,
67-73.
Senbet, Lemma, W. and James K. Seward. (1993). Financial distress, bankruptcy and reorganization. Journal of Finance, Forthcoming.
Shapiro, Bernard and Lawrence Peitzman. (1984). Rising from the ashes. Management Focus, 31, 16-19.
Shrieves, Ronald, E. and Donald lL. Stevens. (1979). Bankruptcy avoidance as a motive for merger. Journal of Financial and Quantitative Analysis, 14, 501-515.
Sprague, James, C. and Roger K.M. Bellows. (1975). How to
calculate your working capital needs. Canadian Business, 48, 30-32.
Stainback, S. and W. Stainback. (1984). Broadening the research perspective in education. Exceptional Children, 50, 400-408.
Stone, B. (1977). Discussant remarks on J. Warner's
bankruptcy costs. Journal of Finance, 32, 366-368.
Swanson, Gene. (1991). How near the edge: gauging lodging firms' liquidity. Cornell Hotel and Restaurant Administration Quarterly, 32, 67-71.
163

Tavlin, E.M., E. Moncarz, and D. Dumont. (1989). Financial failure in the hospitality industry. FIU Review, 7, 55-75.
Titman, Sheridan. (1984). The effect of capital structure on a firm's liquidation decision. Journal of Financial Economics, 13, 137-151.
Ventrice, Lynn, A. (1982). Predicting Business Failure in the Food Service Industry. Unpublished master thesis. Virginia Polytechnic Institute and State University, Blacksburg, VA.
Warner, Jerald B. (1977). Corporate finance-empirical tests, and bankruptcy costs; some evidence. Journal of Finance, 32, 337-347.
Weiss, Lawrence, A. (1990). Bankruptcy resolution: direct costs and violation of priority of claims. Journal of Financial Economics, 27, 285-314.
West, Joseph, J. (1988). Strategy, environmental scanning, and their effect upon firm performance: an exploratory study of the food service industry. Unpublished doctoral dissertation. Virginia Polytechnic Institute and State University, Blacksburg, VA.
White, Michelle. (1983). Bankruptcy costs the new bankruptcy code. Journal of Finance, 38, 477-488.
White, Michelle. (1984). Bankruptcy liquidation and reorganization. InD. Logue, Ed., Handbook of Modern Finance. Beston, Ma: Warren, Gorham & Lamont.
Wight, Colin. (1985). Business failures: early diagnosis and remedies. The Australian Accountant, 55, 30-39.
Zmijewski, Mark, E. (1984). Methodological issues related to the estimation of financial distress prediction models. Journal of Accounting Research, 22, 59-81.
164
VITA
Min-Ho Cho was born May 2, 1963 in Seoul, Korea. He
received his diploma from Youngdong High School in 1982, his
Bachelor of Arts degree in Travel and Tourism Management from
Hanyang University in 1989, and a Masters degree in Hotel and
Food Service Management from Florida International University
in 1991. His doctorate degree was received from Virginia Tech
in Hospitality and Tourism Management with concentrations in
Finance and Strategy.
His work experiences include twenty-eight months of
service in the Korean Army for his country, tour operator at
HanJin Tour Co. which involved working with international
transient passengers, front desk responsibilities at the Seoul
Hilton International, and duties within the personnel and
training department at the Sheraton Hotel in Seoul, Korea as
departmental trainee. -
He has published several articles in scholarly journals
regarding business failure and bankruptcy in the hospitality
industry and made presentations at several national
hospitality conferences.
Some of his honors and awards include a scholarship for
overseas study from Hanyang University and designation as
dean's special student from Florida ase Dey LOL.
Min-Ho Cho
based upon exceptional academic merit.
165