Embed Size (px)
Citation preview
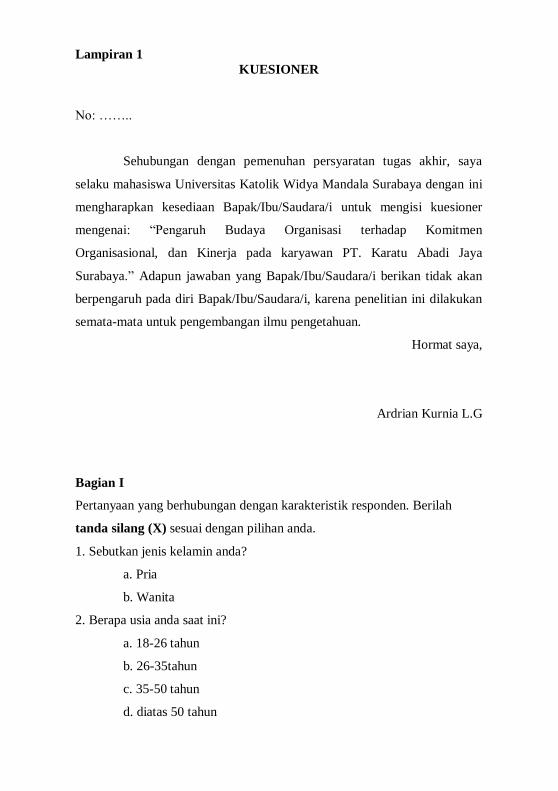
Lampiran 1
KUESIONER
No: ……..
Sehubungan dengan pemenuhan persyaratan tugas akhir, saya
selaku mahasiswa Universitas Katolik Widya Mandala Surabaya dengan ini
mengharapkan kesediaan Bapak/Ibu/Saudara/i untuk mengisi kuesioner
mengenai: “Pengaruh Budaya Organisasi terhadap Komitmen
Organisasional, dan Kinerja pada karyawan PT. Karatu Abadi Jaya
Surabaya.” Adapun jawaban yang Bapak/Ibu/Saudara/i berikan tidak akan
berpengaruh pada diri Bapak/Ibu/Saudara/i, karena penelitian ini dilakukan
semata-mata untuk pengembangan ilmu pengetahuan.
Hormat saya,
Ardrian Kurnia L.G
Bagian I
Pertanyaan yang berhubungan dengan karakteristik responden. Berilah
tanda silang (X) sesuai dengan pilihan anda.
1. Sebutkan jenis kelamin anda?
a. Pria
b. Wanita
2. Berapa usia anda saat ini?
a. 18-26 tahun
b. 26-35tahun
c. 35-50 tahun
d. diatas 50 tahun
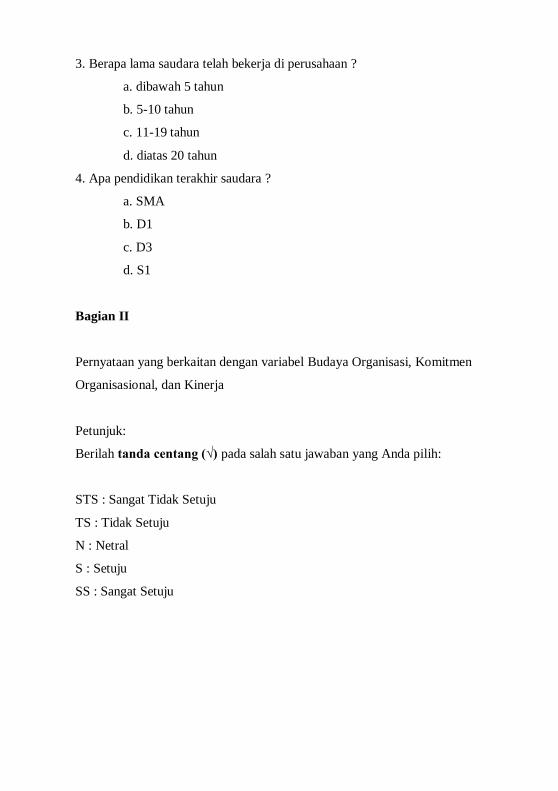
3. Berapa lama saudara telah bekerja di perusahaan ?
a. dibawah 5 tahun
b. 5-10 tahun
c. 11-19 tahun
d. diatas 20 tahun
4. Apa pendidikan terakhir saudara ?
a. SMA
b. D1
c. D3
d. S1
Bagian II
Pernyataan yang berkaitan dengan variabel Budaya Organisasi, Komitmen
Organisasional, dan Kinerja
Petunjuk:
Berilah tanda centang (√) pada salah satu jawaban yang Anda pilih:
STS : Sangat Tidak Setuju
TS : Tidak Setuju
N : Netral
S : Setuju
SS : Sangat Setuju
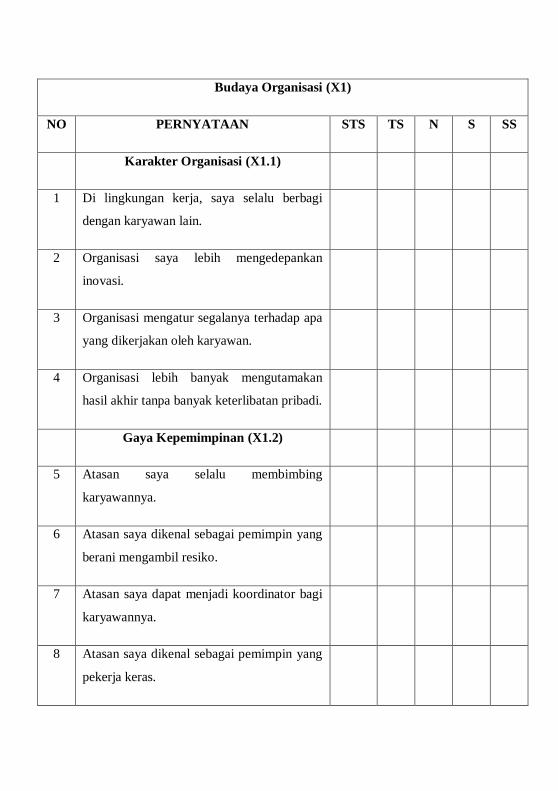
Budaya Organisasi (X1)
NO PERNYATAAN STS TS N S SS
Karakter Organisasi (X1.1)
1 Di lingkungan kerja, saya selalu berbagi
dengan karyawan lain.
2 Organisasi saya lebih mengedepankan
inovasi.
3 Organisasi mengatur segalanya terhadap apa
yang dikerjakan oleh karyawan.
4 Organisasi lebih banyak mengutamakan
hasil akhir tanpa banyak keterlibatan pribadi.
Gaya Kepemimpinan (X1.2)
5 Atasan saya selalu membimbing
karyawannya.
6 Atasan saya dikenal sebagai pemimpin yang
berani mengambil resiko.
7 Atasan saya dapat menjadi koordinator bagi
karyawannya.
8 Atasan saya dikenal sebagai pemimpin yang
pekerja keras.

Ikatan dengan Organisasi (X1.3) STS TS N S SS
9 Organisasi memiliki rasa kebersamaan yang
kuat.
10 Ada dorongan yang kuat dari organisasi
dalam berkomitmen terhadap inovasi dan
pengembangan.
11 Seluruh karyawan bersama-sama mentaati
aturan yang ada pada tempat kerja.
12 Ada dorongan pada tanggung jawab dan
tugas karyawan.
Penekanan Strategis (X1.4)
13 Organisasi menciptakan semangat kerja bagi
karyawan-karyawannya.
14 Organisasi selalu mencoba tantangan baru
bagi karyawan.
15 Organisasi menekankan kinerja yang
effisien.
16 Organisasi menekankan tindakan kompetitif
dan prestasi terhadap karyawannya.
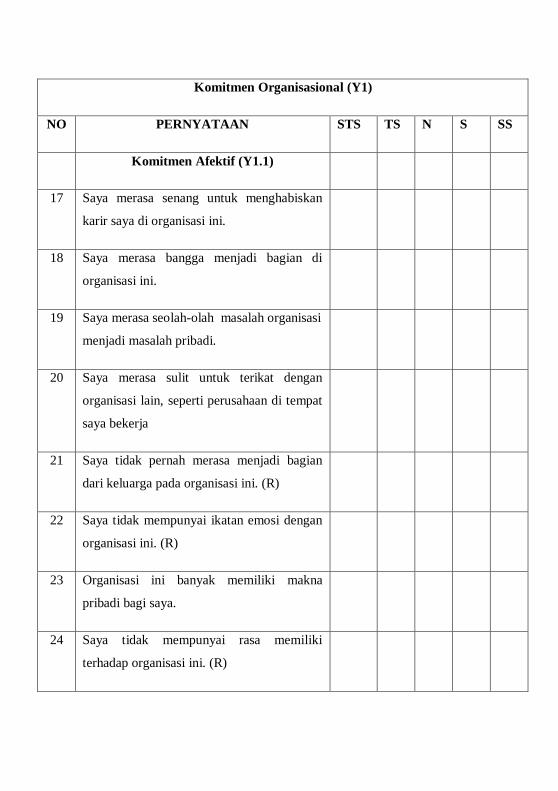
Komitmen Organisasional (Y1)
NO PERNYATAAN STS TS N S SS
Komitmen Afektif (Y1.1)
17 Saya merasa senang untuk menghabiskan
karir saya di organisasi ini.
18 Saya merasa bangga menjadi bagian di
organisasi ini.
19 Saya merasa seolah-olah masalah organisasi
menjadi masalah pribadi.
20 Saya merasa sulit untuk terikat dengan
organisasi lain, seperti perusahaan di tempat
saya bekerja
21 Saya tidak pernah merasa menjadi bagian
dari keluarga pada organisasi ini. (R)
22 Saya tidak mempunyai ikatan emosi dengan
organisasi ini. (R)
23 Organisasi ini banyak memiliki makna
pribadi bagi saya.
24 Saya tidak mempunyai rasa memiliki
terhadap organisasi ini. (R)
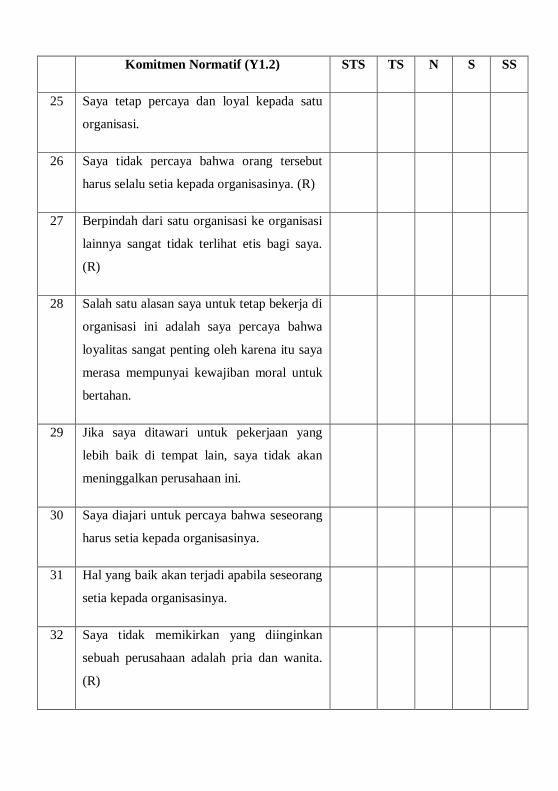
Komitmen Normatif (Y1.2) STS TS N S SS
25 Saya tetap percaya dan loyal kepada satu
organisasi.
26 Saya tidak percaya bahwa orang tersebut
harus selalu setia kepada organisasinya. (R)
27 Berpindah dari satu organisasi ke organisasi
lainnya sangat tidak terlihat etis bagi saya.
(R)
28 Salah satu alasan saya untuk tetap bekerja di
organisasi ini adalah saya percaya bahwa
loyalitas sangat penting oleh karena itu saya
merasa mempunyai kewajiban moral untuk
bertahan.
29 Jika saya ditawari untuk pekerjaan yang
lebih baik di tempat lain, saya tidak akan
meninggalkan perusahaan ini.
30 Saya diajari untuk percaya bahwa seseorang
harus setia kepada organisasinya.
31 Hal yang baik akan terjadi apabila seseorang
setia kepada organisasinya.
32 Saya tidak memikirkan yang diinginkan
sebuah perusahaan adalah pria dan wanita.
(R)
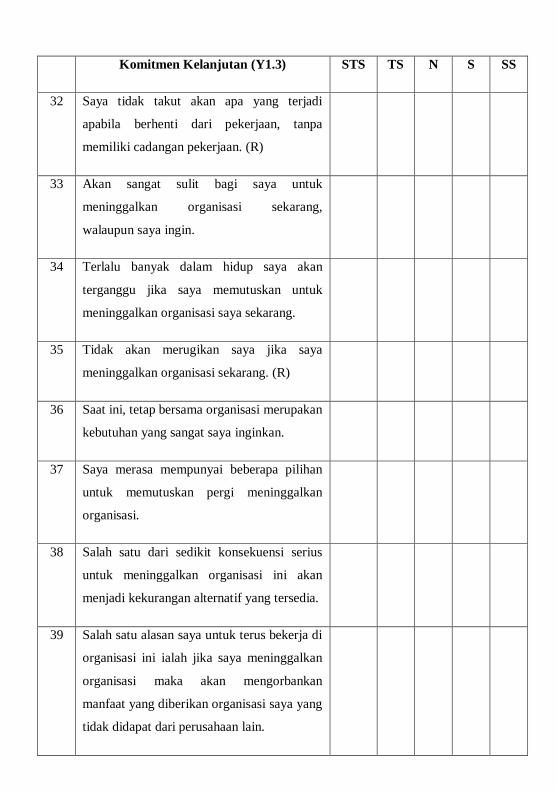
Komitmen Kelanjutan (Y1.3) STS TS N S SS
32 Saya tidak takut akan apa yang terjadi
apabila berhenti dari pekerjaan, tanpa
memiliki cadangan pekerjaan. (R)
33 Akan sangat sulit bagi saya untuk
meninggalkan organisasi sekarang,
walaupun saya ingin.
34 Terlalu banyak dalam hidup saya akan
terganggu jika saya memutuskan untuk
meninggalkan organisasi saya sekarang.
35 Tidak akan merugikan saya jika saya
meninggalkan organisasi sekarang. (R)
36 Saat ini, tetap bersama organisasi merupakan
kebutuhan yang sangat saya inginkan.
37 Saya merasa mempunyai beberapa pilihan
untuk memutuskan pergi meninggalkan
organisasi.
38 Salah satu dari sedikit konsekuensi serius
untuk meninggalkan organisasi ini akan
menjadi kekurangan alternatif yang tersedia.
39 Salah satu alasan saya untuk terus bekerja di
organisasi ini ialah jika saya meninggalkan
organisasi maka akan mengorbankan
manfaat yang diberikan organisasi saya yang
tidak didapat dari perusahaan lain.
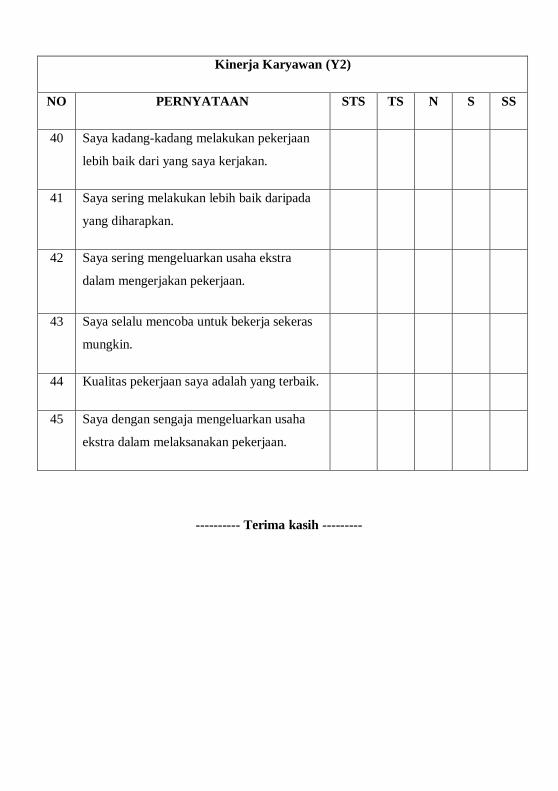
Kinerja Karyawan (Y2)
NO PERNYATAAN STS TS N S SS
40 Saya kadang-kadang melakukan pekerjaan
lebih baik dari yang saya kerjakan.
41 Saya sering melakukan lebih baik daripada
yang diharapkan.
42 Saya sering mengeluarkan usaha ekstra
dalam mengerjakan pekerjaan.
43 Saya selalu mencoba untuk bekerja sekeras
mungkin.
44 Kualitas pekerjaan saya adalah yang terbaik.
45 Saya dengan sengaja mengeluarkan usaha
ekstra dalam melaksanakan pekerjaan.
---------- Terima kasih ---------
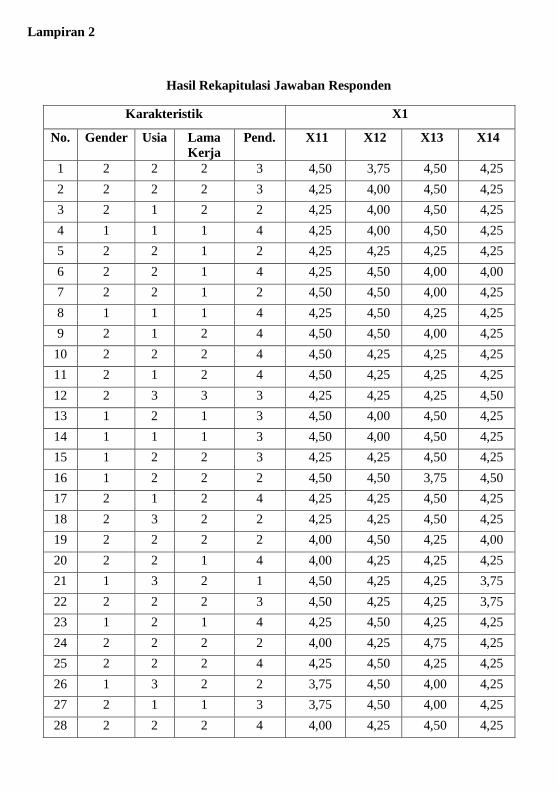
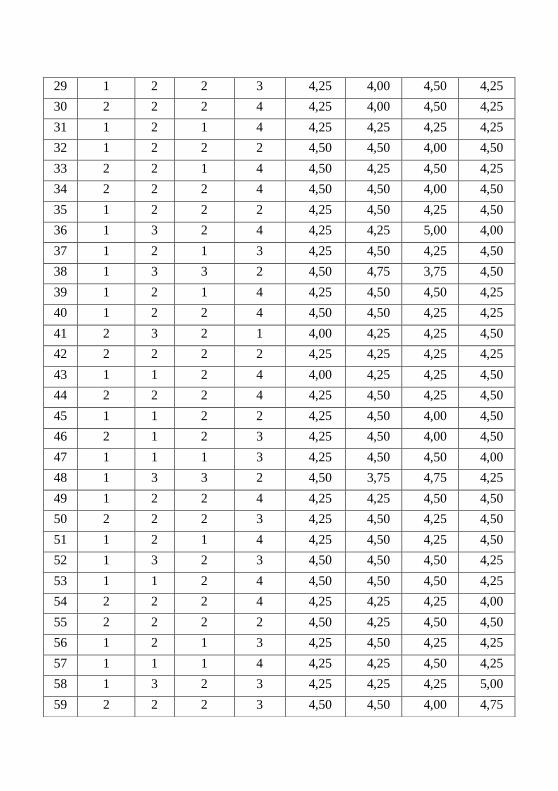
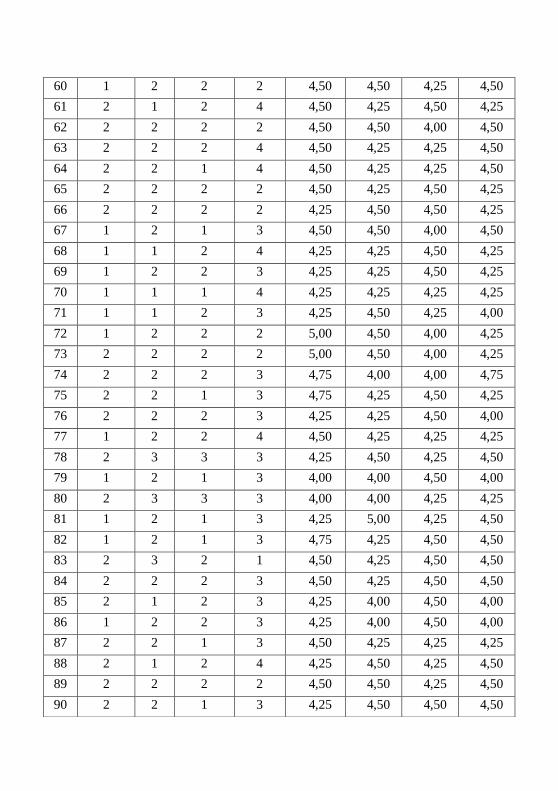
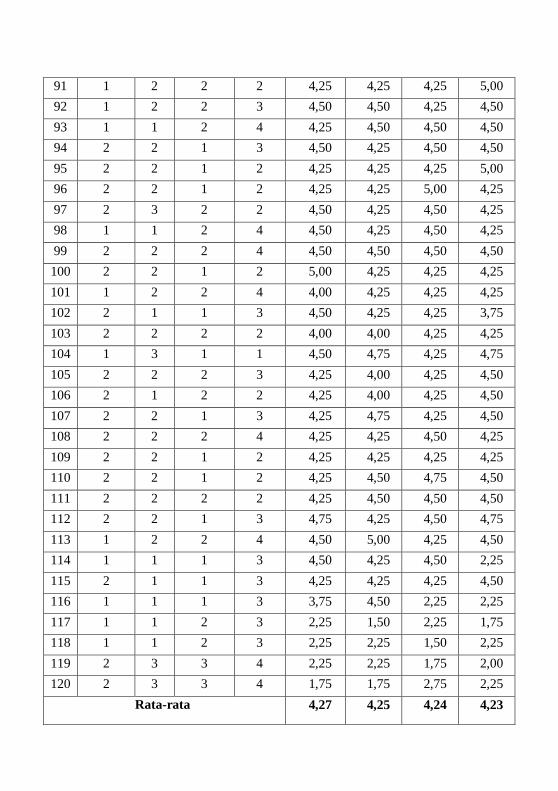
Lampiran 2
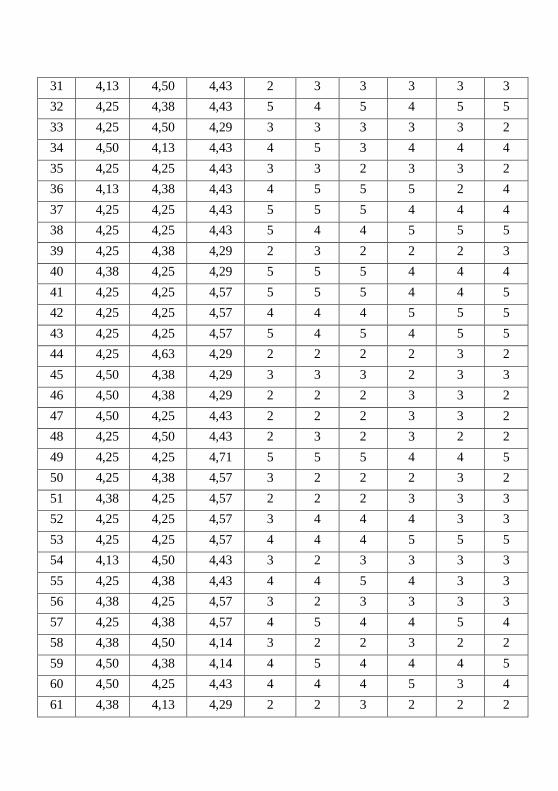
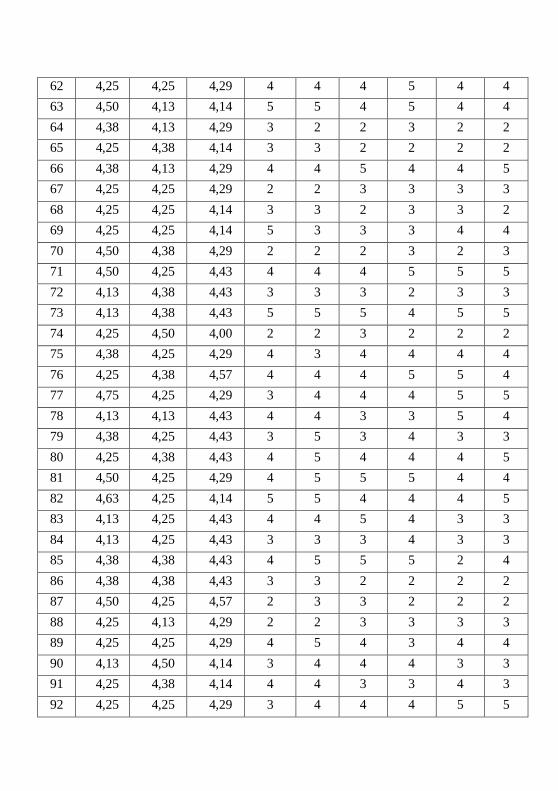
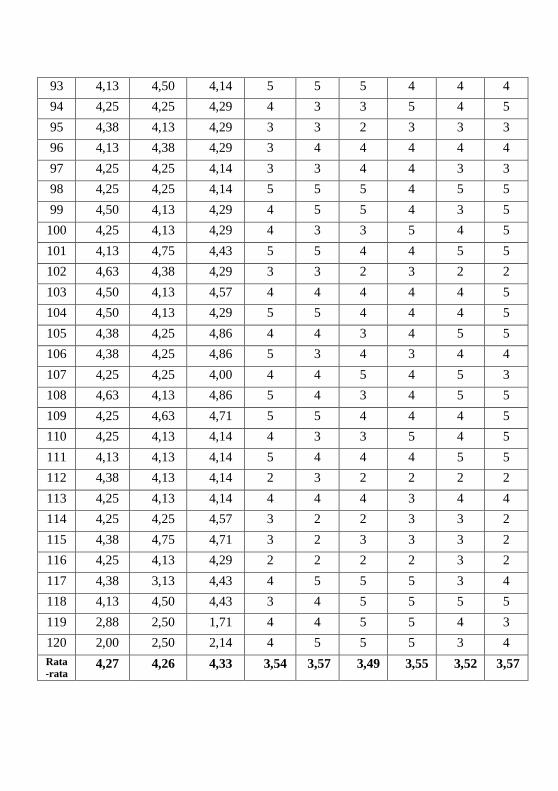
Hasil Rekapitulasi Jawaban Responden
Karakteristik X1
No. Gender Usia Lama
Kerja
Pend. X11 X12 X13 X14
1 2 2 2 3 4,50 3,75 4,50 4,25
2 2 2 2 3 4,25 4,00 4,50 4,25
3 2 1 2 2 4,25 4,00 4,50 4,25
4 1 1 1 4 4,25 4,00 4,50 4,25
5 2 2 1 2 4,25 4,25 4,25 4,25
6 2 2 1 4 4,25 4,50 4,00 4,00
7 2 2 1 2 4,50 4,50 4,00 4,25
8 1 1 1 4 4,25 4,50 4,25 4,25
9 2 1 2 4 4,50 4,50 4,00 4,25
10 2 2 2 4 4,50 4,25 4,25 4,25
11 2 1 2 4 4,50 4,25 4,25 4,25
12 2 3 3 3 4,25 4,25 4,25 4,50
13 1 2 1 3 4,50 4,00 4,50 4,25
14 1 1 1 3 4,50 4,00 4,50 4,25
15 1 2 2 3 4,25 4,25 4,50 4,25
16 1 2 2 2 4,50 4,50 3,75 4,50
17 2 1 2 4 4,25 4,25 4,50 4,25
18 2 3 2 2 4,25 4,25 4,50 4,25
19 2 2 2 2 4,00 4,50 4,25 4,00
20 2 2 1 4 4,00 4,25 4,25 4,25
21 1 3 2 1 4,50 4,25 4,25 3,75
22 2 2 2 3 4,50 4,25 4,25 3,75
23 1 2 1 4 4,25 4,50 4,25 4,25
24 2 2 2 2 4,00 4,25 4,75 4,25
25 2 2 2 4 4,25 4,50 4,25 4,25
26 1 3 2 2 3,75 4,50 4,00 4,25
27 2 1 1 3 3,75 4,50 4,00 4,25
28 2 2 2 4 4,00 4,25 4,50 4,25
29 1 2 2 3 4,25 4,00 4,50 4,25
30 2 2 2 4 4,25 4,00 4,50 4,25
31 1 2 1 4 4,25 4,25 4,25 4,25
32 1 2 2 2 4,50 4,50 4,00 4,50
33 2 2 1 4 4,50 4,25 4,50 4,25
34 2 2 2 4 4,50 4,50 4,00 4,50
35 1 2 2 2 4,25 4,50 4,25 4,50
36 1 3 2 4 4,25 4,25 5,00 4,00
37 1 2 1 3 4,25 4,50 4,25 4,50
38 1 3 3 2 4,50 4,75 3,75 4,50
39 1 2 1 4 4,25 4,50 4,50 4,25
40 1 2 2 4 4,50 4,50 4,25 4,25
41 2 3 2 1 4,00 4,25 4,25 4,50
42 2 2 2 2 4,25 4,25 4,25 4,25
43 1 1 2 4 4,00 4,25 4,25 4,50
44 2 2 2 4 4,25 4,50 4,25 4,50
45 1 1 2 2 4,25 4,50 4,00 4,50
46 2 1 2 3 4,25 4,50 4,00 4,50
47 1 1 1 3 4,25 4,50 4,50 4,00
48 1 3 3 2 4,50 3,75 4,75 4,25
49 1 2 2 4 4,25 4,25 4,50 4,50
50 2 2 2 3 4,25 4,50 4,25 4,50
51 1 2 1 4 4,25 4,50 4,25 4,50
52 1 3 2 3 4,50 4,50 4,50 4,25
53 1 1 2 4 4,50 4,50 4,50 4,25
54 2 2 2 4 4,25 4,25 4,25 4,00
55 2 2 2 2 4,50 4,25 4,50 4,50
56 1 2 1 3 4,25 4,50 4,25 4,25
57 1 1 1 4 4,25 4,25 4,50 4,25
58 1 3 2 3 4,25 4,25 4,25 5,00
59 2 2 2 3 4,50 4,50 4,00 4,75
60 1 2 2 2 4,50 4,50 4,25 4,50
61 2 1 2 4 4,50 4,25 4,50 4,25
62 2 2 2 2 4,50 4,50 4,00 4,50
63 2 2 2 4 4,50 4,25 4,25 4,50
64 2 2 1 4 4,50 4,25 4,25 4,50
65 2 2 2 2 4,50 4,25 4,50 4,25
66 2 2 2 2 4,25 4,50 4,50 4,25
67 1 2 1 3 4,50 4,50 4,00 4,50
68 1 1 2 4 4,25 4,25 4,50 4,25
69 1 2 2 3 4,25 4,25 4,50 4,25
70 1 1 1 4 4,25 4,25 4,25 4,25
71 1 1 2 3 4,25 4,50 4,25 4,00
72 1 2 2 2 5,00 4,50 4,00 4,25
73 2 2 2 2 5,00 4,50 4,00 4,25
74 2 2 2 3 4,75 4,00 4,00 4,75
75 2 2 1 3 4,75 4,25 4,50 4,25
76 2 2 2 3 4,25 4,25 4,50 4,00
77 1 2 2 4 4,50 4,25 4,25 4,25
78 2 3 3 3 4,25 4,50 4,25 4,50
79 1 2 1 3 4,00 4,00 4,50 4,00
80 2 3 3 3 4,00 4,00 4,25 4,25
81 1 2 1 3 4,25 5,00 4,25 4,50
82 1 2 1 3 4,75 4,25 4,50 4,50
83 2 3 2 1 4,50 4,25 4,50 4,50
84 2 2 2 3 4,50 4,25 4,50 4,50
85 2 1 2 3 4,25 4,00 4,50 4,00
86 1 2 2 3 4,25 4,00 4,50 4,00
87 2 2 1 3 4,50 4,25 4,25 4,25
88 2 1 2 4 4,25 4,50 4,25 4,50
89 2 2 2 2 4,50 4,50 4,25 4,50
90 2 2 1 3 4,25 4,50 4,50 4,50
91 1 2 2 2 4,25 4,25 4,25 5,00
92 1 2 2 3 4,50 4,50 4,25 4,50
93 1 1 2 4 4,25 4,50 4,50 4,50
94 2 2 1 3 4,50 4,25 4,50 4,50
95 2 2 1 2 4,25 4,25 4,25 5,00
96 2 2 1 2 4,25 4,25 5,00 4,25
97 2 3 2 2 4,50 4,25 4,50 4,25
98 1 1 2 4 4,50 4,25 4,50 4,25
99 2 2 2 4 4,50 4,50 4,50 4,50
100 2 2 1 2 5,00 4,25 4,25 4,25
101 1 2 2 4 4,00 4,25 4,25 4,25
102 2 1 1 3 4,50 4,25 4,25 3,75
103 2 2 2 2 4,00 4,00 4,25 4,25
104 1 3 1 1 4,50 4,75 4,25 4,75
105 2 2 2 3 4,25 4,00 4,25 4,50
106 2 1 2 2 4,25 4,00 4,25 4,50
107 2 2 1 3 4,25 4,75 4,25 4,50
108 2 2 2 4 4,25 4,25 4,50 4,25
109 2 2 1 2 4,25 4,25 4,25 4,25
110 2 2 1 2 4,25 4,50 4,75 4,50
111 2 2 2 2 4,25 4,50 4,50 4,50
112 2 2 1 3 4,75 4,25 4,50 4,75
113 1 2 2 4 4,50 5,00 4,25 4,50
114 1 1 1 3 4,50 4,25 4,50 2,25
115 2 1 1 3 4,25 4,25 4,25 4,50
116 1 1 1 3 3,75 4,50 2,25 2,25
117 1 1 2 3 2,25 1,50 2,25 1,75
118 1 1 2 3 2,25 2,25 1,50 2,25
119 2 3 3 4 2,25 2,25 1,75 2,00
120 2 3 3 4 1,75 1,75 2,75 2,25
Rata-rata 4,27 4,25 4,24 4,23
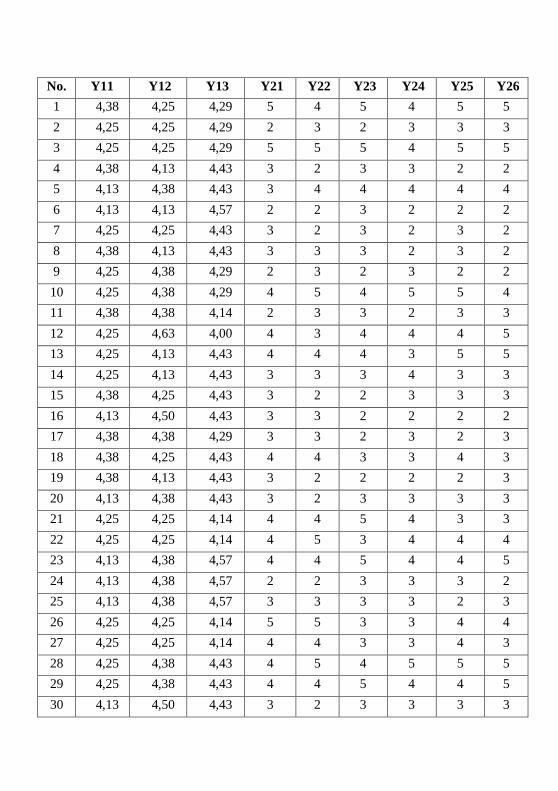
No. Y11 Y12 Y13 Y21 Y22 Y23 Y24 Y25 Y26
1 4,38 4,25 4,29 5 4 5 4 5 5
2 4,25 4,25 4,29 2 3 2 3 3 3
3 4,25 4,25 4,29 5 5 5 4 5 5
4 4,38 4,13 4,43 3 2 3 3 2 2
5 4,13 4,38 4,43 3 4 4 4 4 4
6 4,13 4,13 4,57 2 2 3 2 2 2
7 4,25 4,25 4,43 3 2 3 2 3 2
8 4,38 4,13 4,43 3 3 3 2 3 2
9 4,25 4,38 4,29 2 3 2 3 2 2
10 4,25 4,38 4,29 4 5 4 5 5 4
11 4,38 4,38 4,14 2 3 3 2 3 3
12 4,25 4,63 4,00 4 3 4 4 4 5
13 4,25 4,13 4,43 4 4 4 3 5 5
14 4,25 4,13 4,43 3 3 3 4 3 3
15 4,38 4,25 4,43 3 2 2 3 3 3
16 4,13 4,50 4,43 3 3 2 2 2 2
17 4,38 4,38 4,29 3 3 2 3 2 3
18 4,38 4,25 4,43 4 4 3 3 4 3
19 4,38 4,13 4,43 3 2 2 2 2 3
20 4,13 4,38 4,43 3 2 3 3 3 3
21 4,25 4,25 4,14 4 4 5 4 3 3
22 4,25 4,25 4,14 4 5 3 4 4 4
23 4,13 4,38 4,57 4 4 5 4 4 5
24 4,13 4,38 4,57 2 2 3 3 3 2
25 4,13 4,38 4,57 3 3 3 3 2 3
26 4,25 4,25 4,14 5 5 3 3 4 4
27 4,25 4,25 4,14 4 4 3 3 4 3
28 4,25 4,38 4,43 4 5 4 5 5 5
29 4,25 4,38 4,43 4 4 5 4 4 5
30 4,13 4,50 4,43 3 2 3 3 3 3
31 4,13 4,50 4,43 2 3 3 3 3 3
32 4,25 4,38 4,43 5 4 5 4 5 5
33 4,25 4,50 4,29 3 3 3 3 3 2
34 4,50 4,13 4,43 4 5 3 4 4 4
35 4,25 4,25 4,43 3 3 2 3 3 2
36 4,13 4,38 4,43 4 5 5 5 2 4
37 4,25 4,25 4,43 5 5 5 4 4 4
38 4,25 4,25 4,43 5 4 4 5 5 5
39 4,25 4,38 4,29 2 3 2 2 2 3
40 4,38 4,25 4,29 5 5 5 4 4 4
41 4,25 4,25 4,57 5 5 5 4 4 5
42 4,25 4,25 4,57 4 4 4 5 5 5
43 4,25 4,25 4,57 5 4 5 4 5 5
44 4,25 4,63 4,29 2 2 2 2 3 2
45 4,50 4,38 4,29 3 3 3 2 3 3
46 4,50 4,38 4,29 2 2 2 3 3 2
47 4,50 4,25 4,43 2 2 2 3 3 2
48 4,25 4,50 4,43 2 3 2 3 2 2
49 4,25 4,25 4,71 5 5 5 4 4 5
50 4,25 4,38 4,57 3 2 2 2 3 2
51 4,38 4,25 4,57 2 2 2 3 3 3
52 4,25 4,25 4,57 3 4 4 4 3 3
53 4,25 4,25 4,57 4 4 4 5 5 5
54 4,13 4,50 4,43 3 2 3 3 3 3
55 4,25 4,38 4,43 4 4 5 4 3 3
56 4,38 4,25 4,57 3 2 3 3 3 3
57 4,25 4,38 4,57 4 5 4 4 5 4
58 4,38 4,50 4,14 3 2 2 3 2 2
59 4,50 4,38 4,14 4 5 4 4 4 5
60 4,50 4,25 4,43 4 4 4 5 3 4
61 4,38 4,13 4,29 2 2 3 2 2 2
62 4,25 4,25 4,29 4 4 4 5 4 4
63 4,50 4,13 4,14 5 5 4 5 4 4
64 4,38 4,13 4,29 3 2 2 3 2 2
65 4,25 4,38 4,14 3 3 2 2 2 2
66 4,38 4,13 4,29 4 4 5 4 4 5
67 4,25 4,25 4,29 2 2 3 3 3 3
68 4,25 4,25 4,14 3 3 2 3 3 2
69 4,25 4,25 4,14 5 3 3 3 4 4
70 4,50 4,38 4,29 2 2 2 3 2 3
71 4,50 4,25 4,43 4 4 4 5 5 5
72 4,13 4,38 4,43 3 3 3 2 3 3
73 4,13 4,38 4,43 5 5 5 4 5 5
74 4,25 4,50 4,00 2 2 3 2 2 2
75 4,38 4,25 4,29 4 3 4 4 4 4
76 4,25 4,38 4,57 4 4 4 5 5 4
77 4,75 4,25 4,29 3 4 4 4 5 5
78 4,13 4,13 4,43 4 4 3 3 5 4
79 4,38 4,25 4,43 3 5 3 4 3 3
80 4,25 4,38 4,43 4 5 4 4 4 5
81 4,50 4,25 4,29 4 5 5 5 4 4
82 4,63 4,25 4,14 5 5 4 4 4 5
83 4,13 4,25 4,43 4 4 5 4 3 3
84 4,13 4,25 4,43 3 3 3 4 3 3
85 4,38 4,38 4,43 4 5 5 5 2 4
86 4,38 4,38 4,43 3 3 2 2 2 2
87 4,50 4,25 4,57 2 3 3 2 2 2
88 4,25 4,13 4,29 2 2 3 3 3 3
89 4,25 4,25 4,29 4 5 4 3 4 4
90 4,13 4,50 4,14 3 4 4 4 3 3
91 4,25 4,38 4,14 4 4 3 3 4 3
92 4,25 4,25 4,29 3 4 4 4 5 5
93 4,13 4,50 4,14 5 5 5 4 4 4
94 4,25 4,25 4,29 4 3 3 5 4 5
95 4,38 4,13 4,29 3 3 2 3 3 3
96 4,13 4,38 4,29 3 4 4 4 4 4
97 4,25 4,25 4,14 3 3 4 4 3 3
98 4,25 4,25 4,14 5 5 5 4 5 5
99 4,50 4,13 4,29 4 5 5 4 3 5
100 4,25 4,13 4,29 4 3 3 5 4 5
101 4,13 4,75 4,43 5 5 4 4 5 5
102 4,63 4,38 4,29 3 3 2 3 2 2
103 4,50 4,13 4,57 4 4 4 4 4 5
104 4,50 4,13 4,29 5 5 4 4 4 5
105 4,38 4,25 4,86 4 4 3 4 5 5
106 4,38 4,25 4,86 5 3 4 3 4 4
107 4,25 4,25 4,00 4 4 5 4 5 3
108 4,63 4,13 4,86 5 4 3 4 5 5
109 4,25 4,63 4,71 5 5 4 4 4 5
110 4,25 4,13 4,14 4 3 3 5 4 5
111 4,13 4,13 4,14 5 4 4 4 5 5
112 4,38 4,13 4,14 2 3 2 2 2 2
113 4,25 4,13 4,14 4 4 4 3 4 4
114 4,25 4,25 4,57 3 2 2 3 3 2
115 4,38 4,75 4,71 3 2 3 3 3 2
116 4,25 4,13 4,29 2 2 2 2 3 2
117 4,38 3,13 4,43 4 5 5 5 3 4
118 4,13 4,50 4,43 3 4 5 5 5 5
119 2,88 2,50 1,71 4 4 5 5 4 3
120 2,00 2,50 2,14 4 5 5 5 3 4
Rata
-rata 4,27 4,26 4,33 3,54 3,57 3,49 3,55 3,52 3,57

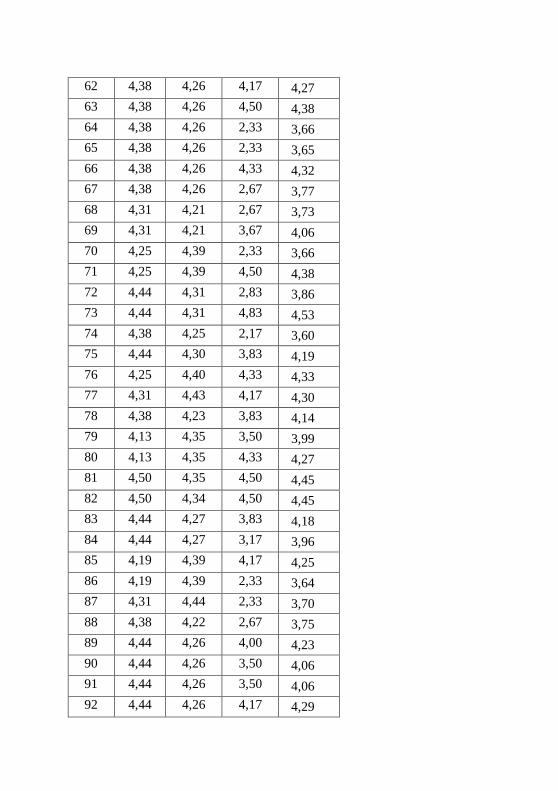
No. X1 Y1 Y2 All
1 4,25 4,30 4,67 4,41
2 4,25 4,26 2,67 3,73
3 4,25 4,26 4,83 4,45
4 4,25 4,31 2,50 3,69
5 4,25 4,31 3,83 4,13
6 4,19 4,27 2,17 3,54
7 4,31 4,31 2,50 3,71
8 4,31 4,31 2,67 3,76
9 4,31 4,30 2,33 3,65
10 4,31 4,30 4,50 4,37
11 4,31 4,30 2,67 3,76
12 4,31 4,29 4,00 4,20
13 4,31 4,27 4,17 4,25
14 4,31 4,27 3,17 3,92
15 4,31 4,35 2,67 3,78
16 4,31 4,35 2,33 3,67
17 4,31 4,35 2,67 3,77
18 4,31 4,35 3,50 4,05
19 4,19 4,31 2,33 3,61
20 4,19 4,31 2,83 3,78
21 4,19 4,21 3,83 4,08
22 4,19 4,21 4,00 4,13
23 4,31 4,36 4,33 4,33
24 4,31 4,36 2,50 3,72
25 4,31 4,36 2,83 3,83
26 4,13 4,21 4,00 4,11
27 4,13 4,21 3,50 3,95
28 4,25 4,35 4,67 4,42
29 4,25 4,35 4,33 4,31
30 4,25 4,35 2,83 3,81

31 4,25 4,35 2,83 3,81
32 4,38 4,35 4,67 4,46
33 4,38 4,35 2,83 3,85
34 4,38 4,35 4,00 4,24
35 4,38 4,31 2,67 3,78
36 4,38 4,31 4,17 4,28
37 4,38 4,31 4,50 4,39
38 4,38 4,31 4,67 4,45
39 4,38 4,30 2,33 3,67
40 4,38 4,30 4,50 4,39
41 4,25 4,36 4,67 4,42
42 4,25 4,36 4,50 4,37
43 4,25 4,36 4,67 4,42
44 4,38 4,39 2,17 3,64
45 4,31 4,39 2,83 3,84
46 4,31 4,39 2,33 3,68
47 4,31 4,39 2,33 3,68
48 4,31 4,39 2,33 3,68
49 4,38 4,40 4,67 4,48
50 4,38 4,40 2,33 3,70
51 4,38 4,40 2,50 3,76
52 4,44 4,36 3,50 4,10
53 4,44 4,36 4,50 4,43
54 4,19 4,35 2,83 3,79
55 4,44 4,35 3,83 4,21
56 4,31 4,40 2,83 3,85
57 4,31 4,40 4,33 4,35
58 4,44 4,34 2,33 3,70
59 4,44 4,34 4,33 4,37
60 4,44 4,39 4,00 4,28
61 4,38 4,26 2,17 3,60
62 4,38 4,26 4,17 4,27
63 4,38 4,26 4,50 4,38
64 4,38 4,26 2,33 3,66
65 4,38 4,26 2,33 3,65
66 4,38 4,26 4,33 4,32
67 4,38 4,26 2,67 3,77
68 4,31 4,21 2,67 3,73
69 4,31 4,21 3,67 4,06
70 4,25 4,39 2,33 3,66
71 4,25 4,39 4,50 4,38
72 4,44 4,31 2,83 3,86
73 4,44 4,31 4,83 4,53
74 4,38 4,25 2,17 3,60
75 4,44 4,30 3,83 4,19
76 4,25 4,40 4,33 4,33
77 4,31 4,43 4,17 4,30
78 4,38 4,23 3,83 4,14
79 4,13 4,35 3,50 3,99
80 4,13 4,35 4,33 4,27
81 4,50 4,35 4,50 4,45
82 4,50 4,34 4,50 4,45
83 4,44 4,27 3,83 4,18
84 4,44 4,27 3,17 3,96
85 4,19 4,39 4,17 4,25
86 4,19 4,39 2,33 3,64
87 4,31 4,44 2,33 3,70
88 4,38 4,22 2,67 3,75
89 4,44 4,26 4,00 4,23
90 4,44 4,26 3,50 4,06
91 4,44 4,26 3,50 4,06
92 4,44 4,26 4,17 4,29
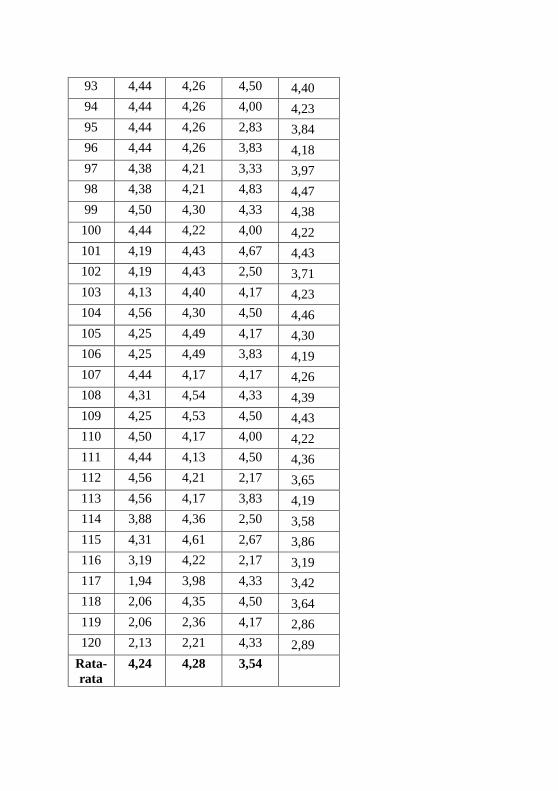
93 4,44 4,26 4,50 4,40
94 4,44 4,26 4,00 4,23
95 4,44 4,26 2,83 3,84
96 4,44 4,26 3,83 4,18
97 4,38 4,21 3,33 3,97
98 4,38 4,21 4,83 4,47
99 4,50 4,30 4,33 4,38
100 4,44 4,22 4,00 4,22
101 4,19 4,43 4,67 4,43
102 4,19 4,43 2,50 3,71
103 4,13 4,40 4,17 4,23
104 4,56 4,30 4,50 4,46
105 4,25 4,49 4,17 4,30
106 4,25 4,49 3,83 4,19
107 4,44 4,17 4,17 4,26
108 4,31 4,54 4,33 4,39
109 4,25 4,53 4,50 4,43
110 4,50 4,17 4,00 4,22
111 4,44 4,13 4,50 4,36
112 4,56 4,21 2,17 3,65
113 4,56 4,17 3,83 4,19
114 3,88 4,36 2,50 3,58
115 4,31 4,61 2,67 3,86
116 3,19 4,22 2,17 3,19
117 1,94 3,98 4,33 3,42
118 2,06 4,35 4,50 3,64
119 2,06 2,36 4,17 2,86
120 2,13 2,21 4,33 2,89
Rata-
rata
4,24 4,28 3,54
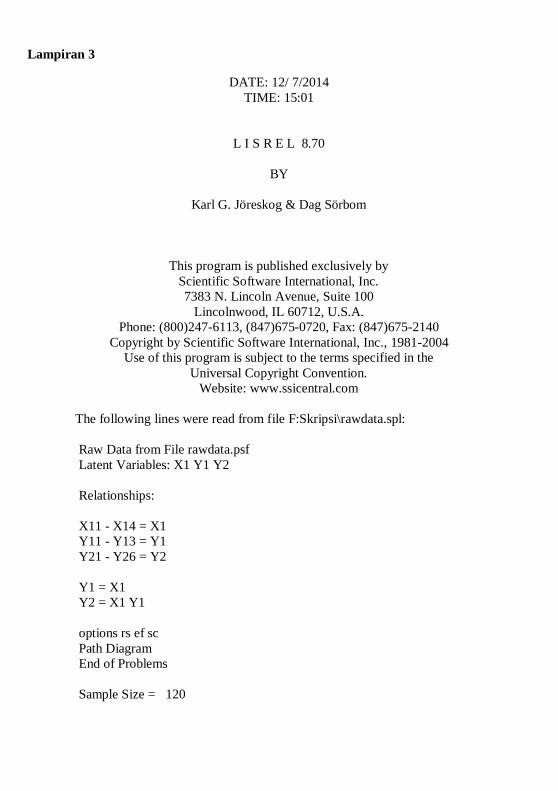
Lampiran 3
DATE: 12/ 7/2014
TIME: 15:01
L I S R E L 8.70
BY
Karl G. Jöreskog & Dag Sörbom
This program is published exclusively by
Scientific Software International, Inc.
7383 N. Lincoln Avenue, Suite 100
Lincolnwood, IL 60712, U.S.A.
Phone: (800)247-6113, (847)675-0720, Fax: (847)675-2140
Copyright by Scientific Software International, Inc., 1981-2004
Use of this program is subject to the terms specified in the
Universal Copyright Convention.
Website: www.ssicentral.com
The following lines were read from file F:Skripsi\rawdata.spl:
Raw Data from File rawdata.psf
Latent Variables: X1 Y1 Y2
Relationships:
X11 - X14 = X1
Y11 - Y13 = Y1
Y21 - Y26 = Y2
Y1 = X1
Y2 = X1 Y1
options rs ef sc
Path Diagram
End of Problems
Sample Size = 120
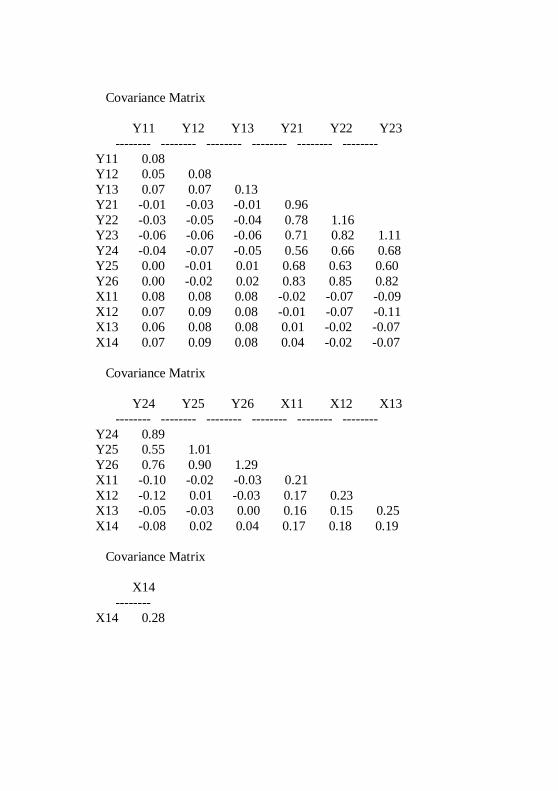
Covariance Matrix
Y11 Y12 Y13 Y21 Y22 Y23
-------- -------- -------- -------- -------- --------
Y11 0.08
Y12 0.05 0.08
Y13 0.07 0.07 0.13
Y21 -0.01 -0.03 -0.01 0.96
Y22 -0.03 -0.05 -0.04 0.78 1.16
Y23 -0.06 -0.06 -0.06 0.71 0.82 1.11
Y24 -0.04 -0.07 -0.05 0.56 0.66 0.68
Y25 0.00 -0.01 0.01 0.68 0.63 0.60
Y26 0.00 -0.02 0.02 0.83 0.85 0.82
X11 0.08 0.08 0.08 -0.02 -0.07 -0.09
X12 0.07 0.09 0.08 -0.01 -0.07 -0.11
X13 0.06 0.08 0.08 0.01 -0.02 -0.07
X14 0.07 0.09 0.08 0.04 -0.02 -0.07
Covariance Matrix
Y24 Y25 Y26 X11 X12 X13
-------- -------- -------- -------- -------- --------
Y24 0.89
Y25 0.55 1.01
Y26 0.76 0.90 1.29
X11 -0.10 -0.02 -0.03 0.21
X12 -0.12 0.01 -0.03 0.17 0.23
X13 -0.05 -0.03 0.00 0.16 0.15 0.25
X14 -0.08 0.02 0.04 0.17 0.18 0.19
Covariance Matrix
X14
--------
X14 0.28
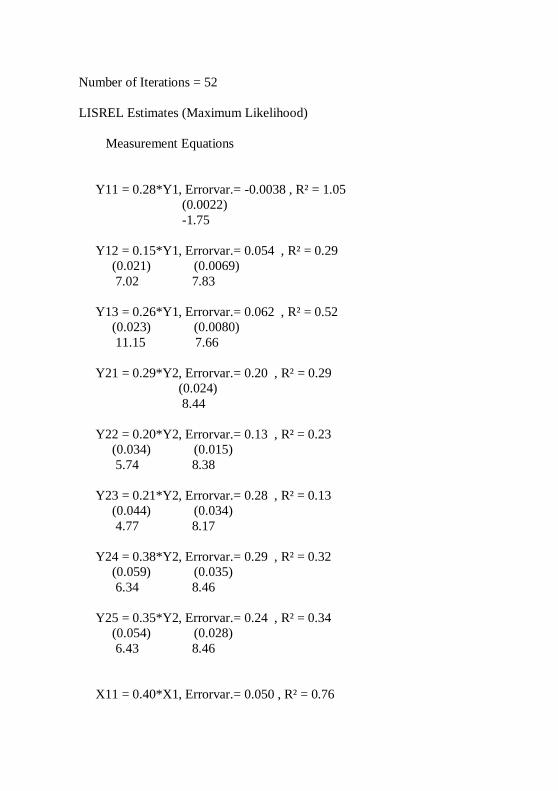
Number of Iterations = 52
LISREL Estimates (Maximum Likelihood)
Measurement Equations
Y11 = 0.28*Y1, Errorvar.= -0.0038 , R² = 1.05
(0.0022)
-1.75
Y12 = 0.15*Y1, Errorvar.= 0.054 , R² = 0.29
(0.021) (0.0069)
7.02 7.83
Y13 = 0.26*Y1, Errorvar.= 0.062 , R² = 0.52
(0.023) (0.0080)
11.15 7.66
Y21 = 0.29*Y2, Errorvar.= 0.20 , R² = 0.29
(0.024)
8.44
Y22 = 0.20*Y2, Errorvar.= 0.13 , R² = 0.23
(0.034) (0.015)
5.74 8.38
Y23 = 0.21*Y2, Errorvar.= 0.28 , R² = 0.13
(0.044) (0.034)
4.77 8.17
Y24 = 0.38*Y2, Errorvar.= 0.29 , R² = 0.32
(0.059) (0.035)
6.34 8.46
Y25 = 0.35*Y2, Errorvar.= 0.24 , R² = 0.34
(0.054) (0.028)
6.43 8.46
X11 = 0.40*X1, Errorvar.= 0.050 , R² = 0.76
(0.035) (0.011)
11.48 4.59
X12 = 0.41*X1, Errorvar.= 0.064 , R² = 0.73
(0.037) (0.013)
11.09 5.06
X13 = 0.26*X1, Errorvar.= 0.094 , R² = 0.42
(0.034) (0.013)
7.60 7.03
X14 = 0.27*X1, Errorvar.= 0.088 , R² = 0.46
(0.034) (0.013)
8.04 6.92
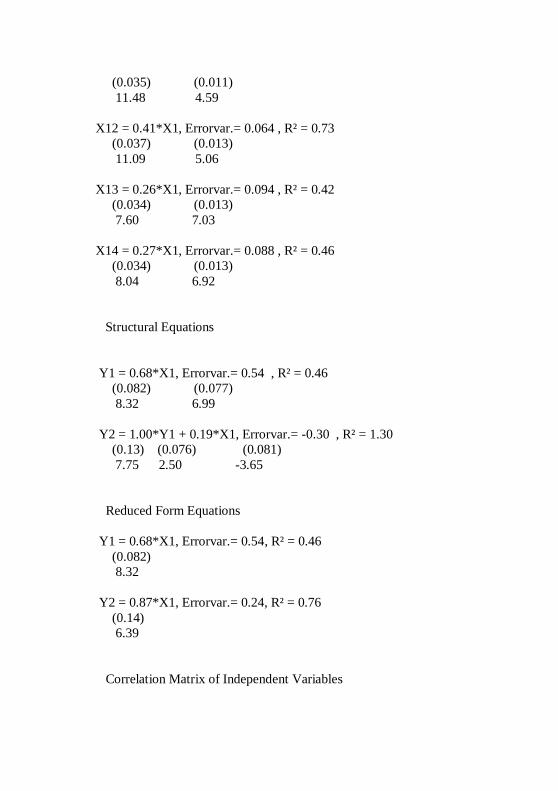
Structural Equations
Y1 = 0.68*X1, Errorvar.= 0.54 , R² = 0.46
(0.082) (0.077)
8.32 6.99
Y2 = 1.00*Y1 + 0.19*X1, Errorvar.= -0.30 , R² = 1.30
(0.13) (0.076) (0.081)
7.75 2.50 -3.65
Reduced Form Equations
Y1 = 0.68*X1, Errorvar.= 0.54, R² = 0.46
(0.082)
8.32
Y2 = 0.87*X1, Errorvar.= 0.24, R² = 0.76
(0.14)
6.39
Correlation Matrix of Independent Variables
X1
--------
1.00
Covariance Matrix of Latent Variables
Y1 Y2 X1
-------- -------- --------
Y1 1.00
Y2 1.13 1.00
X1 0.68 0.87 1.00
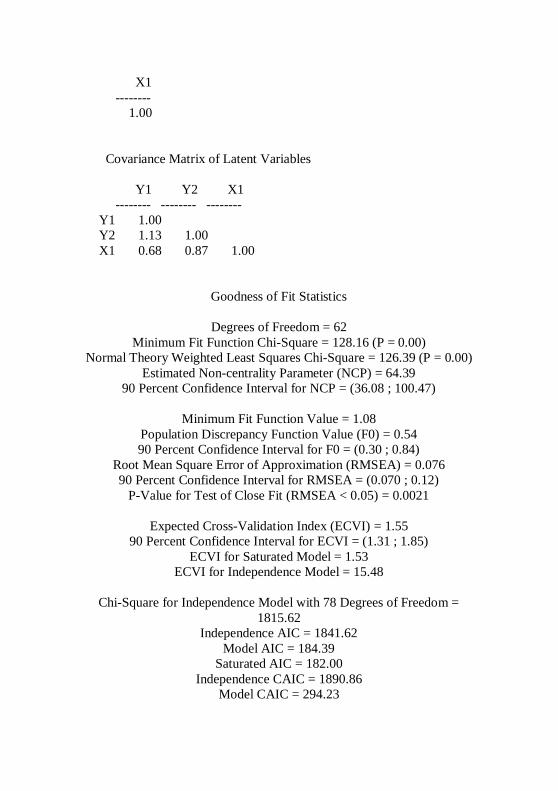
Goodness of Fit Statistics
Degrees of Freedom = 62
Minimum Fit Function Chi-Square = 128.16 (P = 0.00)
Normal Theory Weighted Least Squares Chi-Square = 126.39 (P = 0.00)
Estimated Non-centrality Parameter (NCP) = 64.39
90 Percent Confidence Interval for NCP = (36.08 ; 100.47)
Minimum Fit Function Value = 1.08
Population Discrepancy Function Value (F0) = 0.54
90 Percent Confidence Interval for F0 = (0.30 ; 0.84)
Root Mean Square Error of Approximation (RMSEA) = 0.076
90 Percent Confidence Interval for RMSEA = (0.070 ; 0.12)
P-Value for Test of Close Fit (RMSEA < 0.05) = 0.0021
Expected Cross-Validation Index (ECVI) = 1.55
90 Percent Confidence Interval for ECVI = (1.31 ; 1.85)
ECVI for Saturated Model = 1.53
ECVI for Independence Model = 15.48
Chi-Square for Independence Model with 78 Degrees of Freedom =
1815.62
Independence AIC = 1841.62
Model AIC = 184.39
Saturated AIC = 182.00
Independence CAIC = 1890.86
Model CAIC = 294.23
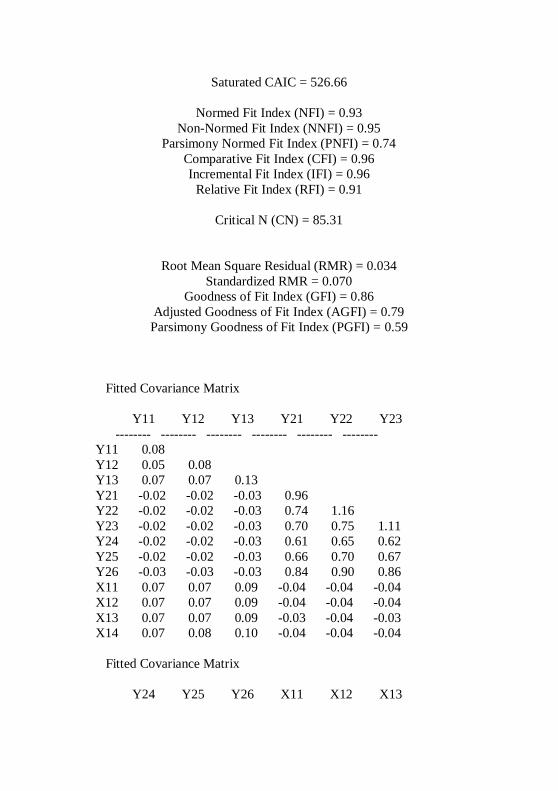
Saturated CAIC = 526.66
Normed Fit Index (NFI) = 0.93
Non-Normed Fit Index (NNFI) = 0.95
Parsimony Normed Fit Index (PNFI) = 0.74
Comparative Fit Index (CFI) = 0.96
Incremental Fit Index (IFI) = 0.96
Relative Fit Index (RFI) = 0.91
Critical N (CN) = 85.31
Root Mean Square Residual (RMR) = 0.034
Standardized RMR = 0.070
Goodness of Fit Index (GFI) = 0.86
Adjusted Goodness of Fit Index (AGFI) = 0.79
Parsimony Goodness of Fit Index (PGFI) = 0.59
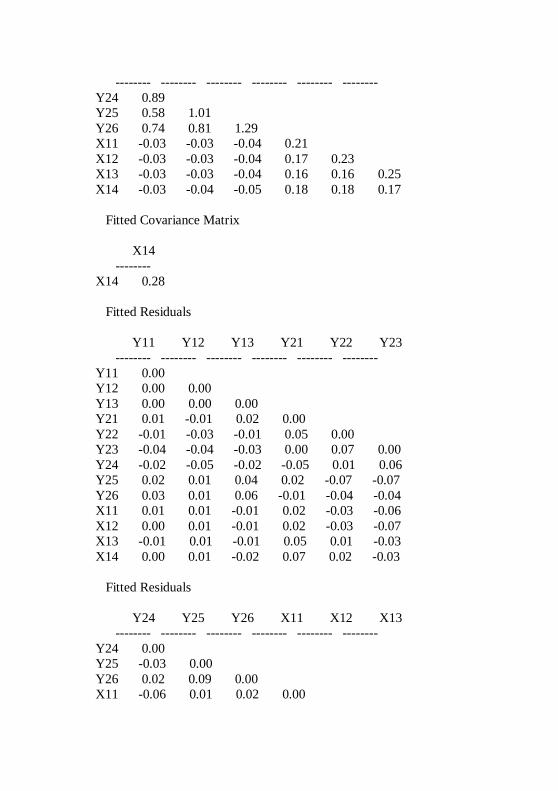
Fitted Covariance Matrix
Y11 Y12 Y13 Y21 Y22 Y23
-------- -------- -------- -------- -------- --------
Y11 0.08
Y12 0.05 0.08
Y13 0.07 0.07 0.13
Y21 -0.02 -0.02 -0.03 0.96
Y22 -0.02 -0.02 -0.03 0.74 1.16
Y23 -0.02 -0.02 -0.03 0.70 0.75 1.11
Y24 -0.02 -0.02 -0.03 0.61 0.65 0.62
Y25 -0.02 -0.02 -0.03 0.66 0.70 0.67
Y26 -0.03 -0.03 -0.03 0.84 0.90 0.86
X11 0.07 0.07 0.09 -0.04 -0.04 -0.04
X12 0.07 0.07 0.09 -0.04 -0.04 -0.04
X13 0.07 0.07 0.09 -0.03 -0.04 -0.03
X14 0.07 0.08 0.10 -0.04 -0.04 -0.04
Fitted Covariance Matrix
Y24 Y25 Y26 X11 X12 X13
-------- -------- -------- -------- -------- --------
Y24 0.89
Y25 0.58 1.01
Y26 0.74 0.81 1.29
X11 -0.03 -0.03 -0.04 0.21
X12 -0.03 -0.03 -0.04 0.17 0.23
X13 -0.03 -0.03 -0.04 0.16 0.16 0.25
X14 -0.03 -0.04 -0.05 0.18 0.18 0.17
Fitted Covariance Matrix
X14
--------
X14 0.28
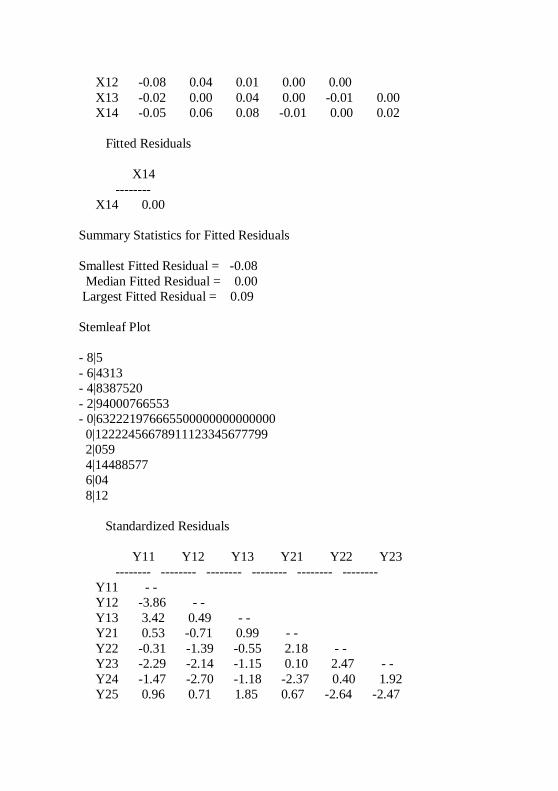
Fitted Residuals
Y11 Y12 Y13 Y21 Y22 Y23
-------- -------- -------- -------- -------- --------
Y11 0.00
Y12 0.00 0.00
Y13 0.00 0.00 0.00
Y21 0.01 -0.01 0.02 0.00
Y22 -0.01 -0.03 -0.01 0.05 0.00
Y23 -0.04 -0.04 -0.03 0.00 0.07 0.00
Y24 -0.02 -0.05 -0.02 -0.05 0.01 0.06
Y25 0.02 0.01 0.04 0.02 -0.07 -0.07
Y26 0.03 0.01 0.06 -0.01 -0.04 -0.04
X11 0.01 0.01 -0.01 0.02 -0.03 -0.06
X12 0.00 0.01 -0.01 0.02 -0.03 -0.07
X13 -0.01 0.01 -0.01 0.05 0.01 -0.03
X14 0.00 0.01 -0.02 0.07 0.02 -0.03
Fitted Residuals
Y24 Y25 Y26 X11 X12 X13
-------- -------- -------- -------- -------- --------
Y24 0.00
Y25 -0.03 0.00
Y26 0.02 0.09 0.00
X11 -0.06 0.01 0.02 0.00
X12 -0.08 0.04 0.01 0.00 0.00
X13 -0.02 0.00 0.04 0.00 -0.01 0.00
X14 -0.05 0.06 0.08 -0.01 0.00 0.02
Fitted Residuals
X14
--------
X14 0.00
Summary Statistics for Fitted Residuals
Smallest Fitted Residual = -0.08
Median Fitted Residual = 0.00
Largest Fitted Residual = 0.09
Stemleaf Plot
- 8|5
- 6|4313
- 4|8387520
- 2|94000766553
- 0|632221976665500000000000000
0|12222456678911123345677799
2|059
4|14488577
6|04
8|12
Standardized Residuals
Y11 Y12 Y13 Y21 Y22 Y23
-------- -------- -------- -------- -------- --------
Y11 - -
Y12 -3.86 - -
Y13 3.42 0.49 - -
Y21 0.53 -0.71 0.99 - -
Y22 -0.31 -1.39 -0.55 2.18 - -
Y23 -2.29 -2.14 -1.15 0.10 2.47 - -
Y24 -1.47 -2.70 -1.18 -2.37 0.40 1.92
Y25 0.96 0.71 1.85 0.67 -2.64 -2.47
Y26 1.74 0.35 2.82 -0.58 -2.30 -1.91
X11 1.54 2.13 -2.46 0.83 -1.14 -2.15
X12 0.46 2.60 -1.93 0.93 -0.97 -2.31
X13 -1.07 1.09 -0.77 1.54 0.37 -0.95
X14 -0.72 1.77 -2.93 2.34 0.56 -0.74
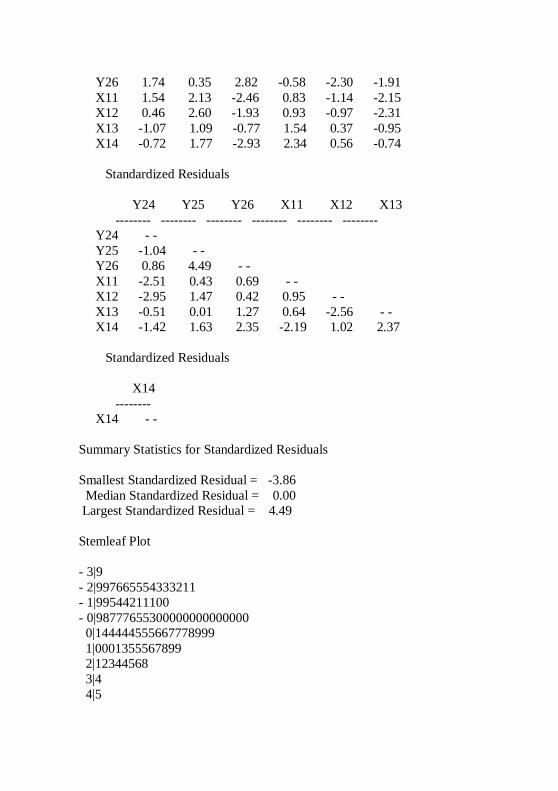
Standardized Residuals
Y24 Y25 Y26 X11 X12 X13
-------- -------- -------- -------- -------- --------
Y24 - -
Y25 -1.04 - -
Y26 0.86 4.49 - -
X11 -2.51 0.43 0.69 - -
X12 -2.95 1.47 0.42 0.95 - -
X13 -0.51 0.01 1.27 0.64 -2.56 - -
X14 -1.42 1.63 2.35 -2.19 1.02 2.37
Standardized Residuals
X14
--------
X14 - -
Summary Statistics for Standardized Residuals
Smallest Standardized Residual = -3.86
Median Standardized Residual = 0.00
Largest Standardized Residual = 4.49
Stemleaf Plot
- 3|9
- 2|997665554333211
- 1|99544211100
- 0|98777655300000000000000
0|144444555667778999
1|0001355567899
2|12344568
3|4
4|5
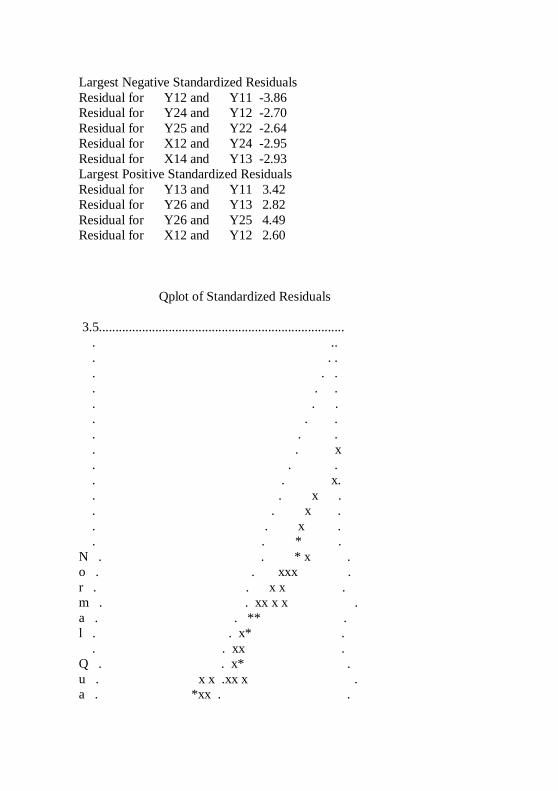
Largest Negative Standardized Residuals
Residual for Y12 and Y11 -3.86
Residual for Y24 and Y12 -2.70
Residual for Y25 and Y22 -2.64
Residual for X12 and Y24 -2.95
Residual for X14 and Y13 -2.93
Largest Positive Standardized Residuals
Residual for Y13 and Y11 3.42
Residual for Y26 and Y13 2.82
Residual for Y26 and Y25 4.49
Residual for X12 and Y12 2.60
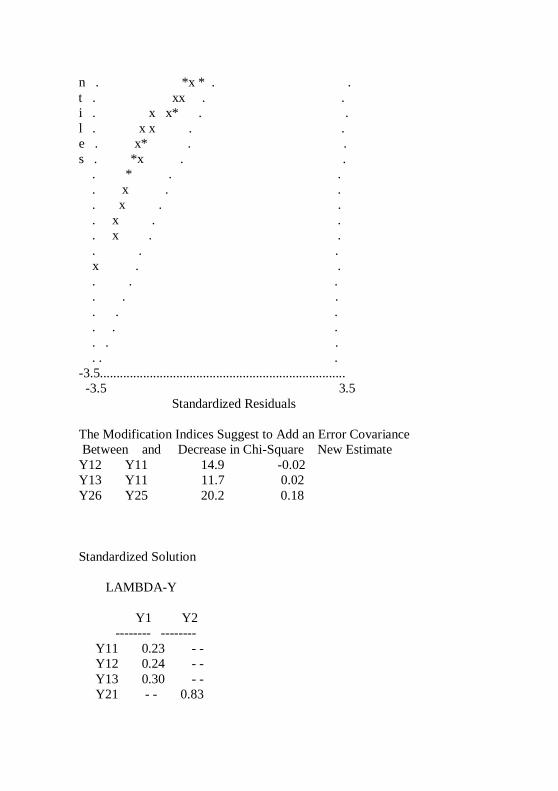
Qplot of Standardized Residuals
3.5..........................................................................
. ..
. . .
. . .
. . .
. . .
. . .
. . .
. . x
. . .
. . x.
. . x .
. . x .
. . x .
. . * .
N . . * x .
o . . xxx .
r . . x x .
m . . xx x x .
a . . ** .
l . . x* .
. . xx .
Q . . x* .
u . x x .xx x .
a . *xx . .
n . *x * . .
t . xx . .
i . x x* . .
l . x x . .
e . x* . .
s . *x . .
. * . .
. x . .
. x . .
. x . .
. x . .
. . .
x . .
. . .
. . .
. . .
. . .
. . .
. . .
-3.5..........................................................................
-3.5 3.5
Standardized Residuals
The Modification Indices Suggest to Add an Error Covariance
Between and Decrease in Chi-Square New Estimate
Y12 Y11 14.9 -0.02
Y13 Y11 11.7 0.02
Y26 Y25 20.2 0.18
Standardized Solution
LAMBDA-Y
Y1 Y2
-------- --------
Y11 0.23 - -
Y12 0.24 - -
Y13 0.30 - -
Y21 - - 0.83
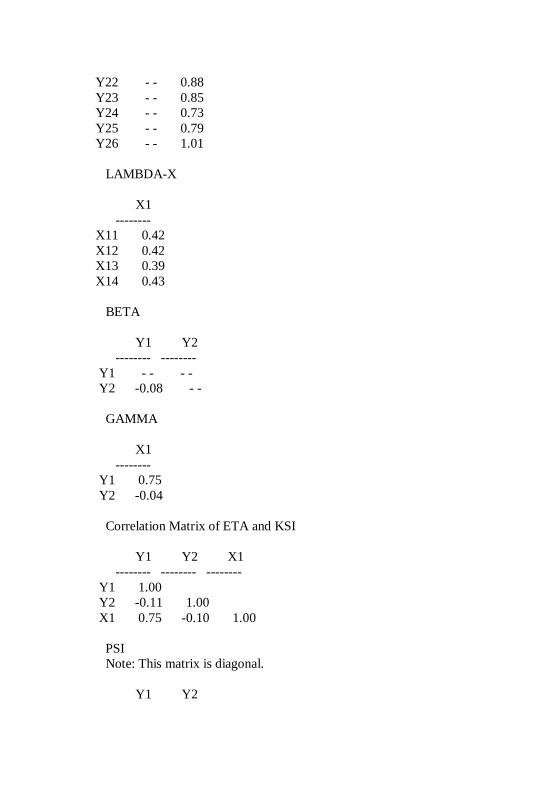
Y22 - - 0.88
Y23 - - 0.85
Y24 - - 0.73
Y25 - - 0.79
Y26 - - 1.01
LAMBDA-X
X1
--------
X11 0.42
X12 0.42
X13 0.39
X14 0.43
BETA
Y1 Y2
-------- --------
Y1 - - - -
Y2 -0.08 - -
GAMMA
X1
--------
Y1 0.75
Y2 -0.04
Correlation Matrix of ETA and KSI
Y1 Y2 X1
-------- -------- --------
Y1 1.00
Y2 -0.11 1.00
X1 0.75 -0.10 1.00
PSI
Note: This matrix is diagonal.
Y1 Y2
-------- --------
0.44 0.99
Regression Matrix ETA on KSI (Standardized)
X1
--------
Y1 0.75
Y2 -0.10
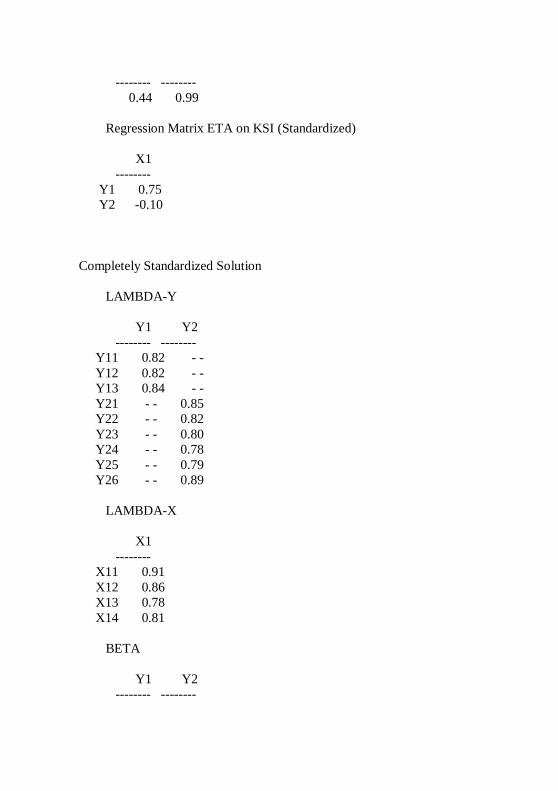
Completely Standardized Solution
LAMBDA-Y
Y1 Y2
-------- --------
Y11 0.82 - -
Y12 0.82 - -
Y13 0.84 - -
Y21 - - 0.85
Y22 - - 0.82
Y23 - - 0.80
Y24 - - 0.78
Y25 - - 0.79
Y26 - - 0.89
LAMBDA-X
X1
--------
X11 0.91
X12 0.86
X13 0.78
X14 0.81
BETA
Y1 Y2
-------- --------
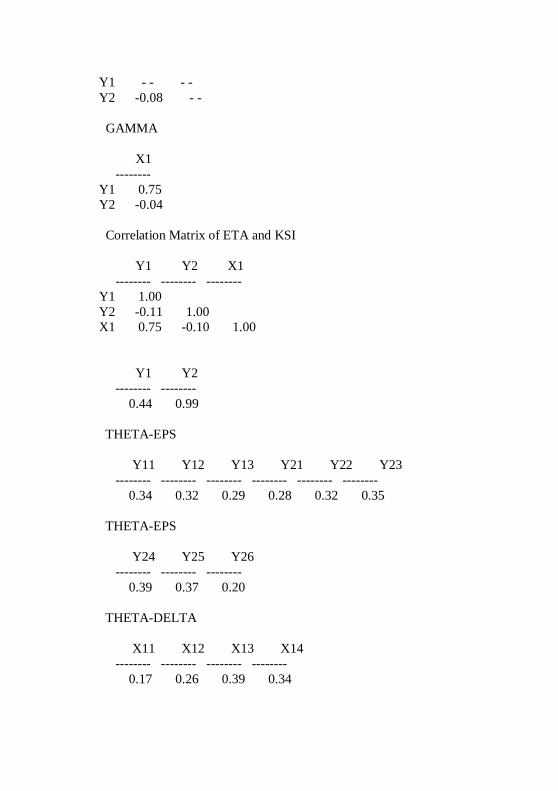
Y1 - - - -
Y2 -0.08 - -
GAMMA
X1
--------
Y1 0.75
Y2 -0.04
Correlation Matrix of ETA and KSI
Y1 Y2 X1
-------- -------- --------
Y1 1.00
Y2 -0.11 1.00
X1 0.75 -0.10 1.00
Y1 Y2
-------- --------
0.44 0.99
THETA-EPS
Y11 Y12 Y13 Y21 Y22 Y23
-------- -------- -------- -------- -------- --------
0.34 0.32 0.29 0.28 0.32 0.35
THETA-EPS
Y24 Y25 Y26
-------- -------- --------
0.39 0.37 0.20
THETA-DELTA
X11 X12 X13 X14
-------- -------- -------- --------
0.17 0.26 0.39 0.34
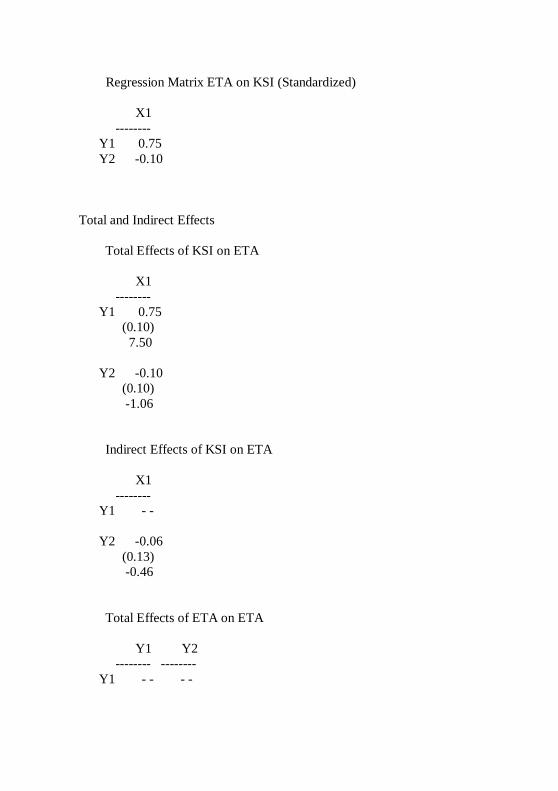
Regression Matrix ETA on KSI (Standardized)
X1
--------
Y1 0.75
Y2 -0.10
Total and Indirect Effects
Total Effects of KSI on ETA
X1
--------
Y1 0.75
(0.10)
7.50
Y2 -0.10
(0.10)
-1.06
Indirect Effects of KSI on ETA
X1
--------
Y1 - -
Y2 -0.06
(0.13)
-0.46
Total Effects of ETA on ETA
Y1 Y2
-------- --------
Y1 - - - -
Y2 -0.08 - -
(0.17)
-0.46
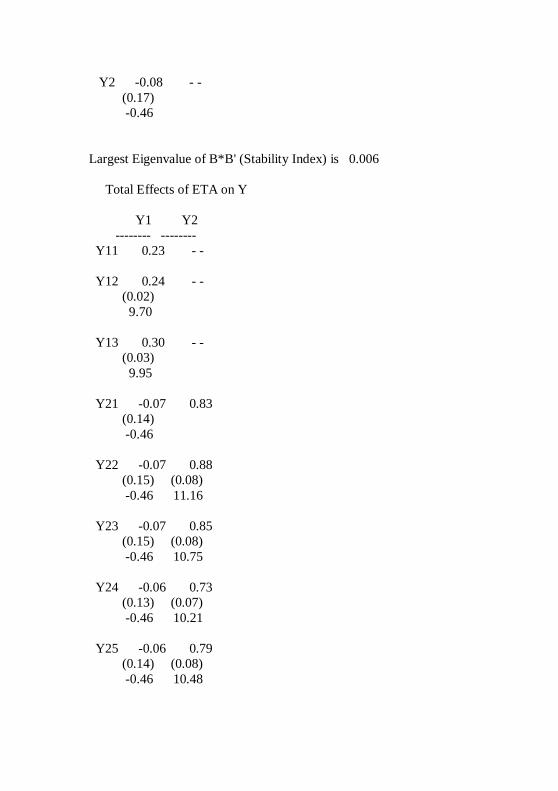
Largest Eigenvalue of B*B' (Stability Index) is 0.006
Total Effects of ETA on Y
Y1 Y2
-------- --------
Y11 0.23 - -
Y12 0.24 - -
(0.02)
9.70
Y13 0.30 - -
(0.03)
9.95
Y21 -0.07 0.83
(0.14)
-0.46
Y22 -0.07 0.88
(0.15) (0.08)
-0.46 11.16
Y23 -0.07 0.85
(0.15) (0.08)
-0.46 10.75
Y24 -0.06 0.73
(0.13) (0.07)
-0.46 10.21
Y25 -0.06 0.79
(0.14) (0.08)
-0.46 10.48
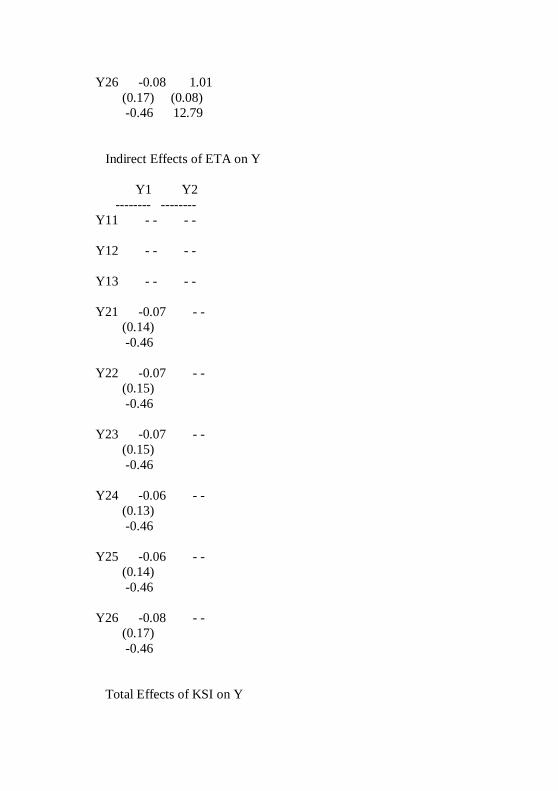
Y26 -0.08 1.01
(0.17) (0.08)
-0.46 12.79
Indirect Effects of ETA on Y
Y1 Y2
-------- --------
Y11 - - - -
Y12 - - - -
Y13 - - - -
Y21 -0.07 - -
(0.14)
-0.46
Y22 -0.07 - -
(0.15)
-0.46
Y23 -0.07 - -
(0.15)
-0.46
Y24 -0.06 - -
(0.13)
-0.46
Y25 -0.06 - -
(0.14)
-0.46
Y26 -0.08 - -
(0.17)
-0.46
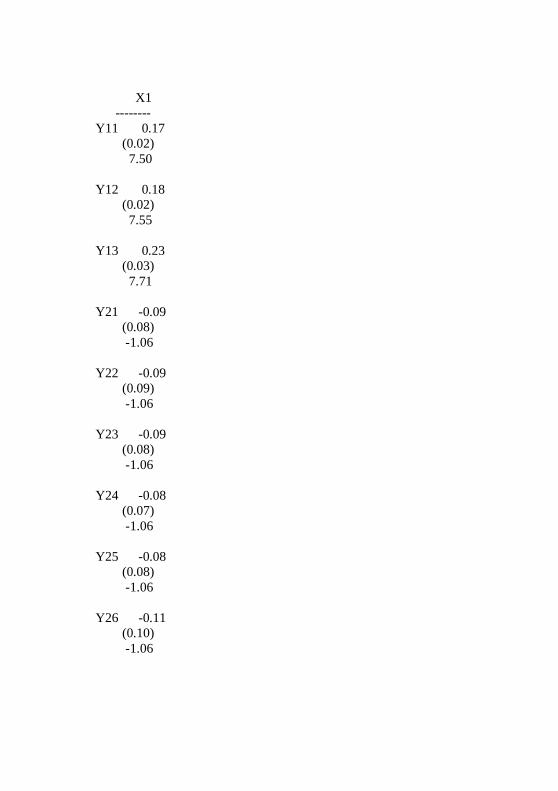
Total Effects of KSI on Y
X1
--------
Y11 0.17
(0.02)
7.50
Y12 0.18
(0.02)
7.55
Y13 0.23
(0.03)
7.71
Y21 -0.09
(0.08)
-1.06
Y22 -0.09
(0.09)
-1.06
Y23 -0.09
(0.08)
-1.06
Y24 -0.08
(0.07)
-1.06
Y25 -0.08
(0.08)
-1.06
Y26 -0.11
(0.10)
-1.06
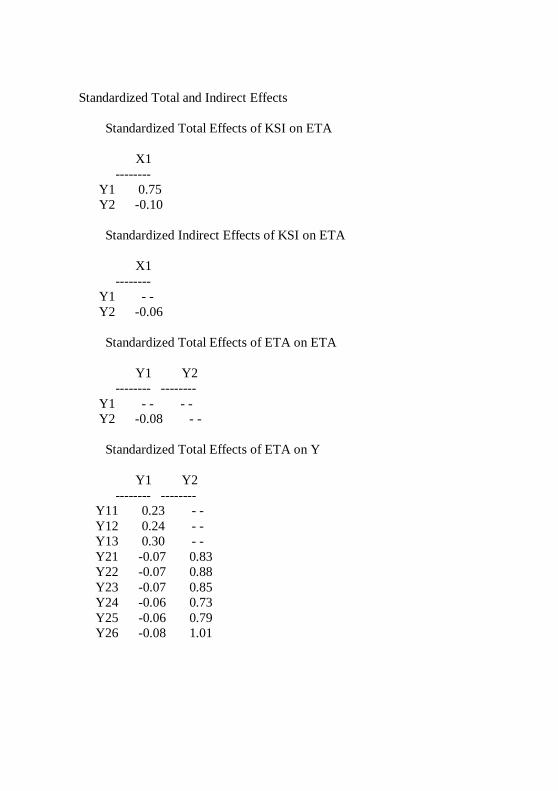
Standardized Total and Indirect Effects
Standardized Total Effects of KSI on ETA
X1
--------
Y1 0.75
Y2 -0.10
Standardized Indirect Effects of KSI on ETA
X1
--------
Y1 - -
Y2 -0.06
Standardized Total Effects of ETA on ETA
Y1 Y2
-------- --------
Y1 - - - -
Y2 -0.08 - -
Standardized Total Effects of ETA on Y
Y1 Y2
-------- --------
Y11 0.23 - -
Y12 0.24 - -
Y13 0.30 - -
Y21 -0.07 0.83
Y22 -0.07 0.88
Y23 -0.07 0.85
Y24 -0.06 0.73
Y25 -0.06 0.79
Y26 -0.08 1.01
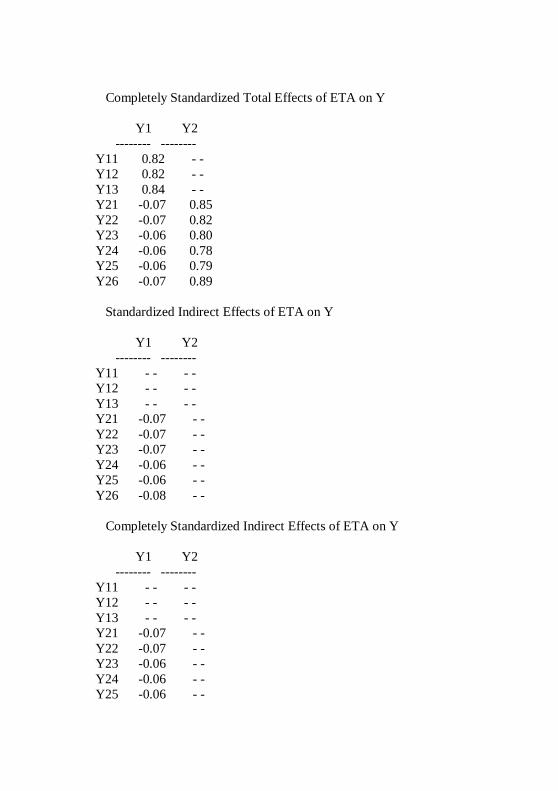
Completely Standardized Total Effects of ETA on Y
Y1 Y2
-------- --------
Y11 0.82 - -
Y12 0.82 - -
Y13 0.84 - -
Y21 -0.07 0.85
Y22 -0.07 0.82
Y23 -0.06 0.80
Y24 -0.06 0.78
Y25 -0.06 0.79
Y26 -0.07 0.89
Standardized Indirect Effects of ETA on Y
Y1 Y2
-------- --------
Y11 - - - -
Y12 - - - -
Y13 - - - -
Y21 -0.07 - -
Y22 -0.07 - -
Y23 -0.07 - -
Y24 -0.06 - -
Y25 -0.06 - -
Y26 -0.08 - -
Completely Standardized Indirect Effects of ETA on Y
Y1 Y2
-------- --------
Y11 - - - -
Y12 - - - -
Y13 - - - -
Y21 -0.07 - -
Y22 -0.07 - -
Y23 -0.06 - -
Y24 -0.06 - -
Y25 -0.06 - -
Y26 -0.07 - -
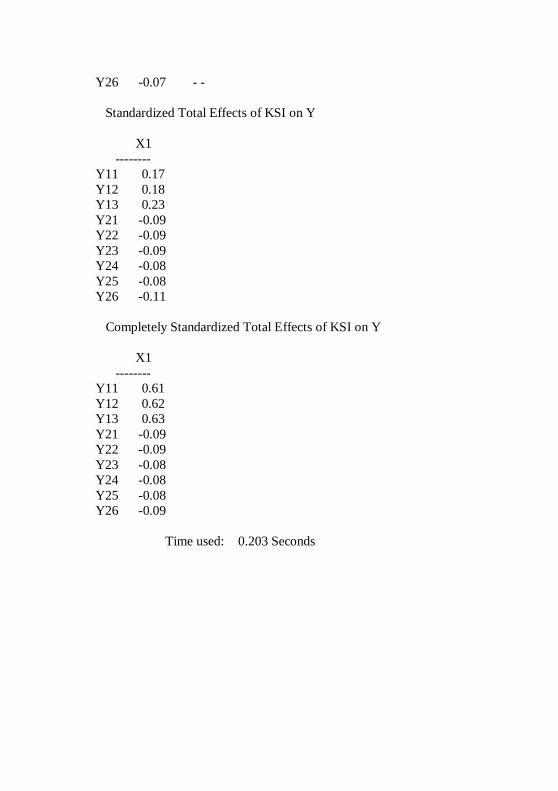
Standardized Total Effects of KSI on Y
X1
--------
Y11 0.17
Y12 0.18
Y13 0.23
Y21 -0.09
Y22 -0.09
Y23 -0.09
Y24 -0.08
Y25 -0.08
Y26 -0.11
Completely Standardized Total Effects of KSI on Y
X1
--------
Y11 0.61
Y12 0.62
Y13 0.63
Y21 -0.09
Y22 -0.09
Y23 -0.08
Y24 -0.08
Y25 -0.08
Y26 -0.09
Time used: 0.203 Seconds
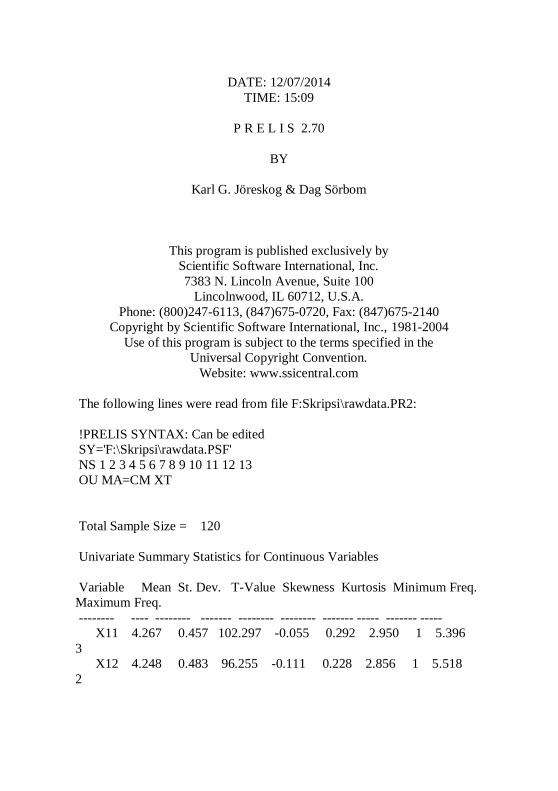
DATE: 12/07/2014
TIME: 15:09
P R E L I S 2.70
BY
Karl G. Jöreskog & Dag Sörbom
This program is published exclusively by
Scientific Software International, Inc.
7383 N. Lincoln Avenue, Suite 100
Lincolnwood, IL 60712, U.S.A.
Phone: (800)247-6113, (847)675-0720, Fax: (847)675-2140
Copyright by Scientific Software International, Inc., 1981-2004
Use of this program is subject to the terms specified in the
Universal Copyright Convention.
Website: www.ssicentral.com
The following lines were read from file F:Skripsi\rawdata.PR2:
!PRELIS SYNTAX: Can be edited
SY='F:\Skripsi\rawdata.PSF'
NS 1 2 3 4 5 6 7 8 9 10 11 12 13
OU MA=CM XT
Total Sample Size = 120
Univariate Summary Statistics for Continuous Variables
Variable Mean St. Dev. T-Value Skewness Kurtosis Minimum Freq.
Maximum Freq.
-------- ---- -------- ------- -------- -------- ------- ----- ------- -----
X11 4.267 0.457 102.297 -0.055 0.292 2.950 1 5.396
3
X12 4.248 0.483 96.255 -0.111 0.228 2.856 1 5.518
2

X13 4.235 0.502 92.349 -0.119 0.219 2.792 1 5.552
2
X14 4.229 0.533 86.899 -0.067 0.272 2.699 1 5.541
3
Y11 4.268 0.278 168.148 0.087 0.118 3.478 1 5.058
1
Y12 4.262 0.288 162.249 0.065 0.028 3.521 2 5.003
2
Y13 4.327 0.360 131.589 -0.008 0.011 3.320 1 5.190
3
Y21 3.542 0.978 39.675 -0.024 -0.835 1.987 20 5.043
22
Y22 3.567 1.075 36.352 -0.046 -1.106 1.987 25 5.048
29
Y23 3.492 1.053 36.318 -0.004 -1.045 1.947 25 5.011
26
Y24 3.550 0.942 41.262 -0.027 -0.730 1.996 18 5.048
20
Y25 3.517 1.004 38.368 -0.020 -0.907 1.946 21 5.009
24
Y26 3.567 1.136 34.405 -0.085 -1.254 1.936 27 5.007
35
Test of Univariate Normality for Continuous Variables
Skewness Kurtosis Skewness and Kurtosis
Variable Z-Score P-Value Z-Score P-Value Chi-Square P-Value
X11 -0.256 0.798 0.801 0.423 12.707 0.002
X12 -0.516 0.606 0.676 0.499 11.723 0.006
X13 -0.555 0.579 0.657 0.511 8.740 0.021
X14 -0.311 0.755 0.763 0.446 9.679 0.012
Y11 0.404 0.686 0.445 0.656 6.361 0.035
Y12 0.304 0.761 0.242 0.809 10.151 0.027
Y13 -0.037 0.971 0.204 0.839 10.043 0.019
Y21 -0.111 0.912 -3.038 0.002 9.241 0.010
Y22 -0.212 0.832 -5.380 0.000 28.992 0.000
Y23 -0.021 0.983 -4.715 0.000 22.230 0.000
Y24 -0.126 0.899 -2.417 0.016 12.858 0.033
Y25 -0.093 0.926 -3.536 0.000 12.511 0.002
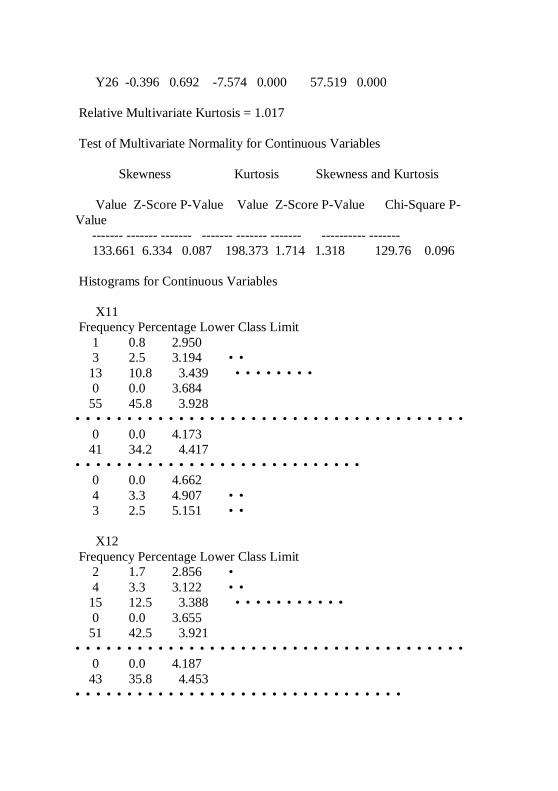
Y26 -0.396 0.692 -7.574 0.000 57.519 0.000
Relative Multivariate Kurtosis = 1.017
Test of Multivariate Normality for Continuous Variables
Skewness Kurtosis Skewness and Kurtosis
Value Z-Score P-Value Value Z-Score P-Value Chi-Square P-
Value
------- ------- ------- ------- ------- ------- ---------- -------
133.661 6.334 0.087 198.373 1.714 1.318 129.76 0.096
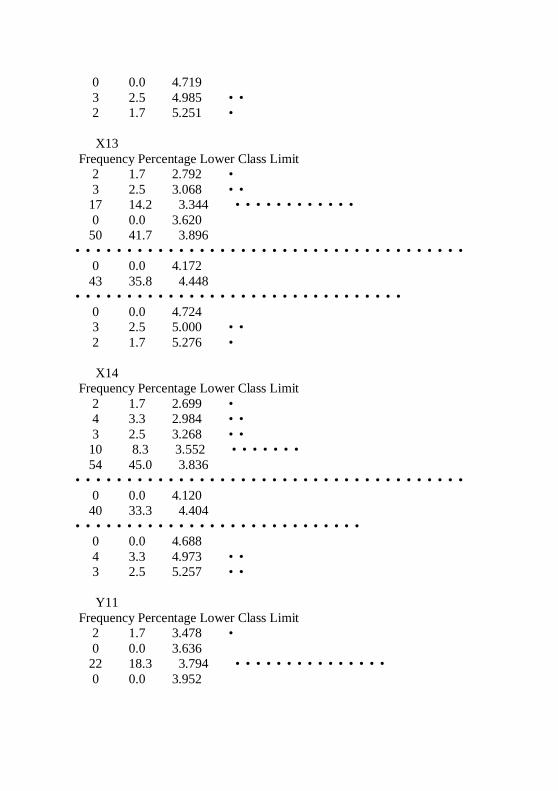
Histograms for Continuous Variables
X11
Frequency Percentage Lower Class Limit
1 0.8 2.950
3 2.5 3.194 ••
13 10.8 3.439 ••••••••
0 0.0 3.684
55 45.8 3.928
••••••••••••••••••••••••••••••••••••••
0 0.0 4.173
41 34.2 4.417
••••••••••••••••••••••••••••
0 0.0 4.662
4 3.3 4.907 ••
3 2.5 5.151 ••
X12
Frequency Percentage Lower Class Limit
2 1.7 2.856 •
4 3.3 3.122 ••
15 12.5 3.388 •••••••••••
0 0.0 3.655
51 42.5 3.921
••••••••••••••••••••••••••••••••••••••
0 0.0 4.187
43 35.8 4.453
••••••••••••••••••••••••••••••••
0 0.0 4.719
3 2.5 4.985 ••
2 1.7 5.251 •
X13
Frequency Percentage Lower Class Limit
2 1.7 2.792 •
3 2.5 3.068 ••
17 14.2 3.344 ••••••••••••
0 0.0 3.620
50 41.7 3.896
••••••••••••••••••••••••••••••••••••••
0 0.0 4.172
43 35.8 4.448
••••••••••••••••••••••••••••••••
0 0.0 4.724
3 2.5 5.000 ••
2 1.7 5.276 •
X14
Frequency Percentage Lower Class Limit
2 1.7 2.699 •
4 3.3 2.984 ••
3 2.5 3.268 ••
10 8.3 3.552 •••••••
54 45.0 3.836
••••••••••••••••••••••••••••••••••••••
0 0.0 4.120
40 33.3 4.404
••••••••••••••••••••••••••••
0 0.0 4.688
4 3.3 4.973 ••
3 2.5 5.257 ••
Y11
Frequency Percentage Lower Class Limit
2 1.7 3.478 •
0 0.0 3.636
22 18.3 3.794 •••••••••••••••
0 0.0 3.952
53 44.2 4.110
••••••••••••••••••••••••••••••••••••••
0 0.0 4.268
25 20.8 4.426 •••••••••••••••••
14 11.7 4.584 ••••••••••
3 2.5 4.742 ••
1 0.8 4.900
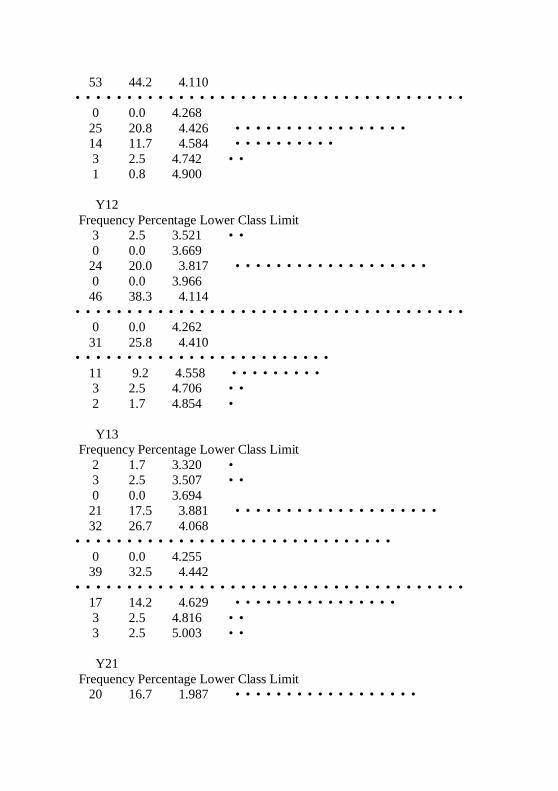
Y12
Frequency Percentage Lower Class Limit
3 2.5 3.521 ••
0 0.0 3.669
24 20.0 3.817 •••••••••••••••••••
0 0.0 3.966
46 38.3 4.114
••••••••••••••••••••••••••••••••••••••
0 0.0 4.262
31 25.8 4.410
•••••••••••••••••••••••••
11 9.2 4.558 •••••••••
3 2.5 4.706 ••
2 1.7 4.854 •
Y13
Frequency Percentage Lower Class Limit
2 1.7 3.320 •
3 2.5 3.507 ••
0 0.0 3.694
21 17.5 3.881 ••••••••••••••••••••
32 26.7 4.068
•••••••••••••••••••••••••••••••
0 0.0 4.255
39 32.5 4.442
••••••••••••••••••••••••••••••••••••••
17 14.2 4.629 ••••••••••••••••
3 2.5 4.816 ••
3 2.5 5.003 ••
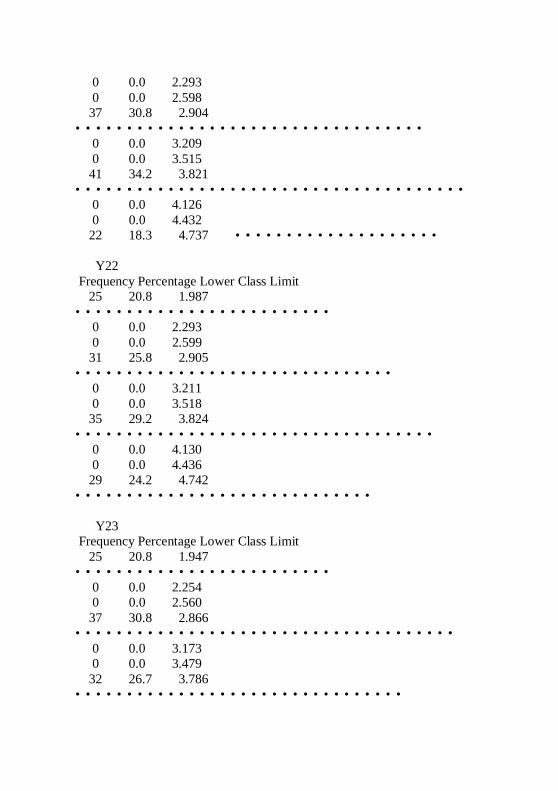
Y21
Frequency Percentage Lower Class Limit
20 16.7 1.987 ••••••••••••••••••
0 0.0 2.293
0 0.0 2.598
37 30.8 2.904
••••••••••••••••••••••••••••••••••
0 0.0 3.209
0 0.0 3.515
41 34.2 3.821
••••••••••••••••••••••••••••••••••••••
0 0.0 4.126
0 0.0 4.432
22 18.3 4.737 ••••••••••••••••••••
Y22
Frequency Percentage Lower Class Limit
25 20.8 1.987
•••••••••••••••••••••••••
0 0.0 2.293
0 0.0 2.599
31 25.8 2.905
•••••••••••••••••••••••••••••••
0 0.0 3.211
0 0.0 3.518
35 29.2 3.824
•••••••••••••••••••••••••••••••••••
0 0.0 4.130
0 0.0 4.436
29 24.2 4.742
•••••••••••••••••••••••••••••
Y23
Frequency Percentage Lower Class Limit
25 20.8 1.947
•••••••••••••••••••••••••
0 0.0 2.254
0 0.0 2.560
37 30.8 2.866
•••••••••••••••••••••••••••••••••••••
0 0.0 3.173
0 0.0 3.479
32 26.7 3.786
••••••••••••••••••••••••••••••••
0 0.0 4.092
0 0.0 4.398
26 21.7 4.705
••••••••••••••••••••••••••
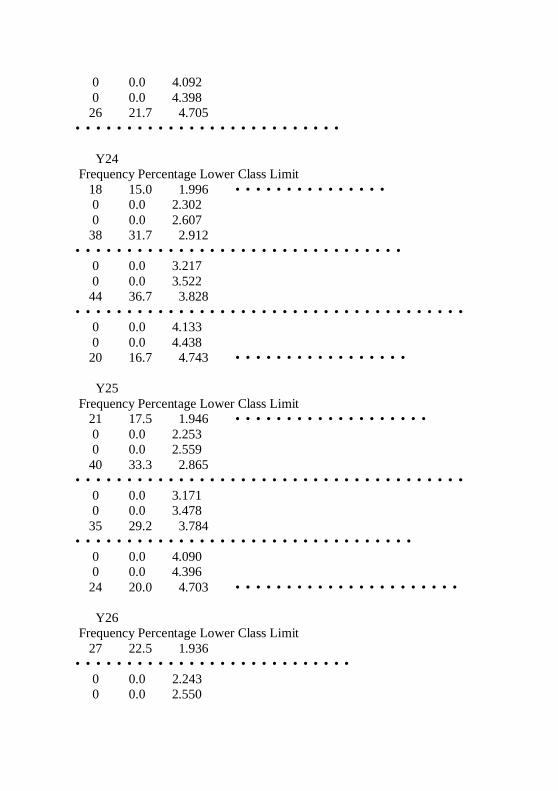
Y24
Frequency Percentage Lower Class Limit
18 15.0 1.996 •••••••••••••••
0 0.0 2.302
0 0.0 2.607
38 31.7 2.912
••••••••••••••••••••••••••••••••
0 0.0 3.217
0 0.0 3.522
44 36.7 3.828
••••••••••••••••••••••••••••••••••••••
0 0.0 4.133
0 0.0 4.438
20 16.7 4.743 •••••••••••••••••
Y25
Frequency Percentage Lower Class Limit
21 17.5 1.946 •••••••••••••••••••
0 0.0 2.253
0 0.0 2.559
40 33.3 2.865
••••••••••••••••••••••••••••••••••••••
0 0.0 3.171
0 0.0 3.478
35 29.2 3.784
•••••••••••••••••••••••••••••••••
0 0.0 4.090
0 0.0 4.396
24 20.0 4.703 ••••••••••••••••••••••
Y26
Frequency Percentage Lower Class Limit
27 22.5 1.936
•••••••••••••••••••••••••••
0 0.0 2.243
0 0.0 2.550
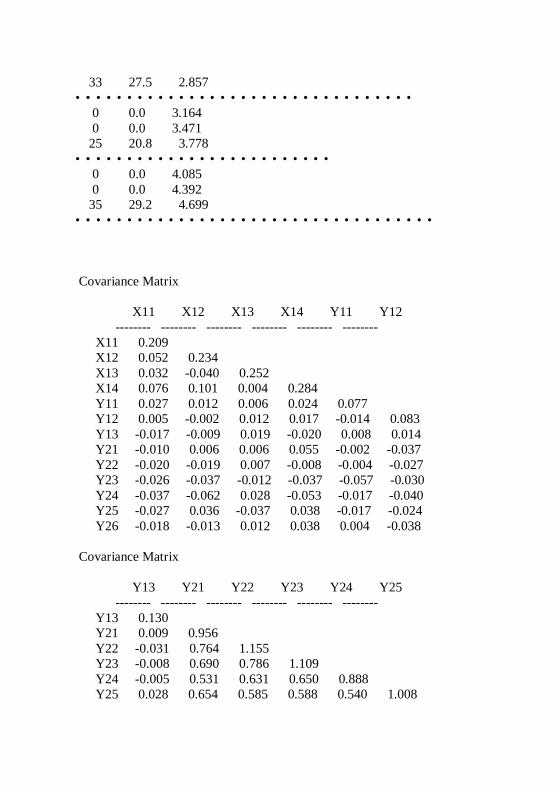
33 27.5 2.857
•••••••••••••••••••••••••••••••••
0 0.0 3.164
0 0.0 3.471
25 20.8 3.778
•••••••••••••••••••••••••
0 0.0 4.085
0 0.0 4.392
35 29.2 4.699
•••••••••••••••••••••••••••••••••••
Covariance Matrix
X11 X12 X13 X14 Y11 Y12
-------- -------- -------- -------- -------- --------
X11 0.209
X12 0.052 0.234
X13 0.032 -0.040 0.252
X14 0.076 0.101 0.004 0.284
Y11 0.027 0.012 0.006 0.024 0.077
Y12 0.005 -0.002 0.012 0.017 -0.014 0.083
Y13 -0.017 -0.009 0.019 -0.020 0.008 0.014
Y21 -0.010 0.006 0.006 0.055 -0.002 -0.037
Y22 -0.020 -0.019 0.007 -0.008 -0.004 -0.027
Y23 -0.026 -0.037 -0.012 -0.037 -0.057 -0.030
Y24 -0.037 -0.062 0.028 -0.053 -0.017 -0.040
Y25 -0.027 0.036 -0.037 0.038 -0.017 -0.024
Y26 -0.018 -0.013 0.012 0.038 0.004 -0.038
Covariance Matrix
Y13 Y21 Y22 Y23 Y24 Y25
-------- -------- -------- -------- -------- --------
Y13 0.130
Y21 0.009 0.956
Y22 -0.031 0.764 1.155
Y23 -0.008 0.690 0.786 1.109
Y24 -0.005 0.531 0.631 0.650 0.888
Y25 0.028 0.654 0.585 0.588 0.540 1.008
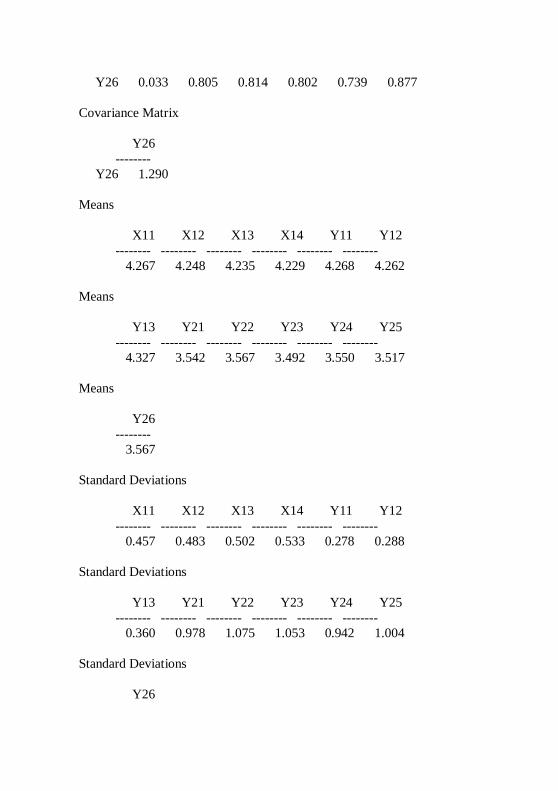
Y26 0.033 0.805 0.814 0.802 0.739 0.877
Covariance Matrix
Y26
--------
Y26 1.290
Means
X11 X12 X13 X14 Y11 Y12
-------- -------- -------- -------- -------- --------
4.267 4.248 4.235 4.229 4.268 4.262
Means
Y13 Y21 Y22 Y23 Y24 Y25
-------- -------- -------- -------- -------- --------
4.327 3.542 3.567 3.492 3.550 3.517
Means
Y26
--------
3.567
Standard Deviations
X11 X12 X13 X14 Y11 Y12
-------- -------- -------- -------- -------- --------
0.457 0.483 0.502 0.533 0.278 0.288
Standard Deviations
Y13 Y21 Y22 Y23 Y24 Y25
-------- -------- -------- -------- -------- --------
0.360 0.978 1.075 1.053 0.942 1.004
Standard Deviations
Y26
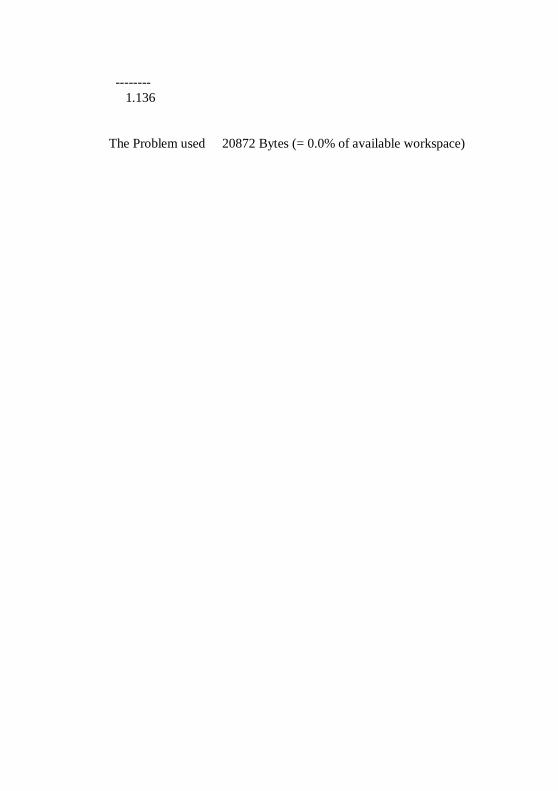
--------
1.136
The Problem used 20872 Bytes (= 0.0% of available workspace)
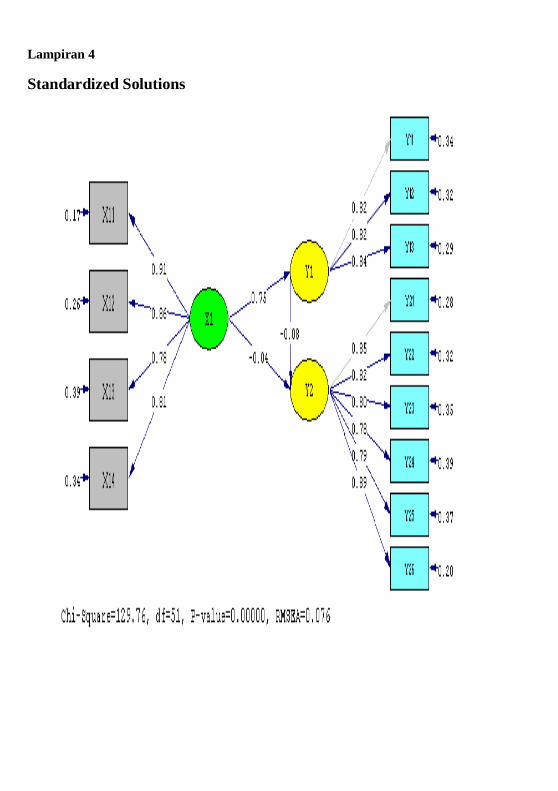
Lampiran 4
Standardized Solutions
T-Value
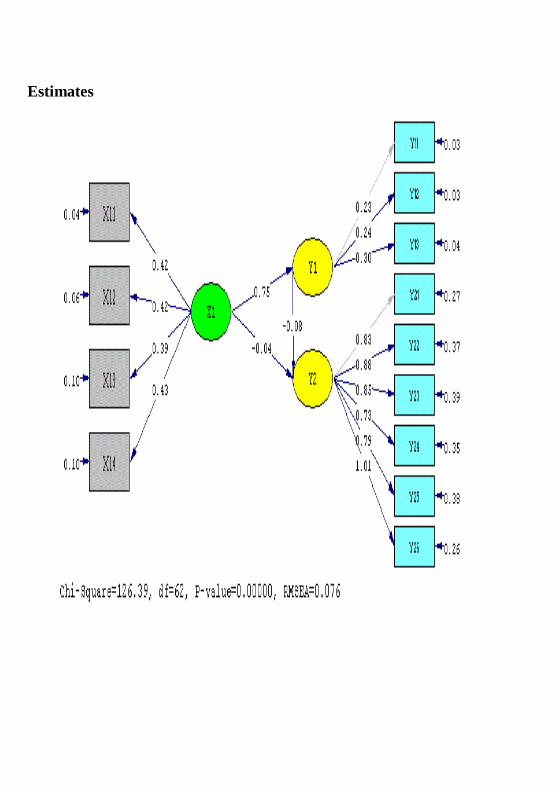
Estimates
PENGARUH BUDAYA ORGANISASI TERHADAP KOMITMEN ORGANISASIONAL,
DAN KINERJA PADA KARYAWAN PT. KARATU ABADI JAYA SURABAYA
ARDRIAN KURNIA L.G
ABSTRACT
The commitment of the organization is the attitude of employees to stay on because the organization to believe
, involvement and loyalty in the organization .Commitment affect the performance of employees , because from
commitment will grow a good performance from an employee.
This study was conducted to examine the effect of organizational culture to commitment organizational and job
performance. The number of respondents used were 120 employees of PT Karatu Abadi Jaya Surabaya. Data collection
method used was a questionnaire that is primary. Each statement of the questionnaire measured through a Likert Scale
with intervals of one to five. The analytical tool used is structure equation modelling analysis.
The results of this study indicate that the organizational culture significant positive effect on commitment
organizational, organizational culture significant positive effects on employee performance, and commitment
organizational significant positive effects on employee performance.
Keywords: organizational culture, commitment organizational, employee performance
PENDAHULUAN
PT Karatu Abadi Jaya adalah perusahaan yang bergerak dalam industri alas kaki, produk yang dihasilkan
berupa sepatu kulit anak-anak dan sandal dewasa dengan berbagai model dan merek sesuai pesanan konsumen. Salah
satu tujuan perusahaan adalah menjalankan usaha dan menghasilkan laba dari hasil pembuatan sepatu dan sandal yang
berkualitas untuk memberikan kepuasan bagi pelanggan. Untuk mencapai tujuan tersebut setiap bagian didalam PT.
Karatu Abadi Jaya harus memberikan kontribusi dengan kinerja yang baik.
Untuk meningkatkan kinerja karyawan, bagian HRD (human resources development)perlu memperhatikan
budaya organisasi dan komitmen karyawan guna menciptakan iklim kerja yang nyaman bagi karyawan. PT. Karatu
abadi jaya memiliki nilai-nilai organisasi yang kuat hal ini ditunjukkan dengan adanya budaya kerja yang dimiliki oleh
perusahaan berupa 5 budaya kerja yang meliputi nilai-nilai : jujur, disiplin, tanggung jawab, bersih rapi dan semangat.
Kinerja karyawan merupakan salah satu hal penting dalam sebuah organisasi, karena bila kinerja karyawan
tidak baik akan berdampak pekerjaan tidak dapat diselesaikan tepat waktu, pekerjaan menjadi tidak terencana dan tak
terarah. Sebaliknya karyawan yang memiliki kinerja yang tinggi dan baik, dapat menunjang tercapainya tujuan dan
sasaran yang telah diterapkan oleh organisasi.
Komitmen organisasi merupakan sikap karyawan untuk tetap bertahan pada organisasi karena timbulnya rasa
percaya, adanya keterlibatan dan loyalitas pada organisasi tersebut. Karyawan yang memiliki komitmen terhadap
organisasi akan menunjukkan perilaku dan sikap yang positif terhadap lembaganya, dan karyawan akan memiliki jiwa
untuk tetap membela organisasinya dengan berusaha meningkatkan prestasi, serta memiliki keyakinan pasti untuk
membantu mewujudkan tujuan organisasi. (Wexley & Yulk ;1977 dalam Arifin; 2010).
Dalam mewujudkan tujuan organisasi, budaya organisasi menjadi faktor yang penting dalam perusahaan.
Budaya organisasi adalah pola keyakinan dan nilai-nilai yang dipahami dan dijiwai oleh anggota organisasi sehingga
pola tersebut memberikan makna bagi anggota sebuah organisasi dan menjadikan dasar aturan dan pedoman berperilaku
di dalam organisasi. Berdasarkan uraian diatas maka penulis tertarik untuk melakukan penelitian dengan mengambil
judul “Pengaruh Budaya Organisasi Terhadap Komitmen Organisasional, dan Kinerja Pada Karyawan PT Karatu Abadi
Jaya Surabaya”.
TUJUAN PENELITIAN
Sesuai dengan perumusan masalah yang telah dirumuskan, tujuan penelitian yang ingin dicapai adalah untuk
mengetahui:
1. Pengaruh Budaya Organisasi terhadap Komitmen Organisasi pada karyawan PT. Karatu Abadi Jaya Surabaya.
2. Pengaruh Budaya Organisasi terhadap Kinerja pada karyawan PT. Karatu Abadi Jaya Surabaya.
3. Pengaruh Komitmen Organisasi terhadap Kinerja pada karyawan PT. Karatu Abadi Jaya Surabaya.
TINJAUAN PUSTAKA
Penelitian ini mereplikasi penelitian yang dilakukan oleh Enny Widyaningrum (2012). Tujuan dari penelitian
ini adalah untuk mengetahui pengaruh budaya organisasi terhadap komitmen organisasi, pengaruh budaya organisasi
terhadap kinerja pada karyawan, dan pengaruh komitmen organisasi terhadap kinerja pada karyawan. Hasil penelitian
menunjukkan terdapat pengaruh positif dan signifikan pada 3 hipotesis tersebut.
Budaya Organisasi
Menurut (Davis, dalam Moeljono 2005), budaya adalah keyakinan dan nilai – nilai yang dipahami dan dijiwai
oleh anggota organisasi sehingga pola tersebut memberikan makna tersendiri bagi organisasi bersangkutan dan menjadi
dasar aturan berperilaku dalam organisasi. Menurut Kreitner dan Kinicki (2007), budaya organisasi adalah nilai dan
keyakinan bersama yang mendasari identitas perusahaan.
Komitmen Organisasional
Menurut (Meyer & Allen, dalam Jarros 2007) mendefinisikan komitmen organisasi sebagai perwujudan
psikologis yang mengkarakteristikkan hubungan pekerja dengan organisasi dan memiliki implikasi terhadap keputusan
untuk melanjutkan atau tidak melanjutkan keanggotannya dalam organisasi. Mathis dan Jackson (2006:122)
mengatakan bahwa komitmen organisasional adalah tingkat sampai dimana karyawan yakin dan menerima tujuan
organisasional, serta berkeinginan untuk tinggal bersama organisasi.
Kinerja Karyawan
Menurut Mathis dan Jackson (2011) kinerja karyawan adalah seberapa banyak mereka memberikan kontribusi
kepada organisasi. Hasibuan, (2006:67) mendefinisikan kinerja sebagai suatu hasil kerja yang dicapai seorang karyawan
dalam melaksanakan tugas-tugas yang dibebankan kepadanya yang didasarkan atas kecakapan, pengalaman dan
kesungguhan serta waktu.
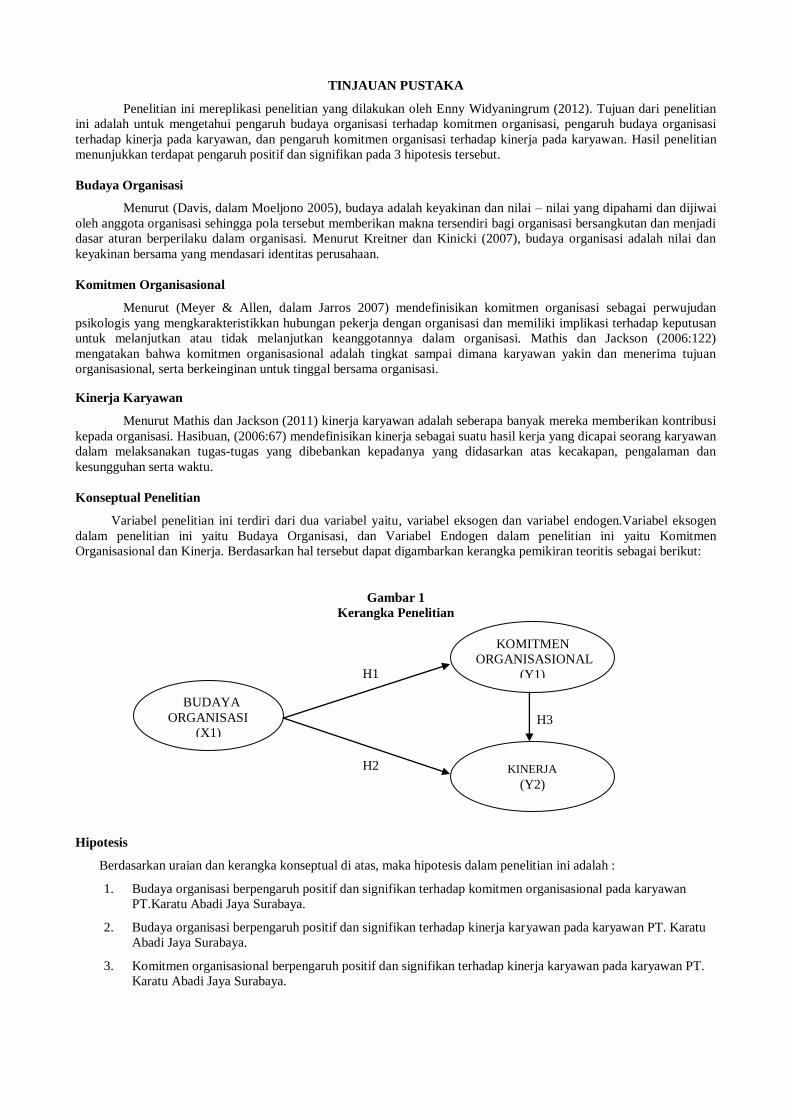
Konseptual Penelitian
Variabel penelitian ini terdiri dari dua variabel yaitu, variabel eksogen dan variabel endogen.Variabel eksogen
dalam penelitian ini yaitu Budaya Organisasi, dan Variabel Endogen dalam penelitian ini yaitu Komitmen
Organisasional dan Kinerja. Berdasarkan hal tersebut dapat digambarkan kerangka pemikiran teoritis sebagai berikut:
Gambar 1
Kerangka Penelitian
H1
H3
H2
Hipotesis
Berdasarkan uraian dan kerangka konseptual di atas, maka hipotesis dalam penelitian ini adalah :
1. Budaya organisasi berpengaruh positif dan signifikan terhadap komitmen organisasional pada karyawan
PT.Karatu Abadi Jaya Surabaya.
2. Budaya organisasi berpengaruh positif dan signifikan terhadap kinerja karyawan pada karyawan PT. Karatu
Abadi Jaya Surabaya.
3. Komitmen organisasional berpengaruh positif dan signifikan terhadap kinerja karyawan pada karyawan PT.
Karatu Abadi Jaya Surabaya.
BUDAYA
ORGANISASI
(X1)
KINERJA
(Y2)
KOMITMEN
ORGANISASIONAL
(Y1)
METODE PENELITIAN
Desain penelitian
Penelitian ini bertujuan menguji hipotesis pengaruh antar variabel. Jenis penelitian ini yaitu deskriptif
kuantitatif dan penelitian survei yaitu peneliti mengajukan pertanyaan kepada subjek dan mengumpulkan jawaban
secara personal melalui kuisioner. Dalam penelitian ini, pengaruh yang diteliti meliputi budaya organisasi terhadap
komitmen organisasi dan kinerja karyawan.
Identifikasi variabel
Variabel yang digunakan dalam penelitian ini yaitu: Variabel Eksogen, meliputi budaya organisasi (X1) dan
Variabel Endogen, yaitu komitmen organisasional (Y1) dan kinerja karyawan (Y2).
Jenis dan sumber data
Penelitian ini menggunakan data primer yaitu data yang dikumpulkan sendiri oleh perseorangan atau langsung
melalui obyeknya. Pengumpulan data ini dilakukan dengan membagikan kuesioner kepada obyek penelitian dan diisi
secara langsung oleh responden yang merupakan karyawan PT Karatu Abadi Jaya Surabaya.
Teknik Sampling
Di dalam penelitian ini penulis mengambil sampel yang ditetapkan pada teknik purposive sampling yaitu seluruh
karyawan yang telah bekerja lebih dari 1 tahun, dengan jumlah 120 sampel.
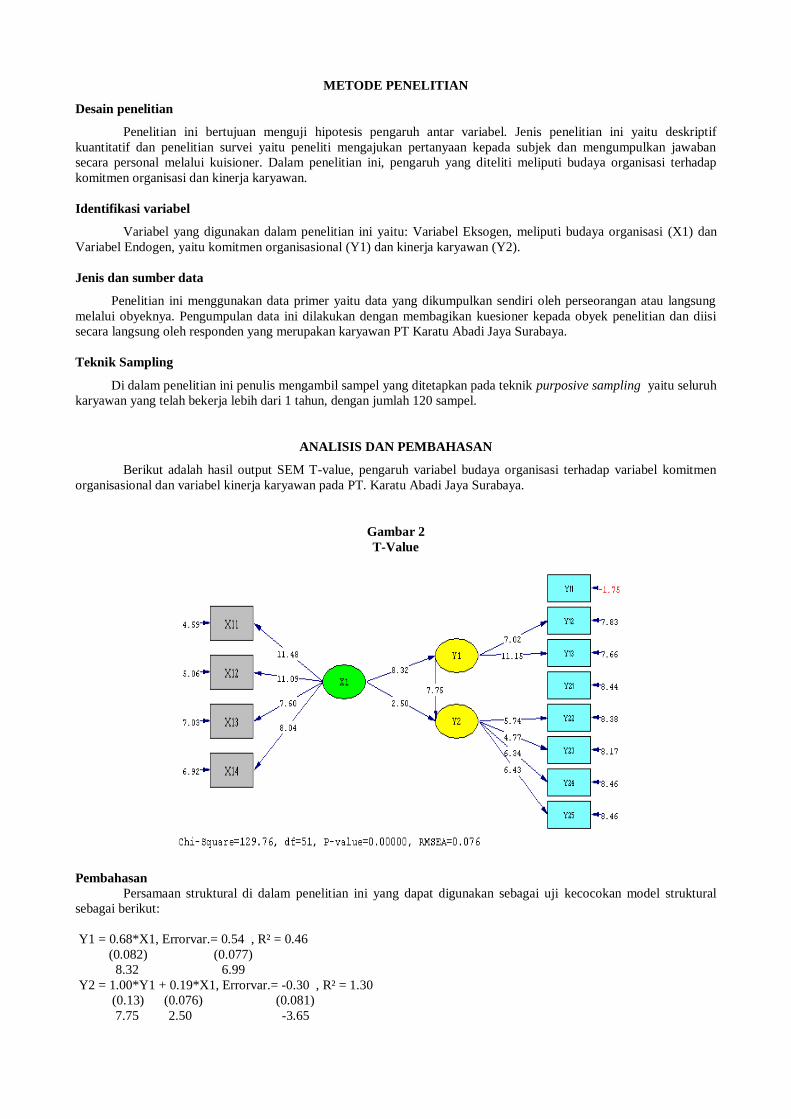
ANALISIS DAN PEMBAHASAN
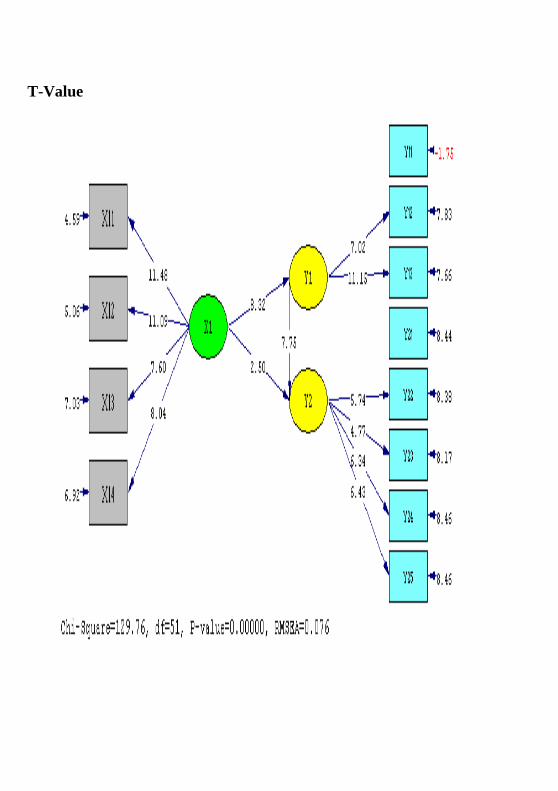
Berikut adalah hasil output SEM T-value, pengaruh variabel budaya organisasi terhadap variabel komitmen
organisasional dan variabel kinerja karyawan pada PT. Karatu Abadi Jaya Surabaya.
Gambar 2
T-Value
Pembahasan
Persamaan struktural di dalam penelitian ini yang dapat digunakan sebagai uji kecocokan model struktural
sebagai berikut:
Y1 = 0.68*X1, Errorvar.= 0.54 , R² = 0.46
(0.082) (0.077)
8.32 6.99
Y2 = 1.00*Y1 + 0.19*X1, Errorvar.= -0.30 , R² = 1.30
(0.13) (0.076) (0.081)
7.75 2.50 -3.65
Pengujian Hipotesis
Dalam pengujian hipotesis dilakukan pengujian terhadap koefisien-koefisien persamaan struktural dengan
menspesifikasikan tingkat signifikan tertentu. Dalam penelitian ini digunakan α = 0,05, sehingga t-value dari persamaan
struktural harus ≤ -1,96 atau ≥ 1,96.
Tabel 1
Pengujian Hipotesis
Hipotesis Path Nilai – t Keterangan
H1 X1 Y1 8.32 Signifikan
H2 X1 Y2 2.50 Signifikan
H3 Y1 Y2 7.75 Signifikan
Pembahasan
Hipotesis penelitian (H1) memiliki nilai t-value sebesar 8.32 (1,96 ≥ t-value). Hasil uji t menyatakan bahwa
hubungan antara variabel Budaya Organisasi dengan Komitmen Organisasional terbukti signifikan. Hasil ini sesuai
dengan penelitian sebelumnya yang menyatakan bahwa Budaya Organisasi adalah satu faktor yang mempengaruhi
hubungan terhadap Komitmen Organisasional, (Sully, 2008). Budaya Organisasi terutama pada perusahaan sekelas PT
Karatu Abadi Jaya memiliki kontribusi terhadap Komitmen Organisasional karyawan perusahaan tersebut. Secara nyata
budaya organisasi yang baik akan membentuk komitmen organisasional pada suatu perusahaan dan hal ini terbukti
dalam penelitian ini.
Hipotesis penelitian (H2) memiliki nilai t-value sebesar 2.50 (1,96 ≥ t-value). Hasil uji t menyatakan bahwa
hubungan antara variabel Budaya Organisasi dengan Kinerja terbukti signifikan. Hasil ini sesuai dengan penelitian
sebelumnya yang menyatakan bahwa Budaya Organisasi adalah faktor yang mempengaruhi Kinerja karyawan
(Shahzad, 2013). Budaya Organisasi yang baik akan membentuk Kinerja karyawan, dengan kinerja yang baik, maka
perusahaan akan siap menghadapi berbagai faktor baik internal maupun eksternal, terutama demi tujuan perusahaan
dalam memenuhi kebutuhan konsumen.
Hipotesis penelitian (H3) memiliki nilai t-value sebesar 7.75 (1,96 ≥ t-value). Hasil uji t menyatakan bahwa
hubungan antara variabel Komitmen Organisasional dengan Kinerja terbukti signifikan. Hasil ini sesuai dengan
penelitian sebelumnya yang menyatakan bahwa Komitmen Organisasional berpengaruh dalam pembentukan Kinerja
(Pei-Ling, 2013). Komitmen Organisasional yang tinggi akan membuat karyawan berjuang meningkatkan Kinerja
dalam perusahaan, dengan kinerja yang baik karena pengaruh komitmen organisasional, maka karyawan akan berjuang
untuk meningkatkan kemampuannya secara individu ataupun secara organisasi. Dengan performa kinerja yang baik
pada akhirnya akan membuat perusahaan dapat memenuhi kebutuhan konsumen secara nyata.
KESIMPULAN
Berdasarkan hasil analisis dan pembahasan yang telah dilakukan pada bab sebelumnya dapat disimpulkan bahwa:
1. Budaya organisasi berpengaruh positif dan signifikan terhadap komitmen organisasional. Hal ini menunjukkan
bahwa semakin baik budaya organisasi yang dimiliki perusahaan, maka semakin tinggi pula komitmen yang
dimiliki oleh karyawan.
2. Budaya organisasi berpengaruh positif dan signifikan terhadap kinerja karyawan. Hal ini menunjukkan bahwa
semakin baik budaya organisasi yang dimiliki perusahaan, maka semakin baik pula kontribusi kinerja yang
diberikan oleh karyawan kepada perusahaan.
3. Komitmen organisasional berpengaruh positif dan signifikan terhadap kinerja karyawan. Hal ini menunjukkan
bahwa semakin tinggi komitmen yang dimiliki karyawan, maka semakin baik pula kontribusi kinerja yang
diberikan oleh karyawan kepada perusahaan.
Dengan tidak mengurangi rasa hormat, penulis juga mengucapkan terima kasih sebesar-besarnya kepada para
dosen pembimbing Bapak JB. Budi Iswanto, Ph.D dan Ibu Dra. Ec. Ani Suhartatik, MM yang telah berandil besar
dalam penyelesaian artikel ini.
REFERENSI
Arifin, Noor. 2010. Analisis Budaya Organisasional Terhadap Komitmen Kerja Karyawan Dalam Peningkatan Kinerja
Organisasional Karyawan Pada Koperasi BMT Di Kecamatan Jepara. Jurnal Ekonomi & Pendidikan, Vol. 8.
No 2. Hal 173-192
Hasibuan, Malayu S.P. 2006. Manajemen Sumber Daya Manusia. Jakarta: Bumi Aksara.
Jaros, Stephen. 2007. Meyer and Allen Model of Organizational Commitment: Measurement Issues. The Icfai Journal
of Organizational Behavior. Vol. 6, No 4, 2007. Hal 7-25.
Kreitner dan Kinicki. 2005. Perilaku Organisasi. Jakarta: Salemba empat
Moeljono, Djokosantoso 2005. Budaya Organisasi Dalam Tantangan. Jakarta: PT. Elex Media Komputindo Gramedia.
Mathis, R. L., dan Jackson, J. H., 2006, Human Resource Management, Jakarta: Salemba Empat.
Sugiyono. 1999. Metode Penelitian Bisnis. Bandung: Alfabeta
Shahzad, Fakhar. 2013. Impact of Organizational Culture on Employees Job Performance: An Empirical Study of
Software Houses in Pakistan. Journal of Bussiness Journal of Business Studies Quarterly. Vol 5, No 2. Hal 56-
64
Tsui, Pei-Ling. 2013. The Influence Of Psychological Contract And Organizational Commitment On Hospitality
Employee Performance. Journal of Social Behaviour and Personality. Vol 41. No 3. Hal 443-452
Widyaningrum, Mahmudah Enny. 2012. Effects of Organizational Culture and Ability on Organizational Commitment
and Performance in Ibnu Sina Hospital Gresik. Academic Research International. Vol 2. No 1. Hal 349-355
EFFECTS OF ORGANIZATIONAL CULTURE ON ORGANIZATIONAL
COMMITMENT AND PERFORMANCE IN PT. KARATU ABADI JAYA SURABAYA
ARDRIAN KURNIA L.G
ABSTRACT
The commitment of the organization is the attitude of employees to stay on because the organization to believe
, involvement and loyalty in the organization. Commitment affect the performance of employees, because from
commitment will grow a good performance from an employee.
This study was conducted to examine the effect of organizational culture to commitment organizational and job
performance. The number of respondents used were 120 employees of PT Karatu Abadi Jaya Surabaya. Data collection
method used was a questionnaire that is primary. Each statement of the questionnaire measured through a Likert Scale
with intervals of one to five. The analytical tool used is structure equation modelling analysis.
The results of this study indicate that the organizational culture significant positive effect on commitment
organizational, organizational culture significant positive effects on employee performance, and commitment
organizational significant positive effects on employee performance.
Keywords: organizational culture, commitment organizational, employee performance
INTRODUCTION
PT Karatu Abadi Jaya is a company engaged in the footwear industry, the resulting product in the form of
children's leather shoes and sandals adults with a variety of models and brands according to customer orders. One of the
company's goal is to run a business and make a profit from the manufacture of shoes and sandals qualified to give
satisfaction to the customers. To achieve these goals each section in PT. Karatu Abadi Jaya should contribute to good
performance.
To improve the performance of employees, the HRD (human resources development) needs to pay attention to
organizational culture and employee commitment to create a working climate which is convenient for employees. PT.
Karatu Abadi Jaya has values a strong organization this is demonstrated by the existence of a work culture that is owned
by a company in the form of a work culture that includes 5 values: honesty, discipline, responsibility, clean tidy and
passion.
Employee performance is one of the important issue in the organization as a because if employee performance
not better will have an impact could not be solved timely work is unplanned and undirected. On the contrary an
employee that has strong performance and good, will be able to support the achievement of the aims and targets which
has been implemented by the organization.
The commitment of the organization is the attitude of employees to stay on because the organization to believe
, involvement and loyalty in the organization. Employees who have a commitment to the organization will show
behavior and attitude that positive on his agency, and employees will have the soul to keep defending her organization
with trying to improve achievement , as well as having confidence must be to help realize the purpose of the
organization. (Wexley & Yulk ;1977 in Arifin; 2010).
In realizing the goals of the organization, organizational culture becomes an important factor in the company.
Culture is of many patterns organization beliefs and values that understood and imbued by of members of an
organization so that the pattern is giving purpose to a member of an organization and making basic rules and guidelines
to behave in the organization. Based on the description above the writer interested to do research by taking the title
“Influence of Organization Culture on the Commitment Organizational and Employees Performance on PT. Karatu
Abadi Jaya Surabaya.”
Research Purposes
In accordance with the formulation of the problem that has been defined, the research objectives to be achieved
is to know :
1. Influence of Organizational Culture on Organizational Commitment to employees of PT. Karatu Abadi Jaya
Surabaya.
2. Influence of Organizational Culture on the performance of employees of PT. Karatu Abadi Jaya Surabaya.
3. Influence of Organizational Commitment on the performance of employees of PT. Karatu Abadi Jaya
Surabaya.
Literature Review
This study replicates research conducted by Enny Widyaningrum (2012). The purpose of this study was to
determine the influence of organizational culture on organizational commitment, organizational culture on the
performance of the employee, and the influence of organizational commitment on the performance of the employee.
The results show there is a positive and significant effect on the third hypothesis.
Organizational Culture
According to the (Davis in moeljono 2005) culture is beliefs and values of being understood and imbued with
members of the organisation and the pattern of such an organization concerned to give meaning to the fundamental
rules and behaving in an organization. According to Kreitner Kinicki (2007), cultural organization is the values and
faith with underlying corporate identity.
Organizational Commitment
According to (Meyer and Allen in Jarros 2007) organization commitment defined as embodiment of
psychological relationship to characterize workers with the organization and have an implication on the decision to
continue or do not continue the membership in organization. Mathis and Jackson (2006: 122) states that organizational
commitment is the extent to which employees believe and accept organizational goals, as well as the desire to stay with
the organization.
Employee Performance
According to Mathis and Jackson (2011) the employee's performance is how much they contribute to the
organization. Hasibuan, (2006: 67) defines performance as a result of which achieved an employee in performing the
tasks assigned to them based on the skills, experience and sincerity as well as time.
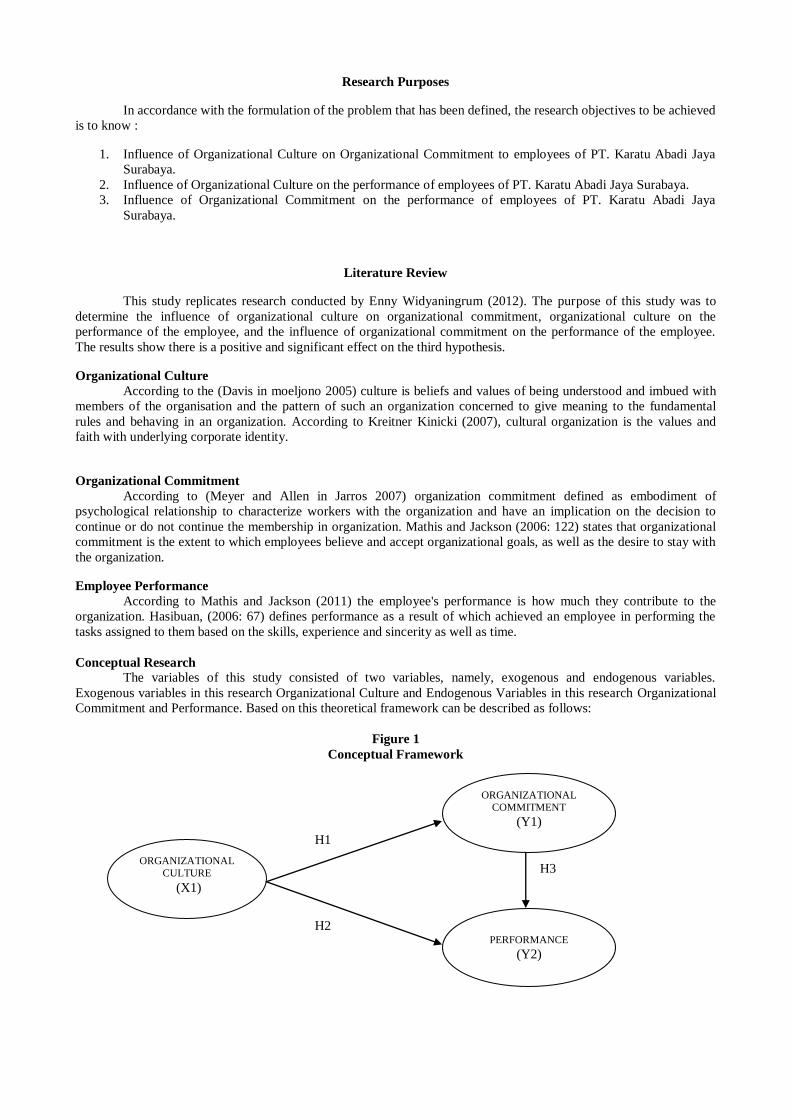
Conceptual Research
The variables of this study consisted of two variables, namely, exogenous and endogenous variables.
Exogenous variables in this research Organizational Culture and Endogenous Variables in this research Organizational
Commitment and Performance. Based on this theoretical framework can be described as follows:
Figure 1
Conceptual Framework
H1
H3
H2
ORGANIZATIONAL
CULTURE
(X1)
PERFORMANCE
(Y2)
ORGANIZATIONAL
COMMITMENT
(Y1)
Hypothesis
Based on the description and conceptual framework above, then the hypothesis in this study are:
1. Organizational culture have positive and significant effect on organizational commitment on employee at
PT.Karatu Abadi Jaya Surabaya.
2. Organizational culture have positive and significant effect on the performance of employees at PT. Karatu
Abadi Jaya Surabaya.
3. Organizational Commitment have positive and significant effect on the performance of employees at PT.
Karatu Abadi Jaya Surabaya.
RESEARCH METHODS
Design Research
This research aims to test the hypothesis of influence among variables. Type of this research is a descriptive
quantitative and survey research that researchers ask questions to the subject and collect answers personally through the
questionnaire. In this study, the influence of which examined include organizational culture organizational commitment
and performance of employees.
Identfying Variables
Variables used in this research namely: The exogen variable, covering cultural organization (X1) and
endogenous variable , namely the commitment of organizational (Y1) and employee performance (Y2).
Type and Data Sources
This study using data primary namely the data collected by individuals or direct through the object. Data
collection is done by distributing a questionnaire to the object of research and filled directly by the respondents who are
employees of PT. Karatu Abadi Jaya Surabaya.
Sampling Technique
In in this research writer take a sample set on techniques of sampling which is purposive all the employees who have
been working more than 1 year , by the number of sample 120.
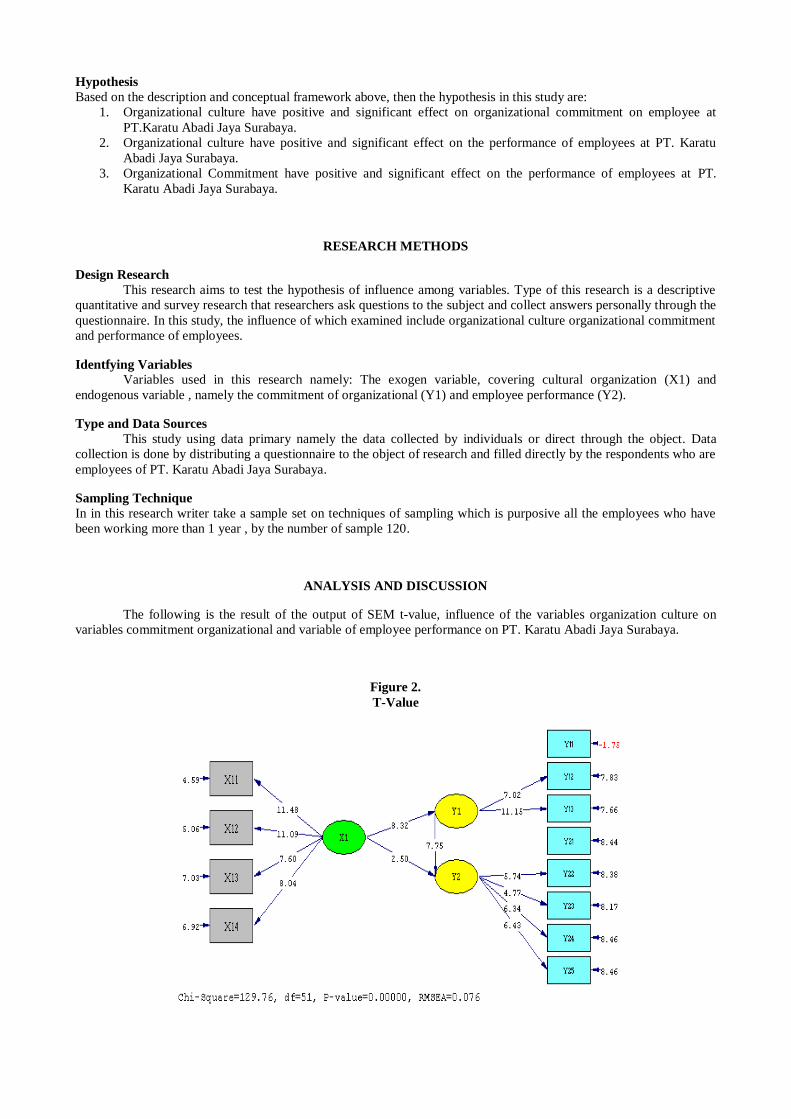
ANALYSIS AND DISCUSSION
The following is the result of the output of SEM t-value, influence of the variables organization culture on
variables commitment organizational and variable of employee performance on PT. Karatu Abadi Jaya Surabaya.
Figure 2.
T-Value
Discussion
Structural in the equation in this research that can be used as a test match structural model as follows:
Y1 = 0.68*X1, Errorvar.= 0.54 , R² = 0.46
(0.082) (0.077)
8.32 6.99
Y2 = 1.00*Y1 + 0.19*X1, Errorvar.= -0.30 , R² = 1.30
(0.13) (0.076) (0.081)
7.75 2.50 -3.65
Hypothesis Tests
Hypothesis Tests is performed by looking the value of path coefficients and p-value at 0.05 significant level. The T-value of structural equations should be ≤ -1,96 or ≥ 1,96.
Table 1.
Structural Equation Modeling of Hypothesis Tests
Hypothesis Path T-Value Note
H1 X1 Y1 8.32 Significant
H2 X1 Y2 2.50 Significant
H3 Y1 Y2 7.75 Significant
Discussion
Hypothesis 1 have T-value of 8.32 (1,96 ≥ t-value). The results of the T-value said that relations between
variables organization culture with the organizational commitment proven significant. The results of this in accordance
with previous studies stating that the culture of the organization is one factor affecting relations on the commitment of
organizational, (Sully, 2008). Especially cultural organization on classmate company PT. Karatu Abadi Jaya have
contributed to the organizational commitment of the company employees. In a real culture of good organization will
form the organizational commitment in a company and this is proven in this research
Hypothesis 2 have T-value of 2.50 (1,96 ≥ t-value). The t-test results stated that the relationship between the
variables of organizational culture with the employee performance proved to be significant. These results fit with
previous research suggesting that the organizational culture are factors that affect the performance of the employee
(Shahzad, 2013). A good organizational culture will shape the performance of employees, with good performance, then
the company will be ready to face a variety of factors both internal and external, especially for the purpose of the
company in meeting the needs of consumers.
Hypothesis 3 have T-value of 7.75 (1,96 ≥ t-value). The t-test results stated that the relationship between the
variables of organizational commitment with the employee performance of proven significant. This results in
accordance with previous studies stating that commitment organizational influential in the formation of performance
(Pei-ling, 2013). Organizational commitment high will make employees struggling improve performance in the
company , with a good performance because of the influence organizational commitment, then employees will struggle
to improve its ability in an individual manner or organizational implications. With some of the form a good
performance in the end will make company can meet the needs of consumers in a tangible manner.
CONCLUSION
Based on the analysis and discussion that has been done , it can be concluded that:
1. Organizational culture have positive and significant effect on organizational commitment on employee at
PT.Karatu Abadi Jaya Surabaya. This shows that the better organization owned company culture , the higher
the commitments that also owned by employees.
2. Organizational culture have positive and significant effect on the performance of employees at PT. Karatu
Abadi Jaya Surabaya. This shows that the better culture organization owned company, the more good too the
contribution of a performance given by employees to the company.
3. Organizational Commitment have positive and significant effect on the performance of employees at PT.
Karatu Abadi Jaya Surabaya. This indicates that the higher the commitments that owned by employees the
more good too the contribution of a performance given by employees upon a company.

REFERENCE
Arifin, Noor. 2010. Analisis Budaya Organisasional Terhadap Komitmen Kerja Karyawan Dalam Peningkatan Kinerja
Organisasional Karyawan Pada Koperasi BMT Di Kecamatan Jepara. Jurnal Ekonomi & Pendidikan, Vol. 8.
No 2. Hal 173-192
Hasibuan, Malayu S.P. 2006. Manajemen Sumber Daya Manusia. Jakarta: Bumi Aksara.
Jaros, Stephen. 2007. Meyer and Allen Model of Organizational Commitment: Measurement Issues. The Icfai Journal
of Organizational Behavior. Vol. 6, No 4, 2007. Hal 7-25.
Kreitner dan Kinicki. 2005. Perilaku Organisasi. Jakarta: Salemba empat
Moeljono, Djokosantoso 2005. Budaya Organisasi Dalam Tantangan. Jakarta: PT. Elex Media Komputindo Gramedia.
Mathis, R. L., dan Jackson, J. H., 2006, Human Resource Management, Jakarta: Salemba Empat.
Sugiyono. 1999. Metode Penelitian Bisnis. Bandung: Alfabeta
Shahzad, Fakhar. 2013. Impact of Organizational Culture on Employees Job Performance: An Empirical Study of
Software Houses in Pakistan. Journal of Bussiness Journal of Business Studies Quarterly. Vol 5, No 2. Hal 56-
64
Tsui, Pei-Ling. 2013. The Influence Of Psychological Contract And Organizational Commitment On Hospitality
Employee Performance. Journal of Social Behaviour and Personality. Vol 41. No 3. Hal 443-452
Widyaningrum, Mahmudah Enny. 2012. Effects of Organizational Culture and Ability on Organizational Commitment
and Performance in Ibnu Sina Hospital Gresik. Academic Research International. Vol 2. No 1. Hal 349-355