Embed Size (px)
Citation preview
JOURNAL OF ENVIRONMENTAL SCIENCE AND HEALTH
Part A—Toxic/Hazardous Substances & Environmental Engineering
Vol. A39, No. 2, pp. 375–384, 2004
Landfill Surface Runoff and Its Effect
on Water Quality on River Yamuna
M. Zafar1,* and B. J. Alappat2
1Department of Civil Engineering, College of Engineering and Petroleum,
Kuwait University, Safat, Kuwait2Department of Civil Engineering, Indian Institute of
Technology, New Delhi, India
ABSTRACT
During 2000, the estimated quantity of solid waste generated in Delhi, India was
more than 9000 tones per day. This is one of the biggest sources of environmental
degradation in capital city of India. Since 1950’s over 12 large landfill have been
packed with all kinds of nonbiodegradable and toxic waste of Delhi. The area
covered is at least 1% (14.83 square kilometer) of total Delhi’s area. All the
landfill sites except Tilak Nagar, Hastal, and Chattarpur are located very closely
(0.5–6 km) to the river Yamuna. It contributes the pollution to river Yamuna in a
significant way in a form of surface runoff from landfill site especially in rainy
season. The chemical analysis of leachate produced by these landfill sites and
corresponding river section (at five river points) has been performed for 16
selected parameter (Temperature, Odor, pH, Turbidity, Conductivity, COD,
Total Solids, Sulphide, Chloride, Nitrate, Iron) in the first stage and for 8
parameters (pH, Conductivity, COD, Total Solids, Chloride, Nitrate, Iron)
in second stage. The study was conducted between August to October, 2000
(rainy season). It is clear from the study that the river water quality is affected by
*Correspondence: M. Zafar, Department of Civil Engineering, College of Engineering and
Petroleum, Kuwait University, P.O. Box: 5969, Safat 13060, Kuwait; E-mail: mfhamoda@
yahoo.com or [email protected].
375
DOI: 10.1081/ESE-120027529 1093-4529 (Print); 1532-4117 (Online)
Copyright & 2004 by Marcel Dekker, Inc. www.dekker.com
ORDER REPRINTS
the presence of landfill surface runoff. Its impact can be seen in the region where
the drains are meeting the river. This is one of the causes of river pollution apart
from other major municipal and industrial sources.
Key Words: Landfill; Leachate; Runoff; River; Solid waste; Water quality.
INTRODUCTION
The river Yamuna in Delhi is the only major source of surface water in capital
city of India. The river water is unfit for direct use because the Yamuna Riverreceives at least 700 million gallons of wastewater everyday, three fourths of which isuntreated. The river also carries highly toxic wastes, containing high level of heavymetals and pesticides indiscriminately discharged by about half a million industrialunits. The biggest problem the river is facing today is due to the vast pollution andindustrialization along its banks. River Yamuna is found to be clean only in a stretch
of 522 km, out of 1044 km, which shows that it is polluted for half of its length. It hasa stretch of about 22 km between Wazirabad and Okhla barrage in Delhi. Pollutionload from Delhi renders it severely polluted downstream.
The water of river Yamuna continues to be polluted by domestic sewage andindustrial effluents from Delhi while the water quality at the point where the riverenters Delhi is within acceptable limits. Pollution load of the river, in terms of BOD,in the Delhi stretch has increased from 117 tones per day during 1982 to 211 tonesper day during 1998; which means the pollution level of Yamuna has increased
two-folds between 1982 to 1998.[1]
In Delhi, Yamuna water quality is so bad that the photosynthesis processes are
absent. BOD removal mainly takes place by the settling of organic matter.[2] Thepresent water quality of river between Wazirabad and Okhla Barriage is of Ecategory; that is, suitable for irrigation and industrial cooling only against therequired category B, which is suitable for bathing. Most of the previous studies arehaving the details about BOD, DO, total E-coli, pH and free ammonia in order toclassify the river Yamuna at some critical locations identified by the Central
Pollution Control Board (CPCB) of India.[3]
Delhi is generating more than 9000 TPD (tones per day), which is highest by any
Indian city. Since 1950’s over 12 large landfills have been packed with all sorts ofnonbiodegradable and toxic waste of Delhi. The area thus covered by landfills is atleast 1% (14.83 square kilometer) of total Delhi’s area.[4] Most of the landfills arelocated very closely to the river. All the landfill sites except Tilak Nagar, Hastal, andChattarpur are located very closely (0.5–6 km) to the river Yamuna. It contributespollution to Yamuna in a significant way in form of surface runoff from the landfill
site especially in rainy season.This article examines the effect of leachate runoff from landfill on the water
quality of river Yamuna in an 8 km long stretch at five selected river point in rainyseason. The effect of rainfall on the water quality (in the stretches of the river nearthe landfill sites) will be examined. The change in chemical characteristics of leachatedue to rainfall within the landfill will also be examined.
376 Zafar and Alappat
ORDER REPRINTS
BACKGROUND
The mega city of Delhi is referred to as the National Capital Territory of Delhi.It has 1485 sq. km area with a population more than 10 million. The densityof population is 6319 per sq. km. The temperature varies as follows: January30oC–15�C; April –May 27.5�C; July 30oC–32.5�C; October below 25�C. The annualrainfall ranges from 40 cm–200 cm. The mega city has dry winter, hot summerfollowed by heavy rains. The only river flows through the city is Yamuna, which isthe main source of drinking water for the population.[5]
The Okhla landfill has been in operation since 1994. Though the expected lifespan was till 1997–1998, garbage is being dumped to that landfill site even now. It islocated in the South of Delhi, adjacent to heavy populated residential area and is oneof the biggest industrial areas of close proximity to river bank. This site has 7.2hectare area and is currently receiving more than 800 tons of solid waste per day. TheGazipur landfill site is in operation since 1984. It is the largest active landfill site inDelhi covering 28 hectare area with a life span till 2004. This site is receiving 1300TPD of solid waste.[6] Also, liquid waste is mixed with all other type of wastes and noproper compaction of solid waste is carried out at the site. It was noted during siteinvestigation that at the landfill site, a proper scientific method of disposal is notadopted. Site is not prepared before use for waste disposal and the undergrounddrainage system; liner cover system and leachate collection system were foundabsent. Due to the lack of information on the leachate plumes at these sites, a trialand error method was implemented as per the United States EnvironmentalProtection Agency (USEPA) guidelines for selecting the leachate collection points.There was no collection system for leachate at the landfill site. All the leachatesamples were collected from the leachate drain below the waste piles.
METHODOLOGY
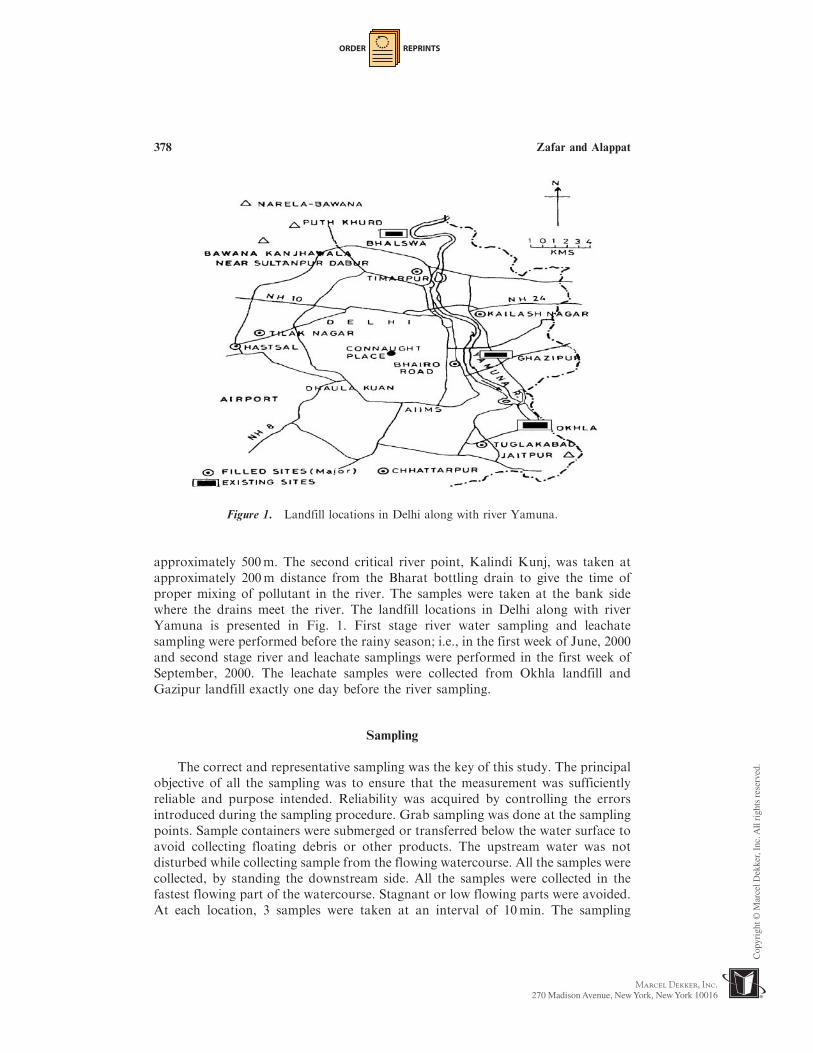
The Okhla landfill site and Gazipur landfill sites were selected for the presentinvestigation due to its close proximity to the river Yamuna. Approximately 8kilometer long river section was selected to study the effect of landfill runoff in rainyseason. The two selected river point were Nizamuddin Bridge and Kalindi Kunj asthey are nearest to the landfills location. It was also insured that at least one drainfrom the landfills meet the river point before the observation/sampling river point.Five drains were found to meet this selected river stretch. These were Barapula drain,Drain number 14, Maharani Bagh drain, a drain near Apollo Hospital, and a drainnear Bharat Bottling. Barapula and drain number 14 bring runoff of Gazipurlandfill. Maharani Bagh drain meets the river Yamuna after Nizamuddin Bridge; soits effect cannot impact the result of first critical observation/sampling river point(Nizamuddin Bridge). The impact of Maharani Bagh drain would be minimal onKalindi Kunj river point as it is approximately 6 kilometer from Kalindi Kunj. Thetwo drains which bring the leachate runoff from Okhla landfill into river were adrain near Apollo Hospital and a drain near Bharat Bottling. This was found out bythe study of flow path of these drains with the help of drainage map of south Delhi.The physical distance of the two drain’s meeting points with river Yamuna is
Landfill Surface Runoff in River Yamuna 377
ORDER REPRINTS
approximately 500m. The second critical river point, Kalindi Kunj, was taken atapproximately 200m distance from the Bharat bottling drain to give the time ofproper mixing of pollutant in the river. The samples were taken at the bank sidewhere the drains meet the river. The landfill locations in Delhi along with riverYamuna is presented in Fig. 1. First stage river water sampling and leachatesampling were performed before the rainy season; i.e., in the first week of June, 2000and second stage river and leachate samplings were performed in the first week ofSeptember, 2000. The leachate samples were collected from Okhla landfill andGazipur landfill exactly one day before the river sampling.
Sampling
The correct and representative sampling was the key of this study. The principalobjective of all the sampling was to ensure that the measurement was sufficientlyreliable and purpose intended. Reliability was acquired by controlling the errorsintroduced during the sampling procedure. Grab sampling was done at the samplingpoints. Sample containers were submerged or transferred below the water surface toavoid collecting floating debris or other products. The upstream water was notdisturbed while collecting sample from the flowing watercourse. All the samples werecollected, by standing the downstream side. All the samples were collected in thefastest flowing part of the watercourse. Stagnant or low flowing parts were avoided.At each location, 3 samples were taken at an interval of 10min. The sampling
Figure 1. Landfill locations in Delhi along with river Yamuna.
378 Zafar and Alappat
ORDER REPRINTS
containers were made up of Polythene Terephthalate (PET). Care was taken toensure that no contamination of the sample occurs during storage after sampling andduring transportation back to the laboratory facilities.
Three locations for the collection of leachate samples were identified at bothOkhla landfill and Gazipur landfill sites to get homogeneous and representativesamples as there was no leachate collection system and monitoring boreholes werepresent.
From each location, a 1000mL sample was collected. Before sampling, thesebottles were properly washed with a phosphate-free detergent, HNO3 and HCl, andthen rinsed several times with deionized distilled water. Samples were stored at 4�Cin the laboratory and unpreserved samples were analyzed immediately. All thelaboratory tests were performed according to the accepted procedures for analysisoutlined in ‘‘Standard Methods for Examination of Water and Wastewater.’’[7]
RESULT AND DISCUSSION
The study examines the impact of rainfall on leachate quality in unlined and oldlandfills, landfill runoff production and pollutant loading into the river and theirimpact on the river water quality parameters.
Leachate Quality
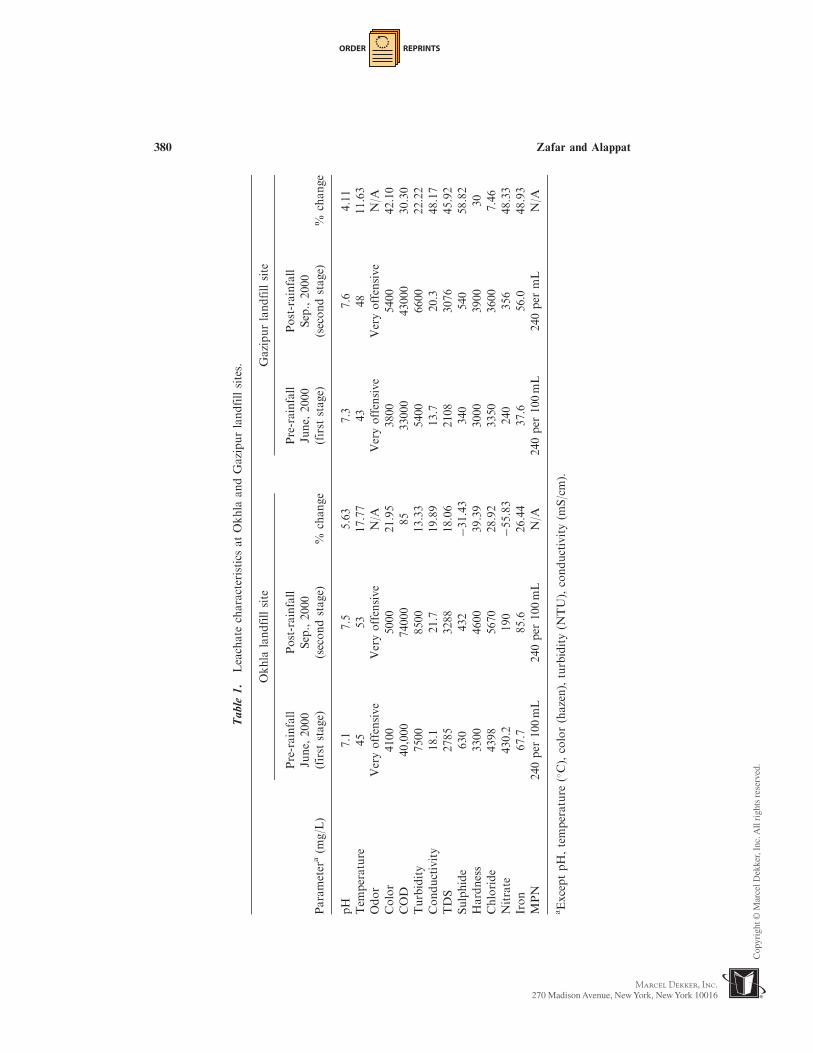
Large variations in the quality of leachate produced from different landfills havebeen reported in the literature.[8–11] The temperature of landfill leachate hasincreased after rainfall 17.77% at Okhla landfill site and 11.63% at Gazipur landfillsites. The pH of leachate was noted 7.1 at Okhla landfill site and 7.3 at Gazipurlandfill in June. After rainfall the leachate became more alkaline and alkalinity wasincreased by 5.63% at Okhla and 11.63% at Gazipur landfill sites in September. Theorganic strength of leachate has increased by 85% in Okhla landfill and 30.3% afterrainfall. The significant increase may be possible due to percolation of rainwater andit takes all the organic and inorganic content with itself by advection and diffusiontransport process from refuse piles. The color has become more dark after rainfallwhich is apparent from high hazen value of leachate in both the landfills in month ofSeptember. The hardness, Nitrate, Chloride and Iron were noted very high in bothlandfill leachate. Odor was continued to be very offensive pre and post rainfallmonths. Moreover, MPN was noted almost constant for all the landfills in pre andpost rainfall months. The results of chemical analysis for two landfills are providedin Table 1.
River Water Quality
In first stage, the critical river points (Nizamuddin Bridge and Kalindi Kunj)were studied along with the lechates from both the landfills. The water qualityanalyses were performed for 16 parameters on collected river samples. Details of the
Landfill Surface Runoff in River Yamuna 379
ORDER REPRINTS
Table
1.
Leachate
characteristics
atOkhla
andGazipurlandfillsites.
Okhla
landfillsite
Gazipurlandfillsite
Pre-rainfall
Post-rainfall
Pre-rainfall
Post-rainfall
June,
2000
Sep.,2000
June,
2000
Sep.,2000
Parameter
a(m
g/L)
(first
stage)
(secondstage)
%change
(first
stage)
(secondstage)
%change
pH
7.1
7.5
5.63
7.3
7.6
4.11
Tem
perature
45
53
17.77
43
48
11.63
Odor
Veryoffensive
Veryoffensive
N/A
Veryoffensive
Veryoffensive
N/A
Color
4100
5000
21.95
3800
5400
42.10
COD
40,000
74000
85
33000
43000
30.30
Turbidity
7500
8500
13.33
5400
6600
22.22
Conductivity
18.1
21.7
19.89
13.7
20.3
48.17
TDS
2785
3288
18.06
2108
3076
45.92
Sulphide
630
432
�31.43
340
540
58.82
Hardness
3300
4600
39.39
3000
3900
30
Chloride
4398
5670
28.92
3350
3600
7.46
Nitrate
430.2
190
�55.83
240
356
48.33
Iron
67.7
85.6
26.44
37.6
56.0
48.93
MPN
240per
100mL
240per
100mL
N/A
240per
100mL
240per
mL
N/A
aExceptpH,temperature
(�C),color(hazen),turbidity(N
TU),conductivity(m
S/cm).
380 Zafar and Alappat
ORDER REPRINTS
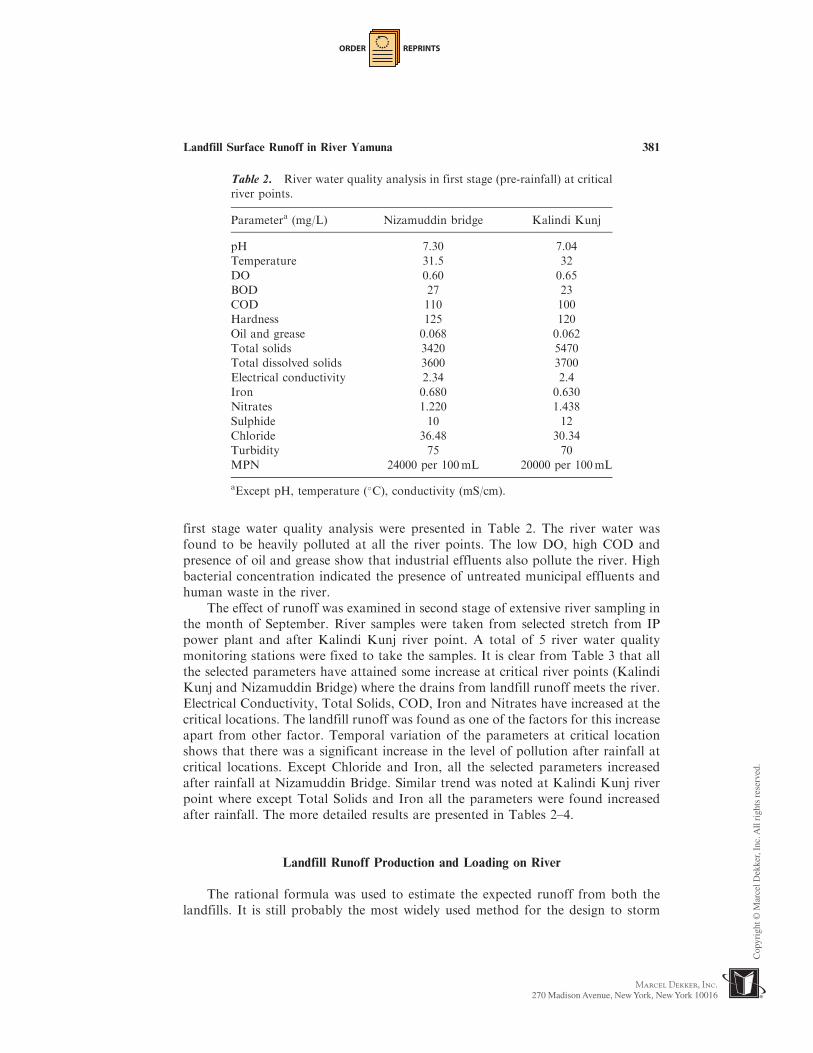
first stage water quality analysis were presented in Table 2. The river water wasfound to be heavily polluted at all the river points. The low DO, high COD andpresence of oil and grease show that industrial effluents also pollute the river. Highbacterial concentration indicated the presence of untreated municipal effluents andhuman waste in the river.
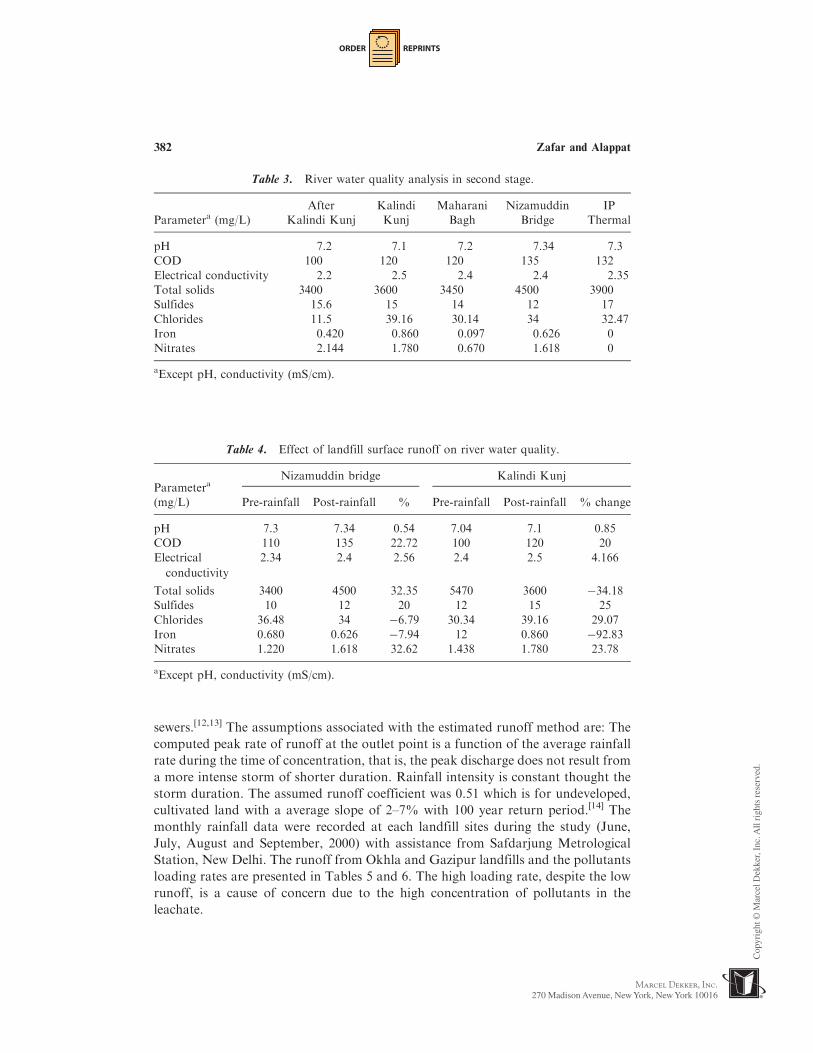
The effect of runoff was examined in second stage of extensive river sampling inthe month of September. River samples were taken from selected stretch from IPpower plant and after Kalindi Kunj river point. A total of 5 river water qualitymonitoring stations were fixed to take the samples. It is clear from Table 3 that allthe selected parameters have attained some increase at critical river points (KalindiKunj and Nizamuddin Bridge) where the drains from landfill runoff meets the river.Electrical Conductivity, Total Solids, COD, Iron and Nitrates have increased at thecritical locations. The landfill runoff was found as one of the factors for this increaseapart from other factor. Temporal variation of the parameters at critical locationshows that there was a significant increase in the level of pollution after rainfall atcritical locations. Except Chloride and Iron, all the selected parameters increasedafter rainfall at Nizamuddin Bridge. Similar trend was noted at Kalindi Kunj riverpoint where except Total Solids and Iron all the parameters were found increasedafter rainfall. The more detailed results are presented in Tables 2–4.
Landfill Runoff Production and Loading on River
The rational formula was used to estimate the expected runoff from both thelandfills. It is still probably the most widely used method for the design to storm
Table 2. River water quality analysis in first stage (pre-rainfall) at critical
river points.
Parametera (mg/L) Nizamuddin bridge Kalindi Kunj
pH 7.30 7.04
Temperature 31.5 32
DO 0.60 0.65
BOD 27 23
COD 110 100
Hardness 125 120
Oil and grease 0.068 0.062
Total solids 3420 5470
Total dissolved solids 3600 3700
Electrical conductivity 2.34 2.4
Iron 0.680 0.630
Nitrates 1.220 1.438
Sulphide 10 12
Chloride 36.48 30.34
Turbidity 75 70
MPN 24000 per 100mL 20000 per 100mL
aExcept pH, temperature (�C), conductivity (mS/cm).
Landfill Surface Runoff in River Yamuna 381
ORDER REPRINTS
sewers.[12,13] The assumptions associated with the estimated runoff method are: The
computed peak rate of runoff at the outlet point is a function of the average rainfall
rate during the time of concentration, that is, the peak discharge does not result from
a more intense storm of shorter duration. Rainfall intensity is constant thought the
storm duration. The assumed runoff coefficient was 0.51 which is for undeveloped,
cultivated land with a average slope of 2–7% with 100 year return period.[14] The
monthly rainfall data were recorded at each landfill sites during the study (June,
July, August and September, 2000) with assistance from Safdarjung Metrological
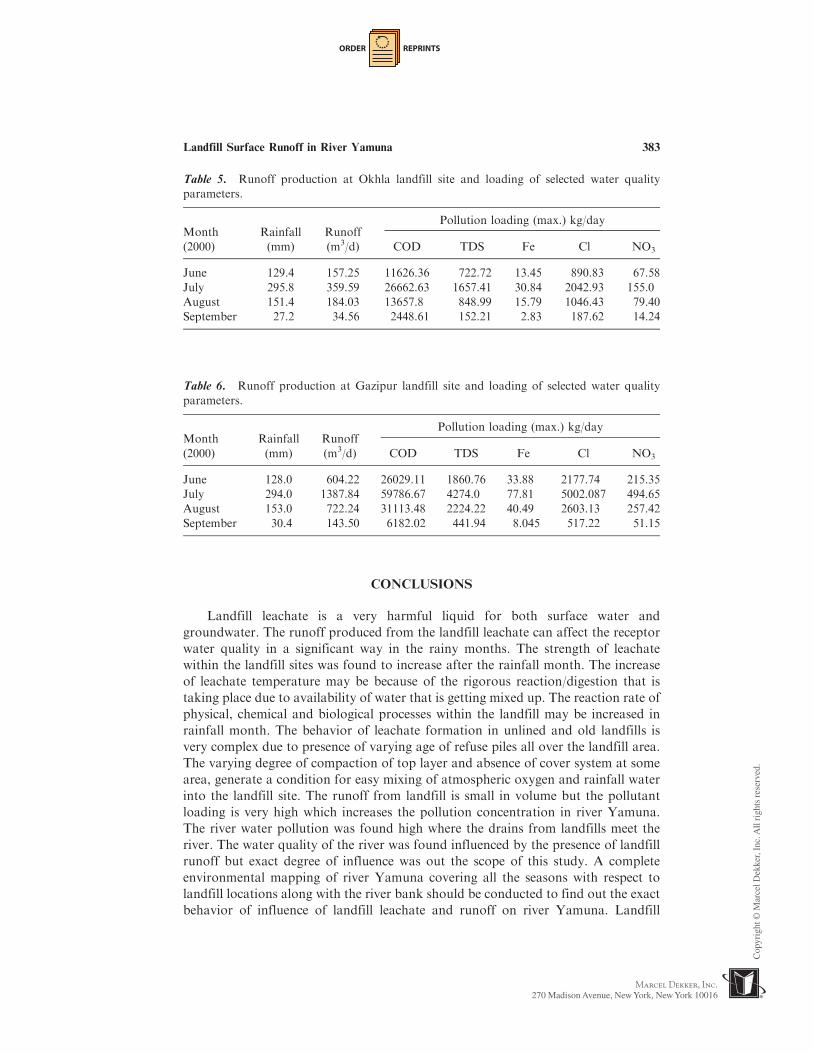
Station, New Delhi. The runoff from Okhla and Gazipur landfills and the pollutants
loading rates are presented in Tables 5 and 6. The high loading rate, despite the low
runoff, is a cause of concern due to the high concentration of pollutants in the
leachate.
Table 4. Effect of landfill surface runoff on river water quality.
Parametera
(mg/L)
Nizamuddin bridge Kalindi Kunj
Pre-rainfall Post-rainfall % Pre-rainfall Post-rainfall % change
pH 7.3 7.34 0.54 7.04 7.1 0.85
COD 110 135 22.72 100 120 20
Electrical
conductivity
2.34 2.4 2.56 2.4 2.5 4.166
Total solids 3400 4500 32.35 5470 3600 �34.18
Sulfides 10 12 20 12 15 25
Chlorides 36.48 34 �6.79 30.34 39.16 29.07
Iron 0.680 0.626 �7.94 12 0.860 �92.83
Nitrates 1.220 1.618 32.62 1.438 1.780 23.78
aExcept pH, conductivity (mS/cm).
Table 3. River water quality analysis in second stage.
Parametera (mg/L)
After
Kalindi Kunj
Kalindi
Kunj
Maharani
Bagh
Nizamuddin
Bridge
IP
Thermal
pH 7.2 7.1 7.2 7.34 7.3
COD 100 120 120 135 132
Electrical conductivity 2.2 2.5 2.4 2.4 2.35
Total solids 3400 3600 3450 4500 3900
Sulfides 15.6 15 14 12 17
Chlorides 11.5 39.16 30.14 34 32.47
Iron 0.420 0.860 0.097 0.626 0
Nitrates 2.144 1.780 0.670 1.618 0
aExcept pH, conductivity (mS/cm).
382 Zafar and Alappat
ORDER REPRINTS
CONCLUSIONS
Landfill leachate is a very harmful liquid for both surface water and
groundwater. The runoff produced from the landfill leachate can affect the receptor
water quality in a significant way in the rainy months. The strength of leachate
within the landfill sites was found to increase after the rainfall month. The increase
of leachate temperature may be because of the rigorous reaction/digestion that is
taking place due to availability of water that is getting mixed up. The reaction rate of
physical, chemical and biological processes within the landfill may be increased in
rainfall month. The behavior of leachate formation in unlined and old landfills is
very complex due to presence of varying age of refuse piles all over the landfill area.
The varying degree of compaction of top layer and absence of cover system at some
area, generate a condition for easy mixing of atmospheric oxygen and rainfall water
into the landfill site. The runoff from landfill is small in volume but the pollutant
loading is very high which increases the pollution concentration in river Yamuna.
The river water pollution was found high where the drains from landfills meet the
river. The water quality of the river was found influenced by the presence of landfill
runoff but exact degree of influence was out the scope of this study. A complete
environmental mapping of river Yamuna covering all the seasons with respect to
landfill locations along with the river bank should be conducted to find out the exact
behavior of influence of landfill leachate and runoff on river Yamuna. Landfill
Table 6. Runoff production at Gazipur landfill site and loading of selected water quality
parameters.
Month Rainfall RunoffPollution loading (max.) kg/day
(2000) (mm) (m3/d) COD TDS Fe Cl NO3
June 128.0 604.22 26029.11 1860.76 33.88 2177.74 215.35
July 294.0 1387.84 59786.67 4274.0 77.81 5002.087 494.65
August 153.0 722.24 31113.48 2224.22 40.49 2603.13 257.42
September 30.4 143.50 6182.02 441.94 8.045 517.22 51.15
Table 5. Runoff production at Okhla landfill site and loading of selected water quality
parameters.
Month Rainfall RunoffPollution loading (max.) kg/day
(2000) (mm) (m3/d) COD TDS Fe Cl NO3
June 129.4 157.25 11626.36 722.72 13.45 890.83 67.58
July 295.8 359.59 26662.63 1657.41 30.84 2042.93 155.0
August 151.4 184.03 13657.8 848.99 15.79 1046.43 79.40
September 27.2 34.56 2448.61 152.21 2.83 187.62 14.24
Landfill Surface Runoff in River Yamuna 383
ORDER REPRINTS
leachate and runoff certainly influence the river water quality apart from other majorfactors.
REFERENCES
1. CAG. Control of pollution of river Yamuna in Delhi. Report of Government ofNCT of Delhi, para 3.3. New Delhi, 1999.
2. Kazmi, A.A.; Hansen, I.S. Numerical models in water quality management acase study of Yamuna river, Water Science and Technology 1997, 36 (5),193–200.
3. Zafar, M.; Alappat, B.J. Water Quality of River Yamuna in Delhi.International Conference of Advancement in Civil Engineering, IndianInstitute of Technology, Kharagpur, India, 2002.
4. Rohilla, S.K.; Datta, P.S.; Bansal, S.P. Delhi’s Water and Solid WasteManagement: Emerging Scenario; Vigyan Prasar: New Delhi, India, 1999.
5. Susheela, A.K.; Bhatnagar, M.; Arvind, K. Status of Drinking Water in theMega City Delhi, Reaching the Unreached: Challenges for the 21st Century.22nd WEDC Conference, New Delhi, India, 1996, 299–301.
6. NEERI. Study of Solid Waste Management of Delhi. Delhi DevelopmentAuthority, National Environmental Engineering Research Institute, Nagpur,India, 1995.
7. American Public Health Association (APHA). Standard methods for theexamination of water and wastewater, 18th Ed.; American Water WorksAssociation, Water Environment Federation publication APHA: Washington,D.C., 1992.
8. Johansen, O.J.; Carlson, D.A. Characterization of sanitary landfill leachate.Water Res. 1976, 10, 1129–1134.
9. Chian, E.S.K. Stability of organic matter in landfill leachates. Water Res. 1977,11, 225–232.
10. Booker, T.J.; Ham, R.K. Stabilization of solid waste in landfill. Journal ofEnvironmental Engineering Div., ASCE 1982, 108 (6), 1089–1128.
11. Kouzeli-Katsiri, A.; Christioulas, D.; Bosdogianni, A. Leachate Degradationafter Recirculation, Proc., Sardinia 93—4th Inl. Landfill Symp., S. Margarita diPula, ed., 1993; 1007–1018.
12. Pilgrim, D.H. Bridging the gap between flood research and design practice.Water Resources Res. 1986, 22 (9), 165S–176S.
13. Linsey, R.K. Flood estimates: how good they are? Water Resources Res. 1986,22 (9), 159S–164S.
14. Mays, L.W.; Taur, C.K. FESWMS-TX two-dimensional analysis of backwaterat bridge: user’s guide and application—phase two, Research Report 314-2F,Center for Transportation Research, University of Taxas, 1984, November.
384 Zafar and Alappat