Embed Size (px)
Citation preview

Laser-induced fluorescence diagnostics of the cross-field discharge of Hall thrusters
This article has been downloaded from IOPscience. Please scroll down to see the full text article.
2013 Plasma Sources Sci. Technol. 22 013001
(http://iopscience.iop.org/0963-0252/22/1/013001)
Download details:
IP Address: 163.9.19.90
The article was downloaded on 30/11/2012 at 12:20
Please note that terms and conditions apply.
View the table of contents for this issue, or go to the journal homepage for more
Home Search Collections Journals About Contact us My IOPscience
IOP PUBLISHING PLASMA SOURCES SCIENCE AND TECHNOLOGY
Plasma Sources Sci. Technol. 22 (2013) 013001 (21pp) doi:10.1088/0963-0252/22/1/013001
INVITED REVIEW
Laser-induced fluorescence diagnostics ofthe cross-field discharge of Hall thrustersStephane Mazouffre
ICARE, CNRS, 1C avenue de la Recherche Scientifique, 45071 Orleans, France
E-mail: [email protected]
Received 20 August 2012, in final form 17 October 2012Published 29 November 2012Online at stacks.iop.org/PSST/22/013001
AbstractThis article presents a review of work performed over the past ten years in France, centered onthe utilization of laser-induced fluorescence (LIF) spectroscopy to diagnose the low-pressuremagnetized dc discharge of a Hall thruster (HT). The latter is a gridless electric propulsiondevice in a crossed electric and magnetic field configuration, which is used onboard satellitesand space probes for various types of maneuvers. Although the design of a HT is relativelysimple, the physical mechanisms that govern thrust generation and efficiency are not yet fullyunderstood. Characterization of the ion and atom velocity distribution function (VDF) appearsto be a powerful way to obtain insights into the underlying physics. The VDF of xenon andkrypton—the most common propellants—is therefore locally interrogated by means of LIF onexcited levels. In this review emphasis is placed on time-averaged and time-resolvedcontinuous-wave LIF measurements, associated quantities and recent outcomes. Results willbe presented concerning a variety of phenomena: velocity vector field structuring, ionpopulation interaction, electric field generation, ion magnetic drift, apparent atom acceleration,interaction of the plasma plume with background gas and low-frequency electric fieldoscillations, to name only a few.
(Some figures may appear in colour only in the online journal)
1. Introduction
In comparison with chemical engines, electric propulsionsystems offer significant advantages for commercial andscientific space missions in terms of payload mass, launchcost and mission duration due to a fast propellant ejectionspeed that warrants a large propellant mass saving accordingto the Tsiolkovsky rocket equation [1]. Nowadays themost important application of electric propulsion systemsis the north–south station keeping of geosynchronoustelecommunication satellites. The increase in electrical poweravailable onboard the spacecraft will lead to new applicationsof electric propulsion systems in the near future, such asorbit raising and orbit topping maneuvers, orbit transfermaneuvers, not only in the Earth upper atmosphere but alsotoward far-off planets and asteroids, as well as end-of-lifedeorbiting. Many different electric propulsion technologiesexist: arcjets [2], magnetoplasmadynamic thrusters [2],gridded ion engines [2, 3], Hall thrusters [2, 4], helicon
thruster [5], VASIMR [6], PEGASES thruster [7] and soon. Among all the different electric propulsion devices, twotechnologies, namely the gridded ion engine (GIE) and theHall thruster (HT), are at the present time mature with a longflight heritage. For instance, over 200 HTs have been flownon satellites since 1971. GIEs are characterized by a purelyelectrostatic acceleration of ions, the latter being extractedfrom a plasma through a set of high-voltage grids [3]. Thedischarge in a GIE can be generated by electron bombardment,microwave power or radio-frequency power. In contrast, HTsare gridless engines. They provide thrust by accelerationof ions in a low pressure discharge in a crossed electricand magnetic field configuration [4]. The two technologiesexhibit a similar thrust efficiency that can be as high as 70%at high power. GIEs are characterized by a high specificimpulse, which means a great ion ejection velocity, and arelatively low thrust level. HTs provide a relatively largethrust with a moderate specific impulse. However, the thrust-to-power ratio of HTs is more than three times larger than
0963-0252/13/013001+21$33.00 1 © 2013 IOP Publishing Ltd Printed in the UK & the USA
Plasma Sources Sci. Technol. 22 (2013) 013001 Invited Review
that of GIEs [9]. Furthermore, a HT is simple, compactand robust. Therefore, Hall thrusters represent an attractiveelectric propulsion technology for standard maneuvers as wellas for foreseen new applications for which thrust is a criticalissue.
Despite dozens of years of HT development andinvestigation, many physical mechanisms that govern thebehavior and the performance of such a magnetized dischargeare nevertheless ill-understood and not well quantified.Among others one can cite the electron diffusion across themagnetic barrier, plasma–wall interactions, energy losses andgeometrical and size effects. This lack of knowledge isclearly a limiting factor for various aspects of the technology:optimization of existing HTs, derivation of scaling laws andsizing methodologies, utilization of alternative propellants, forexample. Moreover, this situation slows down the constructionof novel and more efficient thruster architectures and thedevelopment of predictive numerical models. Among thepossible experimental approaches to gain knowledge, the fineexamination of ion and atom transport phenomena in a HTappears to be a powerful way to improve our understandingof the underlying physics in this specific type of magnetizedplasma source. The transport properties of xenon and kryptonatoms and ions—these two gases being the most commonpropellant for electric thrusters—can be accurately examinedthrough the measurement of a statistical quantity, the so-called velocity distribution function (VDF). The Xe I and Kr I
atom and Xe II and Kr II ion VDF can be probed in a non-intrusive way by means of laser-induced fluorescence (LIF)spectroscopy with a continuous-wave (CW) light beam in thenear-infrared spectral domain.
This review focuses on the utilization of LIF spectroscopyfor HT diagnosis and how it gives insights into the physicsat work in the cross-field discharge and plume of the device.The contribution, which in fact covers ten years of researchperformed at the CARE Institute in France, is divided intoseveral parts. In section 2, a brief overview is offeredon HT principle, design and operation. Typical dischargeparameters are also given to localize this device in the vastcollection of plasma sources. The LIF spectroscopy methodis presented in section 3. After explaining the principle of thetechnique, we discuss the optical train and the data acquisitionsystem for time-averaged measurements. In addition, opticaltransitions used for probing HT discharge with xenon andkrypton are introduced. After describing the basics of thecw-LIF technique, section 4 is about fluorescence line shapeproperties and origin, and ion VDF extraction. Section 5outlines computation of macroscopic quantities from themeasured VDF. The ion velocity, velocity dispersion andvector field are discussed in this section. Calculation ofthe accelerating electric field distribution is illustrated insection 6. Direct determination from the velocity profile iscompared with a method based on the moments of Boltzmann’sequation. Although weakly magnetized, ions undergo anazimuthal drift due to the magnetic field as illustrated insection 7. The effect of the external cathode on the ion driftis also investigated in this section. In section 8, we takean interest in the atomic transport properties. In contrast to
the ion case, the atom velocity is obtained from fluorescencelineshape modeling. Invasion of the beam by the neutral gasand ion recombination at the walls is shown to play a keyrole in the atom velocity development. Section 9 discussestime-resolved LIF measurements using a photon-countingtechnique. Time-varying ion VDFs are shown. In this section,low-frequency spatio-temporal oscillations of the electric fieldare experimentally evidenced. Finally, conclusions are drawnin section 10 and comments on future possibilities are given toclose this review.
2. HT physics and functioning
A HT is an advanced propulsion device for spacecrafts thatuses an electric discharge with magnetized electrons to ionizeand accelerate a propellant gas [2, 4, 8]. HTs offer interestingfeatures in terms of thrust-to-power ratio, specific impulse,efficiency, lifetime and mass. They are therefore recognizedas an attractive propulsion means for space missions andmaneuvers that require a large velocity increment. Currently, 1to 2 kW-class HTs are employed for geosynchronous satelliteattitude correction and station keeping. They also appearas good candidates for the primary propulsion engine ofspace probes, as demonstrated by the successful SMART-1Moon flyby solar-powered mission [10]. Space agenciestogether with satellite manufacturers and users nonethelessenvisage new fields of application for electric propulsionsystems that require low- and high-power devices. Low-power HTs (∼100 W) are well suited for drag compensationof observation satellites that operate on a low-altitude orbitin the Earth’s atmosphere as well as for trajectory correctionof small platforms and microsatellite constellations. The useof mid-power (∼5 kW) HTs for orbit raising, orbit toppingand even full orbit transfer maneuvers of communicationsatellites would offer significant benefits in terms of launchmass, payload mass and operational life. Finally, ambitiousrobotic missions such as exploration of the outer planets of thesolar system and far-off comets as well as transfer of cargovehicles to support crewed missions require very high powerelectric propulsion systems to overcome velocity incrementsthat can be as large as several tens of km s−1. That is the reasonwhy a significant part of research activities focuses on buildingand testing of HTs with power above 10 kW with a thrust levellarger than 1 N [9].
In contrast to, e.g., gridded ion engines, in a HT,acceleration of heavy atomic ions to high velocity occurswithin the core of the discharge, which implies the use ofa magnetized plasma to sustain internal electric fields. Aschematic of a HT is depicted in figure 1. The principlerelies upon a magnetic barrier and a low pressure dc dischargegenerated between an external cathode and an anode in sucha way that a crossed electric and magnetic field dischargeis created [4, 11–13]. The anode, which often serves asa gas injector, is located at the upstream end of a coaxialannular dielectric channel that confines the discharge. Xenon isgenerally used as a propellant gas due to its specific propertiesin terms of high atomic mass and low ionization energy. Aset of solenoids or permanent magnets provides a radially
2
Plasma Sources Sci. Technol. 22 (2013) 013001 Invited Review
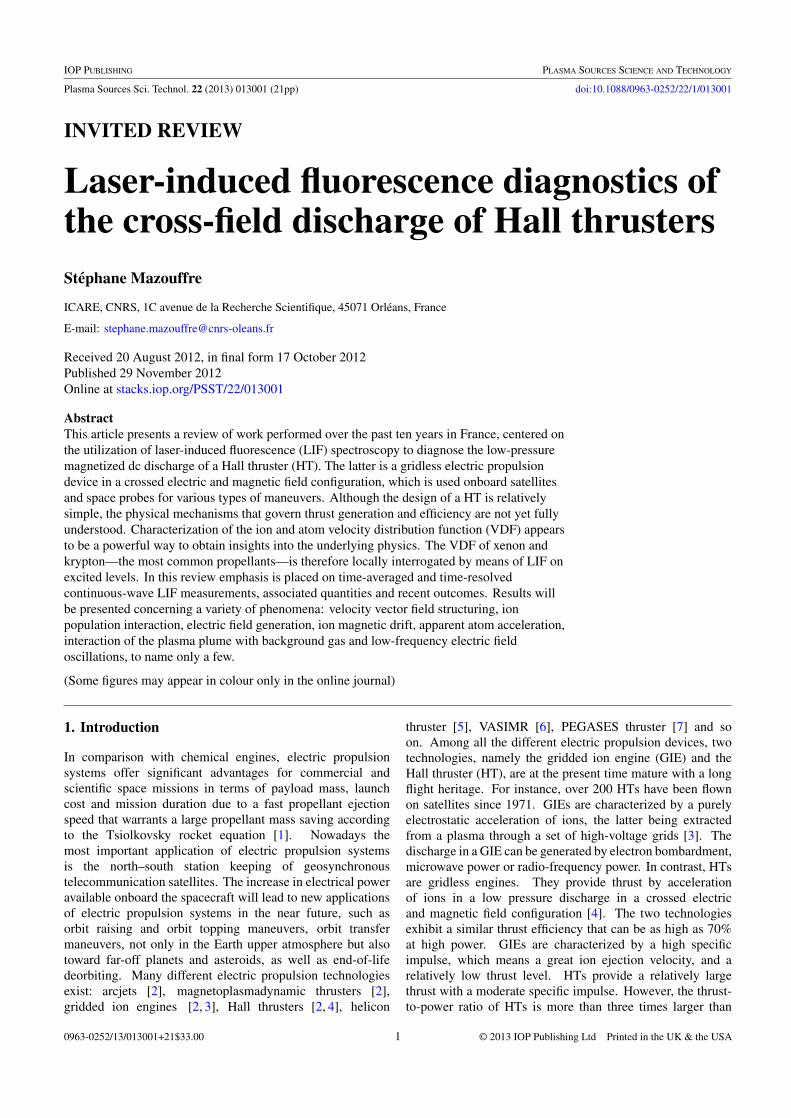
Figure 1. Cross-section view of a HT body in the x–y plane. Themagnetic and electric field vectors as well as the Hall current areindicated.
directed magnetic field B the strength of which is maximumin the vicinity of the channel exhaust. The magnetic field ischosen strong enough to make the electron Larmor radius muchsmaller than the discharge chamber length, but weak enoughnot to affect ion trajectories. The electric potential drop ismostly concentrated in the final section of the channel owingto the low electron axial mobility in this restricted area. Thecorresponding induced local axial electric field E has two maineffects. First, it drives a high electron azimuthal drift—the Hallcurrent—that is responsible for the efficient ionization of thesupplied gas. Second, it accelerates ions out of the channel,which generates thrust. The ion beam is neutralized by afraction of electrons emitted from the cathode. When operatingnear 1.5 kW, a HT ejects ions at 20 km s−1 and generates 90 mNof thrust with an overall efficiency of about 50%. The mainelements of the thruster assembly are displayed in the drawingof figure 1 as well as in the photograph of figure 2. Figure 3shows the 20 kW-class PPS20k-ML thruster firing with xenonfor several discharge powers.
For the record, typical parameters and quantities aregiven in table 1 for a 1.5 kW-class HT equipped with BN-SiO2 walls and operating with xenon. As can be seen,electrons are magnetized whereas ions are not. The electrontemperature is far above characteristic values encountered inlow-pressure discharges; the electron density is also large.As a consequence, the ionization degree is high: in terms offlux, more than 90% of the injected gas flow is ionized inthe discharge of a HT. Note that the HT that circulates in the
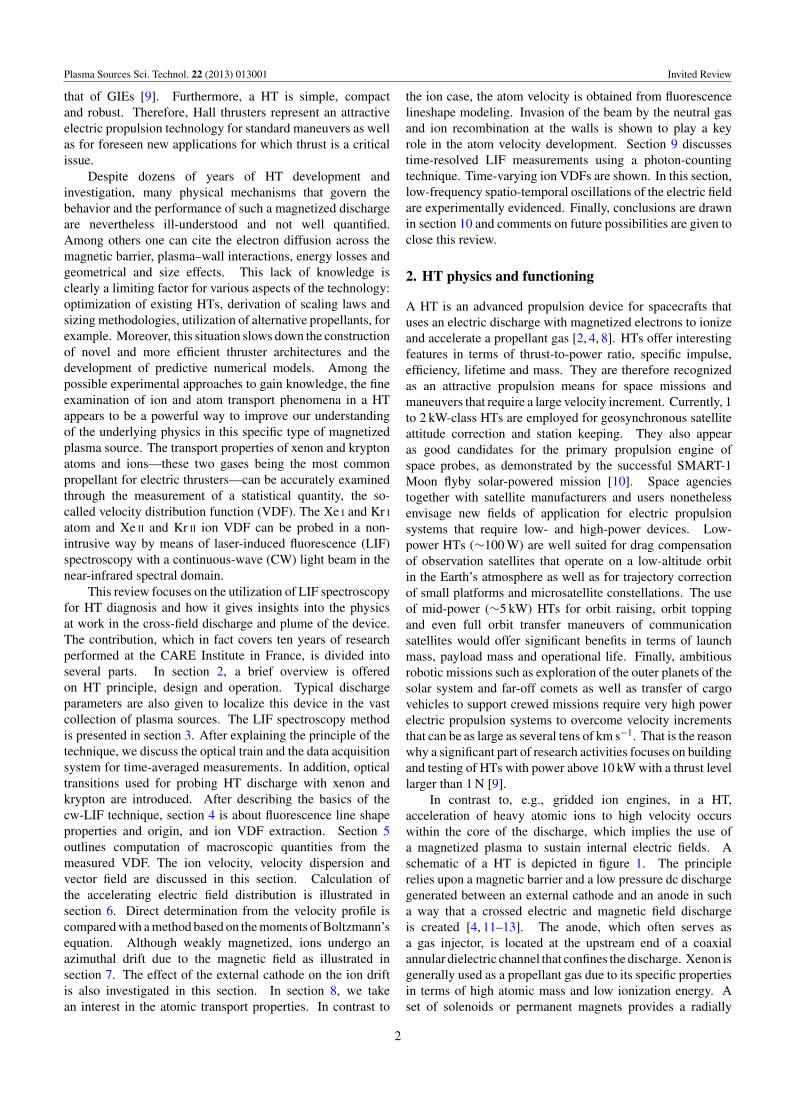
Figure 2. Picture of the 5 kW-class PPSX�000-ML HT prior totesting. The main thruster elements are shown.
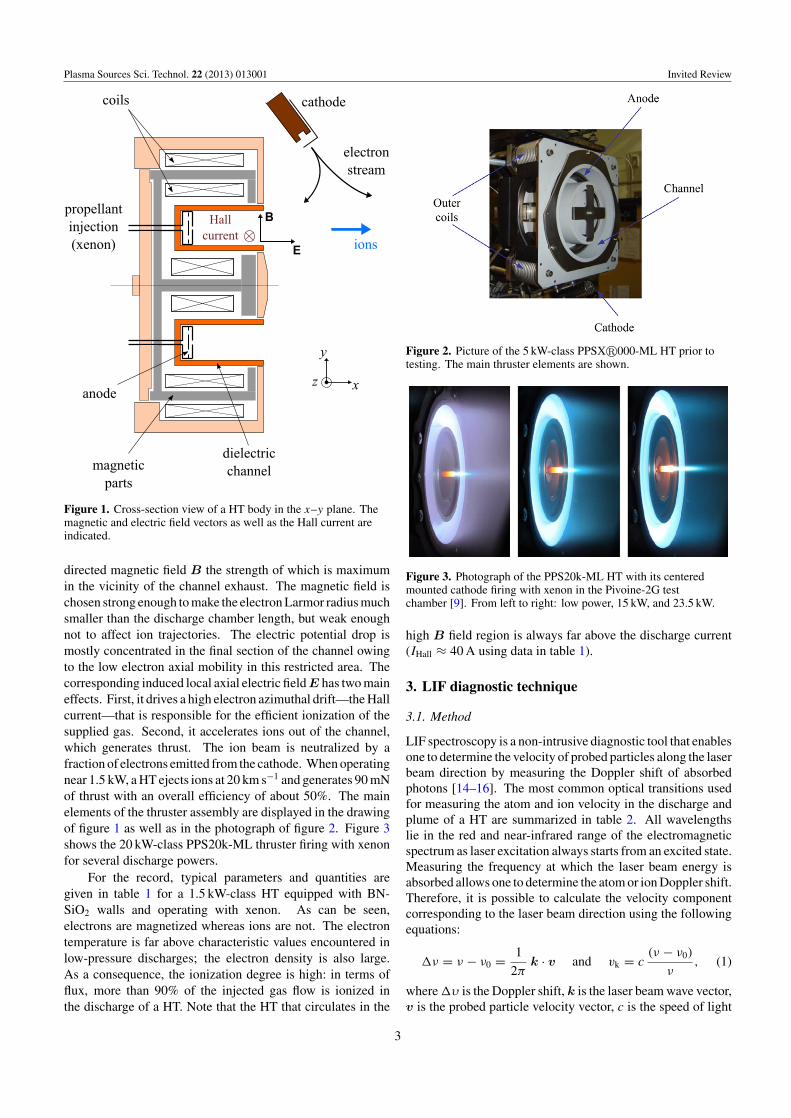
Figure 3. Photograph of the PPS20k-ML HT with its centeredmounted cathode firing with xenon in the Pivoine-2G testchamber [9]. From left to right: low power, 15 kW, and 23.5 kW.
high B field region is always far above the discharge current(IHall ≈ 40 A using data in table 1).
3. LIF diagnostic technique
3.1. Method
LIF spectroscopy is a non-intrusive diagnostic tool that enablesone to determine the velocity of probed particles along the laserbeam direction by measuring the Doppler shift of absorbedphotons [14–16]. The most common optical transitions usedfor measuring the atom and ion velocity in the discharge andplume of a HT are summarized in table 2. All wavelengthslie in the red and near-infrared range of the electromagneticspectrum as laser excitation always starts from an excited state.Measuring the frequency at which the laser beam energy isabsorbed allows one to determine the atom or ion Doppler shift.Therefore, it is possible to calculate the velocity componentcorresponding to the laser beam direction using the followingequations:
�ν = ν − ν0 = 1
2πk · v and vk = c
(ν − ν0)
ν, (1)
where �υ is the Doppler shift, k is the laser beam wave vector,v is the probed particle velocity vector, c is the speed of light
3
Plasma Sources Sci. Technol. 22 (2013) 013001 Invited Review
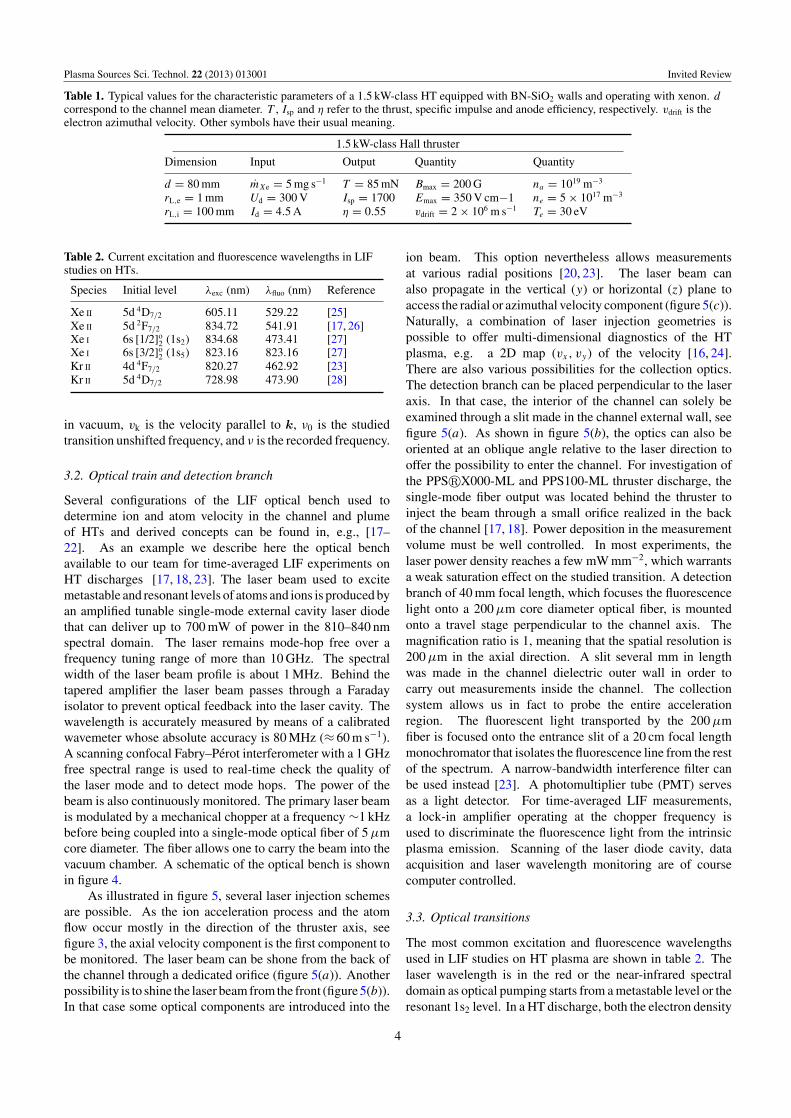
Table 1. Typical values for the characteristic parameters of a 1.5 kW-class HT equipped with BN-SiO2 walls and operating with xenon. dcorrespond to the channel mean diameter. T , Isp and η refer to the thrust, specific impulse and anode efficiency, respectively. vdrift is theelectron azimuthal velocity. Other symbols have their usual meaning.
1.5 kW-class Hall thruster
Dimension Input Output Quantity Quantity
d = 80 mm mXe = 5 mg s−1 T = 85 mN Bmax = 200 G na = 1019 m−3
rL,e = 1 mm Ud = 300 V Isp = 1700 Emax = 350 V cm−1 ne = 5 × 10¹⁷ m−3
rL,i = 100 mm Id = 4.5 A η = 0.55 vdrift = 2 × 10⁶ m s−1 Te = 30 eV
Table 2. Current excitation and fluorescence wavelengths in LIFstudies on HTs.
Species Initial level λexc (nm) λfluo (nm) Reference
Xe II 5d 4D7/2 605.11 529.22 [25]Xe II 5d 2F7/2 834.72 541.91 [17, 26]Xe I 6s [1/2]o
2 (1s2) 834.68 473.41 [27]Xe I 6s [3/2]o
2 (1s5) 823.16 823.16 [27]Kr II 4d 4F7/2 820.27 462.92 [23]Kr II 5d 4D7/2 728.98 473.90 [28]
in vacuum, vk is the velocity parallel to k, ν0 is the studiedtransition unshifted frequency, and ν is the recorded frequency.
3.2. Optical train and detection branch
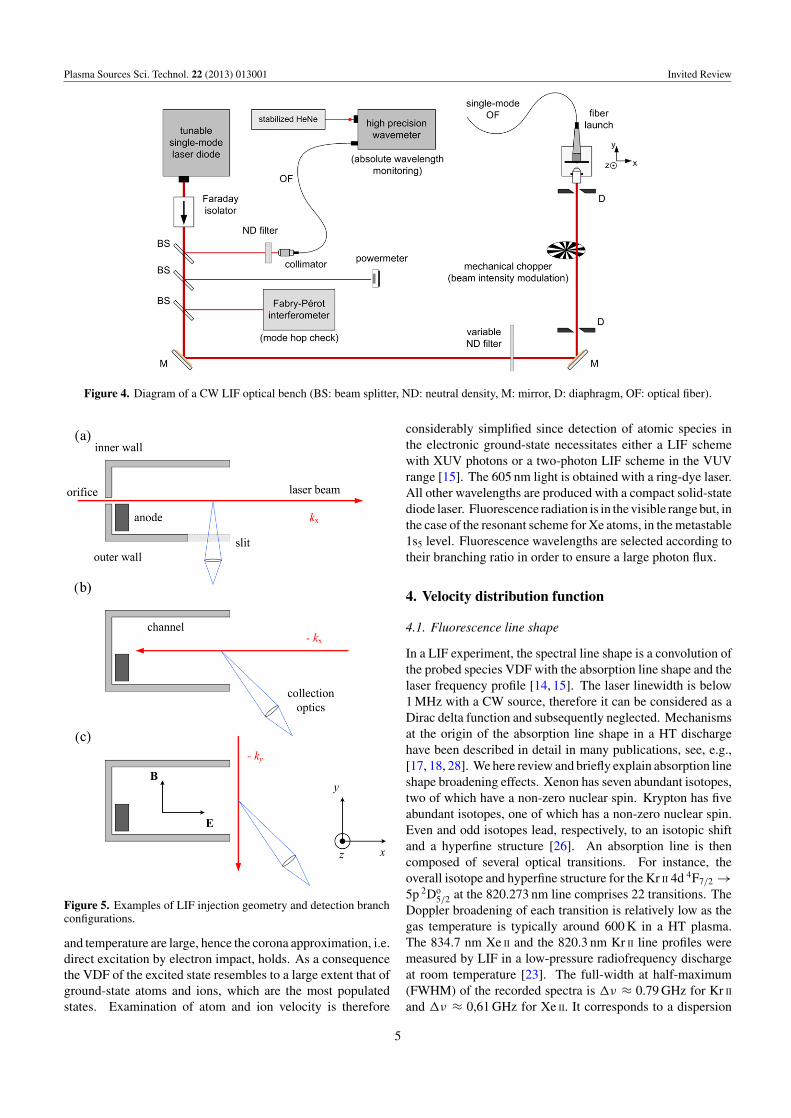
Several configurations of the LIF optical bench used todetermine ion and atom velocity in the channel and plumeof HTs and derived concepts can be found in, e.g., [17–22]. As an example we describe here the optical benchavailable to our team for time-averaged LIF experiments onHT discharges [17, 18, 23]. The laser beam used to excitemetastable and resonant levels of atoms and ions is produced byan amplified tunable single-mode external cavity laser diodethat can deliver up to 700 mW of power in the 810–840 nmspectral domain. The laser remains mode-hop free over afrequency tuning range of more than 10 GHz. The spectralwidth of the laser beam profile is about 1 MHz. Behind thetapered amplifier the laser beam passes through a Faradayisolator to prevent optical feedback into the laser cavity. Thewavelength is accurately measured by means of a calibratedwavemeter whose absolute accuracy is 80 MHz (≈ 60 m s−1).A scanning confocal Fabry–Perot interferometer with a 1 GHzfree spectral range is used to real-time check the quality ofthe laser mode and to detect mode hops. The power of thebeam is also continuously monitored. The primary laser beamis modulated by a mechanical chopper at a frequency ∼1 kHzbefore being coupled into a single-mode optical fiber of 5 µmcore diameter. The fiber allows one to carry the beam into thevacuum chamber. A schematic of the optical bench is shownin figure 4.
As illustrated in figure 5, several laser injection schemesare possible. As the ion acceleration process and the atomflow occur mostly in the direction of the thruster axis, seefigure 3, the axial velocity component is the first component tobe monitored. The laser beam can be shone from the back ofthe channel through a dedicated orifice (figure 5(a)). Anotherpossibility is to shine the laser beam from the front (figure 5(b)).In that case some optical components are introduced into the
ion beam. This option nevertheless allows measurementsat various radial positions [20, 23]. The laser beam canalso propagate in the vertical (y) or horizontal (z) plane toaccess the radial or azimuthal velocity component (figure 5(c)).Naturally, a combination of laser injection geometries ispossible to offer multi-dimensional diagnostics of the HTplasma, e.g. a 2D map (vx, vy) of the velocity [16, 24].There are also various possibilities for the collection optics.The detection branch can be placed perpendicular to the laseraxis. In that case, the interior of the channel can solely beexamined through a slit made in the channel external wall, seefigure 5(a). As shown in figure 5(b), the optics can also beoriented at an oblique angle relative to the laser direction tooffer the possibility to enter the channel. For investigation ofthe PPS�X000-ML and PPS100-ML thruster discharge, thesingle-mode fiber output was located behind the thruster toinject the beam through a small orifice realized in the backof the channel [17, 18]. Power deposition in the measurementvolume must be well controlled. In most experiments, thelaser power density reaches a few mW mm−2, which warrantsa weak saturation effect on the studied transition. A detectionbranch of 40 mm focal length, which focuses the fluorescencelight onto a 200 µm core diameter optical fiber, is mountedonto a travel stage perpendicular to the channel axis. Themagnification ratio is 1, meaning that the spatial resolution is200 µm in the axial direction. A slit several mm in lengthwas made in the channel dielectric outer wall in order tocarry out measurements inside the channel. The collectionsystem allows us in fact to probe the entire accelerationregion. The fluorescent light transported by the 200 µmfiber is focused onto the entrance slit of a 20 cm focal lengthmonochromator that isolates the fluorescence line from the restof the spectrum. A narrow-bandwidth interference filter canbe used instead [23]. A photomultiplier tube (PMT) servesas a light detector. For time-averaged LIF measurements,a lock-in amplifier operating at the chopper frequency isused to discriminate the fluorescence light from the intrinsicplasma emission. Scanning of the laser diode cavity, dataacquisition and laser wavelength monitoring are of coursecomputer controlled.
3.3. Optical transitions
The most common excitation and fluorescence wavelengthsused in LIF studies on HT plasma are shown in table 2. Thelaser wavelength is in the red or the near-infrared spectraldomain as optical pumping starts from a metastable level or theresonant 1s2 level. In a HT discharge, both the electron density
4
Plasma Sources Sci. Technol. 22 (2013) 013001 Invited Review
Figure 4. Diagram of a CW LIF optical bench (BS: beam splitter, ND: neutral density, M: mirror, D: diaphragm, OF: optical fiber).
Figure 5. Examples of LIF injection geometry and detection branchconfigurations.
and temperature are large, hence the corona approximation, i.e.direct excitation by electron impact, holds. As a consequencethe VDF of the excited state resembles to a large extent that ofground-state atoms and ions, which are the most populatedstates. Examination of atom and ion velocity is therefore
considerably simplified since detection of atomic species inthe electronic ground-state necessitates either a LIF schemewith XUV photons or a two-photon LIF scheme in the VUVrange [15]. The 605 nm light is obtained with a ring-dye laser.All other wavelengths are produced with a compact solid-statediode laser. Fluorescence radiation is in the visible range but, inthe case of the resonant scheme for Xe atoms, in the metastable1s5 level. Fluorescence wavelengths are selected according totheir branching ratio in order to ensure a large photon flux.
4. Velocity distribution function
4.1. Fluorescence line shape
In a LIF experiment, the spectral line shape is a convolution ofthe probed species VDF with the absorption line shape and thelaser frequency profile [14, 15]. The laser linewidth is below1 MHz with a CW source, therefore it can be considered as aDirac delta function and subsequently neglected. Mechanismsat the origin of the absorption line shape in a HT dischargehave been described in detail in many publications, see, e.g.,[17, 18, 28]. We here review and briefly explain absorption lineshape broadening effects. Xenon has seven abundant isotopes,two of which have a non-zero nuclear spin. Krypton has fiveabundant isotopes, one of which has a non-zero nuclear spin.Even and odd isotopes lead, respectively, to an isotopic shiftand a hyperfine structure [26]. An absorption line is thencomposed of several optical transitions. For instance, theoverall isotope and hyperfine structure for the Kr II 4d 4F7/2 →5p 2Do
5/2 at the 820.273 nm line comprises 22 transitions. TheDoppler broadening of each transition is relatively low as thegas temperature is typically around 600 K in a HT plasma.The 834.7 nm Xe II and the 820.3 nm Kr II line profiles weremeasured by LIF in a low-pressure radiofrequency dischargeat room temperature [23]. The full-width at half-maximum(FWHM) of the recorded spectra is �ν ≈ 0.79 GHz for Kr II
and �ν ≈ 0,61 GHz for Xe II. It corresponds to a dispersion
5
Plasma Sources Sci. Technol. 22 (2013) 013001 Invited Review
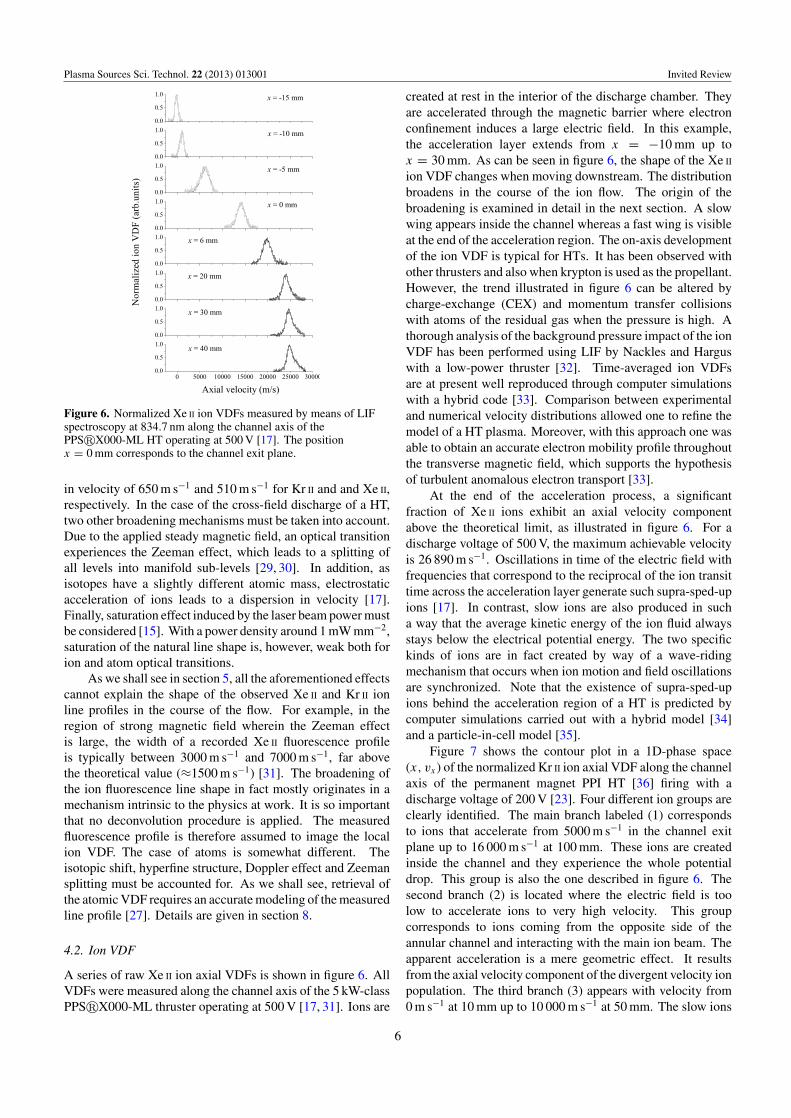
Figure 6. Normalized Xe II ion VDFs measured by means of LIFspectroscopy at 834.7 nm along the channel axis of thePPS�X000-ML HT operating at 500 V [17]. The positionx = 0 mm corresponds to the channel exit plane.
in velocity of 650 m s−1 and 510 m s−1 for Kr II and and Xe II,respectively. In the case of the cross-field discharge of a HT,two other broadening mechanisms must be taken into account.Due to the applied steady magnetic field, an optical transitionexperiences the Zeeman effect, which leads to a splitting ofall levels into manifold sub-levels [29, 30]. In addition, asisotopes have a slightly different atomic mass, electrostaticacceleration of ions leads to a dispersion in velocity [17].Finally, saturation effect induced by the laser beam power mustbe considered [15]. With a power density around 1 mW mm−2,saturation of the natural line shape is, however, weak both forion and atom optical transitions.
As we shall see in section 5, all the aforementioned effectscannot explain the shape of the observed Xe II and Kr II ionline profiles in the course of the flow. For example, in theregion of strong magnetic field wherein the Zeeman effectis large, the width of a recorded Xe II fluorescence profileis typically between 3000 m s−1 and 7000 m s−1, far abovethe theoretical value (≈1500 m s−1) [31]. The broadening ofthe ion fluorescence line shape in fact mostly originates in amechanism intrinsic to the physics at work. It is so importantthat no deconvolution procedure is applied. The measuredfluorescence profile is therefore assumed to image the localion VDF. The case of atoms is somewhat different. Theisotopic shift, hyperfine structure, Doppler effect and Zeemansplitting must be accounted for. As we shall see, retrieval ofthe atomic VDF requires an accurate modeling of the measuredline profile [27]. Details are given in section 8.
4.2. Ion VDF
A series of raw Xe II ion axial VDFs is shown in figure 6. AllVDFs were measured along the channel axis of the 5 kW-classPPS�X000-ML thruster operating at 500 V [17, 31]. Ions are
created at rest in the interior of the discharge chamber. Theyare accelerated through the magnetic barrier where electronconfinement induces a large electric field. In this example,the acceleration layer extends from x = −10 mm up tox = 30 mm. As can be seen in figure 6, the shape of the Xe II
ion VDF changes when moving downstream. The distributionbroadens in the course of the ion flow. The origin of thebroadening is examined in detail in the next section. A slowwing appears inside the channel whereas a fast wing is visibleat the end of the acceleration region. The on-axis developmentof the ion VDF is typical for HTs. It has been observed withother thrusters and also when krypton is used as the propellant.However, the trend illustrated in figure 6 can be altered bycharge-exchange (CEX) and momentum transfer collisionswith atoms of the residual gas when the pressure is high. Athorough analysis of the background pressure impact of the ionVDF has been performed using LIF by Nackles and Harguswith a low-power thruster [32]. Time-averaged ion VDFsare at present well reproduced through computer simulationswith a hybrid code [33]. Comparison between experimentaland numerical velocity distributions allowed one to refine themodel of a HT plasma. Moreover, with this approach one wasable to obtain an accurate electron mobility profile throughoutthe transverse magnetic field, which supports the hypothesisof turbulent anomalous electron transport [33].
At the end of the acceleration process, a significantfraction of Xe II ions exhibit an axial velocity componentabove the theoretical limit, as illustrated in figure 6. For adischarge voltage of 500 V, the maximum achievable velocityis 26 890 m s−1. Oscillations in time of the electric field withfrequencies that correspond to the reciprocal of the ion transittime across the acceleration layer generate such supra-sped-upions [17]. In contrast, slow ions are also produced in sucha way that the average kinetic energy of the ion fluid alwaysstays below the electrical potential energy. The two specifickinds of ions are in fact created by way of a wave-ridingmechanism that occurs when ion motion and field oscillationsare synchronized. Note that the existence of supra-sped-upions behind the acceleration region of a HT is predicted bycomputer simulations carried out with a hybrid model [34]and a particle-in-cell model [35].
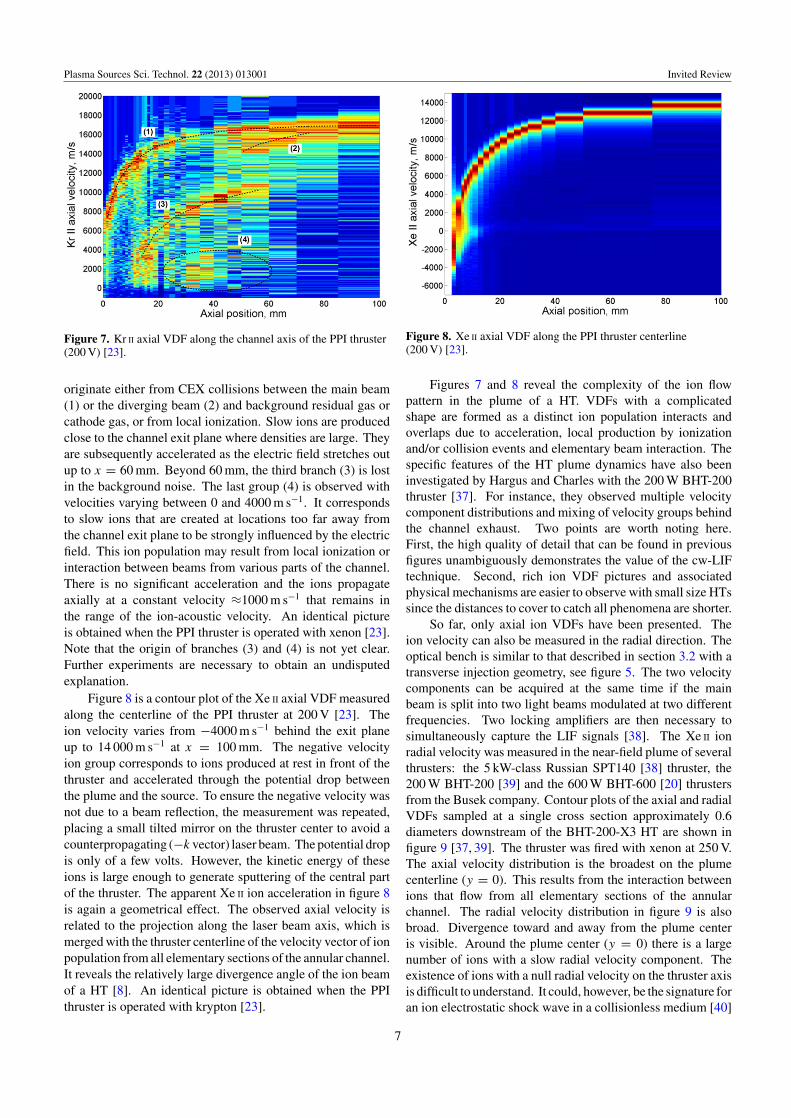
Figure 7 shows the contour plot in a 1D-phase space(x, vx) of the normalized Kr II ion axial VDF along the channelaxis of the permanent magnet PPI HT [36] firing with adischarge voltage of 200 V [23]. Four different ion groups areclearly identified. The main branch labeled (1) correspondsto ions that accelerate from 5000 m s−1 in the channel exitplane up to 16 000 m s−1 at 100 mm. These ions are createdinside the channel and they experience the whole potentialdrop. This group is also the one described in figure 6. Thesecond branch (2) is located where the electric field is toolow to accelerate ions to very high velocity. This groupcorresponds to ions coming from the opposite side of theannular channel and interacting with the main ion beam. Theapparent acceleration is a mere geometric effect. It resultsfrom the axial velocity component of the divergent velocity ionpopulation. The third branch (3) appears with velocity from0 m s−1 at 10 mm up to 10 000 m s−1 at 50 mm. The slow ions
6
Plasma Sources Sci. Technol. 22 (2013) 013001 Invited Review
Figure 7. Kr II axial VDF along the channel axis of the PPI thruster(200 V) [23].
originate either from CEX collisions between the main beam(1) or the diverging beam (2) and background residual gas orcathode gas, or from local ionization. Slow ions are producedclose to the channel exit plane where densities are large. Theyare subsequently accelerated as the electric field stretches outup to x = 60 mm. Beyond 60 mm, the third branch (3) is lostin the background noise. The last group (4) is observed withvelocities varying between 0 and 4000 m s−1. It correspondsto slow ions that are created at locations too far away fromthe channel exit plane to be strongly influenced by the electricfield. This ion population may result from local ionization orinteraction between beams from various parts of the channel.There is no significant acceleration and the ions propagateaxially at a constant velocity ≈1000 m s−1 that remains inthe range of the ion-acoustic velocity. An identical pictureis obtained when the PPI thruster is operated with xenon [23].Note that the origin of branches (3) and (4) is not yet clear.Further experiments are necessary to obtain an undisputedexplanation.
Figure 8 is a contour plot of the Xe II axial VDF measuredalong the centerline of the PPI thruster at 200 V [23]. Theion velocity varies from −4000 m s−1 behind the exit planeup to 14 000 m s−1 at x = 100 mm. The negative velocityion group corresponds to ions produced at rest in front of thethruster and accelerated through the potential drop betweenthe plume and the source. To ensure the negative velocity wasnot due to a beam reflection, the measurement was repeated,placing a small tilted mirror on the thruster center to avoid acounterpropagating (−k vector) laser beam. The potential dropis only of a few volts. However, the kinetic energy of theseions is large enough to generate sputtering of the central partof the thruster. The apparent Xe II ion acceleration in figure 8is again a geometrical effect. The observed axial velocity isrelated to the projection along the laser beam axis, which ismerged with the thruster centerline of the velocity vector of ionpopulation from all elementary sections of the annular channel.It reveals the relatively large divergence angle of the ion beamof a HT [8]. An identical picture is obtained when the PPIthruster is operated with krypton [23].
Figure 8. Xe II axial VDF along the PPI thruster centerline(200 V) [23].
Figures 7 and 8 reveal the complexity of the ion flowpattern in the plume of a HT. VDFs with a complicatedshape are formed as a distinct ion population interacts andoverlaps due to acceleration, local production by ionizationand/or collision events and elementary beam interaction. Thespecific features of the HT plume dynamics have also beeninvestigated by Hargus and Charles with the 200 W BHT-200thruster [37]. For instance, they observed multiple velocitycomponent distributions and mixing of velocity groups behindthe channel exhaust. Two points are worth noting here.First, the high quality of detail that can be found in previousfigures unambiguously demonstrates the value of the cw-LIFtechnique. Second, rich ion VDF pictures and associatedphysical mechanisms are easier to observe with small size HTssince the distances to cover to catch all phenomena are shorter.
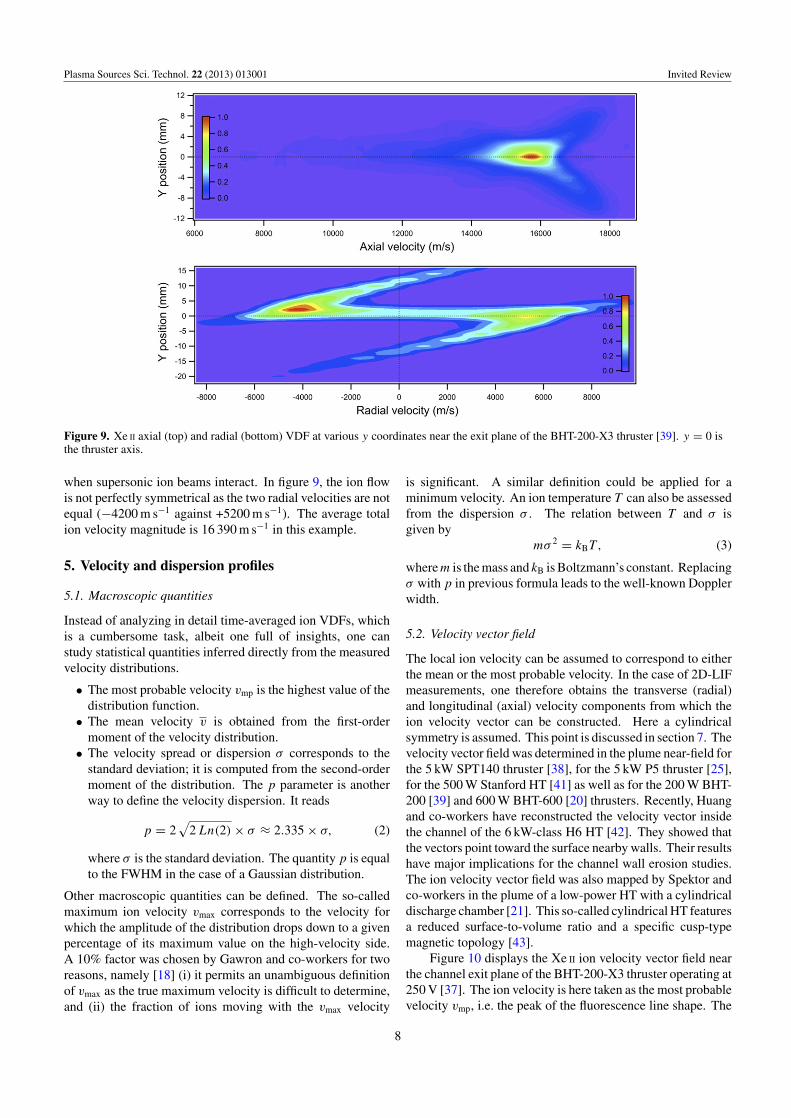
So far, only axial ion VDFs have been presented. Theion velocity can also be measured in the radial direction. Theoptical bench is similar to that described in section 3.2 with atransverse injection geometry, see figure 5. The two velocitycomponents can be acquired at the same time if the mainbeam is split into two light beams modulated at two differentfrequencies. Two locking amplifiers are then necessary tosimultaneously capture the LIF signals [38]. The Xe II ionradial velocity was measured in the near-field plume of severalthrusters: the 5 kW-class Russian SPT140 [38] thruster, the200 W BHT-200 [39] and the 600 W BHT-600 [20] thrustersfrom the Busek company. Contour plots of the axial and radialVDFs sampled at a single cross section approximately 0.6diameters downstream of the BHT-200-X3 HT are shown infigure 9 [37, 39]. The thruster was fired with xenon at 250 V.The axial velocity distribution is the broadest on the plumecenterline (y = 0). This results from the interaction betweenions that flow from all elementary sections of the annularchannel. The radial velocity distribution in figure 9 is alsobroad. Divergence toward and away from the plume centeris visible. Around the plume center (y = 0) there is a largenumber of ions with a slow radial velocity component. Theexistence of ions with a null radial velocity on the thruster axisis difficult to understand. It could, however, be the signature foran ion electrostatic shock wave in a collisionless medium [40]
7
Plasma Sources Sci. Technol. 22 (2013) 013001 Invited Review
Figure 9. Xe II axial (top) and radial (bottom) VDF at various y coordinates near the exit plane of the BHT-200-X3 thruster [39]. y = 0 isthe thruster axis.
when supersonic ion beams interact. In figure 9, the ion flowis not perfectly symmetrical as the two radial velocities are notequal (−4200 m s−1 against +5200 m s−1). The average totalion velocity magnitude is 16 390 m s−1 in this example.
5. Velocity and dispersion profiles
5.1. Macroscopic quantities
Instead of analyzing in detail time-averaged ion VDFs, whichis a cumbersome task, albeit one full of insights, one canstudy statistical quantities inferred directly from the measuredvelocity distributions.
• The most probable velocity vmp is the highest value of thedistribution function.
• The mean velocity v is obtained from the first-ordermoment of the velocity distribution.
• The velocity spread or dispersion σ corresponds to thestandard deviation; it is computed from the second-ordermoment of the distribution. The p parameter is anotherway to define the velocity dispersion. It reads
p = 2√
2 Ln(2) × σ ≈ 2.335 × σ, (2)
where σ is the standard deviation. The quantity p is equalto the FWHM in the case of a Gaussian distribution.
Other macroscopic quantities can be defined. The so-calledmaximum ion velocity vmax corresponds to the velocity forwhich the amplitude of the distribution drops down to a givenpercentage of its maximum value on the high-velocity side.A 10% factor was chosen by Gawron and co-workers for tworeasons, namely [18] (i) it permits an unambiguous definitionof vmax as the true maximum velocity is difficult to determine,and (ii) the fraction of ions moving with the vmax velocity
is significant. A similar definition could be applied for aminimum velocity. An ion temperature T can also be assessedfrom the dispersion σ . The relation between T and σ isgiven by
mσ 2 = kBT , (3)
where m is the mass and kB is Boltzmann’s constant. Replacingσ with p in previous formula leads to the well-known Dopplerwidth.
5.2. Velocity vector field
The local ion velocity can be assumed to correspond to eitherthe mean or the most probable velocity. In the case of 2D-LIFmeasurements, one therefore obtains the transverse (radial)and longitudinal (axial) velocity components from which theion velocity vector can be constructed. Here a cylindricalsymmetry is assumed. This point is discussed in section 7. Thevelocity vector field was determined in the plume near-field forthe 5 kW SPT140 thruster [38], for the 5 kW P5 thruster [25],for the 500 W Stanford HT [41] as well as for the 200 W BHT-200 [39] and 600 W BHT-600 [20] thrusters. Recently, Huangand co-workers have reconstructed the velocity vector insidethe channel of the 6 kW-class H6 HT [42]. They showed thatthe vectors point toward the surface nearby walls. Their resultshave major implications for the channel wall erosion studies.The ion velocity vector field was also mapped by Spektor andco-workers in the plume of a low-power HT with a cylindricaldischarge chamber [21]. This so-called cylindrical HT featuresa reduced surface-to-volume ratio and a specific cusp-typemagnetic topology [43].
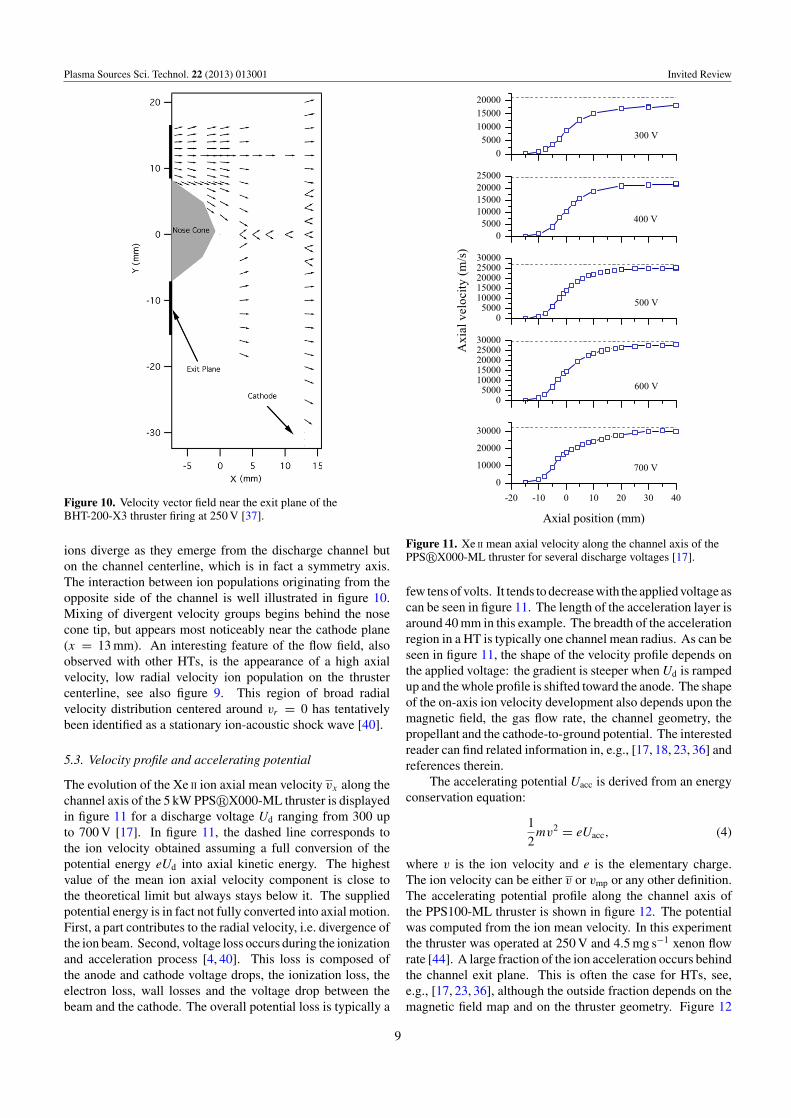
Figure 10 displays the Xe II ion velocity vector field nearthe channel exit plane of the BHT-200-X3 thruster operating at250 V [37]. The ion velocity is here taken as the most probablevelocity vmp, i.e. the peak of the fluorescence line shape. The
8
Plasma Sources Sci. Technol. 22 (2013) 013001 Invited Review
Figure 10. Velocity vector field near the exit plane of theBHT-200-X3 thruster firing at 250 V [37].
ions diverge as they emerge from the discharge channel buton the channel centerline, which is in fact a symmetry axis.The interaction between ion populations originating from theopposite side of the channel is well illustrated in figure 10.Mixing of divergent velocity groups begins behind the nosecone tip, but appears most noticeably near the cathode plane(x = 13 mm). An interesting feature of the flow field, alsoobserved with other HTs, is the appearance of a high axialvelocity, low radial velocity ion population on the thrustercenterline, see also figure 9. This region of broad radialvelocity distribution centered around vr = 0 has tentativelybeen identified as a stationary ion-acoustic shock wave [40].
5.3. Velocity profile and accelerating potential
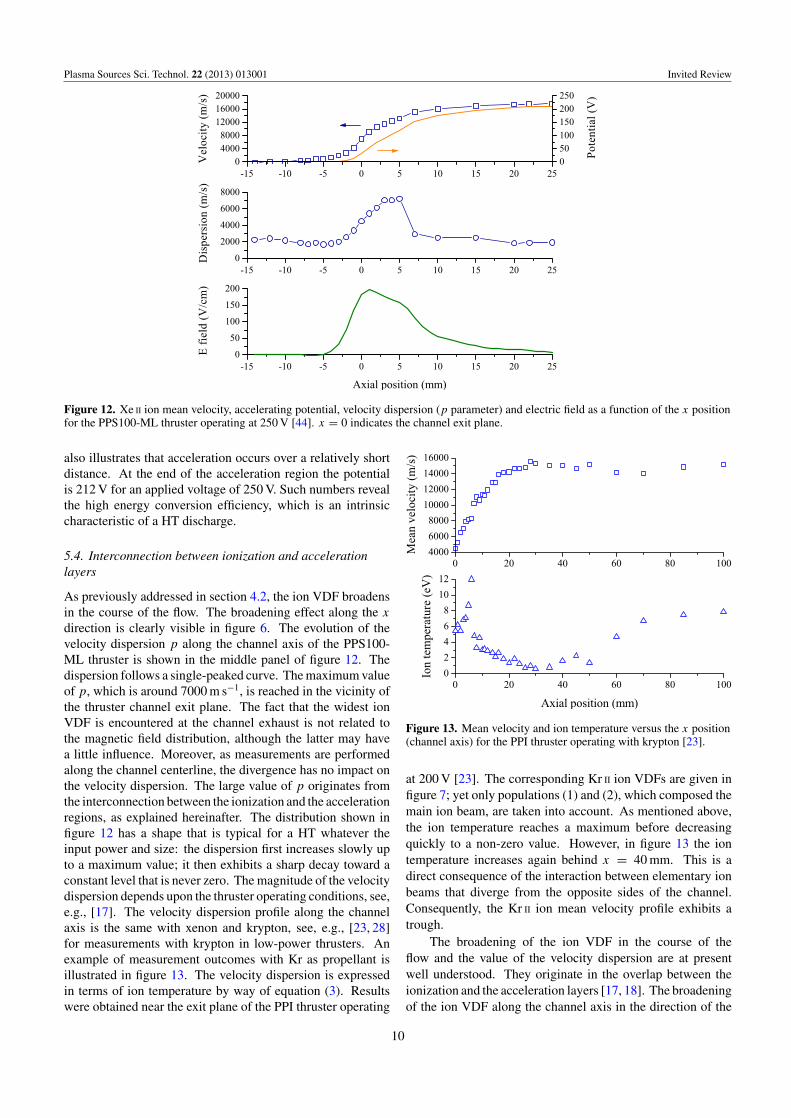
The evolution of the Xe II ion axial mean velocity vx along thechannel axis of the 5 kW PPS�X000-ML thruster is displayedin figure 11 for a discharge voltage Ud ranging from 300 upto 700 V [17]. In figure 11, the dashed line corresponds tothe ion velocity obtained assuming a full conversion of thepotential energy eUd into axial kinetic energy. The highestvalue of the mean ion axial velocity component is close tothe theoretical limit but always stays below it. The suppliedpotential energy is in fact not fully converted into axial motion.First, a part contributes to the radial velocity, i.e. divergence ofthe ion beam. Second, voltage loss occurs during the ionizationand acceleration process [4, 40]. This loss is composed ofthe anode and cathode voltage drops, the ionization loss, theelectron loss, wall losses and the voltage drop between thebeam and the cathode. The overall potential loss is typically a
Figure 11. Xe II mean axial velocity along the channel axis of thePPS�X000-ML thruster for several discharge voltages [17].
few tens of volts. It tends to decrease with the applied voltage ascan be seen in figure 11. The length of the acceleration layer isaround 40 mm in this example. The breadth of the accelerationregion in a HT is typically one channel mean radius. As can beseen in figure 11, the shape of the velocity profile depends onthe applied voltage: the gradient is steeper when Ud is rampedup and the whole profile is shifted toward the anode. The shapeof the on-axis ion velocity development also depends upon themagnetic field, the gas flow rate, the channel geometry, thepropellant and the cathode-to-ground potential. The interestedreader can find related information in, e.g., [17, 18, 23, 36] andreferences therein.
The accelerating potential Uacc is derived from an energyconservation equation:
1
2mv2 = eUacc, (4)
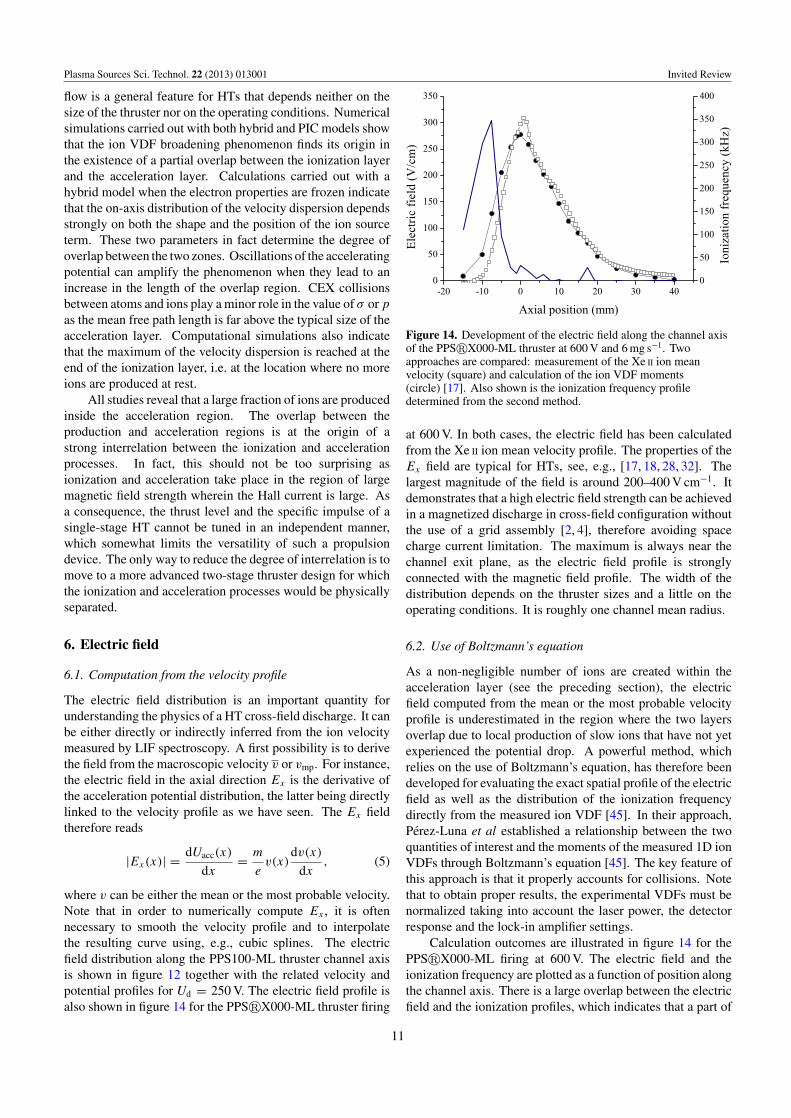
where v is the ion velocity and e is the elementary charge.The ion velocity can be either v or vmp or any other definition.The accelerating potential profile along the channel axis ofthe PPS100-ML thruster is shown in figure 12. The potentialwas computed from the ion mean velocity. In this experimentthe thruster was operated at 250 V and 4.5 mg s−1 xenon flowrate [44]. A large fraction of the ion acceleration occurs behindthe channel exit plane. This is often the case for HTs, see,e.g., [17, 23, 36], although the outside fraction depends on themagnetic field map and on the thruster geometry. Figure 12
9
Plasma Sources Sci. Technol. 22 (2013) 013001 Invited Review
Figure 12. Xe II ion mean velocity, accelerating potential, velocity dispersion (p parameter) and electric field as a function of the x positionfor the PPS100-ML thruster operating at 250 V [44]. x = 0 indicates the channel exit plane.
also illustrates that acceleration occurs over a relatively shortdistance. At the end of the acceleration region the potentialis 212 V for an applied voltage of 250 V. Such numbers revealthe high energy conversion efficiency, which is an intrinsiccharacteristic of a HT discharge.
5.4. Interconnection between ionization and accelerationlayers
As previously addressed in section 4.2, the ion VDF broadensin the course of the flow. The broadening effect along the x
direction is clearly visible in figure 6. The evolution of thevelocity dispersion p along the channel axis of the PPS100-ML thruster is shown in the middle panel of figure 12. Thedispersion follows a single-peaked curve. The maximum valueof p, which is around 7000 m s−1, is reached in the vicinity ofthe thruster channel exit plane. The fact that the widest ionVDF is encountered at the channel exhaust is not related tothe magnetic field distribution, although the latter may havea little influence. Moreover, as measurements are performedalong the channel centerline, the divergence has no impact onthe velocity dispersion. The large value of p originates fromthe interconnection between the ionization and the accelerationregions, as explained hereinafter. The distribution shown infigure 12 has a shape that is typical for a HT whatever theinput power and size: the dispersion first increases slowly upto a maximum value; it then exhibits a sharp decay toward aconstant level that is never zero. The magnitude of the velocitydispersion depends upon the thruster operating conditions, see,e.g., [17]. The velocity dispersion profile along the channelaxis is the same with xenon and krypton, see, e.g., [23, 28]for measurements with krypton in low-power thrusters. Anexample of measurement outcomes with Kr as propellant isillustrated in figure 13. The velocity dispersion is expressedin terms of ion temperature by way of equation (3). Resultswere obtained near the exit plane of the PPI thruster operating
Figure 13. Mean velocity and ion temperature versus the x position(channel axis) for the PPI thruster operating with krypton [23].
at 200 V [23]. The corresponding Kr II ion VDFs are given infigure 7; yet only populations (1) and (2), which composed themain ion beam, are taken into account. As mentioned above,the ion temperature reaches a maximum before decreasingquickly to a non-zero value. However, in figure 13 the iontemperature increases again behind x = 40 mm. This is adirect consequence of the interaction between elementary ionbeams that diverge from the opposite sides of the channel.Consequently, the Kr II ion mean velocity profile exhibits atrough.
The broadening of the ion VDF in the course of theflow and the value of the velocity dispersion are at presentwell understood. They originate in the overlap between theionization and the acceleration layers [17, 18]. The broadeningof the ion VDF along the channel axis in the direction of the
10
Plasma Sources Sci. Technol. 22 (2013) 013001 Invited Review
flow is a general feature for HTs that depends neither on thesize of the thruster nor on the operating conditions. Numericalsimulations carried out with both hybrid and PIC models showthat the ion VDF broadening phenomenon finds its origin inthe existence of a partial overlap between the ionization layerand the acceleration layer. Calculations carried out with ahybrid model when the electron properties are frozen indicatethat the on-axis distribution of the velocity dispersion dependsstrongly on both the shape and the position of the ion sourceterm. These two parameters in fact determine the degree ofoverlap between the two zones. Oscillations of the acceleratingpotential can amplify the phenomenon when they lead to anincrease in the length of the overlap region. CEX collisionsbetween atoms and ions play a minor role in the value of σ or p
as the mean free path length is far above the typical size of theacceleration layer. Computational simulations also indicatethat the maximum of the velocity dispersion is reached at theend of the ionization layer, i.e. at the location where no moreions are produced at rest.
All studies reveal that a large fraction of ions are producedinside the acceleration region. The overlap between theproduction and acceleration regions is at the origin of astrong interrelation between the ionization and accelerationprocesses. In fact, this should not be too surprising asionization and acceleration take place in the region of largemagnetic field strength wherein the Hall current is large. Asa consequence, the thrust level and the specific impulse of asingle-stage HT cannot be tuned in an independent manner,which somewhat limits the versatility of such a propulsiondevice. The only way to reduce the degree of interrelation is tomove to a more advanced two-stage thruster design for whichthe ionization and acceleration processes would be physicallyseparated.
6. Electric field
6.1. Computation from the velocity profile
The electric field distribution is an important quantity forunderstanding the physics of a HT cross-field discharge. It canbe either directly or indirectly inferred from the ion velocitymeasured by LIF spectroscopy. A first possibility is to derivethe field from the macroscopic velocity v or vmp. For instance,the electric field in the axial direction Ex is the derivative ofthe acceleration potential distribution, the latter being directlylinked to the velocity profile as we have seen. The Ex fieldtherefore reads
|Ex(x)| = dUacc(x)
dx= m
ev(x)
dv(x)
dx, (5)
where v can be either the mean or the most probable velocity.Note that in order to numerically compute Ex , it is oftennecessary to smooth the velocity profile and to interpolatethe resulting curve using, e.g., cubic splines. The electricfield distribution along the PPS100-ML thruster channel axisis shown in figure 12 together with the related velocity andpotential profiles for Ud = 250 V. The electric field profile isalso shown in figure 14 for the PPS�X000-ML thruster firing
Figure 14. Development of the electric field along the channel axisof the PPS�X000-ML thruster at 600 V and 6 mg s−1. Twoapproaches are compared: measurement of the Xe II ion meanvelocity (square) and calculation of the ion VDF moments(circle) [17]. Also shown is the ionization frequency profiledetermined from the second method.
at 600 V. In both cases, the electric field has been calculatedfrom the Xe II ion mean velocity profile. The properties of theEx field are typical for HTs, see, e.g., [17, 18, 28, 32]. Thelargest magnitude of the field is around 200–400 V cm−1. Itdemonstrates that a high electric field strength can be achievedin a magnetized discharge in cross-field configuration withoutthe use of a grid assembly [2, 4], therefore avoiding spacecharge current limitation. The maximum is always near thechannel exit plane, as the electric field profile is stronglyconnected with the magnetic field profile. The width of thedistribution depends on the thruster sizes and a little on theoperating conditions. It is roughly one channel mean radius.
6.2. Use of Boltzmann’s equation
As a non-negligible number of ions are created within theacceleration layer (see the preceding section), the electricfield computed from the mean or the most probable velocityprofile is underestimated in the region where the two layersoverlap due to local production of slow ions that have not yetexperienced the potential drop. A powerful method, whichrelies on the use of Boltzmann’s equation, has therefore beendeveloped for evaluating the exact spatial profile of the electricfield as well as the distribution of the ionization frequencydirectly from the measured ion VDF [45]. In their approach,Perez-Luna et al established a relationship between the twoquantities of interest and the moments of the measured 1D ionVDFs through Boltzmann’s equation [45]. The key feature ofthis approach is that it properly accounts for collisions. Notethat to obtain proper results, the experimental VDFs must benormalized taking into account the laser power, the detectorresponse and the lock-in amplifier settings.
Calculation outcomes are illustrated in figure 14 for thePPS�X000-ML firing at 600 V. The electric field and theionization frequency are plotted as a function of position alongthe channel axis. There is a large overlap between the electricfield and the ionization profiles, which indicates that a part of
11
Plasma Sources Sci. Technol. 22 (2013) 013001 Invited Review
the ionization process occurs in the region of strong electricfield, as previously discussed. Of course, the distribution ofEx computed from the VDF moments is not far from the oneinferred from the mean axial velocity profile. However, as theionization process is accounted for in the Boltzmann method,the effect of ions created at the beginning of the accelerationlayer is withdrawn. Figure 14 clearly indicates that the electricfield is underestimated in the ionization layer when the meanor the most probable velocity is used for the calculation.
The method based on the velocity moments ofBoltzmann’s equation was later extended to the 2D case bySpektor, see [46]. It is therefore possible to compute the realelectric field vector distribution from 2D LIF measurementsof both the axial and the radial ion velocity components.Applying the 2D method on a cylindrical HT plasma, Spektorwas for example able to show the critical role of the pressuretensor on the 2D electric field computation in regions wheredensities are large [21, 46].
7. Ion azimuthal velocity
7.1. Ion fluid rotation
In the crossed-field discharge of a HT, ions are commonlyassumed to be unmagnetized, in contrast to the electrons whichare highly confined. In fact, the Larmor radius of ions reachesseveral tens of centimetres whereas it is ∼1 mm for electronswith a 200 G magnetic field. Therefore, electrons undergo afast E×B drift in the azimuthal direction, which forms the so-called Hall current. By contrast, ions never achieve a completerotation along the channel circumference. However, under theinfluence of a vaxial ×B Lorentz force, ions can be azimuthallydeflected from a purely axial trajectory. This is a crucial pointfor the thruster operation since it can affect the thrust vectordirection and apply a torque to the satellite.
The first attempt to measure the azimuthal velocity ofXe II ions was made by Manzella in 1994 with a 1.5 kW-classSPT-100 thruster [47]. The azimuthal velocity was foundto be around 250 m s−1 and the torque was 5 × 10⁻³ N cm.More recently, Hargus and co-workers used a LIF techniqueto study the evolution of the ion rotation velocity in a 600 WHT operating at 300 V [37]. An azimuthal velocity around500 m s−1 was measured at the channel outlet. Interestingly,Hargus et al found a small gap in the ion azimuthal velocitiesbetween the two opposite sides of the channel, but the origin ofthe asymmetry was not discussed in their paper. The torque wasestimated to be 3 × 10⁻³ N cm, close to the value obtained byManzella. As we shall see in the next two paragraphs, the ionfluid rotation in a HT plasma is in fact more complicated thanexpected: the azimuthal drift is asymmetrical and the velocitydoes not solely depend on the magnetic field.
7.2. Sign convention
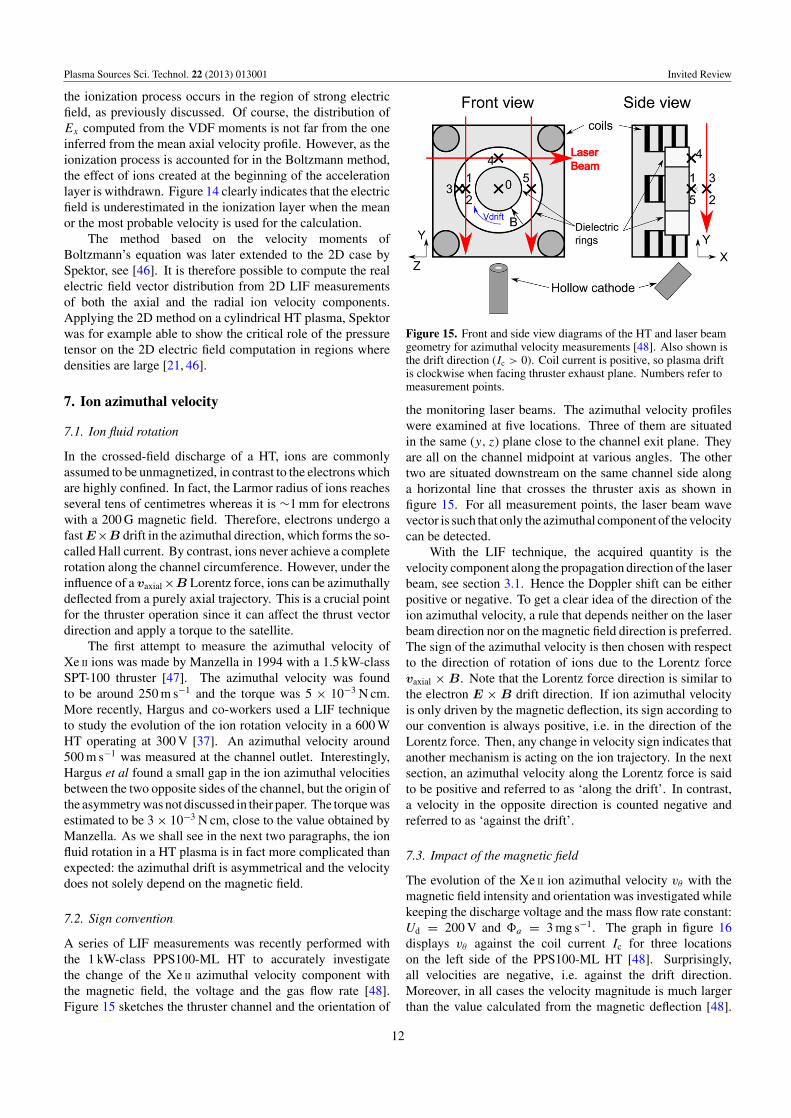
A series of LIF measurements was recently performed withthe 1 kW-class PPS100-ML HT to accurately investigatethe change of the Xe II azimuthal velocity component withthe magnetic field, the voltage and the gas flow rate [48].Figure 15 sketches the thruster channel and the orientation of
Figure 15. Front and side view diagrams of the HT and laser beamgeometry for azimuthal velocity measurements [48]. Also shown isthe drift direction (Ic > 0). Coil current is positive, so plasma driftis clockwise when facing thruster exhaust plane. Numbers refer tomeasurement points.
the monitoring laser beams. The azimuthal velocity profileswere examined at five locations. Three of them are situatedin the same (y, z) plane close to the channel exit plane. Theyare all on the channel midpoint at various angles. The othertwo are situated downstream on the same channel side alonga horizontal line that crosses the thruster axis as shown infigure 15. For all measurement points, the laser beam wavevector is such that only the azimuthal component of the velocitycan be detected.
With the LIF technique, the acquired quantity is thevelocity component along the propagation direction of the laserbeam, see section 3.1. Hence the Doppler shift can be eitherpositive or negative. To get a clear idea of the direction of theion azimuthal velocity, a rule that depends neither on the laserbeam direction nor on the magnetic field direction is preferred.The sign of the azimuthal velocity is then chosen with respectto the direction of rotation of ions due to the Lorentz forcevaxial × B. Note that the Lorentz force direction is similar tothe electron E × B drift direction. If ion azimuthal velocityis only driven by the magnetic deflection, its sign according toour convention is always positive, i.e. in the direction of theLorentz force. Then, any change in velocity sign indicates thatanother mechanism is acting on the ion trajectory. In the nextsection, an azimuthal velocity along the Lorentz force is saidto be positive and referred to as ‘along the drift’. In contrast,a velocity in the opposite direction is counted negative andreferred to as ‘against the drift’.
7.3. Impact of the magnetic field
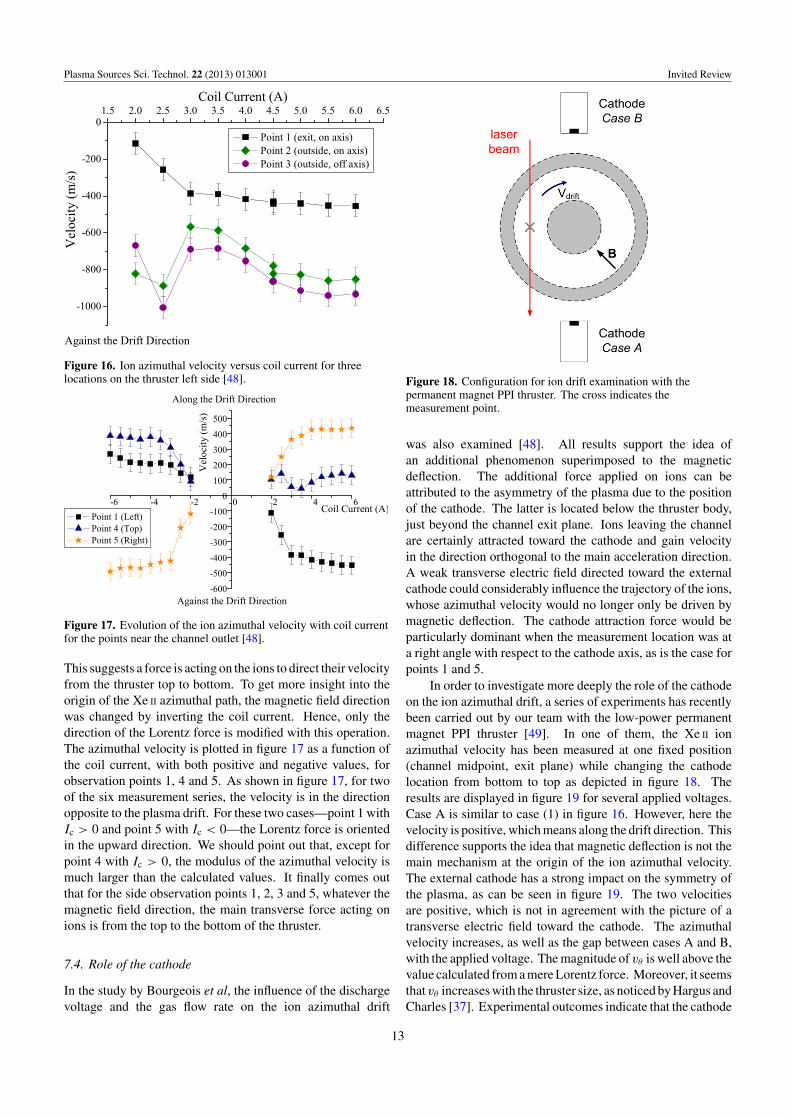
The evolution of the Xe II ion azimuthal velocity vθ with themagnetic field intensity and orientation was investigated whilekeeping the discharge voltage and the mass flow rate constant:Ud = 200 V and a = 3 mg s−1. The graph in figure 16displays vθ against the coil current Ic for three locationson the left side of the PPS100-ML HT [48]. Surprisingly,all velocities are negative, i.e. against the drift direction.Moreover, in all cases the velocity magnitude is much largerthan the value calculated from the magnetic deflection [48].
12
Plasma Sources Sci. Technol. 22 (2013) 013001 Invited Review
Figure 16. Ion azimuthal velocity versus coil current for threelocations on the thruster left side [48].
Figure 17. Evolution of the ion azimuthal velocity with coil currentfor the points near the channel outlet [48].
This suggests a force is acting on the ions to direct their velocityfrom the thruster top to bottom. To get more insight into theorigin of the Xe II azimuthal path, the magnetic field directionwas changed by inverting the coil current. Hence, only thedirection of the Lorentz force is modified with this operation.The azimuthal velocity is plotted in figure 17 as a function ofthe coil current, with both positive and negative values, forobservation points 1, 4 and 5. As shown in figure 17, for twoof the six measurement series, the velocity is in the directionopposite to the plasma drift. For these two cases—point 1 withIc > 0 and point 5 with Ic < 0—the Lorentz force is orientedin the upward direction. We should point out that, except forpoint 4 with Ic > 0, the modulus of the azimuthal velocity ismuch larger than the calculated values. It finally comes outthat for the side observation points 1, 2, 3 and 5, whatever themagnetic field direction, the main transverse force acting onions is from the top to the bottom of the thruster.
7.4. Role of the cathode
In the study by Bourgeois et al, the influence of the dischargevoltage and the gas flow rate on the ion azimuthal drift
Figure 18. Configuration for ion drift examination with thepermanent magnet PPI thruster. The cross indicates themeasurement point.
was also examined [48]. All results support the idea ofan additional phenomenon superimposed to the magneticdeflection. The additional force applied on ions can beattributed to the asymmetry of the plasma due to the positionof the cathode. The latter is located below the thruster body,just beyond the channel exit plane. Ions leaving the channelare certainly attracted toward the cathode and gain velocityin the direction orthogonal to the main acceleration direction.A weak transverse electric field directed toward the externalcathode could considerably influence the trajectory of the ions,whose azimuthal velocity would no longer only be driven bymagnetic deflection. The cathode attraction force would beparticularly dominant when the measurement location was ata right angle with respect to the cathode axis, as is the case forpoints 1 and 5.
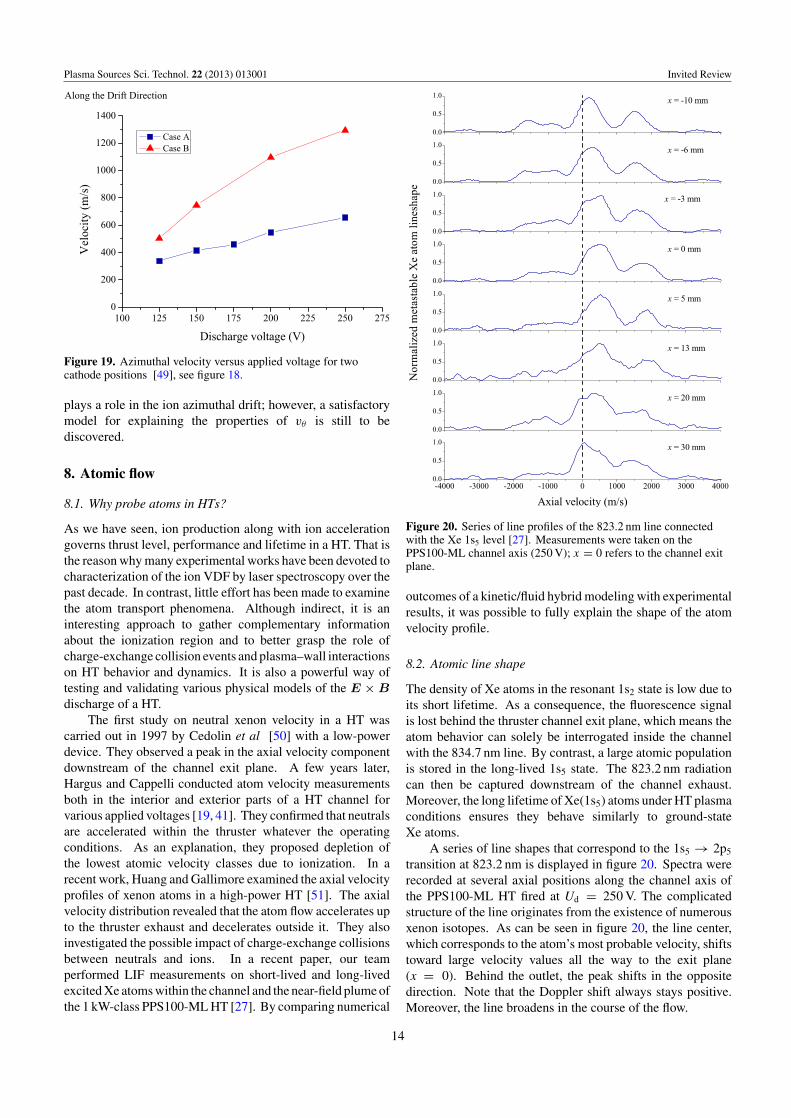
In order to investigate more deeply the role of the cathodeon the ion azimuthal drift, a series of experiments has recentlybeen carried out by our team with the low-power permanentmagnet PPI thruster [49]. In one of them, the Xe II ionazimuthal velocity has been measured at one fixed position(channel midpoint, exit plane) while changing the cathodelocation from bottom to top as depicted in figure 18. Theresults are displayed in figure 19 for several applied voltages.Case A is similar to case (1) in figure 16. However, here thevelocity is positive, which means along the drift direction. Thisdifference supports the idea that magnetic deflection is not themain mechanism at the origin of the ion azimuthal velocity.The external cathode has a strong impact on the symmetry ofthe plasma, as can be seen in figure 19. The two velocitiesare positive, which is not in agreement with the picture of atransverse electric field toward the cathode. The azimuthalvelocity increases, as well as the gap between cases A and B,with the applied voltage. The magnitude of vθ is well above thevalue calculated from a mere Lorentz force. Moreover, it seemsthatvθ increases with the thruster size, as noticed by Hargus andCharles [37]. Experimental outcomes indicate that the cathode
13
Plasma Sources Sci. Technol. 22 (2013) 013001 Invited Review
Figure 19. Azimuthal velocity versus applied voltage for twocathode positions [49], see figure 18.
plays a role in the ion azimuthal drift; however, a satisfactorymodel for explaining the properties of vθ is still to bediscovered.
8. Atomic flow
8.1. Why probe atoms in HTs?
As we have seen, ion production along with ion accelerationgoverns thrust level, performance and lifetime in a HT. That isthe reason why many experimental works have been devoted tocharacterization of the ion VDF by laser spectroscopy over thepast decade. In contrast, little effort has been made to examinethe atom transport phenomena. Although indirect, it is aninteresting approach to gather complementary informationabout the ionization region and to better grasp the role ofcharge-exchange collision events and plasma–wall interactionson HT behavior and dynamics. It is also a powerful way oftesting and validating various physical models of the E × B
discharge of a HT.The first study on neutral xenon velocity in a HT was
carried out in 1997 by Cedolin et al [50] with a low-powerdevice. They observed a peak in the axial velocity componentdownstream of the channel exit plane. A few years later,Hargus and Cappelli conducted atom velocity measurementsboth in the interior and exterior parts of a HT channel forvarious applied voltages [19, 41]. They confirmed that neutralsare accelerated within the thruster whatever the operatingconditions. As an explanation, they proposed depletion ofthe lowest atomic velocity classes due to ionization. In arecent work, Huang and Gallimore examined the axial velocityprofiles of xenon atoms in a high-power HT [51]. The axialvelocity distribution revealed that the atom flow accelerates upto the thruster exhaust and decelerates outside it. They alsoinvestigated the possible impact of charge-exchange collisionsbetween neutrals and ions. In a recent paper, our teamperformed LIF measurements on short-lived and long-livedexcited Xe atoms within the channel and the near-field plume ofthe 1 kW-class PPS100-ML HT [27]. By comparing numerical
Figure 20. Series of line profiles of the 823.2 nm line connectedwith the Xe 1s5 level [27]. Measurements were taken on thePPS100-ML channel axis (250 V); x = 0 refers to the channel exitplane.
outcomes of a kinetic/fluid hybrid modeling with experimentalresults, it was possible to fully explain the shape of the atomvelocity profile.
8.2. Atomic line shape
The density of Xe atoms in the resonant 1s2 state is low due toits short lifetime. As a consequence, the fluorescence signalis lost behind the thruster channel exit plane, which means theatom behavior can solely be interrogated inside the channelwith the 834.7 nm line. By contrast, a large atomic populationis stored in the long-lived 1s5 state. The 823.2 nm radiationcan then be captured downstream of the channel exhaust.Moreover, the long lifetime of Xe(1s5) atoms under HT plasmaconditions ensures they behave similarly to ground-stateXe atoms.
A series of line shapes that correspond to the 1s5 → 2p5
transition at 823.2 nm is displayed in figure 20. Spectra wererecorded at several axial positions along the channel axis ofthe PPS100-ML HT fired at Ud = 250 V. The complicatedstructure of the line originates from the existence of numerousxenon isotopes. As can be seen in figure 20, the line center,which corresponds to the atom’s most probable velocity, shiftstoward large velocity values all the way to the exit plane(x = 0). Behind the outlet, the peak shifts in the oppositedirection. Note that the Doppler shift always stays positive.Moreover, the line broadens in the course of the flow.
14
Plasma Sources Sci. Technol. 22 (2013) 013001 Invited Review
Figure 21. Experimental (squares) and computed (line) lineshapefor the 823.2 nm transition at two locations along the PPS100-MLchannel axis (250 V) [27].
8.3. Line shape modeling
For the two xenon atom excited states, see section 3.3, the mostprobable velocity is given by the Doppler shift of the line center.In order to extract a larger amount of information from themeasured spectra, the line profile has to be reconstructed takinginto account the isotopic and hyperfine structures, Zeemansplitting [30], Doppler broadening and the power saturationeffect. More information about the modeling procedure can befound in [27]. For the interested reader, additional informationabout the deconvolution of fluorescence spectra can be foundin [30, 52, 53].
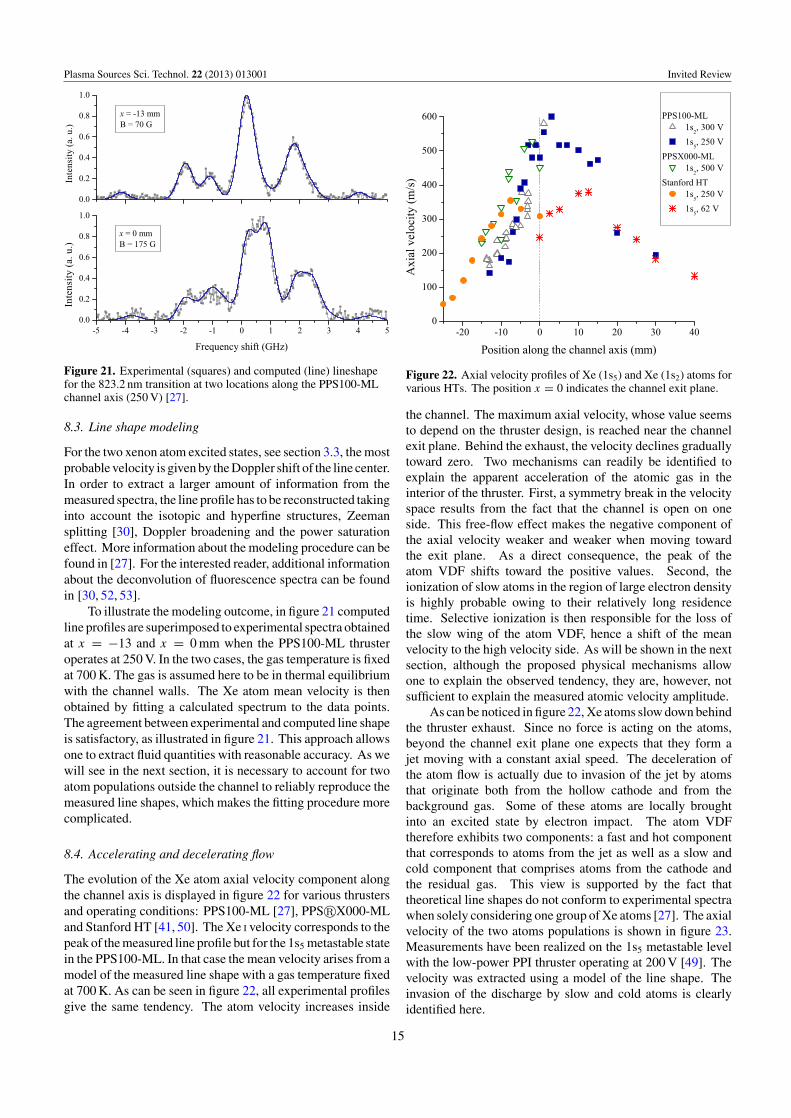
To illustrate the modeling outcome, in figure 21 computedline profiles are superimposed to experimental spectra obtainedat x = −13 and x = 0 mm when the PPS100-ML thrusteroperates at 250 V. In the two cases, the gas temperature is fixedat 700 K. The gas is assumed here to be in thermal equilibriumwith the channel walls. The Xe atom mean velocity is thenobtained by fitting a calculated spectrum to the data points.The agreement between experimental and computed line shapeis satisfactory, as illustrated in figure 21. This approach allowsone to extract fluid quantities with reasonable accuracy. As wewill see in the next section, it is necessary to account for twoatom populations outside the channel to reliably reproduce themeasured line shapes, which makes the fitting procedure morecomplicated.
8.4. Accelerating and decelerating flow
The evolution of the Xe atom axial velocity component alongthe channel axis is displayed in figure 22 for various thrustersand operating conditions: PPS100-ML [27], PPS�X000-MLand Stanford HT [41, 50]. The Xe I velocity corresponds to thepeak of the measured line profile but for the 1s5 metastable statein the PPS100-ML. In that case the mean velocity arises from amodel of the measured line shape with a gas temperature fixedat 700 K. As can be seen in figure 22, all experimental profilesgive the same tendency. The atom velocity increases inside
Figure 22. Axial velocity profiles of Xe (1s5) and Xe (1s2) atoms forvarious HTs. The position x = 0 indicates the channel exit plane.
the channel. The maximum axial velocity, whose value seemsto depend on the thruster design, is reached near the channelexit plane. Behind the exhaust, the velocity declines graduallytoward zero. Two mechanisms can readily be identified toexplain the apparent acceleration of the atomic gas in theinterior of the thruster. First, a symmetry break in the velocityspace results from the fact that the channel is open on oneside. This free-flow effect makes the negative component ofthe axial velocity weaker and weaker when moving towardthe exit plane. As a direct consequence, the peak of theatom VDF shifts toward the positive values. Second, theionization of slow atoms in the region of large electron densityis highly probable owing to their relatively long residencetime. Selective ionization is then responsible for the loss ofthe slow wing of the atom VDF, hence a shift of the meanvelocity to the high velocity side. As will be shown in the nextsection, although the proposed physical mechanisms allowone to explain the observed tendency, they are, however, notsufficient to explain the measured atomic velocity amplitude.
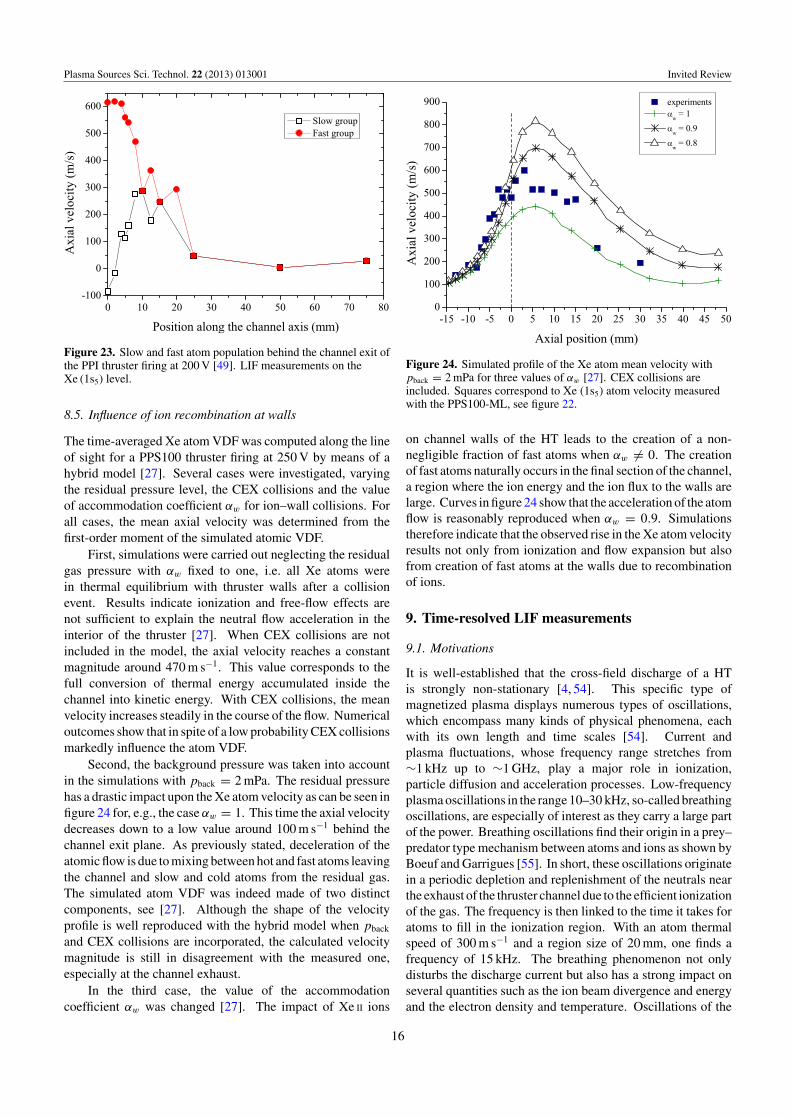
As can be noticed in figure 22, Xe atoms slow down behindthe thruster exhaust. Since no force is acting on the atoms,beyond the channel exit plane one expects that they form ajet moving with a constant axial speed. The deceleration ofthe atom flow is actually due to invasion of the jet by atomsthat originate both from the hollow cathode and from thebackground gas. Some of these atoms are locally broughtinto an excited state by electron impact. The atom VDFtherefore exhibits two components: a fast and hot componentthat corresponds to atoms from the jet as well as a slow andcold component that comprises atoms from the cathode andthe residual gas. This view is supported by the fact thattheoretical line shapes do not conform to experimental spectrawhen solely considering one group of Xe atoms [27]. The axialvelocity of the two atoms populations is shown in figure 23.Measurements have been realized on the 1s5 metastable levelwith the low-power PPI thruster operating at 200 V [49]. Thevelocity was extracted using a model of the line shape. Theinvasion of the discharge by slow and cold atoms is clearlyidentified here.
15
Plasma Sources Sci. Technol. 22 (2013) 013001 Invited Review
Figure 23. Slow and fast atom population behind the channel exit ofthe PPI thruster firing at 200 V [49]. LIF measurements on theXe (1s5) level.
8.5. Influence of ion recombination at walls
The time-averaged Xe atom VDF was computed along the lineof sight for a PPS100 thruster firing at 250 V by means of ahybrid model [27]. Several cases were investigated, varyingthe residual pressure level, the CEX collisions and the valueof accommodation coefficient αw for ion–wall collisions. Forall cases, the mean axial velocity was determined from thefirst-order moment of the simulated atomic VDF.
First, simulations were carried out neglecting the residualgas pressure with αw fixed to one, i.e. all Xe atoms werein thermal equilibrium with thruster walls after a collisionevent. Results indicate ionization and free-flow effects arenot sufficient to explain the neutral flow acceleration in theinterior of the thruster [27]. When CEX collisions are notincluded in the model, the axial velocity reaches a constantmagnitude around 470 m s−1. This value corresponds to thefull conversion of thermal energy accumulated inside thechannel into kinetic energy. With CEX collisions, the meanvelocity increases steadily in the course of the flow. Numericaloutcomes show that in spite of a low probability CEX collisionsmarkedly influence the atom VDF.
Second, the background pressure was taken into accountin the simulations with pback = 2 mPa. The residual pressurehas a drastic impact upon the Xe atom velocity as can be seen infigure 24 for, e.g., the case αw = 1. This time the axial velocitydecreases down to a low value around 100 m s−1 behind thechannel exit plane. As previously stated, deceleration of theatomic flow is due to mixing between hot and fast atoms leavingthe channel and slow and cold atoms from the residual gas.The simulated atom VDF was indeed made of two distinctcomponents, see [27]. Although the shape of the velocityprofile is well reproduced with the hybrid model when pback
and CEX collisions are incorporated, the calculated velocitymagnitude is still in disagreement with the measured one,especially at the channel exhaust.
In the third case, the value of the accommodationcoefficient αw was changed [27]. The impact of Xe II ions
Figure 24. Simulated profile of the Xe atom mean velocity withpback = 2 mPa for three values of αw [27]. CEX collisions areincluded. Squares correspond to Xe (1s5) atom velocity measuredwith the PPS100-ML, see figure 22.
on channel walls of the HT leads to the creation of a non-negligible fraction of fast atoms when αw �= 0. The creationof fast atoms naturally occurs in the final section of the channel,a region where the ion energy and the ion flux to the walls arelarge. Curves in figure 24 show that the acceleration of the atomflow is reasonably reproduced when αw = 0.9. Simulationstherefore indicate that the observed rise in the Xe atom velocityresults not only from ionization and flow expansion but alsofrom creation of fast atoms at the walls due to recombinationof ions.
9. Time-resolved LIF measurements
9.1. Motivations
It is well-established that the cross-field discharge of a HTis strongly non-stationary [4, 54]. This specific type ofmagnetized plasma displays numerous types of oscillations,which encompass many kinds of physical phenomena, eachwith its own length and time scales [54]. Current andplasma fluctuations, whose frequency range stretches from∼1 kHz up to ∼1 GHz, play a major role in ionization,particle diffusion and acceleration processes. Low-frequencyplasma oscillations in the range 10–30 kHz, so-called breathingoscillations, are especially of interest as they carry a large partof the power. Breathing oscillations find their origin in a prey–predator type mechanism between atoms and ions as shown byBoeuf and Garrigues [55]. In short, these oscillations originatein a periodic depletion and replenishment of the neutrals nearthe exhaust of the thruster channel due to the efficient ionizationof the gas. The frequency is then linked to the time it takes foratoms to fill in the ionization region. With an atom thermalspeed of 300 m s−1 and a region size of 20 mm, one finds afrequency of 15 kHz. The breathing phenomenon not onlydisturbs the discharge current but also has a strong impact onseveral quantities such as the ion beam divergence and energyand the electron density and temperature. Oscillations of the
16
Plasma Sources Sci. Technol. 22 (2013) 013001 Invited Review
aforementioned quantities are most likely connected with atime variation of the potential distribution or, in other words,with the variation with time of the accelerating electric field.Therefore, it appears of considerable interest to investigate thetemporal behavior of the electric field that certainly hides arich and intricate dynamics. As the medium is collisionlesswithin the acceleration layer, oscillations of the electric fieldcan be assessed from the time-varying ion velocity with anappropriate numerical method.
As we have seen in section 3.2, a phase sensitive detectionmethod is often used to capture the fluorescence signal incase of time-averaged LIF measurements. However, thismethod, which is powerful enough for the extraction of asignal in an environment with a high background noise level,offers a poor time resolution. To achieve the measurementof the time-resolved ion VDF in the plasma of a HT, it isnecessary to develop a method able to detect LIF photonswith a time resolution around 1µ s. Under normal operatingconditions, the number of fluorescence photons observed at541.9 nm with a continuous laser beam tuned at 834.72 nmwith about 1 mW mm−2 power density is on the order of 10−2
per microsecond. Under identical experimental conditions,the number of background photons generated by the plasmaat 541.9 nm during 1 µs is typically 1, which means a ratioof 100 between the two signal amplitudes. The laser systemmust therefore be able (i) to detect a tiny amount of photonshidden in a strong background and (ii) to determine with highaccuracy the exact moment in time fluorescence photons havebeen produced. One must therefore turn to a photon-countingtechnique.
9.2. Photon-counting technique
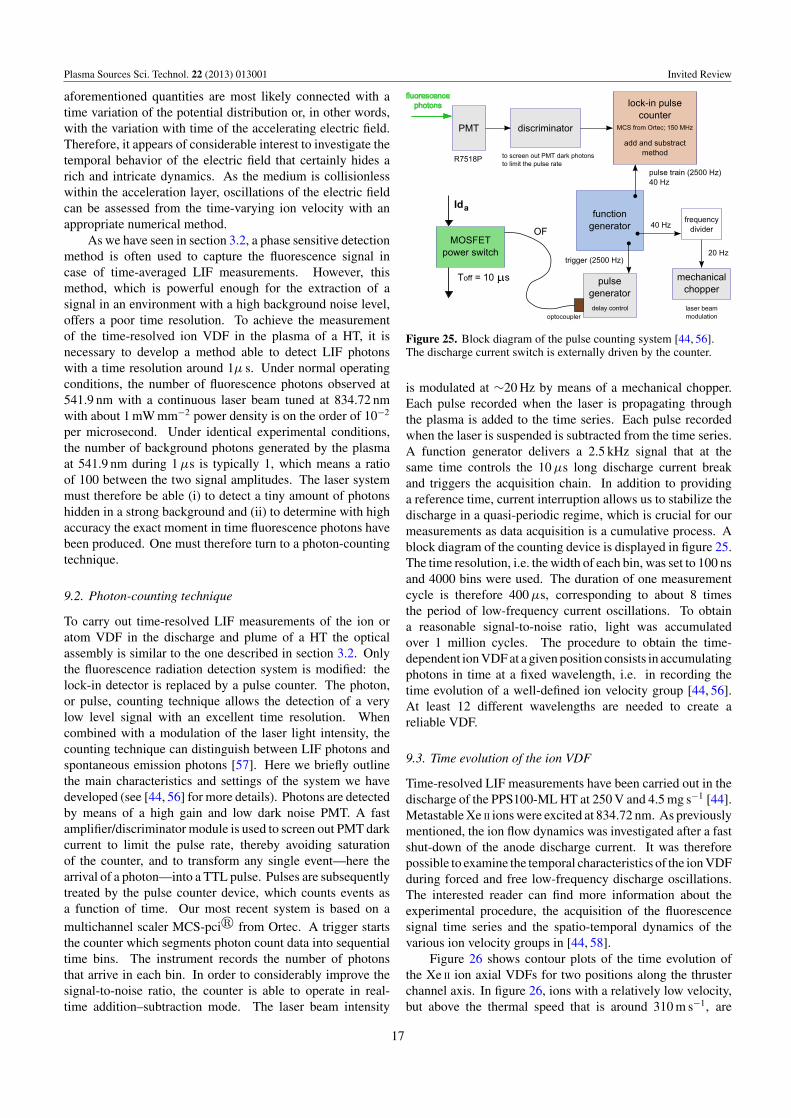
To carry out time-resolved LIF measurements of the ion oratom VDF in the discharge and plume of a HT the opticalassembly is similar to the one described in section 3.2. Onlythe fluorescence radiation detection system is modified: thelock-in detector is replaced by a pulse counter. The photon,or pulse, counting technique allows the detection of a verylow level signal with an excellent time resolution. Whencombined with a modulation of the laser light intensity, thecounting technique can distinguish between LIF photons andspontaneous emission photons [57]. Here we briefly outlinethe main characteristics and settings of the system we havedeveloped (see [44, 56] for more details). Photons are detectedby means of a high gain and low dark noise PMT. A fastamplifier/discriminator module is used to screen out PMT darkcurrent to limit the pulse rate, thereby avoiding saturationof the counter, and to transform any single event—here thearrival of a photon—into a TTL pulse. Pulses are subsequentlytreated by the pulse counter device, which counts events asa function of time. Our most recent system is based on amultichannel scaler MCS-pci� from Ortec. A trigger startsthe counter which segments photon count data into sequentialtime bins. The instrument records the number of photonsthat arrive in each bin. In order to considerably improve thesignal-to-noise ratio, the counter is able to operate in real-time addition–subtraction mode. The laser beam intensity
Figure 25. Block diagram of the pulse counting system [44, 56].The discharge current switch is externally driven by the counter.
is modulated at ∼20 Hz by means of a mechanical chopper.Each pulse recorded when the laser is propagating throughthe plasma is added to the time series. Each pulse recordedwhen the laser is suspended is subtracted from the time series.A function generator delivers a 2.5 kHz signal that at thesame time controls the 10 µs long discharge current breakand triggers the acquisition chain. In addition to providinga reference time, current interruption allows us to stabilize thedischarge in a quasi-periodic regime, which is crucial for ourmeasurements as data acquisition is a cumulative process. Ablock diagram of the counting device is displayed in figure 25.The time resolution, i.e. the width of each bin, was set to 100 nsand 4000 bins were used. The duration of one measurementcycle is therefore 400 µs, corresponding to about 8 timesthe period of low-frequency current oscillations. To obtaina reasonable signal-to-noise ratio, light was accumulatedover 1 million cycles. The procedure to obtain the time-dependent ion VDF at a given position consists in accumulatingphotons in time at a fixed wavelength, i.e. in recording thetime evolution of a well-defined ion velocity group [44, 56].At least 12 different wavelengths are needed to create areliable VDF.
9.3. Time evolution of the ion VDF
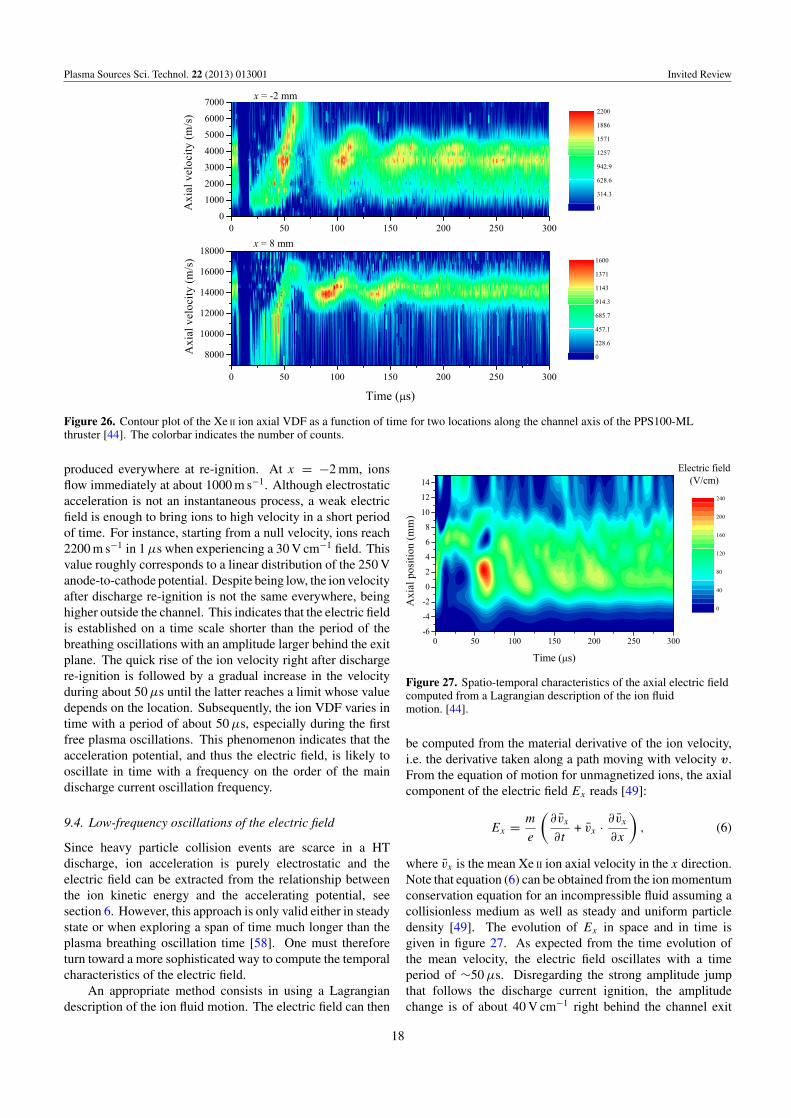
Time-resolved LIF measurements have been carried out in thedischarge of the PPS100-ML HT at 250 V and 4.5 mg s−1 [44].Metastable Xe II ions were excited at 834.72 nm. As previouslymentioned, the ion flow dynamics was investigated after a fastshut-down of the anode discharge current. It was thereforepossible to examine the temporal characteristics of the ion VDFduring forced and free low-frequency discharge oscillations.The interested reader can find more information about theexperimental procedure, the acquisition of the fluorescencesignal time series and the spatio-temporal dynamics of thevarious ion velocity groups in [44, 58].
Figure 26 shows contour plots of the time evolution ofthe Xe II ion axial VDFs for two positions along the thrusterchannel axis. In figure 26, ions with a relatively low velocity,but above the thermal speed that is around 310 m s−1, are
17
Plasma Sources Sci. Technol. 22 (2013) 013001 Invited Review
Figure 26. Contour plot of the Xe II ion axial VDF as a function of time for two locations along the channel axis of the PPS100-MLthruster [44]. The colorbar indicates the number of counts.
produced everywhere at re-ignition. At x = −2 mm, ionsflow immediately at about 1000 m s−1. Although electrostaticacceleration is not an instantaneous process, a weak electricfield is enough to bring ions to high velocity in a short periodof time. For instance, starting from a null velocity, ions reach2200 m s−1 in 1 µs when experiencing a 30 V cm−1 field. Thisvalue roughly corresponds to a linear distribution of the 250 Vanode-to-cathode potential. Despite being low, the ion velocityafter discharge re-ignition is not the same everywhere, beinghigher outside the channel. This indicates that the electric fieldis established on a time scale shorter than the period of thebreathing oscillations with an amplitude larger behind the exitplane. The quick rise of the ion velocity right after dischargere-ignition is followed by a gradual increase in the velocityduring about 50 µs until the latter reaches a limit whose valuedepends on the location. Subsequently, the ion VDF varies intime with a period of about 50 µs, especially during the firstfree plasma oscillations. This phenomenon indicates that theacceleration potential, and thus the electric field, is likely tooscillate in time with a frequency on the order of the maindischarge current oscillation frequency.
9.4. Low-frequency oscillations of the electric field
Since heavy particle collision events are scarce in a HTdischarge, ion acceleration is purely electrostatic and theelectric field can be extracted from the relationship betweenthe ion kinetic energy and the accelerating potential, seesection 6. However, this approach is only valid either in steadystate or when exploring a span of time much longer than theplasma breathing oscillation time [58]. One must thereforeturn toward a more sophisticated way to compute the temporalcharacteristics of the electric field.
An appropriate method consists in using a Lagrangiandescription of the ion fluid motion. The electric field can then
Figure 27. Spatio-temporal characteristics of the axial electric fieldcomputed from a Lagrangian description of the ion fluidmotion. [44].
be computed from the material derivative of the ion velocity,i.e. the derivative taken along a path moving with velocity v.From the equation of motion for unmagnetized ions, the axialcomponent of the electric field Ex reads [49]:
Ex = m
e
(∂vx
∂t+ vx · ∂vx
∂x
), (6)
where vx is the mean Xe II ion axial velocity in the x direction.Note that equation (6) can be obtained from the ion momentumconservation equation for an incompressible fluid assuming acollisionless medium as well as steady and uniform particledensity [49]. The evolution of Ex in space and in time isgiven in figure 27. As expected from the time evolution ofthe mean velocity, the electric field oscillates with a timeperiod of ∼50 µs. Disregarding the strong amplitude jumpthat follows the discharge current ignition, the amplitudechange is of about 40 V cm−1 right behind the channel exit
18
Plasma Sources Sci. Technol. 22 (2013) 013001 Invited Review
plane. The electric field is mostly localized within a regionthat stretches from x = −2 to x = 8 mm, in agreementwith time-averaged data, see [44]. From the contour plot infigure 27, one remarks that the electric field not only oscillatesthrough time but also exhibits changes in space. During oneoscillation of the discharge current, an electric field frontseems to propagate toward the interior of the channel at lowvelocity. For the first forced oscillation, the front velocityis around 700 m s−1 whereas for all other oscillations thevelocity is ∼250 m s−1. The velocity is close to the xenonatom thermal speed. Therefore, the electric field, or in otherwords the acceleration layer, would move with the ionizationlayer as a direct consequence of the prey–predator process atthe origin of the Hall discharge breathing oscillation. This isexpected as the ion velocity dispersion stays almost unchangedin time [44, 58].
Although experimental results show that near the thrusterexit plane an electric field front propagates upstreamperiodically, the observed phenomenon could be artificiallyamplified or distorted as no momentum source term is takeninto account when computing E(t, x) using equation (6).However, Bourgeois has recently shown that the electronpressure gradient and the ionization term in the momentumequation can be neglected in comparison with the velocitymaterial derivative and the electric term, respectively [49]. Thespatio-temporal electric field dynamics illustrated in figure 27is therefore exact. It can then be used as a test case forvalidation of advanced modeling of a HT discharge. Anopen question nevertheless remains: how exactly does theelectric field front propagate in time? As time-resolved LIFmeasurements have only been performed at one position alongthe channel radius, one cannot distinguish between a pure axialmotion and a helicoidal motion.
10. Conclusions and prospects
This article gives a review of recent investigations of themagnetized plasma of a HT by means of time-averaged as wellas time-resolved laser-induced fluorescence spectroscopy. TheXe I and Kr I atom and Xe II and Kr II ion velocity distributionfunction has been obtained after laser excitation of excitedlevels in the discharge chamber and near-field plume for abroad range of thruster power and size. The VDF allowsone to assess important quantities such as the mean velocity,the temperature, the velocity vector and the electric field. Asshown throughout the review, investigation of atomic and ionictransport phenomena is a powerful method for getting insightsinto the physical mechanisms at play in this specific electricpropulsion device.
Although progress has been made over the past decadein the physics of HTs by way of LIF experiments, severalaspects of the technology remain unclear, not to say obscure.That is the reason why many studies still have to be carriedout. To close this review, we propose a non-exhaustive list ofpossible works for the near future. The unconfirmed formationof a stationary electrostatic shock wave on the thruster axis,where elementary ion beams merge, must be investigated.If it exists, its role in the ion beam divergence should be
clarified. So far, only singly charged ions have been observed.LIF measurements on multiply charged ion species, especiallyXe III ions, would certainly bring relevant information aboutthe ionization process. The impact of the thruster designon the VDF has not been examined enough; comparisonbetween diverging cusped-field thrusters, cylindrical HTsand standard HTs is certainly a promising direction tofollow. In order to gain knowledge of the anomalous electrondiffusion across the magnetic barrier, a thorough comparisonbetween experimental VDFs and numerical VDFs is required.Finally, considerably effort must be put into time-resolved LIFmeasurements. Not only must the propagation of an electricfield front at the breathing mode frequency be investigated ina deeper way, the time-evolution of the ion VDF must also bestudied at higher frequencies, especially in the so-called iontransit time regime, and for different thruster power levels.
Acknowledgments
A large part of this work was carried out within the frame of theCNRS/CNES/SNECMA/Universites joint research program3161 entitled Propulsion par plasma dans l’espace. The authorwishes to thank Dr N Sadeghi for fruitful discussions andcollaborations. A large part of this work would not havebeen accomplished without the contribution of D Gawron,G Bourgeois, K Dannenmayer, A Lejeune, L Garrigues andE Pawelec.
References
[1] Turner M J L 2009 Rocket and Spacecraft Propulsion(Chichester: Springer Praxis)
[2] Jahn R G and Choueiri Y 2002 Electric propulsionEncyclopedia of Physical Science and Technology vol 5, 3rdedn (San Diego, CA: Academic) pp 125–41
[3] Jahn R G 1996 Physics of Electric Propulsion (New York:Dover)
[4] Zhurin V V, Kaufmann H R and Robinson R S 1999 Physics ofClosed Drift Thrusters Plasma Sources Sci. Technol.8 R1–20
[5] Pottinger S, Lappas V, Charles C and Boswell R 2011Performance characterization of a helicon double layerthruster using direct thrust measurements J. Phys. D: Appl.Phys. 44 235201
[6] Chang Diaz F R et al 2004 The VASIMR engine: project statusand recent accomplishments Proc. 42nd AIAA AerospaceScience Meeting (Reno, NV) AIAA paper 04-0149
[7] Aanesland A, Mazouffre S and Chabert P 2011 PEGASES—anew promising electric propulsion concept EuroPhys. News42 28–31
[8] Goebel D M and Katz I 2008 Fundamentals of ElectricPropulsion (Hoboken, NJ: Wiley)
[9] Mazouffre S and Lejeune A 2011 High power electricpropulsion for robotic exploration of our Solar system Proc.1st Int. Conf. on Space Access (Paris) paper 51
[10] Koppel C R, Marchandise F, Prioul M, Estublier D and,Darnon F 2005 The SMART-1 electric propulsionsubsystem around the Moon: in flight experience Proc. 41thJoint Propulsion Conf. (Tucson, AZ) AIAA paper 05-3671
[11] Morozov A I and Savelyev V V 2000 Fundamentals ofstationary plasma thruster theory Rev. Plasma Phys. vol 21,ed B B Kadomtsev and V D Shafranov (New York:Consultants Bureau) pp 203–391
19
Plasma Sources Sci. Technol. 22 (2013) 013001 Invited Review
[12] Kim V 1998 Main physical features and processes determiningthe performance of stationary plasma thrusters J. Propul.Power 14 736–43
[13] Dannenmayer K and Mazouffre S 2011 Elementary scalingrelations for Hall effect thrusters J. Propul. Power27 236–45
[14] Demtroder W 1998 Laser Spectroscopy: Basic Concepts andInstrumentation (Berlin: Springer) pp 367–429
[15] Sadeghi N 2004 Molecular spectroscopy techniques appliedfor processing plasma diagnostics J. Plasma Fusion Res.80 767–76 and references therein
[16] Biloiu I A, Scime E E and Biloiu C 2009 One- andtwo-dimensional laser induced fluorescence at obliqueincidence Plasma Sources Sci. Technol. 18 025012 andreferences therein
[17] Mazouffre S, Kulaev V and Perez-Luna J 2009 Ion diagnosticsof a discharge in crossed electric and magnetic fields forelectric propulsion Plasma Sources Sci. Technol. 18 034022
[18] Gawron D, Mazouffre S, Sadeghi N and Heron A 2008Influence of magnetic field and discharge voltage on theacceleration layer features in a Hall effect thruster PlasmaSources Sci. Technol. 17 025001
[19] Hargus W A Jr and Cappelli M A 2001 Laser-inducedfluorescence measurements of velocity within a Halldischarge Appl. Phys. B 72 961–9
[20] Hargus W A Jr and Charles C S 2010 Near-plumelaser-induced fluorescence velocity measurements ofmedium power Hall thruster J. Propul. Power 26 135–41
[21] Spektor R et al 2010 Laser induced fluorescencemeasurements of the cylindrical Hall thruster plume Phys.Plasmas 17 093502
[22] MacDonald N A, Cappelli M A, Gildea S R,Martınez-Sanchez M and Hargus W A Jr 2011Laser-induced fluorescence velocity measurements of adiverging cusped-field thruster J. Phys. D: Appl. Phys.44 295203
[23] Lejeune A, Bourgeois G and Mazouffre S 2012 Kr II and Xe II
axial velocity distribution functions in a cross-field ionsource Phys. Plasmas 19 073501
[24] Barnat E V 2011 Multi-dimensional optical and laser-baseddiagnostics of low-temperature ionized plasma dischargesPlasma Sources Sci. Technol. 20 053001
[25] Williams G J et al 1999 Laser induced fluorescencemeasurement of ion velocities in the plume of aHall effect thruster Proc. 35th Joint Propulsion Conference(Los Angeles, CA) AIAA paper 99-2424
[26] Pawelec E, Mazouffre S and Sadeghi N 2011 Hyperfinestructure of some near-infrared Xe I and Xe II linesSpectroch. Acta B 66 470–75
[27] Mazouffre S, Bourgeois G, Garrigues L and Pawelec E 2011 Acomprehensive study on the atom flow in the cross-fielddischarge of a Hall thruster J. Phys. D: Appl. Phys.44 105203
[28] Hargus W A Jr, Azarnia G M and Nakles M R 2001Demonstration of laser-induced fluorescence on a kryptonHall effect thruster Proc. 32nd Int. Electric PropulsionConf. (Wiesbaden) paper 2011-018
[29] Hollas J M 1998 High Resolution Spectroscopy (New York:Wiley)
[30] Ngom B B, Smith T B, Huang W and Gallimore A D 2008Numerical simulation of the Zeeman effect in neutral xenonfrom NIR diode-laser spectroscopy J. Appl. Phys.104 023303
[31] Mazouffre S, Gawron D, Kulaev V and Sadeghi N 2008 Xe+
ion transport in the crossed-field discharge of a 5 kW classHall effect thruster IEEE Trans. Plasma Sci. 36 1967–76
[32] Nakles M R and Hargus W A Jr 2011 Background pressureeffects on ion velocity distribution witin a medium-powerHall thruster J. Propul. Power 27 737–43
[33] Garrigues L, Mazouffre S and Bourgeois G 2012 Computedversus measured ion velocity distribution functions in a Halleffect thruster J. Appl. Phys. 111 113301
[34] Hagelaar G J M, Bareilles J, Garrigues L and Boeuf J P 2003Role of anomalous electron transport in a stationary plasmathruster simulation J. Appl. Phys. 93 67–75
[35] Adam J C, Heron A and Laval G 2004 Study of stationaryplasma thrusters using two-dimensional fully kineticsimulations Phys. Plasmas 11 295–305
[36] Mazouffre S, Bourgeois G, Dannenmayer K and Lejeune A2012 Ionization and acceleration processes in a small,variable channel width, permanent magnet Hall thrusterJ. Phys. D: Appl. Phys. 45 185203
[37] Hargus W A Jr and Charles C S 2008 Near exit planevelocity field of a 200-W Hall thruster J. Propul. Power24 127–33
[38] Beiting E J and Pollard J E 2000 Measurements of xenon ionvelocities of the SPT-140 using laser induced fluorescenceProc. 3rd Int. Conf. on Spacecraft Propulsion (Cannes)ESA SP-465, pp 897–900
[39] Hargus W A Jr 2011 Laser-induced fluorescence-derived Halleffect thruster ion velocity distribution visualization IEEETrans. Plasma Sci. 39 2918–19
[40] Hruby H, Monheiser J, Pote B, Rostler P, Lolencik J andFreeman C 1999 Development of low power Hall thrustersProc. 30th Plasmadynamics and Lasers Conf. (Norfolk, VA)AIAA paper 99-3534
[41] Hargus W A Jr and Cappelli M A 2002 Interior andexterior laser-induced fluorescence and plasmameasurements within a Hall thruster J. Propul. Power18 159–68
[42] Huang W, Gallimore A D and Smith T B 2011 Two-axislaser-induced fluorescence of singly-charged xenon inside a6-kW Hall thruster Proc. 49th Aerospace Sciences Meeting(Orlando, FL) AIAA paper 2011-1015
[43] Smirnov A, Raitses Y and Fisch N J 2003 Enhancedionization in the cylindrical Hall thruster J. Appl. Phys.94 852–57
[44] Mazouffre S and Bourgeois G 2010 Spatio-temporalcharacteristics of ion velocity in a Hall thruster dischargePlasma Sources Sci. Technol. 19 065018
[45] Perez-Luna J, Hagelaar G J M, Garrigues L and Boeuf J P2009 Method to obtain the electric field and the ionizationfrequency from laser induced fluorescence measurementsPlasma Sources Sci. Technol. 18 034008
[46] Spektor R 2010 Computation of two-dimensional electric fieldfrom the ion laser induced fluorescence measurementsPhys. Plasmas 17 093503
[47] Manzella D H 1994 Stationary plasma thruster ion velocitydistribution Proc. 30th Joint Propulsion Conf.(Indianapolis, IN) AIAA paper 94-3141
[48] Bourgeois G, Mazouffre S and Sadeghi N 2010 Unexpectedtransverse velocity component of Xe+ ions near the exitplane of a Hall thruster Phys. Plasmas 17 113502
[49] Bourgeois G 2012 Influence de la topologie magnetique, de lacathode et de la section du canal sur l’acceleration des ionsdans un propulseur a effet Hall PhD Thesis, University ofOrleans (in French)
[50] Cedolin R J, Hargus W A Jr, Storm P V, Hanson R K andCappelli M A 1997 Laser-induced fluorescence study of axenon Hall thruster Appl. Phys. B 65 459–69
[51] Huang W and Gallimore A D 2009 Laser-induced fluorescencestudy of neutral xenon flow evolution inside a 6 kW Hallthruster Proc. 31st Int. Electric Propulsion Conf. (AnnArbor, MI) paper 09-87
[52] Huang W, Ngom B B and Gallimore A D 2009 Usingnonlinear zeeman spectroscopy to obtain in situ magneticfield measurement in a Hall thruster Proc. 31st Int. ElectricPropulsion Conf. (Ann Arbor, MI) paper 09-088
20

Plasma Sources Sci. Technol. 22 (2013) 013001 Invited Review
[53] Smith T B 2003 Deconvolution of ion velocity distributionsfrom laser-induced fluorescence spectra of xenonelectrostatic thruster plumes PhD Dissertation University ofMichigan, MI
[54] Choueiri E Y 2001 Plasma oscillations in Hall thrusters Phys.Plasmas 8 1411–26
[55] Boeuf J P and Garrigues L 1998 Low frequency oscillations ina stationary plasma thruster J. Appl. Phys 84 3541–54
[56] Mazouffre S, Gawron D and Sadeghi N 2009 A time-resolvedLIF study on the ion velocity distribution function in a Hall
thruster after a fast current disruption Phys. Plasmas16 043504
[57] Pellissier B and Sadeghi N 1996 Time-resolved pulse countinglock-in detection of laser induced fluorescence in thepresence of a strong beackground emission Rev. Sci.Instrum. 67 3405–10
[58] Bourgeois G, Mazouffre S and Sadeghi N 2009 Examinationof the temporal characteristics of the electric field in a Halleffet thruster using a photon-counting technique Proc. 31stInt. Electric Propulsion Conf. (Ann Arbor, MI) paper 09-111
21