Embed Size (px)
Citation preview
ICES Advice on fishing opportunities, catch, and effort
Greater North Sea Ecoregion Published 30 June 2017 lem.27.3a47d DOI: 10.17895/ices.pub.3153
ICES Advice 2017 1
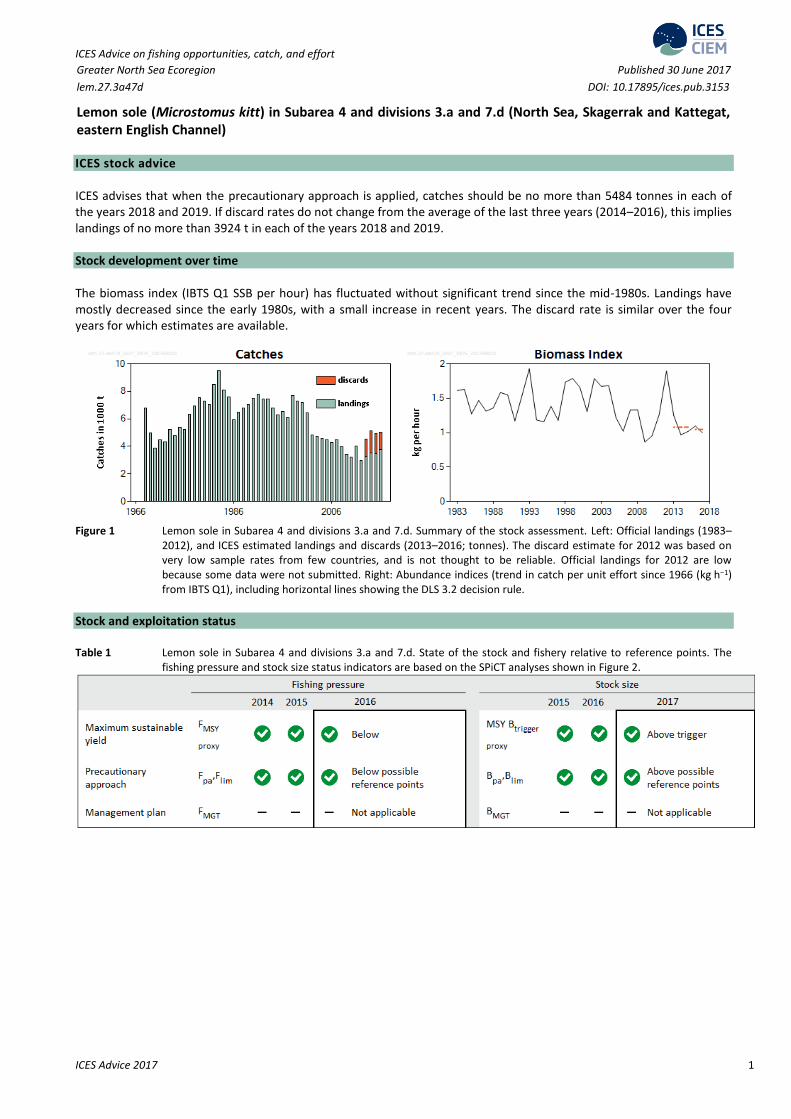
Lemon sole (Microstomus kitt) in Subarea 4 and divisions 3.a and 7.d (North Sea, Skagerrak and Kattegat, eastern English Channel) ICES stock advice ICES advises that when the precautionary approach is applied, catches should be no more than 5484 tonnes in each of the years 2018 and 2019. If discard rates do not change from the average of the last three years (2014–2016), this implies landings of no more than 3924 t in each of the years 2018 and 2019. Stock development over time The biomass index (IBTS Q1 SSB per hour) has fluctuated without significant trend since the mid-1980s. Landings have mostly decreased since the early 1980s, with a small increase in recent years. The discard rate is similar over the four years for which estimates are available.
Figure 1 Lemon sole in Subarea 4 and divisions 3.a and 7.d. Summary of the stock assessment. Left: Official landings (1983–
2012), and ICES estimated landings and discards (2013–2016; tonnes). The discard estimate for 2012 was based on very low sample rates from few countries, and is not thought to be reliable. Official landings for 2012 are low because some data were not submitted. Right: Abundance indices (trend in catch per unit effort since 1966 (kg h−1) from IBTS Q1), including horizontal lines showing the DLS 3.2 decision rule.
Stock and exploitation status Table 1 Lemon sole in Subarea 4 and divisions 3.a and 7.d. State of the stock and fishery relative to reference points. The
fishing pressure and stock size status indicators are based on the SPiCT analyses shown in Figure 2.
ICES Advice on fishing opportunities, catch, and effort Published 30 June 2017 lem.27.3a47d
ICES Advice 2017 2
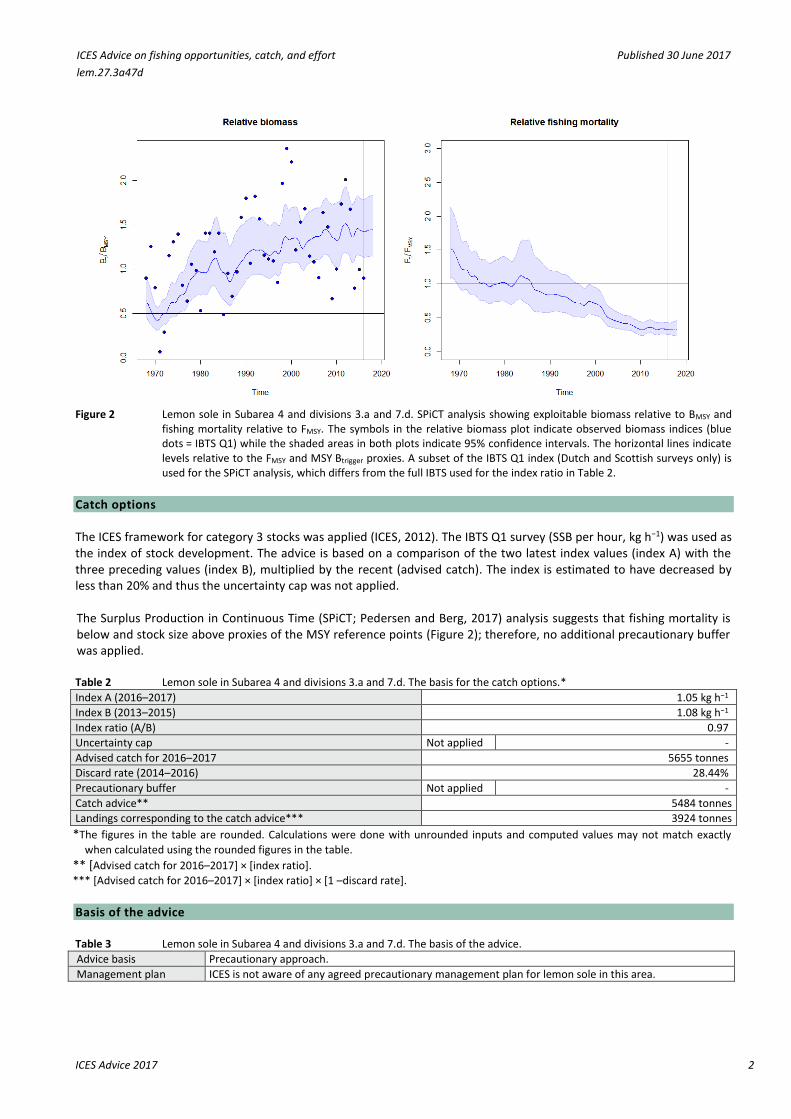
Figure 2 Lemon sole in Subarea 4 and divisions 3.a and 7.d. SPiCT analysis showing exploitable biomass relative to BMSY and
fishing mortality relative to FMSY. The symbols in the relative biomass plot indicate observed biomass indices (blue dots = IBTS Q1) while the shaded areas in both plots indicate 95% confidence intervals. The horizontal lines indicate levels relative to the FMSY and MSY Btrigger proxies. A subset of the IBTS Q1 index (Dutch and Scottish surveys only) is used for the SPiCT analysis, which differs from the full IBTS used for the index ratio in Table 2.
Catch options The ICES framework for category 3 stocks was applied (ICES, 2012). The IBTS Q1 survey (SSB per hour, kg h−1) was used as the index of stock development. The advice is based on a comparison of the two latest index values (index A) with the three preceding values (index B), multiplied by the recent (advised catch). The index is estimated to have decreased by less than 20% and thus the uncertainty cap was not applied. The Surplus Production in Continuous Time (SPiCT; Pedersen and Berg, 2017) analysis suggests that fishing mortality is below and stock size above proxies of the MSY reference points (Figure 2); therefore, no additional precautionary buffer was applied. Table 2 Lemon sole in Subarea 4 and divisions 3.a and 7.d. The basis for the catch options.* Index A (2016–2017) 1.05 kg h−1
Index B (2013–2015) 1.08 kg h−1
Index ratio (A/B) 0.97
Uncertainty cap Not applied -
Advised catch for 2016–2017 5655 tonnes
Discard rate (2014–2016) 28.44%
Precautionary buffer Not applied -
Catch advice** 5484 tonnes
Landings corresponding to the catch advice*** 3924 tonnes
*The figures in the table are rounded. Calculations were done with unrounded inputs and computed values may not match exactly
when calculated using the rounded figures in the table. ** [Advised catch for 2016–2017] × [index ratio].
*** [Advised catch for 2016–2017] × [index ratio] × [1 –discard rate].
Basis of the advice Table 3 Lemon sole in Subarea 4 and divisions 3.a and 7.d. The basis of the advice.
Advice basis Precautionary approach.
Management plan ICES is not aware of any agreed precautionary management plan for lemon sole in this area.
ICES Advice on fishing opportunities, catch, and effort Published 30 June 2017 lem.27.3a47d
ICES Advice 2017 3
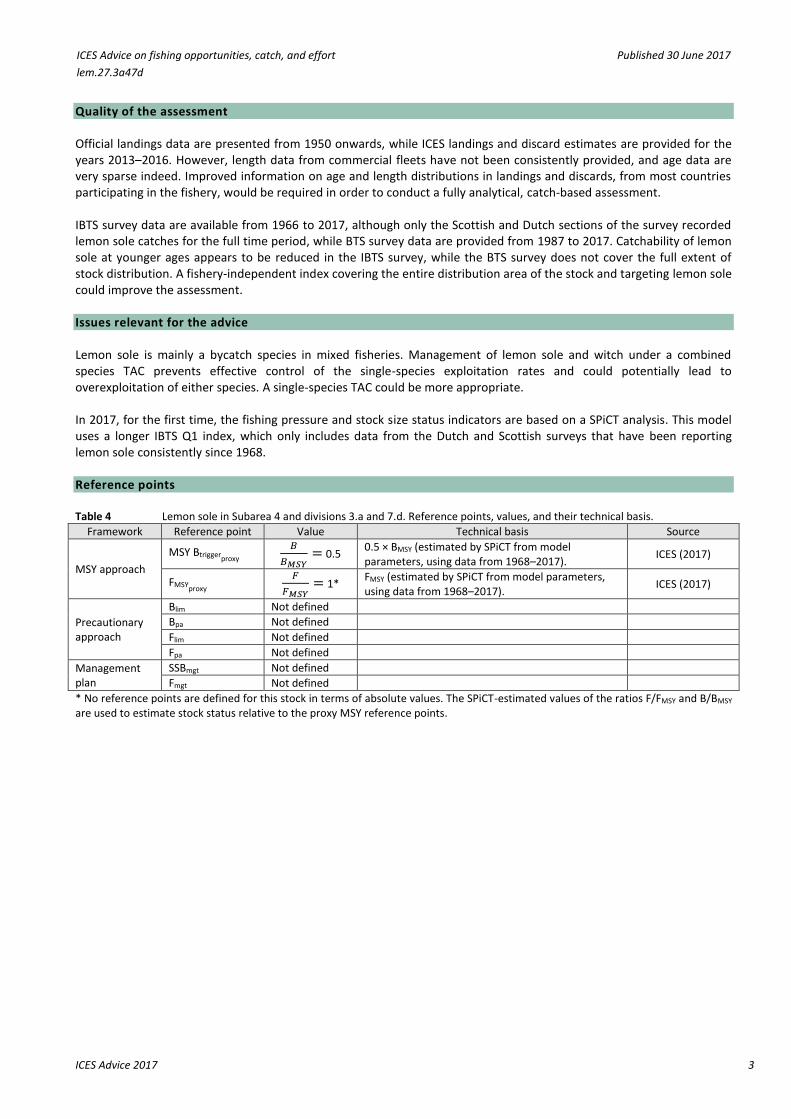
Quality of the assessment Official landings data are presented from 1950 onwards, while ICES landings and discard estimates are provided for the years 2013–2016. However, length data from commercial fleets have not been consistently provided, and age data are very sparse indeed. Improved information on age and length distributions in landings and discards, from most countries participating in the fishery, would be required in order to conduct a fully analytical, catch-based assessment. IBTS survey data are available from 1966 to 2017, although only the Scottish and Dutch sections of the survey recorded lemon sole catches for the full time period, while BTS survey data are provided from 1987 to 2017. Catchability of lemon sole at younger ages appears to be reduced in the IBTS survey, while the BTS survey does not cover the full extent of stock distribution. A fishery-independent index covering the entire distribution area of the stock and targeting lemon sole could improve the assessment. Issues relevant for the advice Lemon sole is mainly a bycatch species in mixed fisheries. Management of lemon sole and witch under a combined species TAC prevents effective control of the single-species exploitation rates and could potentially lead to overexploitation of either species. A single-species TAC could be more appropriate. In 2017, for the first time, the fishing pressure and stock size status indicators are based on a SPiCT analysis. This model uses a longer IBTS Q1 index, which only includes data from the Dutch and Scottish surveys that have been reporting lemon sole consistently since 1968. Reference points Table 4 Lemon sole in Subarea 4 and divisions 3.a and 7.d. Reference points, values, and their technical basis.
Framework Reference point Value Technical basis Source
MSY approach
MSY Btriggerproxy
𝐵
𝐵𝑀𝑆𝑌= 0.5
0.5 × BMSY (estimated by SPiCT from model parameters, using data from 1968–2017).
ICES (2017)
FMSYproxy
𝐹
𝐹𝑀𝑆𝑌= 1*
FMSY (estimated by SPiCT from model parameters, using data from 1968–2017).
ICES (2017)
Precautionary approach
Blim Not defined
Bpa Not defined
Flim Not defined
Fpa Not defined
Management plan
SSBmgt Not defined
Fmgt Not defined
* No reference points are defined for this stock in terms of absolute values. The SPiCT-estimated values of the ratios F/FMSY and B/BMSY are used to estimate stock status relative to the proxy MSY reference points.
ICES Advice on fishing opportunities, catch, and effort Published 30 June 2017 lem.27.3a47d
ICES Advice 2017 4
Basis of the assessment Table 5 Lemon sole in Subarea 4 and divisions 3.a and 7.d. Basis of the assessment and advice.
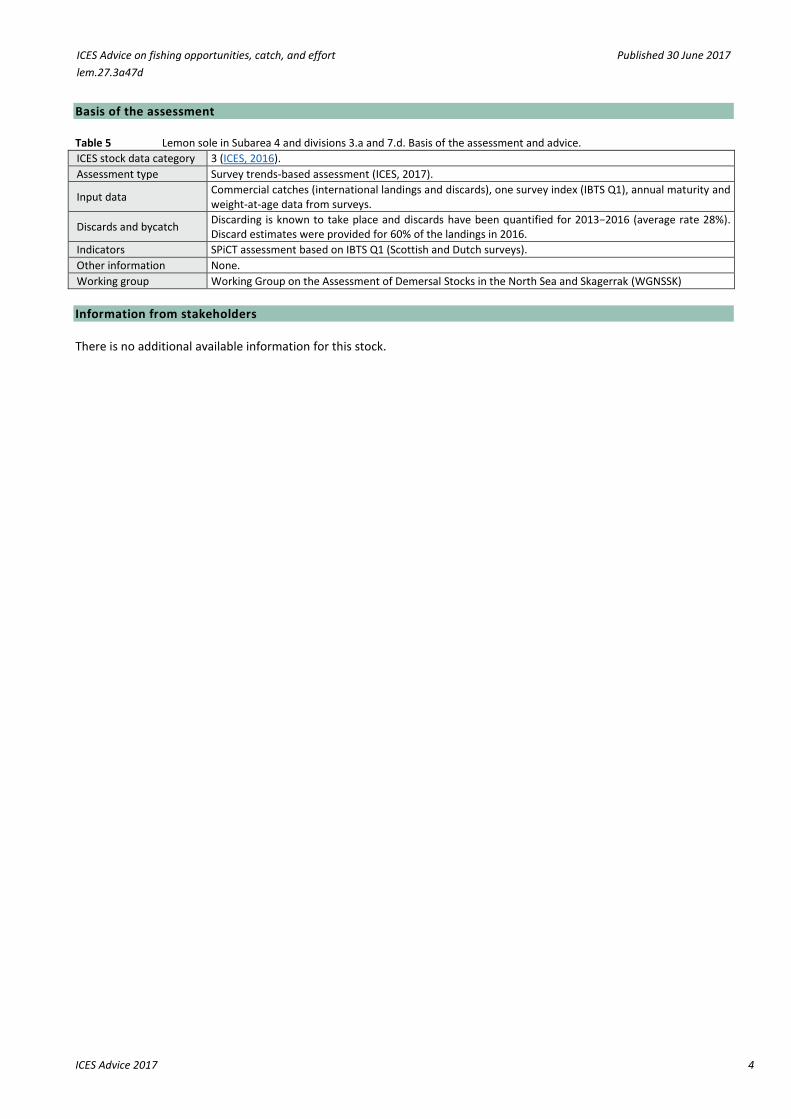
ICES stock data category 3 (ICES, 2016).
Assessment type Survey trends-based assessment (ICES, 2017).
Input data Commercial catches (international landings and discards), one survey index (IBTS Q1), annual maturity and weight-at-age data from surveys.
Discards and bycatch Discarding is known to take place and discards have been quantified for 2013−2016 (average rate 28%). Discard estimates were provided for 60% of the landings in 2016.
Indicators SPiCT assessment based on IBTS Q1 (Scottish and Dutch surveys).
Other information None.
Working group Working Group on the Assessment of Demersal Stocks in the North Sea and Skagerrak (WGNSSK)
Information from stakeholders There is no additional available information for this stock.
ICES Advice on fishing opportunities, catch, and effort Published 30 June 2017 lem.27.3a47d
ICES Advice 2017 5
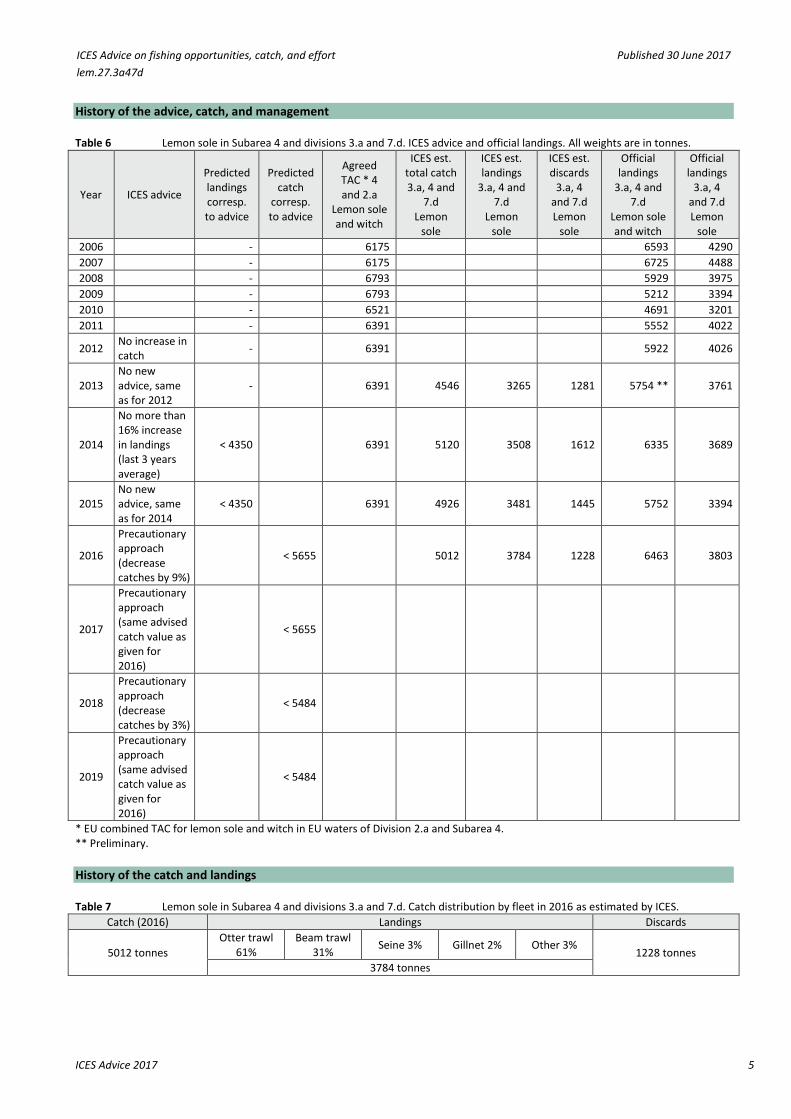
History of the advice, catch, and management Table 6 Lemon sole in Subarea 4 and divisions 3.a and 7.d. ICES advice and official landings. All weights are in tonnes.
Year ICES advice
Predicted landings corresp. to advice
Predicted catch
corresp. to advice
Agreed TAC * 4 and 2.a
Lemon sole and witch
ICES est. total catch 3.a, 4 and
7.d Lemon
sole
ICES est. landings
3.a, 4 and 7.d
Lemon sole
ICES est. discards
3.a, 4 and 7.d Lemon
sole
Official landings
3.a, 4 and 7.d
Lemon sole and witch
Official landings
3.a, 4 and 7.d Lemon
sole
2006 - 6175 6593 4290
2007 - 6175 6725 4488
2008 - 6793 5929 3975
2009 - 6793 5212 3394
2010 - 6521 4691 3201
2011 - 6391 5552 4022
2012 No increase in catch
- 6391 5922 4026
2013 No new advice, same as for 2012
- 6391 4546 3265 1281 5754 ** 3761
2014
No more than 16% increase in landings (last 3 years average)
< 4350 6391 5120 3508 1612 6335 3689
2015 No new advice, same as for 2014
< 4350 6391 4926 3481 1445 5752 3394
2016
Precautionary approach (decrease catches by 9%)
< 5655 5012 3784 1228 6463 3803
2017
Precautionary approach (same advised catch value as given for 2016)
< 5655
2018
Precautionary approach (decrease catches by 3%)
< 5484
2019
Precautionary approach (same advised catch value as given for 2016)
< 5484
* EU combined TAC for lemon sole and witch in EU waters of Division 2.a and Subarea 4. ** Preliminary.
History of the catch and landings Table 7 Lemon sole in Subarea 4 and divisions 3.a and 7.d. Catch distribution by fleet in 2016 as estimated by ICES.
Catch (2016) Landings Discards
5012 tonnes
Otter trawl 61%
Beam trawl 31%
Seine 3% Gillnet 2% Other 3% 1228 tonnes
3784 tonnes
ICES Advice on fishing opportunities, catch, and effort Published 30 June 2017 lem.27.3a47d
ICES Advice 2017 6
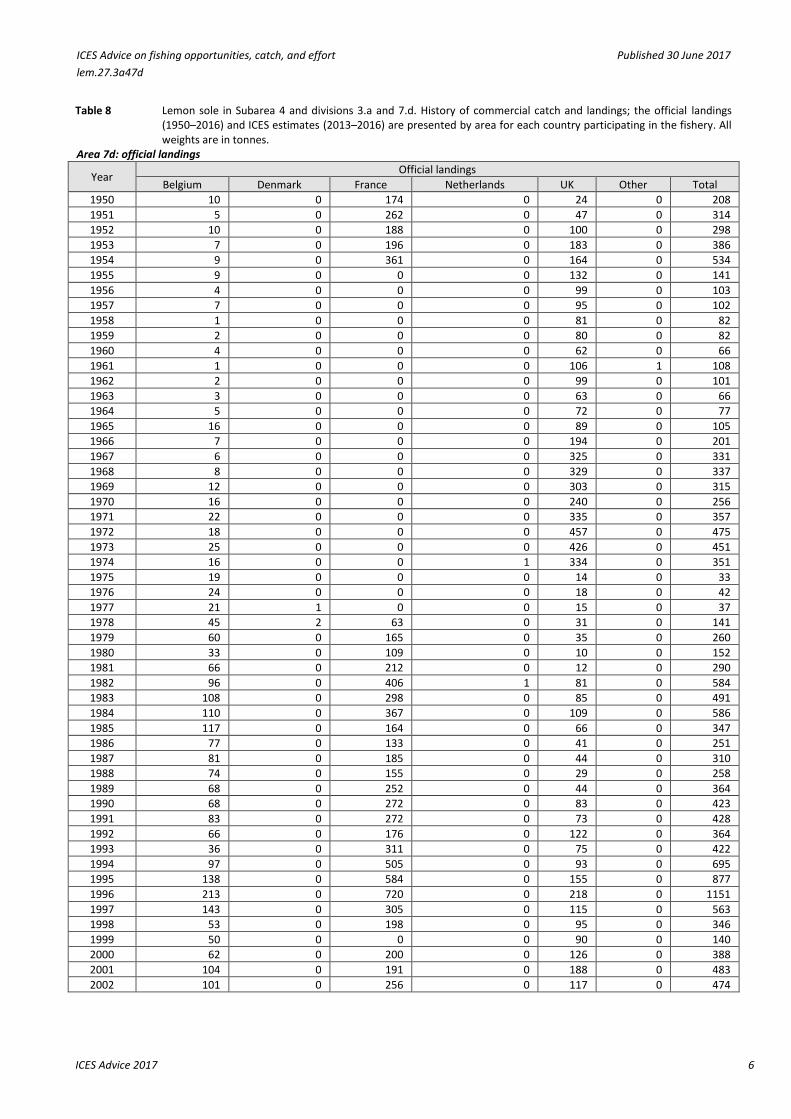
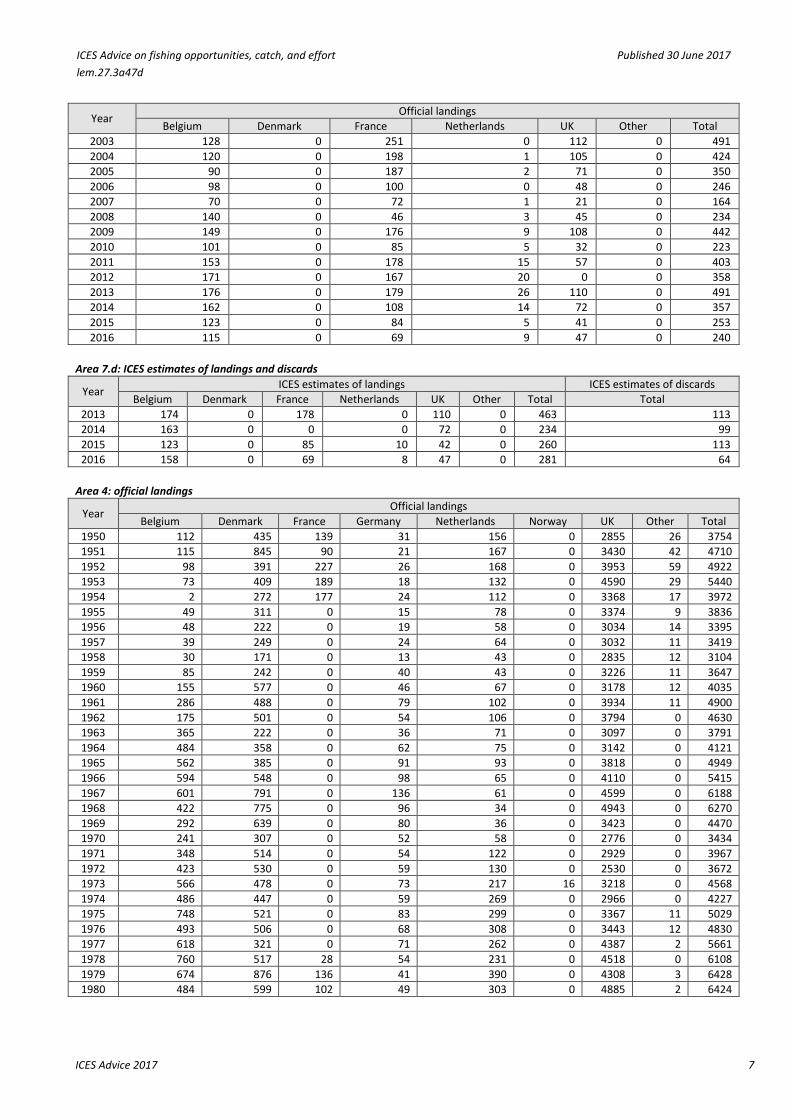
Table 8 Lemon sole in Subarea 4 and divisions 3.a and 7.d. History of commercial catch and landings; the official landings (1950–2016) and ICES estimates (2013–2016) are presented by area for each country participating in the fishery. All weights are in tonnes.
Area 7d: official landings
Year Official landings
Belgium Denmark France Netherlands UK Other Total
1950 10 0 174 0 24 0 208
1951 5 0 262 0 47 0 314
1952 10 0 188 0 100 0 298
1953 7 0 196 0 183 0 386
1954 9 0 361 0 164 0 534
1955 9 0 0 0 132 0 141
1956 4 0 0 0 99 0 103
1957 7 0 0 0 95 0 102
1958 1 0 0 0 81 0 82
1959 2 0 0 0 80 0 82
1960 4 0 0 0 62 0 66
1961 1 0 0 0 106 1 108
1962 2 0 0 0 99 0 101
1963 3 0 0 0 63 0 66
1964 5 0 0 0 72 0 77
1965 16 0 0 0 89 0 105
1966 7 0 0 0 194 0 201
1967 6 0 0 0 325 0 331
1968 8 0 0 0 329 0 337
1969 12 0 0 0 303 0 315
1970 16 0 0 0 240 0 256
1971 22 0 0 0 335 0 357
1972 18 0 0 0 457 0 475
1973 25 0 0 0 426 0 451
1974 16 0 0 1 334 0 351
1975 19 0 0 0 14 0 33
1976 24 0 0 0 18 0 42
1977 21 1 0 0 15 0 37
1978 45 2 63 0 31 0 141
1979 60 0 165 0 35 0 260
1980 33 0 109 0 10 0 152
1981 66 0 212 0 12 0 290
1982 96 0 406 1 81 0 584
1983 108 0 298 0 85 0 491
1984 110 0 367 0 109 0 586
1985 117 0 164 0 66 0 347
1986 77 0 133 0 41 0 251
1987 81 0 185 0 44 0 310
1988 74 0 155 0 29 0 258
1989 68 0 252 0 44 0 364
1990 68 0 272 0 83 0 423
1991 83 0 272 0 73 0 428
1992 66 0 176 0 122 0 364
1993 36 0 311 0 75 0 422
1994 97 0 505 0 93 0 695
1995 138 0 584 0 155 0 877
1996 213 0 720 0 218 0 1151
1997 143 0 305 0 115 0 563
1998 53 0 198 0 95 0 346
1999 50 0 0 0 90 0 140
2000 62 0 200 0 126 0 388
2001 104 0 191 0 188 0 483
2002 101 0 256 0 117 0 474
ICES Advice on fishing opportunities, catch, and effort Published 30 June 2017 lem.27.3a47d
ICES Advice 2017 7
Year Official landings
Belgium Denmark France Netherlands UK Other Total
2003 128 0 251 0 112 0 491
2004 120 0 198 1 105 0 424
2005 90 0 187 2 71 0 350
2006 98 0 100 0 48 0 246
2007 70 0 72 1 21 0 164
2008 140 0 46 3 45 0 234
2009 149 0 176 9 108 0 442
2010 101 0 85 5 32 0 223
2011 153 0 178 15 57 0 403
2012 171 0 167 20 0 0 358
2013 176 0 179 26 110 0 491
2014 162 0 108 14 72 0 357
2015 123 0 84 5 41 0 253
2016 115 0 69 9 47 0 240
Area 7.d: ICES estimates of landings and discards
Year ICES estimates of landings ICES estimates of discards
Belgium Denmark France Netherlands UK Other Total Total
2013 174 0 178 0 110 0 463 113
2014 163 0 0 0 72 0 234 99
2015 123 0 85 10 42 0 260 113
2016 158 0 69 8 47 0 281 64
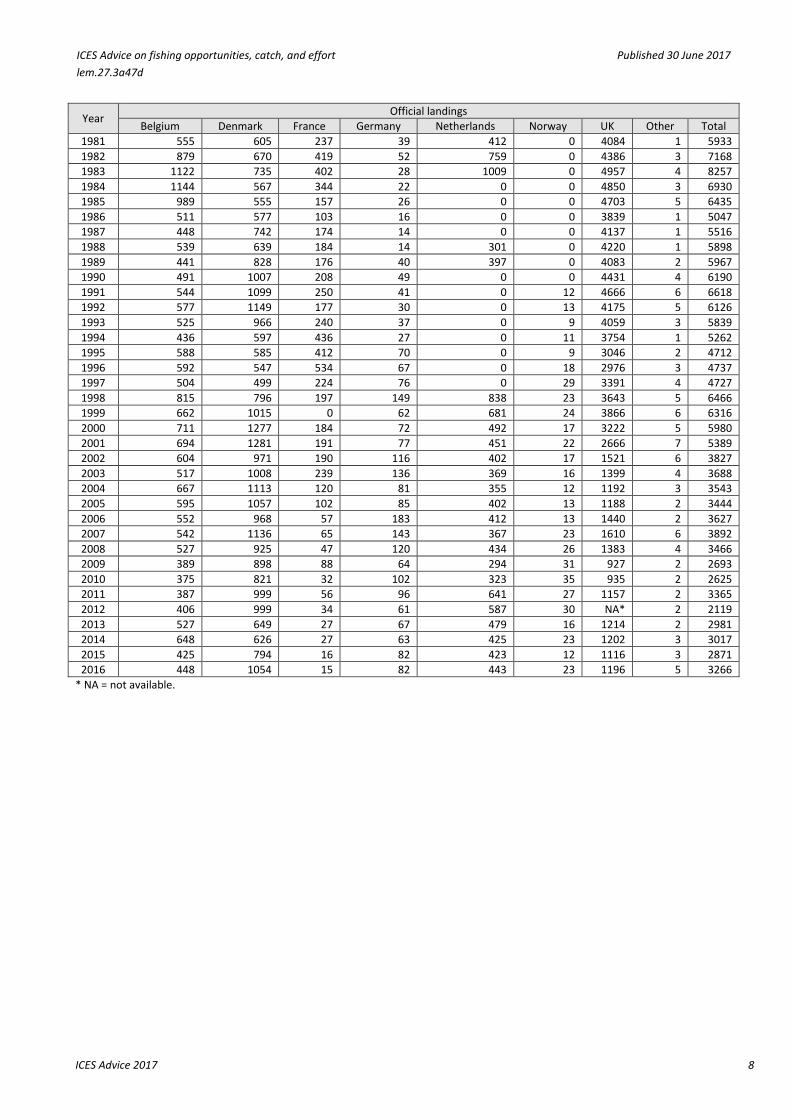
Area 4: official landings
Year Official landings
Belgium Denmark France Germany Netherlands Norway UK Other Total
1950 112 435 139 31 156 0 2855 26 3754
1951 115 845 90 21 167 0 3430 42 4710
1952 98 391 227 26 168 0 3953 59 4922
1953 73 409 189 18 132 0 4590 29 5440
1954 2 272 177 24 112 0 3368 17 3972
1955 49 311 0 15 78 0 3374 9 3836
1956 48 222 0 19 58 0 3034 14 3395
1957 39 249 0 24 64 0 3032 11 3419
1958 30 171 0 13 43 0 2835 12 3104
1959 85 242 0 40 43 0 3226 11 3647
1960 155 577 0 46 67 0 3178 12 4035
1961 286 488 0 79 102 0 3934 11 4900
1962 175 501 0 54 106 0 3794 0 4630
1963 365 222 0 36 71 0 3097 0 3791
1964 484 358 0 62 75 0 3142 0 4121
1965 562 385 0 91 93 0 3818 0 4949
1966 594 548 0 98 65 0 4110 0 5415
1967 601 791 0 136 61 0 4599 0 6188
1968 422 775 0 96 34 0 4943 0 6270
1969 292 639 0 80 36 0 3423 0 4470
1970 241 307 0 52 58 0 2776 0 3434
1971 348 514 0 54 122 0 2929 0 3967
1972 423 530 0 59 130 0 2530 0 3672
1973 566 478 0 73 217 16 3218 0 4568
1974 486 447 0 59 269 0 2966 0 4227
1975 748 521 0 83 299 0 3367 11 5029
1976 493 506 0 68 308 0 3443 12 4830
1977 618 321 0 71 262 0 4387 2 5661
1978 760 517 28 54 231 0 4518 0 6108
1979 674 876 136 41 390 0 4308 3 6428
1980 484 599 102 49 303 0 4885 2 6424
ICES Advice on fishing opportunities, catch, and effort Published 30 June 2017 lem.27.3a47d
ICES Advice 2017 8
Year Official landings
Belgium Denmark France Germany Netherlands Norway UK Other Total
1981 555 605 237 39 412 0 4084 1 5933
1982 879 670 419 52 759 0 4386 3 7168
1983 1122 735 402 28 1009 0 4957 4 8257
1984 1144 567 344 22 0 0 4850 3 6930
1985 989 555 157 26 0 0 4703 5 6435
1986 511 577 103 16 0 0 3839 1 5047
1987 448 742 174 14 0 0 4137 1 5516
1988 539 639 184 14 301 0 4220 1 5898
1989 441 828 176 40 397 0 4083 2 5967
1990 491 1007 208 49 0 0 4431 4 6190
1991 544 1099 250 41 0 12 4666 6 6618
1992 577 1149 177 30 0 13 4175 5 6126
1993 525 966 240 37 0 9 4059 3 5839
1994 436 597 436 27 0 11 3754 1 5262
1995 588 585 412 70 0 9 3046 2 4712
1996 592 547 534 67 0 18 2976 3 4737
1997 504 499 224 76 0 29 3391 4 4727
1998 815 796 197 149 838 23 3643 5 6466
1999 662 1015 0 62 681 24 3866 6 6316
2000 711 1277 184 72 492 17 3222 5 5980
2001 694 1281 191 77 451 22 2666 7 5389
2002 604 971 190 116 402 17 1521 6 3827
2003 517 1008 239 136 369 16 1399 4 3688
2004 667 1113 120 81 355 12 1192 3 3543
2005 595 1057 102 85 402 13 1188 2 3444
2006 552 968 57 183 412 13 1440 2 3627
2007 542 1136 65 143 367 23 1610 6 3892
2008 527 925 47 120 434 26 1383 4 3466
2009 389 898 88 64 294 31 927 2 2693
2010 375 821 32 102 323 35 935 2 2625
2011 387 999 56 96 641 27 1157 2 3365
2012 406 999 34 61 587 30 NA* 2 2119
2013 527 649 27 67 479 16 1214 2 2981
2014 648 626 27 63 425 23 1202 3 3017
2015 425 794 16 82 423 12 1116 3 2871
2016 448 1054 15 82 443 23 1196 5 3266
* NA = not available.
ICES Advice on fishing opportunities, catch, and effort Published 30 June 2017 lem.27.3a47d
ICES Advice 2017 9
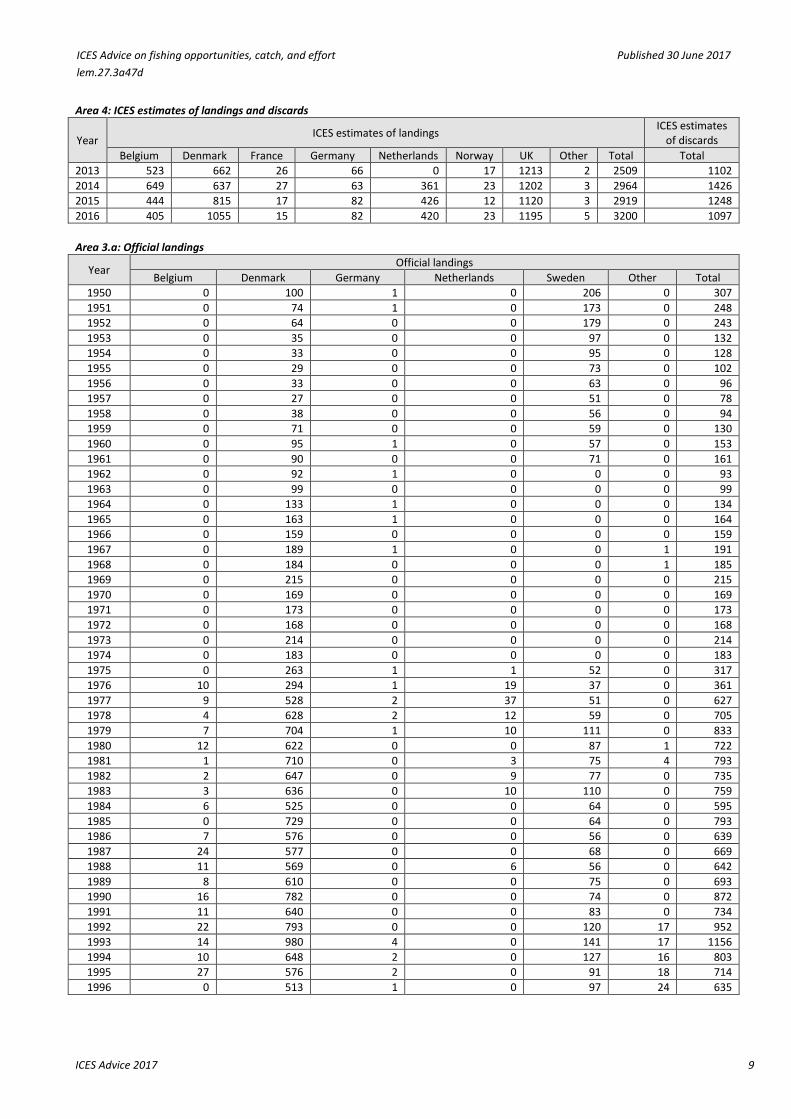
Area 4: ICES estimates of landings and discards
Year ICES estimates of landings
ICES estimates of discards
Belgium Denmark France Germany Netherlands Norway UK Other Total Total
2013 523 662 26 66 0 17 1213 2 2509 1102
2014 649 637 27 63 361 23 1202 3 2964 1426
2015 444 815 17 82 426 12 1120 3 2919 1248
2016 405 1055 15 82 420 23 1195 5 3200 1097
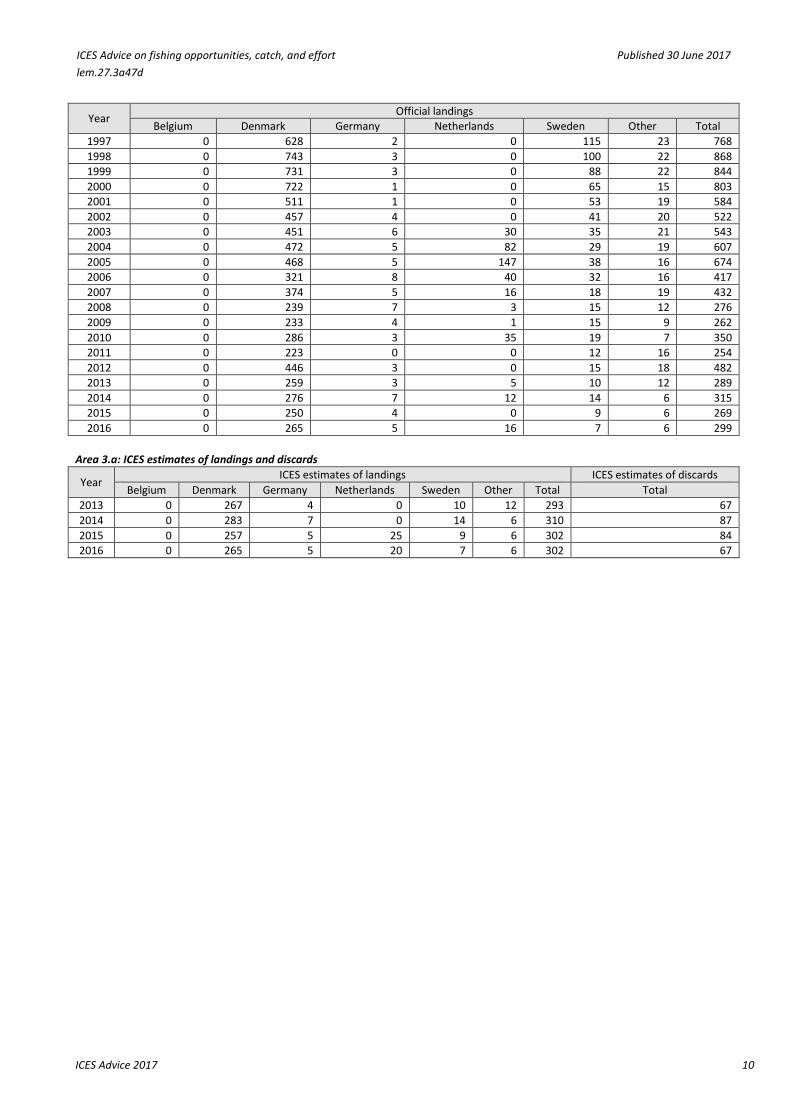
Area 3.a: Official landings
Year Official landings
Belgium Denmark Germany Netherlands Sweden Other Total
1950 0 100 1 0 206 0 307
1951 0 74 1 0 173 0 248
1952 0 64 0 0 179 0 243
1953 0 35 0 0 97 0 132
1954 0 33 0 0 95 0 128
1955 0 29 0 0 73 0 102
1956 0 33 0 0 63 0 96
1957 0 27 0 0 51 0 78
1958 0 38 0 0 56 0 94
1959 0 71 0 0 59 0 130
1960 0 95 1 0 57 0 153
1961 0 90 0 0 71 0 161
1962 0 92 1 0 0 0 93
1963 0 99 0 0 0 0 99
1964 0 133 1 0 0 0 134
1965 0 163 1 0 0 0 164
1966 0 159 0 0 0 0 159
1967 0 189 1 0 0 1 191
1968 0 184 0 0 0 1 185
1969 0 215 0 0 0 0 215
1970 0 169 0 0 0 0 169
1971 0 173 0 0 0 0 173
1972 0 168 0 0 0 0 168
1973 0 214 0 0 0 0 214
1974 0 183 0 0 0 0 183
1975 0 263 1 1 52 0 317
1976 10 294 1 19 37 0 361
1977 9 528 2 37 51 0 627
1978 4 628 2 12 59 0 705
1979 7 704 1 10 111 0 833
1980 12 622 0 0 87 1 722
1981 1 710 0 3 75 4 793
1982 2 647 0 9 77 0 735
1983 3 636 0 10 110 0 759
1984 6 525 0 0 64 0 595
1985 0 729 0 0 64 0 793
1986 7 576 0 0 56 0 639
1987 24 577 0 0 68 0 669
1988 11 569 0 6 56 0 642
1989 8 610 0 0 75 0 693
1990 16 782 0 0 74 0 872
1991 11 640 0 0 83 0 734
1992 22 793 0 0 120 17 952
1993 14 980 4 0 141 17 1156
1994 10 648 2 0 127 16 803
1995 27 576 2 0 91 18 714
1996 0 513 1 0 97 24 635
ICES Advice on fishing opportunities, catch, and effort Published 30 June 2017 lem.27.3a47d
ICES Advice 2017 10
Year Official landings
Belgium Denmark Germany Netherlands Sweden Other Total
1997 0 628 2 0 115 23 768
1998 0 743 3 0 100 22 868
1999 0 731 3 0 88 22 844
2000 0 722 1 0 65 15 803
2001 0 511 1 0 53 19 584
2002 0 457 4 0 41 20 522
2003 0 451 6 30 35 21 543
2004 0 472 5 82 29 19 607
2005 0 468 5 147 38 16 674
2006 0 321 8 40 32 16 417
2007 0 374 5 16 18 19 432
2008 0 239 7 3 15 12 276
2009 0 233 4 1 15 9 262
2010 0 286 3 35 19 7 350
2011 0 223 0 0 12 16 254
2012 0 446 3 0 15 18 482
2013 0 259 3 5 10 12 289
2014 0 276 7 12 14 6 315
2015 0 250 4 0 9 6 269
2016 0 265 5 16 7 6 299
Area 3.a: ICES estimates of landings and discards
Year ICES estimates of landings ICES estimates of discards
Belgium Denmark Germany Netherlands Sweden Other Total Total
2013 0 267 4 0 10 12 293 67
2014 0 283 7 0 14 6 310 87
2015 0 257 5 25 9 6 302 84
2016 0 265 5 20 7 6 302 67
ICES Advice on fishing opportunities, catch, and effort Published 30 June 2017 lem.27.3a47d
ICES Advice 2017 11
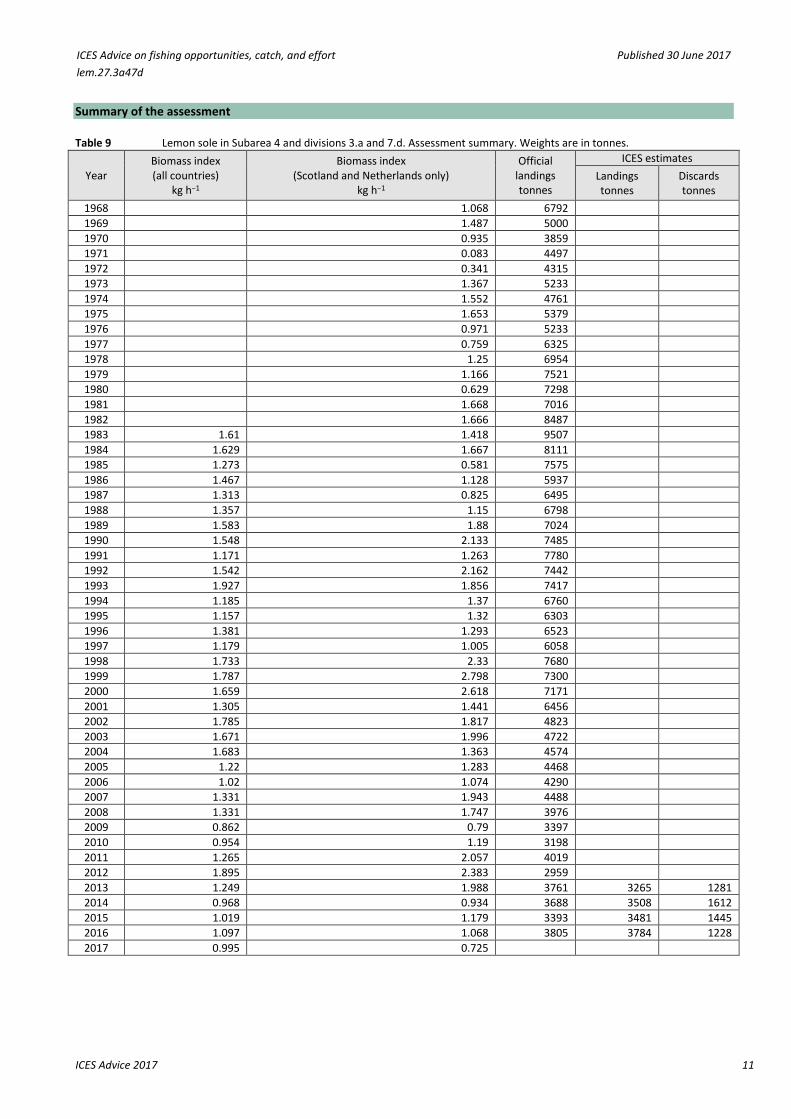
Summary of the assessment Table 9 Lemon sole in Subarea 4 and divisions 3.a and 7.d. Assessment summary. Weights are in tonnes.
Year Biomass index (all countries)
kg h−1
Biomass index (Scotland and Netherlands only)
kg h−1
Official landings tonnes
ICES estimates
Landings tonnes
Discards tonnes
1968 1.068 6792
1969 1.487 5000
1970 0.935 3859
1971 0.083 4497
1972 0.341 4315
1973 1.367 5233
1974 1.552 4761
1975 1.653 5379
1976 0.971 5233
1977 0.759 6325
1978 1.25 6954
1979 1.166 7521
1980 0.629 7298
1981 1.668 7016
1982 1.666 8487
1983 1.61 1.418 9507
1984 1.629 1.667 8111
1985 1.273 0.581 7575
1986 1.467 1.128 5937
1987 1.313 0.825 6495
1988 1.357 1.15 6798
1989 1.583 1.88 7024
1990 1.548 2.133 7485
1991 1.171 1.263 7780
1992 1.542 2.162 7442
1993 1.927 1.856 7417
1994 1.185 1.37 6760
1995 1.157 1.32 6303
1996 1.381 1.293 6523
1997 1.179 1.005 6058
1998 1.733 2.33 7680
1999 1.787 2.798 7300
2000 1.659 2.618 7171
2001 1.305 1.441 6456
2002 1.785 1.817 4823
2003 1.671 1.996 4722
2004 1.683 1.363 4574
2005 1.22 1.283 4468
2006 1.02 1.074 4290
2007 1.331 1.943 4488
2008 1.331 1.747 3976
2009 0.862 0.79 3397
2010 0.954 1.19 3198
2011 1.265 2.057 4019
2012 1.895 2.383 2959
2013 1.249 1.988 3761 3265 1281
2014 0.968 0.934 3688 3508 1612
2015 1.019 1.179 3393 3481 1445
2016 1.097 1.068 3805 3784 1228
2017 0.995 0.725
ICES Advice on fishing opportunities, catch, and effort Published 30 June 2017 lem.27.3a47d
ICES Advice 2017 12
Sources and references ICES 2012. ICES Implementation of Advice for Data-limited Stocks in 2012 in its 2012 Advice. ICES CM 2012/ACOM:68. 42 pp.
ICES. 2016. Advice basis. In Report of the ICES Advisory Committee, 2016. ICES Advice 2016, Book 1, Section 1.2.
ICES. 2017. Report of the Working Group on the Assessment of Demersal Stocks in the North Sea and Skagerrak (WGNSSK), 26 April–5 May 2017, ICES Headquarters, Copenhagen, Denmark. ICES CM 2017/ACOM:21.
Pedersen, M. W., and Berg, C. W. 2017. A stochastic surplus production model in continuous time. Fish and Fisheries, 18: 226–243. doi: 10.1111/faf.12174.