Embed Size (px)
Citation preview
1
Activity Data Report for the ER Program of Lao PDR March 2018 Department of Forestry Lao PDR

2
Contents
1. OBJECTIVES ................................................................................................................ 1
2. METHODOLOGY ........................................................................................................ 1
2.1 Mapping frequency ............................................................................................ 2
2.2 Forest definition and land/forest classification system ..................................... 2
2.2.1 Forest definition .............................................................................................. 2
2.2.2 Land/forest classification system .................................................................... 2
2.3 Development of the Forest Type Maps .............................................................. 4
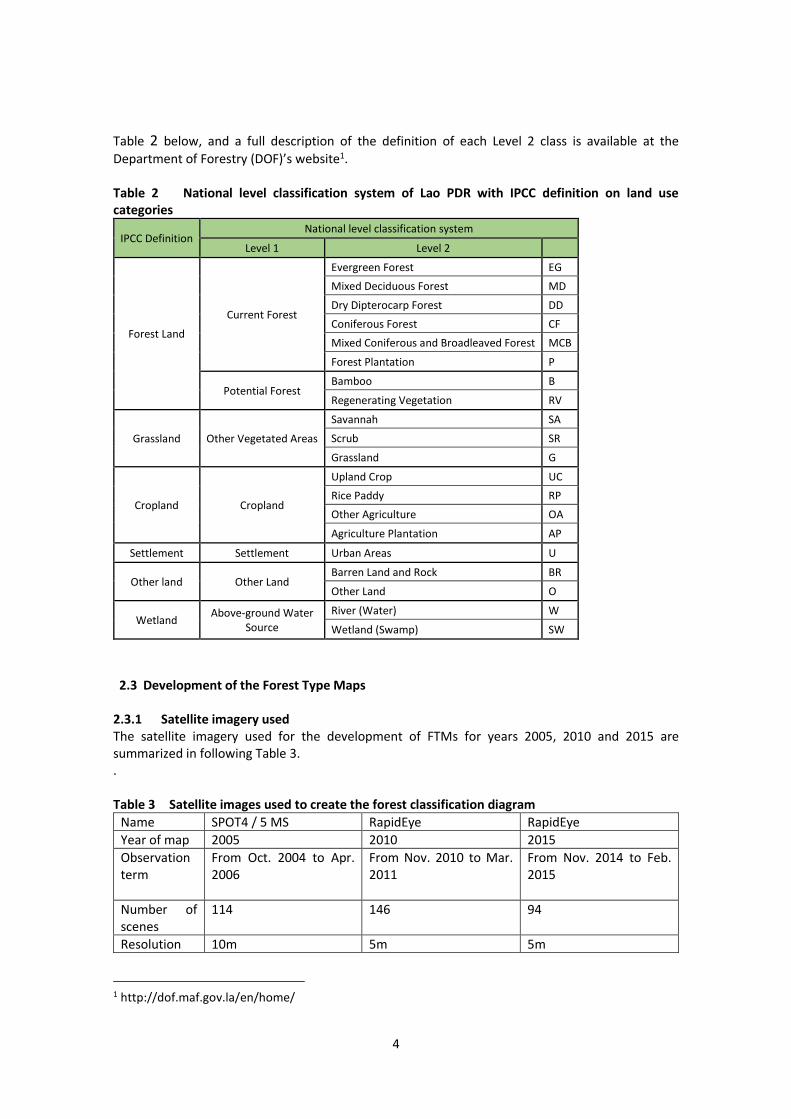
2.3.1 Satellite imagery used ..................................................................................... 4
2.3.2 Technical process of the development of Forest Type Maps (FTM) 2005, 2010 and 2015 .............................................................................................................. 5
2.4 Stratification of land/forest classes .................................................................. 11
2.5 Sources and sinks selected ............................................................................... 14
2.6 Design-based area estimation of Activity Data ................................................ 17
2.6.1 Sampling design ............................................................................................ 17
2.6.2 Response design ............................................................................................ 19
2.6.3 Creation of error matrix ................................................................................ 21
2.6.4 Results of design-based estimation of Activity Data .................................... 21
2.7 Map accuracy assessment ................................................................................ 23
3. CONCLUSIONS AND AREAS FOR FUTURE IMPROVEMENT .................................... 23
REFERENCES ................................................................................................................... 25
Appendix 1 Major findings from the time-series-analysis ........................................... 26

3
List of Figures Figure 1 Overview of the FTM development process ........................................... 5
Figure 2 Comparison of pixel-based classification and object-based classification .......................................................................................................................... 6
Figure 3 Workflow for the development of Forest Type Map ............................. 7
Figure 4 Slash-and-burn cycle and land/forest classes ......................................... 8
Figure 5 Forest Type Map 2005 ............................................................................ 10
Figure 6 Forest Type Map 2010 ........................................................................... 11
Figure 7 Forest Type Map 2015 ........................................................................... 11
Figure 8 Stratified Forest Type Map 2005 ........................................................... 13
Figure 9 Stratified Forest Type Map 2010 ........................................................... 13
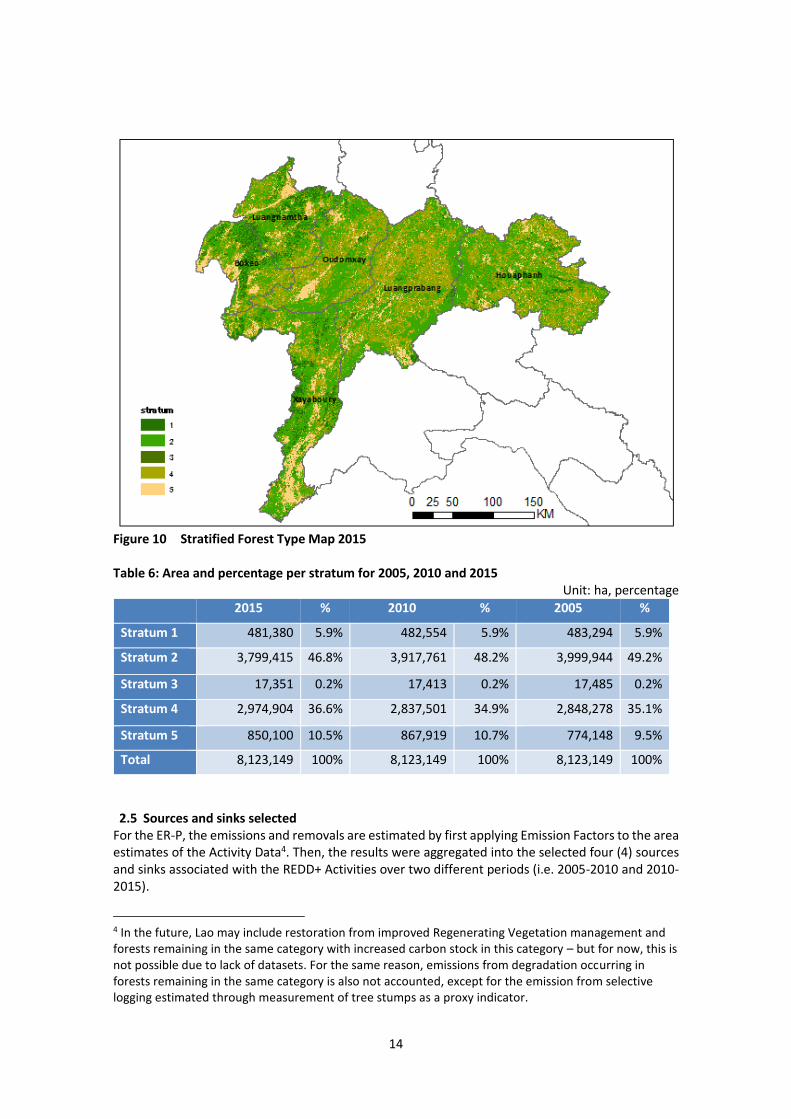
Figure 10 Stratified Forest Type Map 2015 ......................................................... 14
Figure 11 Sources and sinks associated with REDD + activities .......................... 15
Figure 12 Sources and Sinks Map 2005 - 2010 ..................................................... 16
Figure 13 Sources and Sinks Map 2010 - 2015 ..................................................... 16
Figure 14 Example of reference data design using Collect Earth ......................... 20
List of Tables Table 1 Forest definition of Lao PDR ...................................................................... 2
Table 2 National level classification system of Lao PDR with IPCC definition on land use categories ........................................................................................... 4
Table 3 Satellite images used to create the forest classification diagram ............ 4
Table 4 Patterns of illogical changes ..................................................................... 9
Table 5: Land/forest classes and stratification ....................................................... 12
Table 6: Area and percentage per stratum for 2005, 2010 and 2015 .................... 14
Table 7: Sampling design per source/sink 2005 - 2010 .......................................... 18
Table 8: Sampling design per source/sink 2010 - 2015 .......................................... 18
Table 9 Error matrix per source/sink 2005 - 2010 ................................................ 21
Table 10 Error matrix per source/sink 2010 - 2015 .............................................. 21
Table 11 Areas per source/sink 2005 - 2010 ........................................................ 22
Table 12 Areas per source/sink 2010 - 2015 ....................................................... 22
Table 13 Activity Data 2005 - 2010...................................................................... 22
Table 14 Activity Data 2010 - 2015...................................................................... 23
Table 15 Map accuracy and uncertainty of Activity Data 2005 - 2010 ................ 23
Table 16 Map accuracy and uncertainty of Activity Data 2010 - 2015 ................ 23
4
Acronyms
AD Activity Data B Bamboo CF Coniferous Forest DBH Diameter at Breast Height DD Dry Dipterocarp Forest DOF Department of Forestry EG Evergreen Forest FCPF Forest Carbon Partnership Facility FIM Forest Information Management Project FIPD Forestry Inventory and Planning Division FREL Forest Reference Emission Level FRL Forest Reference Level FTM Forest Type Map GHG Greenhouse Gas GIS Geographic Information System IPCC Intergovernmental Panel on Climate Change IT Information Technology Lao PDR Lao People’s Democratic Republic M Million (when used for expressing units) MAF Ministry of Agriculture and Forestry MCB Mixed Coniferous Broadleaved Forest MD Mixed Deciduous Forest MRV Measurement, Reporting and Verification NFI National forest Inventory NFMS National Forest Monitoring System OA Other Agriculture P Plantation REDD+ Reducing Emissions from Deforestation and forest Degradation plus the
conservation of forest carbon stocks, sustainable management of forests and enhancement of forest carbon stocks
RV Regenerating Vegetation UC Upland Crop UNFCCC United Nations Framework Convention on Climate Change
1
1. OBJECTIVES The objectives of this report is to outline the process and result regarding the production of Activity Data (AD) for the estimation of Reference Level (RL) for the Emission Reduction Program Accounting Area (ER-P AA). The report describes the two main areas of work, namely:
1) Development of Forest Type Maps (FTMs) of the ER-P AA (i.e. Luangnamtha, Bokeo,
Oudomxay, Xayaboury, Luangprabang, Houahpanh provinces) for years 2005, 2010, 2015;
2) Application of the forest type stratification (i.e. into five strata) to the FTMs and initial analysis of forest cover change which are used to conduct design-based area estimation of the changes in forest areas (Activity Data) which relate to any of the four (4) sources and sinks.
It should be note that the methods explained in this report only discuss the emissions and removals estimated by the use of spatially explicit AD (IPCC Approach 3). The emission from forest degradation by selective logging is estimated by proxy-based approach, therefore, not include in this report (See the ERPD Chapter 8).
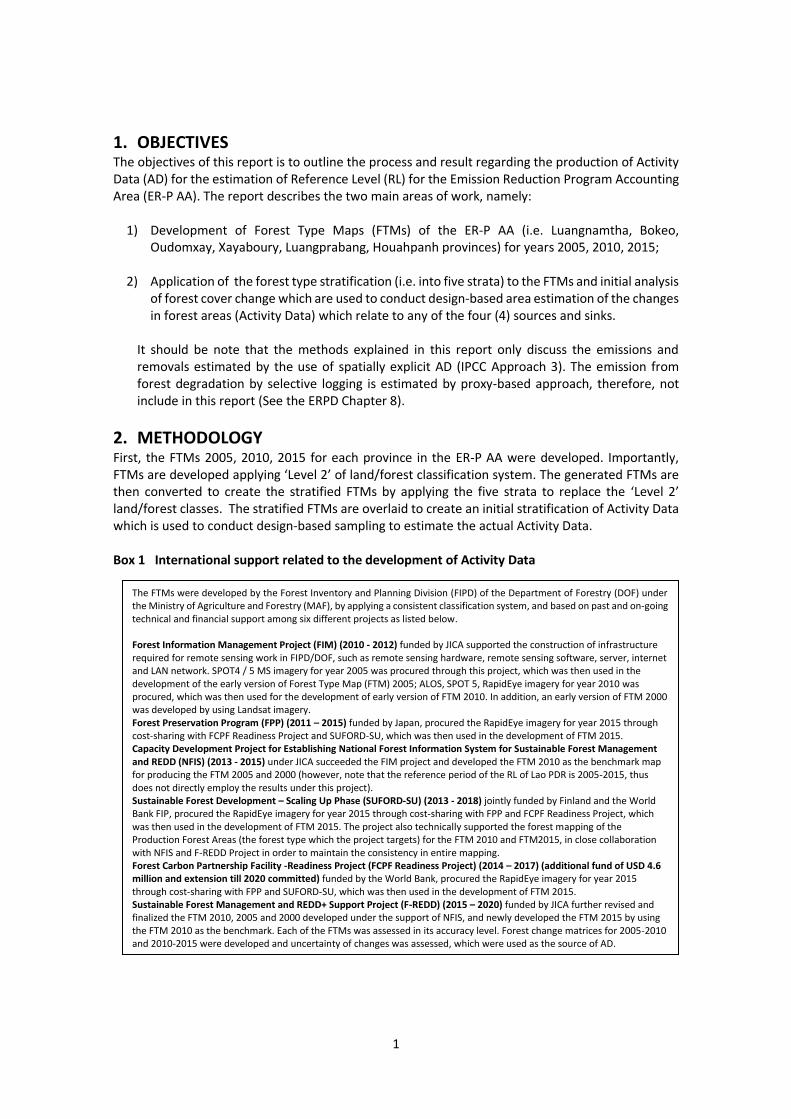
2. METHODOLOGY First, the FTMs 2005, 2010, 2015 for each province in the ER-P AA were developed. Importantly, FTMs are developed applying ‘Level 2’ of land/forest classification system. The generated FTMs are then converted to create the stratified FTMs by applying the five strata to replace the ‘Level 2’ land/forest classes. The stratified FTMs are overlaid to create an initial stratification of Activity Data which is used to conduct design-based sampling to estimate the actual Activity Data.
Box 1 International support related to the development of Activity Data
The FTMs were developed by the Forest Inventory and Planning Division (FIPD) of the Department of Forestry (DOF) under the Ministry of Agriculture and Forestry (MAF), by applying a consistent classification system, and based on past and on-going technical and financial support among six different projects as listed below. Forest Information Management Project (FIM) (2010 - 2012) funded by JICA supported the construction of infrastructure required for remote sensing work in FIPD/DOF, such as remote sensing hardware, remote sensing software, server, internet and LAN network. SPOT4 / 5 MS imagery for year 2005 was procured through this project, which was then used in the development of the early version of Forest Type Map (FTM) 2005; ALOS, SPOT 5, RapidEye imagery for year 2010 was procured, which was then used for the development of early version of FTM 2010. In addition, an early version of FTM 2000 was developed by using Landsat imagery. Forest Preservation Program (FPP) (2011 – 2015) funded by Japan, procured the RapidEye imagery for year 2015 through cost-sharing with FCPF Readiness Project and SUFORD-SU, which was then used in the development of FTM 2015. Capacity Development Project for Establishing National Forest Information System for Sustainable Forest Management and REDD (NFIS) (2013 - 2015) under JICA succeeded the FIM project and developed the FTM 2010 as the benchmark map for producing the FTM 2005 and 2000 (however, note that the reference period of the RL of Lao PDR is 2005-2015, thus does not directly employ the results under this project). Sustainable Forest Development – Scaling Up Phase (SUFORD-SU) (2013 - 2018) jointly funded by Finland and the World Bank FIP, procured the RapidEye imagery for year 2015 through cost-sharing with FPP and FCPF Readiness Project, which was then used in the development of FTM 2015. The project also technically supported the forest mapping of the Production Forest Areas (the forest type which the project targets) for the FTM 2010 and FTM2015, in close collaboration with NFIS and F-REDD Project in order to maintain the consistency in entire mapping. Forest Carbon Partnership Facility -Readiness Project (FCPF Readiness Project) (2014 – 2017) (additional fund of USD 4.6 million and extension till 2020 committed) funded by the World Bank, procured the RapidEye imagery for year 2015 through cost-sharing with FPP and SUFORD-SU, which was then used in the development of FTM 2015. Sustainable Forest Management and REDD+ Support Project (F-REDD) (2015 – 2020) funded by JICA further revised and finalized the FTM 2010, 2005 and 2000 developed under the support of NFIS, and newly developed the FTM 2015 by using the FTM 2010 as the benchmark. Each of the FTMs was assessed in its accuracy level. Forest change matrices for 2005-2010 and 2010-2015 were developed and uncertainty of changes was assessed, which were used as the source of AD.

2
2.1 Mapping frequency The AD for the ER-P was developed for two time periods: 2005-2010; and 2010-2015. Availability of official dataset which covers the ER-P AA was the ultimate reason of selecting the two time periods. Some background in arriving at this decision is presented below:
1) In the early stages of REDD+ readiness, while preparing towards submission of the Readiness Package Proposal to the FCPF, GoL consulted strategic options regarding the FREL/FRL and how to prepare necessary data including AD. It was agreed that a national wall-to-wall map with 2010 as the benchmark and dating back with 5-year intervals (i.e. 2005, 2000) would be appropriate. This was considered reasonable also from the perspective of the year 2000 being around the time when new major trends in land-use were observed to be emerging in the country;
2) Through the FIM project (above) satellite imagery and technical support was provided to the GoL to initiate the mapping in 2010;
3) Although not yet realized, GoL’s intentions to carry out the National Forest Inventory (NFI: field-based forest survey) every 5 years were expressed, thus, wall-to-wall mapping with 5-year interval was considered appropriate to cross-reference;
4) As large part of Lao PDR’s landscape is shifting cultivation, a 5-year interval was deemed as the minimum interval to capture resulting land/forest use changes.
2.2 Forest definition and land/forest classification system
2.2.1 Forest definition According to the Land Law (2003) and Forestry Law (2007), forest and forest resources in Lao PDR occur in lands that are designated by the Government as forest lands, and in areas outside forest lands, and includes stocked and temporarily un-stocked forests.
Lao PDR has a national definition of Current Forests which is used in the planning, monitoring and evaluation of forests. A summary is shown in the following Table 1. Table 1 Summary of the Current Forest definition of Lao PDR
Items Value
DBH Minimum of 10cm
Crown Density Minimum of 20% Area Minimum of 0.5 ha
This definition was used for the past two National Communications on Climate Change, and has been agreed to be used for the future national GHG inventory starting with the Third National Communication which the GoL plans to submit to the UNFCCC in early 2019. 2.2.2 Land/forest classification system The land/forest classification system of the country applies two levels of classification, including Level 1 consisting of seven classes including “Current Forest” and “Potential Forest” among others, and Level 2 which further classifies the Level 1 current forest class into six natural and plantation classes. The relation between the national land/forest classification system and the land-use category definition of the IPCC is illustrated in Table 2 below. The carbon accounting applied in the national FREL/FRL and the RL for the ER Program uses both Current and Potential Forest classes as corresponding to the IPCC forestland category.

3
When Lao PDR initiated the development of its national Forest Type Maps (wall-to-wall maps of the entire territory) in the context of REDD+ around 2010, the government and the stakeholders, first, reviewed the land/forest classification system to be applied for the mapping. An important point was to ensure the classification system is in harmony with the land-use category definition of the IPCC in order to maintain consistency between the REDD+ and GHG Inventory while meeting national needs in a variety of applications. Another was to determine how to categorize the temporarily un-stocked forests (“regenerating vegetation: RV”) and upland crop (UC) in the classification system. This reflects the unique situation of forests and forest use in the country, and in particular, the prevalence of pioneering and shifting cultivation, and presence of vast areas of forest fallow. This land-use is seen throughout the country, but is particularly characteristic of the hilly and mountainous Northern landscapes including the ER-P AA where a significant area is covered under forest fallow stages of shifting cultivation, regenerating through natural vegetative succession and in and out of temporarily un-stocked states. UC and RV are predominately considered to be stages of the shifting cultivation cycle, and these lands are considered to re-grow and recover through natural vegetative succession. Through intensive discussions within DOF and with stakeholders on whether to classify these under the IPCC land use category of “Forest Land” or “Cropland”, it was concluded that for the purpose of REDD+ (including for the ER Program), in line with the IPCC definition, to classify RV as “Forest Land” as it they are “…vegetation that currently fall below, but are expected to exceed, the threshold of forest land category.” (IPCC, 2003) and classify UC as “Cropland” as they are used, even temporarily, for cropping at the time of mapping. The GoL has been implementing actions to reduce deforestation by stabilizing shifting cultivation, and to restore of those lands into forest through various means. However, the impact has been limited, where according to the FTM analysis over the period of 2000-2015, only approximately 100,000 ha out of 2,954,443ha (in 2015) have been restored from RV to forest which exceed the threshold of the forest definition (i.e. 3-4% of the total RV area). Lao PDR recognizes that by applying such method of classification, a piece of land not undergoing land use change, but, only temporary land cover change (i.e. short-term changes) would be subject to designation as a change event. However, Lao PDR choses to apply this method for the REDD+ FRL/FREL and MMR/MRV. The overestimation of change resulting from method of classification is consistently and symmetrically conducted for emissions and removals. For example, when a shifting cultivation landscape undergoes change from RV (forest fallow) to UC (cropping) this short-term loss is recorded; on the other hand, when the UC (cropping) is left for fallow and regenerates into RV, this removal is also recorded; meaning that overestimation of emissions is offset by overestimation of removals, so far as the rotational agricultural practice continues. The decision for the Current Forest definition over a more conventional forest definition which includes a height threshold is to allow for better results in the identification of land cover classes. By applying this definition of a minimum stand DBH of 10cm, some land with small diameter trees which would have been classified as forest under a height threshold definition can be excluded. The other reason for the application of this forest definition is to do with trees in rice paddy landscapes in the flatland areas. In order to avoid misinterpretation of these paddy lands (which often have canopy cover of over 10%) as forests, the 20% crown density threshold has been adopted. The relation between the national land/forest classification system and the land-use category definition of the IPCC is shown in
4
Table 2 below, and a full description of the definition of each Level 2 class is available at the
Department of Forestry (DOF)’s website1. Table 2 National level classification system of Lao PDR with IPCC definition on land use categories
IPCC Definition National level classification system
Level 1 Level 2
Forest Land
Current Forest
Evergreen Forest EG
Mixed Deciduous Forest MD
Dry Dipterocarp Forest DD
Coniferous Forest CF
Mixed Coniferous and Broadleaved Forest MCB
Forest Plantation P
Potential Forest Bamboo B
Regenerating Vegetation RV
Grassland Other Vegetated Areas
Savannah SA
Scrub SR
Grassland G
Cropland Cropland
Upland Crop UC
Rice Paddy RP
Other Agriculture OA
Agriculture Plantation AP
Settlement Settlement Urban Areas U
Other land Other Land Barren Land and Rock BR
Other Land O
Wetland Above-ground Water
Source
River (Water) W
Wetland (Swamp) SW
2.3 Development of the Forest Type Maps
2.3.1 Satellite imagery used The satellite imagery used for the development of FTMs for years 2005, 2010 and 2015 are summarized in following Table 3. . Table 3 Satellite images used to create the forest classification diagram
Name SPOT4 / 5 MS RapidEye RapidEye
Year of map 2005 2010 2015
Observation term
From Oct. 2004 to Apr. 2006
From Nov. 2010 to Mar. 2011
From Nov. 2014 to Feb. 2015
Number of scenes
114 146 94
Resolution 10m 5m 5m
1 http://dof.maf.gov.la/en/home/
5
Bands Band1: Green Band2: Red Band3: NIR Band4: SWIR
Band1: Blue Band2: Green Band3: Red Band4: Rededge Band5: NIR
Band1: Blue Band2: Green Band3: Red Band4: Rededge Band5: NIR
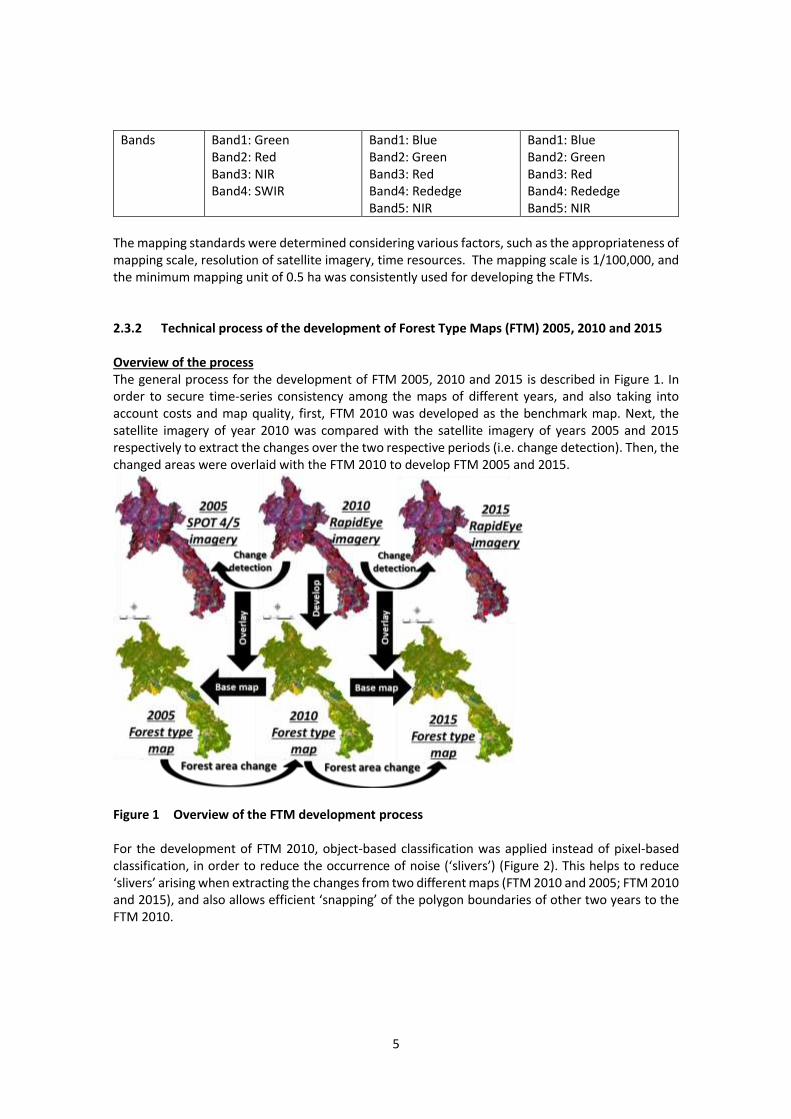
The mapping standards were determined considering various factors, such as the appropriateness of mapping scale, resolution of satellite imagery, time resources. The mapping scale is 1/100,000, and the minimum mapping unit of 0.5 ha was consistently used for developing the FTMs. 2.3.2 Technical process of the development of Forest Type Maps (FTM) 2005, 2010 and 2015 Overview of the process The general process for the development of FTM 2005, 2010 and 2015 is described in Figure 1. In order to secure time-series consistency among the maps of different years, and also taking into account costs and map quality, first, FTM 2010 was developed as the benchmark map. Next, the satellite imagery of year 2010 was compared with the satellite imagery of years 2005 and 2015 respectively to extract the changes over the two respective periods (i.e. change detection). Then, the changed areas were overlaid with the FTM 2010 to develop FTM 2005 and 2015.
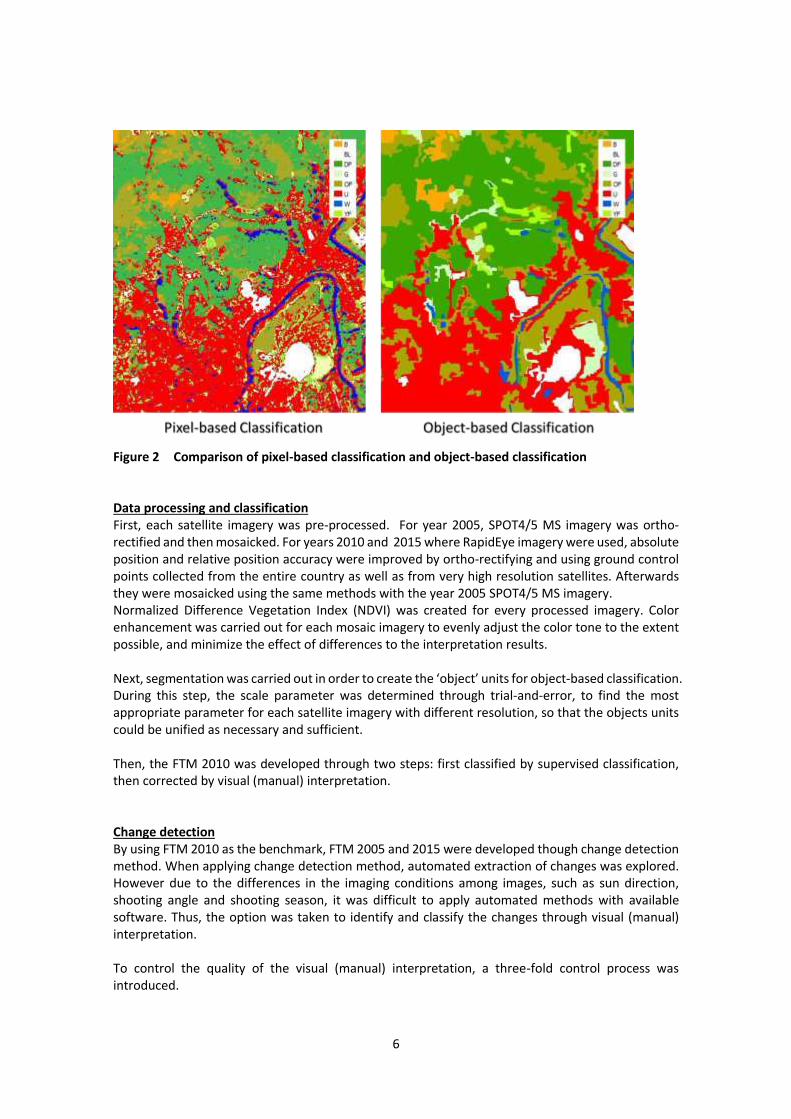
Figure 1 Overview of the FTM development process For the development of FTM 2010, object-based classification was applied instead of pixel-based classification, in order to reduce the occurrence of noise (‘slivers’) (Figure 2). This helps to reduce ‘slivers’ arising when extracting the changes from two different maps (FTM 2010 and 2005; FTM 2010 and 2015), and also allows efficient ‘snapping’ of the polygon boundaries of other two years to the FTM 2010.
6
Figure 2 Comparison of pixel-based classification and object-based classification Data processing and classification First, each satellite imagery was pre-processed. For year 2005, SPOT4/5 MS imagery was ortho-rectified and then mosaicked. For years 2010 and 2015 where RapidEye imagery were used, absolute position and relative position accuracy were improved by ortho-rectifying and using ground control points collected from the entire country as well as from very high resolution satellites. Afterwards they were mosaicked using the same methods with the year 2005 SPOT4/5 MS imagery. Normalized Difference Vegetation Index (NDVI) was created for every processed imagery. Color enhancement was carried out for each mosaic imagery to evenly adjust the color tone to the extent possible, and minimize the effect of differences to the interpretation results. Next, segmentation was carried out in order to create the ‘object’ units for object-based classification. During this step, the scale parameter was determined through trial-and-error, to find the most appropriate parameter for each satellite imagery with different resolution, so that the objects units could be unified as necessary and sufficient. Then, the FTM 2010 was developed through two steps: first classified by supervised classification, then corrected by visual (manual) interpretation. Change detection By using FTM 2010 as the benchmark, FTM 2005 and 2015 were developed though change detection method. When applying change detection method, automated extraction of changes was explored. However due to the differences in the imaging conditions among images, such as sun direction, shooting angle and shooting season, it was difficult to apply automated methods with available software. Thus, the option was taken to identify and classify the changes through visual (manual) interpretation.
To control the quality of the visual (manual) interpretation, a three-fold control process was introduced.

7
Step 1: interpretation by FIPD remote sensing engineers. Each engineer was assigned to a specific
region (a group of provinces) where his/her specialized knowledge can be utilized and further accumulated.
Step 2: quality check by FIDP senior remote sensing engineers. Any possibilities of
misinterpretation and errors were returned to the Step 1 engineer for re-checking. Step 3: sample-based random quality check by external international remote sensing engineers
from F-REDD Project. Any possibilities of misinterpretation and errors were returned to the Step 1 engineer for re-checking.
As widely recommended, remote sensing exercise was combined with nation-wide ground truth survey to improve and verify the map quality, and also to build the interpretation capacity of the FIPD remote sensing engineers involved in the task. The results of ground truth survey were organized into a system for improvement, such as establishing interpretation standards for each satellite imagery and classification item, preparation/updating of interpretation cards, then shared among the interpretation team. To avoid overestimation of emissions and removals, only the cases which could be interpreted as ‘obvious change’ were extracted. The detailed work flow is shown in Figure 3.
Figure 3 Workflow for the development of Forest Type Map Challenges related to the classification of land under shifting cultivation A technical challenge faced throughout the forest mapping exercise was to accurately and consistently distinguish the Upland Crop (UC), Regenerating Vegetation (RV) and Mixed Deciduous Forest (MD).

8
As a supplementary measure to improve the classification accuracy and time-series consistency for UC, RV and MD classes (considered to be associated with shifting cultivation), the FIPD team made corrections to the FTM classes based on the years since the land was slashed and burnt. This involved a survey of the number of years of fallow required to regenerate to meet the forest definition (i.e. the threshold year). The survey used the annual vegetation loss dataset by Hansen et al 2 to detect the year of loss on forest loss plots, then ground truth and measure the crown cover to find whether it has reached the status as ‘forest’. The results of survey showed that the threshold number of years for a RV fallow to reach the forest threshold was on average seven years. By adding one year for cropping (classified as “UC”), it was assumed that a land slashed and burnt would regenerate into forest status in eight years (see the “RD Survey” Report 3 for details). Box 2 Challenges related to the classification of land under shifting cultivation
However, the two issues below related to the use of dataset from Hansen et al. were taken into account while maintaining conservativeness in estimates, and only the plots (polygons) which clearly satisfy the criteria above were revised:
2 Hansen, M. C., P. V. Potapov, R. Moore, M. Hancher, S. A. Turubanova, A. Tyukavina, D. Thau, S. V. Stehman, S. J. Goetz, T. R. Loveland, A. Kommareddy, A. Egorov, L. Chini, C. O. Justice, and J. R. G. Townshend. 2013. “High-Resolution Global Maps of 21st-Century Forest Cover Change.” Science 342 (15 November): 850–53. Data available on-line from: http://earthenginepartners.appspot.com/science-2013-global-forest. 3 DOF, et al. (2017) “Development of a Lao-specific Equation for the Estimation of Biomass of ‘Regenerating Vegetation’ and Determination of the Threshold Years for its Regeneration into Forest. <http://dof.maf.gov.la/en/home/>
The total area of these three land/forest classes account for nearly 70% of the land of Lao PDR and over 80% of the land of the ER-P AA. Due to the prevalence of shifting cultivation in Lao PDR and particularly in the northern region (ER-P target area), large areas of land are shifting between these three different land/forest classes. Accurate interpretation of the transition events from UC (i.e. non-forest land) to RV (i.e. forest land temporarily un-stocked and does not meet the definition as forest) and then to MD, through satellite imagery presents a technical challenge (see Error! Reference source not found.). The classification of these land/forest classes can have significant impact on uncertainty.
Figure 4 Slash-and-burn cycle and land/forest classes Among the stages of shifting cultivation, UC is the stage of the land immediately after being slashed-and-burnt for cropping, and is relatively easy to classify due to the lack of, or reduced, vegetation cover. RV and MD are continuous phases of regeneration in many cases, and old RV and young MD have very similar color tone and texture on satellite imagery, thus, distinguishing the two in a single satellite imagery is technically challenging.
Upland Crop (UC) Regenerating Vegetation (RV) Mixed Deciduous Forest (MD)
DBH > 10cm
Crown Cover > 20%
9
1) The Hansen et al. dataset includes vegetation loss occurring outside forest land (e.g. on agriculture land). Therefore, if a land parcel (polygon) is interpreted as UC for more than 10 years (continuously interpreted as UC over the 2 time periods of 2005-2010 and 2010-2015) it was determined as permanent agricultural land and the classification of the latter year was revised to Other Agriculture (OA) class; and
2) The Hansen et al. dataset does not identify repeated loss events, thus, repeated loss could be under-estimated. Considering 8 years as the standard number of years for forest regeneration (i.e. 1 year as UC and 7 years under fallow), only the MD plots (polygons) where vegetation loss was confirmed in the past one to eight years were revised to RV (with an assumption that land will not regenerate into MD class in less than eight years).
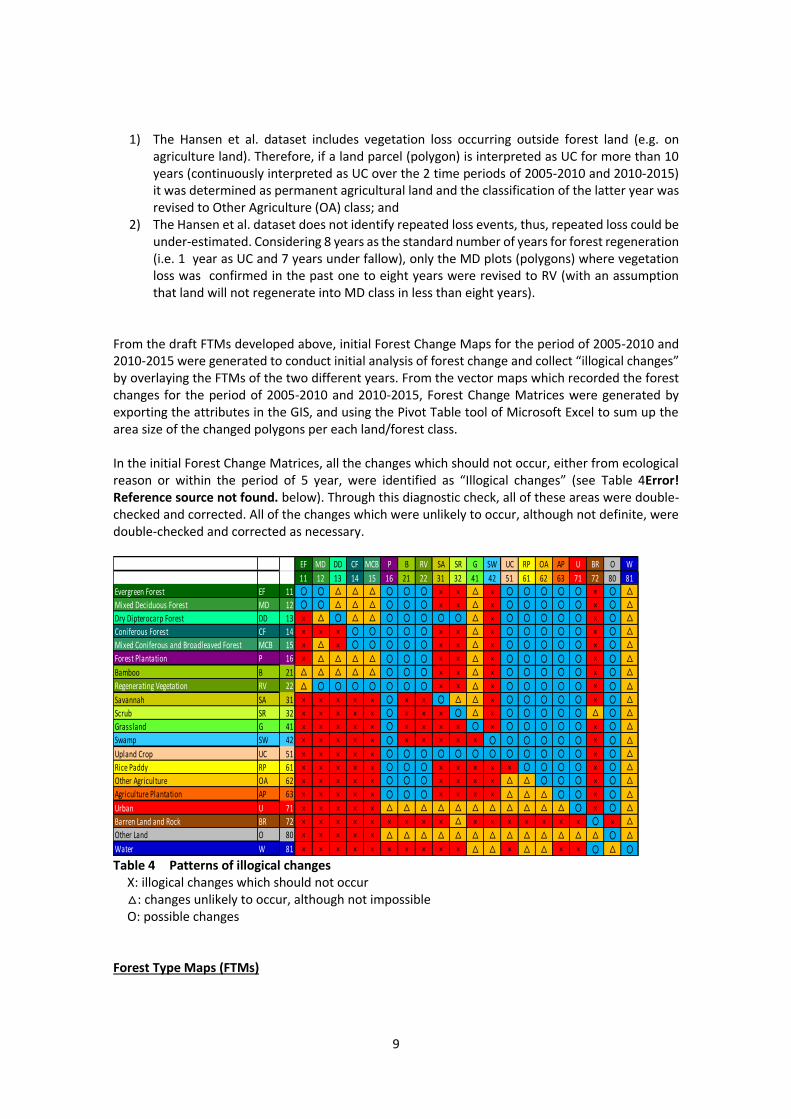
From the draft FTMs developed above, initial Forest Change Maps for the period of 2005-2010 and 2010-2015 were generated to conduct initial analysis of forest change and collect “illogical changes” by overlaying the FTMs of the two different years. From the vector maps which recorded the forest changes for the period of 2005-2010 and 2010-2015, Forest Change Matrices were generated by exporting the attributes in the GIS, and using the Pivot Table tool of Microsoft Excel to sum up the area size of the changed polygons per each land/forest class. In the initial Forest Change Matrices, all the changes which should not occur, either from ecological reason or within the period of 5 year, were identified as “Illogical changes” (see Table 4Error! Reference source not found. below). Through this diagnostic check, all of these areas were double-checked and corrected. All of the changes which were unlikely to occur, although not definite, were double-checked and corrected as necessary.
Table 4 Patterns of illogical changes
X: illogical changes which should not occur △: changes unlikely to occur, although not impossible O: possible changes
Forest Type Maps (FTMs)
EF MD DD CF MCB P B RV SA SR G SW UC RP OA AP U BR O W
11 12 13 14 15 16 21 22 31 32 41 42 51 61 62 63 71 72 80 81
Evergreen Forest EF 11 ○ ○ △ △ △ ○ ○ ○ × × △ × ○ ○ ○ ○ ○ × ○ △
Mixed Deciduous Forest MD 12 ○ ○ △ △ △ ○ ○ ○ × × △ × ○ ○ ○ ○ ○ × ○ △
Dry Dipterocarp Forest DD 13 × △ ○ △ △ ○ ○ ○ ○ ○ △ × ○ ○ ○ ○ ○ × ○ △
Coniferous Forest CF 14 × × × ○ ○ ○ ○ ○ × × △ × ○ ○ ○ ○ ○ × ○ △
Mixed Coniferous and Broadleaved Forest MCB 15 × △ × ○ ○ ○ ○ ○ × × △ × ○ ○ ○ ○ ○ × ○ △
Forest Plantation P 16 × △ △ △ △ ○ ○ ○ × × △ × ○ ○ ○ ○ ○ × ○ △
Bamboo B 21 △ △ △ △ △ ○ ○ ○ × × △ × ○ ○ ○ ○ ○ × ○ △
Regenerating Vegetation RV 22 △ ○ ○ ○ ○ ○ ○ ○ × × △ × ○ ○ ○ ○ ○ × ○ △
Savannah SA 31 × × × × × ○ × × ○ △ △ × ○ ○ ○ ○ ○ × ○ △
Scrub SR 32 × × × × × ○ × × × ○ △ × ○ ○ ○ ○ ○ △ ○ △
Grassland G 41 × × × × × ○ × × × × ○ × ○ ○ ○ ○ ○ × ○ △
Swamp SW 42 × × × × × ○ × × × × × ○ ○ ○ ○ ○ ○ × ○ △
Upland Crop UC 51 × × × × × ○ ○ ○ ○ ○ ○ ○ ○ ○ ○ ○ ○ × ○ △
Rice Paddy RP 61 × × × × × ○ ○ ○ × × × × × ○ ○ ○ ○ × ○ △
Other Agriculture OA 62 × × × × × ○ ○ ○ × × × × △ △ ○ ○ ○ × ○ △
Agriculture Plantation AP 63 × × × × × ○ ○ ○ × × × × △ △ △ ○ ○ × ○ △
Urban U 71 × × × × × △ △ △ △ △ △ △ △ △ △ △ ○ × ○ △
Barren Land and Rock BR 72 × × × × × × × × × △ × × × × × × × ○ × △
Other Land O 80 × × × × × △ △ △ △ △ △ △ △ △ △ △ △ △ ○ △
Water W 81 × × × × × × × × × × △ △ × △ △ × × ○ △ ○

10
Figure 5, Figure 6 and Figure 7 show the final FTMs for year 2005, 2010 and 2015 for the ER-P AA (i.e. 6 provinces) which were extracted from the national FTMs.
Figure 5 Forest Type Map 2005

11
Figure 6 Forest Type Map 2010
Figure 7 Forest Type Map 2015 2.4 Stratification of land/forest classes
In order to reduce uncertainty of emissions and removals while balancing the accuracy of sampling and the cost/efforts required, the land/forest classification explained in Section 2.2 was further stratified into five strata as below and as summarized in Table 5:
• Evergreen Forest (EG) has distinctly high carbon stocks (200.00tC), thus, separated as an independent stratum – Stratum 1 (expanse: 481,380ha, 5.9% of the ER-P AA).
• Mix Deciduous Forest (MD), Conifer Forest (CF) and Mixed Coniferous and Broadleaved Forest (MCB) will form one stratum on the basis of similarity in carbon stocks per hectare (87.7tC, 92.6tC, 114.7tc). – Stratum 2 (expanse: 3,799,415ha, 46.8% of the ER-P AA).
• Dry Dipterocarp Forest (DF) will form one stratum due to the difference in carbon stock from other forest classes (43.2tC), and also due to the fact that they are mostly distributed in the low-lands and prone to conversion to other land use – Stratum 3 (expanse: 17,351ha, 0.2% of the ER-P AA).
• Plantation (P), Bamboo (B) and Regenerating Vegetation (RV) will form one strata on the basis of similarity in average carbon stock (37.2tC, 24.4tC, 17.4tC) and the limited area in the ER-P AA – Stratum 4 (expanse: 2,974,904ha, 36.6% of the ER-P AA).
• The remaining 12 non-forest classes will form one stratum – Stratum 5 (expanse: 850,100ha, 10.5% of the ER-P AA).

12
Table 5: Land/forest classes and stratification
Land/forest classes Area (ha) 2015
% of total area
Strata
Level 1 Level 2
Current Forest
Evergreen Forest EG 481,380 5.9% 1 Mixed Deciduous Forest MD
3,799,415 46.8% 2 Coniferous Forest CF
Mixed Coniferous and Broadleaved Forest
MCB
Dry Dipterocarp Forest DD 17,351 0.2% 3 Forest Plantation P
2,974,904 36.6% 4 Potential Forest
Bamboo B
Regenerating Vegetation RV
Other vegetated Areas
Savannah SA
850,100 10.5% 5
Scrub SR
Grassland G
Cropland
Upland Crop UC
Rice Paddy RP
Other Agriculture OA
Agriculture Plantation AP
Settlement Urban U
Other Land Barren Land and Rock BR
Other Land O
Above-ground Water Source
River (Water) W
Wetland (Swamp) SW
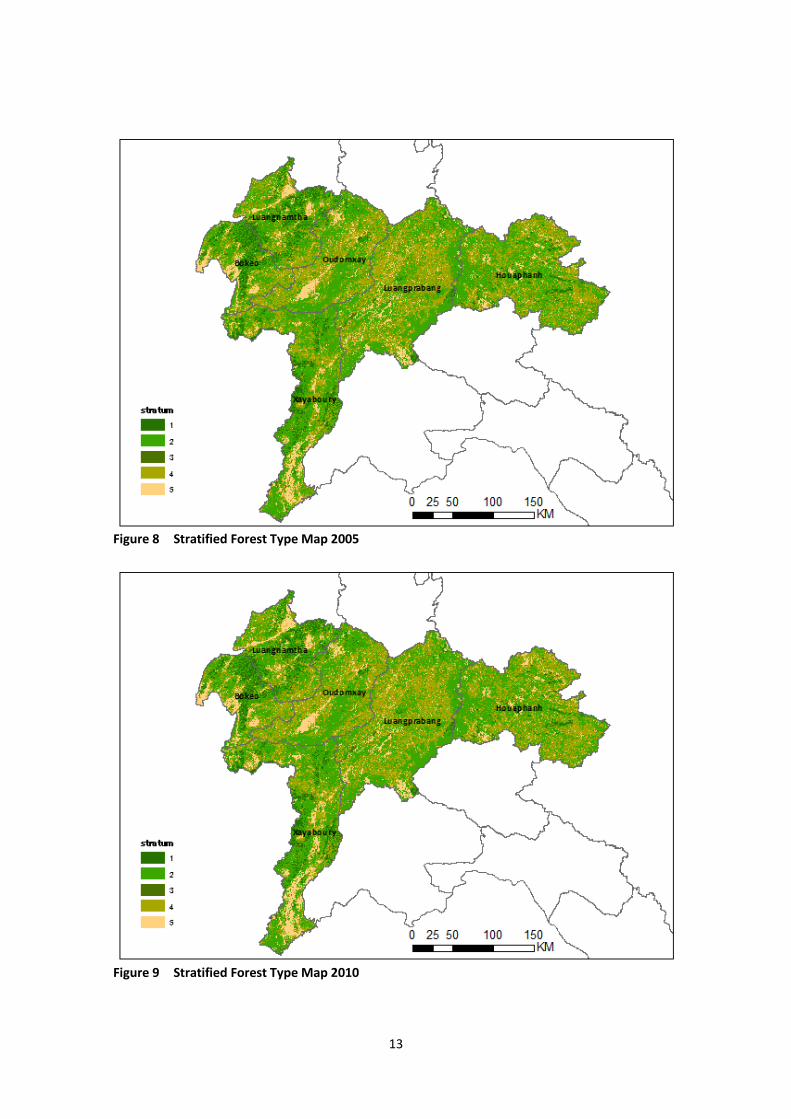
Total 8,123,149 100.0% Stratified Forest Type Maps (FTMs) Figure 8, Figure 9 and Figure 10 show the stratified FTMs for year 2005, 2010 and 2015 for the ER-P AA respectively, and Table 6 summarizes the area and percentage of each stratum for different years.
13
Figure 8 Stratified Forest Type Map 2005
Figure 9 Stratified Forest Type Map 2010
14
Figure 10 Stratified Forest Type Map 2015 Table 6: Area and percentage per stratum for 2005, 2010 and 2015
Unit: ha, percentage
2015 % 2010 % 2005 %
Stratum 1 481,380 5.9% 482,554 5.9% 483,294 5.9%
Stratum 2 3,799,415 46.8% 3,917,761 48.2% 3,999,944 49.2%
Stratum 3 17,351 0.2% 17,413 0.2% 17,485 0.2%
Stratum 4 2,974,904 36.6% 2,837,501 34.9% 2,848,278 35.1%
Stratum 5 850,100 10.5% 867,919 10.7% 774,148 9.5%
Total 8,123,149 100% 8,123,149 100% 8,123,149 100%
2.5 Sources and sinks selected
For the ER-P, the emissions and removals are estimated by first applying Emission Factors to the area estimates of the Activity Data4. Then, the results were aggregated into the selected four (4) sources and sinks associated with the REDD+ Activities over two different periods (i.e. 2005-2010 and 2010-2015).
4 In the future, Lao may include restoration from improved Regenerating Vegetation management and forests remaining in the same category with increased carbon stock in this category – but for now, this is not possible due to lack of datasets. For the same reason, emissions from degradation occurring in forests remaining in the same category is also not accounted, except for the emission from selective logging estimated through measurement of tree stumps as a proxy indicator.

15
In Lao PDR’s carbon accounting, all the emissions from deforestation and forest degradation are regarded as anthropogenic, for the reasons that, the ER-Program area is home to many different mountain ethnic minorities groups in and interacting with the forests in their daily lives; and large-scale natural disasters in forest areas or forest diseases are not common. In addition there is no suitable technology yet to clearly distinguish anthropogenic and non-anthropogenic emissions:
Emissions from Deforestation (DF), caused by loss of forest carbon stock due to conversion of a forest land stratum to non-forest land stratum;
Emissions from Forest Degradation (DG), caused by downward shift of a forest stratum from a higher carbon stock strata to another forest stratum with lower carbon stock5;
Removals from Forest Enhancement (Restoration) (RS), caused by upward shift of a forest land stratum with lower carbon stock to another forest/land stratum with higher carbon stock; and
Removals from Forest Enhancement (Reforestation) (RF), caused by gain of forest carbon stock due to conversion of non-forest land stratum to a forest land stratum.
In addition, there are two (2) stable types of land/forest classes which do not impact emissions or removals, which are:
Stable Forest (SF), where there is no change in the forest stratum; and. Stable Non-Forest (SNF), where there is no change in the non-forest land stratum.
Accordingly the AD will derived as amount of changes in forest areas which relate to any of the four (4) sources and sinks as shown in following Figure 11. The four (4) sources and sinks and the two (2) stable land/forest classes serve as stratification for collecting reference data to apply design based area estimation of Activity Data.
Figure 11 Sources and sinks associated with REDD + activities Sources and sinks maps The maps which shows the sources and sinks associated with REDD+ activities for 2005-2010 and 2010-2015 for the ER-P AA are shown in Figure 12 and Figure 13.
5 In addition to the use of stock difference method with the use of activity data and emission factors, impact of logging is estimated through field survey of tree stumps. This captures degradation not only caused by downward shift of a forest stratum, but also those in same forest land stratum. Possible double-counting of emissions from degradation arising from the use of two different methods are avoided in the accounting. The details are explained in Chapter 8 of the ERPD.
stratum 1 stratum 2 stratum 3 stratum 4 stratum 5
stratum 1 SF Deforestation (DF)
stratum 2 SF Degradation (DG)
stratum 3 SF Restoration (RS)
stratum 4 SF Reforestation (RF)
stratum 5 SNF Stable Forest (SF)
Stable Non-Forest (SNF)
RF
YearX+5
Year
X DFDG
RS

16
Figure 12 Sources and Sinks Map 2005 - 2010
Figure 13 Sources and Sinks Map 2010 - 2015

17
2.6 Design-based area estimation of Activity Data
The following sections explain the methods used for conducting design based area estimation using the stratified FTMs for collecting reference data. Lao PDR decided to apply design-based area estimation with respect to generating statistically reliable estimates of AD. This method follows good practice recommended by Olofsson et al. (2014)6, which regards the stratified FTMs to serve as an initial stratification of the population of interest for the purposes of designing and collecting reference data which will actually be used to estimate the actual changed areas. 2.6.1 Sampling design In principle, the sample size for the reference data was determined as proportional to the changed areas associated to the four sources and sinks as well as to the two stable types of land/forest classes, except for the cases where the sample size was intentionally increased where the sample size would otherwise have been too small due to the rare occurrence of such changes. A stratified random sampling (probability sampling design; inclusion of probability known for each unit selected in the sample and greater than zero for all units in the target area) was applied to distribute the sampling points. The variance estimator (the formula below) was used for the assessment of user accuracy in order to determine the sample size needed to achieve certain standard errors for the assumed estimated user's accuracy for each stratum (iterative process).
Where N = number of sample points for the stratum of interest
= standard error of the estimated overall accuracy that we would like to achieve Wi = mapped proportion of area of stratum i, Si = standard deviation of stratum i. The sample size was determined by using the formula by Cochran (1977), assuming that the sampling cost of each stratum is the same. The calculation was done using FAO SEPAL which allows automated calculation of sampling size and distribution. The following values were set as the target for allocating statistically sound sampling size7: Standard error of 0.01 for the overall user accuracy; Standard error of 0.7 for Forest Degradation, Deforestation, Restoration and Reforestation; Standard error of 0.9 for Stable forest and Stable Non-Forest; and Minimum sample size for each stratum is 308. As a result, the sampling design for the reference data was created as shown in Table 7 and Table 8.
6 Application of this method for the development of AD was advised by the World Bank mission during the preparation of the ERPD. 7 According to Congalton and Green (2008), the minimum sample size for assessing the accuracy of remotely sensed data is recommended to be in the range of 20 – 100 samples.

18
The actual sample size for the period 2005-2010 are shown in Table 7. The total number of plots sampled was 970 plots, where 30 sampling plots were given to DG, DF, RF and RS respectively, to ensure statistical soundness (i.e. otherwise, from proportional allocation, the sample size would be < 30 plots). The total number sampled for SF and SNF were 783 plots and 67 plots respectively. Table 7: Sampling design per source/sink 2005 - 2010
Similarly for the period 2010-2015, as shown in Table 8, the total number of plots sampled was 954 plots, where 30 sampling plots were given to DG, DF, RF and RS respectively, and the total number sampled for SF and SNF were 755 plots and 79 plots respectively. Table 8: Sampling design per source/sink 2010 - 2015
Souce/Sink
CategoryDegradation (DG) Deforestation (DF) Restoration (RS) Reforestation (RF) Stable forest (SF)
Stable Non-Forest
(SNF)Total
Area (ha) 97,911 270,691 45,869 178,195 6,933,250 597,234 8,123,149
Expected User’s
Accuracy0.70 0.70 0.70 0.70 0.90 0.90
Wi (Mapped
proportion)0.01 0.03 0.01 0.02 0.85 0.07
Si (Standard
Deviation)0.46 0.46 0.46 0.46 0.30 0.30
Wi*Si 0.01 0.02 0.00 0.01 0.26 0.02 0.31
(SE overall
accuracy)0.01
970.61
970
Total
Equal 161.67 161.67 161.67 161.67 161.67 161.67 970
Proportional 12 32 5 21 828 71 970
Adjusted 30 30 30 30 783 67 970
Total Number of Samples
Sample size per stratum
Souce/Sink
CategoryDegradation (DG) Deforestation (DF) Restoration (RS) Reforestation (RF) Stable forest (SF)
Stable Non-Forest
(SNF)Total
Area (ha) 125,686 131,002 45,606 148,234 6,952,904 719,716 8,123,149
Expected User’s
Accuracy0.70 0.70 0.70 0.70 0.90 0.90
Wi (Mapped
proportion)0.02 0.02 0.01 0.02 0.86 0.09
Si (Standard
Deviation)0.46 0.46 0.46 0.46 0.30 0.30
Wi*Si 0.01 0.01 0.00 0.01 0.26 0.03 0.31
(SE overall
accuracy)0.01
953.43
954
Total
Equal 159.00 159.00 159.00 159.00 159.00 159.00 954
Proportional 15 15 5 17 817 85 954
Adjusted 30 30 30 30 755 79 954
Total Number of Samples
Sample size per stratum

19
2.6.2 Response design The response design provides the best available interpretation of change for each spatial unit sampled. The spatial assessment unit was set as 1 ha (100 x 100 m), and square plots laid out with an internal grid and 5 x 5 = 25 reference points (to guide the interpretation) were prepared. The square plots were visually (manually) interpreted using high and medium resolution satellite imagery as the reference data. High and medium resolution satellite imagery were obtained from repository accessible through Google Earth and Google Earth Engine, as well as the satellite WMS layers (Landsat2000, SPOT 2005, RapidEye 2010, and RapidEye 2015) of FIPD and already made available for use through the Collect Earth tool9. Protocols and rules, such as reference labelling, were agreed on before conducting the assessment. Some examples from the interface of the reference data design are shown in Figure 14 below.
Collect Earth Interface (customized) on Google Earth
Alternative High-Resolution Satellite (Bing Maps)
Reference to Global Forest Change data processed by Google Earth Engine
Land/forest classes selected for different years
9 www.openforis.org/

20
LANDSAT2000 SPOT2005
RapidEye2010 RapidEye2015
Consistently verifying historical forest cover with Landsat imagery
Figure 14 Example of reference data design using Collect Earth
21
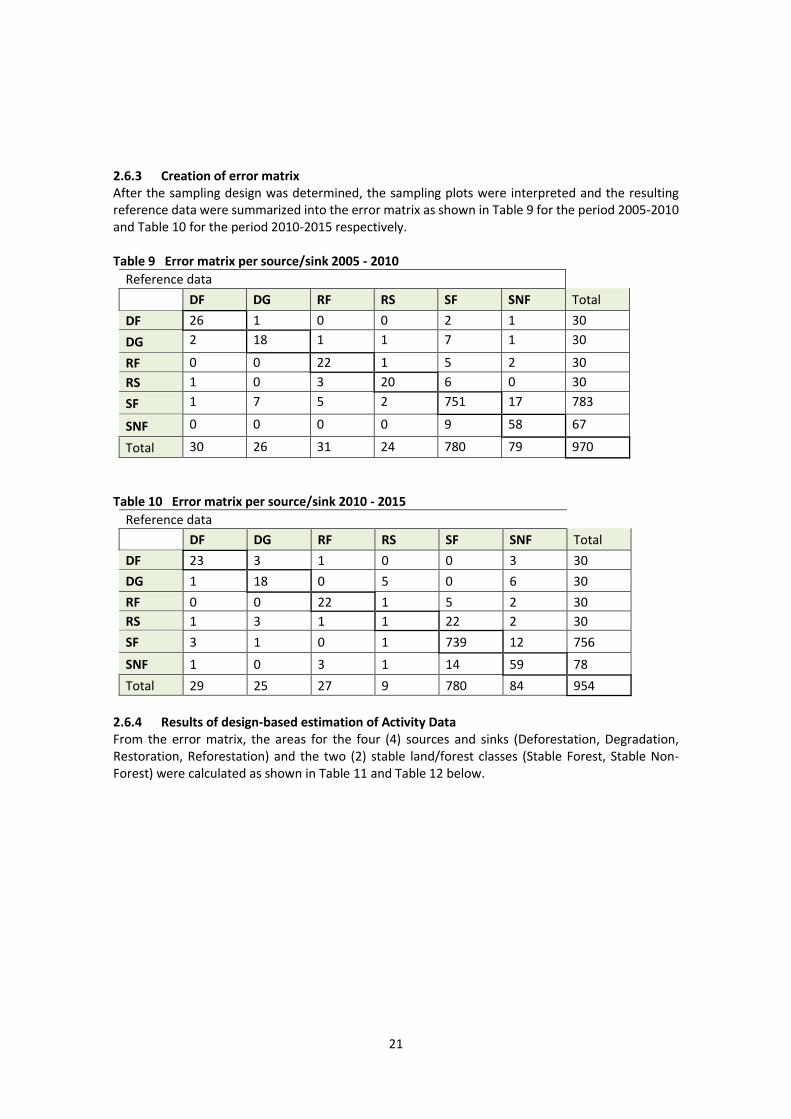
2.6.3 Creation of error matrix After the sampling design was determined, the sampling plots were interpreted and the resulting reference data were summarized into the error matrix as shown in Table 9 for the period 2005-2010 and Table 10 for the period 2010-2015 respectively. Table 9 Error matrix per source/sink 2005 - 2010
Reference data
DF DG RF RS SF SNF Total
DF 26 1 0 0 2 1 30
DG 2 18 1 1 7 1 30
RF 0 0 22 1 5 2 30
RS 1 0 3 20 6 0 30
SF 1 7 5 2 751 17 783
SNF 0 0 0 0 9 58 67
Total 30 26 31 24 780 79 970
Table 10 Error matrix per source/sink 2010 - 2015
Reference data
DF DG RF RS SF SNF Total
DF 23 3 1 0 0 3 30
DG 1 18 0 5 0 6 30
RF 0 0 22 1 5 2 30
RS 1 3 1 1 22 2 30
SF 3 1 0 1 739 12 756
SNF 1 0 3 1 14 59 78
Total 29 25 27 9 780 84 954
2.6.4 Results of design-based estimation of Activity Data From the error matrix, the areas for the four (4) sources and sinks (Deforestation, Degradation, Restoration, Reforestation) and the two (2) stable land/forest classes (Stable Forest, Stable Non-Forest) were calculated as shown in Table 11 and Table 12 below.

22
Table 11 Areas per source/sink 2005 - 2010
Class DF DG RF RS SF SNF
DF 0.0290 0.0011 0.0000 0.0000 0.0022 0.0011
DG 0.0008 0.0072 0.0004 0.0004 0.0028 0.0004
RF 0.0000 0.0000 0.0161 0.0007 0.0037 0.0015
RS 0.0002 0.0000 0.0006 0.0038 0.0011 0.0000
SF 0.0011 0.0076 0.0055 0.0022 0.8186 0.0185
SNF 0.0000 0.0000 0.0000 0.0000 0.0099 0.0635
Reference Class Proportion
0.0311 0.0160 0.0225 0.0071 0.8383 0.0850
Standard error 0.0024 0.0033 0.0031 0.0018 0.0072 0.0056
95% CI 0.0048 0.0064 0.0060 0.0036 0.0141 0.0110
Area 251,510 129,753 182,801 57,492 6,809,889 691,705
Table 12 Areas per source/sink 2010 - 2015
Class DF DG RF RS SF SNF
DF 0.0124 0.0016 0.0005 0.0000 0.0000 0.0016
DG 0.0005 0.0093 0.0000 0.0026 0.0000 0.0031
RF 0.0000 0.0000 0.0134 0.0006 0.0031 0.0012
RS 0.0002 0.0006 0.0002 0.0002 0.0041 0.0004
SF 0.0034 0.0011 0.0000 0.0011 0.8367 0.0136
SNF 0.0011 0.0000 0.0034 0.0011 0.0159 0.0670
Reference Class Proportion
0.0176 0.0126 0.0176 0.0056 0.8597 0.0868
Standard error 0.0027 0.0020 0.0025 0.0020 0.0062 0.0061
95% CI 0.0052 0.0040 0.0049 0.0040 0.0121 0.0119
Area 142,963 102,269 142,274 45,833 6,983,886 705,925
As the AD are the amount of areas changed among the 5 strata (as described in Section xx), the areas above were proportionally disaggregated back to the changes occurred among the 5 strata, and the final AD are determined as show in Table 13 and Table 14 below:
Table 13 Activity Data 2005 - 2010
2010
ha Stratum 1 Stratum 2 Stratum 3 Stratum 4 Stratum 5
2005 Stratum 1 473,906 355 0 482 154 Deforestation
Stratum 2 71 3,802,793 0 128,892 28,727 Degradation
Stratum 3 0 0 17,056 66 65 Restoration
Stratum 4 0 57,361 60 2,516,047 223,674 Reforestation
Stratum 5 0 0 0 182,805 690,635 No Change
Total 8,123,149

23
Table 14 Activity Data 2010 - 2015
2015
ha Stratum 1 Stratum 2 Stratum 3 Stratum 4 Stratum 5
2010 Stratum 1 483,524 120 7 257 767 Deforestation
Stratum 2 0 3,770,430 161 101,607 42,539
Degradation
Stratum 3 0 0 17,171 121 184
Restoration
Stratum 4 0 45,796 49 2,712,747 99,489
Reforestation
Stratum 5 0 0 0 142,703 705,477
No Change
Total 8,123,149
2.7 Map accuracy assessment
From the error matrix (shown in Section 2.6.3), user accuracy and producer accuracy of the FTMs were estimated for the four (4) sources and sinks and the two (2) stable land/forest classes. Finally, the uncertainty of AD was estimated as show in Table 15 and Table 16 below: Table 15 Map accuracy and uncertainty of Activity Data 2005 - 2010
Class DF DG RF RS SF SNF
AD uncertainty 15.5% 40.1% 26.7% 50.4% 1.7% 13.0%
User accuracy 86.7% 60.0% 73.3% 66.7% 95.9% 86.6%
Producer accuracy 86.7% 69.2% 71.0% 83.3% 96.3% 73.4%
Overall accuracy 92.3%
Table 16 Map accuracy and uncertainty of Activity Data 2010 - 2015
Class DF DG RF RS SF SNF
AD uncertainty 29.5% 31.8% 28.2% 70.5% 1.4% 13.7%
User accuracy 76.7% 60.0% 73.3% 3.3% 97.8% 75.6%
Producer accuracy 79.3% 72.0% 81.5% 11.1% 94.7% 70.2%
Overall accuracy 90.4%
3. CONCLUSIONS AND AREAS FOR FUTURE IMPROVEMENT
The FTMs (wall-to-wall maps) for year 2005, 2010 and 2015 were developed through consistent method, and the forest cover change for the period 2005-2010 and 2010-2015 were assessed with spatially explicit observations of land use and land-use change, satisfying “Approach 3” of the IPCC10. The maps were used to conduct design-based estimation of areas of Activity Data and map accuracy was assessed for the two respective periods. The resulting information was also analyzed as a time series from 2000-2015 (see the appendix) to better understand recent trends in land cover change in the project area, and to inform the development of the program strategy. The data are made accessible to public (although with different levels of access rights, depending on the viewer/user) through the NFMS Web portal to ensure transparency.
10 GPG LULUCF, (2003)

24
Three areas for future improvement are identified for step-wise improvement as well as to further reduce the uncertainty of AD: 1) Improvement of classification between MD and RV
The RV study, based on analysis of historical tree loss dataset from Hansen et al. combined with field surveys identified the number of years required to reach the forest definition after a slash and burning event is seven years. This information was used to improve the accuracy of classification between RV and MD. Also, noting that of the Hansen et al. data does not detect repeated slash and burn incidents, which is a typical land-use practice in the ER-P AA, for future forest mapping, Lao PDR will attempt to explore methods to detect repeated slash and burn practices in order to enable further analysis of land/forest cover change over time.
2) Updating FTM 2015 map and FTMs
As explained in Section 2.3.2, distinguishing UC and OA is a challenge, as they have very similar texture on satellite imagery. Therefore, in the current mapping method, if a land parcel (polygon) is interpreted as UC for more than 10 years (continuously interpreted as UC over the 2 time periods of 2005-2010 and 2010-2015) it was determined as permanent agricultural land and the classification of the latter year was revised to OA class. This is an example of challenges of conducting forest mapping with satellite imagery of a single year. In the future, Lao PDR may explore using options, such as the technologies to analyze ‘big data’, multi-temporal satellite dataset available, and GIS data from different sources (e.g. land concession data), which meet its needs.
3) Further capacity building of the remote sensing, GIS and IT engineers
FIPD/DOF has been increasing their remote sensing capacity with the technical and financial support from development partners and projects. However, under rapid innovation of remote sensing, GIS and IT technologies, demand for sufficient number of competent engineers/team is increasing. Particularly the skills and knowledge of the skilled senior engineers needs to systematically be passed on to the younger generation. Also, there is an emerging need for IT engineers who can manage and operate database systems which handle large and diverse range of digital data. In order to periodically develop the AD for the MMR, continuous capacity building efforts is inevitable. Development partners can continue to play an important role on systemizing the know-how, training on planning, development and analysis of data, and support the FIPD/DOF staff to catch-up with the innovative technologies.

25
REFERENCES Cochran, W.G. (1977). Sampling Techniques, 3rd ed. John Wiley and Sons, New York. Congalton, R. G. & Green, K. (2008). Assessing the Accuracy of Remotely Sensed Data: Principles
and Practices, Second Edition. CRC Press FAO (2016). Map Accuracy Assessment and Area Estimation: A Practical Guide, National forest
monitoring assessment working paper No.46/E, (http://www.fao.org/3/a-i5601e.pdf) FCPF (2010): Readiness Preparation Proposal, FCPF Carbon Fund FCPF (2015): Emission Reduction Program Idea Note (ER-PIN), FCPF Carbon Fund FCPF (2016): REDD+ Compass: Module 2.7 Estimation of uncertainties (https://www.forestcarbonpartnership.org/sites/fcp/files/2015/May/Module%202.7%20Lecture_0
8_05_15_final.pdf) GOFC-GOLD (2016): REDD+ Sourcebook (http://www.gofcgold.wur.nl/redd/sourcebook/GOFC-
GOLD_Sourcebook.pdf) GFOI (2016): Methods and Guidance Documentation (MGD)
(https://www.reddcompass.org/documents/184/0/MGD2.0_English/c2061b53-79c0-4606-859f-ccf6c8cc6a83)
Olofsson, P., Foody, G. M., Herold, M., Stehman, S. V., Woodcock C. E., Wulder, M. A. (2014). Good
practices for estimating area and assessing accuracy of land change. Remote Sensing of Environment, 148:42–57.

26
Appendix 1 Major findings from the time-series-analysis 1. Introduction The objectives of the time-series-analysis of the forest type maps were to analyze recent trends in land cover change in the ER Program area, and to inform the development of the ER Program strategy. Forest type maps 2000, 2005, 2010 and 2015 were overlaid to create time-series change data of forest area parcels (note that the RL period is 2005-2015, thus, forest type map 2000 was used only for analysis purpose). The main objectives of the time-series analysis were the following: a. Conduct a diagnostic check in addition to the identification and correction of “illogical changes”
as described in Section 2.3.2 of this AD Report, to understand the quality of mapping; b. Analyze the major change patterns, classify them into groups, and use them to plan proposed
interventions under the ER-P; c. Analyze the degree of RV lands actually regenerating to forest; and d. Quantify the reversal events which took place during the analyzed period in order to support
the assessment of reversal risks. 2. Background information Land area
National land area 23,054,258ha
ER-P area 8,123,149ha
Land/forest classification and stratification
Land/forest classes Area (ha) 2015
% of total area
Strata
Level 1 Level 2
Current Forest
Evergreen Forest EG 481,380 5.9% 1
Mixed Deciduous Forest MD
3,799,415 46.8% 2 Coniferous Forest CF
Mixed Coniferous and Broadleaved Forest
MCB
Dry Dipterocarp Forest DD 17,351 0.2% 3
Forest Plantation P
2,974,904 36.6% 4 Potential Forest
Bamboo B
Regenerating Vegetation RV
Other vegetated Areas
Savannah SA
850,100 10.5% 5
Scrub SR
Grassland G
Cropland
Upland Crop UC
Rice Paddy RP
Other Agriculture OA
Agriculture Plantation AP
Settlement Urban U
Other Land Barren Land and Rock BR
Other Land O
Above-ground Water Source
River (Water) W
Wetland (Swamp) SW
Total 8,123,149 100.0%

27
3. Results of analysis
3.1. Diagnostic check No “illogical changes” were found based on the diagnostic check. Very small changes (approximately 30ha) were found which are “unlikely, though not impossible to occur”, and the resulting impact is considered negligible. 3.2. Analysis of change patterns a. Major ‘change’ and ‘no-change’ patterns observed The table below is a list all the ‘change’ and ‘no-change’ patterns with an area size more than 30,000ha for the period 2000-2015. The codes ‘1’, ‘2’, ‘3’, ‘4’, ‘5’ shows the stratum identified for each corresponding year. For example, the area of 3,710,306 ha consistently classified as stratum ‘2’ for all mapping years indicates that the area of land was under stratum 2 (either MD or CF or MCB status) throughout, and therefore, regarded as ‘intact forest’. Similarly, the area of 2,509,134ha consistently classified as stratum ‘4’ for all mapping years indicates that the land area was under stratum 4 (Potential Forests status, including some small area of Bamboo and Forest Plantation), and assumed that the land may have been under short-rotation shifting cultivation practices, or in severely degraded conditions preventing regeneration in to the current forest status. The area of 126, 808ha classified as ‘4 - 4 - 5 - 4’ for the respective years indicates that the land area has been used for shifting cultivation, therefore repeating cropping (Stratum 5) and fallow (Stratum 4).
CF-6 provinces(8,123,149ha) Presumed condition and type of land use
2000 2005 2010 2015 Area(ha)
2 2 2 2 3,710,306 Intact forest
4 4 4 4 2,509,134 Very short-rotation shifting cultivation OR degraded land/constantly disturbed (e.g. wood harvesting) hardly regenerate to forest
1 1 1 1 478,564 Intact forest
5 5 5 5 326,605 Permanent agriculture
4 5 5 5 127,296 Permanent agriculture
4 4 5 4 126,808 Shifting cultivation (rotational)
2 2 2 4 123,017 Pioneering shifting cultivation
4 5 4 4 111,222 Very short-rotation shifting cultivation OR degraded land/constantly disturbed (e.g. wood harvesting) hardly regenerate to forest
4 4 5 5 99,087 Permanent agriculture
5 4 4 4 91,856 Very short-rotational agriculture OR degraded land/constantly disturbed (e.g. wood harvesting) hardly regenerate to forest
4 4 4 5 72,018 Agricultural expansion
2 5 4 4 41,844 Very short-rotation shifting cultivation OR degraded land/constantly disturbed (e.g. wood harvesting) hardly regenerate to forest
2 2 4 2 38,777 Pioneering shifting cultivation OR long fallow
2 2 2 5 37,615 Pioneering shifting cultivation
2 2 4 4 36,516 Pioneering shifting cultivation OR long fallow
*only the changes > 30,000ha are shown. The total accounts for 98% of the total ER-P area
All the types of ‘change’ and ‘no-change’ were classified into small number of groups in order to understand the geographical scale of each change type. Then, the assumed actions were considered
28
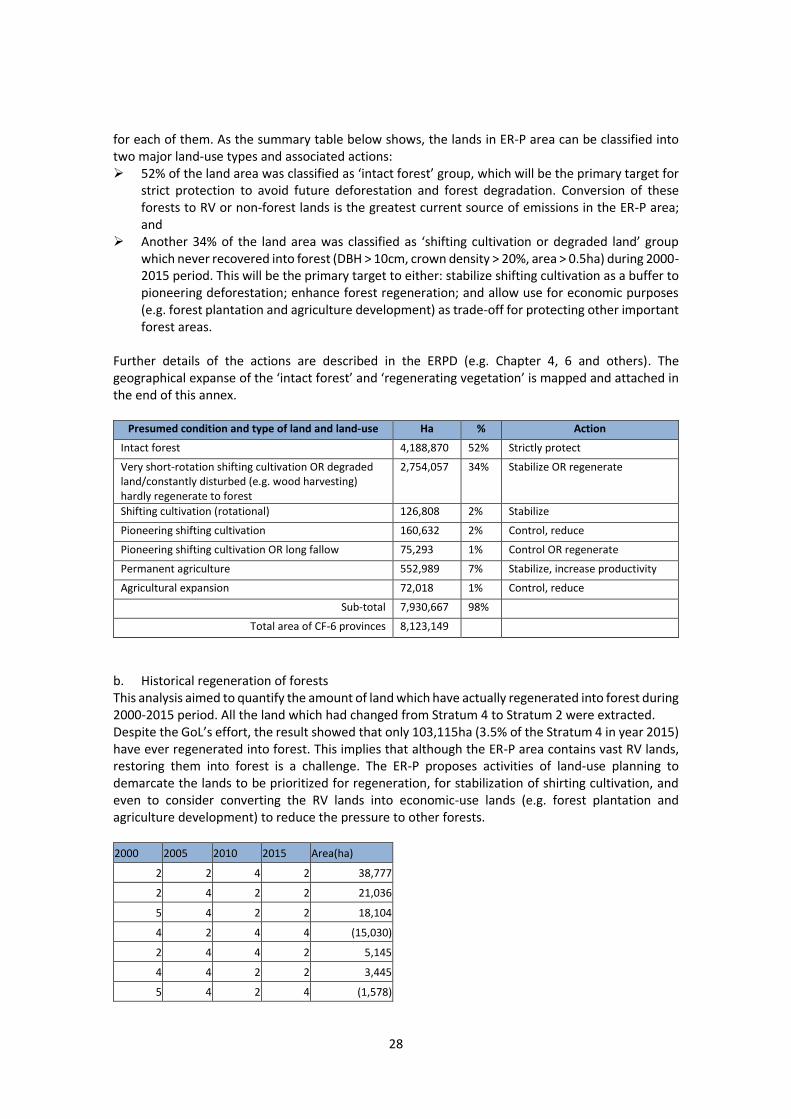
for each of them. As the summary table below shows, the lands in ER-P area can be classified into two major land-use types and associated actions: ➢ 52% of the land area was classified as ‘intact forest’ group, which will be the primary target for
strict protection to avoid future deforestation and forest degradation. Conversion of these forests to RV or non-forest lands is the greatest current source of emissions in the ER-P area; and
➢ Another 34% of the land area was classified as ‘shifting cultivation or degraded land’ group which never recovered into forest (DBH > 10cm, crown density > 20%, area > 0.5ha) during 2000-2015 period. This will be the primary target to either: stabilize shifting cultivation as a buffer to pioneering deforestation; enhance forest regeneration; and allow use for economic purposes (e.g. forest plantation and agriculture development) as trade-off for protecting other important forest areas.
Further details of the actions are described in the ERPD (e.g. Chapter 4, 6 and others). The geographical expanse of the ‘intact forest’ and ‘regenerating vegetation’ is mapped and attached in the end of this annex.
Presumed condition and type of land and land-use Ha % Action
Intact forest 4,188,870 52% Strictly protect
Very short-rotation shifting cultivation OR degraded land/constantly disturbed (e.g. wood harvesting) hardly regenerate to forest
2,754,057 34% Stabilize OR regenerate
Shifting cultivation (rotational) 126,808 2% Stabilize
Pioneering shifting cultivation 160,632 2% Control, reduce
Pioneering shifting cultivation OR long fallow 75,293 1% Control OR regenerate
Permanent agriculture 552,989 7% Stabilize, increase productivity
Agricultural expansion 72,018 1% Control, reduce
Sub-total 7,930,667 98%
Total area of CF-6 provinces 8,123,149
b. Historical regeneration of forests This analysis aimed to quantify the amount of land which have actually regenerated into forest during 2000-2015 period. All the land which had changed from Stratum 4 to Stratum 2 were extracted. Despite the GoL’s effort, the result showed that only 103,115ha (3.5% of the Stratum 4 in year 2015) have ever regenerated into forest. This implies that although the ER-P area contains vast RV lands, restoring them into forest is a challenge. The ER-P proposes activities of land-use planning to demarcate the lands to be prioritized for regeneration, for stabilization of shirting cultivation, and even to consider converting the RV lands into economic-use lands (e.g. forest plantation and agriculture development) to reduce the pressure to other forests.
2000 2005 2010 2015 Area(ha)
2 2 4 2 38,777
2 4 2 2 21,036
5 4 2 2 18,104
4 2 4 4 (15,030)
2 4 4 2 5,145
4 4 2 2 3,445
5 4 2 4 (1,578)
29
Total 103,115
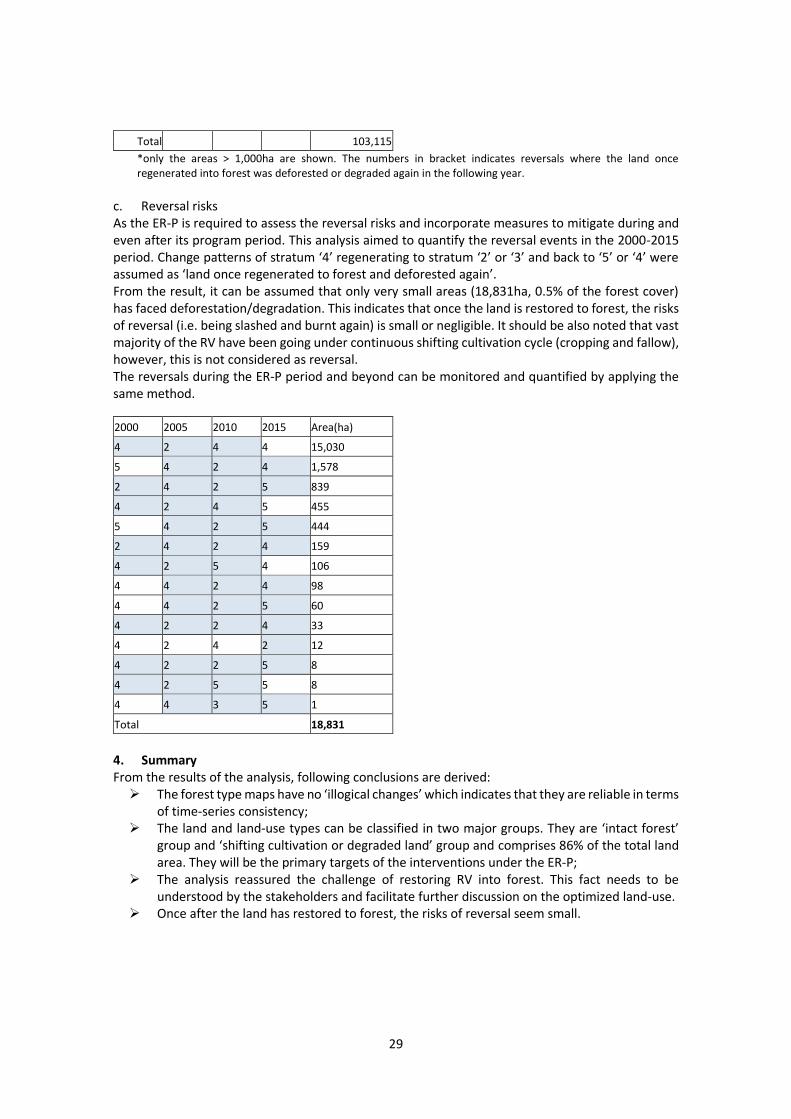
*only the areas > 1,000ha are shown. The numbers in bracket indicates reversals where the land once regenerated into forest was deforested or degraded again in the following year.
c. Reversal risks As the ER-P is required to assess the reversal risks and incorporate measures to mitigate during and even after its program period. This analysis aimed to quantify the reversal events in the 2000-2015 period. Change patterns of stratum ‘4’ regenerating to stratum ‘2’ or ‘3’ and back to ‘5’ or ‘4’ were assumed as ‘land once regenerated to forest and deforested again’. From the result, it can be assumed that only very small areas (18,831ha, 0.5% of the forest cover) has faced deforestation/degradation. This indicates that once the land is restored to forest, the risks of reversal (i.e. being slashed and burnt again) is small or negligible. It should be also noted that vast majority of the RV have been going under continuous shifting cultivation cycle (cropping and fallow), however, this is not considered as reversal. The reversals during the ER-P period and beyond can be monitored and quantified by applying the same method.
2000 2005 2010 2015 Area(ha)
4 2 4 4 15,030
5 4 2 4 1,578
2 4 2 5 839
4 2 4 5 455
5 4 2 5 444
2 4 2 4 159
4 2 5 4 106
4 4 2 4 98
4 4 2 5 60
4 2 2 4 33
4 2 4 2 12
4 2 2 5 8
4 2 5 5 8
4 4 3 5 1
Total 18,831
4. Summary From the results of the analysis, following conclusions are derived: ➢ The forest type maps have no ‘illogical changes’ which indicates that they are reliable in terms
of time-series consistency; ➢ The land and land-use types can be classified in two major groups. They are ‘intact forest’
group and ‘shifting cultivation or degraded land’ group and comprises 86% of the total land area. They will be the primary targets of the interventions under the ER-P;
➢ The analysis reassured the challenge of restoring RV into forest. This fact needs to be understood by the stakeholders and facilitate further discussion on the optimized land-use.
➢ Once after the land has restored to forest, the risks of reversal seem small.
30
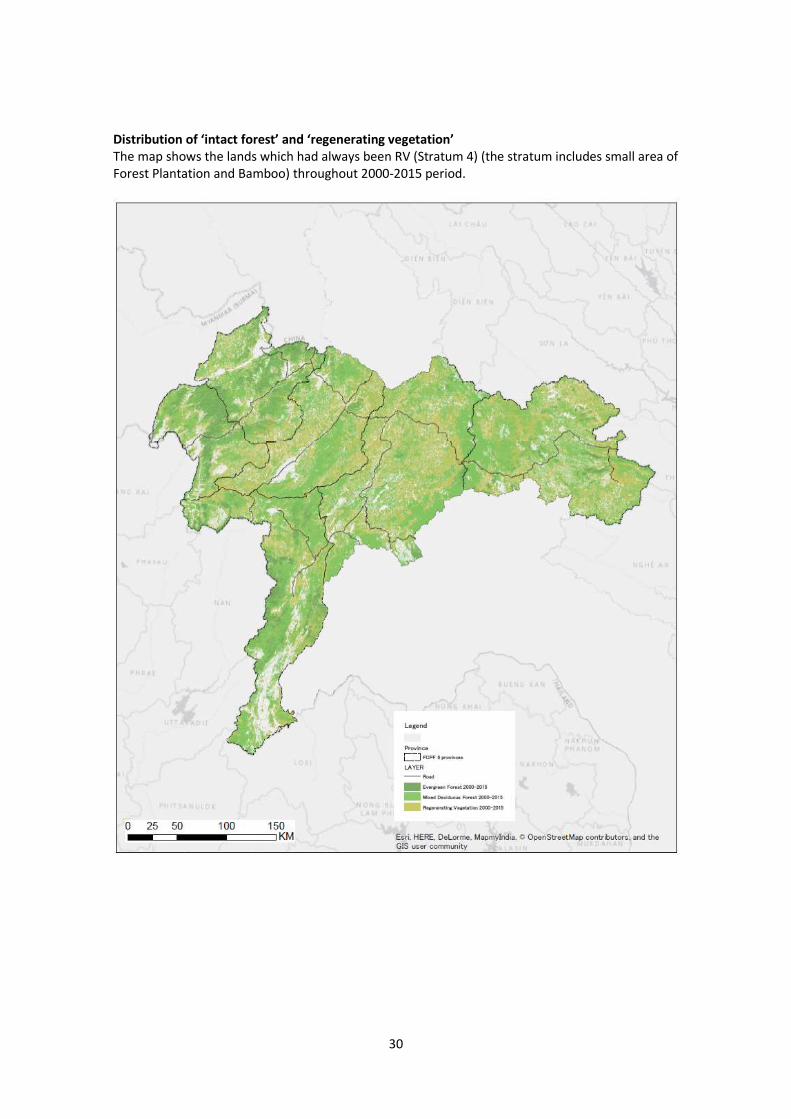
Distribution of ‘intact forest’ and ‘regenerating vegetation’ The map shows the lands which had always been RV (Stratum 4) (the stratum includes small area of Forest Plantation and Bamboo) throughout 2000-2015 period.
31
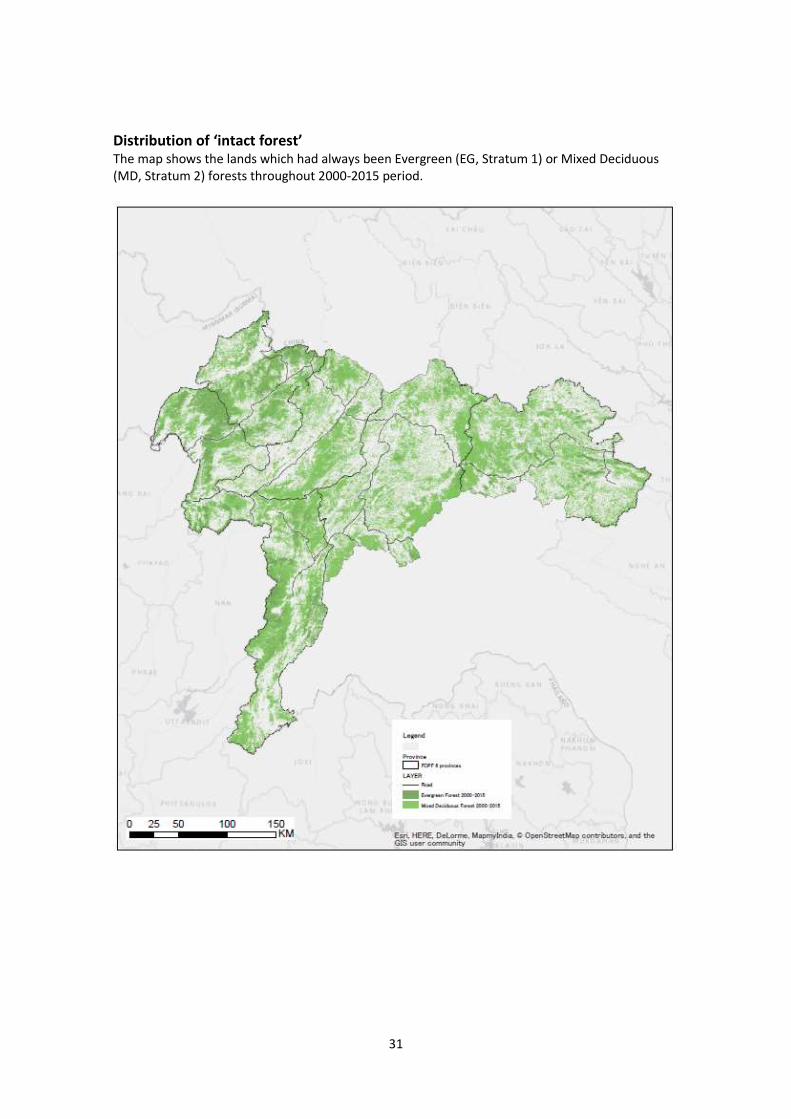
Distribution of ‘intact forest’ The map shows the lands which had always been Evergreen (EG, Stratum 1) or Mixed Deciduous (MD, Stratum 2) forests throughout 2000-2015 period.
32
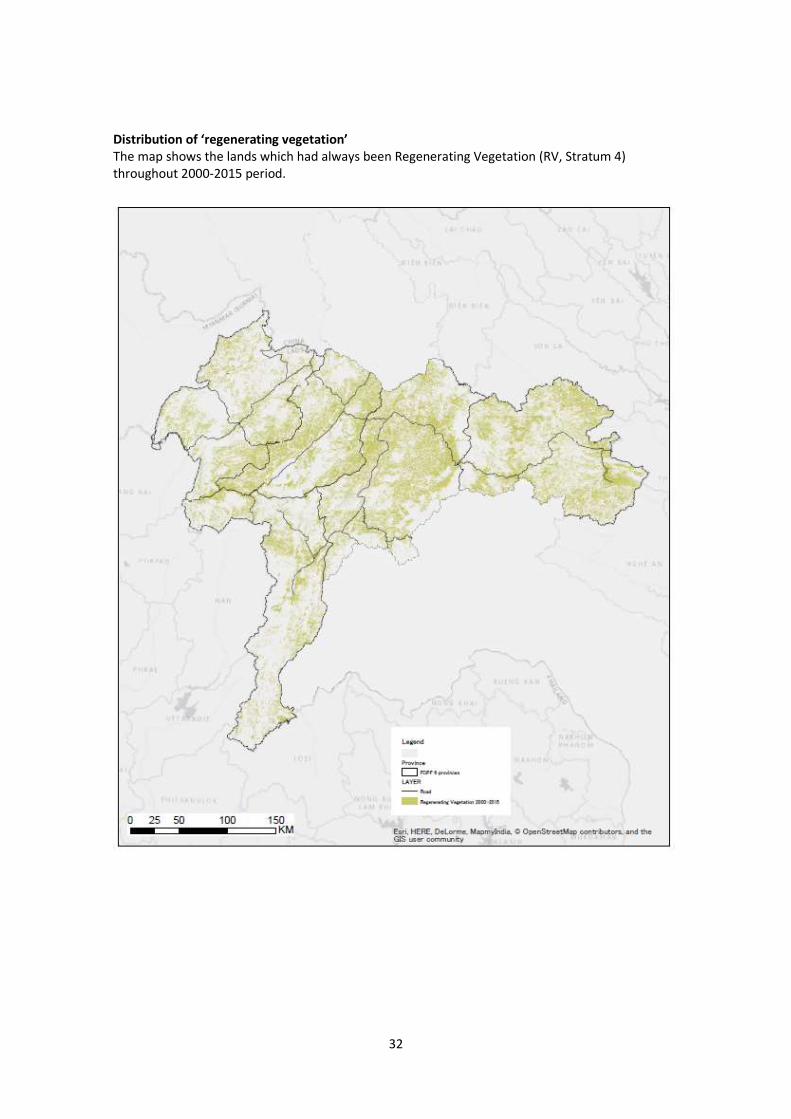
Distribution of ‘regenerating vegetation’ The map shows the lands which had always been Regenerating Vegetation (RV, Stratum 4) throughout 2000-2015 period.