Embed Size (px)
Citation preview

Institute for European Politics (IEP)
Master program: European Union and Central Asia in the international system
Year of class: 2014
Master thesis:
Turkmenistan’s potential accession
to the WTO - lessons to be learned
from other countries
Supervisor: Prof Dr. André Schmidt
Author: Rustem Bekmyradov, 744001, Ashgabat, Turkmenistan,
Ashgabat, February 7, 2015

2
Abstract
With 98% of world trade being carried out by the 159 WTO members and further 24 countries
negotiating to join the WTO, it is a matter of time for the remaining – mostly developing –
countries, including Turkmenistan, to file for WTO application, especially if they want to develop
competitive industries and access foreign export markets. That said, the economic development
policies newly acceding governments have in place in their countries and other accession conditions
may affect the extent of economic benefits countries, including their industries, are able to yield
from the WTO accession.
This paper examines three conditions that can potentially have an effect on the level of WTO
accession benefits in developing resource-rich countries and traces the mechanisms through which
these conditions influence economic growth. The research findings suggests that countries that have
achieved a greater level of industrialization by the time of WTO accession are better able to yield
economic benefits from trade liberalization that the accession entails. This finding can encourage
developing countries to help their industries upgrade their comparative advantage before they enter
a competitive international trade environment through WTO accession.

3
Table of contents
Acknowledgments .............................................................................................................................. 4
List of figures ...................................................................................................................................... 5
List of Tables ...................................................................................................................................... 6
List of abbreviations .......................................................................................................................... 7
Chapter 1. Introduction ..................................................................................................................... 8
Chapter 2. About WTO and WTO Accession ................................................................................. 9
Chapter 3. Turkmenistan ................................................................................................................ 13
3.1. GDP Growth Figures ............................................................................................................... 13
3.2. Resource-export dependency .................................................................................................. 14
3.3. Central coordination of economic policies by the state .......................................................... 16
3.4. Still no application for WTO membership .............................................................................. 17
Chapter 4. Related Literature Review and Relevant Theories .................................................... 19
4.1. General Theories on International trade supporting Free Trade ......................................... 19
4.2. Theories competing with classical free-trade arguments .................................................... 20
Chapter 5. Theoretical Framework ................................................................................................ 24
5.1. Research question .................................................................................................................... 24
5.2. Hypotheses Concerning the Research Question ...................................................................... 25
Chapter 6. Methodology and Case selection .................................................................................. 30
6.1. Summary of Methodology Used ............................................................................................. 30
6.2. Operationalization and Data Sources ...................................................................................... 31
6.3. Actual case (country) selection ............................................................................................... 36
6.4. Actual case analyses – Hypotheses Testing ............................................................................ 43
Chapter 7. Research Results ........................................................................................................... 57
Chapter 8. Conclusion ..................................................................................................................... 60
References / Bibliography ............................................................................................................... 62

4
Acknowledgments
This thesis would not have been written without the support of my colleagues from Deloitte
Consulting LLP in Ashgabat. I am also deeply grateful for the help of Nihal Pitigala Senior Trade
Advisor at The World Bank for providing initial comments as to the form and design of this
research.
5
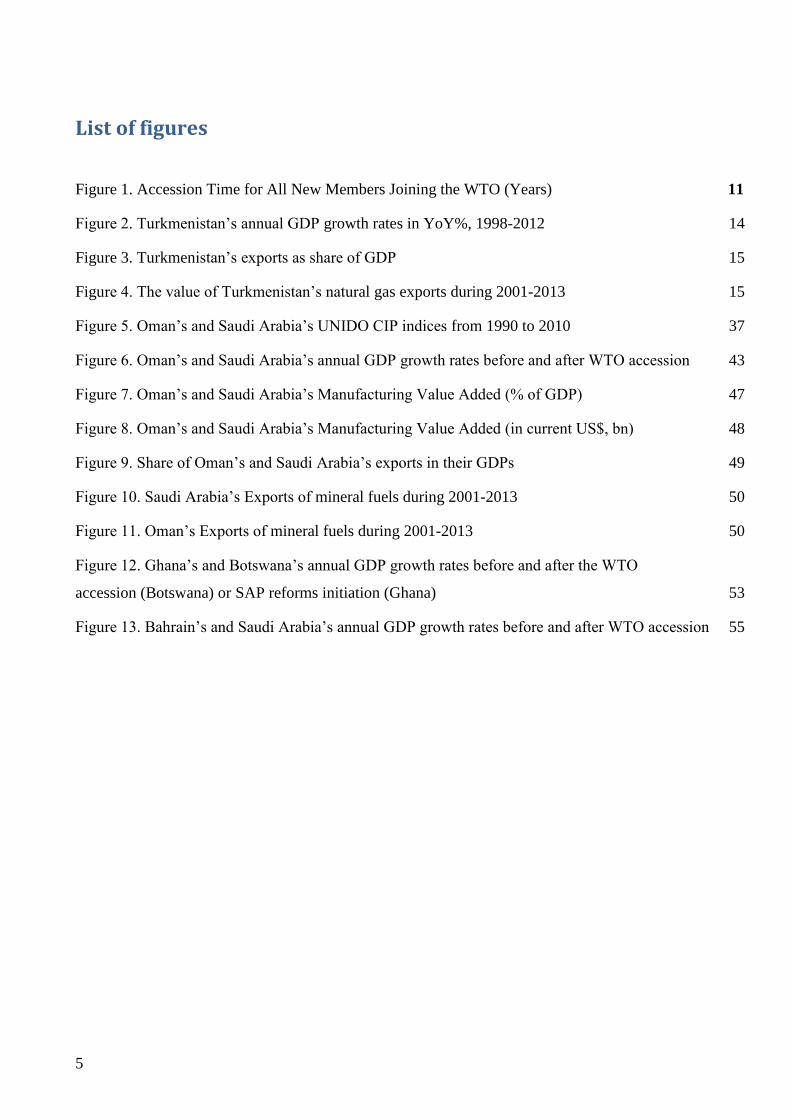
List of figures
Figure 1. Accession Time for All New Members Joining the WTO (Years) 11
Figure 2. Turkmenistan‘s annual GDP growth rates in YoY%, 1998-2012 14
Figure 3. Turkmenistan‘s exports as share of GDP 15
Figure 4. The value of Turkmenistan‘s natural gas exports during 2001-2013 15
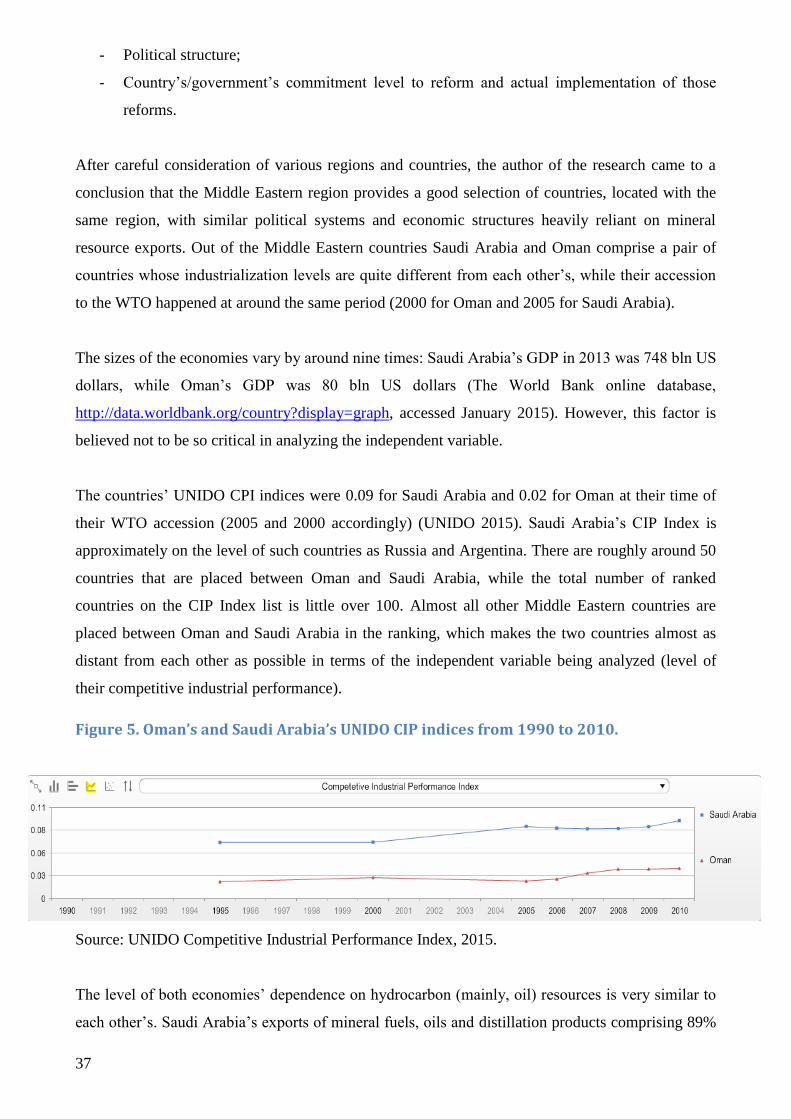
Figure 5. Oman‘s and Saudi Arabia‘s UNIDO CIP indices from 1990 to 2010 37
Figure 6. Oman‘s and Saudi Arabia‘s annual GDP growth rates before and after WTO accession 43
Figure 7. Oman‘s and Saudi Arabia‘s Manufacturing Value Added (% of GDP) 47
Figure 8. Oman‘s and Saudi Arabia‘s Manufacturing Value Added (in current US$, bn) 48
Figure 9. Share of Oman‘s and Saudi Arabia‘s exports in their GDPs 49
Figure 10. Saudi Arabia‘s Exports of mineral fuels during 2001-2013 50
Figure 11. Oman‘s Exports of mineral fuels during 2001-2013 50
Figure 12. Ghana‘s and Botswana‘s annual GDP growth rates before and after the WTO
accession (Botswana) or SAP reforms initiation (Ghana) 53
Figure 13. Bahrain‘s and Saudi Arabia‘s annual GDP growth rates before and after WTO accession 55

6
List of Tables
Table 1. Oman‘s and Saudi Arabia‘s mineral resource exports at time of WTO accession. 38
Table 2: CIS countries‘ accession status to the WTO 42
Table 3. Oman‘s and Saudi Arabia‘s average growth rates before and after WTO accession. 44
Table 4. Comparative Statistical Analysis of Oman‘s and Saudi Arabia‘s starting conditions before
WTO accession and GDP performance after the WTO accession. 45
Table 5. Ghana‘s and Botswana‘s average growth rates before and after WTO accession/SAP
launch. 54
Table 6. Bahrain‘s and Saudi Arabia‘s average GDP growth rates before and after WTO accession. 56
Table 7: Causal relationships between independent variables and the dependent variable in three
hypotheses 59

7
List of abbreviations
EU European Union
WTO World Trade Organization
CIS Commonwealth of Independent States
USAID United States Agency for International Development
MFN Most Favored Nation
WB World Bank
IMF International Monetary Fund
GATT General Agreement on Tariffs and Trade
GATS General Agreement on Trade in Service
USSR Union of Soviet Socialist Republics
GDP Gross Domestics Product
MVA Manufacturing Value Added
FDI Foreign Direct Investments
SAP Structural Adjustment Program
UNIDO United Nations Industrial Development Organization
CPI Competitive Industrial Performance
NDP National Development Plans

8
Chapter 1. Introduction
European Union (EU) aims to encourage the integration of all countries into the world economy,
including through the abolition of restrictions on international trade. The EU‘s Central Asia strategy
adopted in 2007 outlined, among other things, promotion of economic development and trade and
investments. According to the strategy EU supports the removal of trade barriers between the
Central Asian states and it will continue to support World Trade Organization (WTO) accession for
the four Central Asian states, some of which are not yet WTO members.
At present about 98% of world trade is carried out by the 159 WTO members. A further 24
countries are currently negotiating to join the WTO, including Uzbekistan (with no major progress
to date), Kazakhstan, and Azerbaijan among the CIS countries. Turkmenistan is the only CIS
country which has not yet applied for membership. Hence, the case of Turkmenistan and its
considerations and reasoning about joining the WTO deserve greater academic attention. More
research into the conditions for a more beneficial way of acceding to the WTO could persuade the
government of Turkmenistan to file a membership application sooner rather than later.
This master thesis aims to explore key conditions that could influence the level of benefits a country
like Turkmenistan could gain from a WTO accession. The key conditions being looked at are (1)
the level of a country‘s industrialization, (2) central government coordination of economic policies,
and (3) the lateness of a country‘s accession to the WTO. Analyzing past accession cases of
countries similar to Turkmenistan in economic structure, the author assesses these conditions‘
influence on economic growth rates of these countries. The outcomes will help evaluate whether
there is actually a relationship between the analyzed conditions and the acceding countries‘ long-
term economic growth. If/where the positive relationship is evidenced, the acceding countries‘
economic policies could be adjusted to strengthen the presence and efficacy of these conditions.
To explore the subject area described above the master thesis will set forth the following research
question: ―Under which conditions is it economically beneficial for a resource-exporting
developing country to accede to the WTO?”
This subject area is of particular interest to the author of this master thesis, for he is a citizen of
Turkmenistan. But even more importantly, the author is professionally engaged in a United States
Agency for International Development (USAID) funded development projects called the Economic

9
Reforms to Enhance Competitiveness Project1 and the Macroeconomic Project in Turkmenistan.
The aim of the projects is to provide assistance to the government of Turkmenistan in promoting
broad-based economic growth based on expanded private sector participation in the economy,
including effective trade policies as part of the potential accession of the country to the WTO. The
knowledge and insights gained by the author as a result of conducting the present research will be
of high value as he engages in the implementation of private sector and trade-related development
assistance projects of the Macroeconomic Project. Likewise, the author‘s practical experience in the
area of trade reforms will contribute to the quality and practicality of the present academic research.
Chapter 2. About WTO and WTO Accession
All discussions in the present thesis will be conducted within the notional framework of countries‘
accession to the WTO. This, in a way, will be the realm of the thesis. That said, some of the
conclusions made in this master thesis might be applicable to events happening not only as part of a
WTO accession, however it is not the objective of the thesis to focus on those wider-scale events,
but to only focus on events and mechanisms taking place in relation to or as a result of countries‘
accession to the WTO. Thus, because accession to the WTO was identified as the so-called ‗realm‘
of the present thesis, it is important to provide a due description of this international organization,
including the benefits and challenges of becoming its member.
In its official website, the WTO is described as ―the only global international organization dealing
with the rules of trade between nations‖ (WTO web site 2015a). The organization operates based on
its agreements, ―negotiated and signed by the bulk of the world‘s trading nations and ratified in
their parliaments‖ (Ibid.). The organization officially started its operation from 1 January 1995,
following the Marrakech Agreement, replacing the General Agreement on Tariffs and
Trade (GATT), which commenced in 1948. Principles and agreements of the WTO are largely
based on neoclassical economic theories which advocate for free trade. It is based on these theories
that WTO‘s ―liberal trade policies — policies that allow the unrestricted flow of goods and services
— sharpen competition, motivate innovation and breed success. They multiply the rewards that
result from producing the best products, with the best design, at the best price‖ (WTO web site
2015b)
Most of the arguments in favor of the WTO accession go along the same lines. They have been well
documented in a number of recent publications. Cattaneo and Braga summarize the key benefits
1 EREC project ended in 2011. Its successor is Macroeconomic Project, implemented by Deloitte Consulting LLP.

10
well in their World Bank Policy Research Working Paper under two broad themes – acceding or
member countries‘ outward and inward policies (Cattaneo and Primo Braga 2009). Among the key
‗outward-looking‘ reasons behind WTO accession, they list (1) better terms for exports to other
countries through having access to the Most Favored Nation (MFN) status in those countries; (2)
the reduction in the cost of trade negotiations; (3) the participation in setting international rules on
trade; and (4) the access to an international dispute resolution mechanism (Ibid.: 4-5). The ‗inward-
looking‘ reasons for WTO accession are related with an improved business environment for
domestic firms and international investors and specifically include (1) reforming towards more
efficient and credible trade policies and (2) using the accession as an anchor or framework for
improving domestic legislation (Ibid.: 5-6).
While there are obvious benefits of joining WTO, there are also costs involved. The WTO
accession process involves a significant public sector resource commitment in terms of staffing,
coordination, capacity building, legislative drafting and approval, which a developing country may
lack. For instance, Saudi Arabia joined the WTO in 2005 after 10 years of negotiations, 365
bilateral and 14 multilateral rounds of negotiation, answering to 3,500 questions about its trading
regime and system of business regulation, and submitting 7,600 pages of documentation. Saudi
Arabia also prepared implementation of its commitments by issuing 28 Royal Orders and 42 laws
and regulations (Evenett 2006). Moreover, the time taken to complete the WTO lengthy accession
process has steadily grown over the past decade (see Figure 1 below).

11
Figure 1. Accession Time for All New Members Joining the WTO (Years)
Source: WTO website.
Two World Bank trade specialists, Simon Evenett and Carlos Prima Braga, briefly summarized the
costs of the accession process in Issue 23 of the World Bank‘s Trade Notes‘ Series. Among them is
the level of commitments required from new entrants, which is much higher than it was in the early
stages of General Agreement on Tariffs and Trade (GATT). Evenett and Braga note that ―given the
conjunction of bilateral and multilateral negotiations in the accession process, the larger the
membership, the more specific requests a candidate country will receive, and the longer the process
is likely to be‖. With the increasing diversity of interests in the WTO, more topics are under
scrutiny than ever before in the accession process (Evenett and Braga 2006).
0 2 4 6 8 10 12 14 16 18 20
Ecuador - 1996
Bulgaria - 1996
Mongolia - 1997
Panama - 1997
Kyrgyzstan - 1998
Latvia - 1999
Estonia - 1999
Jordan - 2000
Georgia- 2000
Albania - 2000
Oman - 2000
Croatia - 2000
Lithuania - 2001
Moldavia - 2001
China - 2001
Taiwan - 2002
Armenia - 2003
Macedonia - 2003
Nepal - 2004
Cambodia - 2004
Saudi - 2005
Vietnam - 2007
Tonga - 2007
Ukraine - 2008
Cape Verde - 2008
Russia - 2012
Montenegro - 2012
Samoa - 2012
Vanuatu - 2012
Laos - 2013
Tajikistan - 2013
Bosnia Herzegovina
Azerbaijan
Kazakhstan
Uzbekistan
Belarus

12
Based on the above costs and challenges of the WTO accession, significant degree of criticism of
the WTO has emerged in the scholarly literature in the recent years, especially in the context of
developing countries2.
Despite all these challenges of the WTO accession, most of which lie in the sphere of national
economic policy and stringency of WTO accession rules, new countries do actually choose to
pursue WTO accession. It is believed that this is not only related with economic benefits, but also
with the political considerations of new acceding states, which want to demonstrate to the world
community that they choose to follow market economy principles in their economic development
path. As Cattaneo puts it, for many countries the WTO accession is now ―a political decision with a
varnish of economic rationale‖ (Cattaneo 2008: 37). With some countries‘ accession, even the
‗varnish of economic rationale‘ is absent, as they choose to join without any substantial analysis of
economic effects of WTO membership, as it was the case with Mongolia, for example (Tsogtbaatar
2005).
2 see Chapter 4 on Literature Review below

13
Chapter 3. Turkmenistan
As the title of the present dissertation focuses on Turkmenistan, it is important to provide
background information on Turkmenistan and its status in the WTO accession process. For the sake
of effectively addressing the research question which states ―Under which conditions is it
economically beneficial for a resource-exporting developing country to accede to WTO?‖, it is
assumed that Turkmenistan has already made a decision to pursue the WTO accession and is
currently considering its policies as part of its accession plan and the conditions it wants to
negotiate with other member-countries as part of the process. Assuming that Turkmenistan has
made the decision to join will influence the theoretical framework and the formation of the relevant
hypotheses later in this thesis, as it is important to keep the theoretical discourse not only within the
contemporary literature framework, but also applicable to the country mentioned in the title of the
dissertation. But as it should be the case with any academic research, the conclusions of the present
thesis will likely be relevant to a class of countries similar to Turkmenistan in its economic
structure, the role of the government in centrally coordinating the country‘s economic strategy and
in the timing of its WTO accession (which actually will be the themes of the three hypotheses to be
formed later in the thesis). Likewise, the background description of Turkmenistan will also be
mainly contained to these three thematic areas (i.e. economic structure, role of central government
coordination and the country‘s status in acceding to the WTO), which will ensure making the
hypothesis formation informed, while not spending too much time on the descriptions not directly
relevant to the focus of this work.
So Turkmenistan is one of the five Central Asian countries and one of the 15 former USSR
republics, which have now become independent states. The country borders with Afghanistan, Iran,
Kazakhstan, Uzbekistan and the Caspian Sea. Approximately 80% of the country‘s territory is
desert. Turkmenistan‘s climate is severely continental and extremely dry (Turkmen Statistics
Committee website). The country is rich in oil and natural gas resources and cotton is its major
agricultural product. However, other processing industries have developed over the years of
independence since 1991, including oil refining, chemical and petro-chemical industries, textile and
food processing industries, among some others.
3.1. GDP Growth Figures
The GDP of Turkmenistan has been consistently growing since 1998 due to the growing energy
prices in the world. Over the 15-year period from 1998 to 2012 growth has averaged almost 9% (see
14
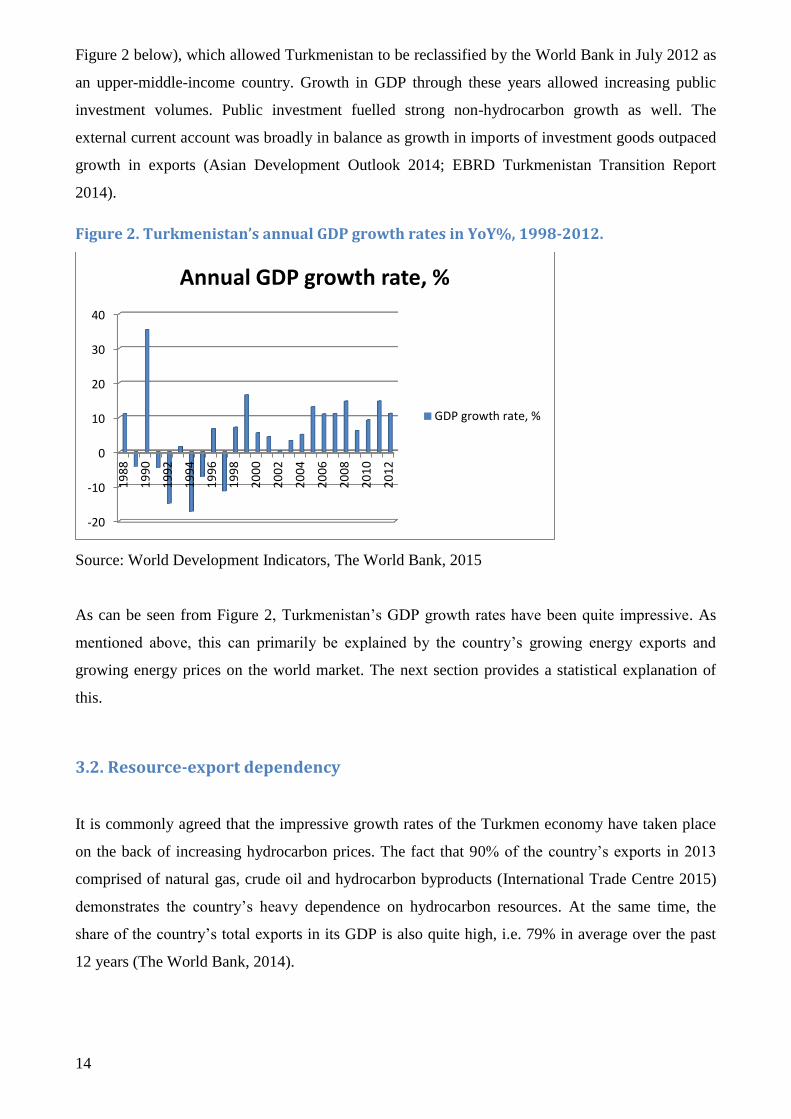
Figure 2 below), which allowed Turkmenistan to be reclassified by the World Bank in July 2012 as
an upper-middle-income country. Growth in GDP through these years allowed increasing public
investment volumes. Public investment fuelled strong non-hydrocarbon growth as well. The
external current account was broadly in balance as growth in imports of investment goods outpaced
growth in exports (Asian Development Outlook 2014; EBRD Turkmenistan Transition Report
2014).
Figure 2. Turkmenistan’s annual GDP growth rates in YoY%, 1998-2012.
Source: World Development Indicators, The World Bank, 2015
As can be seen from Figure 2, Turkmenistan‘s GDP growth rates have been quite impressive. As
mentioned above, this can primarily be explained by the country‘s growing energy exports and
growing energy prices on the world market. The next section provides a statistical explanation of
this.
3.2. Resource-export dependency
It is commonly agreed that the impressive growth rates of the Turkmen economy have taken place
on the back of increasing hydrocarbon prices. The fact that 90% of the country‘s exports in 2013
comprised of natural gas, crude oil and hydrocarbon byproducts (International Trade Centre 2015)
demonstrates the country‘s heavy dependence on hydrocarbon resources. At the same time, the
share of the country‘s total exports in its GDP is also quite high, i.e. 79% in average over the past
12 years (The World Bank, 2014).
-20
-10
0
10
20
30
40
19
88
19
90
19
92
19
94
19
96
19
98
20
00
20
02
20
04
20
06
20
08
20
10
20
12
Annual GDP growth rate, %
GDP growth rate, %
15
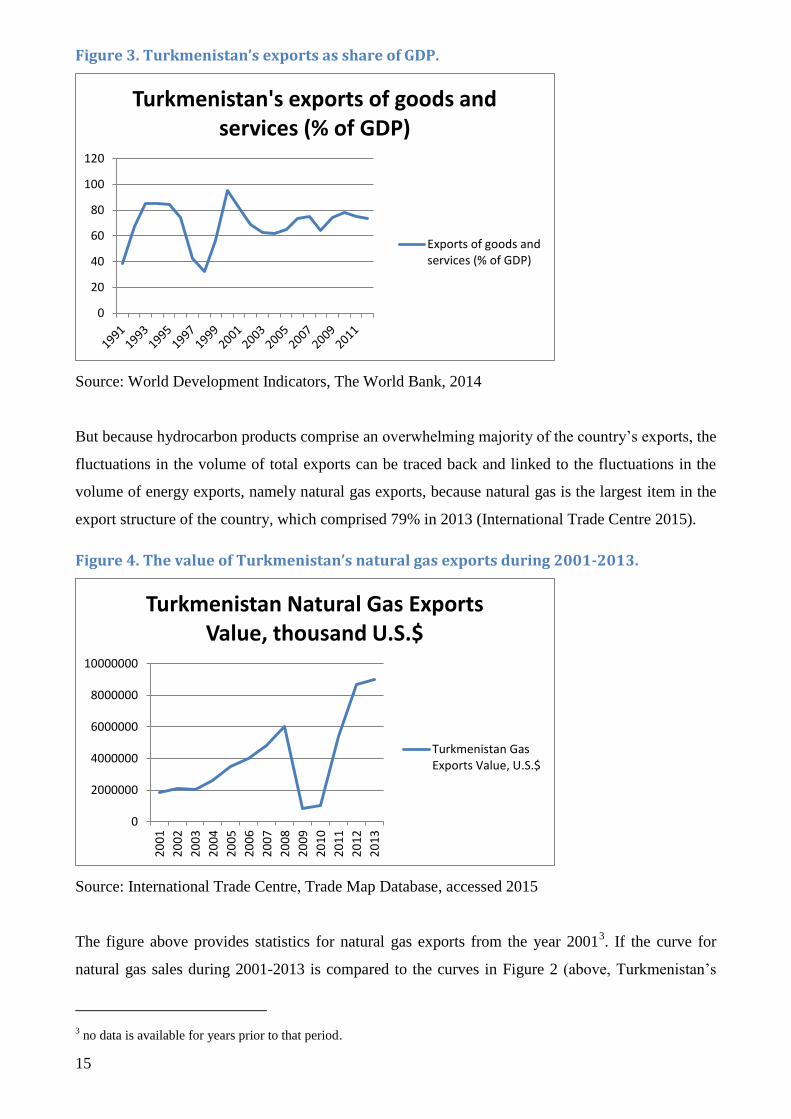
Figure 3. Turkmenistan’s exports as share of GDP.
Source: World Development Indicators, The World Bank, 2014
But because hydrocarbon products comprise an overwhelming majority of the country‘s exports, the
fluctuations in the volume of total exports can be traced back and linked to the fluctuations in the
volume of energy exports, namely natural gas exports, because natural gas is the largest item in the
export structure of the country, which comprised 79% in 2013 (International Trade Centre 2015).
Figure 4. The value of Turkmenistan’s natural gas exports during 2001-2013.
Source: International Trade Centre, Trade Map Database, accessed 2015
The figure above provides statistics for natural gas exports from the year 20013. If the curve for
natural gas sales during 2001-2013 is compared to the curves in Figure 2 (above, Turkmenistan‘s
3 no data is available for years prior to that period.
0
20
40
60
80
100
120
Turkmenistan's exports of goods and services (% of GDP)
Exports of goods andservices (% of GDP)
0
2000000
4000000
6000000
8000000
10000000
20
01
20
02
20
03
20
04
20
05
20
06
20
07
20
08
20
09
20
10
20
11
20
12
20
13
Turkmenistan Natural Gas Exports Value, thousand U.S.$
Turkmenistan GasExports Value, U.S.$

16
annual GDP growth rates) and in Figure 3 (above, Turkmenistan‘s exports as % of GDP), then for
the period of 2001-2013, the obvious similarities can be observed. Specifically, the low rates of
natural gas exports during 2001-2002 (in Figure 4) explain the relatively slow GDP growth rates
during 2001-2003. Likewise, further growth in the natural gas volumes in 2004 and onwards (in
Figure 4) explains the higher growth rates of the economy during the following decade (in Figure
2). And even the lower natural gas exports during the global crisis years, i.e. during 2009-2010,
haven‘t had such a strong influence on the GDP rates thanks to the foreign currency reserves and
other growth momenta accumulated during the previous growth years. Obviously, the key
explanatory factor for this strong correlation between the volume of natural gas exports (Figure 4)
and the GDP growth rate (Figure 2) is the high share of natural gas in the export structure and the
high share of the total exports in the country‘s GDP (Figure 3).
The fact that the country hasn‘t still applied for WTO membership could be explained by
hydrocarbon prices not being subjected to tariffs and that they are set independently from the
principles of competitive free trade and don‘t really depend on the level of the economy‘s trade
liberalization. Thus, the country has not made WTO accession its priority.
3.3. Central coordination of economic policies by the state
Being a former republic of the Soviet Union, Turkmenistan has inherited a command economy
structure, under which the state used to design an economic plan, with pre-identified types and
volumes of production and necessary resources allocated by the central government to be used as
inputs for the planned productions. Over the course of the past 23 years since gaining its
independence, Turkmenistan has been gradually moving away from this model towards a market
economy. The current economic governance style can be characterized as a mixed economy, with
market economy principles in force in certain industries and sectors (e.g. retail trade, food
processing, construction, transportation, etc.), but the state has preserved the role of guiding the
overall economic policy, as well as keeping control of certain industries considered to be of
strategic nature (e.g. oil and gas, aviation, railway transportation).
Some examples of the strategic management of the economic policy by the state are the types of
medium- and long-term economic development programs adopted by the government. For example,
to guide the economic development of the country for the next two decades, the government
approved the National Program of Socioeconomic Development (NPSED), 2011–2030, which aims
to diversify and modernize the country‘s industrial base, develop rural areas, and raise living

17
standards. For the medium-term future, the government has adopted a number of sectoral
development strategies, including the following:
1. The State economic development program for 2012-2016
2. The State stock markets and stock exchange development program for 2012-2016
3. The Banking sector development program for 2012-2016
4. The Privatization program for 2013-2016
These programs identify the key directions for further economic development and set various
qualitative and quantitative objectives.
That said, the policy of the country cannot be described as strictly an import-substitution policy.
Although import-substitution is still present in the government‘s economic policy lingo, it is part of
a wider development policy, which also includes such terms as ‗economic diversification‘, ‗export
promotion‘, ‗innovation‘, ‗technologies‘ and ‗industrialization‘. Thus, the economic policy
approach undertaken by the government of Turkmenistan can be qualified as ‗the industrialization
strategy approach‘, if one is to refer to the typology used by Todaro and Smith (2011: 613).
According to them, the industrialization strategy approach as an ―outward-oriented and optimistic
about export-led development but still envisions an active role for government in influencing the
type and sequencing of exports as a country strives to produce more advanced products, adding
higher value‖ (Ibid.). Turkmenistan appears to qualify this definition.
3.4. Still no application for WTO membership
Turkmenistan has not made an application to join the WTO. That said, two years ago, in January of
2012, the President, who is also the head of government, decreed to form a commission that would
look at the feasibility and consequences of acceding to the WTO. No formal findings or
recommendations of the task force have since been announced.
As mentioned above, the fact that the country is not in a hurry to seek WTO membership can be
explained by the economic structure of the country, which is heavily reliant on hydrocarbon
exports. As is known, hydrocarbon exports, particularly natural gas exports, are not subject to tariffs
or other widely accepted trade conditions. Instead, terms and conditions for the exports of natural
gas, which is predominantly transported via pipelines, are decided on individual case-by-case basis

18
as a result of mutual negotiations between governments and/or companies. This makes most of the
WTO agreements not applicable to practical circumstances affecting natural gas sales and prices.
In any case, should Turkmenistan file an application to join the WTO, it would be qualified as a
‗late applicant‘ or ‗latecomer‘.

19
Chapter 4. Related Literature Review and Relevant Theories
Keeping the research question in mind, the current chapter provides a review of scholarly literature
which forms the theoretical basis for discussions on trade liberalization through joining the WTO
and the specific conditions which affect the extent of benefits from WTO accession.
4.1. General Theories on International trade supporting Free Trade
One doesn‘t have to be an economist or a scholar to agree that the most dominant theory related to
international trade is the ‗free trade‘ theory, which is also called the Neoclassical Theory of
Comparative Advantage. At the foundation of this theory is the work by Adam Smith called ―The
Wealth of Nations‖ (Smith 1776). Smith introduced the argument that opening up of trade with
other countries allows expanding the market, which allows greater levels of specialization for
trading countries, i.e. countries don‘t have to produce the goods they can buy from other countries
for relatively cheaper prices.
This idea of free trade based on specialization and the division of labor was further developed by
David Ricardo, who introduced the Theory of Comparative Advantage (Ricardo 1817). The
principle of comparative advantage asserts that countries should engage in international trade by
specializing in the export of goods that can be produced at lowest relative cost. This principle of
comparative advantage creates opportunities for beneficial trade even between unequal trading
partners.
In this classical comparative advantage model the basis of trade exists in international difference in
labor productivity, or technology, only. Later in the 20th
century, Swedish economists Eli Heckscher
and Bertin Ohlin further elaborated the Ricardian theory by taking into account differences between
countries in factor supplies, namely land, climate, labor, and capital (Heckscher 1949; Ohlin 1933).
This theory, referred to as the Factor Endowment, or Heckscher-Ohlin, theory, postulates that
countries will tend to specialize in the production of the commodities that make use of their
abundant factors of production (land, labor, capital, etc.).
It is based on this neoclassical model of free trade the proponents of globalization argue that
increased cross-border economic activities bring huge benefits for all countries (Bhagwati 2007;
Friedman 2005).
20
4.2. Theories competing with classical free-trade arguments
4.2.1. On the role of government intervention
Though the free-trade argument of the neoclassical theory is quite appealing in terms of the
potential to maximize global wealth, there are, however, opinions that do not agree with some of its
assumptions and postulates, such as non-interference of governments in the markets through
policies affecting ‗natural‘ trade or the assumption that technology of production is fixed (Ricardian
model) or similar and freely available to all countries (Neoclassical/Factor Endowment model).
One of the long-time critiques of the free-trade theory has been the Infant Industry argument, which
states that firms from poor or least developed nations are not able to establish themselves in new
industries, unless they are protected from international competitors, either through trade restrictions
or through government subsides. With time, the protected domestic producers raise their
productivity to the level of international competitors or higher. This usually happens through
conscious efforts on the part of the national government to raise productivity through investments in
worker training, research and development, and corporate management skills (Todaro and Smith
2011: 600).
Similar to the traditional infant industry argument is the Big Push argument. It tries to justify the
state-led economic development by arguing that there is a need for advance coordination of
investments by the government due to ‗demand complementarity‘ between different industries, if
the purpose is to develop industries in a country where they do not exist (Rosenstein-Rodan 1943,
1961; Nurkse 1953).
Thus, we can distinguish between a more outward-looking and more inward-looking development
policies. An outward-looking development policy is the one that ―encourages not only free trade but
also the free movement of capital, workers, enterprises and students…, the multinational enterprise,
and an open system of communications‖ (Streeten 1973). On the other side, an inward-looking
development policy focuses on the need for countries to establish their own styles of development
and to control their own economic destiny, including through domestic development of technology,
the imposition of barriers to imports, and the discouragement of private foreign investment
(Streeten 1973). Although the infant industry policy is often seen as a part of the inward-looking
strategy, often associated with the import substitution strategy or the theory of protectionism, it can
actually facilitate the export promotion strategy as well. There are numerous authors who have used
the infant industry argument as the basis for arguing in favor of the more dynamic theories of trade

21
(Rodrick 1991; Bell et al 1984; Pack & Westphal 1986; Westphal 1982). These dynamic theories of
trade are based on the adoption by countries of a nuanced approach in their trade policy that draws
on some elements of both the import substitution and export promotion strategies to develop
targeted sectors.
One approach in this strand of thought is the industrialization strategy approach, which is ―outward-
oriented and optimistic about export-led development but still envisions an active role for
government in influencing the type and sequencing of exports as a country strives to produce more
advanced products, adding higher value‖ (Todaro and Smith 2011: 613). While having developed as
an empirical literature, the industrialization strategy approach has then developed into a theory
which explains why an interventionist strategy towards exports can accelerate growth and improve
development outcomes more than a strict free-trade approach (Cimoli, Dosi and Stiglitz 1999).
4.2.2. On unequal starting conditions of the North and the South
From another, geographical or chronological, angle, there are critics of the free trade theory which
argue that the lateness of many developing countries, i.e. the South, in joining the liberalized global
trade environment plays against them, and that the currently developed countries, the North, had the
advantage of entering this global trade field earlier than most other countries. The so-called North-
South trade models focus on trade relations between rich and poor countries in an attempt to figure
out how these separate groups of countries have benefited, or suffered losses, due to the various
conditions existent at the time of their active global integration. In contrary, the traditional trade
theory was assumed to apply to all countries. (Krugman 1981; Dutt 1988; Khor 2001).
The Late Development theory, also called late industrialization theory, which was advanced by
Alexander Gerschenkron, argues that the later a country embarks on the process of industrialization
and global trade integration, the more it requires more powerful financing institutions, which
justifies a more powerful role of the states in developing countries, e.g. the state in Tsarist Russia
(Gerschenkron 1962).
4.2.3. On unequal starting conditions in the WTO framework
These theories (the North-South trade models and the Late Development theory) can also be applied
to the issue of WTO membership, if one is to assume that this international organization is the
‗territory‘ or the North. Chakravarthi Raghavan in his article entitled ―UNCTAD Plan of Action
Provides Critique of WTO agreements‖ argues:

22
―The WTO trading system has asymmetries and imbalances against the developing world, and has
made 'late-comers' face more stringent policy conditions for industrialization and development, and
the remaining trade barriers have a negative impact on developing countries. Although developing
countries need policy flexibility to support and promote their enterprises, investments in production
and marketing, and export expansion and diversification, latecomers now face more stringent policy
conditions than those which prevailed previously. The multilateral framework of WTO rules, while
contributing to a stable and predictable environment, in certain cases has narrowed the range of
policy options for Governments, while the commitments undertaken under IMF/World Bank
structural adjustment programs have further reduced the remaining policy options‖. (Raghavan
2000).
Raghavan continues to argue that trade policies and trade liberalization should be made more
consistent with overall development objectives, and ways and means need to be sought in
developing countries to ensure that trade makes a more decisive contribution to alleviating poverty.
Further attention, including monitoring of developmental impact of multilateral trade agreements, is
required on the role of trade for stimulating economic growth, distribution of growth effects, and
sectoral policies for agricultural and tourism, and longer term for diversification into industry and
advanced services (Ibid.). Another argument set forth by Aileen Kwa states that compliance with
WTO rules is problematic for developing counties and that ―over the years, as the corporate
interests of the developed countries have expanded, these countries have also lobbied for more
issues to be incorporated into the GATT/WTO. (Kwa 2003).
There is also growing criticism related to WTO as an entity. For example, Martin Khor argues that
―the WTO does not manage the global economy impartially, but in its operation has a systematic
bias toward rich countries and multinational corporations, harming smaller countries which have
less negotiation power‖ (Khor 2000). Other critic Richard Blackhurst describes ―Green Room‖
discussions in the WTO as ‗unrepresentative and non-inclusive‘. He notes that ―more active
participants, representing more diverse interests and objectives, have complicated WTO decision-
making, and the process of ‗consensus-building‘ has broken down. Results of green room
discussions are presented to the rest of the WTO which may vote on the result. They have thus
proposed the establishment of a small, informal steering committee (a ‗consultative board‘) that can
be delegated responsibility for developing consensus on trade issues among the member countries
(Blackhurst 2000).

23
4.2.4. Questions on the ‘added value’ of the WTO
There is also literature that questions the value added by the institution of the WTO for international
trade. Some scholars have collected empirical data that does not demonstrate a correlation between
WTO membership and trade gains of a country. One of the works that demonstrated this is by
Andrew Rose in his article titled ―Do we really know that the WTO increases trade?‖ (2004).
In regards to the gains in the services sector, Eschenbach and Hoekman (2006) have also concluded
that the more a country commits to WTO principles, namely the General Agreement on Trade in
Services (GATS), the less effective are its services sector policies. However, according to the
authors, this might partly be related with the unwillingness of WTO partners to file disputes within
the framework of the WTO in the cases when newly acceded countries don‘t live up to their WTO
commitments, due to high costs of this enforcement mechanism.
The literature on assessing or measuring benefits of the WTO accession is relatively scarce and the
matter deserves to be explored in greater depths. Hence, the choice of the general theme of the
present master thesis, which is to assess conditions for a more beneficial accession for countries.

24
Chapter 5. Theoretical Framework
Taking into account the literature review conducted above on the theoretical concepts of
international trade, as well as background information and academic literature about the benefits
and challenges of acceding to the WTO, it makes sense now to return to the research question of the
master thesis and then to formulate the hypotheses.
5.1. Research question
The research question needs to be reviewed at this stage based on the above discussions, as well as
to guide further methodological discourse and research. Having provided background information
on Turkmenistan, the author of this thesis will now attempt to formulate the research question to
make it as applicable to the case of Turkmenistan as possible. The general framework of the present
research will be ‗WTO accession‘, i.e. the discourse will stay within the framework of countries‘
accession to the WTO. To further narrow the research area, the author will look at WTO accession
from the angle of its economic benefits, i.e. how countries are able to benefit economically from
acceding to the WTO. More specifically, how the GDP rate, and possibly some other economic
development indicators such as the Manufacturing Value Added (MVA) or Foreign Direct
Investments (FDI) rates grow – or decline – as a result of countries‘ WTO accession (these
indicators will be discussed later in the context of operationalizing the hypotheses).
As mentioned above it is necessary to narrow down the types of countries to be analyzed, i.e.
choose them in line with – or in a way to be able to observe and analyze – the characteristics present
in the case of Turkmenistan. One of such characteristics is that the country is resource-dependent or
resource-exporting, i.e. mineral fuels‘ exports take up a large share of its GDP. In a way, this also
qualifies the country as a developing country. There may be some other critical characteristics and
factors that will need to be analyzed, including through the formulation of hypotheses (i.e. strong
state coordination of economic policy, ‗late-joiner‘ to the WTO, etc.), but not all of them need to be
included in the research question. Taking these into account the formulation of the research
question will be as follows:
―Under which conditions is it economically beneficial for a resource-exporting developing country
to accede to the WTO?‖
It is hoped that the present research work will contribute to the scholarly knowledge in the area of
WTO accession and different conditions that influence prospects for getting benefits from the
25
accession. Based on the findings of the present thesis, countries which are similar in economic
structure and governance to Turkmenistan, would be able to develop a more nuanced approach to
negotiations as part of their WTO accession and better manage effects of WTO accession for their
economies, as well as mitigate adjustment costs and maximize benefits following the WTO
accession.
5.2. Hypotheses Concerning the Research Question
Based on the research question formulated above, as well as on the above literature review on key
factors affecting benefits from free trade and WTO accession, relevant research hypotheses can now
be formulated. The hypotheses will focus on the areas – or conditions or factors – affecting
economic benefits from WTO accession which appear to be under-researched, i.e. in which there is
lack of scholarly consensus as to whether these conditions have a clearly positive or negative
influence on gaining benefits from WTO accession. The hypotheses will not be mutually exclusive,
but will still compete with each other to explain which condition influences a developing, resource-
exporting country‘s ability to gain more economic benefits from its WTO accession.
Three hypotheses will be formulated based on economic theories and debates around international
trade and WTO with three Independent Variables (IVs) that can be expressed as: ―X1‖, ―X2‖, ―X3‖
and one Dependent Variable (DV) or ―D‖, which I will attempt to explain by testing ―X1‖, ―X2‖,
―X3‖ and their impact on ―D‖.
5.2.1. Hypothesis 1
An important term included in the research question is ‗resource-exporting‘. By a ‗resource-
exporting‘ country, a lower level of the economy‘s industrialization is implied. This is explained by
the temptation of the resource-rich country to enhance its welfare merely through the sale of its
mineral resources or commodities. Developing through enhancing production and technological
capabilities, knowledge and education is much longer-term and requires much more patience and
consistent, disciplined efforts on the part of the state. That is why resource-rich countries don‘t tend
to focus much on diversifying their industries towards other industries or do it at a slow pace. This
process of slower development in other industries is also likened to the phenomenon of ‗resource
curse‘, i.e. abundance of a specific resource, which can bring quick enrichment, but usually leads to
slack progress in other areas of economic development, such as the manufacturing sector, which
require steady knowledge-based progress (Ross 1999; Rosser 2006; Humphreys, Sachs and Stiglitz
2007).

26
However, some states, such as Norway, have been able to overcome the danger of becoming
dependent on their natural resources and have advanced industrially at high rates. Norway‘s ranking
in the UNIDO‘s Competitive Industrial Performance Index is 0.12 which is quite high, i.e. the 31st
in the world, despite the exports of its mineral fuels and oils comprising two-thirds of its total
exports (International Trade Centre 2014). This demonstrates that there are resource-exporting
states which have been able to reach a significant level of industrialization, despite the risk of being
‗cursed‘ by their resources.
As this discussion is moved into the WTO accession context, one needs to recall that the
fundamental theoretical framework of the WTO is based on the concept of free trade, which stands
on the Theory of Comparative Advantage (Ricardo 1817) and the Neoclassical or Factor
Endowment Theory (Heckscher 1949; Ohlin 1933), as described in an earlier section of the present
research paper (Chapter 4 on Literature Review). The Comparative Advantage theory asserts that
countries should engage in international trade by specializing in the export of goods that can be
produced at lowest relative cost, while the Factor Endowment theory postulates that countries
should specialize in the production of the commodities that make use of their abundant factors of
production (land, labor, capital, etc.). Applied to a resource-exporting economy this means that such
countries should continue to focus on selling – and maybe processing, in some cases – their natural
resources, which are their ‗cheapest‘ and most ‗abundant‘ product. After all, theoretical and most
practical principles laid at the foundation of the WTO call on countries to trade in the goods which
they‘re most competitive in, which, according to the Neoclassical theory and the WTO, are
supposed lead to greatest economic benefits for any country.
But would such an approach, solely based on the neoclassical theory of free trade, lead to the
greatest economic benefits through a resource-rich country‘s accession to the WTO? Or should the
country first seek to industrialize by developing a comparative advantage in a different sector and
thus move itself away from heavy dependence on its natural resources and its exports?
The attempt through the first hypothesis is to test whether the level of industrialization of a
resource-rich and resource-exporting country acceding to the WTO influences its potential for
reaping more economic benefits as a WTO member. Thus, the level of industrialization of a country
will be the independent variable, or ―X1‖, in the first hypothesis, while economic benefits stemming
from WTO accession will be the dependent variable or ―D‖.
While the theory of free trade supposes that any economy, including a resource-rich economy,
should not make any special or ‗unnatural‘ efforts to industrialize before or after the WTO

27
accession, but merely continue to capitalize on its comparative advantage (which is often
understood as selling its natural resources), the author of the present research takes a stance
opposing to that of the free trade theory and hypothesizes that the level of industrialization
positively affects the degree of benefits gained from the WTO accession. This also assumes that
even if a resource-rich country makes active efforts to industrialize, this can be rewarded by greater
economic benefits as a member of the WTO. Thus, the hypothesis itself can be formulated as
follows:
―The more industrialized a country is, the more economic benefits it reaps from the WTO
accession‖.
Testing this hypothesis on the cases of resource-exporting countries and the resulting findings
should help advance scholarly literature in the area of whether a resource-rich country should seek
to industrialize in order to maximize its economic benefits from WTO accession.
5.2.2. Hypothesis 2
The second hypothesis is similar to the first hypothesis in terms of the logic used for its formulation.
The neoclassical theory of economics postulates that the state should not interfere in the market,
except in areas where there is a market failure. The natural market forces of supply and demand
would bring to optimal relations between producers and buyers on the market, including on the
global market, and the prices would be set on the appropriate level to facilitate the largest volume of
trade, which would lead to greatest economic growth. As with the previous hypothesis, this theory
of the state‘s non-interference in market affairs lies in the foundation of the WTO‘s agreements and
policies (e.g. the Agreement on Subsidies and Countervailing Measures).
On the other hand, however, alternative arguments, such as the Infant Industry argument, the Big
Push argument and the Industrialization Strategy approach, have been reviewed above, which call
for a more active, steering role of the state in promoting a country‘s economic growth, including
through a more intelligently guided trade policy by ―influencing the type and sequencing of exports
as a country strives to produce more advanced products, adding higher value‖ (Todaro and Smith
2011: 613). This approach goes against the fundamental theoretical principles of the WTO and
claims it can lead to greater economic benefits for a developing country (see the Literature Review
chapter above; Gerschenkron 1962).
In an attempt to identify which of these theoretical approaches leads to greater economic benefits
for a country acceding to the WTO, the author, again, will take a stance opposing that of the free

28
trade theory and hypothesize that a centrally coordinated economic development strategy oriented at
increasing exports would lead to greater economic benefits, even as part of the WTO. In the second
hypothesis, the dependent variable would remain the same (―greater economic benefits stemming
from WTO accession‖), while the independent variable (X2) would be ―centrally coordinated
industrialization strategy‖. Thus, the second hypothesis will be formulated as follows:
―If a country has a centrally coordinated industrialization strategy, then it will reap more economic
benefits from WTO accession.‖
In approaching this hypothesis, the author believes that researching strictly resource-rich countries
is not a requirement, as resource abundance of a country does not directly influence the causal
relationship between central coordination of economic policy and economic benefits stemming
from WTO accession. At the same time, the outcomes of testing this hypothesis will be applicable
to resource-rich countries as well and will contribute to the research question of the present thesis.
Testing the second hypothesis should help advance scholarly literature in the area of whether a
country should have its government actively guide or direct its industrialization-focused economic
policy in an attempt to maximize economic benefits from the WTO accession.
5.2.3. Hypothesis 3
In the sections titled ―On unequal starting conditions of the North and the South‖ and ―On unequal
starting conditions in the WTO framework‖ above, relevant literature and arguments were discussed
on how the ‗lateness‘ of developing countries in joining the liberalized global trade environment
and the WTO play against them, and that the currently developed countries have the advantage of
entering the global trade field earlier than most other countries or that the current WTO members
have the advantage of already being in the WTO, while other developing countries are only
undergoing the accession process.
These theoretical arguments, in a way, go against the neoclassical free trade theory by questioning
the beneficial nature of free, liberalized trade for all countries, at least in the short- or medium-term
context. Instead, the ‗lateness‘ arguments suggest possible losses for developing countries in freely
trading with developed countries (see Krugman 1981; Dutt 1988; Khor 2001). This also applies to
the WTO framework, as it too has ―asymmetries and imbalances against the developing world, and
has made ‗late-comers‘ face more stringent policy conditions for industrialization and
development‖ (Raghavan 2000).
29
Through the third hypothesis, the author attempts to test these arguments. Again, the dependent
variable would remain the same (―greater economic benefits stemming from WTO accession‖),
while the independent variable (X3) would be ―the earliness/year of a country‘s WTO accession‖.
So the third hypothesis states:
―The earlier a country accedes to WTO, the more economic benefits it will gain from the
accession.‖
Again, in approaching this hypothesis, the author believes that researching strictly resource-rich
countries is not a requirement, as resource abundance of a country does not directly influence the
causal relationship between the timing of a country‘s WTO accession and economic benefits
stemming from the accession. At the same time, the outcomes of testing this hypothesis will be
applicable to resource-rich countries as well and will contribute to the research question of the
present thesis.
Testing the third hypothesis should help advance knowledge on how much the lateness of
developing countries‘ accession to the WTO affects their ability to reap benefits from the accession.
Also, this knowledge will help acceding countries adjust their policies and the speed of their
accession process in order to maximize economic benefits from the WTO accession.

30
Chapter 6. Methodology and Case selection
To test the above hypotheses, a suitable methodology needs to be developed. The methodology will
mostly focus on using quantitative (basic statistical) methods for conducting the analyses, but will
also refer to qualitative methods, where quantitative methods are deemed insufficient. This chapter
on methodology will also define the types of quantitative and qualitative approaches and methods
(comparative, forward-looking vs. backward-looking, most similar vs. most different systems
design, etc.), operationalize the variables in the hypotheses, after which the actual cases will need to
be identified and analyzed.
6.1. Summary of Methodology Used
The research will apply both quantitative and qualitative methods. The quantitative methods are
going to be very basic statistical ones. Once the three independent variables (X1, X2 and X3) and
the dependent variable (D) are operationalized, suitable cases (i.e. country experiences) will need to
be identified. Two cases will be selected for each of the hypotheses. Each pair of cases will be
analyzed separately, first, using the statistical comparative methods, and then, when necessary, by
going into qualitative comparative methods.
The focus in testing the hypotheses will be on the independent variables (the level of countries‘
industrialization, their central governments‘ level of coordination of economic policy and the
earliness/lateness of their WTO accession). This means the design of the present research is
forward-looking (and not backward-looking), i.e. by analyzing independent variables their effect on
the dependent variable (economic benefits stemming from WTO accession) will be determined.
Obviously, cases will be carefully selected based on theoretical considerations discussed up to this
point in the thesis. While basic statistical methods will also be applied, the importance of careful
theory-based selection of cases will become evident, when the analysis reaches the stage of
qualitative comparison of the cases. One of the reasons for well-thought-through case selection is to
increase the internal validity of the research project. I.e. the analysis will actually need to explain as
much as possible the factors affecting the causal relationship between independent variable and the
dependent variable. This means that the cases (or country experiences) that actually clearly
demonstrate the relevant observable factors‘ influence (or lack thereof) on the dependent variable
are going to be most useful.
In order to ensure this, the most similar systems design will need to be applied. What this means is
that in selecting the country cases two most similar countries will be chosen, which only differ on

31
the main factor that interests the research, i.e. the independent variable. Then, depending on how
this factor plays out on the dependent variable (economic benefits stemming from the WTO
accession), relevant conclusions can be made.
6.2. Operationalization and Data Sources
6.2.1. Dependent Variable Operationalization and Data Source
For the quantitative and qualitative methods of analysis to be specific and to refer to the same set of
indicators in the analysis of different cases or different independent variables, one common and
well recognized, but also quantifiable indicator needs to be identified. Since the dependent variable
in the hypotheses of the present research is ‗economic benefits stemming from the WTO accession‘,
the author believes the best indicator representing an increase or decline in the economic wellbeing
of any country is its annual GPD growth/decline rates. This indicator is widely used and recognized,
with commonly agreed methodology of its calculation and easily available data. The data for the
present research will be mostly extracted from the World Bank‘s online statistical database
(http://data.worldbank.org).
GDP is also a very comprehensive indicator, which encompasses many other aspects of ‗economic
benefits‘ or economic development within just one indicator. Since there‘re many declared
‗benefits‘ of WTO accession, it would be too challenging to analyze them individually, but they all,
to a degree, manifest themselves in GDP growth rates in the long-run (10-15 years), while other
measures of accession effects (exports volumes, FDI volumes, etc.) show only a partial picture (for
some other ways to capture effects of WTO accession, see Cattaneo and Primo Braga 2009: 9).
Another key comment in relation to the operationalization of the dependent variable is that
economic benefits from a specific factor, event or process cannot be measured at a specific point in
time, i.e. usually effects of an economic or other event on a country‘s economy are promulgated and
are observable after or over a certain period of time (several months, but usually several years). This
is even more so for such a macro-level event as a WTO accession, the effects of which are only
visible several years after, once the economic transformations and policies implemented as part of
WTO accession are starting to take effect. This timeframe issue is complicated even further if one is
to consider that the timing of the actual economic reforms that an acceding country commits to do
not necessarily coincide with the date of the formal accession. It is only as a result of the actual
reforms that economic processes and market relationships begin to change and evolve. So the
timing of those reforms becomes important if one really wants to attribute the benefits of the WTO

32
accession. Sometimes the difference in years between the formal accession and the real economic
reforms can amount several years.
That is why in each of the countries to be identified as case studies, it will be necessary to observe
and compare a longer span of years, i.e. a period of at least 8-10 years prior to the WTO accession
and a period of at least 8-10 years following the WTO accession in order to provide the assessment
as accurately as possible and the economic benefits to be attributed to WTO accession-related
reforms.
GDP growth rates in per cents (%) for those periods will need to be averaged. The comparison of
the GDP growth rates prior to and after the WTO accession should give an idea of whether the
economic growth of a specific country has accelerated or decreased post-WTO accession. This
method of dependent variable operationalization will be applied in testing all three hypotheses in
the present research.
In some cases where it will be purposeful to do so, some other dimensions will be added to the
Dependent Variable, i.e. additional methods of its operationalization will be introduced.
Alternatively, this can also be done by introducing intermediate variables. For example, indicators
for the Manufacturing Value Added (MVA) for periods prior and post WTO accession can be
compared and analyzed for the countries in question. Data for this indicator can also be accessed at
that above-mentioned World Bank online database. The purpose behind adding additional
operationalization indicators is to provide a more focused perspective or additional angles on how
independent variables influence economic benefits as a result of WTO accession.
6.2.2. Independent Variable Operationalization and Data Sources
Operationalization of the independent variables will need to be done using both the quantitative
indicators and qualitative definitions. The reason for this is that not always clear quantitative
indicators are available. In any case, operationalization and available data sources for each of the
independent variables will need to be discussed separately.
6.2.2.1. Independent Variable 1
The independent variable in the first hypothesis developed for the present research is ‗the level of
industrialization of a country‘. To operationalize this variable, an objective statistical,
33
i.e. quantifiable, indicator needs to be identified. There are several institutions that do this, but one
should also remember that the level of industrialization needs to be assessed for the year in which a
country acceded to the WTO. This is a more challenging task given that most of our case studies
will need to be of the countries, which had acceded several decades ago, or one decade ago at the
latest (this is necessary to ensure a time series of at least 8 years for the dependent variable, which
was discussed in the previous sector on Dependent Variable Operationalization and Data Source).
So the source for the industrialization indicator has to go back in time at least around 15-20 years
ago.
Having conducted in-depth research into statistical databases that track the level of countries‘
industrialization, the author came to the conclusion that the Competitive Industrial Performance
(CIP) Index of the United Nations Industrial Development Organization (UNIDO) is the most
comprehensive and elaborate measure of countries‘ progress in industrialization. Its data goes back
until 1990, although not available for all countries. But its key advantage is its objectivity and
accuracy as the UNIDO is a well-recognized, reputable and non-biased international organization
specializing on the matters of industrialization. This makes the methodology behind the CIP index
reliable and trustworthy.
So according to the most similar systems design for Hypothesis 1, two oil-rich and/or oil-exporting
countries would need to be identified with their CIP indices significantly differing from each other‘s
at the time of their WTO accession. The fact that the UNIDO data goes back to only 1990 limits the
choice of countries available for selection for Hypothesis 1 to only those countries which acceded
after 1990. But this is not a huge limitation as the author‘s intention was to stay within the
timeframe of the past 20 years or so anyway, because other data (e.g. GDP, other intervening
variables, secondary literature, etc.) is likely to be scarce for years prior to 1990 anyway.
The two selected cases will also need to be as similar as possible on all other control variables, i.e.
other factors that might influence the dependent variable, i.e. their GDP growth rates. Some of the
possible control variables to keep an eye on are:
- Geographical location;
- Economic structure (share of mineral resources sales in GDP);
- Size of the economy;
- GDP growth rates prior to WTO accession;
- Political structure;
- Government‘s level of commitment to reform and actual implementation of those reforms;

34
- Year of joining the WTO, etc.
It is unrealistic to expect that these control variables would be totally similar in terms of their level
of influencing countries‘ GDP growth rates. So the similarity of the ones that are deemed to have
lesser effect on GDP growth rates can be sacrificed, which should not affect the internal validity of
the research. These factors will be analyzed at a greater depth in further chapters of the research.
6.2.2.2 Intervening Variables for Independent Variable 1
As part of testing Hypothesis 1, the author also introduces and analyzes intervening variables,
which also need to be operationalized. One of the variables will be the value added in the
manufacturing sector, which can be operationalized by the indicator often used by the World Bank,
i.e. the Manufacturing Value Added (MVA). This indicator is calculated by the World Bank for
most countries of the world on annual basis and is measured in several different ways, including as
percentage share of GDP and in absolute values, e.g. current US dollars. This data is also accessible
on the World Banks online database of World Development Indicators.
Another intervening variable that will be referred to as part of testing Hypothesis 1 is the
dependency of countries on their exports of mineral fuels. This variable can be operationalized in a
straightforward manner, by using either the percentage share of mineral fuels‘ exports in a country‘s
GDP or the absolute values of mineral fuels‘ exports in current US dollars or in current national
currencies of the countries of interest. This kind of data is available on various sources, including in
the Trade Map database of the International Trade Centre, which collaborates with the UN
Comtrade database.
6.2.2.3 Independent Variable 2
Operationalization of the second independent variable will need to be more subjective, i.e. refer to a
well-established qualitative definition of the ―centrally coordinated industrialization strategy‖.
Obviously, this variable is difficult to quantify. Various rankings of countries by economic freedom
(The Heritage Foundation) or economic transformation (Transformation Index BTI) assess
economic developments in a country on a wider scale, whereas for the present research the role of
the government specifically in relation to steering economic policy needs to be defined. That is why
the author decided to use qualitative judgment in choosing two countries that will need to be
different in terms of their government‘s intervention in steering trade policy.
35
The specific definition of a ‗centrally coordinated industrialization strategy‘ will be taken from an
earlier chapter of this research on state-of-the-art literature review, i.e. it envisions ―an active role
for government in influencing the type and sequencing of exports as a country strives to produce
more advanced products, adding higher value‖ (Todaro and Smith 2011: 613).
The stance of the government will be assessed for the several years before and after the WTO
accession and that stance will need to remain consistent during that whole time span in order for
this independent variable to be properly operationalized.
So according to the most similar systems design for Hypothesis 2, two developing counties would
need to be identified with different levels of their government‘s intervention in their trade policies.
One government would need to be very actively engaged in guiding the country‘s trade policy and
reforms, while the other country‘s government would need to take a laisser-faire approach and let
market forces take care of what‘s produced and traded by the country.
As was the case with Hypothesis 1, the two cases would need to be selected in such a way so that
all/most other control variables in the two countries would be as similar to each other as possible.
These control variables would be the same for Hypothesis 2, as they were for Hypothesis 1, with the
addition of one more factor – the level of the countries‘ industrialization (which had to be different
for the two cases identified for Hypothesis 1).
6.2.2.4. Independent Variable 3
For Hypothesis 3, it may seem quite straightforward to operationalize its independent variable,
which is the ‗year of a country‘s WTO accession‘. The year in which any WTO member acceded to
the WTO or signed the GATT agreement is available on the WTO website (2015c).
But one important qualification has to be made. Often, the actual year in which the country formally
accedes to the WTO does not coincide with the actual economic and/or legislative reforms a
country undertakes as part of its WTO accession. In some cases the reforms can be implemented
several years prior to the formal accession due to the country‘s early efforts to bring its economic
and legislative regime in compliance with the WTO‘s rules and requirements. In other cases,
especially with the least developing countries, a transition period can be granted to an acceding
country, which allows the country to undertake many of the reforms several years down the road,
and a the actual WTO accession can take place before those reforms are undertaken. So whenever

36
possible, the author will try to track the year in which the majority of the reforms related with the
country‘s WTO accession actually took place.
The differentiation between the two cases selected for testing Hypothesis 3 can be done by ensuring
a sufficient time gap between the accession years of the two selected developing countries. It would
be appropriate if that gap is between 10-15 years. If it‘s closer, there is a risk that the differentiation
between the independent variables of the two cases would not be as clear-cut. If it‘s longer than 15
years, there is a risk that data may not be available (or sufficient) for the country that acceded, to the
WTO, or signed the GATT Agreement, earlier (i.e. prior to 1990). However, if this data concern is
addressed, then the time gap can be even longer.
Again, according to the most similar systems design, other independent variables affecting the two
countries‘ GDP growth rates, called control variables, would need to be as similar to each other as
possible. It would be ideal if the only differing independent variable would be the year of accession.
One of such control variables is the historical economic context of the case countries. This factor
should be stable around the accession years of both countries to be selected. This means that there
should not be major political or economic shocks for either of the countries during the time periods
to be analyzed, i.e. 10-15 years before the accession and the 10-15 years post-accession. Shocks,
such as financial or economic crises often significantly affect countries‘ growth trajectories,
whereas our objective is to trace the influence of the WTO accession year per se on the two selected
countries‘ growth trajectories.
6.3. Actual case (country) selection
6.3.1. Selection of Two Cases for Hypothesis 1
The selection of the two cases for testing the first hypothesis needs to be done in a way to ensure
that all – or at least the most critical – conditions set out in the previous section on the
operationalization of the relevant independent variable (X1) are met. While the variable that is of
research interest to us (the level of industrialization of a country) needs to be different for the two
cases, the other control variables that should be as similar as possible are:
- Geographical location;
- Year of accession the WTO;
- Economic structure (share of mineral resources sales in GDP);
- Size of the economy;
- GDP growth rates prior to WTO accession;
37
- Political structure;
- Country‘s/government‘s commitment level to reform and actual implementation of those
reforms.
After careful consideration of various regions and countries, the author of the research came to a
conclusion that the Middle Eastern region provides a good selection of countries, located with the
same region, with similar political systems and economic structures heavily reliant on mineral
resource exports. Out of the Middle Eastern countries Saudi Arabia and Oman comprise a pair of
countries whose industrialization levels are quite different from each other‘s, while their accession
to the WTO happened at around the same period (2000 for Oman and 2005 for Saudi Arabia).
The sizes of the economies vary by around nine times: Saudi Arabia‘s GDP in 2013 was 748 bln US
dollars, while Oman‘s GDP was 80 bln US dollars (The World Bank online database,
http://data.worldbank.org/country?display=graph, accessed January 2015). However, this factor is
believed not to be so critical in analyzing the independent variable.
The countries‘ UNIDO CPI indices were 0.09 for Saudi Arabia and 0.02 for Oman at their time of
their WTO accession (2005 and 2000 accordingly) (UNIDO 2015). Saudi Arabia‘s CIP Index is
approximately on the level of such countries as Russia and Argentina. There are roughly around 50
countries that are placed between Oman and Saudi Arabia, while the total number of ranked
countries on the CIP Index list is little over 100. Almost all other Middle Eastern countries are
placed between Oman and Saudi Arabia in the ranking, which makes the two countries almost as
distant from each other as possible in terms of the independent variable being analyzed (level of
their competitive industrial performance).
Figure 5. Oman’s and Saudi Arabia’s UNIDO CIP indices from 1990 to 2010.
Source: UNIDO Competitive Industrial Performance Index, 2015.
The level of both economies‘ dependence on hydrocarbon (mainly, oil) resources is very similar to
each other‘s. Saudi Arabia‘s exports of mineral fuels, oils and distillation products comprising 89%

38
of its total exports at the year of its WTO accession (2005). The share of Oman‘s exports of the
same types of products in its total exports comprised 80% in 2000, the year it joined the WTO
(International Trade Centre 2015).
Table 1. Oman’s and Saudi Arabia’s mineral resource exports at time of WTO accession.
Exports at year of WTO accession Oman (2001*, US dollar thousand)
Saudi Arabia (2005, US dollar thousand)
All products 11 036 616 180 737 249
Mineral fuels, oils, distillation products, etc 8 883 366 161 718 621
Share of Mineral resources in Total exports 80% 89%
* Data for 2000 not available
Source: TradeMap, Market Analysis and Research, International Trade Centre (ITC), 2015
Both countries demonstrated steady growth rates in the decade preceding their accession with the
average annual growth rate of Oman equaling 4.21% and the average annual growth rate of Saudi
Arabia equaling 3.45%. The similar rates of GDP growth of both countries is another control
variable that qualifies these cases to be selected according to the most similar systems research
design.
6.3.2. Selection of Two Cases for Hypothesis 2
Similar to the approached used in relation to Hypothesis 1, the selection of the two cases for testing
the second hypothesis needs to be done in a way to ensure that all – or at least the most critical –
conditions set out in the previous section on the operationalization of the relevant independent
variable (X2) are met. While the variable that is of research interest to us (the level of the
government‘s central coordination of the economic/trade policy) needs to be different for the two
cases, the other control variables that should be as similar as possible are:
- Geographical location;
- Year of accession the WTO;
- Economic structure (share of mineral resources sales in GDP);
- Size of the economy;
- GDP growth rates prior to WTO accession;
- Level of industrialization of the economy.
There were different approaches to selecting case studies for the second hypothesis. The biggest
challenge is the subjectivity of identifying countries with governments either actively implementing

39
economic development strategies or letting the economy develop on the laissez-faire principle. The
second challenged encountered during this exercise was the matching of the countries‘ years of
WTO accession. Often, the countries that seemed to suit the definitions for operationalization
turned out to have very distant years of accession, which distorts the global/regional economic
contexts for the countries at question. A third challenge was to identify two cases of countries
located in the same region or even the same continent. Often, countries located in the same region
have similar economic governance systems, whereas for the present research the author sought for
two countries with significantly differing independent variables (i.e. economic governance styles).
The various options, i.e. pairs of countries, considered by the author for testing this hypothesis
included: an East Asian country vs. a Latin American country, a former-Soviet laisser-faire country
vs. a former Soviet developmental state, South Korea vs. Hong Kong, Costa Rica vs. Mexico. But
the choice was made to compare two African countries, especially given West African countries‘
experience of Structural Adjustment Programs in the 1980-90s, which can represent a good case of
a laisser-faire economy. So Ghana was selected as country to represent that style of economic
governance, while Botswana was selected as a country with the state leading an outward-oriented
economic – or industrialization, or trade – policy.
One qualification has to be made up front, i.e. it was not possible to meet all of the challenges listed
above. Specifically, in the case of Ghana-Botswana, the two countries did not sign the GATT
Agreement at around the same time. Ghana signed it in 1957, while Botswana signed it in 1987, i.e.
30 years later. But the actual effect of this huge time difference on the countries‘ economic policies
should not be misleading. In fact, unlike in the times of WTO, signing of the GATT Agreement did
not entail an obligation to undergo substantial reforms in the economy. So Ghana‘s economic
governance and, in fact, the structure of economy as a whole between 1957 and 1984, when it
embarked on its World Bank and IMF-initiated Structural Adjustment Programs, has not changed
much (Ghana Web).
In fact, the actual neoliberal reforms which the WTO advocates for have taken off in Ghana in
1984, with the implementation of the above-mentioned Structural Adjustment Program (SAP). So in
effect, the SAP‘s effect on Ghana‘s economy was virtually the same as the WTO accession would
have on a developing country in the present days. So conditionally qualifying Ghana‘s SAP as a
WTO accession can allow us to comparatively study Ghana and Botswana by preserving the
methodological consistency. One would just need to take account of this conditionality in
interpreting the results.

40
The author believes the two other challenges mentioned above (identifying countries that match the
definition for operationalization and finding two countries from the same region) have been
satisfactorily resolved. Obviously, the countries are from the same continent, though not quite
closely located to other. They have similar political histories, having been colonies of the United
Kingdom, which also means their property rights and rule of law systems interested from the
colonial era were similar at the time they gained their independence (see Acemoglu and Robinson
1999 on the significance of pre-independence colonial regime in determining the adoption of
property rights and rule of law institutions post-independence).
Both countries were very poor at the early stage of their independence (1960s), but had sufficient
reserves of mineral resources to aid their development. Botswana identified large deposits of
diamonds in 1967 (Capital Resources, Botswana Country Overview, 2013/14: 7), while Ghana
possesses industrial minerals, hydrocarbons and precious metals and is considered an average
natural resource enriched country. Its 1960 per capita income of about $500 was comparable to that
of South Korea or Mexico (see Benneh 1998: 1).
According to the research design of this thesis, the two countries are different in terms of the second
independent variable, the centrally coordinated industrialization strategy. Their economic
governance during the years to be analyzed, 1984-2000, has differed significantly. This SAP
program launched in Ghana, with the assistance of the World Bank and the International Monetary
Fund, introduced such policy changes as the implementation of free market principles, removing
price controls, privatization of state industries, currency rate liberalization, etc, i.e. all attributes of a
free market system. This process was accompanied by layoffs of civil servants, students hearing
higher costs for their education and patients facing higher costs for health services (GhanaWeb).
Botswana‘s stable political situation over the years of independence has allowed it to carry out
economic development policies conducive for growth. Other than leading the country in a stable
political environment, the role of the government was also critical in terms of economic
governance. Botswana‘s National Development Plans (NDPs) have historically been the main
document setting out economic policy priorities and framework for the country. Their term is for
six years and they have been used since independence. The current NDP is the tenth in Botswana‘s
history. These documents help the government plan economic development, as well as specific
development projects. Other than traditional state ministries and institutions, the country also has
the Botswana Economic Advisory Council (BEAC), a high level body comprising local and foreign
experts that provides guidance on economic development strategies. BEAC has produced the
Botswana Excellence Strategy document, a high-level overview of development priorities and
41
strategies based on the diversification objective (Capital Resources, Botswana Country Overview,
2013/14: 30).
All of the above qualifies Botswana as a country with its government centrally coordinating its
industrial policies, which qualifies this country as one of the two cases, along with Ghana, for
testing Hypothesis 2.
6.3.3. Selection of Two Cases for Hypothesis 3
In identifying the two cases for testing the third hypothesis, which states that ‗the earlier a country
accedes to WTO, the more economic benefits it will gain from the accession‘, the comments and
qualifications made in the section above on the operationalization of the third independent variable
(determining the year in which most WTO-related reforms took place, ensuring a time gap of
around 15 years, keeping other control variables similar, etc.) will need to be taken into account.
One of the control variables mentioned in the section above is the historical economic context, i.e.
our case countries should not have been subjected to major political or economic socks during the
period before or after the accession. With this in mind, we would have to eliminate former Soviet
republic – or even former socialist bloc countries for that matter – from our Hypothesis 3 analysis.
The break-up of the USSR and the socialistic block had a major impact on the economic growth
trajectories of these countries, most of which started their WTO accession process at around the
same time (see Table 2 below). Those eastern European countries which were signatories to GATT
since 1950s or 1960s did not really implement the GATT agreement provisions until late 1980s or
early 1990s (Cattaneo and Primo Braga 2009: 9-12). All this makes the quantitative comparison of
either of these countries with another country which acceded to the WTO either more than 15 years
before or around 10-15 years after, i.e. in 2000s, biased. This means the selection will have to be
made from among some other countries.

42
Table 2: CIS countries’ accession status to the WTO
Country Application Membership
Armenia November 1993 February 2003
Azerbaijan July 1997 Ongoing negotiations
Belarus September 1993 Ongoing negotiations
Georgia July 1996 2000
Kazakhstan January 1996 Ongoing negotiations
Kyrgyzstan February 1996 December 1998
Moldova November 1993 2001
Russia June 1993 August 2012
Tajikistan May 2001 2013
Turkmenistan … …
Ukraine November 1993 May 2008
Uzbekistan December 1994 Ongoing negotiations
Source: WTO website
Similar challenges exist when other geographically co-located countries are analyzed. Most of the
East Asian countries joined GATT quite early in the process, and their joining/accession years are
not too distant from each other‘s. The author came to a conclusion that, again, a Middle Eastern pair
of countries would be a good set. Despite these countries‘ similar economic structures and political
and economic histories, they have varying WTO accession years. For example, Kuwait signed the
GATT Agreement back in 1963, whereas Yemen acceded to the WTO as recently as in June of
2014 (WTO website, accessed in January 2015). But choosing two countries which are so long
apart in time would present a historical context challenge, i.e. the political and economic context
changes too much over such a long time period, while in the case of Yemen post-accession data
time series would not be available.
Thus, Bahrain and Saudi Arabia were actually selected for the analysis as part of testing Hypothesis
3. These countries‘ accession years are 12 years apart. Bahrain joined the GATT agreement in 1993,
while Saudi Arabia acceded to the WTO in 2005. Thus, the difference between the independent
variables (year of WTO accession) of the two countries is sufficiently big. Also, Bahrain joined the
GATT agreement, the process for which is much easier, whereas Saudi Arabia had to undergo
stringent accession processes, including difficult negotiations with member countries. This adds to
the time contrast that is the subject of analysis as part of this Hypothesis.
Almost all of the control variables for these countries are the same. They are both located in the
same geographical region and have similar resource-dependent economic structures. Their political
systems are also the same, i.e. a monarchy.

43
The sizes of the economies vary by more than 20 times: Saudi Arabia‘s GDP in 2013 was 748 bln
US dollars, while Oman‘s GDP was 33 bln US dollars (The World Bank 2015). However, this
factor is believed not to be so critical in analyzing the independent variable.
Both countries demonstrated steady growth rates in the decade preceding their accession with the
average annual growth rate of Bahrain equaling 5.53% and the average annual growth rate of Saudi
Arabia equaling 3.45%. The similar rates of GDP growth of both countries is another control
variable that qualifies these cases to be selected according to the most similar systems research
design.
6.4. Actual case analyses – Hypotheses Testing
6.4.1. Testing Hypothesis 1
6.4.1.1. Statistical Comparative Analysis
To test the hypothesis which states that ‗the more industrialized a country is, the more economic
benefits it reaps from the WTO accession‘, using the selected cases, i.e. Oman and Saudi Arabia, it
is necessary to compare the statistical indicators of the two countries. Specifically, the dynamics of
the two cases‘ dependent variables, i.e. the changes observed in the countries‘ GDP growth rates
following their WTO accession, need to be analyzed. To do this the following figure was developed
by the author using World Bank historical statistics on countries‘ annual GDP growth rates.
Figure 6. Oman’s and Saudi Arabia’s annual GDP growth rates before and after WTO
accession.
Source: World Bank‘s World Development Indicators, 2015
-4
-2
0
2
4
6
8
10
Oman(accession year - 2000)
Saudi Arabia(accession year - 2005)

44
Looking at the graph, a trend can be observed that Oman‘s growth rates were generally higher
during the 10 years before the accession year (red vertical line). But the trend changes for the period
after the accession, which is already quite indicative. Quantifying the two countries‘ annual GDP
growth rates through calculating their average GDP growth rates for the periods before and after the
WTO accession will provide even a clearer picture. As a result of this, it will be possible to trace the
relative changes in the growth rates (negative or positive) after the accession and even determine
the extent of such changes (as a difference of two averaged percentage figures).
Table 3. Oman’s and Saudi Arabia’s average growth rates before and after WTO
accession.
Average GDP growth rates (%) WTO accession Change in
GDP rate
10 years prior 8 years after
Oman 4,21 3,49 -0,72
Saudi Arabia 3,45 6,86 +3,41
Source: World Bank‘s World Development Indicators, 2015
As it can be seen from Figure 6 and Table 3 above, the WTO accession has affected the two
countries‘ growth rates, i.e. the dependent variable, in different ways, despite the similarity of many
independent control variables. The average GDP growth rate for Oman, which had a lower level of
industrialization at the time of WTO accession, has gone down from 4.21% prior to the accession to
3.49% during the eight years following the accession. This marks a negative trend of -0.72%.
At the same time, the trend for Saudi Arabia, which had a higher index of industrial performance,
was much more positive. Its average GDP growth rate has increased twofold from 3.45% during the
decade before the WTO accession to 6.86% during the period following the WTO accession, which
is a significant increase of 3.41%.
To comment on the possibility of large-scale external factors affecting the calculations, it should be
noted that the global crisis of 2008-2009 should have affected both countries in a similar way, i.e.
for both countries the crisis years fell on the period after the WTO accession. This means that other
things being equal, the crisis should have affected both countries‘ GDP growth rate trends in a
similar way. Thus, the change in different rates of GDP growth after the accession cannot be related
with the global crisis.
The only key variable that was different for the two countries in the research model (other than the
sizes of the economies, which we mentioned above) is the two countries‘ level of industrial

45
performance, which supposedly affected the differences in their GDP growth rates, which has been
clearly demonstrated statistically.
The whole statistical comparison exercise has been summed up in the following table:
Table 4. Comparative Statistical Analysis of Oman’s and Saudi Arabia’s starting
conditions before WTO accession and GDP performance after the WTO accession.
Variables Oman Saudi Arabia
Independent Variable:
UNIDO CIP Index 0.02 0.09
Control Variables
WTO accession year 2000 2005
Mineral resource dependency (share of mineral
exports in total exports at year of accession) 80% 89%
Size of economy (GDP in 2013, USD) 80 bn 748 bn
Geographic region Middle East Middle East
Average GDP growth rate before WTO accession (10
yrs.) 4.21% 3.49%
Dependent variable
Average GDP growth rate change before and after
WTO accession -0.72% 3.41%
Source: Previous sections of the present thesis.
While the statistical method of testing the causal or correlational relationship between the two
countries‘ level of industrialization at the time of WTO accession and their GDP performance
following the accession has provided initial positive answers regarding Hypothesis 1, this
relationship needs to be analyzed further by searching for intervening variables that should shed
more light on whether the relationship is actually causal or simply correlational through another
independent variable that affects both the independent variable and the dependent variable in
Hypothesis 1. Thus, searching for an intervening variable will help explore the exact mechanisms of
this relationship. This will be the next stage of testing Hypothesis 1.
6.4.1.2. Looking for Intervening Variables: Manufacturing Value Added
Whether and how a country‘s industrialization level translates into its faster economic growth or
more effective economic development following its WTO accession is the question to be answered
by looking for intervening variables in Hypothesis 1? In this section an attempt will be made to
identify intervening variable(s) that relate the independent variable 1 (X1) with the dependent
variable (D), i.e. the level of a country‘s industrialization and its economic benefits from WTO
accession.

46
Since the approach selected in this thesis is forward-looking, i.e. from the independent variable
towards the dependent variable, the author begins the search for intervening variables from the
independent variable (X1 or the level of a country‘s industrialization) and looks at immediate
effects that the independent variable may have had on other factors (I-1.1; I-1.2; etc.), under the
influence of the WTO accession, that could then pass on their effect on the dependent variable (D or
economic benefits).
The first step in assessing that relationship is to determine whether the level of Saudi Arabia‘s or
Oman‘s industrialization, measured by the UNIDO Competitive Industrial Performance Index
above, has affected the growth of Manufactured Value Added (MVA) in the two countries during
the years after the WTO accession, or has the MVA share remained at around the same level.
Logically thinking, if Saudi Arabia‘s CIP index is higher, i.e. it‘s more industrialized, at the time of
WTO accession, the country‘s MVA should grow faster in the following years, especially with the
effect of greater industrial and trade liberalization that the WTO brings. With easier access to
international export markets and better conditions for foreign investment attraction, which the WTO
provides, Saudi Arabia should have been more successful than Oman in increasing the share of its
manufacturing sector in its exports, including through higher MVA share in its GDP.
This line of thinking is also supported by a research conducted by S.M.Shafaeddin, senior
economist in charge of macroeconomics and development policies at UNCTAD, in 2005. In his
work titled ―Trade Liberalization and Economic Reform in Developing Countries: Structural
Change or De-Industrialization‖ Shafaeddin shares outcomes of his statistical observations in a
wide range of developing countries during and after their trade liberalization reforms and concludes
that for most of them ―trade liberalization has led to the development and re-orientation of the
industrial sector in accordance with static comparative advantage, with the exception of industries
that were near maturity‖ (Shafaeddin 2005: 1, script changed to cursive by the author of this thesis).
Saudi Arabia, with the UNIDO CIP index of 0.9, can be qualified as a country with its
manufacturing sector ‗near maturity‘, thus should have experienced a structural change towards
greater industrialization, i.e. gained dynamic comparative advantage, following the implementation
of the WTO-driven trade liberalization policies. According to the observation of Shafaeddin, Oman,
with the UNIDO CIP index of 0.2, i.e. with the manufacturing sector not yet close to maturity,
should have continued its industrial development ―in accordance with static comparative
advantage‖ (Ibid.) following its WTO accession and the accompanying trade liberalization reforms.

47
The validity of the above logic can be tested by statistically comparing the MVA growth rates of the
two countries, i.e. their MVA share in GDP, during their pre- and post-WTO accession periods:
Figure 7. Oman’s and Saudi Arabia’s Manufacturing Value Added (% of GDP)
Source: World Bank‘s World Development Indicators, 2015
Looking at the graph above, which measures MVA of Saudi Arabia and Oman as a share in their
GDP, one may get an impression that the relationship between the countries‘ level of
industrialization (IV1) at the time of WTO accession and their further MVA growth is inverse. The
MVA share in GDP for Saudi Arabia, which has a higher industrialization level, stays at the same
level in Figure 7, i.e. at the level of around 10%, throughout the whole period (1995-2013). It only
slightly grew to a level of around 11% during 2008-2009. Whereas, for Oman, the share of its MVA
to GDP has started to grow from 1999, i.e. one year before its WTO accession and continued to
grow steadily and reach the level of 10% by 2006.
But this if we look at absolute MVA figures for these two countries, measured in either national
currencies of these countries or in US dollars, it becomes obvious that the figures of MVA as
percentage share in GDP are misleading. This is related with an external factor, another intervening
variable one may call it, which is influenced the total GDP base. While, that intervening variable (I-
1.2) will be considered later in this section, below in Figure 8, are the MVA figures for Saudi
Arabia and Oman for the pre- and post-WTO accession periods:
0
2
4
6
8
10
12
-10 -9 -8 -7 -6 -5 -4 -3 -2 -1
WTO
acc
ess
ion
ye
ar +1
+2
+3
+4
+5
+6
+7
+8
Oman (acceded in 2000)
Saudi Arabia (acceded in2005)

48
Figure 8. Oman’s and Saudi Arabia’s Manufacturing Value Added (in current US$, bn)
Source: World Bank‘s World Development Indicators, 2015
The MVA growth trends in value terms in this figure are totally different and demonstrate that the
MVA for Saudi Arabia has grown significantly starting from a few years before the accession year
and rapidly accelerating during the years after the accession. More specifically, Saudi Arabia‘s
MVA in current US dollars increased from USD 13.7bn in 1995 to USD 75.5bn in 2013 (World
Bank‘s World Development Indicators 2015), i.e. 5.5 times, with most of that growth taking place
after the WTO accession. Meantime, the rate of Oman‘s MVA growth has also been significant, i.e.
18-fold from USD 350mln in 1990 to USD 6.4bn in 2008, but it was from a very low base.
In terms of the difference in the values of Saudi Arabia‘s and Oman‘s MVA indicators, it was
USD 13.35bn ten years prior to their relevant WTO accession years (shown as ‗-10‘ on the graph
above), then it was USD 30.24bn during their WTO accession years (the level of the red vertical
line), and eight years past their WTO accession, the MVA difference was USD 69.15bn. Thus, the
MVA difference in value terms between the two countries grew by 5.2 times.
It is obvious that the key factor behind this MVA growth leap for Saudi Arabia, in comparison with
Oman, is its higher level of industrialization, which it gained during the years prior to its WTO
accession. It is thanks to that level of industrialization that Saudi Arabia‘s MVA was able to take off
even stronger after the WTO accession in 2005. Speaking in terms of Shafaeddin (2005), Saudi
Arabia‘s manufacturing industry was already at the ‗near maturity‘ stage by its accession year, or by
the time it launched its trade liberalization reforms, which allowed its economy to gain ‗dynamic
comparative advantage‘ and further build on its manufacturing sector. This allowed Saudi Arabia to
0,00
10,00
20,00
30,00
40,00
50,00
60,00
70,00
80,00
Oman (acceded in2000)
Saudi Arabia (accededin 2005)

49
overcome to a certain degree the risk of getting stuck in its ‗static comparative advantage‘, which is
mainly crude oil exports.
6.4.1.3. Looking for Intervening Variables: Mineral Fuel Exports
But why were the MVA figures as percentage share of GDP so misleading in Figure 7 above? What
was that external factor that distorted these figures by having such a great effect on the value of the
GDPs of Saudi Arabia and Oman during the analyzed periods? To answer this question, one needs
to look at the structure of these countries‘ GDPs and at how it has changed over the analyzed
period. To be more exact, the share of exports of these countries in their GDP structure needs to be
analyzed.
Figure 9. Share of Oman’s and Saudi Arabia’s exports in their GDPs.
Source: World Bank‘s World Development Indicators, 2015
It‘s clearly visible even without specific figures that the share of exports of both countries in their
GDP has been steadily growing. This suggests that there may be a commodity or service in the
composition of these countries‘ exports structure, which has been influencing the higher level of
exports and the higher share of exports in the GDPs during the analyzed period.
Table 1 shows that both Omani and Saudi exports are heavily dependent on mineral fuels. At their
year of accession, the share of mineral fuel exports in total exports comprised 80% and 89%
respectively for Oman (acceded in 2000) and Saudi Arabia (acceded in 2005). Thus, it is natural to
analyze the two countries‘ mineral fuel exports during the observed period.
0
10
20
30
40
50
60
70
-10 -9 -8 -7 -6 -5 -4 -3 -2 -1
WTO
acc
ess
ion
ye
ar +1
+2
+3
+4
+5
+6
+7
+8
Oman
Saudi Arabia

50
Figure 10. Saudi Arabia’s Exports of mineral fuels during 2001-2013.
Source: International Trade Centre, Trade Map Database
Figure 11. Oman’s Exports of mineral fuels during 2001-2013.
Source: International Trade Centre, Trade Map Database
Looking at the graphs above, which demonstrate the high pace of growth of mineral fuels exports of
both Saudi Arabia and Oman, it becomes obvious why the two countries‘ share of exports in their
GDP rose (see Figure 9) and why their GDP base grew so rapidly during the 2000s as well. This
also explains why Figure 7, which demonstrates the two countries MVA as a percentage share of
GDP, becomes difficult to interpret, despite the high pace of Saudi Arabia‘s MVA growth in
absolute terms (Figure 8).
0
50
100
150
200
250
300
350
400
20
01
20
02
20
03
20
04
20
05
20
06
20
07
20
08
20
09
20
10
20
11
20
12
20
13
Saudi Exports of Mineral Fuels (USD, bn)
Saudi Exports ofMineral Fuels (USD,bn)
0,0
5,0
10,0
15,0
20,0
25,0
30,0
35,0
40,0
45,0
20
01
20
02
20
03
20
04
20
05
20
06
20
07
20
08
20
09
20
10
20
11
20
12
20
13
Oman's Exports of Mineral Fuels (USD, bn)
Oman's Exports ofMineral Fuels (USD,bn)
51
Thus, the rapid growth rate of mineral fuels export revenue for Saudi Arabia and Oman during the
2000s intervenes in the analysis of the causal relationship between the independent variable (X1 or
the level of a country‘s industrialization) and the dependent variable (D or economic benefits
stemming from WTO accession). Thus, it can be defined as the second intervening variable (I-1.2)
in the analysis of Hypothesis 1. Knowing that mineral fuels exports (I-1.2) played such a huge role
in the two countries‘ GDP growth during the 2000s, it would now be virtually impossible to
statistically follow the causal relationship between X1 and D. The effect of the level of countries‘
industrialization (X1) or the effect of the level of the countries‘ manufacturing value added (I-1.1)
over the analyzed period becomes very minor when compared to the effect of such a huge factor as
the growth rate of the mineral fuels exports (I-1.2).
6.4.1.4. Qualitative Methods of Testing Hypothesis 1
At this stage of testing Hypothesis 1, the analysis reached a certain milestone, but also encountered
the challenge of a strong intervening variable. Further conclusions about Hypothesis 1 need to be
made on ‗hypothetical‘ or conditional basis. It‘s already statistically proven that the positive
relationship between the level of industrialization of a country (X1) and the level of Manufacturing
Value Added (I-1.1) holds true. This means the effect of the level of industrialization on the so
called ‗manufacturing sector GDP‘ is also positive. If one is to remove the intervening variable
which so significantly affects the total GDP level, i.e. the high growth rate of mineral fuels exports
or I-1.2, from the total GDP picture, then one can assume that the MVA would have a much
stronger influence on the total GDP. In this case, the stark contrast between Saudi Arabia‘s and
Oman‘s MVA levels (Figure 8) would be more demonstratively reflected in the two country‘s GDP
dynamics, i.e. Saudi Arabia‘s GDP growth rate would be even higher compared to that of Oman,
which would prove Hypothesis 1.
Thus, introducing this qualification, i.e. removing the effect of rapidly growing rates of mineral
fuels exports in Saudi Arabia and Oman during 2000s from their historical GDP figures, it is
possible to conclude that the level of industrialization of these countries at the time of their WTO
accession did indeed have a positive effect on their economic benefits stemming from their WTO
accession. This causal mechanism happened through the increasing value added in Saudi Arabia‘s
manufacturing sector, thanks to its solid base of industrialization at the time of WTO accession,
proven by the UNIDO CIP index of 0.09. The manufacturing sector of Saudi Arabia was able to
withstand the trade liberalization which the WTO brought, because it was at the near maturity stage
already.

52
These conclusions are confirmed through reports on the nature of Saudi Arabia‘s economic
development during the years following its WTO accession, including in the manufacturing sector.
As is the case in many countries with a strong manufacturing base, the WTO accession brought
greater levels of investments and higher employment rates to Saudi Arabia. The country‘s Trade
Policy Review for the years 2005-2011 states:
“Growth of real GDP [during 2005-2009] was attributable to the high level of investment,
which enhanced productivity in many sectors. The annual growth rate for investments
during 2005-09 amounted to about 11.2%, which led the average ratio of investment to real
GDP to rise to about 28.1% in 2009, compared to 21.1% in 2005 (WTO: Trade Policy
Review Report by The Kingdom of Saudi Arabia, 2011).”
The growing role of the manufacturing sector in the Trade Policy Review is also underlined: ―The
contribution of manufacturing to GDP in Saudi Arabia is about 12.7% and it is expected to increase
to about 14% by 2014.‖ The value of various newly emerging manufacturing industries and sectors
in the Saudi economy, including their role in increasing the employment rate, is obvious from the
following excerpt from the Trade Policy Review:
“The value added of other manufacturing industries is expected to grow at an average
annual rate of 7.6%, compared with 6.8% in 2009. Hence, the Ninth Development Plan
forecasts a contribution by these industries to GDP of about 9.2% in 2014. Investment and
employment in these industries is expected to grow during the next three years at average
annual rates of approximately 15.3% and 0.3% respectively, compared with 6.3% and 0.8%
respectively in 2009 (Ibid.).”
All of the above contributes to greater levels of GDP growth, especially the non-hydrocarbon part
of the GDP, which is an important priority of the Saudi government‘s economic policy. The sound
industrialization level achieved by the time the country acceded to the WTO in 2005 is the result of
the country‘s five-year development plans, which have set diversification of the economic base as a
key objective for Saudi Arabia‘s economic and social development. The development plans have
―consistently focused on developing and enhancing the role of non-hydrocarbon sectors in the
national economy‖ (Ibid.). This is why ―the contribution of non-hydrocarbon sectors has grown in
value at an average annual rate of 5.5%, with its share in GDP growing from 51% in 1970 to 73.5%
in 2009‖ (Ibid.).

53
6.4.2. Testing Hypothesis 2
The second hypothesis that needs to be tested states that ―if a country has a centrally coordinated
industrialization strategy, then it will reap more economic benefits from WTO accession.‖ Hence
the first, most basic, stage of testing Hypothesis 2 statistically is comparing how the two countries
GDP performance trends have changed after the WTO accession (or the conditional WTO accession
for Ghana). The GDP annual growth trends for Ghana and Botswana have been visualized on the
same graph below:
Figure 12. Ghana’s and Botswana’s annual GDP growth rates before and after the WTO
accession (Botswana) or SAP reforms initiation (Ghana).
Source: World Bank‘s World Development Indicators, 2015
The figure above demonstrates different levels of GDP growth before the WTO accession or the
SAP initiation year (the vertical red line). The low and unstable levels of Ghana‘s GDP during the
years prior to the SAP are likely related with the high corruption level and social and political
strives in the country (African Economic Outlook: Ghana 2014). Apparently, the SAP reforms,
oriented at implementing a free market-based economy in the country had its positive effects on
stabilizing the GDP growth rates. The average GDP growth rate in Ghana during the 10 years prior
to the SAP program was negative, at -0.61%. But during the following 16 years, the country‘s GDP
growth rate has stabilized and stayed on a pretty good level of 4.75% in average.
-15
-10
-5
0
5
10
15
20
25
-10 -8 -6 -4 -2
WTO
/ S
AP
yea
r 2 4 6 8
10
12
14
16
Ghana (SAP take-off -1984)
Botswana (accessionyear - 1987)
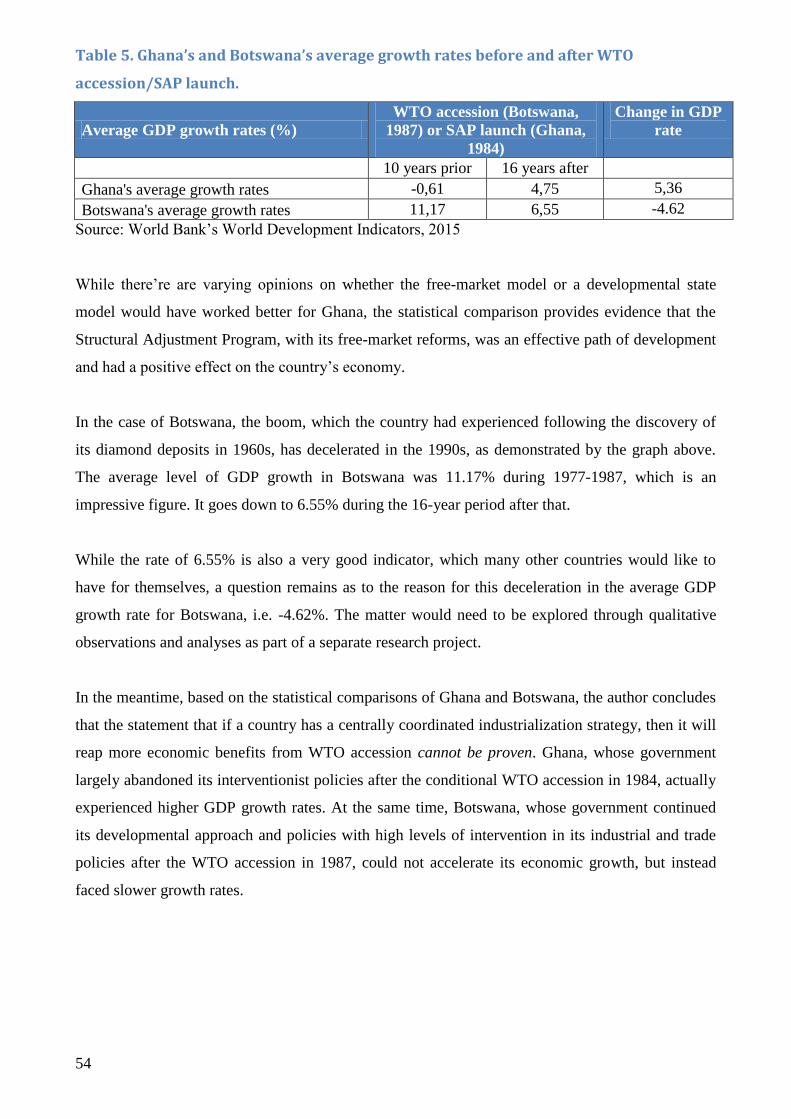
54
Table 5. Ghana’s and Botswana’s average growth rates before and after WTO
accession/SAP launch.
Average GDP growth rates (%)
WTO accession (Botswana,
1987) or SAP launch (Ghana,
1984)
Change in GDP
rate
10 years prior 16 years after
Ghana's average growth rates -0,61 4,75 5,36
Botswana's average growth rates 11,17 6,55 -4.62
Source: World Bank‘s World Development Indicators, 2015
While there‘re are varying opinions on whether the free-market model or a developmental state
model would have worked better for Ghana, the statistical comparison provides evidence that the
Structural Adjustment Program, with its free-market reforms, was an effective path of development
and had a positive effect on the country‘s economy.
In the case of Botswana, the boom, which the country had experienced following the discovery of
its diamond deposits in 1960s, has decelerated in the 1990s, as demonstrated by the graph above.
The average level of GDP growth in Botswana was 11.17% during 1977-1987, which is an
impressive figure. It goes down to 6.55% during the 16-year period after that.
While the rate of 6.55% is also a very good indicator, which many other countries would like to
have for themselves, a question remains as to the reason for this deceleration in the average GDP
growth rate for Botswana, i.e. -4.62%. The matter would need to be explored through qualitative
observations and analyses as part of a separate research project.
In the meantime, based on the statistical comparisons of Ghana and Botswana, the author concludes
that the statement that if a country has a centrally coordinated industrialization strategy, then it will
reap more economic benefits from WTO accession cannot be proven. Ghana, whose government
largely abandoned its interventionist policies after the conditional WTO accession in 1984, actually
experienced higher GDP growth rates. At the same time, Botswana, whose government continued
its developmental approach and policies with high levels of intervention in its industrial and trade
policies after the WTO accession in 1987, could not accelerate its economic growth, but instead
faced slower growth rates.

55
6.4.3. Testing Hypothesis 3
6.4.3.1. Statistical Comparative Analysis
To test the hypothesis which states that ‗the earlier a country accedes to WTO, the more economic
benefits it will gain from the accession‘, using the cases of Bahrain and Saudi Arabia, it is again
necessary to compare the statistical indicators of the two countries, i.e. the annual GDP growth rates
before and after the WTO accession (or GATT joining in the case of Bahrain). That will allow us to
see whether the change in the average annual GDP growth rates was positive or negative in the case
of each country and thus draw initial conclusions as to whether the hypothesis tests positively or
negatively.
Figure 13. Bahrain’s and Saudi Arabia’s annual GDP growth rates before and after WTO
accession.
Source: World Bank‘s World Development Indicators, 2015
According to Figure 13, the GDP trend changes more positively for Saudi Arabia after its accession
to the WTO. For Bahrain, the trend goes down sharply in the next year after its GATT accession
and then stays approximately at the level of 4-5%. To quantify these trends using specific numbers,
one needs to look at the exact averaged GDP growth rates for the two periods:
-6
-4
-2
0
2
4
6
8
10
12
14
Bahrain(accession year - 1993)
Saudi Arabia(accession year - 2005)

56
Table 6. Bahrain’s and Saudi Arabia’s average GDP growth rates before and after WTO
accession.
Average annual GDP growth rates WTO accession
Change
in GDP
rate
10 years prior 8 years
after
8 years
after
Bahrain's average growth rate 5,53 5,08 -0,45
Saudi Arabia's average growth rate 3,45 6,86 3,41
Source: World Bank‘s World Development Indicators, 2015
The average GDP growth rate for Bahrain, which acceded to GATT/WTO in 1993, has actually
slightly gone down from 5.53% prior to the accession to 5.08% during the eight years following the
GATT joining. This marks a negative trend of -0.45%. At the same time, the trend for Saudi Arabia,
which acceded later, i.e. in 2005, was much more positive. Its average GDP growth rate has
increased twofold from 3.45% during the decade before the WTO accession to 6.86% during the
period following the WTO accession, which is a significant increase of 3.41%.
This observation is not consistent with the third hypothesis, in fact, it goes against it, which leads to
a conclusion that the time, i.e. the earliness or lateness, of WTO accession probably does not play a
major role in an acceding country‘s ability to yield economic benefits from the accession. The
qualitative analysis of the results of the statistical exercise should help shed more light on the causal
mechanism between the lateness of accession and economic benefits, if any. Another possible
outcome of the further qualitative analysis is the identification of other intervening variables that
have a stronger influence on a country‘s ability to yield economic benefits from a WTO accession.
While, this kind of a thorough qualitative analysis would need to be a subject of a separate research
project, the author will attempt to briefly provide some explanatory factors related with yielding
benefits from earliness or lateness of acceding to the WTO.
6.4.3.2. Some Explanatory Factors
First of all, the earlier sections of the present thesis shed light on at least one qualification behind
the statistical outcomes in Figure 13 above. One hugely important intervening variable affecting the
case of Saudi Arabia is its increased mineral fuels exports during the 2000s (see Figure 10). This in
itself is a factor much stronger than any possible, likely fragmental, gains from the timing of a
country‘s WTO accession. That is why it becomes problematic to analyze Hypothesis 3 statistically,
or even qualitatively, using the example of Saudi Arabia. For that matter, it is very likely that any
country‘s case would have similar challenges, i.e. factors that would have greater influence on the

57
types of economic benefits a country can have compared to the timing of its WTO accession. This is
related with the vast number of different factors – economic, political, social – which affect gains or
losses in economic welfare of a country or community.
That is why in further qualitative studies of benefits or costs of the earliness or lateness of a
country‘s WTO accession, the issue of methodology and operationalization needs to be well thought
through. The statistical comparative analysis above was intentionally done using a rather simple
methodology just to launch the debate around late-joiners‘ economic losses, compared to the early-
joiners.
One way to possibly quantify gains/losses from the timing of WTO accession is assessing the
extended duration of WTO accession processes that ‗late-joiners‘ have to go through. It is widely
accepted that the lateness of WTO application influences not only the burdensome nature of the
accession process, but also the number of commitments the acceding country has to be undertake
(Evenett and Braga 2006; also see Chapter 2 above on WTO accession). All that might be
quantified at least through various administrative costs of the institutions and officials involved in
the accession process on behalf of the acceding country.
But judging by the outcome of the statistical comparison above there is not directly significant
economic effect of the timing of a WTO accession on the country‘s economy. Rather on the policy-
level the acceding governments‘ focus should be more on the core benefits or costs of the WTO
accession, i.e. those related with the opening up of export markets, attraction of more foreign
investments, increasing the domestic industry‘s competitiveness, etc.
Chapter 7. Research Results
In answering the research question ―Under which conditions is it economically beneficial for a
resource-exporting developing country to accede to the WTO?‖, the author worked with three
hypotheses. The results of the comparative statistical testing of the hypotheses are illustrated in
Table 7 below.
Thus, one out of three hypotheses tested positively. It would now be the right time for the
academic/peer community to review and critique the methodological and logical grounding of the
testing process. Perhaps, once comments are received on possible flaws of the present research, the

58
methodology could be further fine-tuned to conduct a new research around the same research
question.
In the meantime, the hypothesis can serve as a preliminary guidance for country which are
considering a WTO accession or are in the process of accession. These countries could factor in the
advantage of their early industrialization for their ability to reap greater economic benefits once
trade liberalization is launched as part of acceding to the WTO.
As for Hypotheses 2 and 3, they should not be totally abandoned only because they tested
negatively as part of the present research. The ideas proposed as part of these hypotheses can be
further explored, perhaps, through a more elaborate methodology. One possible way to improve the
methodology could be to identify a dependent variable that is in a more direct causal relationship
with the independent variables. This means, the quantifiability of that dependent variable may need
to be sacrificed, but this approach has its merits. The present research aimed at focusing on solely
economic benefits of acceding to the WTO and on quantifying those benefits.

Table 7: Causal relationships between independent variables and the dependent variable in three hypotheses
Hypothesis Independent
Variable Case A Case B
Dependent
variable (D) Result
1) ―The more
industrialized a country
is, the more economic
benefits it reaps from the
WTO accession‖
Level of
Industrialization
(X1)
Saudi Arabia: higher level
of industrialization causes
economic growth after
WTO accession through
greater value added in the
manufacturing sector (+)
Oman: lower level of
industrialization does
not cause economic
growth as much as
Case A (-)
Economic
benefits
(GDP and
Manufacturing
Value Added)
Hypothesis 1 tested positively,
but intervening variable of high
revenues from mineral fuels
exports in both countries
prevents revealing a clearer
statistical causation between
X1 and D.
2) ―If a country has a
centrally coordinated
industrialization strategy,
then it will reap more
economic benefits from
WTO accession.‖
Central
economic/
industrialization
strategy in place
Botswana: practice of
central economic
development planning by
the government does not
cause greater economic
growth after WTO
accession (-)
Ghana: absence of
central economic
development planning
by the government
correlated with greater
economic growth (+)
Greater
economic
growth
Hypothesis 2 did NOT test
positively.
3) ―The earlier a country
accedes to WTO, the
more economic benefits
it will gain from the
accession.‖
Earliness of
WTO accession
Saudi Arabia: Lateness in
joining the WTO does not
case fewer economic
benefits (-)
Bahrain: Earliness in
joining the WTO does
not cause greater
economic growth (+)
Greater
economic
growth
Hypothesis 3 did NOT test
positively.

Chapter 8. Conclusion
The present thesis analyzed three hypotheses which were developed around the research question of
―Under which conditions is it economically beneficial for a resource-exporting developing country to
accede to the WTO?‖ Three hypotheses were developed and analyzed, each representing one
condition which affects the level of economic benefits countries‘ can gain from WTO accession.
Specifically, the conditions were (1) the level of a country‘s industrialization, (2) central government
coordination of economic policies, and (3) the lateness of a country‘s accession to the WTO. Three
pairs of cases were selected for testing the three hypotheses, according to the most similar systems
design approach. The selected countries were from among developing, resource-rich countries to
more specifically answer the research question. The method of comparing statistical indicators for the
selected pairs of countries for the periods of approximately 10 years before and after their WTO
accession was selected. This helps trace the effect of the varying independent variables (the three
conditions listed above) on the dependent variable (economic benefits stemming from WTO
accession) in each of the hypotheses. The case of Turkmenistan, which has not yet applied for the
WTO, but considers acceding, has been identified as a country representing a class of countries
which could potentially benefit from the findings of the present research.
One of the three hypotheses, namely the first one on the level of a country‘s industrialization, tested
positively. This means that there is now stronger evidence for countries to implement the strategic
industrialization approach, in order to expand their manufacturing capabilities before they are faced
with the immediate need to liberalize their economies and trade policies as part of their WTO
accession commitments.
While this thesis researched the conditions (independent variables) that affect the efficacy of WTO
accession (essentially, the dependent variable) and the causal mechanisms, further research can
analyze in greater detail whether the independent variables can be influenced or not, particularly the
one that tested positively.
On a practical level, policy-makers and other stakeholders should aim at changing the current state of
the conditions that affect the WTO accession outcomes. So, further policy of the national government
and/or the industry can focus on working with those conditions. For example, the industrialization
strategy is something the central government and other stakeholders can work on and use to gain

61
more benefits from the accession to the WTO. The structure of a country‘s economy, including its
dependency on the exports of a specific commodity, can be changed, but would require a long period
of time, so the process needs to start as soon as possible, if it hasn‘t started already.
These very conclusions are very relevant and timely for Turkmenistan, as the country develops and
implements its industrialization strategy. Developing export-oriented industries would help gain
greater benefits from the opening up of export markets. The country should aim at reaching near-
maturity level in its industrialization, so that when the actual trade liberalization reforms are
introduced under the aegis of WTO accession, the static comparative advantage can move towards a
dynamic comparative advantage. This would increase the value added in the manufacturing sector of
the economy and contribute to greater economic growth.

62
References / Bibliography
Acemoglu, D., and J. A. Robinson. (1999). ‗On the Political Economy of Institutions and
Development.‘ American Economic Review 91 (4): 938–63.
African Economic Outlook: Ghana 2014, available at
http://www.africaneconomicoutlook.org/fileadmin/uploads/aeo/2014/PDF/CN_Long_EN/Ghana_EN
G.pdf, (last accessed 2 January 2015).
Asian Development Outlook 2014: Turkmenistan, available at
http://www.adb.org/countries/turkmenistan/main, (last accessed 5 January 2015).
Bell, M., Ross-Larson, B. & Westphal, L., (1984), ‗Assessing the Performance of Infant Industries‘,
JDE, 1984, nos. ½.
Benneh, Wilson (1998), ‗Structural Adjustment in Ghana: An Examination of the Effects of Policy
Reforms on the Structure and Performance of the Manufacturing Sector‘, Kwame Nkrumah
University of Science and Technology, Kumasi.
Capital Resources. Botswana Country Overview 2013/14, available at http://acap.com.au/wp-
content/uploads/2013/09/BOTSWANA-COUNTRY-AND-ECONOMIC-OVERVIEW-2013.pdf;
(last accessed 10 January 2015)
Bhagwati, Jagdish (2007), In Defense of Globalization. Oxford University Press.
Blackhurst, Richard (2000), "Reforming WTO Decision Making: Lessons from Singapore and
Seattle". Center for Research on Economic Development and Policy Reform (Working Paper No 63):
1–20.
Cattaneo, Olivier and Primo Braga, Carlos A. (2009), ―Everything You Always Wanted to Know
about WTO Accession (But Were Afraid to Ask)‖ Policy Research Working Paper 5116, The World
Bank.
Cattaneo, Olivier (2008), ―The political economy of free-trade agreements‖, in Simon Lester and
Bryan Mercurio (eds), Bilateral and Regional Trade Agreements, Commentary and Analysis,
Cambridge University Press.
63
Cimoli, Mario; Giovanni Dosi, and Joseph E. Stiglitz (eds.), Industrial Policy and development: The
Political Economy of Capabilities Accumulation (New York: Oxford University Press, 2009).
Dutt, Amitova K. (1988), Monopoly power and uneven development: Baran revisited, Journal of
Development Studies 24 (1988): 161-176.
EBRD Transition Report (2014), Turkmenistan, available at http://tr.ebrd.com/tr14/turkmenistan,
(last accessed 4 January 2015).
Eschenbach, Felix, and Bernard Hoekman (2006), ―Services Policies in Transition Economies: on
the EU and the WTO as Commitment Mechanisms‖, World Trade Review, vol. 5, n°3, pp. 415-43.
Evenett, Simon J. (2006), Competition Advocacy: Time for Rethink?. Northwestern Journal of
International Law and Business, 26(3), 495-514.
Evenett, Simon J. (2006), A Summary Report of the Discussion on Improving the Accession Process
in the 21st Century, Session organized by the International Development Center (IDRC), Canada,
WTO Public Forum.
Evenett, Simon J., and Carlos A. Primo Braga. (2006), ―WTO accession: moving the goalposts?‖, in
Richard Newfarmer (ed.), Trade, Doha, and Development: a Window into the Issues, World Bank,
pp. 231-45.
Friedman, Thomas (2005), The World is Flat: Further Updated and Expanded (Release 3.0) (2nd
revised and expanded ed.). Farrar, Straus and Giroux. 2007.
GhanaWeb, Economic History Highlights, available at
http://www.ghanaweb.com/GhanaHomePage/history/timeline.php, (last accessed 20 January 2015).
Gallagher, Peter; Low, Patrick and Stoler, Andrew L. (eds), (2000), Managing the Challenges of
WTO Participation, 45 Case Studies, Cambridge University Press and WTO.
Gerschenkron, Alexander. (1962), ‗Economic Backwardness in Historical Perspective‘, (Frederick A.
Praeger Publishers, 1962).
64
Heckscher, Eli. (1949), ‗The Effect of Foreign Trade on the Distribution of Income,‘ in Ellis and
Metzler, eds., Readings in the Theory of International Trade, Philadelphia: Blakiston.
Humphreys, Macartan; Sachs, Jeffrey and Stiglitz, Joseph (2007), ‗Escaping the Resource Curse‘.
New York: Columbia University Press, 2007.
International Trade Centre (2015), Trade Map Database, available at www.trademap.org, (last
accessed 5 January 2015)
Khor, M. (2000), ‗Rethinking Liberalization and Reforming The WTO‘. Third World Network,
available at http://www.twn.my/title/davos2-cn.htm, (Last accessed October 2014).
Khor, M. (2001) Rethinking Globalization: Critical Issues and Policy Choices. London: Zed Books.
Krugman, Paul (1981), Trade, accumulation and uneven development, Journal of Development
Economics 8 (1981): 149-161.
Kwa, Aileen, ‗WTO and Developing countries‘, available at http://www.saylor.org/site/wp-
content/uploads/2013/04/ECON307-2.3-WTOandDevelopingCountries.pdf (last accessed 10
December 2014).
Lewin, Michael (2011), ―Chapter 4: Botswana‘s Success: Good Governance, Good Policies, and
Good Luck‖, in Chuhan-Pole, Punam and Angwafo, Manka, ―Yes, Africa Can: Success Stories from
a Dynamic Continent‖, World Bank, Washington, D. C.
Nurkse, R. (1953), Problems of Capital Formation in Underdeveloped Countries; Oxford: Basil
Blackwell.
Ohlin, Bertil (1933), ‗Interregional and International Trade‘ Cambridge, Mass.: Harvard University
Press.
Pack, H. & Westphal, L., (1986), ‗Industrial Strategy and Technological Change: Theory and
Reality‘, JDE, 1986
Raghavan, Chakravarthi (2000), ‗UNCTAD Plan of Action Provides Critique of WTO Agreements‘,
23 February 2000, available at www.twn.my/title/plan.htm, (last accessed 3 January 2015)

65
Ricardo, D., (1817), On the Principles of Political Economy and Taxation. Retrieved from the
Library of Economics and Liberty in October 2014.
Rodrik, D., ‗Closing the Productivity Gap: Does Trade Liberalisation Really Help? in G. Helleiner
(ed.), Trade Policy, Industrialisation, and Development, Oxford, England: Clarendon Press, 1991.
Rose, Andrew K. (2004), ―Do we really know that the WTO increases trade?‖, The American
Economic Review, Volume 94, Number 1, pp. 98-114.
Rosenstein-Rodan, P. N. (1943), Problems of industrialisation of Eastern and South-Eastern Europe,
Economic Journal, 53, pp. 202–211.
Rosenstein-Rodan, P. N. (1961), Notes on the theory of the ‗big push‘, in: H. S. Ellis & H. C.
Wallich (Eds) Economic Development for Latin America (London: Macmillan).
Rosser, Andrew (2006), ‗Escaping the Resource Curse‘, in New Political Economy 11 (4): 557-70;
2006.
Ross, Michael (1999) ―The Political Economy of the Resource Curse‖, in World Politics 51 (2): 297-
322, 1999.
Shafaeddin, S.M. (2005), ―Trade Liberalization and Economic Reform in Developing Countries:
Structural Change or De-Industrialization?‖, in UNCTAD Discussion Paper No.179, April 2005.
Smith, Adam (1776). ‗An Inquiry into the Nature and Causes of the Wealth of Nations‘ 1 (1 ed.).
London: W. Strahan. Retrieved October 2014, volume 2 via Google Books.
Streeten, Paul (1973), ―Trade strategies for development: some themes for the seventies‖, World
Development, 1973, vol. 1, issue 6, pages 1-10.
Todaro, M, and Smith S (2011), Economic Development (11th ed); Addison-Wesley, London.
Tsogtbaatar, Damedin (2005), ―Mongolia‘s WTO accession: Expectations and realities of WTO
membership‖, in Peter Gallagher, Patrick Low, and Andrew L. Stoler (eds), Managing the

66
Challenges of WTO Participation, 45 Case Studies, Cambridge University Press and WTO, pp.409-
20.
The Heritage Foundation, www.heritage.org
Transformation Index BTI, www.bti-project.org
Turkmen State Statistics Committee website, www.stat.gov.tm
Westphal, L., (1982), ‗Fostering Technological Mastery by means of Selective Infant-industry
Protection‘ in M. Syrquin & S. Tieitel (eds.), Trade, Stability, and Equity in Latin America
World Bank website (2014), World Development Indicators, available at
http://data.worldbank.org/indicator, (last accessed 11 January 2015)
WTO (2011): Trade Policy Review Report by The Kingdom of Saudi Arabia.
WTO website (2015a), ‗What is the WTO?‘, available at
http://www.wto.org/english/thewto_e/whatis_e/whatis_e.htm (last accessed through 16 Dec 2014)
WTO website (2015b), http://www.wto.org/english/thewto_e/whatis_e/tif_e/fact3_e.htm; (accessed 4
January 2015)
WTO website (2015c), available at ttp://www.wto.org/english/thewto_e/whatis_e/tif_e/org6_e.htm
UNIDO website, http://www.unido.org/data1/Statistics/Research/cip.html, (last accessed 17 January
2015).
UN Comtrade database, http://comtrade.un.org/, (last accessed 20 January 2015).
Zahid, Khan (2005), The Impact of WTO on Saudi Arabia, 19 September 2005, The Arab
News.website, available at http://www.arabnews.com/node/273257 (last accessed 25 Dec 2014).