Embed Size (px)
Citation preview

Measuring Material Deprivation with EU-SILC: Lessons from the
Irish Survey
Christopher T. Whelan and Bertrand Maitre
Economic and Social Research Institute,
4 Burlington Road
Dublin 4
Ireland
Tel: +353 1 667 1525
Fax: +353 1 668 6231
Email: [email protected]

2
Abstract In this paper we consider the consequences for measurement of material deprivation,
consistent poverty and economic vulnerability of the shift from the ECHP data set to
the EU-SILC instrument. Despite the restricted number of deprivation items available
in EU-SILC, we show that there is a substantial overlap between such measures when
they are estimated using EU-wide and Irish specific indicators. By placing the EU-
wide measures in the context of the full range of Irish indicators, we demonstrate that
they allow us to identify clusters of individuals sharply differentiated in terms of their
multidimensional deprivation profiles. They also provide an understanding of the
socio-economic factors associated with such differentiation that departs in only
modest respects from that derived from the more comprehensive set of Irish specific
indicators.
Key words: income poverty, material deprivation, multidimensionality, consistent poverty, economic strain, economic stress.

Introduction During the period 1994-2001 the European Community Household Panel (ECHP) was
the primary source for the analysis of poverty and social exclusion in the European
Union. The range of data available in the ECHP meant that it was possible to go
beyond documenting income poverty levels and adopt a multidimensional perspective
on social exclusion. In particular, the availability of detailed information relating to
material deprivation encouraged a range of work exploring the relationship between
income poverty and deprivation, measurement of economic vulnerability and
multidimensional deprivation 1
With the termination of the ECHP the European Union Statistics on Income and
Living Conditions (EU-SILC) instrument is potentially the primary source for such
analysis. It is from this source that the common statistical indicators endorsed by the
Laeken Council in 2001, and later refined by the Social Protection Committee to serve
as an essential element in the Open Method of Coordination will be drawn. EU-SILC
is organised under a Framework Regulation of the European Parliament and the
Council. However, it was launched in 2003 on the basis of a 'gentleman’s agreement'
in six Member States as well as in Norway. The starting date for the EU-15 (with the
exception of Germany, Netherlands and the UK who had derogations until 2005) as
well as for Estonia, Norway and Iceland was 2004. The remaining New Member
states started in 2005. The first set of micro data and cross-sectional indicators from
1 See Muffels and Fouarge (2004), Whelan et al (2001, 2004), Tsakloglou and
Papadopoulous (2002)

2
EU-SILC covering all EU25 Member States is due in December 2006.2 In the
transition period Eurostat has launched a collection of indicators derived from
national sources including the data collected by the six countries at the forefront of
EU-SILC data collection. 3
EU-SILC differs from ECHP in a number of important respects. Of particular interest
for our present purposes is the fact that the range of life-style deprivation indicators
available in the former is substantially more restricted. Thus, the question arises as to
what extent it will be possible to emulate the range of research conducted in relation
to such outcomes with EU-SILC data. Material deprivation can be defined as
involving the enforced lack of of items depicting relating to living conditions, such as
ability to afford basic requirements, possession of consumer durables, housing
conditions etc.4 As part of a growing emphasis on the multidimensionality of poverty
and social exclusion, the value of such deprivation indicators has increasingly been
recognized. The Eurostat (2005b: 2) report constitutes the first published effort
employing EU-SILC data to address such issues. That paper notes that the
development and use of material deprivation indicators is currently being discussed by
the Social Protection Committee with a view to refining and consolidating the original
list of the Laeken common indicators relating to poverty and social exclusion. In
anticipation of the availability of the harmonized micro data set for the 25 Member
States collected under the EU-SILC instrument, Eurostat (2005b) investigated the
construction of material indicators using both ECHP and EU-SILC data sources but
focusing solely on the items available in both sources. The subsequent analysis is
based on ten items that are found to form three clusters that are labeled as “economic
2 See Eurostat (2005a) for a more detailed discussion 3 See Eurostat (2005 a & b). 4 See Nolan and Whelan (1996) and Eurostat (2005:2).

3
strain”, “durables” and “housing”, although for much of the analysis the first two
clusters are merged. Using these measures Eurostat (2005b) presents a range of
interesting results relating to deprivation levels and consistent poverty with the latter
being defined as incorporating enforced material deprivation and low income.
A major concern relating to the Eurostat analysis relates to the fact that the number of
items involved is extremely small. This is reflected in the fact that, using the first
complete wave of the Irish data collected in 2004, the Cronbach’s alpha reliability
level for the four item economic strain index is 0.57 while that for the seven item
index combining economic strain and consumer durables is 0.65. These values are the
low side for indices that are intended to play a central role in the analysis of material
deprivation and consistent poverty. In this paper we take advantage of the fact that the
Irish component of EU-SILC contains a much broader range of material deprivation
indicators than the set that is common to the EU25,
In the Irish case the 2004 wave of the EU-SILC survey has been used to construct
indices of consistent poverty and what we refer to as ‘economic vulnerability’ by
selecting their constituent indicators, from a broad range of potential items, on a
theoretically informed basis and in the light of the findings from previous research. It
has also been possible to undertake a process of construct validation involving the use
of both deprivation indicators not forming part of these indices and a number of
measures of subjective economic pressures that we have deliberately excluded.5 The
Irish measures can provide a context in which we can evaluate measures based on the
indicators available on an EU wide basis.
5 See Whelan et al (2006), Whelan and Maître (2006).

4
The strategy we pursue is similar to that employed by McKay and Collard (2003) in
developing deprivation indicators for the UK Family Resources Survey; in that we
seek to demonstrate that it is not necessary to have a large suite of questions if a
smaller set exhibit comparable discriminatory power. On the same basis, it may be
possible to incorporate items in our indices, such as reports of experience of economic
pressures, that otherwise we might reject on the basis that they are more appropriately
used as reference points against which we should validate our measures.
In the analysis that follows we will make use of 46 indicators that are available in the
Irish component of EU-SILC and a sub-set of 21 items that are available cross-
nationally.6 Using the latter, we shall proceed to examine the dimensionality of
deprivation and levels of ‘consistent poverty’ and ‘economic vulnerability’. At each
stage we will consider how our conclusions compare to those arising from analysis
based on the more comprehensive set of Irish items.
In nesting our analysis of the set of common EU-SILC items in the context of a
parallel set of analyses based on the more comprehensive set of Irish indicators, we
distinguish two different aspects of measurement: identifying the poor/counting the
number poor versus capturing what it means to be poor. We shall seek to illustrate
that a restricted set of indicators may be sufficient to identify those who experience
more broadly based deprivation. The degree of multidimensionality required in
identifying the poor/excluded is an empirical matter. It is not something one can
6 We do not make use of the item relating to enforced absence of a colour television because as is clear form Eurostat (2005b) within the EU15 hardly anyone reports deprivation in relation to this item. We also exclude the item related to being able to save because of difficulties involved in interpreting it.

5
simply read off from the multidimensional nature of the concepts themselves.7 By
placing analyses based on the more restricted group of items in the context of findings
arising from the broader set, we can test the extent to which indices based on the
former succeed in capturing more widespread patterns of differentiation.
Data and Measures In Ireland the information required under this EU-SILC framework is being obtained
via a new survey to be conducted by the Central Statistics Office (CSO) each year.
The first full wave of the survey was conducted in 2004 (CSO 2005). The EU-SILC
survey is a voluntary survey of private households. In 2004 the total completed
sample size was 5,477 households and 14,272 individuals. A two-stage sample design
with eight population density stratum groups with random selection of sample and
substitute households within blocks and the application of appropriate weight was
employed (CSO, 2005).
The core aim of EU-SILC is to provide a basis for monitoring living standards,
poverty and social exclusion. Income is defined as equivalised household disposable
income with the equivalence scale employed attributing a weight of 1 to the first
adult, 0.66 to each subsequent adult (aged 14+ living in the household) and 0.33 to
each child aged less than 14. The at-risk-of poverty-rate is the share of persons with
an equivalised income below a given percentage of the national median income. The
set of deprivation questions posed covered a wide spectrum of items ranging from
possession of consumer durables, quality of housing and neighbourhood environment
to health status. Our analysis makes use of forty-two such indicators.
7 For further discussion of these issues see Nolan and Whelan (2005)

6
For the first set of items relating to relatively basic items such as food, clothes, heat
and furniture respondents were asked if (1) the household possessed/availed the items
(2) did not possess/avail of because they could not afford it or (3) did not
possess/avail for other reason. A similar format was employed in relation to a range of
consumer items such as a video, a stereo etc. A further set of 4 items concerned the
absence of basic housing facilities. of these items, we assume that their absence is due
to inability to afford them. An additional set of 5 items related to the quality of the
dwelling and the neighbourhood environment and focused on problems relating to
damp, light, noise, pollution or crime.
The questions described to this point concern households and household members.
The final set of item we consider were addressed to individuals. The items related to,
going without heating during the last 12 months through lack of money, having a
morning, afternoon or evening out in the last fortnight for entertainment, a car.
An additional set of items relate to the health of the household reference person. We
have extended our notion of material deprivation to incorporate health indicators
because of the large body of evidence showing the relationship of more narrowly
conceived deprivation to such outcomes. This contrasts with the much weaker
associations observed in the case of factors such as social isolation that are often
included under the notion of social exclusion.8 The specific questions were as follows:
8 See Davey Smith et al (1994) and Gallie et al (2003).

7
• Evaluation of general health. Five response options were offered. We considered
respondents as having health problems when they answered from “fair” to “very
bad”.
• If they suffered from any chronic illness or condition. A simple “yes” or “no” was
offered to the respondents.
• If they have been limited in usual activities for at least the last 6 months because
of a health problem. Three options were offered and those answering “yes very
limited” and “limited” are considered as well as having health problems.
The final set of questions focused on a range of subjective economic pressures.
• The first identifies households that are incapable of coping with unanticipated
expenses.
• The second relates to households incurring debts in relation to routine
expenses.
• The third deals with arrears arising from mortgage, rent, hire purchase
payments etc.
• The final item focuses on those households experiencing difficulty or great
difficulty in making ends meet.
We will therefore make us of a total of forty-six indicators comprising the forty-two
deprivation indicators and the four items relating to subjective economic pressures.
Our analysis refers to all persons in the EU-SILC Irish survey. Household
characteristics have been allocated to each individual. Where more than one person
answered a question, the response of the household reference person (HRP) has been
allocated to each individual in the household. The HRP is the one responsible for the
8
household accommodation. Where this responsibility was shared the oldest person
was chosen.
In Table 1 we set out details of the full range of indicators, distinguishing those that
the Irish CSO is required to provide to Eurostat as part of the common EU-SILC data-
set from those that are specific to the Irish data set.

9
Table 1: List of Common EU and Specific National Deprivation Indicators
Deprivation Indicators Common EU Set of Indicators: Provide in All EU Member States
Additional Indicators Collected in Ireland
Cold – going without heating during a 12 month period through lack of money X Inability to afford: Social Life – Not having a morning, afternoon or evening out once a fortnight X - Two pairs of strong shoes X - A roast joint (or its equivalent) once a week X - A meal with meat, chicken, fish (or vegetarian equivalent) every second day X - New rather than second-hand clothes X - A warm waterproof coat X - Keeping the home adequately warm X - Replacing worn out furniture X - Having family or friends for a drink or meal once a month X - Buying presents for family or friends at least once a year X
Inability to afford: - Paying for a week’s annual holiday away from home X Enforced lack of: - Fixed line telephone X - Computer X - Satellite Dish X - Video Recorder X - Stereo X - CD Player X - Camcorder X - Clothes Dryer X - Dish washer X - Vacuum Cleaner X - Fridge with separate freezer section X - Deep Freeze X - Microwave X - Deep fat fryer X - Liquidiser X - Food processor X Private Car X - Washing Machine X
Bath or shower X Toilet (internal) X Central Heating X Piped Hot water X
Problems with Accommodation and the Environment: - Leaking roof, damp walls/ceilings/floors/foundations, rot in the doors window frames or the floor
X
- Too dark or don’t have enough light X - Pollution grime or other environmental problems caused by traffic or industry X - Crime or vandalism in the area X - Noise from neighbours or outside X
-Assessment of Health X
-Chronic Illness X
-Mobility restriction X
Subjective Economic Pressures - Coping with unanticipated expenses X Arrears relating to mortgage, rent or hire purchase X Debt to meet ordinary living expenses such as food, Christmas or back-to-school expenses?
X
Degree of difficulty in making ends meet X
10
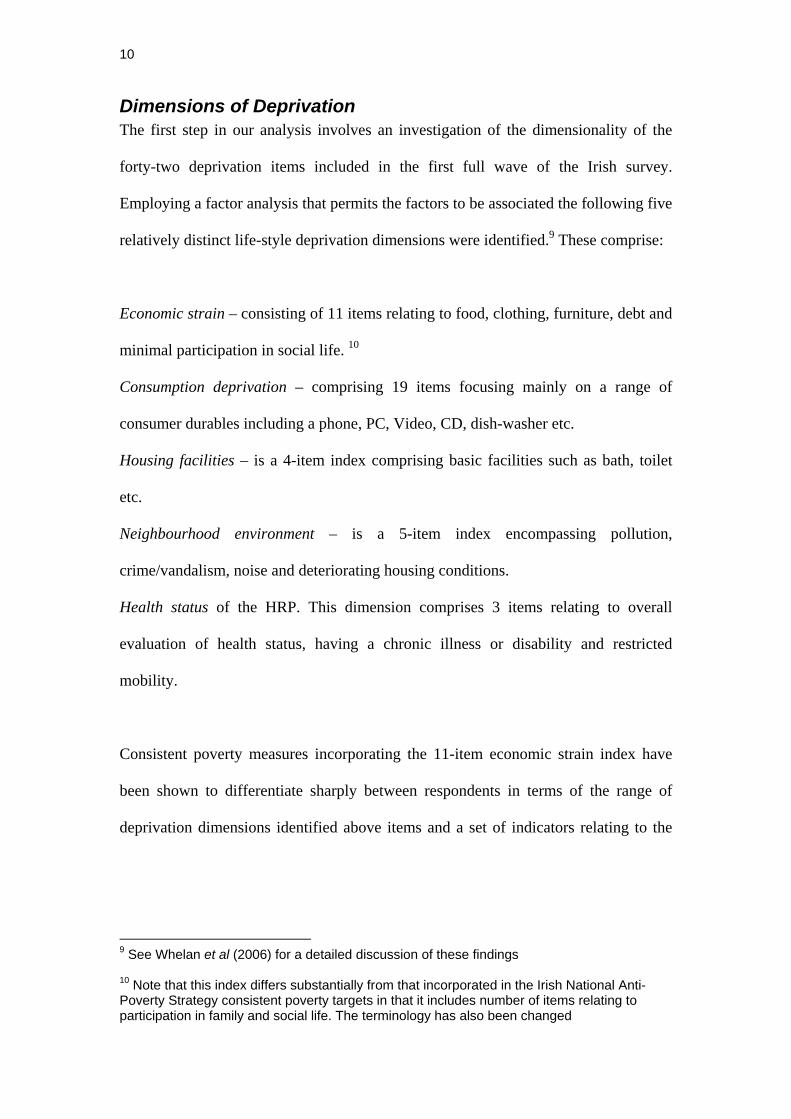
Dimensions of Deprivation The first step in our analysis involves an investigation of the dimensionality of the
forty-two deprivation items included in the first full wave of the Irish survey.
Employing a factor analysis that permits the factors to be associated the following five
relatively distinct life-style deprivation dimensions were identified.9 These comprise:
Economic strain – consisting of 11 items relating to food, clothing, furniture, debt and
minimal participation in social life. 10
Consumption deprivation – comprising 19 items focusing mainly on a range of
consumer durables including a phone, PC, Video, CD, dish-washer etc.
Housing facilities – is a 4-item index comprising basic facilities such as bath, toilet
etc.
Neighbourhood environment – is a 5-item index encompassing pollution,
crime/vandalism, noise and deteriorating housing conditions.
Health status of the HRP. This dimension comprises 3 items relating to overall
evaluation of health status, having a chronic illness or disability and restricted
mobility.
Consistent poverty measures incorporating the 11-item economic strain index have
been shown to differentiate sharply between respondents in terms of the range of
deprivation dimensions identified above items and a set of indicators relating to the
9 See Whelan et al (2006) for a detailed discussion of these findings
10 Note that this index differs substantially from that incorporated in the Irish National Anti-Poverty Strategy consistent poverty targets in that it includes number of items relating to participation in family and social life. The terminology has also been changed

11
subjective experience of economic pressures. The index is thus confirmed to be a
highly reliable and valid measure of such poverty.11
In conducting a comparable analysis for a set of items that will be available in the
harmonized EU-SILC data set our options are a good deal more restricted. We finally
settled on a set of 20 items and conducted a factor analysis based on this set. The
available indicators include a good deal fewer items relating to consumer deprivation
and somewhat fewer dealing with economic strain, than in Irish case. In light of this,
we include three items relating to subjective economic pressures in the EU-SILC
common economic strain index in the expectation that they might serve as proxies for
such strain. Given the range of items available, it seemed unlikely that we will be able
to establish empirically the distinction between the economic strain and consumption
deprivation dimensions. As the factor analysis results set out in Table 2 reveal, this
turns out to be the case. Four distinct dimensions emerge. The first, to which we will
apply the label ‘economic strain’, involves a mixture of items that in the Irish analysis
were divided between the economic strain and consumption deprivation dimensions,
together with the three subjective economic pressures indicators. Items falling into the
first category include being unable able to afford a meal with meat, fish or chicken
and keeping the household adequately warm. The second category comprises the
enforced absence of a car, a telephone, a PC and a holiday away from home once a
year. The subjective pressure items include being unable to cope with unanticipated
expenses, debt problems arising from ordinary living expenses, and arrears relating to
mortgage, rent or hire purchase payments. The neighbourhood environment
dimension and health status dimensions are identical to those identified in the Irish
11 See Maître et al (2006)

12
case. The housing dimension is slightly different it that it comprises three rather than
four items and includes the item relating to a washing machine.
Table 2. Factor Analysis Oblique Rotation Solution for EU-SILC Common Deprivation Items Deprivation Dimensions
Economic Strain Housing Facilities
Neighbourhood Environment
Health
Meals with meat, fish or chicken .537 Household Adequately Warm .525
Car .545 Telephone .572
PC .626 Holiday away from home .660 Inability to cope with unexpected expenses
.681
Debt problems arising from ordinary expenses
.582
Arrears relating to mortgage, rent or hire purchase
.619
Bath or Shower Hot water .836 Washing Machine .850
.360 Pollution .721 Crime, Violence, Vandalism .683 Noise .728 Leaking roof & Damp .396 Rooms too Dark .405
Assessment of Health 0.842 Chronic Illness 0.869 Mobility restriction 0.889
For our present purposes, it is the nine-item economic strain index that is crucial.
From Table 2 we see that the items load on this factor in a relatively homogeneous
manner with all nine values located in the range running from 0.50 to 0.68.12 As
shown in Table 3, the 9-item index has a highly satisfactory alpha coefficient of 0.79
that is slightly lower than for the corresponding 11-item Irish index , which has a
value of 0.86 However, omitting the three subjective economic pressure items would
reduce this value to 0.68. The health and neighbourhood environment dimensions,
12 Since weighting by level of deprivation has no significant effect on our results we operate with unweigthed indices

13
which are common to both sets of analyses, have reliability coefficients of 0.82 and
0.58 respectively. The 3-item housing index from the deriving the common EU
analysis has an alpha value of 0.56, which is almost identical to that for the
corresponding Irish specific index. The values for the housing and neighbourhood
indices are lower than we would like but that it is not surprising given the small
number of items involved.
Table 3: Reliability Levels for Deprivation Dimensions
ECHP Common Dimensions Economic Strain – 9 Item Scale 0.787 Economic Strain – 6 Item Scale
0.677
Housing – 3 Item scale 0.560 Neighbourhood Environment – 5- scale 0.578 Health – 3 Item Scale 0.818
Irish Specific Dimensions Economic Strain – 11-Item Scale 0.855 Consumption Deprivation – 18-item scale 0.878 Housing – 4 -tem scale 0.576
The main difference arising from the separate analyses is that employing the full set
of Irish items we can make a clear distinction between deprivation relating to rather
basic items such as food, clothing, heat and social participation, which load on the
economic strain dimension, and deprivation relating to consumer durables. The
crucial question that remains is the extent to which the 9-item EU common index and
the 11-item Irish specific indices of economic strain are measuring similar or different
dimensions.
Comparing EU Common and Irish Specific Measure of Consistent Poverty
A definition of poverty in terms of exclusion from the life of one’s society
because of a lack of resources has been enshrined in the Irish National Anti-Poverty

14
Strategy. In monitoring the evolution of poverty in Ireland over recent years extensive
use has been made not only of household income but also of non-monetary indicators
of deprivation, in order to obtain a more comprehensive picture of household living
standards and command over resources. This approach is consistent with a trend
towards increased emphasis on direct measurement of deprivation.13 Particular
attention has been paid to those both falling below relative income thresholds and
reporting basic deprivation of the kind captured by the Irish specific 11-item
economic strain index. Those fulfilling both conditions are identified as experiencing
generalised deprivation due to lack of resources. 14
In order to implement the consistent poverty approach, it is necessary to
choose a threshold for the economic strain index. A series of analyses by Maître et al
(2006) indicated that the most appropriate cut off point for the 11-item Irish specific
index was 2+ items. In order to facilitate comparison between the two indices we
choose a cut off point off 3+ for the 9-item EU-SILC common index that produces
consistent poverty rates as close as possible to those produced by the 11-item Irish
specific index. The income threshold is set at 70% of household disposable equivalent
income. From Table 4 we see that this approach produces a consistent poverty rate of
9.6% for the Irish specific measure and 9.1% for the EU common measure.
13 Recent examples relating to Britain, New Zealand and the USA include McKay and Collard (2004), Perry (2002) and Short (2005) while Fõrster (2005) provides an example of a comparative European analysis. 14 See Callan et al (1993), Nolan and Whelan, (1996) for early examples of this method and Maître et al (2006) for a revised approach using EU-SILC data.
15
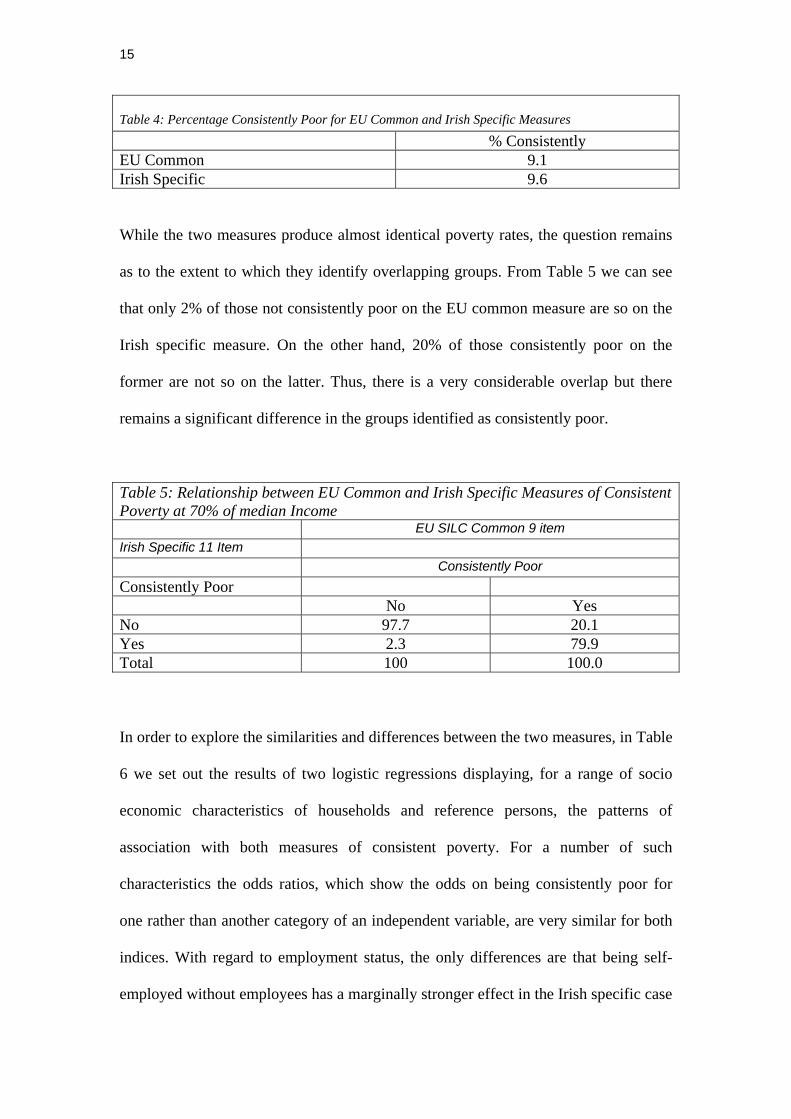
Table 4: Percentage Consistently Poor for EU Common and Irish Specific Measures
% Consistently EU Common 9.1 Irish Specific 9.6 While the two measures produce almost identical poverty rates, the question remains
as to the extent to which they identify overlapping groups. From Table 5 we can see
that only 2% of those not consistently poor on the EU common measure are so on the
Irish specific measure. On the other hand, 20% of those consistently poor on the
former are not so on the latter. Thus, there is a very considerable overlap but there
remains a significant difference in the groups identified as consistently poor.
Table 5: Relationship between EU Common and Irish Specific Measures of Consistent Poverty at 70% of median Income EU SILC Common 9 item Irish Specific 11 Item Consistently Poor Consistently Poor No Yes No 97.7 20.1 Yes 2.3 79.9 Total 100 100.0 In order to explore the similarities and differences between the two measures, in Table
6 we set out the results of two logistic regressions displaying, for a range of socio
economic characteristics of households and reference persons, the patterns of
association with both measures of consistent poverty. For a number of such
characteristics the odds ratios, which show the odds on being consistently poor for
one rather than another category of an independent variable, are very similar for both
indices. With regard to employment status, the only differences are that being self-
employed without employees has a marginally stronger effect in the Irish specific case

16
while being a farmer, unemployed or an employee who has experienced
unemployment in the past twelve months have slightly greater impact for the EU
common measure. However, overall the similarities are a great deal more striking than
the differences. Thus, for illness and disability the odds ratio in both cases is close to
9:1, for being in education 10:1 and for home duties 5:1. The similarities extend to the
impact of urban location. In both cases the odds ratio for primary education is 4:1 and
for separation/divorce is close to 3:1. Lone parenthood and having more than two
children have a marginally greater impact on the EU common measure.
Two factors distinguish the measures. The first is that being consistently poor on the
EU common index is much more strongly associated with being in the younger age
groups than is the case for the Irish specific measure. Thus, in the comparison
involving those in households where the reference person is aged thirty or less
compared to those where s/he is aged 65+ the odds ratio is 4:1 for the EU common
measure compared to 1.5:1 for the Irish specific measure. The results for the
comparison involving those aged 30-49 are almost identical. For those aged 50-64 the
respective odds ratios are 2.3:1 and 1.2:1. The other major differentiating factor is
household tenure. Being a private tenant has a marginally stronger association with
the EU common measure. However, it is public sector tenancy that is the crucial
differentiating factor. In reference to home owners the odds ratio for residents in such
households is 6:1 for the EU common measure compared to less than 4:1 in the Irish
specific case.

17
Table 6 : Logistic Regressions of EU-SILC Common and Irish Specific Consistent Poverty Household Socio-Economic Characteristics EU Common Irish Specific Exp (B) Sig. Exp (B) Sig. Employment Status Self-employed with employees 0.394 * 0.353 n.s. Self-employed without employees 1.325 ** 2.188 *** Farmer 0.520 * 0.868 n.s Employee – unemployed in previous 12 months
4.138 *** 2.137 ***
Ill/Disabled 8.613 *** 8.523 Unemployed 8.941 *** 7.453 *** In Education 9.527 *** 10.159 *** Home-Duties 5.064 *** 4.830 *** Retired 2.415 *** 1.923 *** Marital Status Single 1.638 *** 1.761 *** Widowed 1.005 n.s. 0.834 n.s. Separate/Divorced 2.809 *** 3.045 *** Number of Children > 2 1.258 * 1.165 n.s Lone Parent 2.217 * 1.568 *** Age Group Under30 4.189 *** 1.533 * 30-49 4.008 *** 1.678 *** 50-64 2.256 *** 1.159 n.s Education Primary 4.174 *** 4.075 *** Lower Secondary 2.337 *** 2.680 ***
Urban Location 0,802 n.s. 0.716 **. Tenure Private Tenant 1.748 *** 1.578 *** Local Authority Tenant 6.095 *** 3.893 *** Nagelkerke R2 0.421 0.344 Chi Squared 2.981.7 2,417.2 Degrees of Freedom 22 22 *** P< .001, ** P< .01 P < .1

18
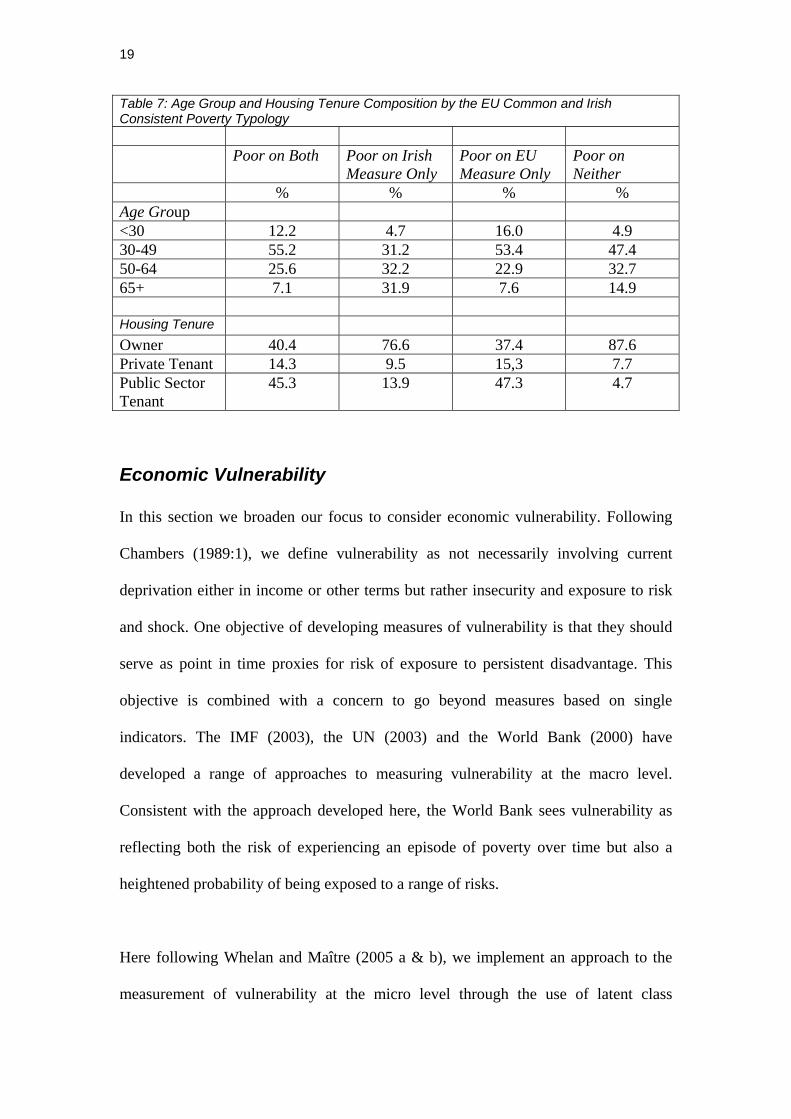
In order to bring out the consequences of these differences for the composition of the
consistently poor groups, we construct a typology based on cross classifying the two
consistent poverty measures. In Table 7 we break down age groups and housing
tenure composition by this typology. Focusing on age f, we see that 67% of those who
are poor on both measures are in households where the household reference is aged
less than fifty, 12% are under thirty and 7% are aged sixty-five or over. The
distribution for those poor on the EU common measures is very similar. However, the
picture is quite different for those poor on the Irish specific measure only with 32%
being aged sixty-five or over and only 5% being aged thirty or under. In relation to
housing tenure, we see that almost 40% of those poor on both measures are home
owners, 14% are private sector tenants and 45% are public sector tenants. This
distribution is again almost exactly mirrored for those poor on the EU common
measure only. For those poor on the Irish specific measure only the situation is quite
different with 77% of this group being homeowners and only 14% being public sector
tenants. Finally, almost 90% of those poor on neither measure are home owners. The
Irish specific measure captures older home owning respondents who are not picked up
by the EU general measure. 15
15 A multinomial regression involving these categories available from the authors confirms these findings.
19
Table 7: Age Group and Housing Tenure Composition by the EU Common and Irish Consistent Poverty Typology Poor on Both Poor on Irish
Measure Only Poor on EU Measure Only
Poor on Neither
% % % % Age Group <30 12.2 4.7 16.0 4.9 30-49 55.2 31.2 53.4 47.4 50-64 25.6 32.2 22.9 32.7 65+ 7.1 31.9 7.6 14.9 Housing Tenure Owner 40.4 76.6 37.4 87.6 Private Tenant 14.3 9.5 15,3 7.7 Public Sector Tenant
45.3 13.9 47.3 4.7
Economic Vulnerability In this section we broaden our focus to consider economic vulnerability. Following
Chambers (1989:1), we define vulnerability as not necessarily involving current
deprivation either in income or other terms but rather insecurity and exposure to risk
and shock. One objective of developing measures of vulnerability is that they should
serve as point in time proxies for risk of exposure to persistent disadvantage. This
objective is combined with a concern to go beyond measures based on single
indicators. The IMF (2003), the UN (2003) and the World Bank (2000) have
developed a range of approaches to measuring vulnerability at the macro level.
Consistent with the approach developed here, the World Bank sees vulnerability as
reflecting both the risk of experiencing an episode of poverty over time but also a
heightened probability of being exposed to a range of risks.
Here following Whelan and Maître (2005 a & b), we implement an approach to the
measurement of vulnerability at the micro level through the use of latent class
20
analysis. The basic idea underlying such analysis is the associations between a set of
categorical variables, regarded as indicators of an unobserved typology, are accounted
for by membership of a small number of underlying latent classes.16
Our focus initially is on three indicators - household income, economic strain and
reporting that one’s household experiences difficulty in making ends meet. In order to
provide us with sufficient degrees of freedom our income poverty variable has four
categories distinguishing between those below 50% median income, between 50-60%,
between 60% to 70% and above 70%. Our analysis is thus based on the distribution of
frequencies in a 4x2x2 table. For income we report the conditional probabilities of
being below each of the three median income lines and for economic strain the risk of
an enforced lack of three or more items on the 9-item EU common index. The
economic stress variable distinguishes those households that have difficulty or great
difficulty in making ends meet.17 Our objective is to identify a group who are
vulnerable to economic exclusion in being distinctive in their risk of falling below a
critical resource level, being exposed to rather basic life-style deprivation and in their
level of subjective economic stress.
In Table 8 we show the results of fitting such a model. The goodness of fit indicators
include the percentage of cases misclassified and the reduction in the deviance level
compared to the independence model. The model misclassifies less than 1% of cases.
The G2 measure of goodness of fit returns a value of 24.1 with 4 degrees of freedom
16 See Lazarsfeld and Henry, 1968 and more recently Magdison and Vermunt (2004) and McCutcheon, and Mills (1998) for discussion of latent class models. Recent applications to the analysis of social exclusion include Moisio (2004) and Dewilde (2004), Whelan and Maître (2004 & 2005). 17 We use the label economic stress for this variable rather than economic strain as in earlier work because Eurostat has taken to using the latter term for something close to the basic deprivation index employed in earlier Irish work on consistent poverty.

21
that reduces the value of the benchmark independence model by 99.4%. The model
identifies one in five of the population as being economically vulnerable. At all three
income poverty lines the vulnerable are significantly more likely to be below the
relevant threshold. At the 50% line the respective percentages are 31% and 6% and
these rise to 68% and 19% at 70% of median income. The contrast between economic
vulnerability and income poverty is clearly illustrated by these results. At the 60%
line, where the number income poor is almost identical to that economically
vulnerable, just over one in two of those below the income threshold are vulnerable.
Furthermore, there is no tendency for the association between income poverty and
vulnerability to strengthen as the income threshold is made more stringent. In fact, the
opposite is the case with the odds ratio declining from 9.1:1 at the 70% line to 7.3:1 at
the 60% line and finally to 6.6:1 at the 50% line.
Table 8: Latent Class EU Common Analysis of Economic Vulnerability
Vulnerable Class Size 19.6 G2 24.1
Degrees of freedom 4 r G2 of independence model 99.4%
% of case misclassified 0.9
Conditional Probabilities Non-Vulnerable Vulnerable
Income < 50% of median 0.063 0.308 < 60% of median 0.120 0.498 < 70% of median 0.190 0.680
Economic Strain (3+) 0.025 0.656
Dificulty in making ends meet 0.111 0.821
The economically vulnerable are also sharply differentiated in terms of their exposure
to subjective economic stress with the respective figures being 82% and 11%.
However, while these disparities are substantial, the primary factor differentiating the
latent classes is their risk of experiencing an enforced lack three or more items on the
22
9-item the economic strain index. While 66% of the vulnerable group fall into this
category this is true of only 3% of the non-vulnerable.
Substituting the 11-item Irish economic strain measure with a threshold of 2+ into this
analysis produces a remarkably similar set of results. It too identifies one-fifth of the
population as vulnerable. The pattern of differentiation between vulnerable and non-
vulnerable is also strikingly similar with the only notable difference being that the
probability of being above the economic strain threshold is even lower for the non-
vulnerable cluster in the Irish specific case with the relevant figure being 1.3% rather
than 2.5%.
The latent class analyses, involving the alternative economic strain indices, identify
identical numbers of the population as economically vulnerable and produce
remarkably similar multidimensional profiles. However, as in the case of consistent
poverty, the question remains as to whether the different approaches are identifying
the same or different groups. From Table 9 we can see that 4% of those non-
vulnerable in the EU-SILC common case are classified as vulnerable in the Irish case
and 10% of the vulnerable are placed in the non-vulnerable cluster. In other words
90% of those found to be economically vulnerable by the EU common analysis are
also vulnerable using the Irish specific measure.

23
Table 9: Relationship between EU Common and Irish Specific Measures of Economic Vulnerability at e EU SILC Common 9 item Irish Specific 11 Item Economically Vulnerable Economically Vulnerable No Yes No 95.9 10.4 Yes 4.1 89.6 Total 100 100.0
In Table 10 we extend our analysis to provide a comparison of the socio-economic
factors associated with membership of the respective vulnerability clusters. In this
case the degree of similarity is even more striking than for consistent poverty. Some
very modest differences are apparent in relation to employment status, however, what
is really striking is the similarity of odds ratios across equations. This pattern is
maintained across the remaining independent variables with the only difference of any
magnitude being observed for age. Even here the differences are more modest than in
the case of consistent poverty. Thus, for the comparison between those aged thirty or
less and those aged sixty-five or more the odds ratio rises from 1.6:1 in the Irish
specific case to 3.1:1 for the EU common. Similar but more modest differences exist
for the remaining age comparison. In composition terms, this results in a situation
whereby 20% of those vulnerable on the EU common measure only are in households
where the reference person is aged less than thirty and only 3% in ones where s/he is
aged sixty five or over. The corresponding figures for the Irish specific measure are
7% and 19%.18
18 Once again a multinomial regression analysis, which is available from the authors, confirms these findings.

24
Table 10: Logistic Regressions of EU-SILC Common and Irish Specific Economic Vulnerability Measures Household Socio-Economic Characteristics EU Common Irish Specific Exp (B) Sig. Exp (B) Sig. Employment Status Self-employed with employees 0.243 *** 0.576 ** Self-employed without employees 1.432 *. 1.550 **. Farmer 2.232 *** 2.196 *** Employee – unemployed in previous 12 months
2.192 *** 1.686 ***
Ill/Disabled 6.875 *** 6.172 *** Unemployed 4.903 *** 4.838 *** In Education 4.371 *** 4.171 *** Home-Duties 3.352 *** 2.752 *** Retired 2.357 *** 1.759 *** Marital Status *** Single 1.451 *** 1.327 *** Widowed 1.130 *** 1.298 ** Separate/Divorced 2.277 *** 2.354 *** Number of Children > 2 2.040 *** 1.945 *** Lone Parent 2.957 *** 2.926 *** Age Group ** Under30 3.052 *** 1.644 ** 30-49 3.071 *** 2.025 *** 50-64 1.864 *** 1.261 *** Education Primary 4.088 *** 3.424 *** Lower Secondary 2.615 *** 2.262 ***
Rural Location 0.800 *** 0.927 n.s. Tenure Private Tenant 2.582 *** 2.316 *** Local Authority Tenant 4.134 *** 3.393 **.* Nagelkerke R2 0.356 0.311 Chi Square 3,454.9 3,045.5 Degrees of Freedom 22 22 *** P< .001, ** P< .01, *P < .1

25
The different measures of economic strain lead to almost identical conclusions
regarding levels of economic exclusion and the pattern of multidimensional
differentiation. However, what is even more striking is that, with key exceptions, they
produce broadly similar conclusions regarding the socio-economic profile of the
vulnerable.
Multiple Deprivation Profiles The economic vulnerability approach takes us beyond the unidimensional perspective
associated with a focus on the relative income approach. However, it still involves a
rather more restricted view of deprivation than that typically associated with the
notions of “multiple deprivation”. In this section we seek to take advantage of the
range of life-style deprivation items available in the Irish component of EU-SILC to
develop an understanding of the consequences of economic vulnerability, as measured
using the EU-SILC common items, for more broadly conceived patterns of
deprivation.
In order to pursue this analysis, we distinguish between those who are economically
vulnerable and consistently poor, those vulnerable and those who are neither. Since
the consistently poor are a sub-set of the economically vulnerable, for convenience we
will refer to the first category as the consistently poor and the second as the
economically vulnerable. In Table 11 we then consider the patterns of differentiation
across the categories of these typologies for the five life-style deprivation dimensions
identified in the Irish survey. In both cases we see that deprivation increases for each
dimension as one moves from non-vulnerable group to the vulnerable and then to the
consistently poor. With the exception of the health dimension, the vulnerable group
occupies a position close to half way between the non-vulnerable and the consistently

26
Table 11: Variation Across Irish Specific Deprivation Dimensions by Consistent Poverty and Economic Vulnerability at both The Irish and EU Common Level Economic
Strain Consumptio
n Deprivation
Housing Deprivation
Neighbourhood Deprivation
Health
Mean Mean Mean Mean Mean EU Common Level
Not Vulnerable 0.21 0.71 0.08 0.45 0.55 Vulnerable & Not Poor
1.87 3.49 0.18 0.87 1.02
Vulnerable & Poor
3.81 6.78 0.41 1.20 1.23
Ratio of Vulnerable & poor to Non-Vulnerable
18.1 9.5 5.1 2.7 2.2
Eta2 0.423 0.431 0.045 0.060 0.045 Irish Specific Not Vulnerable 0.10 0.71 0.08 0.45 0.54 Vulnerable & Not Poor
1.98 3.45 0.20 0.87 1.02
Vulnerable & Poor
4.29 6.32 0.40 1.18 1.27
Ratio of Vulnerable & poor to Non-Vulnerable
42.9 8.9 5.0 2.6 2.4
Eta2 0.585 0.388 0.047 0.061 0.052
poor. In the case of health the vulnerable are closer to the consistently poor. For both
the EU common and the Irish specific profiles the extent of variation across the
typology declines as one moves from the economic strain to consumption deprivation
and then to housing, neighbourhood environment and health status. The disparity

27
ratios summarising the scale of the disadvantage experienced by the consistently poor
in comparison with the non-vulnerable are respectively 18:1, 10:1, 5:1, 3:1 and 2:1.
Turning our attention to how the EU common typology fares in comparison with its
Irish specific counterpart, we find that both the observed disparities and the
proportions of variance explained are pretty well identical. In the case of consumer
deprivation, the EU common typology produces a slightly higher disparity ratio and
accounts for a slightly higher proportion of the variance. However, the major contrast
relates to economic strain. The level for the non-vulnerable in the Irish specific
typology is 50% that for their EU common counterparts while for the consistently
poor it is 10% higher. As a consequence, the disparity ratio relating to the comparison
between these two groups rise from 18:1 in the latter case to 43:1 in the former.
Similarly, the proportion of variance explained rises from 42% to 59%.
Only in relation to the capacity to differentiate between those experiencing the kind of
extreme deprivation captured in the items that make up the Irish specific economic
strain index does it fare less well. However, this difference is of some importance
since ability to discriminate in relation to such deprivation is of fundamental
importance in a poverty measure and the Irish specific index is therefore clearly
superior. However, what is striking is not that the more restricted, and less
theoretically grounded set of EU items, performs less well but rather that they provide
the basis for identifying groups who are so sharply differentiated in relation to a range
of life-style dimensions including the Irish specific economic strain index.

28
Conclusions In this paper we have considered the consequences for the measurement of material
deprivation, consistent poverty and economic strain of the shift from the ECHP data
set to the EU-SILC instrument. By taking advantage of the availability of the much
wider set of indicators available in the Irish version of EU-SILC, it has been possible
to evaluate the more restricted EU-wide indices by placing them in the context of
measures constructed on a theoretically informed basis and validated in relation to a
range of external indicators.
A comparison of consistent poverty measures based on EU common and Irish specific
measures of economic strain revealed a substantial overlap with eight out of ten of
those consistently poor on the former also being poor on the latter. The major
difference between the measures is that the EU common index is significantly more
likely to identify younger individuals and correspondingly less likely to identify
homeowners. In each case one fifth of the population was identified as economically
vulnerable with the pattern of differentiation between the vulnerable and non-
vulnerable being strikingly similar. The overlap between the measures is even greater
than in the case of consistent poverty and the socio-economic profiles of the groups
identified are remarkably similar.
By creating typologies that combined information on consistent poverty and economic
vulnerability, we were able to show that using the EU wide measures it is possible to
identify clusters of individual who are differentiated across a wide range of
deprivation dimensions. They also provide us with an understanding of the socio-

29
economic factors associated with such differentiation that departs in only modest
respects from that derived from the more comprehensive set of Irish specific
indicators. Our analysis holds out the prospect that the harmonised EU-SILC data set
will allow us to continue to pursue important aspects of the research agenda relating
to multi-dimensional deprivation developed on the basis of the ECHP. Further studies
comparing EU common and country specific approaches have the potential to deepen
our understanding of how the set of deprivation measures available in EU-SILC might
best be revised at a later stage.
References
Breen, R and Moisio, P., ‘Overestimated Poverty Mobility: Poverty Dynamics
Corrected for Measurement Error’, Journal of Economic Inequality, 2004, 2.3:171-
191.

30
Callan, T., Nolan, B., Whelan, C. T. (1993), “Resources, Deprivation and the
Measurement of Poverty”, Journal of Social Policy, 22, 2:141-172.
Central Statistics Office (2005), EU Survey on Income and Living Conditions (EU-
SILC); First Results 2003, Statistical Release 24 January, SO: Dublin/Cork
Chambers, R. (1989), ‘Vulnerabilty: How the Poor Cope, Editorial IDS Bulletin, 20:2
Davey Smith, Blane, D. and Bartley, M. (1994), ‘Explanations for Socio-economic
Differentials in mortality;, European Journal of Public Health, 4:131-144.
Dewilde, D. (2004),‘The Multidimensional Measurement of Poverty in Belgium and
Britain: A Categorical Approach, Journal of Social Indicators, 68, 3, 331 - 369
Eurostat (2005a), ‘Income Poverty and Social Exclusion in the EU25’ Statistics in
Focus 03/2005, A.-C. Guio
Eurostat (2005b), ‘Material Deprivation in the EU’ Statistics in Focus 05/2005, A.-C.
Guio.
Förster, M, F. (2005), ‘The European Social space Revisited: Comparing Povery in
the Enlarged European Union’, Journal of Comparative Policy Analysis, 7,1:29-48.
Gallie, D., Paugam, S. and Jacobs, S. 920030, ‘Unempolyment, Poverty and Social
Isolation’, European Societies, 5,1:1-31.

31
International Monetary Fund (2003), Vulnerability Indicators: A Factsheet,
www.imf.org/external/np/exr/facts/vul.html
Lazarsfeld, P.F., & Henry, N.W.(1968), Latent Structure Analysis. Boston: Houghton
Mifflin
Magidson, J. and Vermunt, J. (2004), ‘Latent Class Models’, in D. Kaplan (ed),
Hanbook of Quantitative Methodology, London: Sage
Mc Kay, S. and Collard, S. (2003), Developing Deprivation Questions for the Family
Resources Survey, Department for Work and Pensions Working paper Numner13.
Corporate Document Series
Mc Cutcheon, A. and Mills, A. (1998), ‘Categorical Data Analysis; Log-Linear and
Latent Class Models, in Scarborough, E. Tannenbauum, E., Research Strategies in the
Social Sciences, Oxford, Oxford University Press
Moisio P. (2004), ‘ A Latent Class Application to the Multidimensional Measurement
of Poverty’, Quantity and Quality-International Journal of Methodology
Muffels, R. & Fouarge, D.,’ The Role of European Welfare States in Explaining
Resources Deprivation’. Social Indicators Research, (2004) 68: 299-330
Nolan, B. and Whelan, C. T. (1996), ‘Resources, Deprivation and Poverty’, Oxford
and New York: Oxford University Press, Clarendon Press.

32
Nolan, B. and C. T. Whelan, (2005). “On the Multidimensionality of Poverty and
Social Exclusion”, paper presented at European Consortium for Sociological Research
Conference on Comparative European Studies: Assessing Ten Years of Sociological
Research 1995-2005. Paris: 25/26 November.
Perry, B. (2002), ‘The Mismatch Between Income Measures and Direct Outcome
Measures of Poverty’, Social Policy Journal of New Zealand, 19:101-127
Short, K. S. (2005), ‘Material and Financial Hardship and Income-based Poverty
Measures in the USA’, Journal of Social Policy, 34,1:21-38.
Tsakloglou, P. and Papadopoulous, F. (2002) ‘Aggregate level and determining
factors of social exclusion in twelve European countries’, Journal of European Social
Policy, 12 (3): 211_/25.
United Nations (2003), Report on the World Social Situation: Social Vulnerability:
Sources and Challenges, New York: United Nations Department of Economic and
Social Affairs.
Whelan, C.T., Layte, R. & Maître, B. (2004), "Understanding the Mismatch Between
Income Poverty and Deprivation: A Dynamic Comparative Analysis", European
Sociological Review, 20, 4: 287-30
33
Whelan, C.T., Maître, B. (2005a), “Economic Vulnerability, Multi-dimensional
Deprivation and Social Cohesion in an Enlarged European Union”, International
Journal of Comparative Sociology, 46, 3:215-239.
Whelan, C.T, Maître, B. (2005b), “Vulnerability and Multiple Deprivation
Perspectives on Economic Exclusion in Europe: A Latent Class Analysis”, European
Societies, 7,3:423-450.
Whelan, C. T., Maître, B. and Nolan, B. (2006), ‘Measuring Consistent Poverty in
Ireland, with EU SILC Data’, Dublin: Economic and Social Research Institute,
Working Paper No. 165.
Whelan, C. T. and Maître, B (2006), ‘Levels and Patterns of Material Deprivation in
Ireland: After the ‘Celtic Tiger’’, Dublin: Economic and Social Research Institute,
Working Paper No. 171.
World Bank (2000), World Development Report 2000-01: Attacking Poverty, New
York: Oxford University Press.