Embed Size (px)
Citation preview
Measuring the Impact of the Financial Inclusion Action Plan (FIAP) Program Process and Baseline Impact Evaluation 2018
Final Report
Mar 2018
For Good Shepherd Microfinance
i
MEASURING THE FIAP IMPACT
2018
Research team
Abigail Powell Isabella Saunders Fanny Salignac Axelle Marjolin Lena Etuk Jasmine Bruce Alexandra Walker
Recommended Citation
Powell, A. (2018) Measuring the FIAP Impact: Process and Baseline Impact Evaluation of the
Financial Inclusion Action Plan (FIAP) Program 2018. Report for Good Shepherd
Microfinance. Sydney: Centre for Social Impact, UNSW.
Address for Correspondence
Abigail Powell
Centre for Social Impact
02 8936 0916
Centre for Social Impact
The Centre for Social Impact (CSI) is a national research and education centre dedicated to
catalysing social change for a better world. CSI is built on the foundation of three of Australia’s
leading universities: UNSW Sydney, The University of Western Australia, and Swinburne
University of Technology. Our research develops and brings together knowledge to understand
current social challenges and opportunities; our postgraduate and undergraduate education
develops social impact leaders; and we aim to catalyse change by drawing on these foundations
and translating knowledge, creating leaders, developing usable resources, and reaching across
traditional divides to facilitate collaborations.
Acknowledgements
This evaluation has been undertaken with funding from Good Shepherd Microfinance. CSI has
benefited from the extensive expertise, commitment and support of Good Shepherd Microfinance,
EY, the Financial Inclusion Action Plan (FIAP) partnership group and FIAP Trailblazers.
Disclaimer
Any errors or omissions are those of the authors only.
ii
MEASURING THE FIAP IMPACT
2018
CONTENTS
Figures .................................................................................................................................................................................. iii
Executive Summary ............................................................................................................................................................. i
The Baseline: where are we now? ........................................................................................................................................ i
Lessons from the Trailblazer Community ....................................................................................................................... ii
Ongoing challenges and opportunities to improve .................................................................................................... iii
Introduction ............................................................................................................................................................. 4
1.1 The FIAP Evaluation ........................................................................................................................................................... 4
1.2 This report .............................................................................................................................................................................. 5
1.3 How we conducted the evaluation .............................................................................................................................. 6
1.4 Companion reports ............................................................................................................................................................. 6
Impact evaluation: Building The FIAP Baseline .......................................................................................... 7
2.1 The FIAP Indicator bank .................................................................................................................................................. 7
2.2 Population level baseline ................................................................................................................................................. 7
2.3 FIAP program level baseline........................................................................................................................................ 16
2.4 Reflections and recommendations on the FIAP Indicator bank .................................................................. 17
Impact evaluation: Preliminary outcomes ................................................................................................ 20
3.1 Targeted FIAP actions .................................................................................................................................................... 20
3.2 Awareness and understanding of financial inclusion and resilience ........................................................ 21
3.3 Awareness and emulation of the FIAP program ................................................................................................. 22
3.4 Collaboration ...................................................................................................................................................................... 23
Process evaluation findings ............................................................................................................................. 25
4.1 Motivations and expectations about FIAP ............................................................................................................. 25
4.2 Enablers and barriers to the success of FIAP....................................................................................................... 26
Summary: What have we learnt in PHase One of the FIAP PROGRAM ............................................. 30
References .......................................................................................................................................................................... 31
Appendix 1: Theory of Change .................................................................................................................................... 33
Appendix 2: Draft proposal for revised indicator bank .................................................................................... 34
Trailblazer Indicator Reporting Tool .............................................................................................................................. 34
Appendix 3: Summary of Trailblazer actions ........................................................................................................ 36
Trailblazer Target Populations .......................................................................................................................................... 36
Trailblazer Move the Dial Strategies ............................................................................................................................... 37
Appendix 4: FIAP Media coverage ............................................................................................................................. 39
Appendix 5: Evaluation Methodology ...................................................................................................................... 41
What did we measure? .......................................................................................................................................................... 41
iii
MEASURING THE FIAP IMPACT
2018
How did we measure it? ........................................................................................................................................................ 43
Evaluation limitations ............................................................................................................................................................ 45
Appendix 6: Glossary and key terms ........................................................................................................................ 47
FIGURES
Figure 1.1 FIAP Action Areas and ‘Move the Dial’ Strategies ........................................................................................... 5
Figure 2.1 Gini coefficient Australia and the OECD............................................................................................................... 8
Figure 2.2 Unemployment ratio, seasonally adjusted (%) ................................................................................................ 9
Figure 2.3 Underemployment ratio, seasonally adjusted (%) ......................................................................................... 9
Figure 2.4 Full-time base salary and total remuneration gender pay gap (%) ..................................................... 10
Figure 2.5 Superannuation coverage by gender and age (%) ....................................................................................... 11
Figure 2.6 Mean superannuation balance by gender and age ($’000) ...................................................................... 12
Figure 2.7 Year 12 (or equivalent) attainment of 20-24-year olds by gender (%) ............................................. 13
Figure 2.8 25-29-year olds with a Bachelor Degree or higher non-school qualification (%) ......................... 13
Figure 2.9 Ratio of household debt to disposable income (%) ..................................................................................... 14
Figure 2.10 Bank service fees from households ($) ........................................................................................................ 15
Figure 2.11 Adults with low or very low levels of financial resilience components (%) ............................... 16
Figure 3.1 Key population groups targeted by FIAP actions* ....................................................................................... 21
Figure 3.2 Emulation: Trailblazer survey findings (%) ................................................................................................... 23
i
MEASURING THE FIAP IMPACT
2018
EXECUTIVE SUMMARY
Measurement and evaluation are an important part of any program. They enable us to establish
progress against our intended outcomes and impact, understand where and for whom we are
making a difference, as well as identifying where improvements may be made going forward.
The Financial Inclusion Action Plan (FIAP) program, led by Good Shepherd Microfinance on
behalf of the Australian Government in partnership with CSI and EY, aims to increase financial
inclusion and resilience in Australia through enabling participating organisations (FIAP
Trailblazers) to take action. By taking these actions, Trailblazers also contribute to Sustainable
Development Goals of reducing inequalities and increasing inclusive growth.
The FIAP evaluation includes the following:
1. Impact Evaluation: To measure progress against the intended short, medium, long term
outcomes and impact of the FIAP program. This includes building a FIAP Baseline and
Indicator Bank, to understand where we are now, in order to measure the progress made
by the FIAP program into the future.
2. Process Evaluation: To understand what is working (or not working), for whom and why;
to identify potential challenges that may need to be addressed and opportunities to
enhance future phases of the program.
In the lead-up to the completion of Phase One of the FIAP program, the focus of CSI’s evaluation
was on establishing the FIAP baseline, identifying preliminary outcomes that occurred in the first
year of launching 12 Foundation FIAPs (while recognising that FIAP is a long-term program), and
ascertaining challenges and lessons in the establishment and early implementation of FIAP.
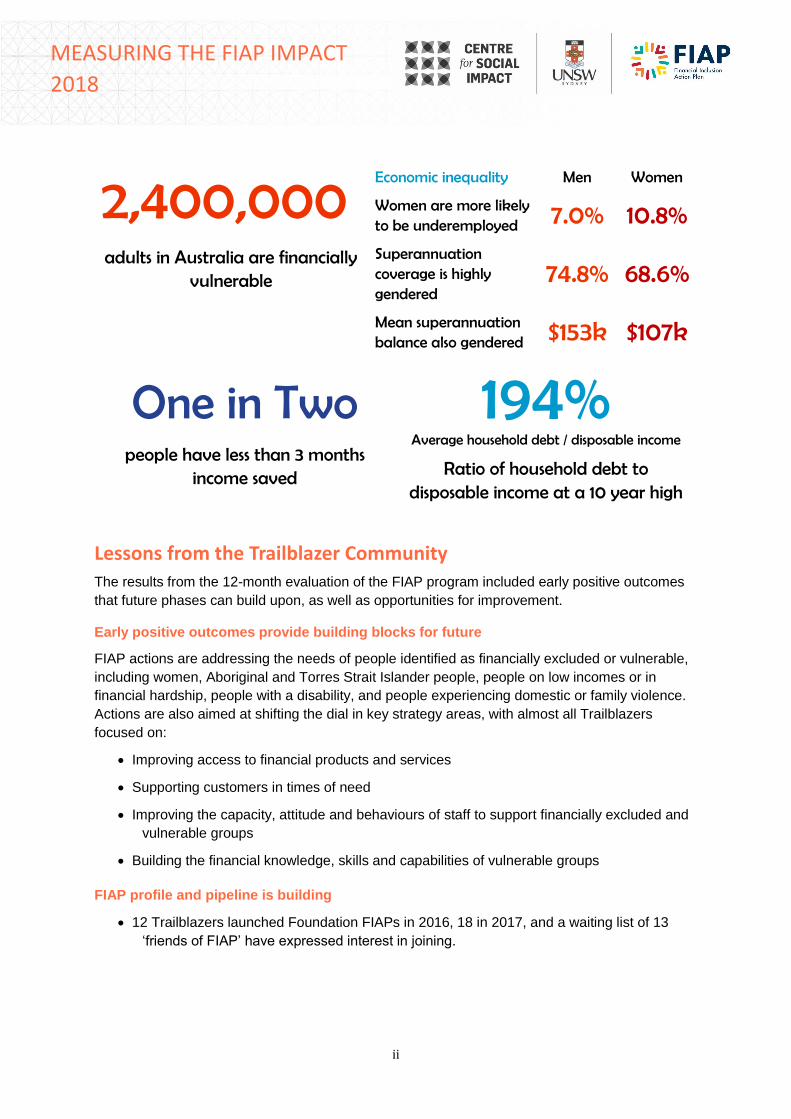
The Baseline: where are we now?
In order to measure whether the FIAP program reduces inequalities and increases inclusive
growth, financial resilience and financial inclusion, we need to understand where we are
currently. This data below provides a brief insight:
The gender pay gap is decreasing but remains high Australia’s Gini coefficient
(an indicator of how unequal a country’s income is) is
decreasing but is higher than the OECD average.
17.3% Gender pay gap, based on salary remuneration
22.4% Total remuneration gender pay gap
ii
MEASURING THE FIAP IMPACT
2018
2,400,000 adults in Australia are financially
vulnerable
Economic inequality Men Women Women are more likely to be underemployed
7.0% 10.8% Superannuation coverage is highly gendered
74.8% 68.6% Mean superannuation balance also gendered
$153k $107k One in Two
people have less than 3 months income saved
194% Average household debt / disposable income
Ratio of household debt to disposable income at a 10 year high
Lessons from the Trailblazer Community
The results from the 12-month evaluation of the FIAP program included early positive outcomes
that future phases can build upon, as well as opportunities for improvement.
Early positive outcomes provide building blocks for future
FIAP actions are addressing the needs of people identified as financially excluded or vulnerable,
including women, Aboriginal and Torres Strait Islander people, people on low incomes or in
financial hardship, people with a disability, and people experiencing domestic or family violence.
Actions are also aimed at shifting the dial in key strategy areas, with almost all Trailblazers
focused on:
• Improving access to financial products and services
• Supporting customers in times of need
• Improving the capacity, attitude and behaviours of staff to support financially excluded and
vulnerable groups
• Building the financial knowledge, skills and capabilities of vulnerable groups
FIAP profile and pipeline is building
• 12 Trailblazers launched Foundation FIAPs in 2016, 18 in 2017, and a waiting list of 13
‘friends of FIAP’ have expressed interest in joining.

iii
MEASURING THE FIAP IMPACT
2018
• Newer Trailblazers are more likely to find out about the FIAP program through other
Trailblazers, rather than the Partnership group.
• 72 percent of Trailblazers report increased awareness and understanding of financial
inclusion and resilience within their organisations.
• As at early December 2017, the FIAP webpage on the Good Shepherd Microfinance
website had 6,196 views, including 4,695 unique page views and an average visit length
of 2 minutes and 56 seconds.
Collaboration is increasing
Increasing Trailblazer collaboration and facilitating collective action is a critical component of the
FIAP program. Interviews with Trailblazers indicated a strong desire to collaborate and learn from
others, demonstrating that the FIAP program is more than the sum of its parts. 76 percent of
survey respondents said they had engaged with other Trailblazers beyond the formal
mechanisms the FIAP program facilitates (e.g. Community of Practices and working groups).
Ongoing challenges and opportunities to improve
• Organisational commitment and resourcing (time and funding). Trailblazers must
ensure ongoing internal commitment and resourcing for the FIAP efforts, which is critical
both in establishing a FIAP and Implementing actions.
• Identifying a clear roadmap and value proposition. Ensuring that FIAP stakeholders
have clarity on the future roadmap of the FIAP program is important, whilst
acknowledging that the value proposition might be different for different sectors.
• Role of the FIAP Secretariat. Ongoing support from a FIAP Secretariat is instrumental to
drive the program into the future, support Trailblazers in developing their FIAPs and
facilitating ongoing collaboration.
• Identifying and measuring impact. Continued commitment for the FIAP program is likely
to depend on achieving its short-term outcomes, yet attributing population-level change to
actions is challenging. Instead, the FIAP evaluation can point to program contribution by
measuring collective FIAP actions through outcomes measurement at an aggregated
organisational level and mapping other factors that could be contributing to change.
4
MEASURING THE FIAP IMPACT
2018
INTRODUCTION
More than three million people living in Australia are severely or fully financially excluded. These
individuals and their families are at higher risk of financial hardship, such as poverty, financial
stress and vulnerability to predatory lending practices, and poor social, emotional and health
outcomes. While financial exclusion levels haven’t changed markedly over the past 8 years;
income gaps and financial hardship increased following the 2008 global financial crisis.
Against this background, in May 2015, the Australian Government pledged to develop the
country’s first Financial Inclusion Action Plan (FIAP) program (GSM 2016). This was part of the
commitment made by G20 leaders, including Australia, to rebuild a resilient financial system in
the wake of the Global Financial Crisis (GPFI 2014). The FIAP program, led by Good Shepherd
Microfinance (GSM) in partnership with the Department of Social Services (DSS), Ernst and
Young (EY) and the Centre for Social Impact (CSI), is based on a coordinated and systemic
approach to creating a fairer and more just society. The FIAP program was developed in line with
Australia’s obligations to the G20 Financial Inclusion Action Plan and the United Nation’s
Sustainable Development Goals.
1.1 The FIAP Evaluation
Measurement and evaluation are important components of any program. Measuring outcomes
and impacts allow organisations and sectors to demonstrate change, or lack thereof, and know
where and for whom they are making a difference. Measurement and evaluation also provide
evidence that can be used for multiple purposes, including: learning and development; seek
funding; accountability; and benchmarking (Muir & Bennett, 2014).
The FIAP evaluation includes:
1. Impact evaluation: To measure progress against the intended short, medium, long term
outcomes and impact of the FIAP program
a. Building the FIAP baseline: To understand where we are now in order to measure
progress into the future at a macro population level and collective action at the FIAP
program level
2. Process evaluation: To understand how outcomes will be achieved, other factors that may
impact outcomes, what is working and for whom.
FIAP aims to realise inclusive growth for individuals and communities in Australia by reducing inequalities and increasing financial inclusion and
financial resilience through collective actions of organisations across industry, government, academia and the community sector
5
MEASURING THE FIAP IMPACT
2018
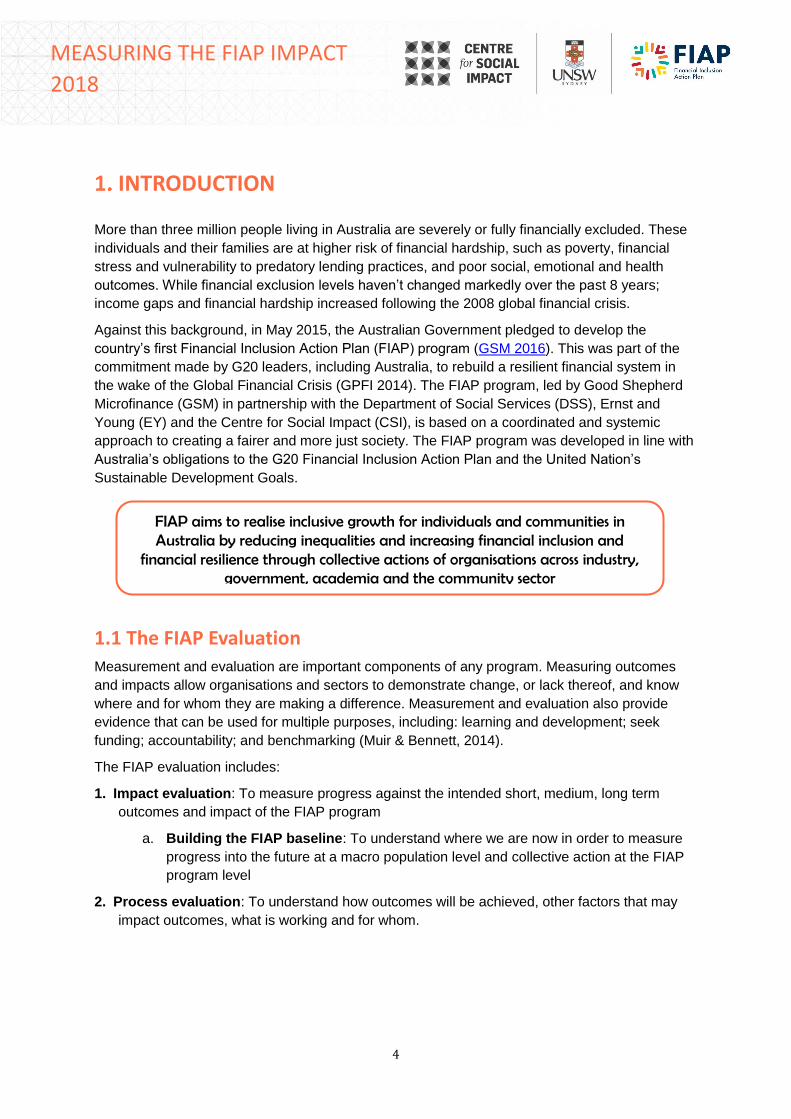
The FIAP program takes a systems approach, recognising that for change to occur at a macro
level (across society), we need to implement change in our communities and organisations (at the
meso level) and among individuals (micro level). This is important as it recognizes that
organisations are working within an ecosystem and are able to influence financial inclusion and
resilience at multiple levels (Muir et al, 2016a). The FIAP framework is underpinned by four key
action areas, identifying ten ‘system-wide’ strategies required to ‘move the dial’ on, or enhance,
financial inclusion and resilience in Australia (Figure 1.1). These action areas respond directly to
key triggers of financial exclusion and low resilience, including lack of access to safe, affordable
and appropriate products and services; low capability both external to participating organisations
(their clients and community partners) and internal (their staff, policies and processes, and
suppliers); lack of understanding of vulnerability; and fewer opportunities for economic
participation and equality.
Figure 1.1 FIAP Action Areas and ‘Move the Dial’ Strategies
Source: Good Shepherd Microfinance (2016)
While the FIAP program seeks to contribute to these actions and strategies at a macro
(population) level in Australia (e.g. Gini-co-efficients and other determinants of economic growth
and overall population level inequalities), we acknowledge it is not possible to attribute them
directly to the FIAP program. Changes can only be tracked at the FIAP organisational level,
based on FIAP Trailblazer activities and intended target groups, and by monitoring changes for
these groups over time.
1.2 This report
In this report, we establish the FIAP baseline and investigate short-term outcomes for the FIAP
program, as well as assess the process of developing a Foundation FIAP. Measurement of long-
term change and impact will go far beyond Phase One, straddling another three phases of the
program over a ten-year horizon. Given the FIAP program has adopted a ‘try, test and learn’
approach to continuous learning, the FIAP evaluation will also continue to be tested and refined.
6
MEASURING THE FIAP IMPACT
2018
In this report we describe:
• The FIAP baseline – indicators at the national population level and the FIAP organisation
level – in order to measure progress against outcomes in future evaluations of FIAP
• Preliminary outcomes that have occurred in Phase One of FIAP (2015-2018)
• Results of the process evaluation, reflecting on facilitators and barriers to the establishment
and early implementation of FIAP both at the program level and within Trailblazer
organisations.
1.3 How we conducted the evaluation
The FIAP evaluation uses a mixed method approach including:
• Document analysis
• Secondary data analysis
• Interviews and surveys with FIAP stakeholders
Please refer to Appendix 5: Evaluation Methodology), for further details about how the FIAP
evaluation was conducted.
1.4 Companion reports
Alongside this report, you may also find it useful to read some of the other FIAP and evaluation
reports:
• FIAP concepts and baseline (November 2016), available at www.csi.edu.au/fiap
• FIAP measuring impact (March 2017), available at www.csi.edu.au/fiap
• FIAP launch report (November 2016), available at fiap.org.au
• FIAP Phase One Completion report (March 2018) , available at fiap.org.au.
7
MEASURING THE FIAP IMPACT
2018
IMPACT EVALUATION: BUILDING THE FIAP BASELINE
In this chapter we:
• Establish the FIAP baseline at a population level (section 2.2)
• Describe the FIAP program level baseline using aggregated data from the original 12
Trailblazers (section 2.3)
• Reflect on the process of establishing the FIAP baseline and make recommendations
regarding future data collection (section 2.4).
2.1 The FIAP Indicator bank
The FIAP baseline has been established using an Indicator bank developed as part of the FIAP
evaluation framework. The purpose of the FIAP Indicator bank is to demonstrate:
• Progress against outcomes identified in the Theory of Change (see Appendix 1)
• Achievements against the identified strategies to ‘shift the dial’ (see Figure 1.1 above).
The FIAP Indicator bank recognises the systems approach adopted by the FIAP program, with
indicators to measure the impact of FIAP at the macro or population level as well as the collective
action (meso-level change) or effort of the organisations participating in FIAP (currently the FIAP
Trailblazers).
Indicators were developed from existing frameworks including Trailblazers existing regulatory
reporting, as well as international and national frameworks such as the Sustainable Development
Goals (SDGs), Australian Bureau of Statistics (ABS), Workplace Gender Equality Agenda
(WGEA), Reconciliation Action Plans (RAP), World Bank Global Findex Database, Australian
Prudential Regulation Authority (APRA), the Association of Superannuation Funds of Australia
(ASFA) and RFi research1.
2.2 Population level baseline
Inclusive growth and economic inequalities
Over the last 30 years, the distribution of income has become increasingly unequal with the
richest 10% having, on average, a mean income 9.5 times higher than the poorest 10% in OECD
1 RFi Group is a global intelligence and digital media provider focusing exclusively on financial services (www.rfigroup.com),
Indicators are measurable markers that demonstrate progress against outcomes
8
MEASURING THE FIAP IMPACT
2018
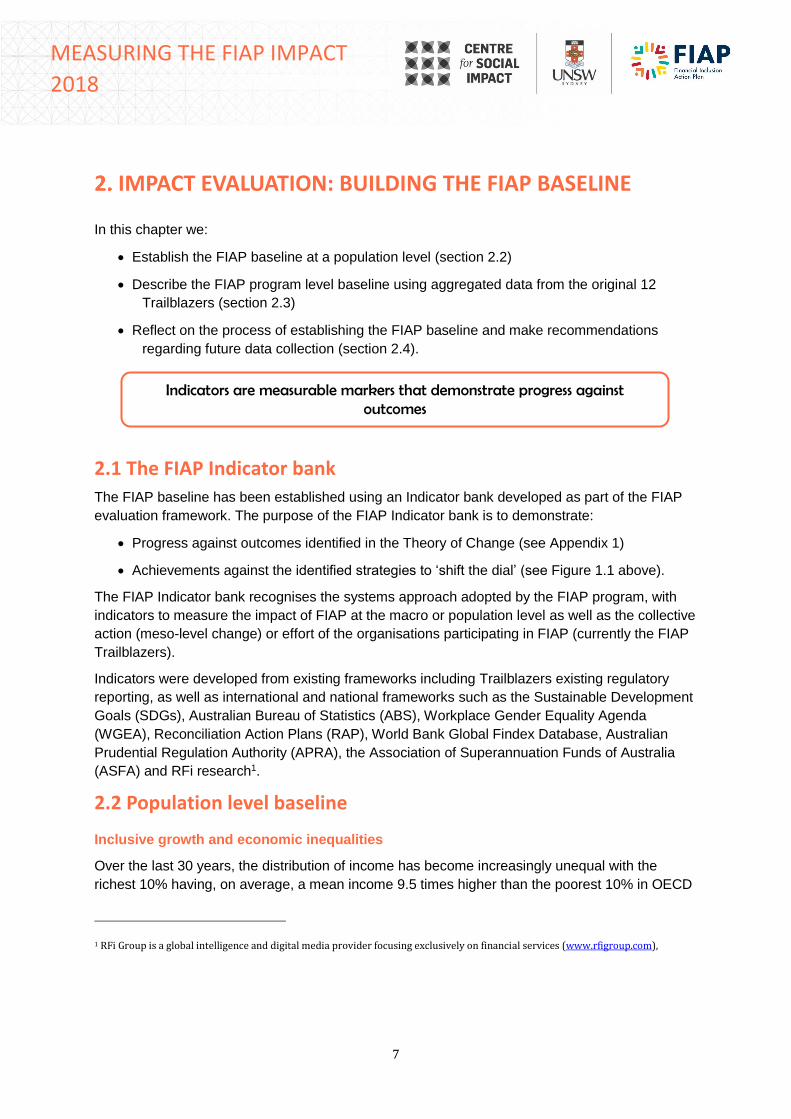
countries (OECD 2015). A common measure of how unequal a country’s income distribution is
the Gini coefficient. It ranges from 0 to 1, where 0 indicates perfect equality and 1 perfect
inequality. As shown in
Australia’s Gini coefficient has decreased slightly recently from 0.333 in 2013/14 to 0.323 in
2015/16, demonstrating a slight improvement in income distribution. However, Australia’s Gini
coefficient is higher than the OECD average, suggesting there is still room for improvement.
Figure 2.1 Gini coefficient Australia and the OECD
Source: ABS (2017) 6523.0 Household Income and Wealth, Australia. Table 1 Household income and income distribution; OECD (2016) Income Inequality Update.
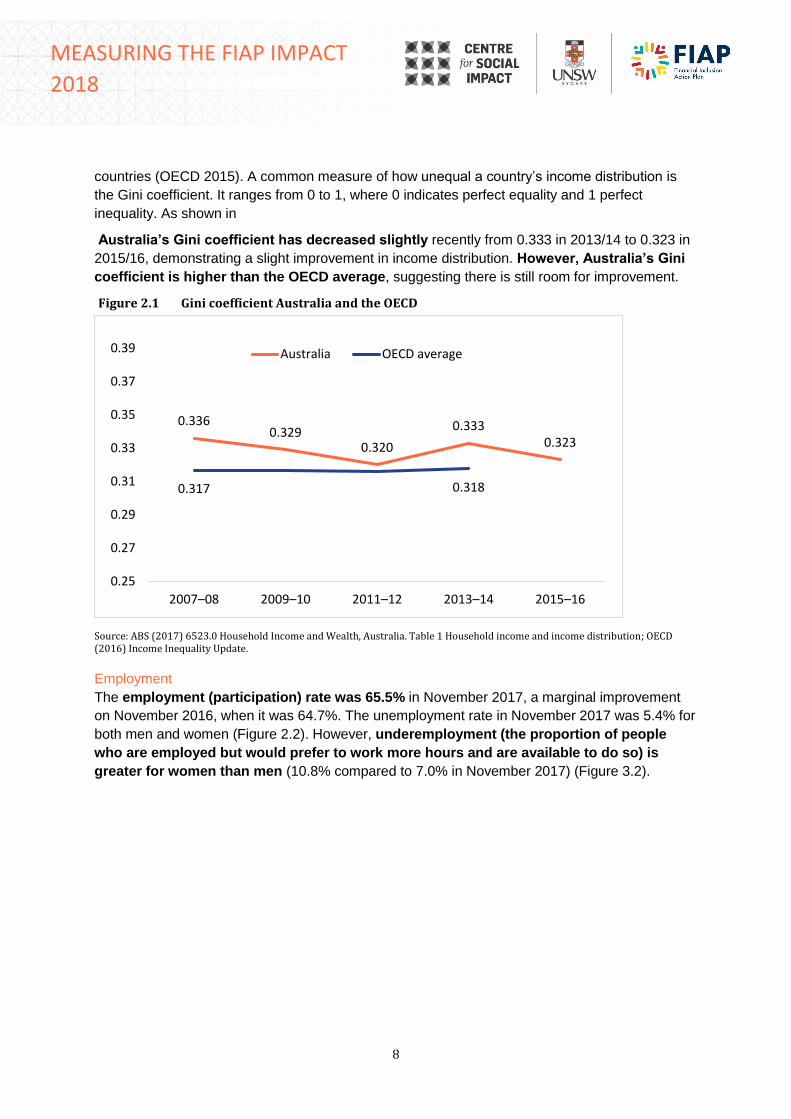
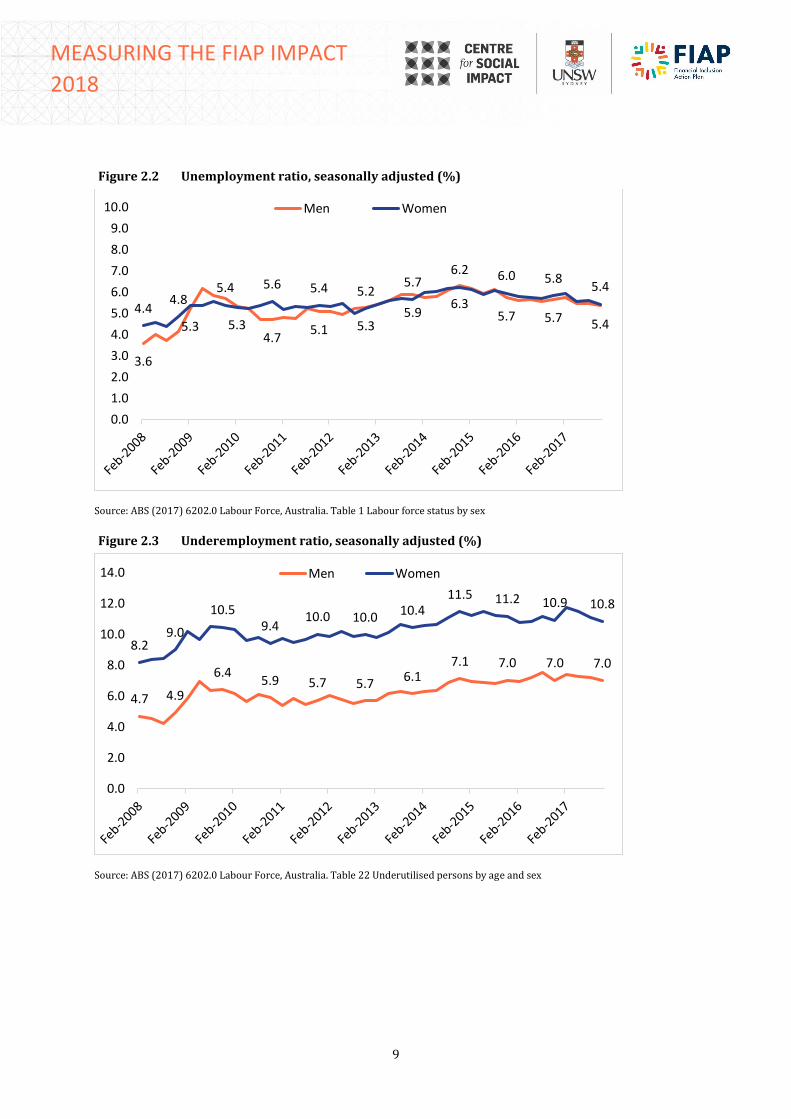
Employment
The employment (participation) rate was 65.5% in November 2017, a marginal improvement
on November 2016, when it was 64.7%. The unemployment rate in November 2017 was 5.4% for
both men and women (Figure 2.2). However, underemployment (the proportion of people
who are employed but would prefer to work more hours and are available to do so) is
greater for women than men (10.8% compared to 7.0% in November 2017) (Figure 3.2).
0.3360.329
0.320
0.3330.323
0.317 0.318
0.25
0.27
0.29
0.31
0.33
0.35
0.37
0.39
2007–08 2009–10 2011–12 2013–14 2015–16
Australia OECD average
9
MEASURING THE FIAP IMPACT
2018
Figure 2.2 Unemployment ratio, seasonally adjusted (%)
Source: ABS (2017) 6202.0 Labour Force, Australia. Table 1 Labour force status by sex
Figure 2.3 Underemployment ratio, seasonally adjusted (%)
Source: ABS (2017) 6202.0 Labour Force, Australia. Table 22 Underutilised persons by age and sex
3.6
5.3 5.34.7
5.1 5.35.9
6.35.7 5.7 5.4
4.44.8
5.4 5.6 5.4 5.25.7
6.2 6.0 5.85.4
0.0
1.0
2.0
3.0
4.0
5.0
6.0
7.0
8.0
9.0
10.0 Men Women
4.7 4.9
6.45.9 5.7 5.7
6.17.1 7.0 7.0 7.0
8.29.0
10.59.4
10.0 10.0 10.411.5 11.2 10.9 10.8
0.0
2.0
4.0
6.0
8.0
10.0
12.0
14.0 Men Women
10
MEASURING THE FIAP IMPACT
2018
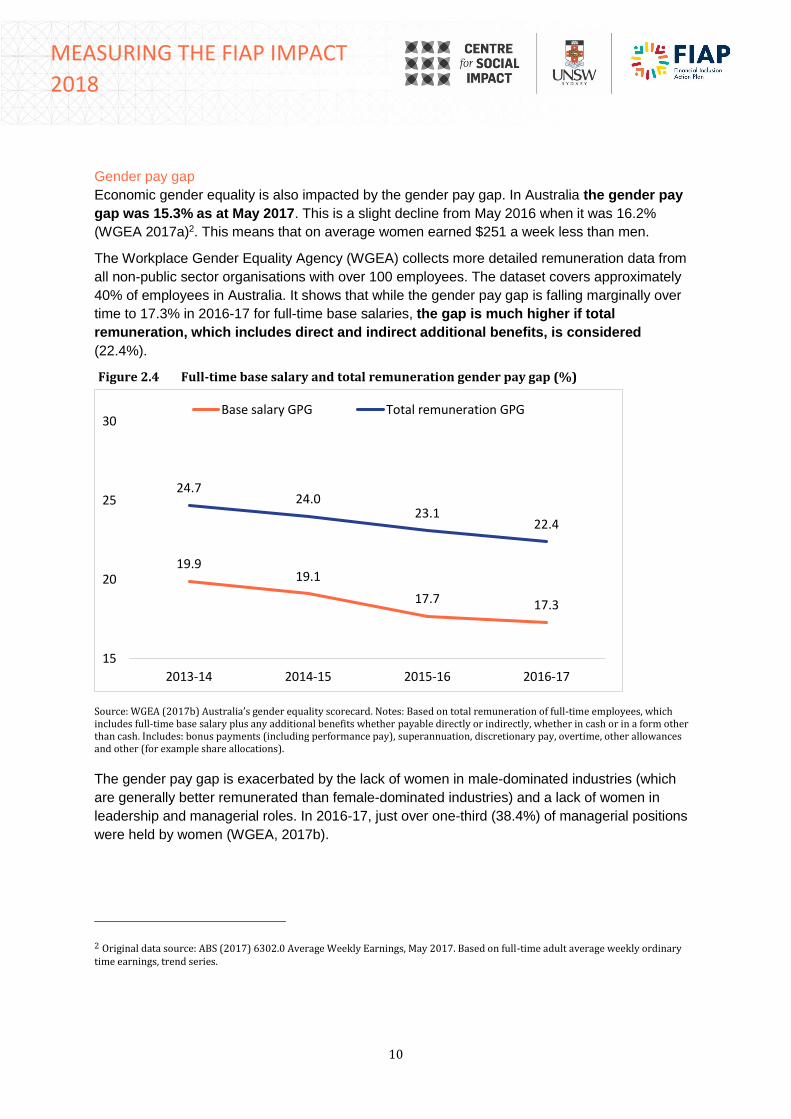
Gender pay gap
Economic gender equality is also impacted by the gender pay gap. In Australia the gender pay
gap was 15.3% as at May 2017. This is a slight decline from May 2016 when it was 16.2%
(WGEA 2017a)2. This means that on average women earned $251 a week less than men.
The Workplace Gender Equality Agency (WGEA) collects more detailed remuneration data from
all non-public sector organisations with over 100 employees. The dataset covers approximately
40% of employees in Australia. It shows that while the gender pay gap is falling marginally over
time to 17.3% in 2016-17 for full-time base salaries, the gap is much higher if total
remuneration, which includes direct and indirect additional benefits, is considered
(22.4%).
Figure 2.4 Full-time base salary and total remuneration gender pay gap (%)
Source: WGEA (2017b) Australia’s gender equality scorecard. Notes: Based on total remuneration of full-time employees, which includes full-time base salary plus any additional benefits whether payable directly or indirectly, whether in cash or in a form other than cash. Includes: bonus payments (including performance pay), superannuation, discretionary pay, overtime, other allowances and other (for example share allocations).
The gender pay gap is exacerbated by the lack of women in male-dominated industries (which
are generally better remunerated than female-dominated industries) and a lack of women in
leadership and managerial roles. In 2016-17, just over one-third (38.4%) of managerial positions
were held by women (WGEA, 2017b).
2 Original data source: ABS (2017) 6302.0 Average Weekly Earnings, May 2017. Based on full-time adult average weekly ordinary time earnings, trend series.
19.919.1
17.7 17.3
24.724.0
23.122.4
15
20
25
30
2013-14 2014-15 2015-16 2016-17
Base salary GPG Total remuneration GPG
11
MEASURING THE FIAP IMPACT
2018
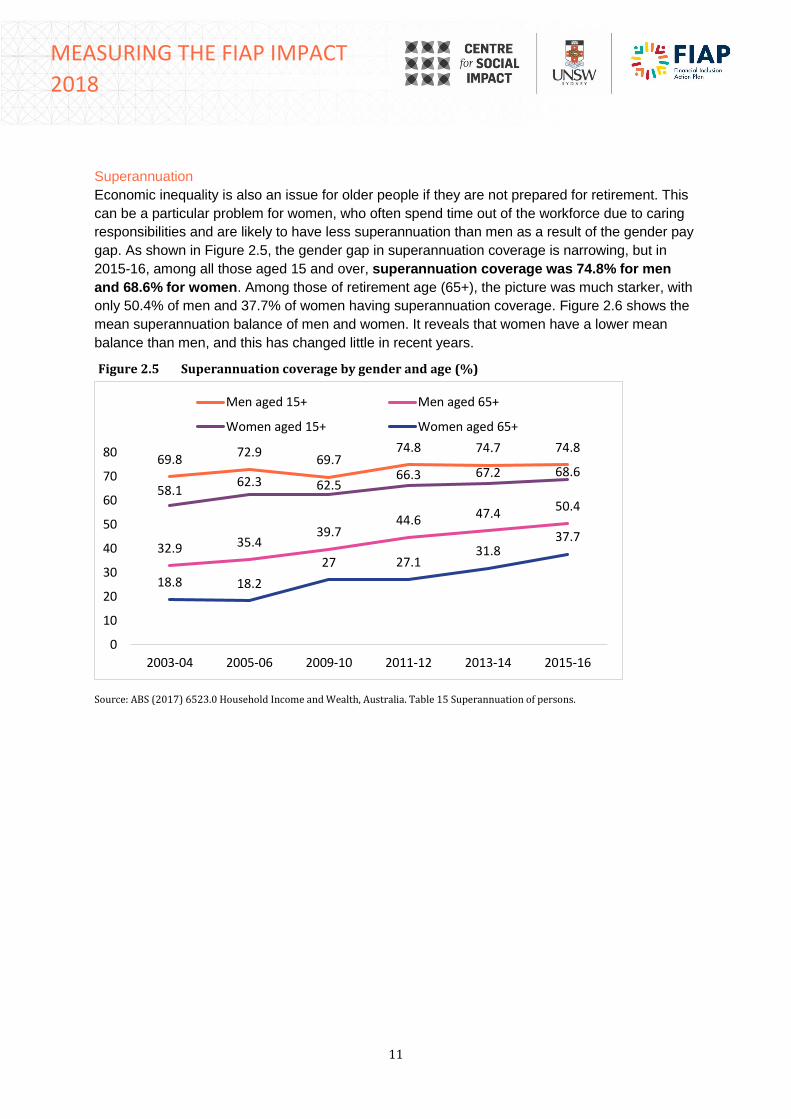
Superannuation
Economic inequality is also an issue for older people if they are not prepared for retirement. This
can be a particular problem for women, who often spend time out of the workforce due to caring
responsibilities and are likely to have less superannuation than men as a result of the gender pay
gap. As shown in Figure 2.5, the gender gap in superannuation coverage is narrowing, but in
2015-16, among all those aged 15 and over, superannuation coverage was 74.8% for men
and 68.6% for women. Among those of retirement age (65+), the picture was much starker, with
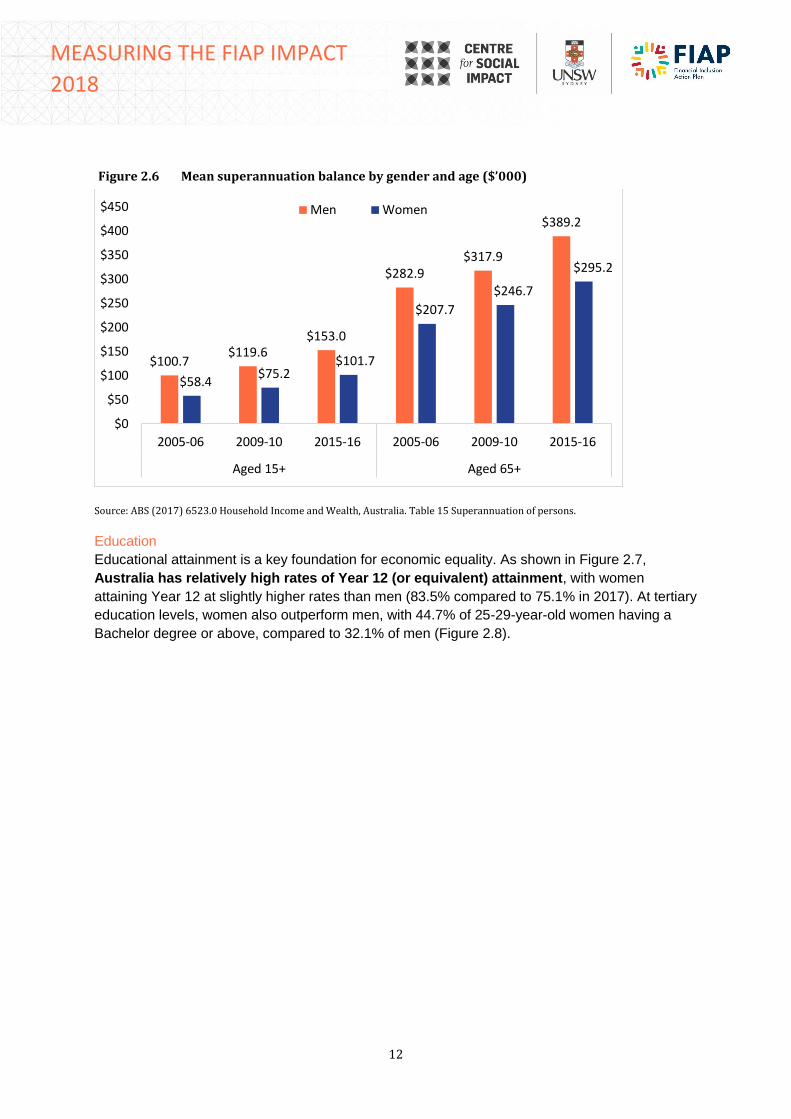
only 50.4% of men and 37.7% of women having superannuation coverage. Figure 2.6 shows the
mean superannuation balance of men and women. It reveals that women have a lower mean
balance than men, and this has changed little in recent years.
Figure 2.5 Superannuation coverage by gender and age (%)
Source: ABS (2017) 6523.0 Household Income and Wealth, Australia. Table 15 Superannuation of persons.
69.872.9
69.774.8 74.7 74.8
32.9 35.439.7
44.6 47.450.4
58.162.3 62.5
66.3 67.2 68.6
18.8 18.2
27 27.131.8
37.7
0
10
20
30
40
50
60
70
80
2003-04 2005-06 2009-10 2011-12 2013-14 2015-16
Men aged 15+ Men aged 65+
Women aged 15+ Women aged 65+
12
MEASURING THE FIAP IMPACT
2018
Figure 2.6 Mean superannuation balance by gender and age ($’000)
Source: ABS (2017) 6523.0 Household Income and Wealth, Australia. Table 15 Superannuation of persons.
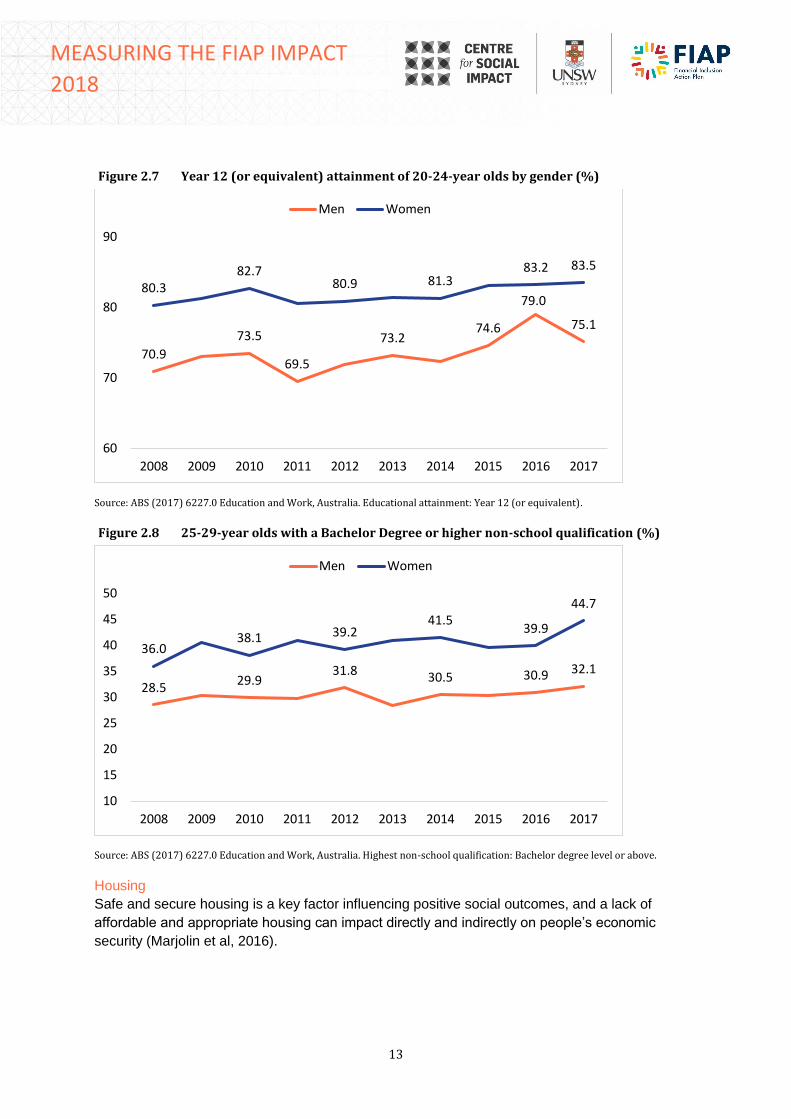
Education
Educational attainment is a key foundation for economic equality. As shown in Figure 2.7,
Australia has relatively high rates of Year 12 (or equivalent) attainment, with women
attaining Year 12 at slightly higher rates than men (83.5% compared to 75.1% in 2017). At tertiary
education levels, women also outperform men, with 44.7% of 25-29-year-old women having a
Bachelor degree or above, compared to 32.1% of men (Figure 2.8).
$100.7$119.6
$153.0
$282.9$317.9
$389.2
$58.4$75.2
$101.7
$207.7
$246.7
$295.2
$0
$50
$100
$150
$200
$250
$300
$350
$400
$450
2005-06 2009-10 2015-16 2005-06 2009-10 2015-16
Aged 15+ Aged 65+
Men Women
13
MEASURING THE FIAP IMPACT
2018
Figure 2.7 Year 12 (or equivalent) attainment of 20-24-year olds by gender (%)
Source: ABS (2017) 6227.0 Education and Work, Australia. Educational attainment: Year 12 (or equivalent).
Figure 2.8 25-29-year olds with a Bachelor Degree or higher non-school qualification (%)
Source: ABS (2017) 6227.0 Education and Work, Australia. Highest non-school qualification: Bachelor degree level or above.
Housing
Safe and secure housing is a key factor influencing positive social outcomes, and a lack of
affordable and appropriate housing can impact directly and indirectly on people’s economic
security (Marjolin et al, 2016).
70.9
73.5
69.5
73.274.6
79.0
75.1
80.382.7
80.9 81.383.2 83.5
60
70
80
90
2008 2009 2010 2011 2012 2013 2014 2015 2016 2017
Men Women
28.529.9
31.8 30.5 30.9 32.1
36.038.1 39.2
41.539.9
44.7
10
15
20
25
30
35
40
45
50
2008 2009 2010 2011 2012 2013 2014 2015 2016 2017
Men Women
14
MEASURING THE FIAP IMPACT
2018
Over the last few years there has been a decrease in housing ownership in Australia from
66.2% in 2001 to 62.0% in 2016 (ABS, 2016). This reflects increasing housing prices (ABS,
2015a), often reinforced by increased rental costs (ABS 2015b), which can make it even harder to
save for a home deposit. A recent study by the IMF (2015) indicated that Australian housing is
among the most expensive in the world.
Housing stress is also increasing, with people spending a larger proportion of their income on
housing (AIHW, 2017), limiting the amount of income left over for non-housing expenses
(ACOSS, 2016). Between 2001 and 2013, the average proportion of gross income spent on
housing costs increased from 17.7% to 25.0% (Marjolin et al, 2016). In 2013, approximately
16.7% of households were spending more than 30% of their income on housing. (Marjolin et al.
2016).
Financial inclusion and resilience
Debt and savings
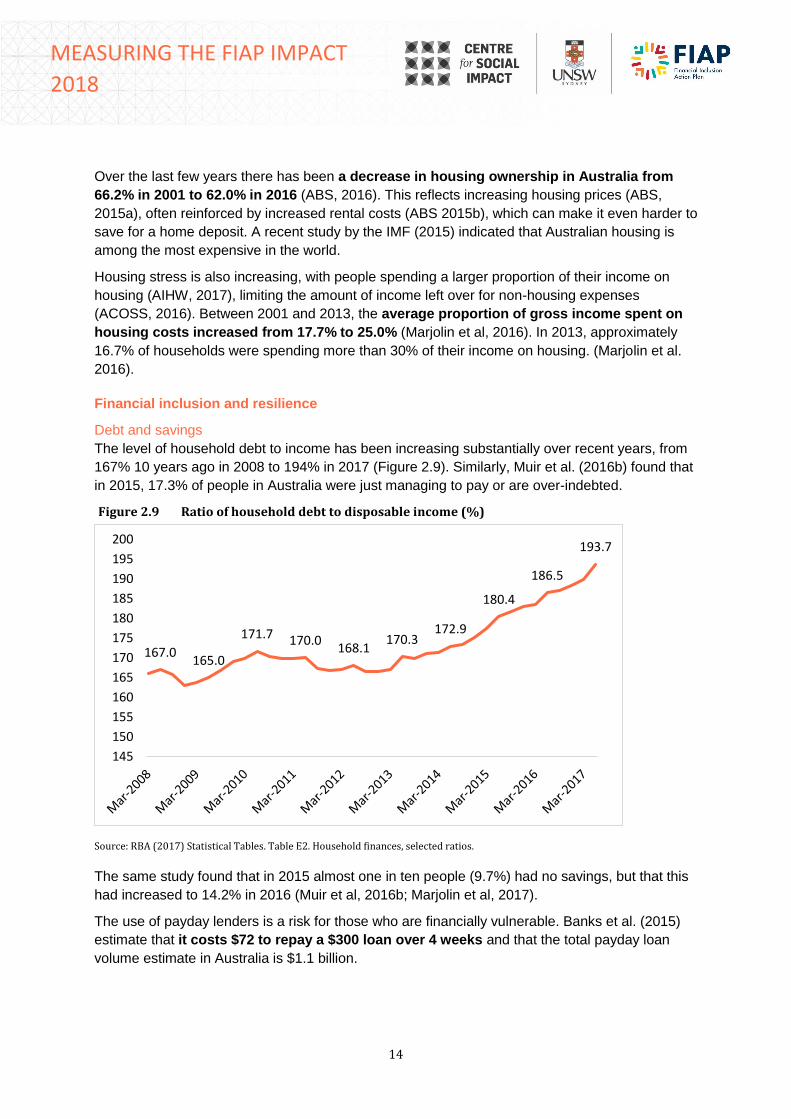
The level of household debt to income has been increasing substantially over recent years, from
167% 10 years ago in 2008 to 194% in 2017 (Figure 2.9). Similarly, Muir et al. (2016b) found that
in 2015, 17.3% of people in Australia were just managing to pay or are over-indebted.
Figure 2.9 Ratio of household debt to disposable income (%)
Source: RBA (2017) Statistical Tables. Table E2. Household finances, selected ratios.
The same study found that in 2015 almost one in ten people (9.7%) had no savings, but that this
had increased to 14.2% in 2016 (Muir et al, 2016b; Marjolin et al, 2017).
The use of payday lenders is a risk for those who are financially vulnerable. Banks et al. (2015)
estimate that it costs $72 to repay a $300 loan over 4 weeks and that the total payday loan
volume estimate in Australia is $1.1 billion.
167.0165.0
171.7 170.0168.1
170.3172.9
180.4
186.5
193.7
145
150
155
160
165
170
175
180
185
190
195
200
15
MEASURING THE FIAP IMPACT
2018
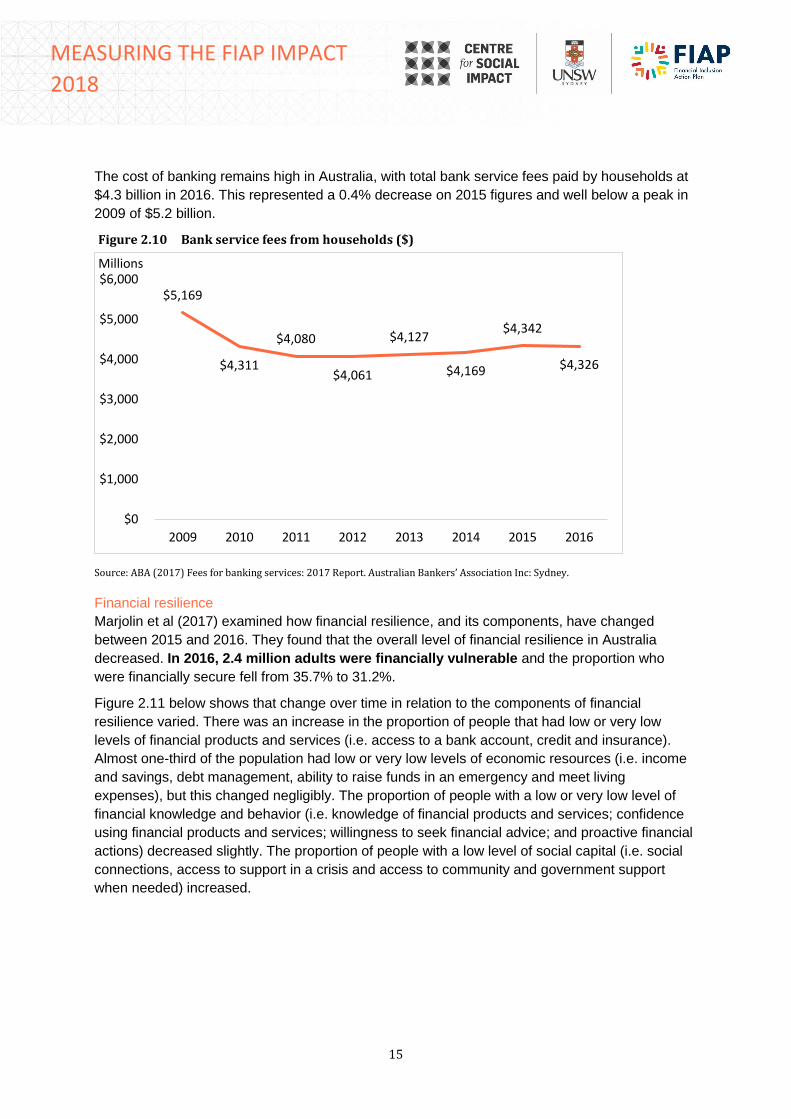
The cost of banking remains high in Australia, with total bank service fees paid by households at
$4.3 billion in 2016. This represented a 0.4% decrease on 2015 figures and well below a peak in
2009 of $5.2 billion.
Figure 2.10 Bank service fees from households ($)
Source: ABA (2017) Fees for banking services: 2017 Report. Australian Bankers’ Association Inc: Sydney.
Financial resilience
Marjolin et al (2017) examined how financial resilience, and its components, have changed
between 2015 and 2016. They found that the overall level of financial resilience in Australia
decreased. In 2016, 2.4 million adults were financially vulnerable and the proportion who
were financially secure fell from 35.7% to 31.2%.
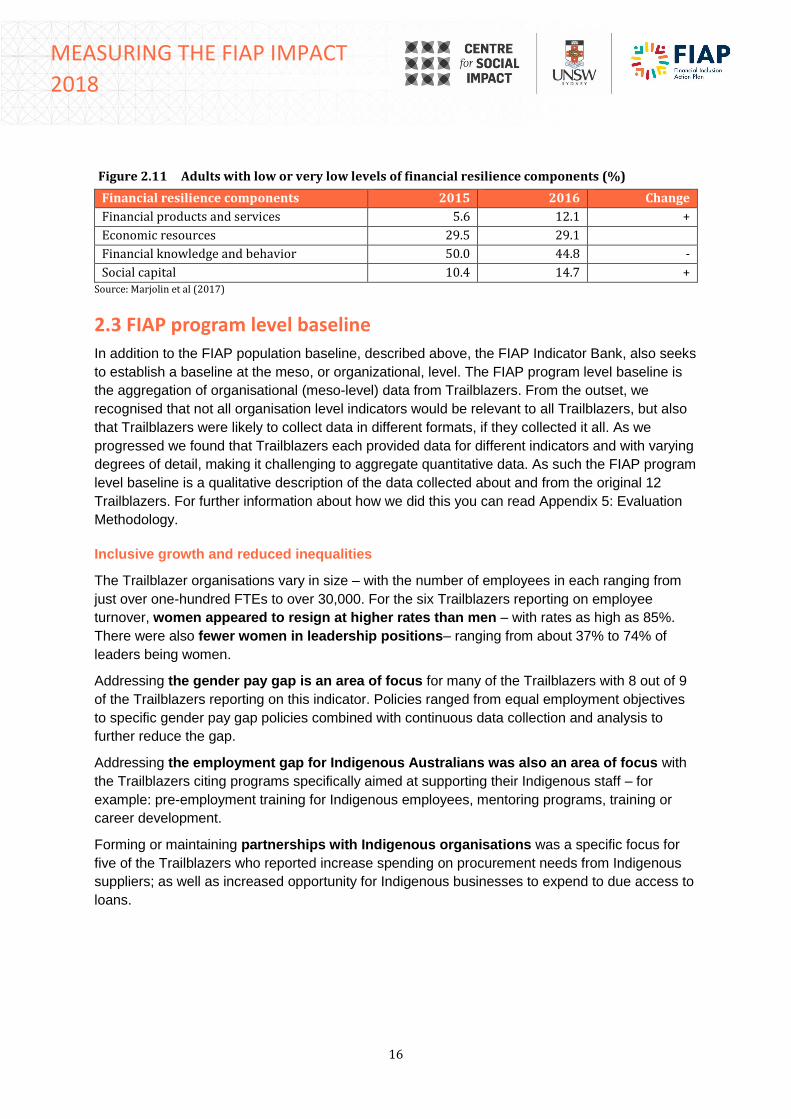
Figure 2.11 below shows that change over time in relation to the components of financial
resilience varied. There was an increase in the proportion of people that had low or very low
levels of financial products and services (i.e. access to a bank account, credit and insurance).
Almost one-third of the population had low or very low levels of economic resources (i.e. income
and savings, debt management, ability to raise funds in an emergency and meet living
expenses), but this changed negligibly. The proportion of people with a low or very low level of
financial knowledge and behavior (i.e. knowledge of financial products and services; confidence
using financial products and services; willingness to seek financial advice; and proactive financial
actions) decreased slightly. The proportion of people with a low level of social capital (i.e. social
connections, access to support in a crisis and access to community and government support
when needed) increased.
$5,169
$4,311
$4,080
$4,061
$4,127
$4,169
$4,342
$4,326
$0
$1,000
$2,000
$3,000
$4,000
$5,000
$6,000
2009 2010 2011 2012 2013 2014 2015 2016
Millions
16
MEASURING THE FIAP IMPACT
2018
Figure 2.11 Adults with low or very low levels of financial resilience components (%)
Financial resilience components 2015 2016 Change
Financial products and services 5.6 12.1 +
Economic resources 29.5 29.1
Financial knowledge and behavior 50.0 44.8 -
Social capital 10.4 14.7 + Source: Marjolin et al (2017)
2.3 FIAP program level baseline
In addition to the FIAP population baseline, described above, the FIAP Indicator Bank, also seeks
to establish a baseline at the meso, or organizational, level. The FIAP program level baseline is
the aggregation of organisational (meso-level) data from Trailblazers. From the outset, we
recognised that not all organisation level indicators would be relevant to all Trailblazers, but also
that Trailblazers were likely to collect data in different formats, if they collected it all. As we
progressed we found that Trailblazers each provided data for different indicators and with varying
degrees of detail, making it challenging to aggregate quantitative data. As such the FIAP program
level baseline is a qualitative description of the data collected about and from the original 12
Trailblazers. For further information about how we did this you can read Appendix 5: Evaluation
Methodology.
Inclusive growth and reduced inequalities
The Trailblazer organisations vary in size – with the number of employees in each ranging from
just over one-hundred FTEs to over 30,000. For the six Trailblazers reporting on employee
turnover, women appeared to resign at higher rates than men – with rates as high as 85%.
There were also fewer women in leadership positions– ranging from about 37% to 74% of
leaders being women.
Addressing the gender pay gap is an area of focus for many of the Trailblazers with 8 out of 9
of the Trailblazers reporting on this indicator. Policies ranged from equal employment objectives
to specific gender pay gap policies combined with continuous data collection and analysis to
further reduce the gap.
Addressing the employment gap for Indigenous Australians was also an area of focus with
the Trailblazers citing programs specifically aimed at supporting their Indigenous staff – for
example: pre-employment training for Indigenous employees, mentoring programs, training or
career development.
Forming or maintaining partnerships with Indigenous organisations was a specific focus for
five of the Trailblazers who reported increase spending on procurement needs from Indigenous
suppliers; as well as increased opportunity for Indigenous businesses to expend to due access to
loans.
17
MEASURING THE FIAP IMPACT
2018
Financial inclusion and resilience
Between them, the Trailblazers from financial services reported a total of about 3,300 bank
branches available per 100,000 people (between 20 to 1300 APRA points of access per
Trailblazers); and about 13,800 ATMs per 100,000 people (between 3,100 and 3,760 per
trailblazer).
The Trailblazers also provide a range of education focused programs aiming at supporting
vulnerable customers – these ranged from financial literacy programs to online banking
assistance. According to the data available, attendance at financial literacy programs ranged from
about 3,000 to 41,000 between 2015 and 2016. Four Trailblazers reported providing affordable
loans – these ranged from up to 57% of commercial loans to the provision of hardship programs
such as debt relief.
In addition to this, two of the Trailblazers reported that structures had been put in place for their
employees to better understand the needs and risks of financially excluded customers – for
example: internal strategy workshops and employee training.
2.4 Reflections and recommendations on the FIAP Indicator bank
At the population level, the indicators to be included in the FIAP Indicator bank should be
reviewed on a regular basis to ensure that they are consistent with international indicators
targeting economic equality and financial inclusion (with a particular focus on the SDG Indicators
and G20 Financial Inclusion Indicators). At the same time, it is important that the indicators used
are also relevant to the Australian context, with a number of international indicators having a
focus on developing countries.
At the organisational level, there were a number of indicators where Trailblazers were able to
provide no, or very limited, data. Datasets were also very diverse across organisations. This
demonstrated a potential lack of clarity on what was required of Trailblazers in completing the
indicator bank. Indicators where this was the case included:
• Employee retention rate
• Average customer debt
• Savings incentives
• Cost of financial services
• Face-to-face services
• Number of staff undertaken training around financial inclusion and resilience
• Number of staff undertaken training to understand needs and risks of financially excluded
customers
• Proportion of women clients accessing two or more distinct types of voluntary financial
products
• Amount spent on Indigenous business
• Number of clients attending financial literacy programs
• Proportion of women clients who attended financial education programs
• Initiatives are accessible and appropriate
18
MEASURING THE FIAP IMPACT
2018
• Take up of products and services to support those in financial hardship.
Simplification and customisation
Based on this, there is a need to improve the description of data required in future iterations
of the FIAP Indicator bank, in order to ensure consistency across organisations. This could be
achieved by adding some pre-questions for organisations. For example, does your organisation
deliver any financial literacy programs? If yes, how many clients attended your programs in the
last year? Another example, is employee retention, which may need to be more specific, for
example, employees returning after parental leave; or employee turnover, may be revised to
male: female employee turnover rate.
While it may be helpful to map indicators against FIAP outcome areas and move the dial
strategies in terms of justifying the inclusion of indicators and in presenting the final indicator
bank, feedback suggests this may be a distraction for organisations completing their own
indicator bank. We recommend turning the indicator bank into a simple questionnaire for
organisations to complete. This would also enable us to hide any questions that are not relevant
to specific organisations.
As with Quality Assurance it may also be appropriate to ask organisations to provide quantitative
data and commentary in a separate column. In the example above, organisations could briefly
describe their literacy programs if they chose to.
Improved guidelines for completion
In addition, future evaluation should include a very brief description for each indicator to explain
its value. For example, ‘evidence tells us that people with higher levels of financial literacy have
higher levels of financial inclusion and resilience. Do you offer any initiatives or programs to
improve financial literacy? If yes, how many people attended these programs in the last financial
year? This is important because there are multiple data custodians within organisations, who may
be reluctant to provide data without clear purpose or justification.
We need to acknowledge that different organisations may have different reporting periods, so
guidelines for completion should note that ‘last year’ relates to your organisation’s last full
reporting year (for example, this could be Jan-Dec for some organisations or Jul-Jun for others).
Ensure indicators are meaningful
Indicators need to be relevant and meaningful to the Australian context. In drawing on
external sources to develop the indicator bank, including international indicators, some indicators
may be less relevant to the Australian context. One example of this is ‘face-to-face’ services. In
Australia, many organisations are reducing their face-to-face services as consumer preference is
switching to digital channels. Accessibility of services may therefore be a more relevant and
meaningful indicator.
19
MEASURING THE FIAP IMPACT
2018
Individual level indicators
The majority of Trailblazers found it hard to distinguish between organisation and individual level
indicators. We distinguish between the two by suggesting that individual level indicators are
metrics that can be collected from individuals or groups of individuals (e.g. via staff or client
surveys). While individual (micro) level indicators are important, the collection of individual level
data was a challenge for Trailblazers in Phase One. This appeared to be because these
indicators were primarily subjective measures, meaning that the only way to know the answer is
by speaking to or surveying individuals.
At the current time, Trailblazers are not necessarily in a position to do this. We therefore
recommend excluding individual level indicators from the indicator bank in the short term. In
subsequent phases of FIAP, we will look to develop a survey for staff and clients of Trailblazer
organisations to collect data for the FIAP program and measure individual level indicators. In the
shorter term, this may include developing a set of questions that Trailblazers can choose from to
include in any existing staff or customer surveys they have3. This would include questions to
measure economic resources, financial knowledge and behaviours, access to financial products
and services, and social capital.
A revised FIAP indicator bank
For an improved indicator bank to be used in future years of the FIAP evaluation, see Appendix
2: Draft proposal for revised indicator bank. This indicator bank seeks to address many of the
challenges identified above, as well as recognizing that at this early stage in the FIAP program,
Trailblazers are still developing how they measure and report on their FIAPs. Overtime, as
Trailblazers further develop both their actions and the measurement of their actions, the indicator
bank should also be adapted to ensure it is capturing robust data that can be aggregated across
organisations and sectors.
3 Relevant surveys mentioned by organisations included for example, annual staff engagement surveys, adhoc customer surveys, e.g. about products and services. One trailblazer has a survey panel that could be used for this purpose.
20
MEASURING THE FIAP IMPACT
2018
IMPACT EVALUATION: PRELIMINARY OUTCOMES
The FIAP Theory of Change identifies a number of short-term outcomes (12-months). In Phase
One of the FIAP program, we do not yet expect to see significant changes in any outcomes,
including short-term outcomes. Nevertheless, in this chapter we examine some preliminary
outcomes.
3.1 Targeted FIAP actions
In the development of the FIAP program a number of key target population groups were identified
as financially excluded or vulnerable. This included women, Aboriginal and Torres Strait Islander
people, those on low incomes, people with a disability, refugees and those from a non-English
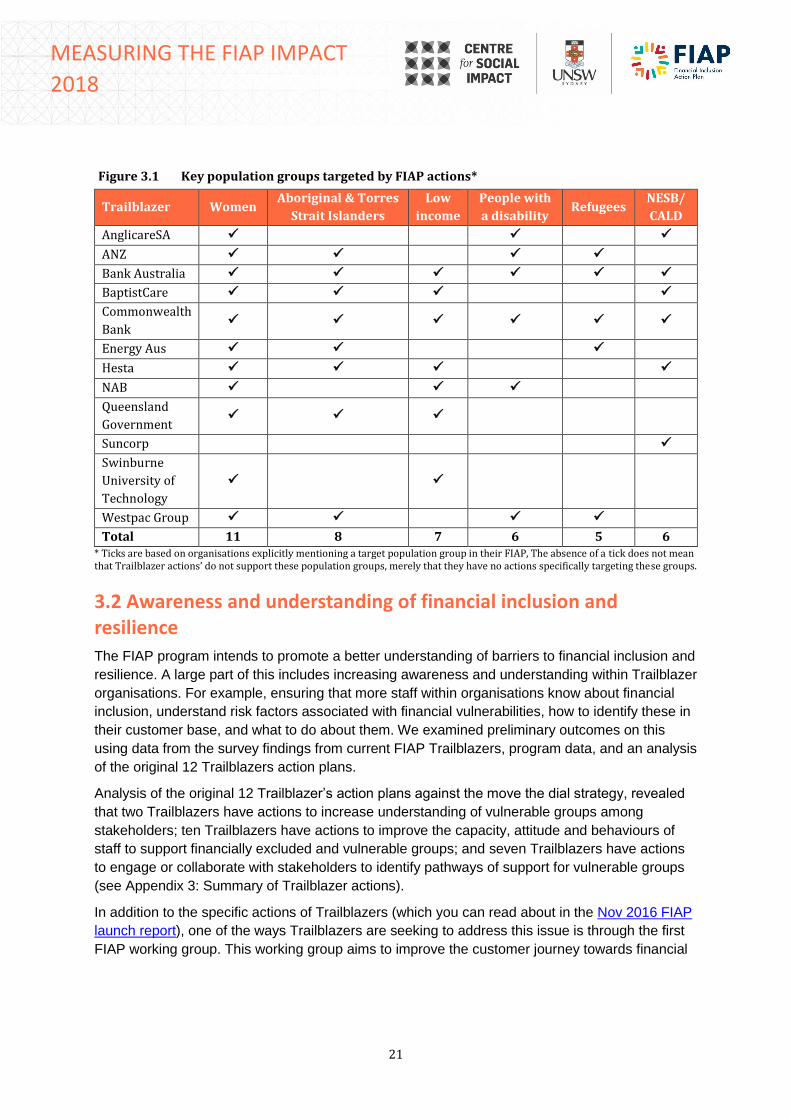
speaking background. As shown in Figure 3.1, the action plans of the original 12 Trailblazers had
good coverage of these groups. In addition, a number of other population groups were targeted
by FIAP action plans, these are detailed in Appendix 3: Summary of Trailblazer actions, but
included survivors of domestic violence (including financial abuse), those affected by natural
disasters, young people and retirees.
We also mapped the actions of the original 12 Trailblazers to the ten ‘move the dial strategies’
identified in the FIAP Measuring concepts and baseline report. All 12 Trailblazers had actions
linked to improving access to financial products and services and supporting customers
in times of need. Ten out of 12 Trailblazers also had actions that aimed to build financial
knowledge, skills and capabilities of vulnerable groups and to improve the capacity, attitude and
behaviours of staff to support financially excluded and vulnerable groups (see Appendix 3:
Summary of Trailblazer actions).
21
MEASURING THE FIAP IMPACT
2018
Figure 3.1 Key population groups targeted by FIAP actions*
Trailblazer Women Aboriginal & Torres
Strait Islanders
Low
income
People with
a disability Refugees
NESB/
CALD
AnglicareSA ✓ ✓ ✓
ANZ ✓ ✓ ✓ ✓
Bank Australia ✓ ✓ ✓ ✓ ✓ ✓
BaptistCare ✓ ✓ ✓ ✓
Commonwealth
Bank ✓ ✓ ✓ ✓ ✓ ✓
Energy Aus ✓ ✓ ✓
Hesta ✓ ✓ ✓ ✓
NAB ✓ ✓ ✓
Queensland
Government ✓ ✓ ✓
Suncorp ✓
Swinburne
University of
Technology
✓ ✓
Westpac Group ✓ ✓ ✓ ✓
Total 11 8 7 6 5 6 * Ticks are based on organisations explicitly mentioning a target population group in their FIAP, The absence of a tick does not mean that Trailblazer actions’ do not support these population groups, merely that they have no actions specifically targeting these groups.
3.2 Awareness and understanding of financial inclusion and resilience
The FIAP program intends to promote a better understanding of barriers to financial inclusion and
resilience. A large part of this includes increasing awareness and understanding within Trailblazer
organisations. For example, ensuring that more staff within organisations know about financial
inclusion, understand risk factors associated with financial vulnerabilities, how to identify these in
their customer base, and what to do about them. We examined preliminary outcomes on this
using data from the survey findings from current FIAP Trailblazers, program data, and an analysis
of the original 12 Trailblazers action plans.
Analysis of the original 12 Trailblazer’s action plans against the move the dial strategy, revealed
that two Trailblazers have actions to increase understanding of vulnerable groups among
stakeholders; ten Trailblazers have actions to improve the capacity, attitude and behaviours of
staff to support financially excluded and vulnerable groups; and seven Trailblazers have actions
to engage or collaborate with stakeholders to identify pathways of support for vulnerable groups
(see Appendix 3: Summary of Trailblazer actions).
In addition to the specific actions of Trailblazers (which you can read about in the Nov 2016 FIAP
launch report), one of the ways Trailblazers are seeking to address this issue is through the first
FIAP working group. This working group aims to improve the customer journey towards financial
22
MEASURING THE FIAP IMPACT
2018
resilience. Its terms of reference are to build on the expertise of FIAP members in different
sectors in order to: i) map existing referral pathways, identifying organisations that can be
engaged at different moments and gaps in the systems; ii) develop a more refined understanding
of the journey of specific groups of vulnerable customers, such as Aboriginal and Torres Strait
Islander peoples, or those experiencing family violence, housing stress or homelessness.
The survey findings from existing FIAP Trailblazers revealed, 72% of respondents agreed that,
as a result of FIAP, people in their organisation have a better understanding of financial
inclusion (8% strongly agreed and 64% agreed). This is described further below in the process
evaluation where we discuss trailblazer’s motivations for participating in FIAP.
3.3 Awareness and emulation of the FIAP program
One of the intended outcomes of FIAP is that there is increased awareness of the FIAP program
in Australia. Increased awareness is a critical step on the pathway to FIAP actions being
emulated by others, and the FIAP program being an advocate for policy and regulatory change. A
measure of FIAP’s success will be if, and when, FIAP actions become industry norms and
influence structural change.
Here we draw on data from Good Shepherd Microfinance and survey findings from existing FIAP
Trailblazers.
Awareness raising
Awareness raising about FIAP has included a wide-ranging media campaign. There have been at
least 36 media articles promoting FIAP (see Appendix 4: FIAP Media coverage) and two blog
posts. As at early December 2017, the FIAP webpage on the Good Shepherd Microfinance
website had 6,195 views, including 4,695 unique page views and an average visit length of 2
minutes and 56 seconds. FIAP also hosted a webinar in November 2017 on Collaborative
Action for Results with 110 registrations and 61 people participating on the day. The webinar
was hosted as part of Financial Inclusion Week.
In addition to this, there are currently 13 organisations, referred to as ‘friends of FIAP’ that
are ready to join FIAP. These organisations will join FIAP in phase 2, when the existing 18
Trailblazers with statements of commitment have launched their action plans.
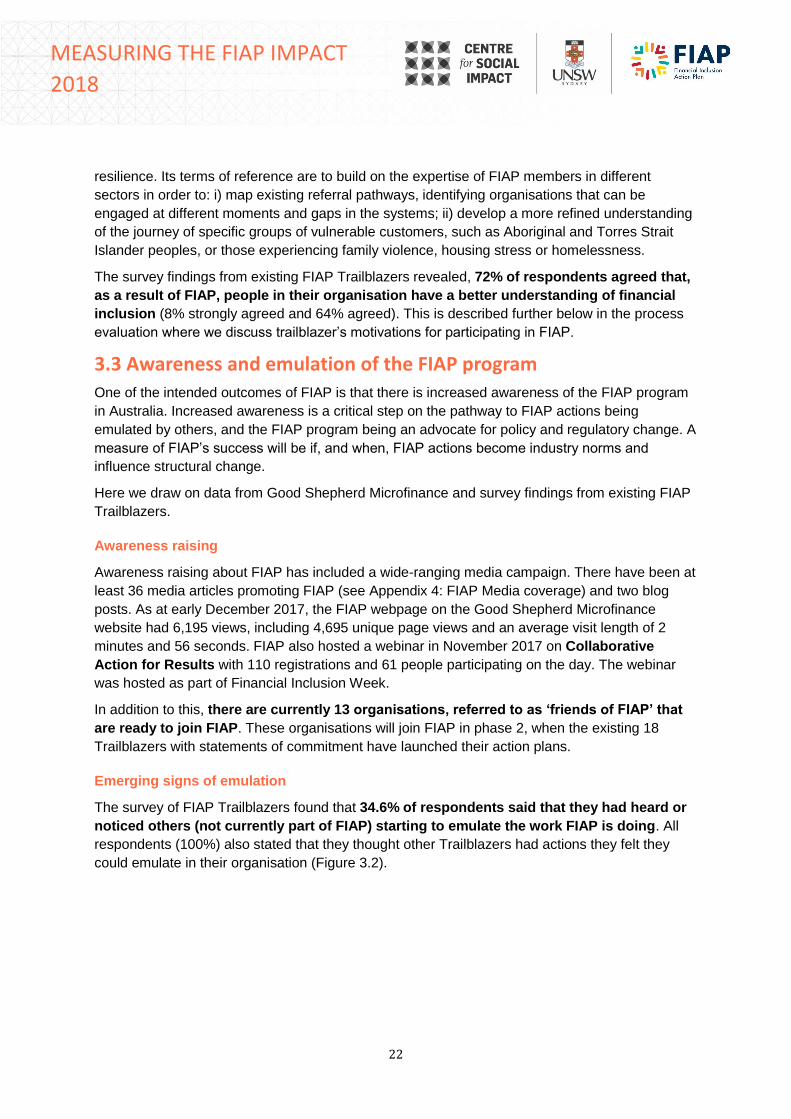
Emerging signs of emulation
The survey of FIAP Trailblazers found that 34.6% of respondents said that they had heard or
noticed others (not currently part of FIAP) starting to emulate the work FIAP is doing. All
respondents (100%) also stated that they thought other Trailblazers had actions they felt they
could emulate in their organisation (Figure 3.2).
23
MEASURING THE FIAP IMPACT
2018
Figure 3.2 Emulation: Trailblazer survey findings (%)
Notes: n=28.
3.4 Collaboration
A key element of the FIAP program, also discussed in the process evaluation findings, is
increased engagement and collaboration within and between industries.
Collaboration within FIAP is facilitated through the FIAP Community of Practice meetings
that are held quarterly and five special issue working groups that provide an opportunity for
Trailblazers to get more involved in specific elements of FIAP. In addition to this, FIAP
Trailblazers have maintained and developed new relationships within the FIAP network to work
on particular initiatives.
Interviews with Trailblazers revealed that the opportunity to collaborate with, and learn from, other
Trailblazers was a critical feature of FIAP for them.
This was supported by a survey of Trailblazers, where 76% of respondents said they had
engaged with other FIAP Trailblazers outside of the Community of Practices and working
groups (20/26). This included activities such as:
• Informal discussions about potential collaborative opportunities around shared interests
• Sharing information
• Discussions and collaboration regarding specific activities or projects, some of which
existed prior to FIAP.
In addition, 50% of respondents said they had promoted or referred the FIAP program to
other people or organisations (13/26). This included:
36.0
7.7
3.8
64.0
50.0
30.8
7.7
7.7
34.6
57.7
0 50 100
Other TBs have FIAP actions I think wecould emulate in our org
I have noticed other orgs (not FIAP) aredoing things around financial inclusion Iwould like to know more about
I have heard/noticed others (not FIAP) arestarting to emulate the work FIAP is doing
Strongly agree Agree Disagree Strongly disagree I don't know
24
MEASURING THE FIAP IMPACT
2018
• Talking about FIAP at industry forums
• Promoting FIAP internally within their organisation.
65% of respondents (17/26) said they had been involved in other programs related to financial
inclusion and resilience beyond FIAP. This included:
• Ongoing activities that were in place prior to FIAP
• Attending events held by others outside FIAP (e.g. RMIT, Brotherhood of St Laurence,
ASIC)
• Involvement in other programs that have related objectives including Reconciliation Action
Plan and the Thriving Communities Partnership.

25
MEASURING THE FIAP IMPACT
2018
PROCESS EVALUATION FINDINGS
The process evaluation is part of understanding the processes involved in establishing and
implementing FIAP. It examines the facilitators and barriers to FIAP’s effective establishment,
implementation and helps understand the circumstances under which change occurs and for
whom. The findings from the process evaluation emerged via interviews and surveys of the
original 12 Trailblazers and the FIAP Advisory group.
4.1 Motivations and expectations about FIAP
Understanding the motivations and expectations of those participating in FIAP is important firstly
to ascertain whether there is a shared vision about the purpose of FIAP, and secondly, so that we
can measure whether expectations are met as FIAP progresses.
Although all of the original 12 Trailblazers have been
doing work related to financial inclusion previously,
albeit to varying degrees, Trailblazers described in
interviews how FIAP had enabled them to rearticulate
and/or strengthen their strategy and approach to
financial inclusion.
Trailblazers’ motivations to address financial inclusion
were motivated by a range of factors, including a desire
for some to support specific vulnerable groups or
communities such as Indigenous Australians, people experiencing family violence, refugees,
women, staff and customers experiencing hardship and inequity generally. This is reflected in the
organisational FIAPs (see Figure 3.1 and Appendix 3: Summary of Trailblazer actions).
The desire to tackle financial inequalities and exclusion was motivated by evidence regarding
the scale of the problem, wanting to take a proactive rather than reactive approach to the issue
and a sense that their organisation could not afford not to be part of it.
More than half of the Trailblazers interviewed also
described FIAP as an internal lever; an opportunity to
raise awareness of financial inclusion and work they
were often already doing in relation to this within other
parts of their business.
As mentioned previously, the opportunity to
collaborate with others was one of the most popular
features of FIAP. This included the recognition that
responsibility for financial inclusion did not just rest on
financial institutions, that perhaps some organisations
could bring an alternative perspective to the table and
help others think outside the box, and that there may
“FIAP has enabled us to take what we do to the next level.”
“FIAP is an opportunity to amplify our core value and direction.”
“FIAP has helped us articulate [financial inclusion] across the business.”
[FIAP] “increases the sense of urgency around the work we’re doing.”
[FIAP] “holds a mirror up to what we’re doing.”
26
MEASURING THE FIAP IMPACT
2018
be actions that others are taking that their organisation
could build on.
One interviewee reported that the value of sharing
insights with each other ‘makes [our] collective effort
stronger’. Interviews with the advisory group echoed this,
with advisory members stating they were excited by the
potential of organisations working together for social
good. They also indicated that they saw FIAP as an
opportunity to bring existing work together under one umbrella (both within and across
organisations).
Other key features of FIAP were the ability to understand impact and measure the outcomes
of FIAP, developing further understanding of the drivers that lead to financial hardship and
exclusion, and what might shift this, and ultimately identify and address any gaps in their own
work around financial inclusion.
Trailblazers also acknowledged that participating in FIAP was a chance to improve the
reputation of their organisation and increase trust in their brand more generally.
The FIAP Advisory Group interviews also revealed some more holistic aspirations and
expectations, with interviewees hoping that short-term outcomes would include consistent
agreement about the FIAP program’s purpose; embedding institutional change and helping
organisations identify meaningful ways they can make a difference; scaling up the number and
range of organisations involved in FIAP; ensuring organisations are committed to developing
actions and implementing them; ensuring organisations are responsive to customers who have
traditionally been financially excluded.
Longer-term there was recognition that real, meaningful change to financial inclusion and
resilience would take time and not necessarily be observable for a number of years.
Nevertheless, Advisory Group members spoke of long-term outcomes such as improvements in
financial exclusion, shifting the numbers of people experiencing financial exclusion and hardship;
actions that address the causes of financial exclusion not just symptoms; emulation of FIAP
actions by others; FIAP becoming an embedded framework in a similar way to Reconciliation
Action Plans; and Australia impacting the Sustainable Development Goals.
4.2 Enablers and barriers to the success of FIAP
Trailblazers and the Advisory Group were asked in interviews about what they thought were the
enablers and barriers to the success of FIAP. Enablers and barriers were generally the same, but
the flip-side of an issue. For example, if an enabler was ‘sufficient funding’, the barrier was lack
[FIAP is an opportunity…] “to join the dots, apply a more strategic approach and scale impact.”
“Being involved in a federally funded initiative is good for our reputation.”
“Customers will see us as responsive to their needs”
27
MEASURING THE FIAP IMPACT
2018
of, or ‘insufficient, funding’. Enablers and barriers were discussed in relation to the establishment
and implementation of the FIAP program as a whole and of Trailblazers organisational FIAPs.
Establishing and implementing organisational FIAPs
At an organisational level internal resourcing was seen as a key issue. This was discussed both
in terms of the time and funding required to be dedicated to both developing a FIAP and
carrying out the actions. This was felt to be a concern in the context of competing priorities for
resources within organisations and not wanting FIAP to fall off the agenda within their
organisation. Some Trailblazers noted that the effort to put together their FIAP was considerable,
and that for new organisations, it cannot be seen as too hard, otherwise this will be a barrier to
participation.
This was also discussed in terms of the challenge of attending multiple meetings or full day
meetings for the broader FIAP program, which was seen as a big resource cost for some
organisations, particularly smaller businesses and not-for-profit organisations.
Trailblazers also discussed the need to achieve internal buy-in from parts of the organisation
that may not directly be involved in establishing the FIAP, but whose time, effort and resources
may be required to deliver committed actions. This was felt to be a particular challenge in larger
companies with multiple divisions.
Collaboration between Trailblazers was also seen as a
facilitator to achieving impact, in that one of the values
of FIAP should be that it is more than a collection of
organisations working on financial inclusion in siloes.
Related to collaboration was the ability to learn about
what works and what doesn’t, including from Trailblazers
working in different sectors.
The development of FIAP working groups was in part to
fulfil this need, alongside the Community of Practice more
broadly. However, some Trailblazers also mentioned the
need to develop evidence-based practice and that it may
not be necessary to reinvent the wheel if other
Trailblazers have already developed innovative solutions they could emulate.
Furthermore, interviews with Trailblazers revealed a need for clearer expectations and
accountability of the working groups to ensure that everyone understood the purpose of each
group and the actions that needed to occur as a result. Another trailblazer suggested that more
facilitated discussion at Communities of Practices, to enable the organisations to get to know
each other and determine where there may be opportunities for collaboration, would be useful.
“The effort to pull our FIAP together was considerable; it can’t be seen as too hard.”
“The value of sharing insights with each other ‘makes the collective effort stronger’.”
“Without collaboration the risk is that the impact won’t be there, if we’re all working separately.”
28
MEASURING THE FIAP IMPACT
2018
Potential improvements
When asked what they would have done to improve the establishment of the FIAP internally, two
Trailblazers said they would make it more directly a part of their organisation’s strategy, while
another stated they would have started developing their FIAP earlier, and another that they would
have made their FIAP less ambitious and more focused. Others spoke about the support they
received from the FIAP Implementation team and reflected that while critical, clearer guidelines
about the FIAP development process would have been useful. Trailblazers also discussed the
need to balance the desire for commonality among Trailblazers with flexibility, recognising that
different Trailblazers may want to take slightly different approaches.
As a result of this feedback (and feedback received via the quality assurance process), the
process for developing an organisational FIAP has been improved and more clearly
documented for Trailblazers. This includes recommendations around aligning actions with the
organisation’s strategy.
In relation to implementation, a number of survey respondents indicated they would like a
dedicated FIAP resource and allocated budget.
Establishing and implementing the FIAP program
Trailblazers and the advisory group also reflected on the establishment and implementation of the
FIAP program as a whole.
Having a clear value proposition was seen as a key facilitator for
the FIAP program, particularly in terms of scaling-up the program.
That is, making it clear why organisations should participate in FIAP,
and recognising this might be different for different sectors.
Trailblazers believed that for businesses to commit to FIAP, it could
not just be a philanthropic exercise and there need to be value to the
business. For example, thinking about the positive impact that more
affordable and accessible financial products might have on business.
FIAP stakeholders reported that this was important to help them gain
internal leverage but is equally likely to be relevant in engaging new
organisations to participate in FIAP. Similarly, Trailblazers described
the need for the value of participating in FIAP to outweigh the cost,
including what it takes to create initial FIAP and ongoing compliance,
reporting. Advisory group members described this in terms of
ensuring that FIAP resonates with people and is something organisations want to be a part of.
Around half of Trailblazers stated that losing the FIAP momentum would be a barrier, with
concerns that it could be challenging to keep FIAP on the agenda over the long-term.
“Does making products more affordable/ accessible have a positive impact on business? It can't just be a philanthropic exercise.”
29
MEASURING THE FIAP IMPACT
2018
The role of the secretariat was seen as
instrumental to the establishment and
ongoing implementation of FIAP, but one
that required funding. Trailblazers
recognised that FIAP required someone (or
an organisation) to drive and oversee the
program.
Trailblazers believed that the ability to
identify and measure the impact and
success of FIAP was an important
facilitator. However, there were concerns
about a potential lack of data, ensuring
there were common measures across
organisations, and the ability to attribute
any change to the FIAP program. For
example, how do we know that any population changes we identify are a result of FIAP, when
there are other external influences, including potential changes in the broader economy, and
others doing work in financial inclusion, but who are not part of the FIAP program.
Potential improvements
Respondents were overwhelmingly positive about the FIAP program as a whole, but there
was a desire for greater clarity regarding the future of FIAP and its roadmap or strategy. For
example, one survey respondent reflected that there needed to be a clearer strategy about
organisations targeted for participation in FIAP, believing there should be more focus on creating
the most impact, for example by getting large scale organisations involved, rather than smaller
organisations with limited resources, or organisations whose activity is already financially
inclusive, limiting the opportunity to shift the dial.
A related concern was that the FIAP program should not grow too fast in terms of participating
organisations until there is a clearer pathway to program sustainability. Potential improvements
around keeping up the FIAP momentum discussed by Trailblazers was the need for greater
visibility/profile around FIAP, with direct comparison made to the Reconciliation Action Plans.
Similarly, another commented that they would like to have some FIAP materials that they can
share with others about what FIAP is and how they can get involved.
“I think the approach of GSM working with a number of external organisations and getting each of them onboard to have their own organisational FIAPs and drive this change through their organisations and external from this within their specified industry has been fantastic.”
[It’s] “too much to ask from any organisation to oversee an initiative like this.”
30
MEASURING THE FIAP IMPACT
2018
SUMMARY: WHAT HAVE WE LEARNT IN PHASE ONE OF THE FIAP PROGRAM
The evaluation of Phase One of the FIAP program has demonstrated that the FIAP profile and
pipeline is building. Newer Trailblazers are finding out about the FIAP program largely by word
of mouth from other Trailblazers and there is a waitlist of organisations that have expressed an
interest in joining phase two of the program. The program is also increasing awareness and
understanding of financial inclusion and resilience within Trailblazer organisations, with
72% of Trailblazers reporting this.
Critically, FIAP is not just a group of organisations tackling financial inclusion under one
umbrella – interviews with Trailblazers demonstrate a strong desire to collaborate and learn
from others, making the FIAP program more than the sum of its parts. Three-quarters of survey
respondents in the evaluation said they had engaged with other trailblazers beyond the formal
mechanisms facilitated by the program.
The evaluation revealed a number of challenges and opportunities to improve, which we will be
tackling over the coming months. These include the need for:
• Ongoing organisational commitment and resourcing, both in terms of time and funding • A clear roadmap and value proposition, recognising this may be different for different
sectors • Ongoing support from a FIAP secretariat is instrumental to drive the program into the
future. Continued commitment for the FIAP program is likely to depend on achieving its short-
term outcomes, yet attributing population-level change to actions is challenging. Instead, FIAP
Evaluation can point to program contribution by:
i) Measuring collective FIAP actions through outcomes measurement at an aggregated
organisational level ii) Mapping other factors that could be contributing to change.
This approach will require ongoing commitment from Trailblazers to collect and report on
outcomes data, as well as innovative solutions to monitoring and capturing data for evaluation,
but this is precisely the point of FIAP.

31
MEASURING THE FIAP IMPACT
2018
REFERENCES ABS. (2015a). Residential Property Price Indexes: Eight capital cities, cat. no. 6416.0 [Online]. Australian
Bureau of Statistics: Canberra. Available: http://www.abs.gov.au/AUSSTATS/[email protected]/Lookup/6416.0Main+Features1Jun%202015?OpenDocument.
ABS. (2015b). Key findings - Housing Occupancy and Costs, cat. no. 4130.0 [Online]. Australian Bureau of Statistics: Canberra. Available: http://www.abs.gov.au/AUSSTATS/[email protected]/Lookup/4130.0Main+Features12013-14?OpenDocument
ACOSS (2016). Poverty in Australia 2016. NSW, Australia: Australian Council of Social Service. Available: https://www.acoss.org.au/wp-content/uploads/2016/10/Poverty-in-Australia-2016.pdf
AIHW (2017). Housing assistance in Australia 2017. Canberra: Australian Institute of Health and Welfare. Available: https://www.aihw.gov.au/reports/housing-assistance/housing-assistance-in-australia-2017/contents/housing-assistance-why-do-we-need-it-and-what-supports-exist
Banks, M., De Silva, A., and Russell, R. (2015) Trends in the Australian Small Loan Market. Commissioned paper series for the Australian Centre for Financial Studies. RMIT University: Melbourne. Available: https://australiancentre.com.au/wp-content/uploads/2015/10/Commissioned-paper-Trends-in-the-Australian-small-loan-market.pdf
Good Shepherd Microfinance (2016) Collective Actions, Leading Change. Financial Inclusion Action Plan (FIAP) Launch Report. November 2016, Good Shepherd Microfinance: Melbourne. Available: http://goodshepherdmicrofinance.org.au/researchreports/collective-actions-leading-change/
IMF. (2015). House price-to-income ratio around the world [Online]. International Monetary Fund. Available: http://www.imf.org/external/research/housing/
Marjolin, A., Muir, K., Ramia, I., and Powell, A. (2017) Why is financial stress increasing? Financial Resilience in Australia 2016 – Part 1, Centre for Social Impact (CSI) at UNSW Sydney, for National Australia Bank. Available: http://www.csi.edu.au/financialresilience/
Marjolin, A., Reeve, R., Flatau, P. and Weier, M. (2016) Housing and homelessness. In Reeve, R., Marjolin, A., Muir, K., Powell, A., Hannigan, N., Ramia, I. and Etuk, L. (Eds.) (2016) Australia’s Social Pulse. Centre for Social Impact: UNSW Australia, Sydney and UWA, Perth. Available: http://amplify.csi.edu.au/pulse/download/
Muir, K. and Bennett, S. (2014) The Compass: Your guide to social impact measurement. Centre for Social Impact, UNSW Australia. Sydney. Available: http://www.csi.edu.au/research/project/compass-your-guide-social-impact-measurement/
Muir, K., Marjolin, A., Reeve, R., Powell, A. and Etuk, L. (2016a) Evaluation Framework Part I: FIAP Concepts and Population Baseline. Centre for Social Impact, UNSW: Sydney. Available: http://www.csi.edu.au/fiap
Muir, K., Reeve, R., Connolly, C., Marjolin, A., Salignac, F. and Ho, K. (2016b) Financial Resilience in Australia 2015, Centre for Social Impact (CSI) – University of New South Wales, for National Australia Bank. Available: http://www.csi.edu.au/financialresilience/
Powell, A., Marjolin, A., Etuk, L. and Ramia, I. (2017) Evaluation Framework Part II: Measuring the FIAP Impact. Centre for Social Impact, UNSW: Sydney. Available: http://www.csi.edu.au/fiap
32
MEASURING THE FIAP IMPACT
2018
WGEA (2017a) Australia’s gender pay gap statistics. August 2017. Australian Government, Workplace Gender Equality Agency: Sydney. Available at: https://www.wgea.gov.au/sites/default/files/gender-pay-gap-statistics.pdf
WGEA (2017b) Australia’s gender equality scorecard. Key findings from the Workplace Gender Equality Agency’s 2016-17 reporting data. November 2017. Australian Government, Workplace Gender Equality Agency: Sydney. Available at: https://www.wgea.gov.au/sites/default/files/2016-17-gender-equality-scorecard.pdf
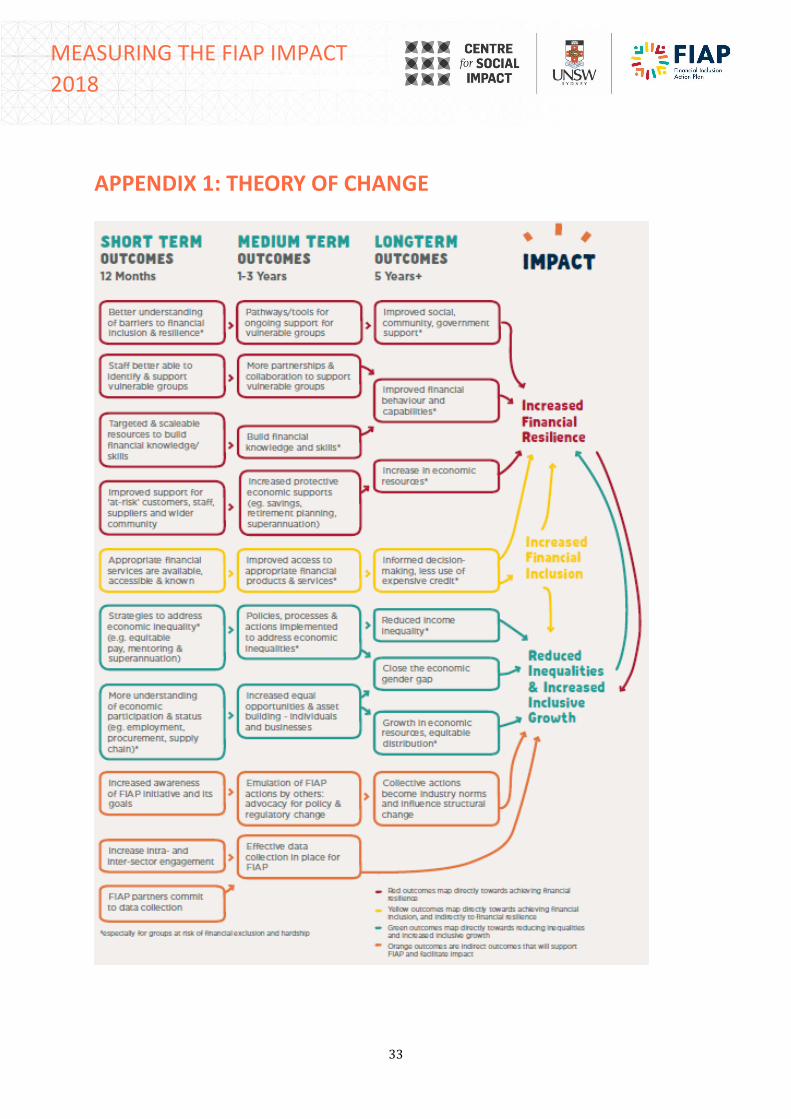
33
MEASURING THE FIAP IMPACT
2018
APPENDIX 1: THEORY OF CHANGE

34
MEASURING THE FIAP IMPACT
2018
APPENDIX 2: DRAFT PROPOSAL FOR REVISED INDICATOR BANK
Trailblazer Indicator Reporting Tool Please complete the attached information as part of the FIAP evaluation. Please complete with regards to
your last complete reporting period.
Org name:
Sector:
Org size by employees:
Org size by annual revenue: XS (Less than $50k); S (50k to less than $250k); M ($250k to less than
$1million); L ($1m to less than $10m); XL ($10m to less than $100m); XXL (over $100m)
Reporting period: What is your standard reporting period (e.g. Jan-Dec; Jul-Jun)?
Indicators about economic equality in your workforce
1. Number of employees. How many full-time, part-time and casual staff does your organisation
employ?
2. Employee retention. What are your return to work rates after parental leave for men? For
women?
3. Employee turnover. What is your male: female turnover rate?
4. Gender pay gap. What is your gender pay gap?
5. Women in leadership. What proportion of managerial positions are held by women?
6. Indigenous staff development. Do you offer any specific mentoring, training or career
development that targets staff or recruits who identify as Aboriginal or Torres Isalanders?
Yes/No. If yes, please summarise the different initiatives and report on the numbers of staff that
participated.
Indicators about economic equality (for educational institutions only)
7. What is the ratio of male: female students?
8. What is the ratio of Indigenous: non-Indigenous students?
Indicators about economic equality (for clients/customers)
9. Identification. Do you have a process for identifying vulnerable customers?
Indicators about financial inclusion
10. Customer debt. What is the average level of customer debt for your clients?
11. Cost of services. Financial services: What is the average cost of opening a basic current account?
What is the average cost of maintaining a basic bank current account (annual fees)? What is the
average cost of credit transfers?
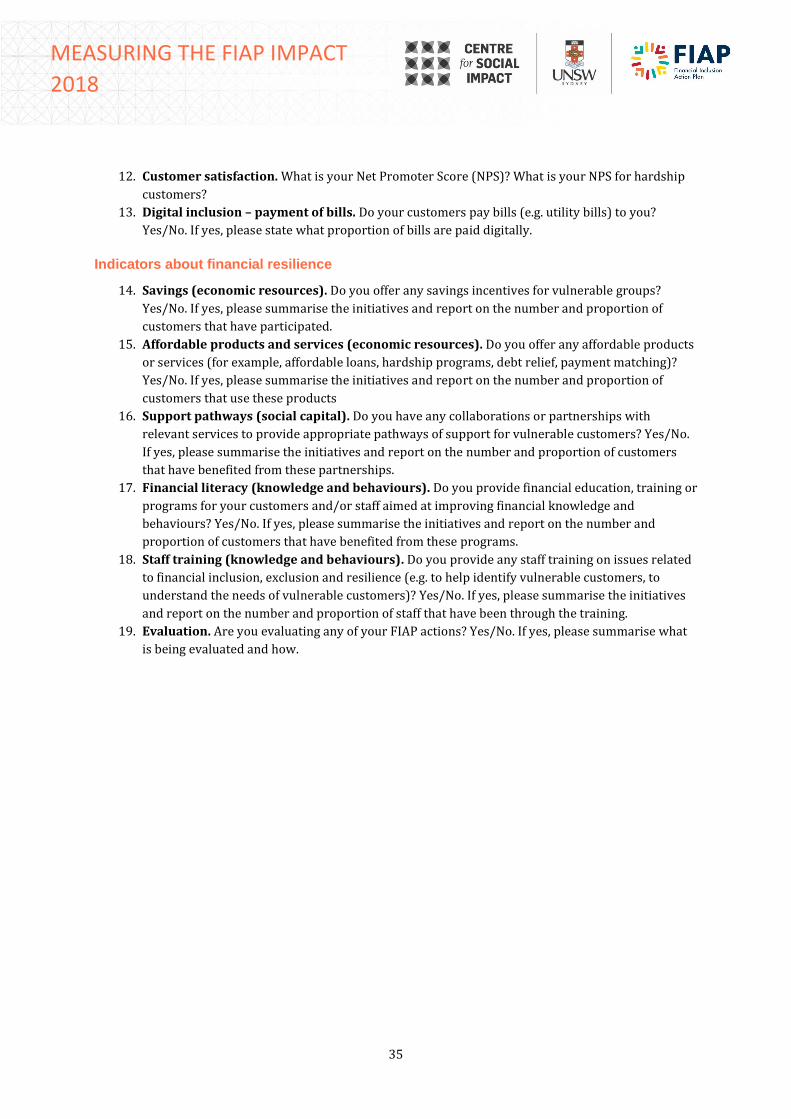
35
MEASURING THE FIAP IMPACT
2018
12. Customer satisfaction. What is your Net Promoter Score (NPS)? What is your NPS for hardship
customers?
13. Digital inclusion – payment of bills. Do your customers pay bills (e.g. utility bills) to you?
Yes/No. If yes, please state what proportion of bills are paid digitally.
Indicators about financial resilience
14. Savings (economic resources). Do you offer any savings incentives for vulnerable groups?
Yes/No. If yes, please summarise the initiatives and report on the number and proportion of
customers that have participated.
15. Affordable products and services (economic resources). Do you offer any affordable products
or services (for example, affordable loans, hardship programs, debt relief, payment matching)?
Yes/No. If yes, please summarise the initiatives and report on the number and proportion of
customers that use these products
16. Support pathways (social capital). Do you have any collaborations or partnerships with
relevant services to provide appropriate pathways of support for vulnerable customers? Yes/No.
If yes, please summarise the initiatives and report on the number and proportion of customers
that have benefited from these partnerships.
17. Financial literacy (knowledge and behaviours). Do you provide financial education, training or
programs for your customers and/or staff aimed at improving financial knowledge and
behaviours? Yes/No. If yes, please summarise the initiatives and report on the number and
proportion of customers that have benefited from these programs.
18. Staff training (knowledge and behaviours). Do you provide any staff training on issues related
to financial inclusion, exclusion and resilience (e.g. to help identify vulnerable customers, to
understand the needs of vulnerable customers)? Yes/No. If yes, please summarise the initiatives
and report on the number and proportion of staff that have been through the training.
19. Evaluation. Are you evaluating any of your FIAP actions? Yes/No. If yes, please summarise what
is being evaluated and how.
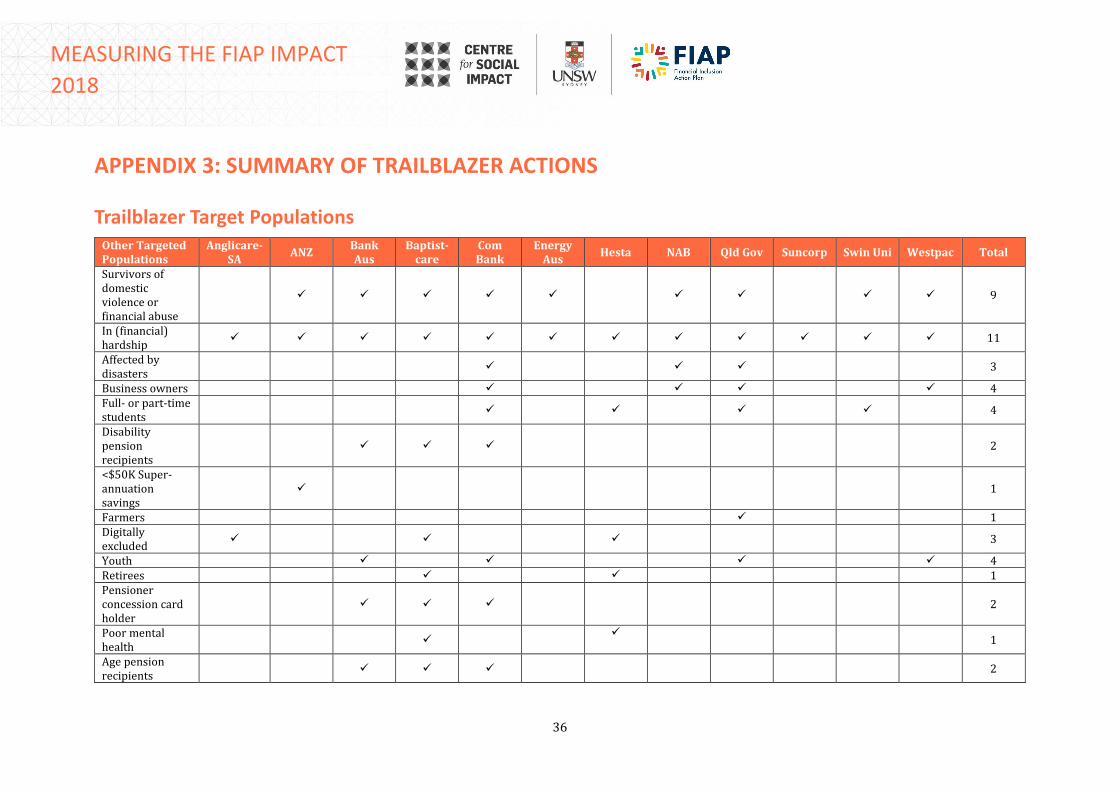
36
MEASURING THE FIAP IMPACT
2018
APPENDIX 3: SUMMARY OF TRAILBLAZER ACTIONS
Trailblazer Target Populations Other Targeted Populations
Anglicare-SA
ANZ Bank Aus
Baptist-care
Com Bank
Energy Aus
Hesta NAB Qld Gov Suncorp Swin Uni Westpac Total
Survivors of domestic violence or financial abuse
✓ ✓ ✓ ✓ ✓ ✓ ✓ ✓ ✓ 9
In (financial) hardship
✓ ✓ ✓ ✓ ✓ ✓ ✓ ✓ ✓ ✓ ✓ ✓ 11
Affected by disasters
✓ ✓ ✓ 3
Business owners ✓ ✓ ✓ ✓ 4 Full- or part-time students
✓ ✓ ✓ ✓ 4
Disability pension recipients
✓ ✓ ✓ 2
<$50K Super-annuation savings
✓ 1
Farmers ✓ 1 Digitally excluded
✓ ✓ ✓ 3
Youth ✓ ✓ ✓ ✓ 4 Retirees ✓ ✓ 1 Pensioner concession card holder
✓ ✓
✓
2
Poor mental health
✓
✓ 1
Age pension recipients
✓ ✓ ✓ 2
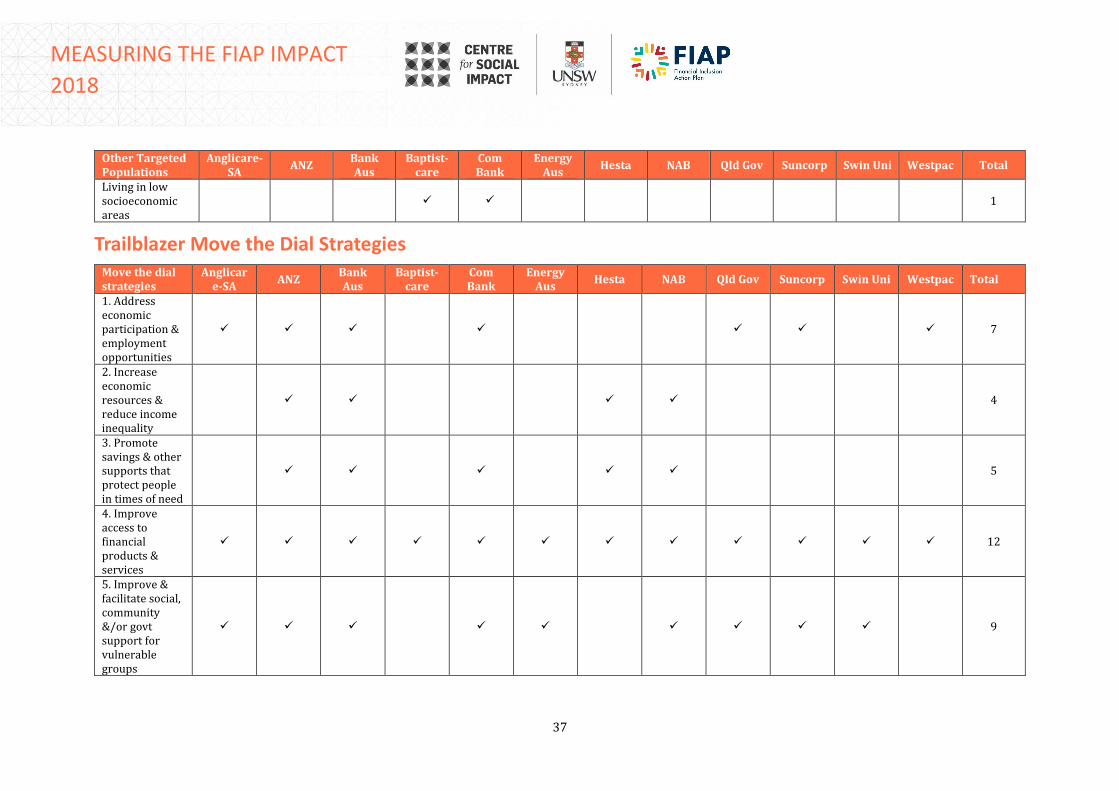
37
MEASURING THE FIAP IMPACT
2018
Other Targeted Populations
Anglicare-SA
ANZ Bank Aus
Baptist-care
Com Bank
Energy Aus
Hesta NAB Qld Gov Suncorp Swin Uni Westpac Total
Living in low socioeconomic areas
✓
✓
1
Trailblazer Move the Dial Strategies Move the dial strategies
Anglicare-SA
ANZ Bank Aus
Baptist-care
Com Bank
Energy Aus
Hesta NAB Qld Gov Suncorp Swin Uni Westpac Total
1. Address economic participation & employment opportunities
✓ ✓ ✓ ✓ ✓ ✓ ✓ 7
2. Increase economic resources & reduce income inequality
✓
✓ ✓ ✓ 4
3. Promote savings & other supports that protect people in times of need
✓ ✓ ✓ ✓ ✓ 5
4. Improve access to financial products & services
✓ ✓ ✓ ✓ ✓ ✓ ✓ ✓ ✓ ✓ ✓ ✓ 12
5. Improve & facilitate social, community &/or govt support for vulnerable groups
✓ ✓ ✓ ✓ ✓ ✓ ✓ ✓ ✓ 9
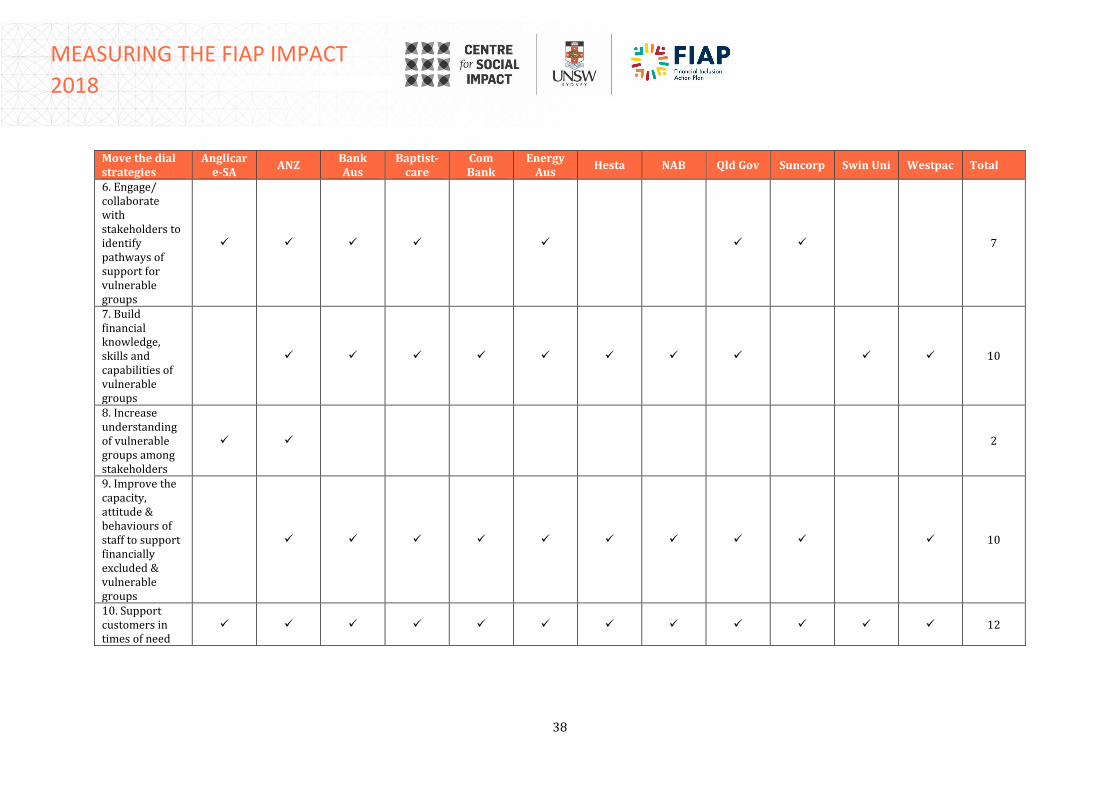
38
MEASURING THE FIAP IMPACT
2018
Move the dial strategies
Anglicare-SA
ANZ Bank Aus
Baptist-care
Com Bank
Energy Aus
Hesta NAB Qld Gov Suncorp Swin Uni Westpac Total
6. Engage/ collaborate with stakeholders to identify pathways of support for vulnerable groups
✓ ✓ ✓ ✓ ✓ ✓ ✓ 7
7. Build financial knowledge, skills and capabilities of vulnerable groups
✓ ✓ ✓ ✓ ✓ ✓ ✓ ✓ ✓ ✓ 10
8. Increase understanding of vulnerable groups among stakeholders
✓ ✓ 2
9. Improve the capacity, attitude & behaviours of staff to support financially excluded & vulnerable groups
✓ ✓ ✓ ✓ ✓ ✓ ✓ ✓ ✓ ✓ 10
10. Support customers in times of need
✓ ✓ ✓ ✓ ✓ ✓ ✓ ✓ ✓ ✓ ✓ ✓ 12
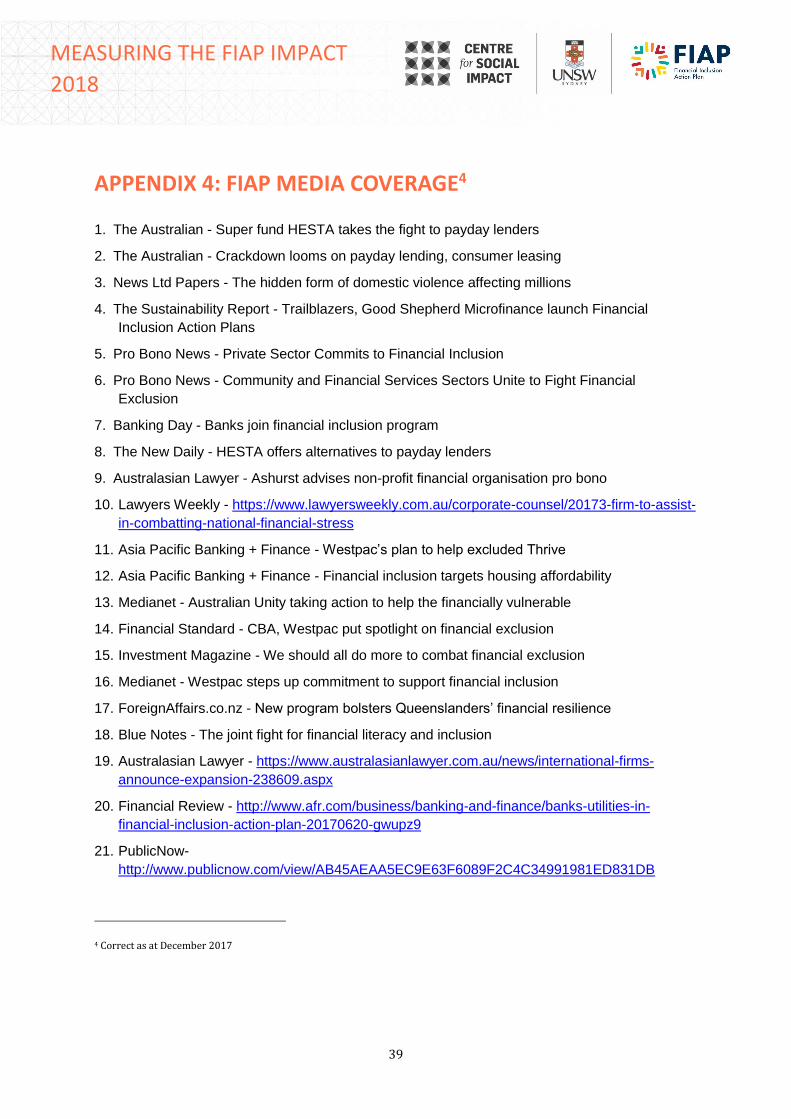
39
MEASURING THE FIAP IMPACT
2018
APPENDIX 4: FIAP MEDIA COVERAGE4
1. The Australian - Super fund HESTA takes the fight to payday lenders
2. The Australian - Crackdown looms on payday lending, consumer leasing
3. News Ltd Papers - The hidden form of domestic violence affecting millions
4. The Sustainability Report - Trailblazers, Good Shepherd Microfinance launch Financial
Inclusion Action Plans
5. Pro Bono News - Private Sector Commits to Financial Inclusion
6. Pro Bono News - Community and Financial Services Sectors Unite to Fight Financial
Exclusion
7. Banking Day - Banks join financial inclusion program
8. The New Daily - HESTA offers alternatives to payday lenders
9. Australasian Lawyer - Ashurst advises non-profit financial organisation pro bono
10. Lawyers Weekly - https://www.lawyersweekly.com.au/corporate-counsel/20173-firm-to-assist-
in-combatting-national-financial-stress
11. Asia Pacific Banking + Finance - Westpac’s plan to help excluded Thrive
12. Asia Pacific Banking + Finance - Financial inclusion targets housing affordability
13. Medianet - Australian Unity taking action to help the financially vulnerable
14. Financial Standard - CBA, Westpac put spotlight on financial exclusion
15. Investment Magazine - We should all do more to combat financial exclusion
16. Medianet - Westpac steps up commitment to support financial inclusion
17. ForeignAffairs.co.nz - New program bolsters Queenslanders’ financial resilience
18. Blue Notes - The joint fight for financial literacy and inclusion
19. Australasian Lawyer - https://www.australasianlawyer.com.au/news/international-firms-
announce-expansion-238609.aspx
20. Financial Review - http://www.afr.com/business/banking-and-finance/banks-utilities-in-
financial-inclusion-action-plan-20170620-gwupz9
21. PublicNow-
http://www.publicnow.com/view/AB45AEAA5EC9E63F6089F2C4C34991981ED831DB
4 Correct as at December 2017
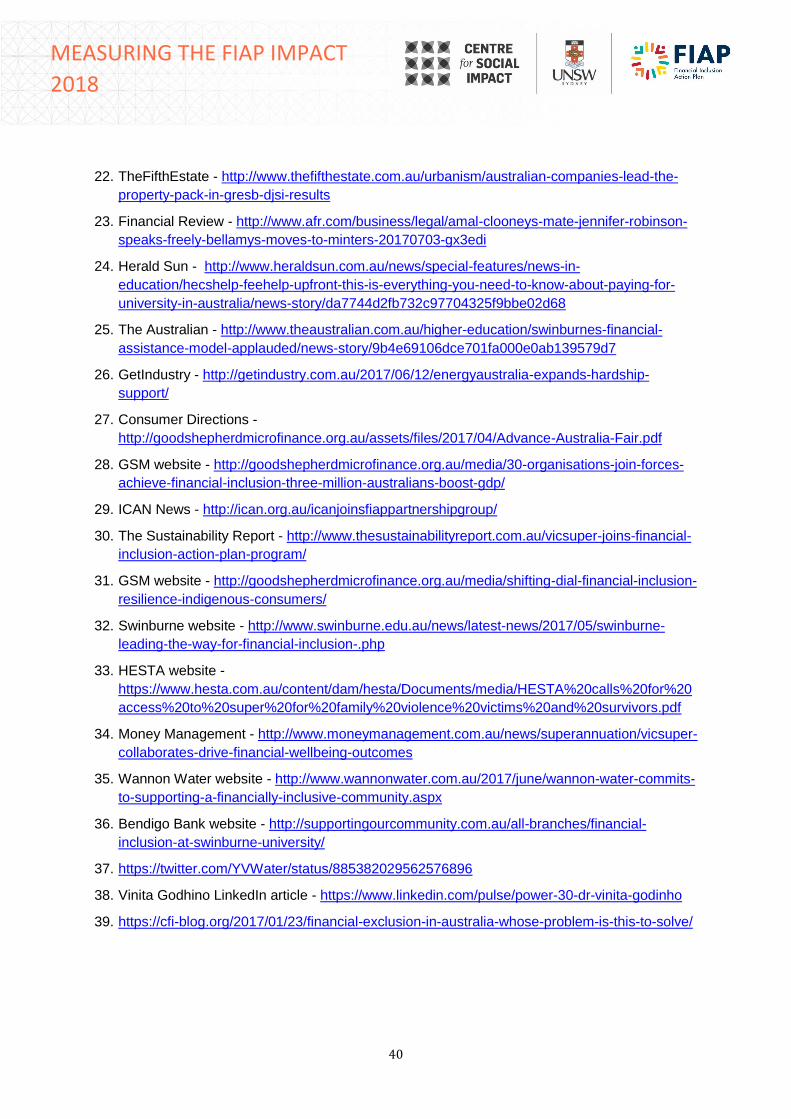
40
MEASURING THE FIAP IMPACT
2018
22. TheFifthEstate - http://www.thefifthestate.com.au/urbanism/australian-companies-lead-the-
property-pack-in-gresb-djsi-results
23. Financial Review - http://www.afr.com/business/legal/amal-clooneys-mate-jennifer-robinson-
speaks-freely-bellamys-moves-to-minters-20170703-gx3edi
24. Herald Sun - http://www.heraldsun.com.au/news/special-features/news-in-
education/hecshelp-feehelp-upfront-this-is-everything-you-need-to-know-about-paying-for-
university-in-australia/news-story/da7744d2fb732c97704325f9bbe02d68
25. The Australian - http://www.theaustralian.com.au/higher-education/swinburnes-financial-
assistance-model-applauded/news-story/9b4e69106dce701fa000e0ab139579d7
26. GetIndustry - http://getindustry.com.au/2017/06/12/energyaustralia-expands-hardship-
support/
27. Consumer Directions -
http://goodshepherdmicrofinance.org.au/assets/files/2017/04/Advance-Australia-Fair.pdf
28. GSM website - http://goodshepherdmicrofinance.org.au/media/30-organisations-join-forces-
achieve-financial-inclusion-three-million-australians-boost-gdp/
29. ICAN News - http://ican.org.au/icanjoinsfiappartnershipgroup/
30. The Sustainability Report - http://www.thesustainabilityreport.com.au/vicsuper-joins-financial-
inclusion-action-plan-program/
31. GSM website - http://goodshepherdmicrofinance.org.au/media/shifting-dial-financial-inclusion-
resilience-indigenous-consumers/
32. Swinburne website - http://www.swinburne.edu.au/news/latest-news/2017/05/swinburne-
leading-the-way-for-financial-inclusion-.php
33. HESTA website -
https://www.hesta.com.au/content/dam/hesta/Documents/media/HESTA%20calls%20for%20
access%20to%20super%20for%20family%20violence%20victims%20and%20survivors.pdf
34. Money Management - http://www.moneymanagement.com.au/news/superannuation/vicsuper-
collaborates-drive-financial-wellbeing-outcomes
35. Wannon Water website - http://www.wannonwater.com.au/2017/june/wannon-water-commits-
to-supporting-a-financially-inclusive-community.aspx
36. Bendigo Bank website - http://supportingourcommunity.com.au/all-branches/financial-
inclusion-at-swinburne-university/
37. https://twitter.com/YVWater/status/885382029562576896
38. Vinita Godhino LinkedIn article - https://www.linkedin.com/pulse/power-30-dr-vinita-godinho
39. https://cfi-blog.org/2017/01/23/financial-exclusion-in-australia-whose-problem-is-this-to-solve/
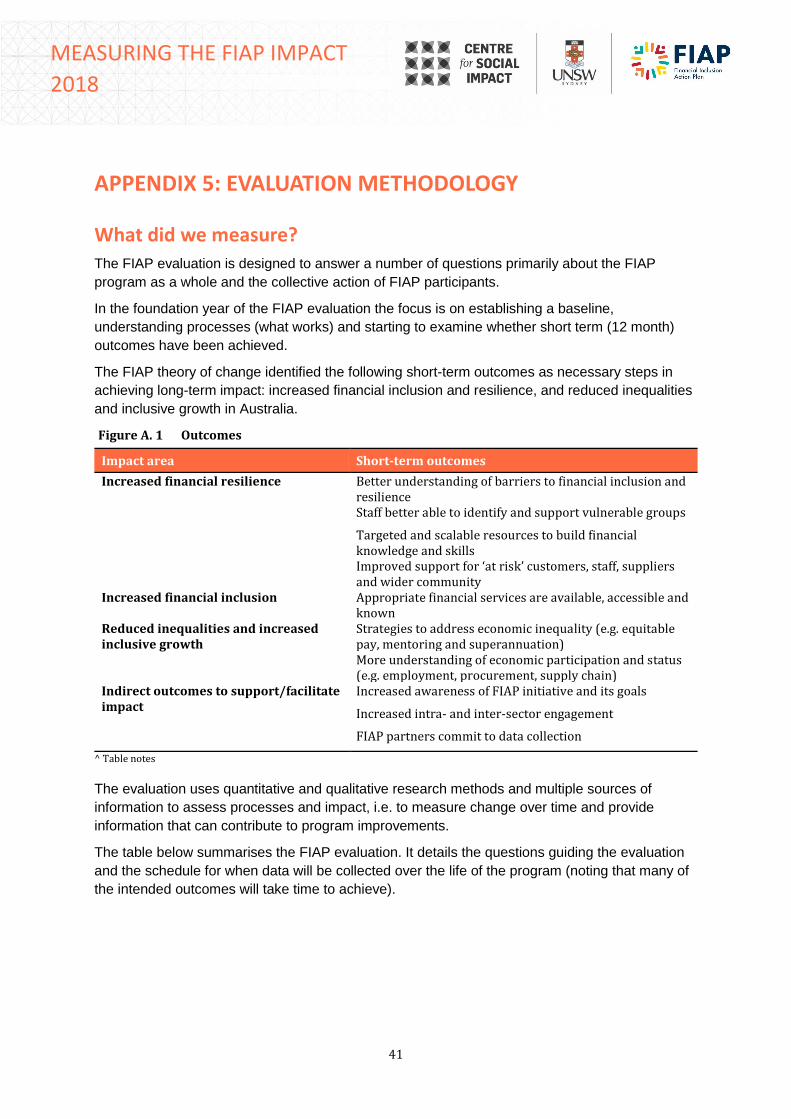
41
MEASURING THE FIAP IMPACT
2018
APPENDIX 5: EVALUATION METHODOLOGY
What did we measure?
The FIAP evaluation is designed to answer a number of questions primarily about the FIAP
program as a whole and the collective action of FIAP participants.
In the foundation year of the FIAP evaluation the focus is on establishing a baseline,
understanding processes (what works) and starting to examine whether short term (12 month)
outcomes have been achieved.
The FIAP theory of change identified the following short-term outcomes as necessary steps in
achieving long-term impact: increased financial inclusion and resilience, and reduced inequalities
and inclusive growth in Australia.
Figure A. 1 Outcomes
Impact area Short-term outcomes
Increased financial resilience Better understanding of barriers to financial inclusion and resilience Staff better able to identify and support vulnerable groups
Targeted and scalable resources to build financial knowledge and skills Improved support for ‘at risk’ customers, staff, suppliers and wider community
Increased financial inclusion Appropriate financial services are available, accessible and known
Reduced inequalities and increased inclusive growth
Strategies to address economic inequality (e.g. equitable pay, mentoring and superannuation) More understanding of economic participation and status (e.g. employment, procurement, supply chain)
Indirect outcomes to support/facilitate impact
Increased awareness of FIAP initiative and its goals
Increased intra- and inter-sector engagement
FIAP partners commit to data collection
^ Table notes
The evaluation uses quantitative and qualitative research methods and multiple sources of
information to assess processes and impact, i.e. to measure change over time and provide
information that can contribute to program improvements.
The table below summarises the FIAP evaluation. It details the questions guiding the evaluation
and the schedule for when data will be collected over the life of the program (noting that many of
the intended outcomes will take time to achieve).
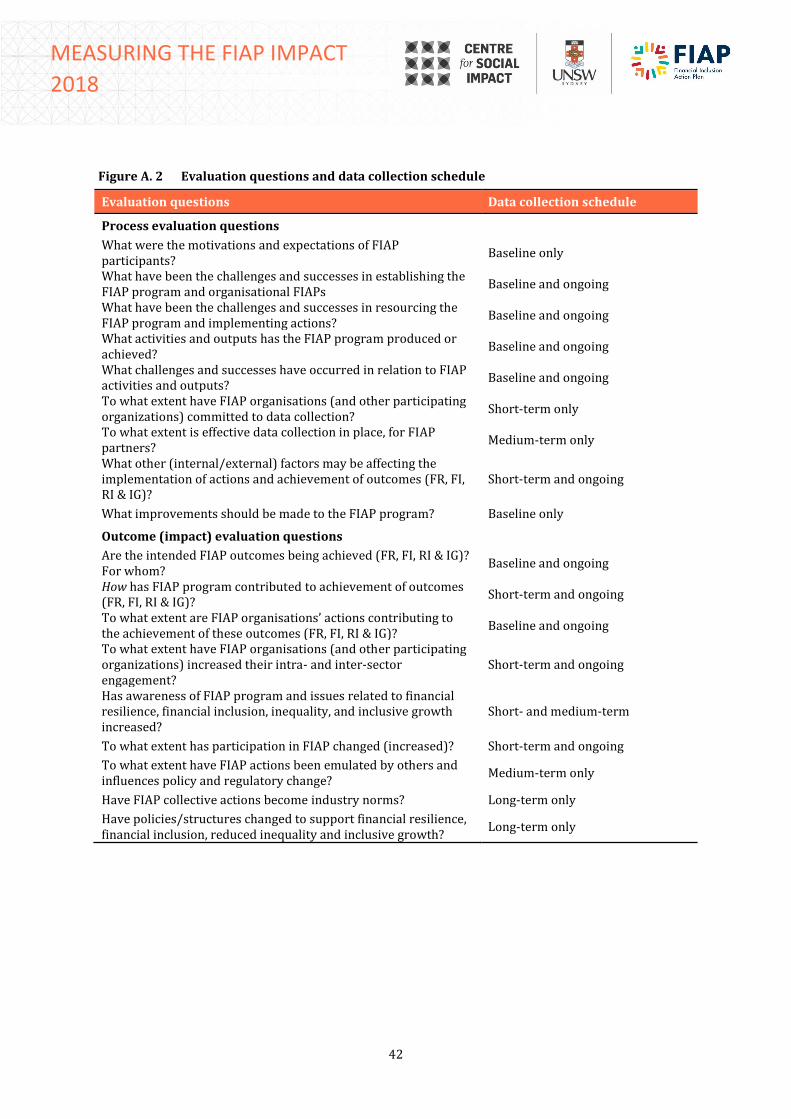
42
MEASURING THE FIAP IMPACT
2018
Figure A. 2 Evaluation questions and data collection schedule
Evaluation questions Data collection schedule
Process evaluation questions
What were the motivations and expectations of FIAP participants?
Baseline only
What have been the challenges and successes in establishing the FIAP program and organisational FIAPs
Baseline and ongoing
What have been the challenges and successes in resourcing the FIAP program and implementing actions?
Baseline and ongoing
What activities and outputs has the FIAP program produced or achieved?
Baseline and ongoing
What challenges and successes have occurred in relation to FIAP activities and outputs?
Baseline and ongoing
To what extent have FIAP organisations (and other participating organizations) committed to data collection?
Short-term only
To what extent is effective data collection in place, for FIAP partners?
Medium-term only
What other (internal/external) factors may be affecting the implementation of actions and achievement of outcomes (FR, FI, RI & IG)?
Short-term and ongoing
What improvements should be made to the FIAP program? Baseline only
Outcome (impact) evaluation questions
Are the intended FIAP outcomes being achieved (FR, FI, RI & IG)? For whom?
Baseline and ongoing
How has FIAP program contributed to achievement of outcomes (FR, FI, RI & IG)?
Short-term and ongoing
To what extent are FIAP organisations’ actions contributing to the achievement of these outcomes (FR, FI, RI & IG)?
Baseline and ongoing
To what extent have FIAP organisations (and other participating organizations) increased their intra- and inter-sector engagement?
Short-term and ongoing
Has awareness of FIAP program and issues related to financial resilience, financial inclusion, inequality, and inclusive growth increased?
Short- and medium-term
To what extent has participation in FIAP changed (increased)? Short-term and ongoing
To what extent have FIAP actions been emulated by others and influences policy and regulatory change?
Medium-term only
Have FIAP collective actions become industry norms? Long-term only
Have policies/structures changed to support financial resilience, financial inclusion, reduced inequality and inclusive growth?
Long-term only
43
MEASURING THE FIAP IMPACT
2018
How did we measure it?
The 2017 evaluation uses a range of methods that are summarised below.
Document analysis
A range of documentation was analysed as part of the evaluation. In relation to the FIAP program
as a whole, this allowed us to understand the processes that have been implemented by the
FIAP program implementation team to support organisations as they create and implement their
FIAPs, to raise awareness of the FIAP program, to engage further organisations in the FIAP
program and to coordinate stakeholder communication and learning opportunities such as the
FIAP Community of Practices.
FIAP organisations’ policies and reports were analysed to establish the FIAP baseline and
provide organisational level data against the indicator bank (described below). A key challenge
for FIAP organisations is the burden of reporting and data collection. For this reason, we have
attempted to align FIAP reporting with existing reporting, including but not limited to: annual
reports, sustainability reports, reconciliation action plan (RAP) reporting and workplace gender
equality agency (WGEA) reporting.
Where possible data across FIAP organisations will be aggregated to provide a picture of the
collective efforts of the FIAP program. In the foundation FIAP year, however, there may be gaps
and inconsistencies in data that make this challenging. The evaluation will therefore also track
the extent to which FIAP organisations commit to future data collection (short-term) and establish
effective data collection (medium-term).
In addition to this, the evaluation collected data from Good Shepherd Microfinance regarding new
organisations contacting them about getting involved in the FIAP program. This has included
information about how they found out about FIAP and their motivations for participating.
Secondary data analysis
A number of secondary data sources were analysed to establish the FIAP baseline at the
population level. Specific data and sources are detailed in the indicator bank, but include for
example, data on:
• Employment trends from the Australian Bureau of Statistics (ABS)
• Financial resilience from the Centre for Social Impact’s ongoing research
• Accessibility of banking facilities from the World Banking Financial Index
• Customer satisfaction from the Roy Morgan Main Financial Institution (MFI) satisfaction
survey
By analysing this data at the baseline, we will be able to examine the contribution of FIAP to
population changes in financial resilience, financial inclusion, reduced inequalities and inclusive
growth. As noted previously, attribution specifically to FIAP will be challenging, although we will
44
MEASURING THE FIAP IMPACT
2018
explore other factors that may have contributed to population change through qualitative data
collection.
The indicator bank was populated by CSI with population level data (completed December 2016
and included in the indicator bank in table 2 of this report) and publicly available FIAP
organisation level data (e.g. from annual reports, corporate sustainability reports, RAP reporting,
WGEA reporting and other relevant materials). Organisational level data was then circulated to
the relevant organisations for review in July 2017 and organisations had the opportunity to
provide comments and/or additional data.
If FIAP organisations released any confidential or commercially sensitive data to CSI, this data
was (and will continue to be) shared with FIAP partners only if it can be aggregated and/or safely
anonymised, unless FIAP organisations have given explicit consent that data can be shared.
New data collection
Short interviews and surveys were conducted with a range of stakeholders to understand and
evaluate the process of FIAP. Stakeholders included those responsible for FIAP in FIAP
organisations, the FIAP program implementation team, the Partnership group and the Advisory
group.
The process evaluation is formative and examines the implementation of the FIAP program and
how FIAP organisations established and implemented their FIAPs. It will help us understand the
circumstances under which change occurs and for whom.
Interviews and surveys explored facilitators and barriers to FIAP’s effective establishment,
implementation, governance and outcomes. Lessons learnt from the process evaluation are
critical for ensuring the success of the FIAP program as more organisations join FIAP.
Interviews and surveys were also used to address some evaluation questions such as the nature
and extent of collaboration between FIAP partners and the extent to which FIAP actions have
been emulated by others.
Participation in interviews and surveys was voluntary and had approval from UNSW Human
Research Ethics Committee.
Interviews
Interviews were conducted in the first half of 2017 with FIAP stakeholders to understand their
motivations and expectations of the FIAP program. This will enable us to measure whether
expectations have been met in the future.
Interviews were conducted by primarily by phone, but in two instances where we were unable to
schedule interviews, questions and responses were provided by email.
Interviews were completed with:
• 14 Trailblazer organisations (some of these were group interviews) in February 2017
• 14 members of the FIAP advisory group (4 of whom were also members of the Partnership
group) in April/May 2017.
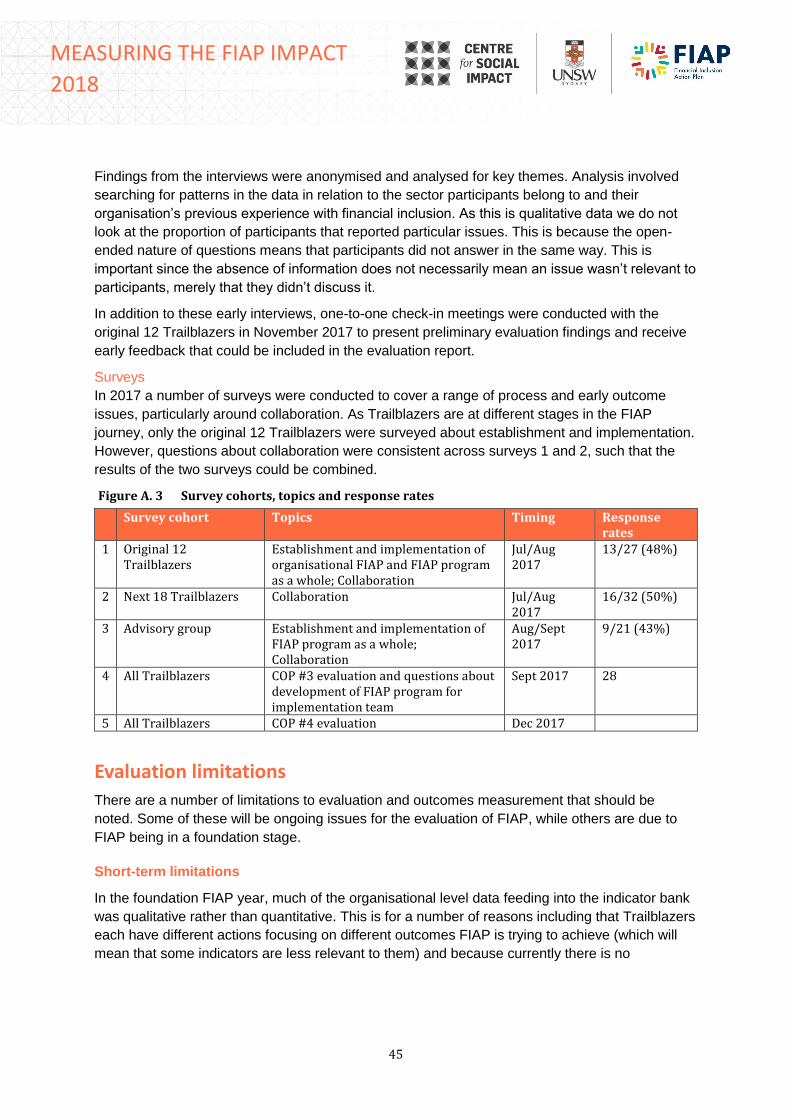
45
MEASURING THE FIAP IMPACT
2018
Findings from the interviews were anonymised and analysed for key themes. Analysis involved
searching for patterns in the data in relation to the sector participants belong to and their
organisation’s previous experience with financial inclusion. As this is qualitative data we do not
look at the proportion of participants that reported particular issues. This is because the open-
ended nature of questions means that participants did not answer in the same way. This is
important since the absence of information does not necessarily mean an issue wasn’t relevant to
participants, merely that they didn’t discuss it.
In addition to these early interviews, one-to-one check-in meetings were conducted with the
original 12 Trailblazers in November 2017 to present preliminary evaluation findings and receive
early feedback that could be included in the evaluation report.
Surveys
In 2017 a number of surveys were conducted to cover a range of process and early outcome
issues, particularly around collaboration. As Trailblazers are at different stages in the FIAP
journey, only the original 12 Trailblazers were surveyed about establishment and implementation.
However, questions about collaboration were consistent across surveys 1 and 2, such that the
results of the two surveys could be combined.
Figure A. 3 Survey cohorts, topics and response rates
Survey cohort Topics Timing Response rates
1 Original 12 Trailblazers
Establishment and implementation of organisational FIAP and FIAP program as a whole; Collaboration
Jul/Aug 2017
13/27 (48%)
2 Next 18 Trailblazers Collaboration Jul/Aug 2017
16/32 (50%)
3 Advisory group Establishment and implementation of FIAP program as a whole; Collaboration
Aug/Sept 2017
9/21 (43%)
4 All Trailblazers COP #3 evaluation and questions about development of FIAP program for implementation team
Sept 2017 28
5 All Trailblazers COP #4 evaluation Dec 2017
Evaluation limitations
There are a number of limitations to evaluation and outcomes measurement that should be
noted. Some of these will be ongoing issues for the evaluation of FIAP, while others are due to
FIAP being in a foundation stage.
Short-term limitations
In the foundation FIAP year, much of the organisational level data feeding into the indicator bank
was qualitative rather than quantitative. This is for a number of reasons including that Trailblazers
each have different actions focusing on different outcomes FIAP is trying to achieve (which will
mean that some indicators are less relevant to them) and because currently there is no
46
MEASURING THE FIAP IMPACT
2018
consistency in how Trailblazers collect data. While this has made it difficult to aggregate
organisational data, thematic analysis was used to analyse the qualitative data. Overtime as FIAP
develops, and Trailblazers understand what is expected of them in terms of data collection, there
will be greater consistency in reporting enabling aggregation.
A further limitation in relation to the indicator bank, is that ideally we would collect organisational
data disaggregated for groups that we know are vulnerable to financial hardship and exclusion, in
order that we can measure progress specifically for these groups. However, in many cases,
organisations did not collect demographic information that identified vulnerable characteristics.
Wherever possible, indicators will make comparisons between vulnerable groups and the general
population. Over time this may improve.
Ongoing limitations
As noted previously, the evaluation and outcomes measurement cannot attribute population
change to FIAP. Measurement can only point to the contribution of FIAP to any change that
occurs. This also highlights the need for not only outcomes measurement, but also broader
evaluation that can examine what else is happening that can impact on financial inclusion and
resilience, including macro level factors such as what is happening more widely in politics and the
economy, as well as meso level factors such as the contribution of organisations that are not part
of FIAP but who are involved in work around financial inclusion and exclusion.
47
MEASURING THE FIAP IMPACT
2018
APPENDIX 6: GLOSSARY AND KEY TERMS
Activities: The processes or actions that produce the desired outputs and ultimately outcomes.
In essence, activities describe “what we do”.
Aggregation: The collection of particulars combined into a total. When we examine the collective
action of FIAP we will aggregate, or ‘add up’ indicators from Trailblazer organisations to create
indicators for FIAP as a whole or for specific sectors participating in FIAP (e.g. the finance sector
or the not-for-profit sector).
Attribution: Attribution is the extent to which population level changes can be considered a direct
result of a program, initiative or intervention. Attributing change specifically to FIAP will be
challenging, as there may be other things that impact on Australia’s financial inclusion, resilience,
inequalities and inclusive growth. However, the evaluation will examine the contribution of FIAP to
any changes identified. We can do this by looking at the collective actions of FIAP as well as
exploring other factors that could be contributing to population changes.
Baseline: The initial information collected about the condition or performance of subjects prior to
the implementation of an intervention or program, against which progress can be compared at
strategic points during and at completion of the program. This means understanding where we
are at the beginning of the FIAP program, so that when we can measure how far we’ve come in
the future.
Collaboration: Is a highly developed and formal way of working with others. It involves working
towards a collectively produced, shared goal to solve a complex problem. It usually involves
organisations letting go of some autonomy and combining resources in pursuit of the common
goal. Collaboration is a key component of the FIAP program and will be necessary for many of
the participants to achieve their intended outcomes. The evaluation will examine the extent to
which collaboration is occurring, how it has occurred, where it appears most useful, and key
challenges and successes.
Collective action: Collective action is what the FIAP Trailblazers are able to achieve collectively
or as a whole. Over time, the indicator bank will measure this by examining population level
changes as well as aggregating data collected from all FIAP Trailblazers and groups of
Trailblazers, for example to examine the effect of collective action at an industry level. In the
short-term, it is difficult to measure collective action because there is little consistency in the way
Trailblazers collect and report relevant data.
Emulation: Emulation is the extent to which FIAP actions are accepted as industry norms and
taken up by industry bodies, peak associations and other organisations that may not be directly
involved in the FIAP program. This is a long-term outcome. In the short-term, the evaluation will
examine the extent to which there is awareness of the FIAP program more broadly, as this is a
prerequisite for emulation, and the extent to which specific actions may be emulated or shared
both among FIAP Trailblazers and beyond FIAP.
48
MEASURING THE FIAP IMPACT
2018
Impact: The longer-term social, economic, and/or environmental outcomes (effects or
consequences) of a program. They may be positive, negative or neutral; intended or unintended.
Achieving impact takes time and the FIAP program acknowledges it may at least 10 years to
realise reduced inequalities and increased inclusive growth.
Indicator bank: An indicator bank is a suite of indicators and measures that can be used to
examine whether an initiative has achieved its outcomes. The FIAP indicator bank will be used to
assess whether the FIAP program as a whole has achieved its short, medium and long-term
outcomes. It will also help to establish shared measurement over-time. However, since FIAP
organisations each have their own actions and are working in very different sectors, not all
indicators are relevant to all organisations participating in FIAP. The indicator bank will also
evolve over time as we identify indicators that are relevant to different sectors participating.
Indicators: Indicators are measurable markers that show whether progress is being made on a
certain condition or circumstance. Different indicators will be needed to determine how much
progress has been made toward a particular goal, output, or outcome.
Inputs: Resources put into a program for its establishment and implementation. Examples are
money, staff, time, facilities, equipment, etc
Materiality: Are an organisations FIAP actions material, i.e. feasible, relevant and aligned with
the organisation’s strategy?
Measures: A direct instrument that ascertains the unit of something. For example, if the indicator
is ability to raise funds in an emergency, the measure is the question asked of people to
determine this, i.e. If you had a financial emergency (e.g. your car breaks down, your washing
machine stops working) would you be able to raise $2000 within a week? How would you raise
this money?
Outcome: An outcome can be both the results/ effects expected by implementing a program/
initiative/ strategy and the changes that occur in attitudes, values, behaviours or conditions.
Changes can be immediate, intermediate or long-term.
Outcomes evaluation: The FIAP outcomes evaluation will determine the short, medium and long
term outcomes and impact of the FIAP program and what has changed since the baseline was
established. Given the long-term nature of the FIAP program and that the first year of FIAP is a
period of try, test and learn, only short-term outcomes can be assessed.
Outputs: The direct products or services resulting from your program or interventions’ activities.
For example, the number of people, places, supports or activities your program has produced.
Qualitative data: Seeks to understand how the world is understood, interpreted and experienced
by individuals, groups and organisations (usually through the eyes of people being studied and in
natural settings). It unpacks the ‘why’, is often richly descriptive, flexible, relative and subjective.
Qualitative data is usually text or narrative.
Quantitative data: Seeks to explain something by using numerical data: how many, much, often,
change etc. It is highly structured and based on theory/evidence and is usually objective, but can
49
MEASURING THE FIAP IMPACT
2018
also capture subjective responses (e.g. attitudes and feelings). It provides findings that can often
be generalised and are conducted in artificial settings.
Process evaluation: A process evaluation is often conducted alongside outcomes evaluation to
understand the circumstances under which change occurs and for whom. The FIAP process
evaluation will examine facilitators and barriers to FIAP’s effective establishment, implementation,
governance and outcomes, for both organisations and FIAP as a whole. Lessons learnt from the
process evaluation will be critical for ensuring the success of the FIAP program as more
organisations join FIAP.
Shared measurement: Shared measurement is a process for coordinating consistent
measurement and evaluation (e.g. how to measure, what indicators to use). It is also a tool for
collecting and measuring results consistently across groups. If common indicators are used and
data is de-identified and shared, we can build a picture of the collective actions and efforts of
FIAP organisations, while recognising that FIAP actions are not uniform. The FIAP indicator bank
has been developed to support shared measurement.
Stakeholders: Any group or individual who can affect, or is affected by, an organisation or its
activities. Also, any individual or group that can help define value propositions for the
organisation.
Theory of change: A theory of change is a representation of how a program or initiative should
work. It links inputs (the resources that go into a program), activities (what the program does),
outputs (the number of people, places, supports, activities the program has produced), outcomes
(what changes have occurred) and impact (long term change). You can see the FIAP theory of
change in the launch report from Nov 2016. The FIAP theory of change demonstrates that
through a range of activities undertaken by FIAP organisations and simultaneous action by the
FIAP Program team, we expect customers and staff to experience an increase in financial
inclusion and resilience, which will in turn contribute to inclusive growth and reduced inequalities.
We also anticipate that FIAP organisation’s activities that engage staff, suppliers and
stakeholders will have both a direct and indirect impact on increasing financial inclusion and
resilience for individuals experiencing financial exclusion and hardship more broadly (beyond the
customer base).