Embed Size (px)
Citation preview

Mediengespräch EY
Globale Biotechindustrie: Analysen und Prognosen 9. Juni 2016

Returning to Earth
EY Beyond borders
biotechnology report 2016
Page 3
Content
The year in review..……………………………...………………………………………..…...…. 4
Financial performance Global………………………………………………………..……....….. 9
Financial performance Europe……………………….……………………………...…………... 15
Financing Global………………………………………………………………………………….. 18
Financing US...........……………………………………….....………………..………………... 24
Financing Europe..……………………………………….....………………..…………………... 27
Deals Global...………….……………...………..………….…………………………………….. 32
Deals Europe.………….……………...………..………….……………………………………... 40
Drug Pricing...………….……………...………..………….……………………………………... 44

Page 4
The year in review
Beyond borders - Biotechnology Report 2016
Page 5
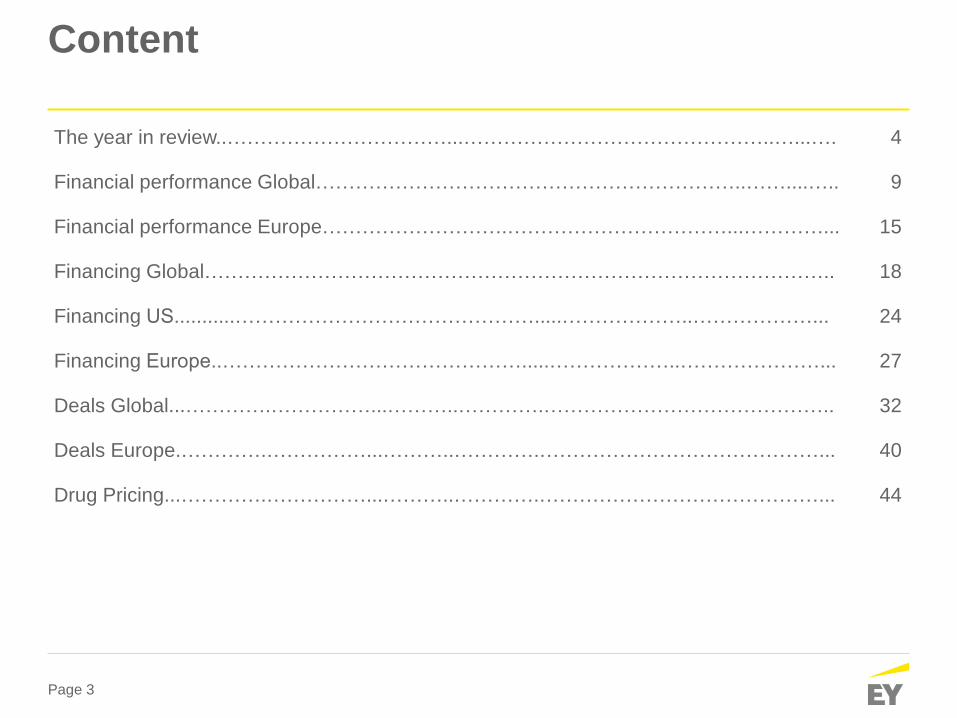
2015: Record results for the biotechnology industry, but…
Beyond borders - Biotechnology Report 2016
R&D spend up 16% to >US$40b
M&A involving biotech >US$100b
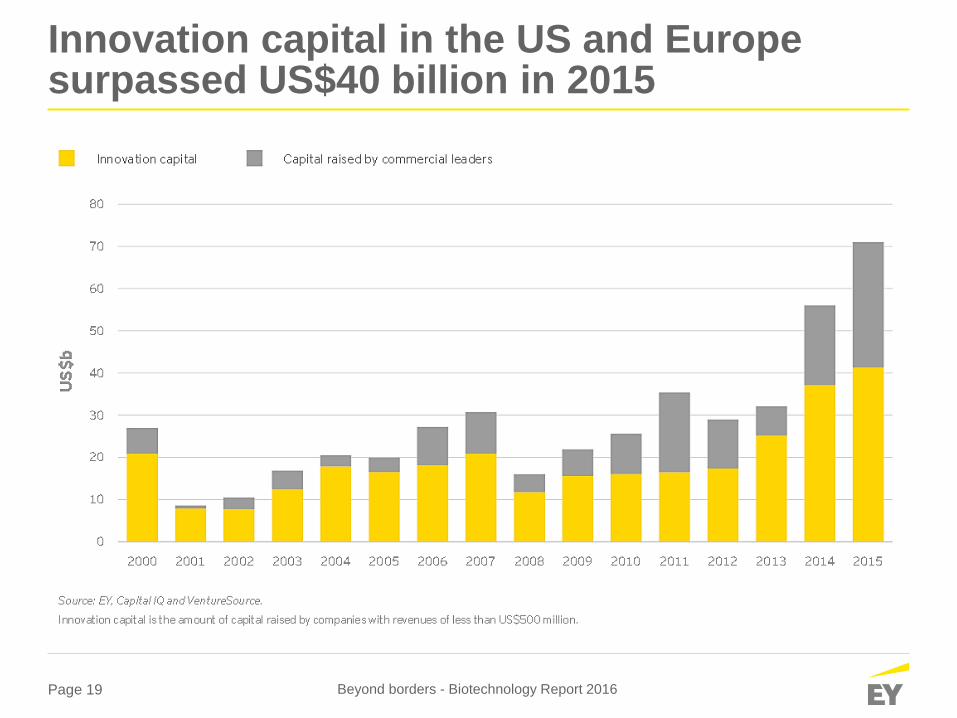
Innovation capital exceeds US$41b
Capital raised: US$71b
IPO window: 11 consecutive quarters
The biotech industry market cap: US$1.1t
Revenues reach historic high: US$132.7b
New drug approvals: US: 45 / Europe: 93
Employees up 19% to 203,850
Page 6
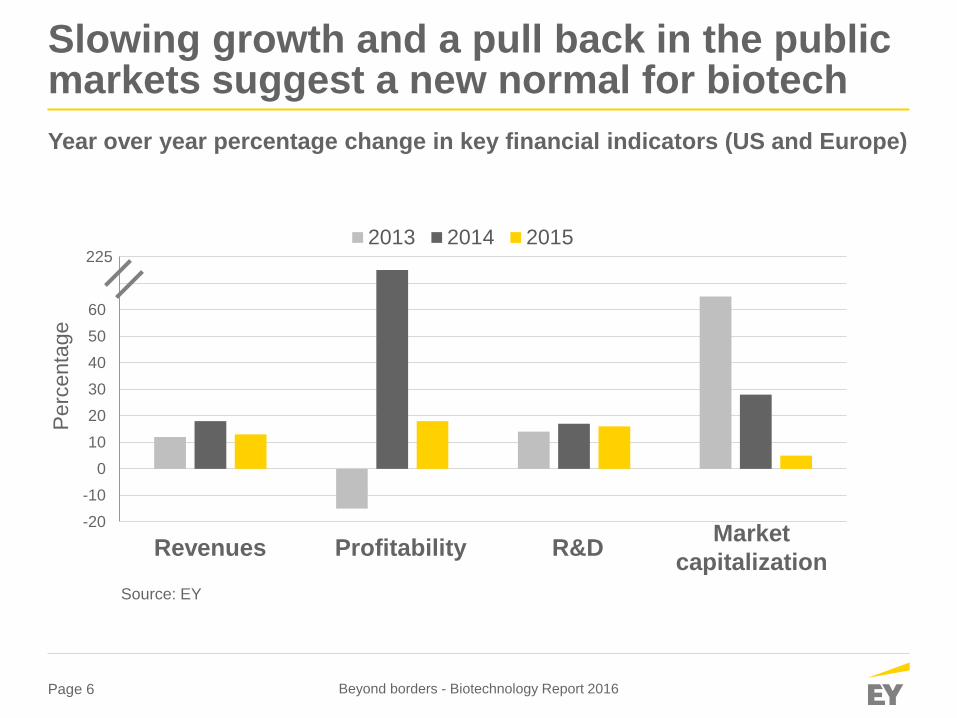
Slowing growth and a pull back in the public markets suggest a new normal for biotech
Year over year percentage change in key financial indicators (US and Europe)
Market
capitalization Revenues R&D Profitability
-20
-10
0
10
20
30
40
50
60
70
802013 2014 2015
225
Perc
enta
ge
Source: EY
Beyond borders - Biotechnology Report 2016
Page 7
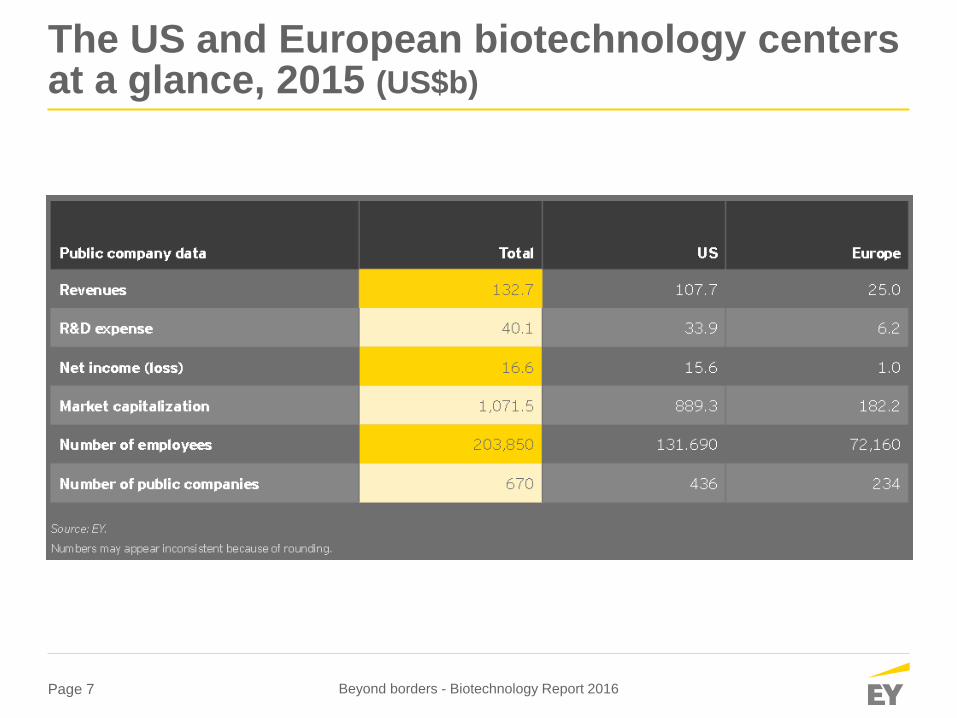
The US and European biotechnology centers at a glance, 2015 (US$b)
Beyond borders - Biotechnology Report 2016
Page 8
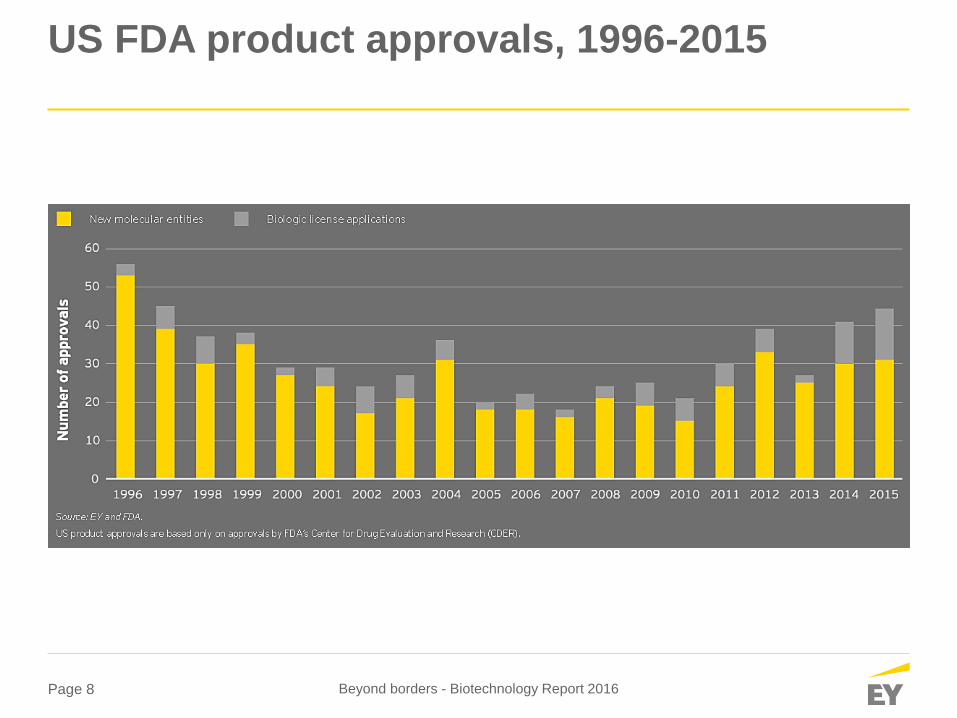
US FDA product approvals, 1996-2015
Beyond borders - Biotechnology Report 2016
Page 9
Financial performance
Beyond borders - Biotechnology Report 2016
Global
Page 10
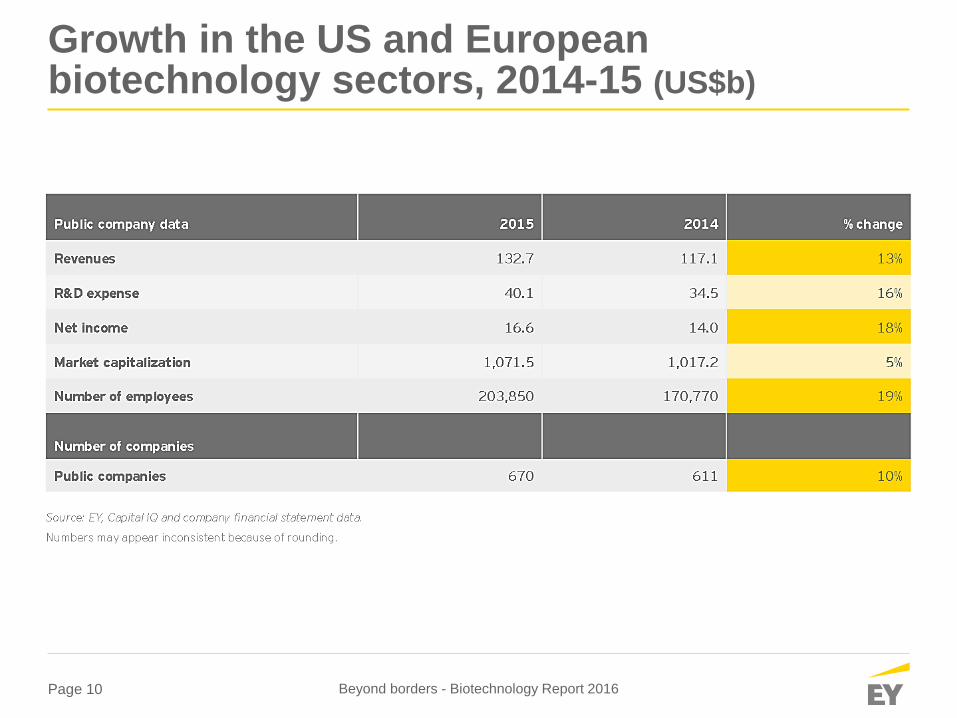
Growth in the US and European biotechnology sectors, 2014-15 (US$b)
Beyond borders - Biotechnology Report 2016
Page 11
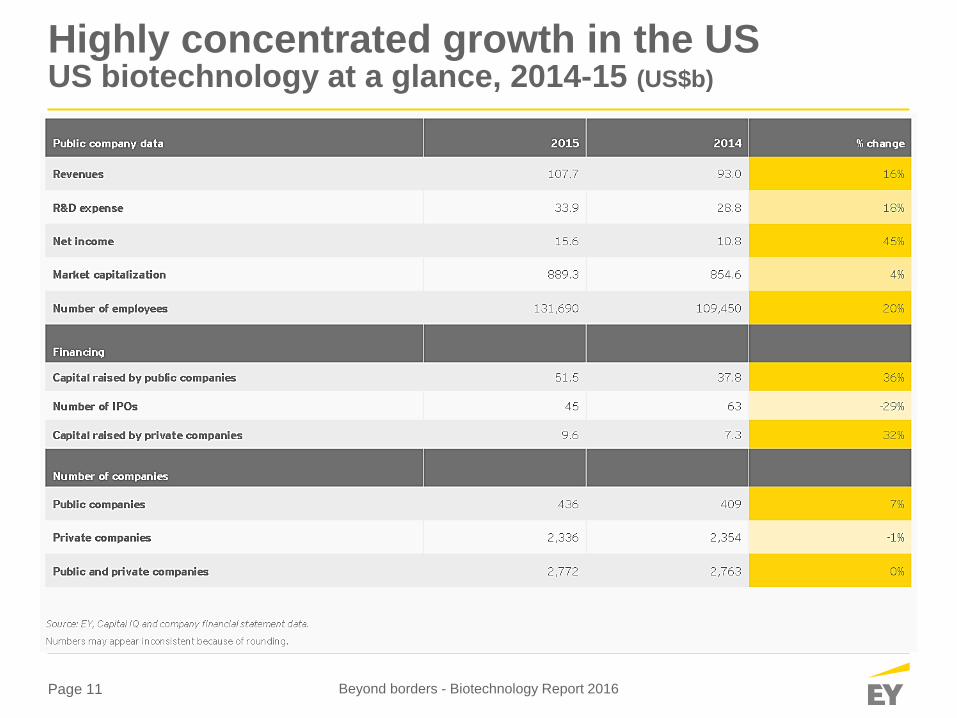
Highly concentrated growth in the US US biotechnology at a glance, 2014-15 (US$b)
Beyond borders - Biotechnology Report 2016
Page 12
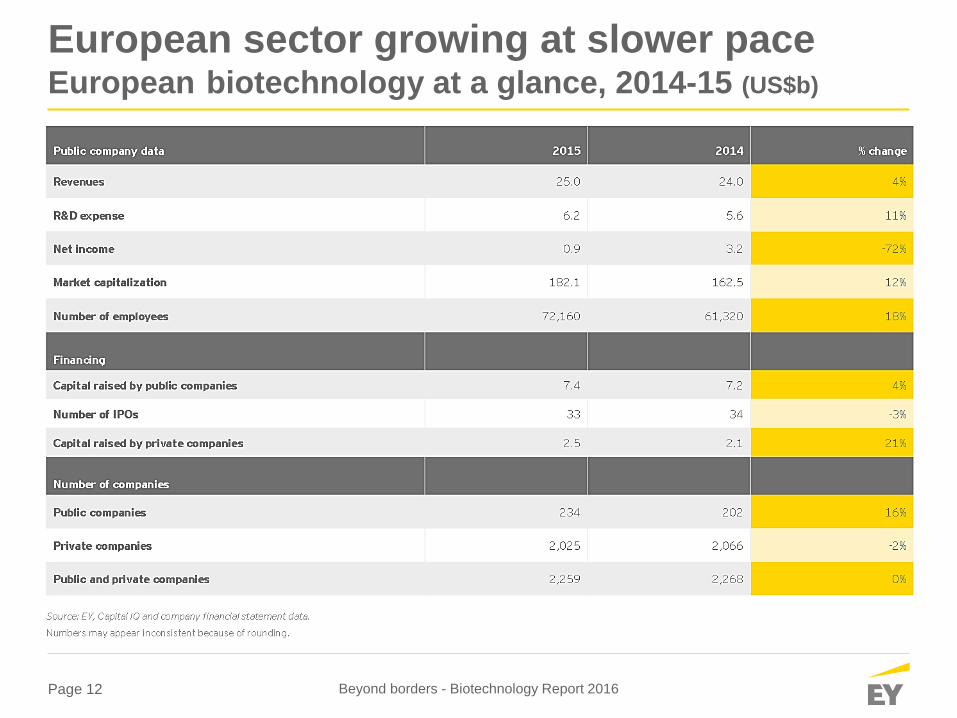
European sector growing at slower pace European biotechnology at a glance, 2014-15 (US$b)
Beyond borders - Biotechnology Report 2016
Page 13
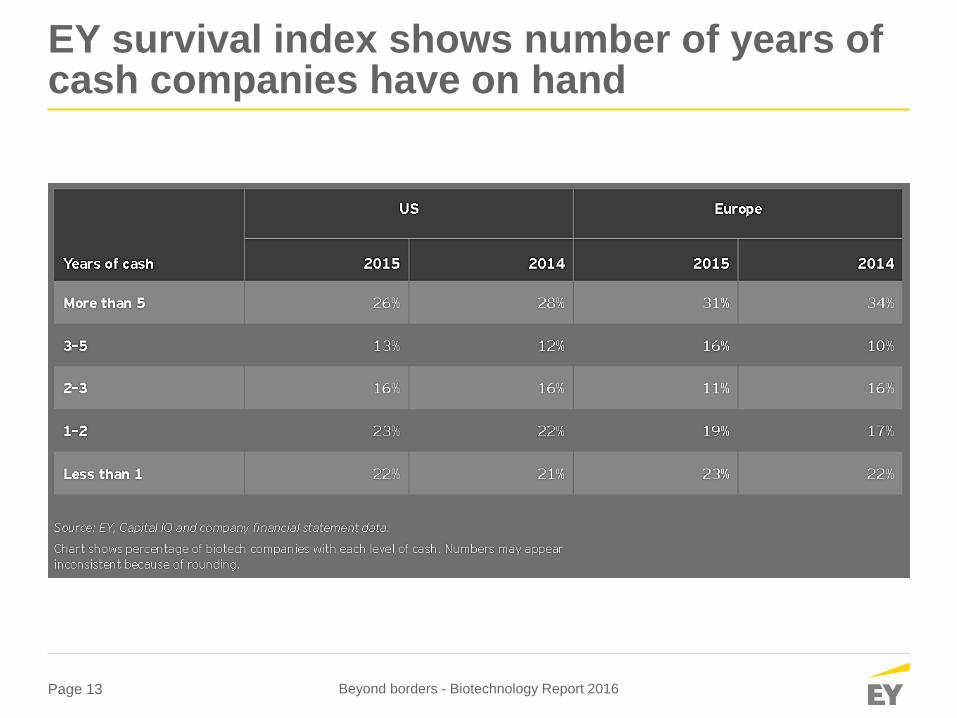
EY survival index shows number of years of cash companies have on hand
Beyond borders - Biotechnology Report 2016
Page 14
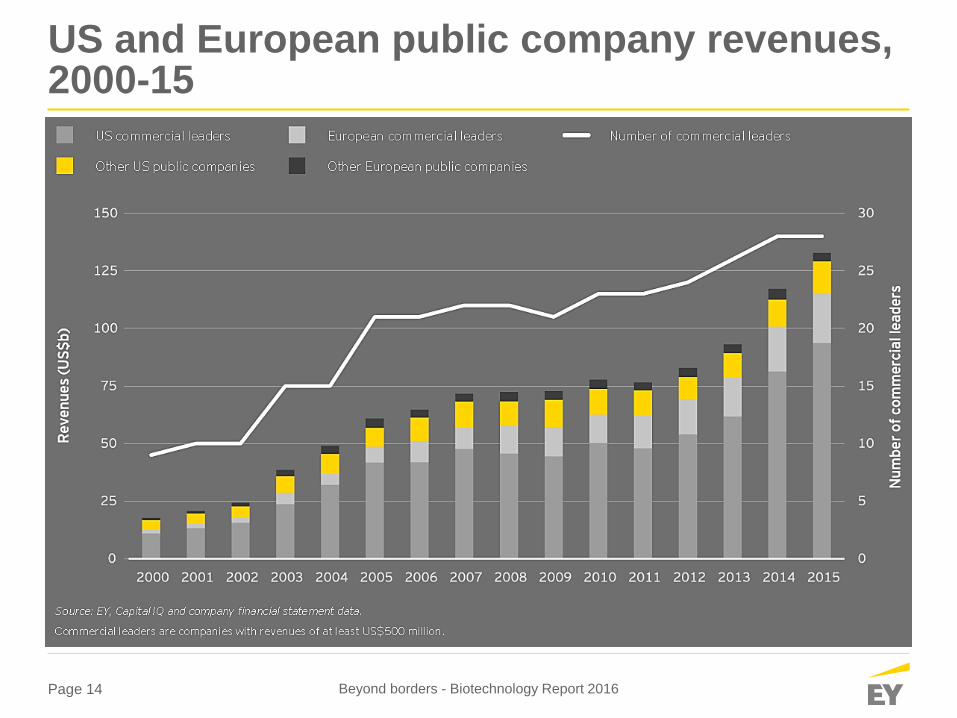
US and European public company revenues, 2000-15
Beyond borders - Biotechnology Report 2016

Page 15
Financial performance
Beyond borders - Biotechnology Report 2016
Europe
Page 16
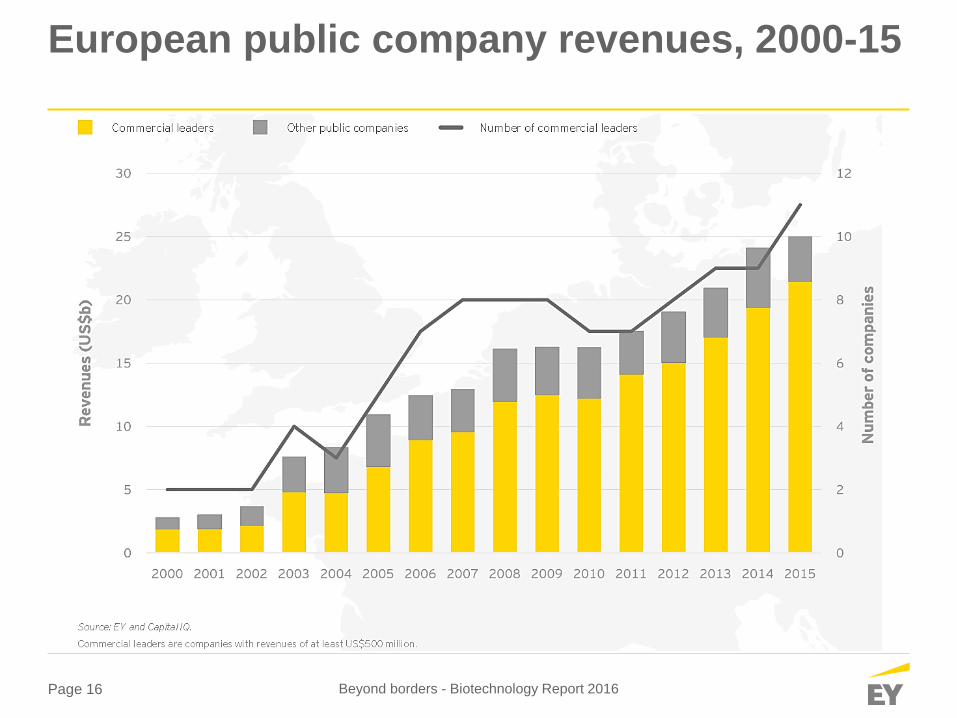
European public company revenues, 2000-15
Beyond borders - Biotechnology Report 2016
Page 17
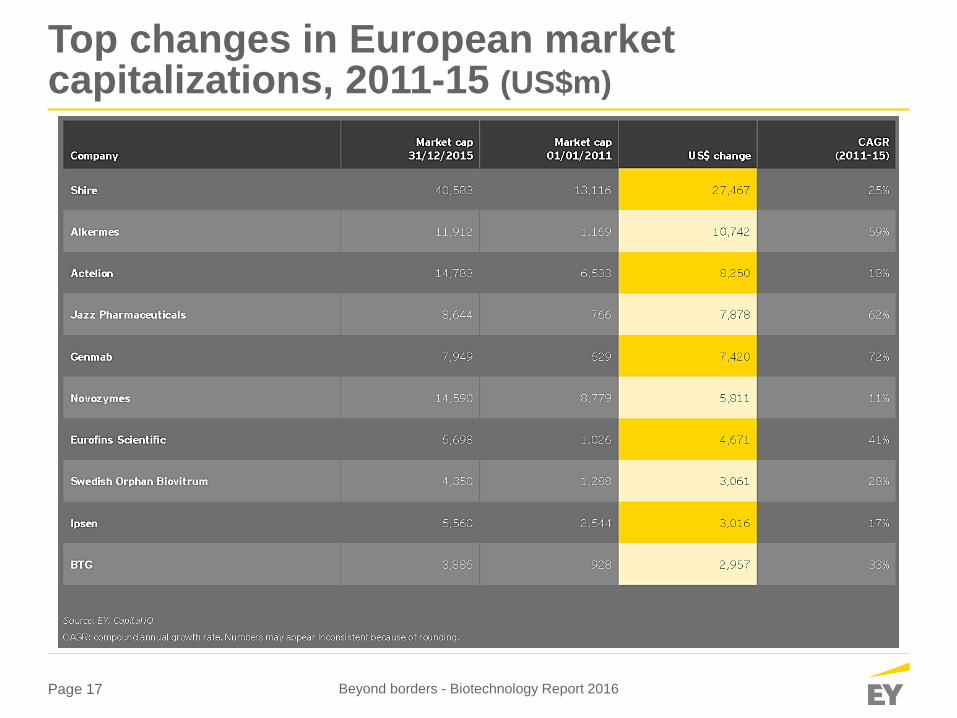
Top changes in European market capitalizations, 2011-15 (US$m)
Beyond borders - Biotechnology Report 2016
Page 18
Financing
Beyond borders - Biotechnology Report 2016
Global
Page 19
Innovation capital in the US and Europe surpassed US$40 billion in 2015
Beyond borders - Biotechnology Report 2016
Chart placeholder
Page 20
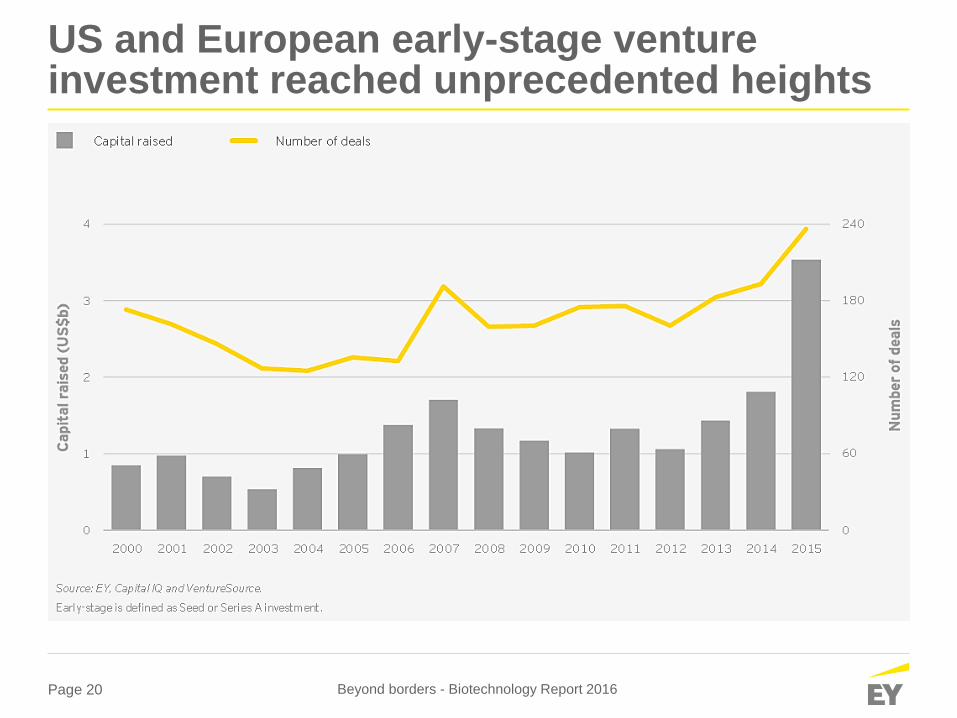
US and European early-stage venture investment reached unprecedented heights
Beyond borders - Biotechnology Report 2016
Page 21
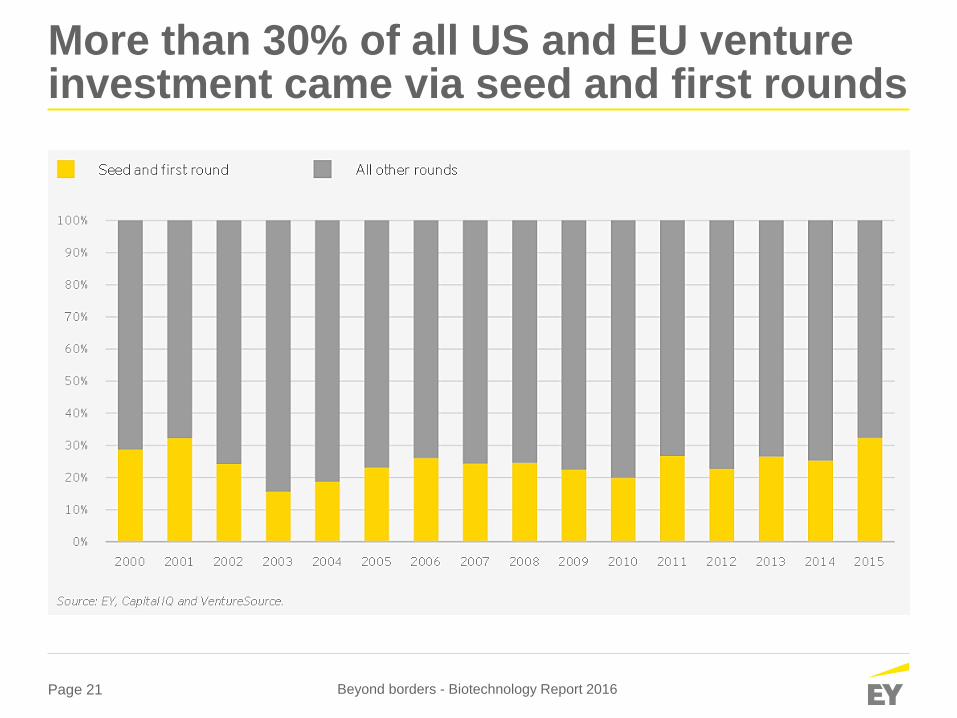
More than 30% of all US and EU venture investment came via seed and first rounds
Beyond borders - Biotechnology Report 2016
Page 22
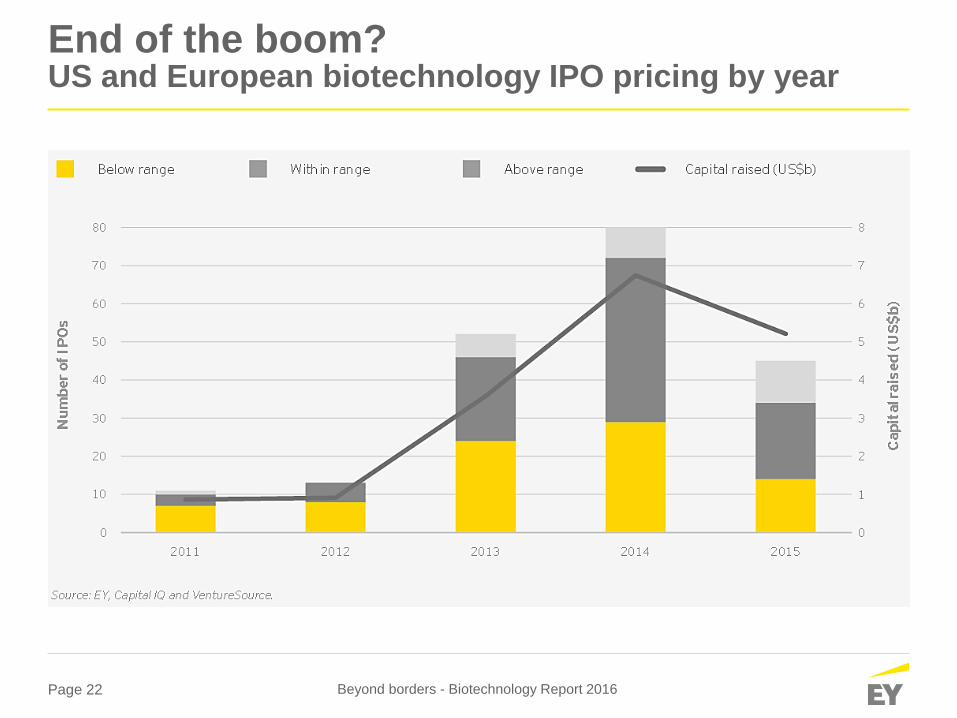
End of the boom? US and European biotechnology IPO pricing by year
Beyond borders - Biotechnology Report 2016
Page 23
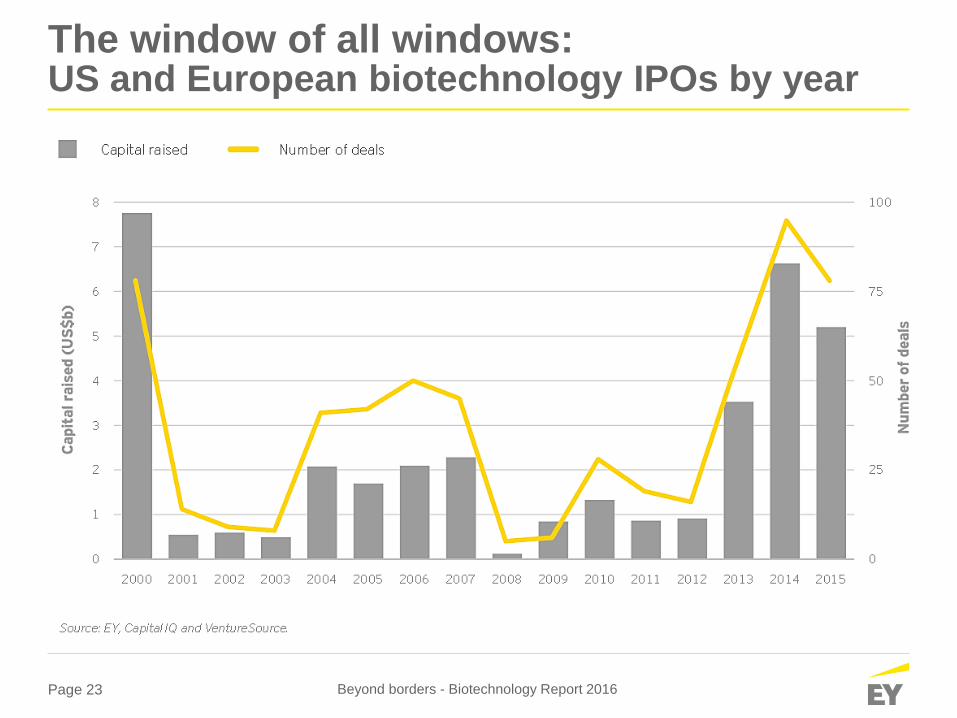
The window of all windows: US and European biotechnology IPOs by year
Beyond borders - Biotechnology Report 2016
Page 24
Financing
Beyond borders - Biotechnology Report 2016
US
Page 25
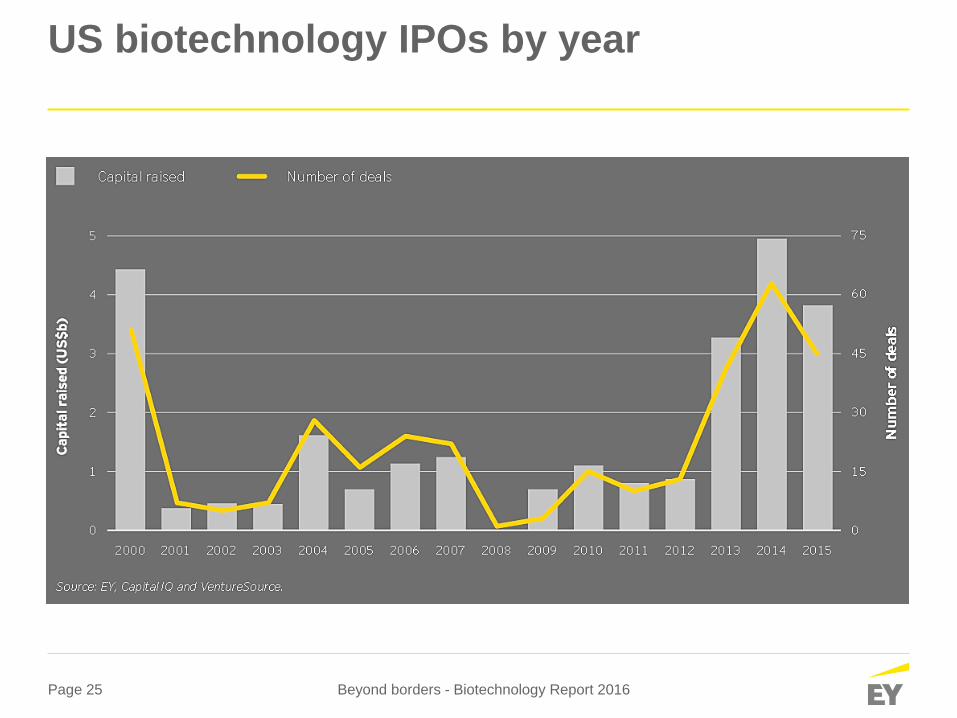
US biotechnology IPOs by year
Beyond borders - Biotechnology Report 2016
Page 26
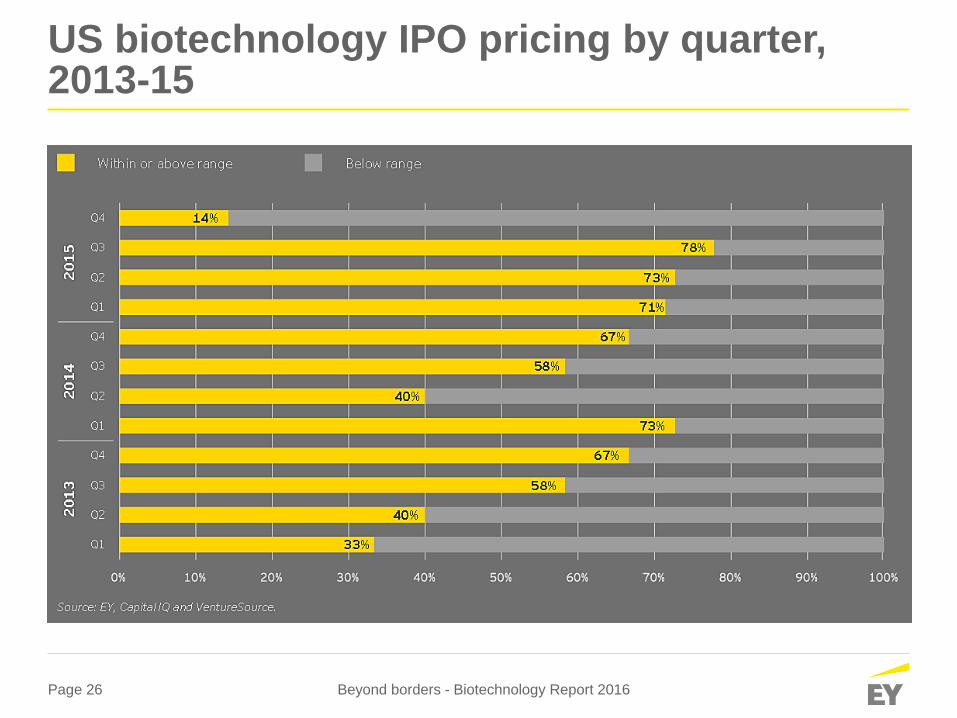
US biotechnology IPO pricing by quarter, 2013-15
Beyond borders - Biotechnology Report 2016
Page 27
Financing
Europe
Beyond borders - Biotechnology Report 2016
Page 28
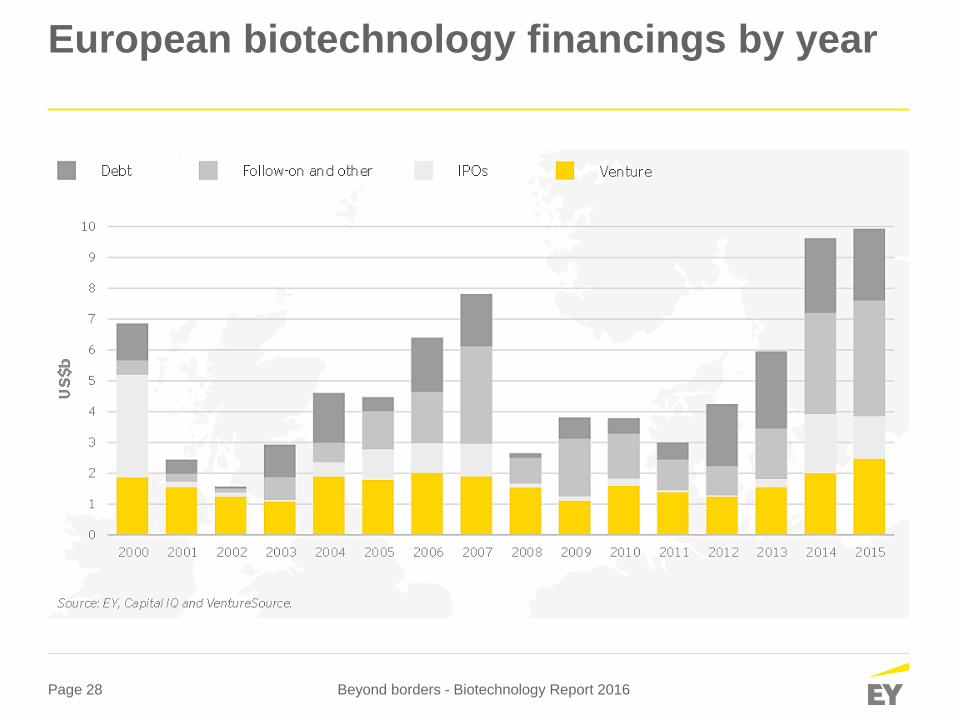
European biotechnology financings by year
Beyond borders - Biotechnology Report 2016
Page 29
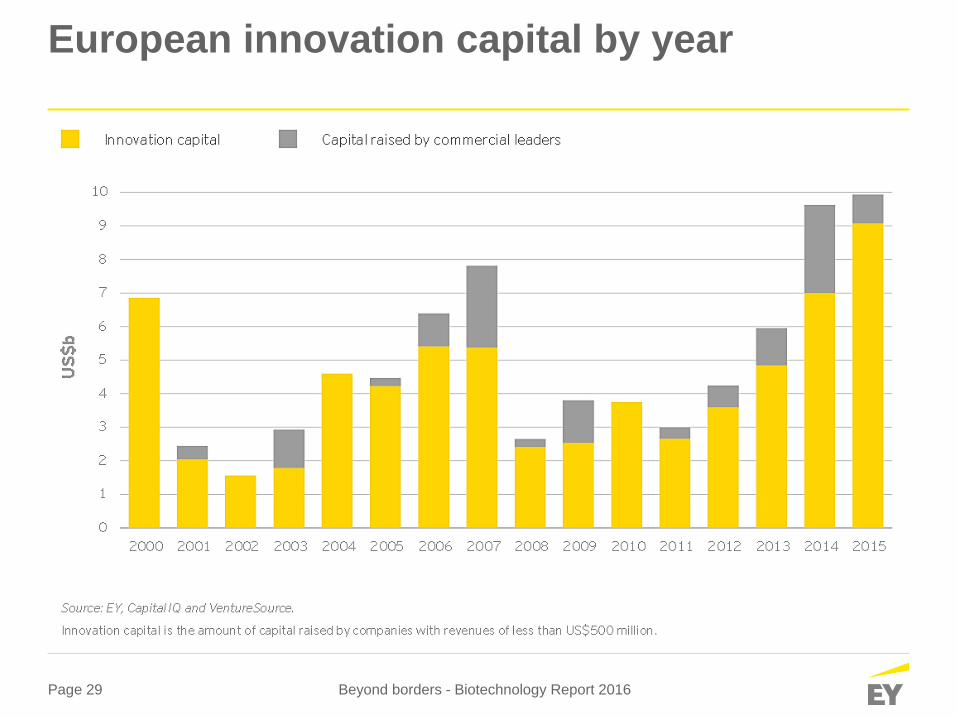
European innovation capital by year
Beyond borders - Biotechnology Report 2016
Page 30
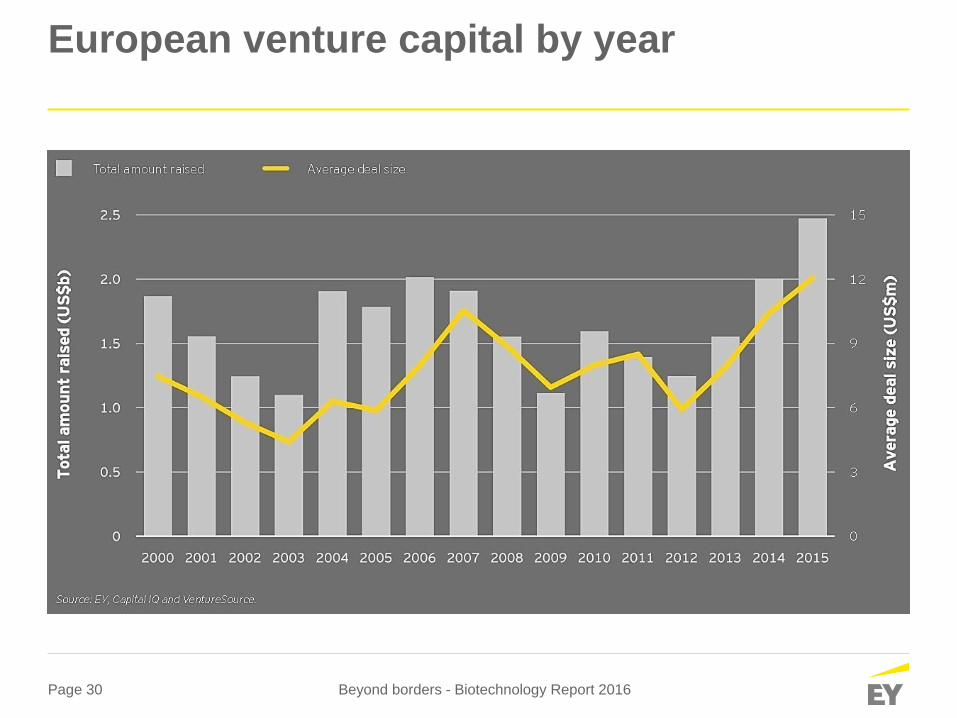
European venture capital by year
Beyond borders - Biotechnology Report 2016
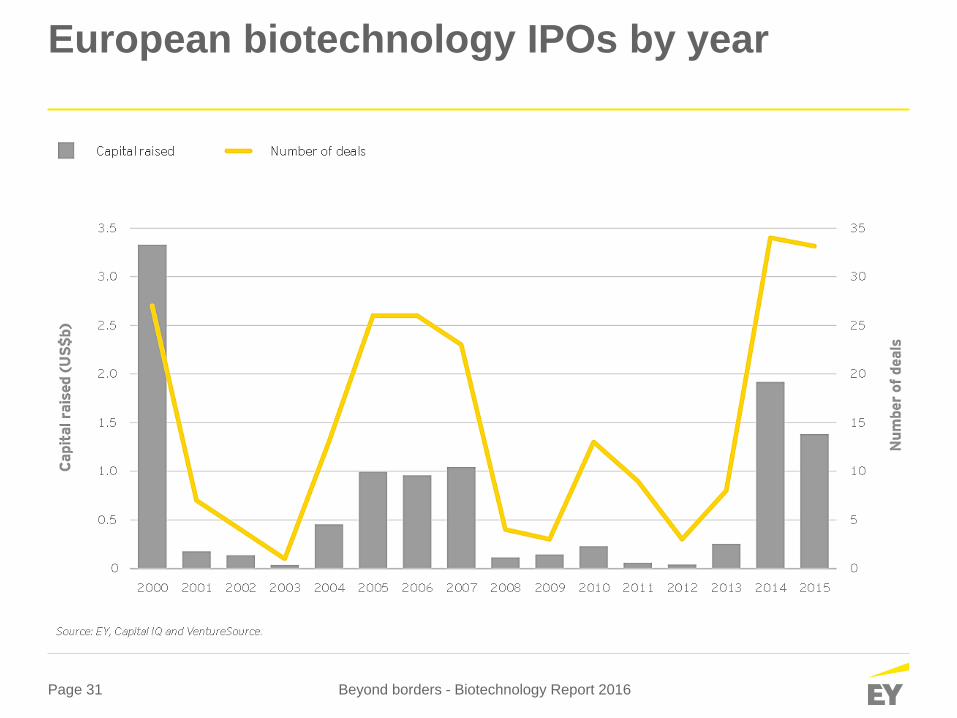
Page 31
European biotechnology IPOs by year
Beyond borders - Biotechnology Report 2016

Page 32
Deals
Beyond borders - Biotechnology Report 2016
Global
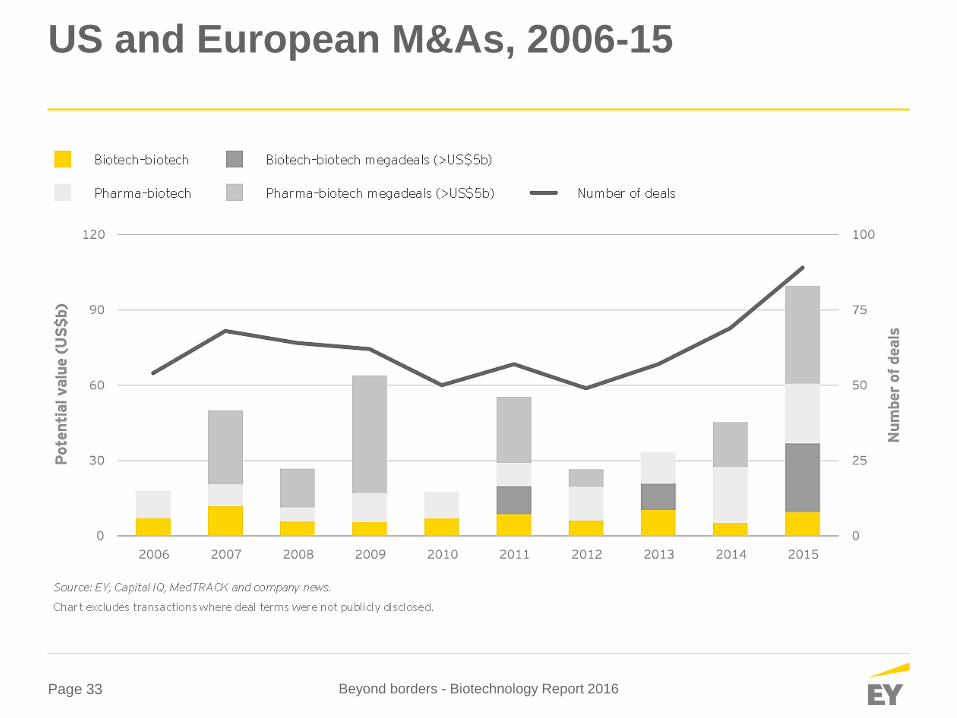
Page 33
US and European M&As, 2006-15
Beyond borders - Biotechnology Report 2016
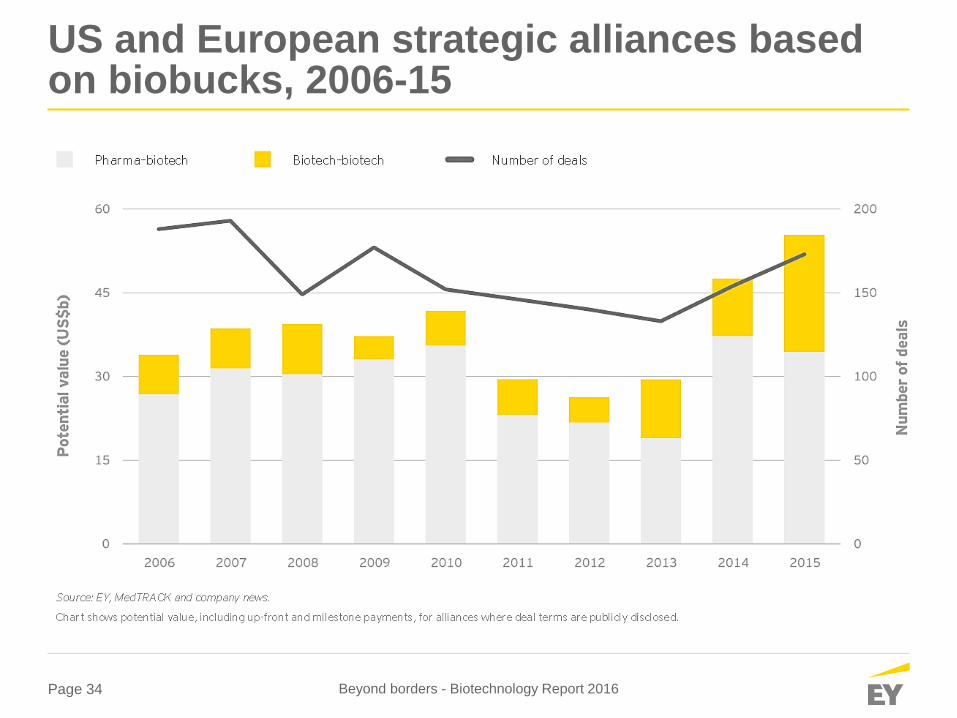
Page 34
US and European strategic alliances based on biobucks, 2006-15
Beyond borders - Biotechnology Report 2016
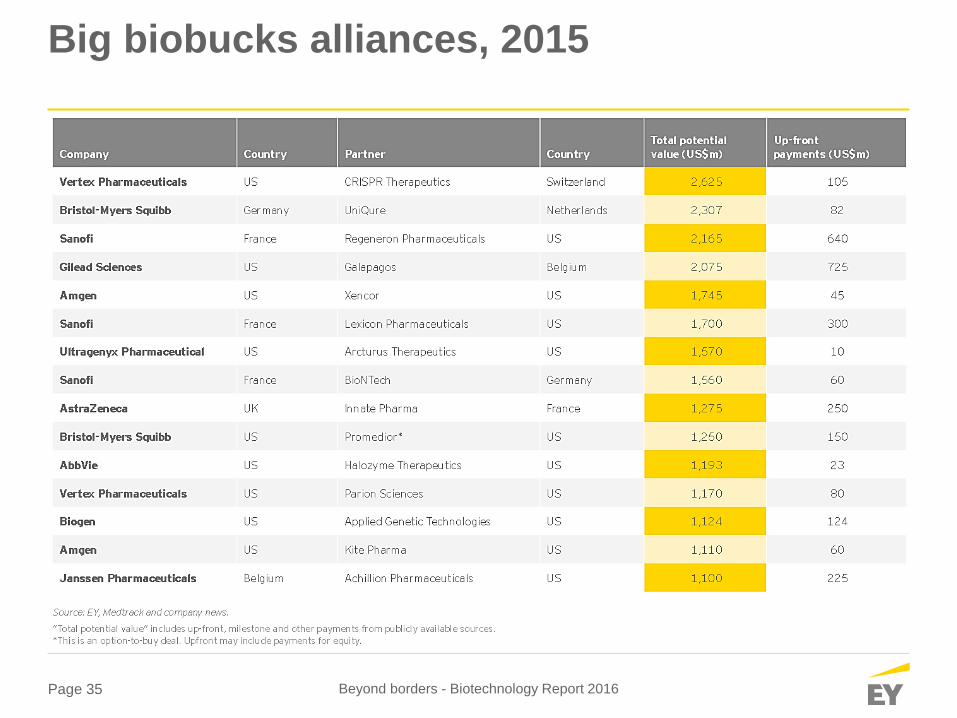
Page 35
Big biobucks alliances, 2015
Beyond borders - Biotechnology Report 2016
Page 36
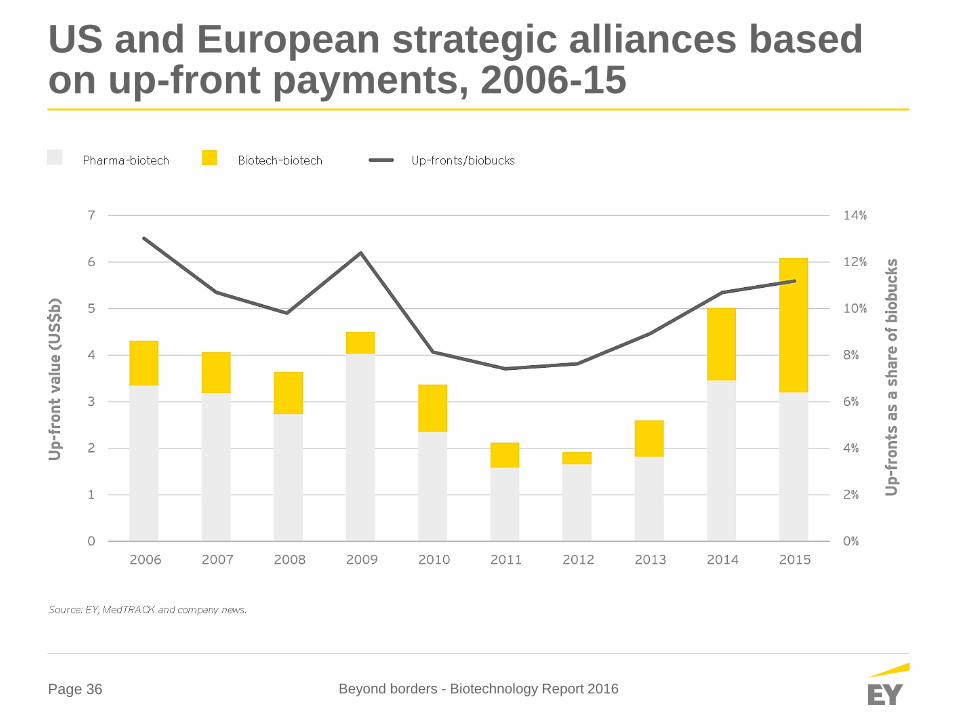
US and European strategic alliances based on up-front payments, 2006-15
Beyond borders - Biotechnology Report 2016
Page 37
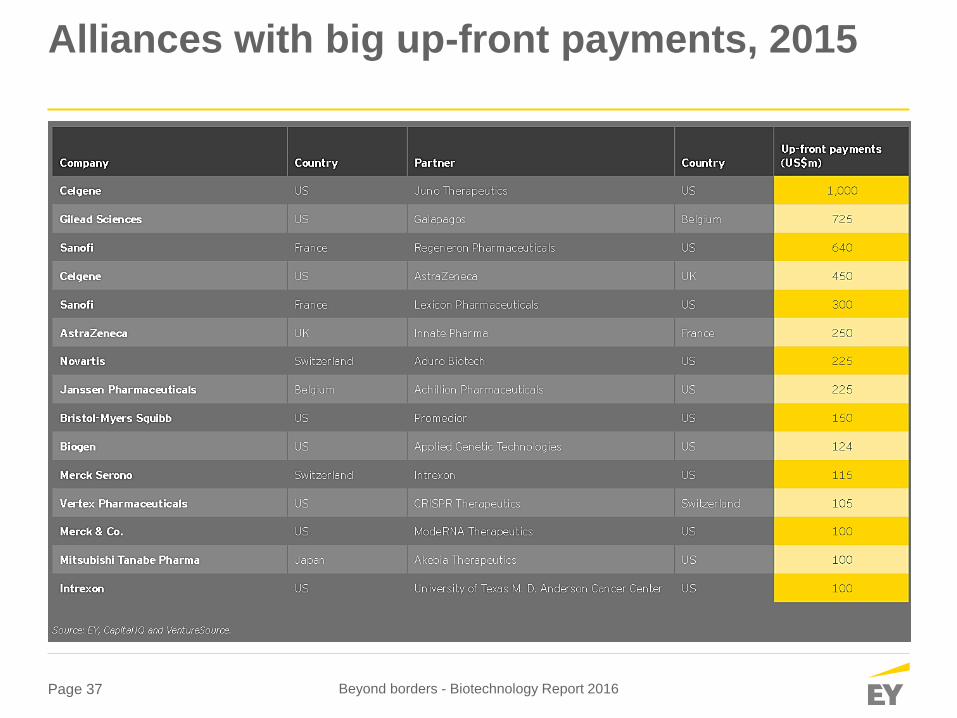
Alliances with big up-front payments, 2015
Beyond borders - Biotechnology Report 2016
Page 38
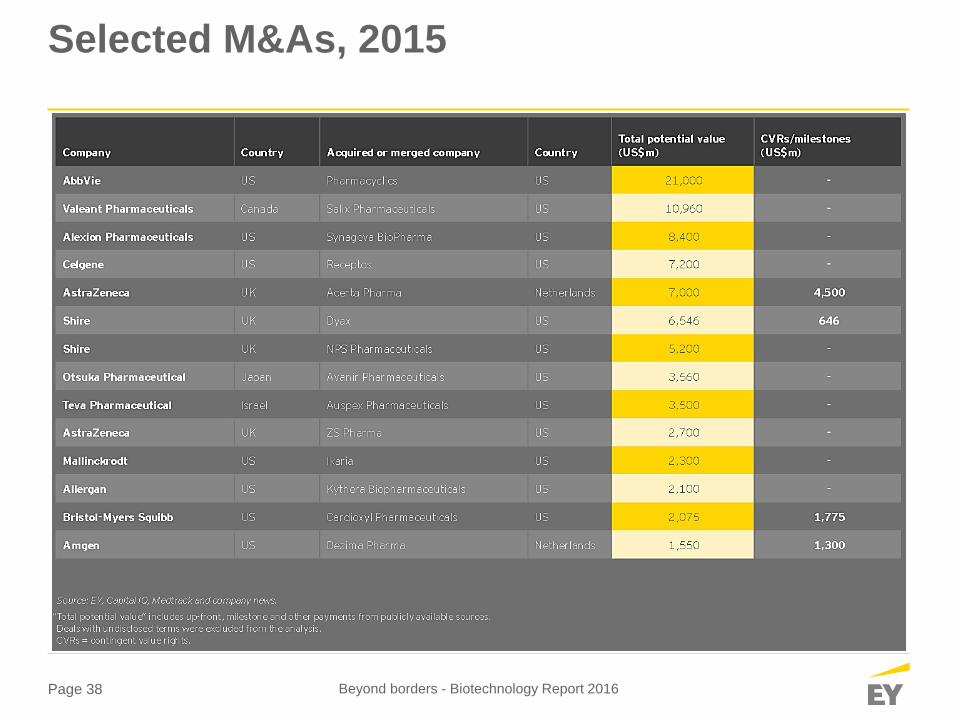
Selected M&As, 2015
Beyond borders - Biotechnology Report 2016
Page 39
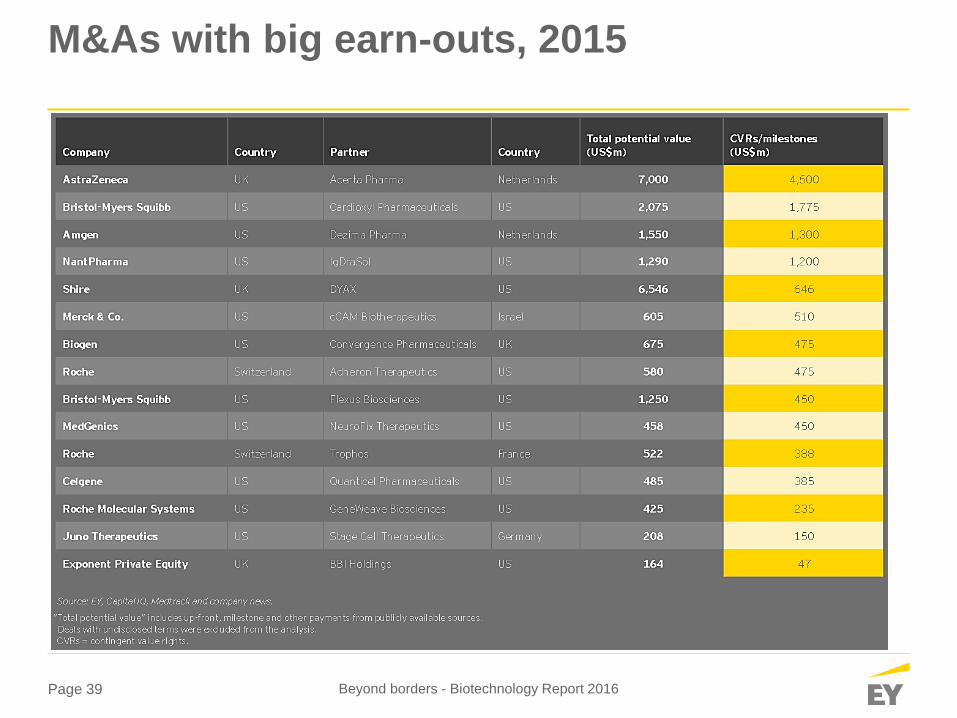
M&As with big earn-outs, 2015
Beyond borders - Biotechnology Report 2016

Page 40
Deals
Beyond borders - Biotechnology Report 2016
Europe
Page 41
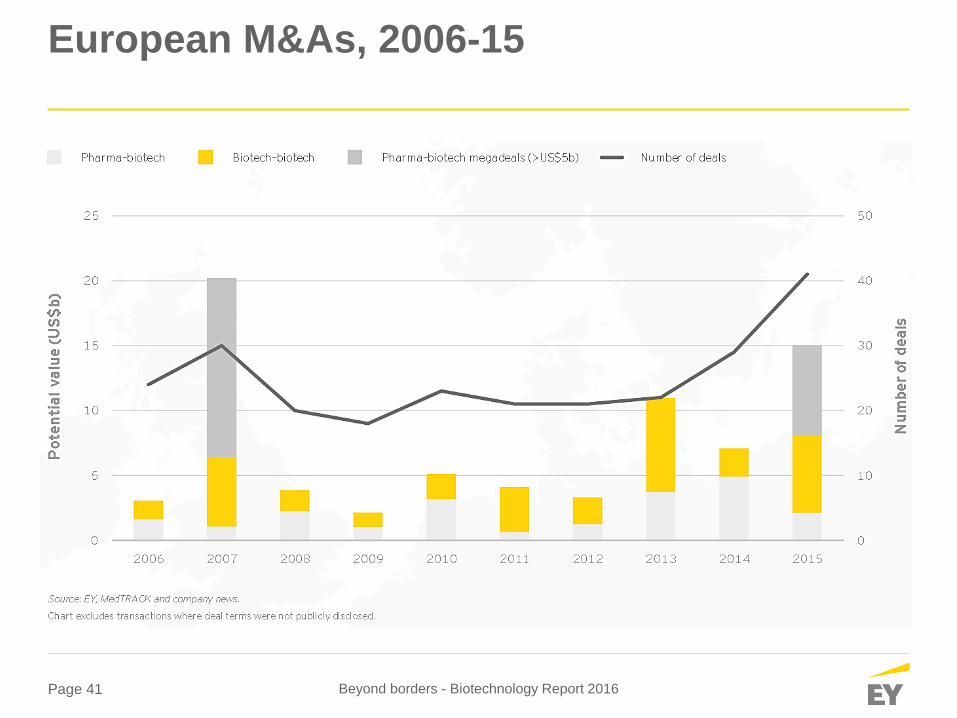
European M&As, 2006-15
Beyond borders - Biotechnology Report 2016
Page 42
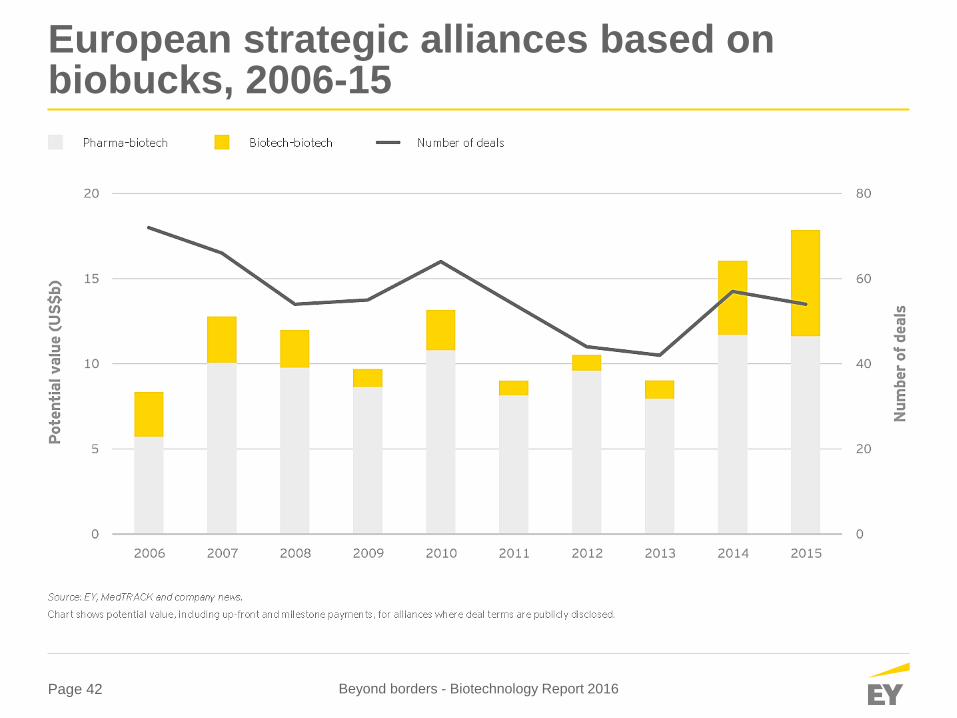
European strategic alliances based on biobucks, 2006-15
Beyond borders - Biotechnology Report 2016
Page 43
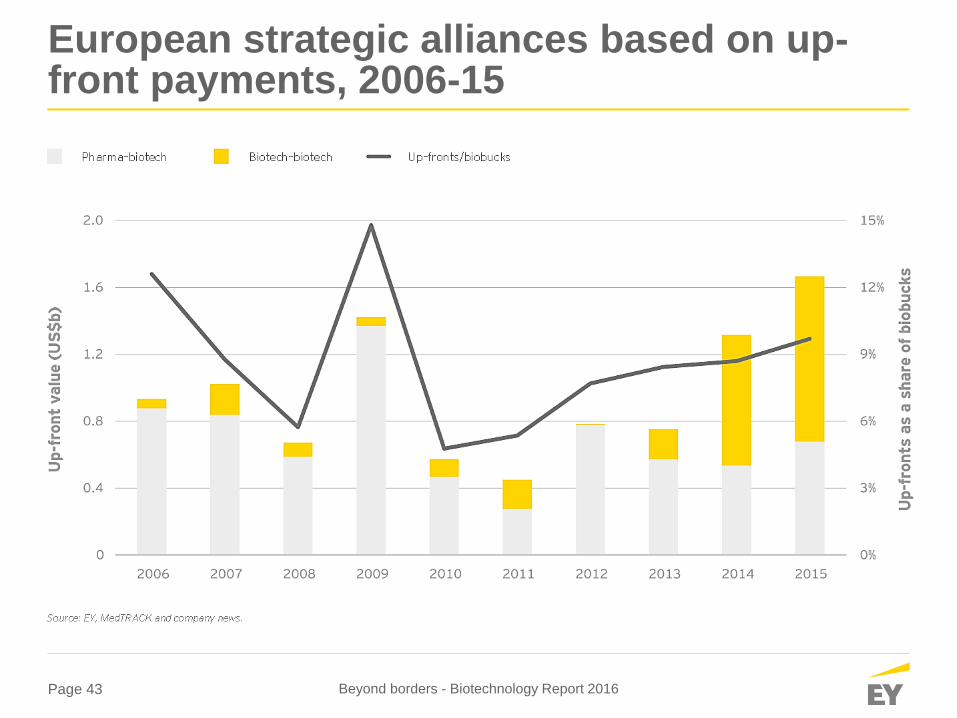
European strategic alliances based on up-front payments, 2006-15
Beyond borders - Biotechnology Report 2016

Page 44
Drug Pricing
Beyond borders - Biotechnology Report 2016
Page 45
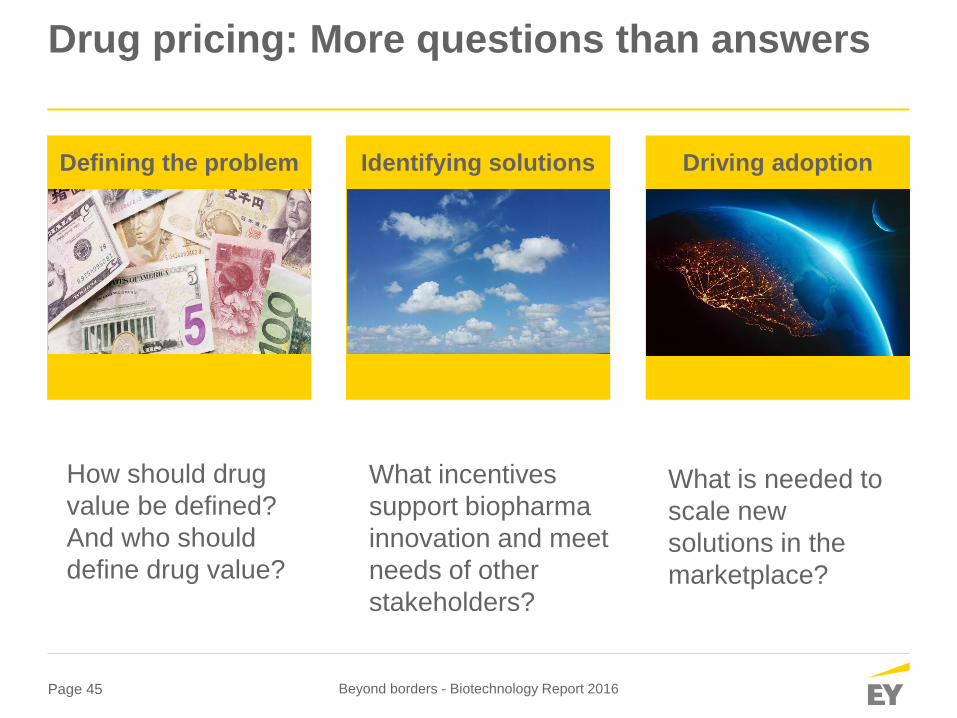
Drug pricing: More questions than answers
Beyond borders - Biotechnology Report 2016
What incentives
support biopharma
innovation and meet
needs of other
stakeholders?
What is needed to
scale new
solutions in the
marketplace?
How should drug
value be defined?
And who should
define drug value?
Defining the problem Identifying solutions Driving adoption
Page 46
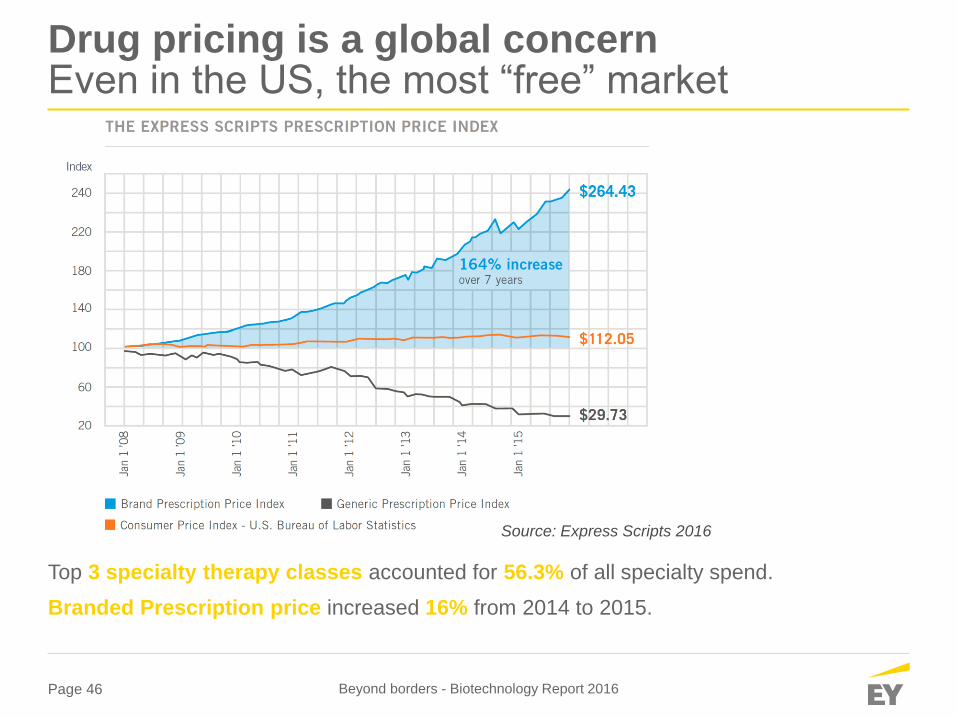
Drug pricing is a global concern Even in the US, the most “free” market
Top 3 specialty therapy classes accounted for 56.3% of all specialty spend.
Branded Prescription price increased 16% from 2014 to 2015.
Beyond borders - Biotechnology Report 2016
Source: Express Scripts 2016
Page 47
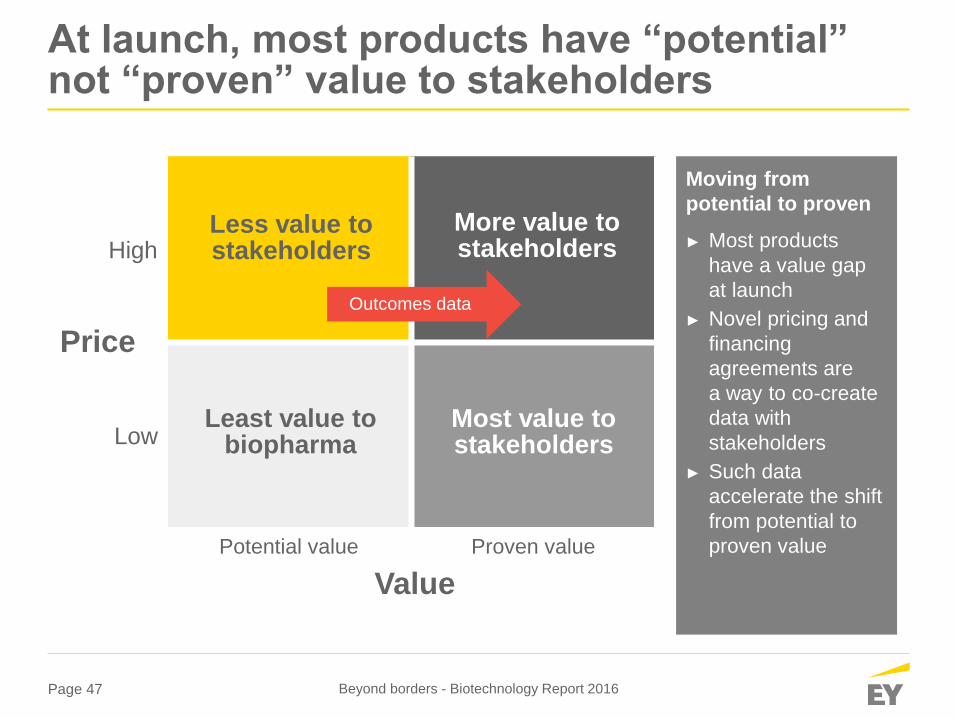
Moving from
potential to proven
► Most products
have a value gap
at launch
► Novel pricing and
financing
agreements are
a way to co-create
data with
stakeholders
► Such data
accelerate the shift
from potential to
proven value
At launch, most products have “potential” not “proven” value to stakeholders
High
Low
Potential value Proven value
Price
Value
Less value to stakeholders
Most value to stakeholders
More value to stakeholders
Least value to biopharma
Outcomes data
Beyond borders - Biotechnology Report 2016
Page 48
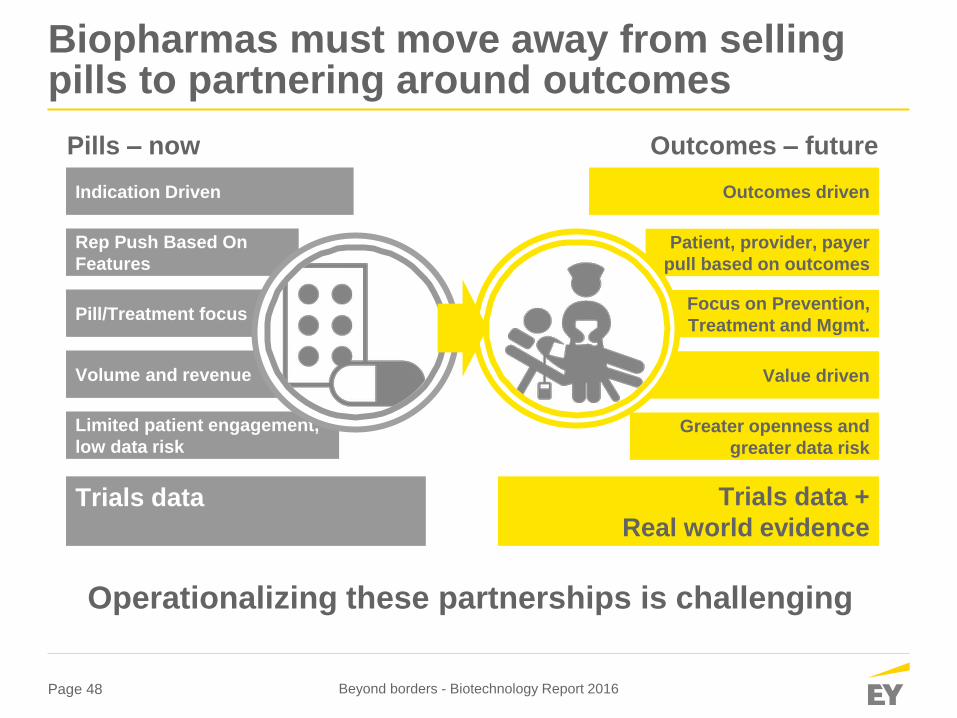
Biopharmas must move away from selling pills to partnering around outcomes
Outcomes driven
Patient, provider, payer
pull based on outcomes
Focus on Prevention,
Treatment and Mgmt.
Value driven
Indication Driven
Rep Push Based On
Features
Pill/Treatment focus
Volume and revenue
Limited patient engagement,
low data risk Greater openness and
greater data risk
Pills – now Outcomes – future
Trials data +
Real world evidence Trials data
Operationalizing these partnerships is challenging
Beyond borders - Biotechnology Report 2016
Page 49
Thank you and stay tuned
Download the report:
ey.com/beyondborders
Participate in our blog:
LifeSciencesBlog.ey.com
Follow us on Twitter:
@EY_LifeSciences
Jürg Zürcher Partner, Life Science Sector Leader Switzerland, Biotechnology Sector Leader EMEIA
Ernst & Young AG Rain 41 Telefon: + 41 58 286 23 74 CH-5001 Aarau jürg.zü[email protected]
Beyond borders - Biotechnology Report 2016
Page 50
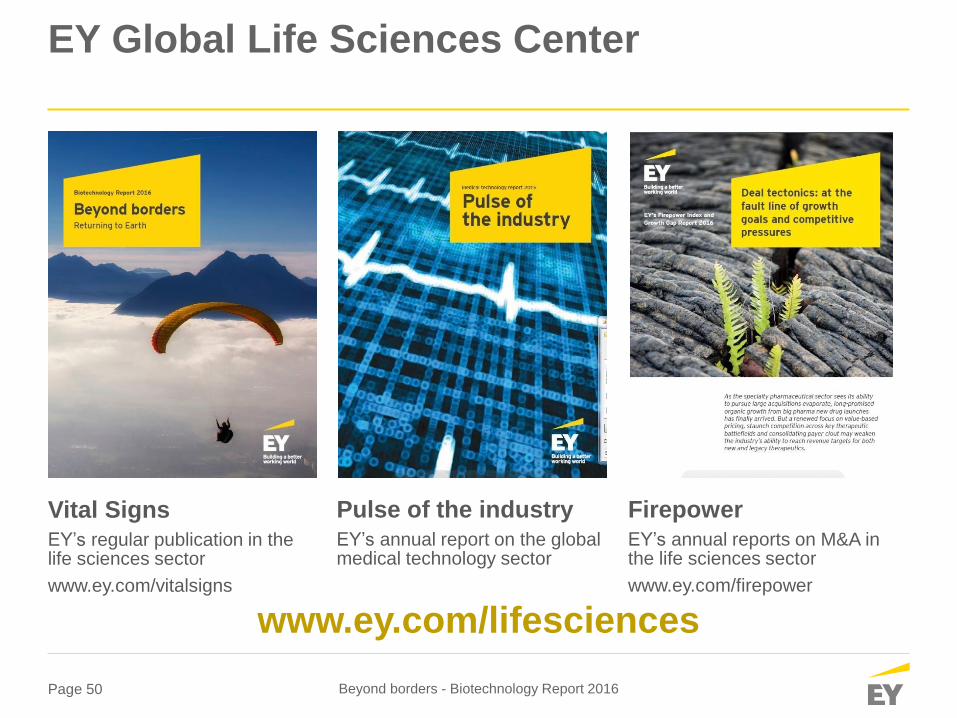
EY Global Life Sciences Center
Vital Signs
EY’s regular publication in the life sciences sector
www.ey.com/vitalsigns
Pulse of the industry
EY’s annual report on the global medical technology sector
Firepower
EY’s annual reports on M&A in the life sciences sector
www.ey.com/firepower
www.ey.com/lifesciences
Beyond borders - Biotechnology Report 2016
Page 51
EY | Assurance | Tax | Transactions | Advisory
Über die globale EY-Organisation
Die globale EY-Organisation ist eine Marktführerin in der Wirtschaftsprüfung,
Steuerberatung, Transaktionsberatung und Rechtsberatung sowie in den Advisory
Services. Wir fördern mit unserer Erfahrung, unserem Wissen und unseren
Dienstleistungen weltweit die Zuversicht und die Vertrauensbildung in die
Finanzmärkte und die Volkswirtschaften. Für diese Herausforderung sind wir dank gut
ausgebildeter Mitarbeitender, starker Teams sowie ausgezeichneter Dienstleistungen
und Kundenbeziehungen bestens gerüstet. Building a better working world: Unser
globales Versprechen ist es, gewinnbringend den Fortschritt voranzutreiben – für
unsere Mitarbeitenden, unsere Kunden und die Gesellschaft.
Die globale EY-Organisation besteht aus den Mitgliedsunternehmen von Ernst &
Young Global Limited (EYG). Jedes EYG-Mitgliedsunternehmen ist rechtlich
selbstständig und unabhängig und haftet nicht für das Handeln und Unterlassen der
jeweils anderen Mitgliedsunternehmen. Ernst & Young Global Limited ist eine
Gesellschaft mit beschränkter Haftung nach englischem Recht und erbringt keine
Leistungen für Kunden. Weitere Informationen finden Sie auf unserer Website:
www.ey.com.
Die EY-Organisation ist in der Schweiz durch die Ernst & Young AG, Basel, an zehn
Standorten sowie in Liechtenstein durch die Ernst & Young AG, Vaduz, vertreten.
«EY» und «wir» beziehen sich in dieser Publikation auf die Ernst & Young AG, Basel,
ein Mitgliedsunternehmen von Ernst & Young Global Limited.
©2015 Ernst & Young AG
All Rights Reserved.
www.ey.com/ch
Beyond borders - Biotechnology Report 2016