Embed Size (px)
Citation preview

Available online at www.sciencedirect.com
Procedia - Social and Behavioral Sciences 00 (2013) 1–14
Conference on Agent-Based Modeling in Transportation Planning and Operations
Modeling Urban Transportation in the Aftermath of a NuclearDisaster: The Role of Human Behavioral Responses
Abhijin Adiga1, Madhav V. Marathe, Henning S. Mortveit, Sichao Wu, Samarth Swarup
Network Dynamics and Simulation Science Laboratory, Virginia Bioinformatics Institute, Virginia Tech, Blacksburg, VA 24061.
email:{abhijin,mmarathe,henning,sichao,swarup}@vbi.vt.edu
Abstract
This paper describes an integrated modeling environment for a large urban transportation system designed to capturehuman behaviors in the aftermath of an improvised nuclear device denotation. The integrated environment modelsthe complex interplay of human behavior (under deteriorating health conditions) and infrastructural systems in theaftermath of such a hypothetical crisis. Prior work on this scenario has covered in detail physical and radiologicaleffects of the blast, casualty estimates and impact on health, evacuation strategies, etc. assuming a static populationdistribution. Relatively few studies have accounted for how people respond to the event and the strong coupling thatexists between the various infrastructural systems. This paper highlights the design aspects of the system concerningthe transportation and behavior modules and their interactions. The transportation model incorporates dynamic networkloading for auto and walk travel modes, group travel, crowd-following, as well as adjustments for ambient traffic toaccount for network loads caused by external agents. We present a collection of computational experiments offeringinsight into how different individual and collective behaviors of agents can affect evacuation times, route choices andhealth effects.
c© 2013 The Authors, Published by Elsevier B.V.Selection and/or peer-review under responsibility of Chinese Overseas Transportation Association (COTA).
Keywords: Transportation, routing, constraints, sensitivity, stability, human behavior
1. Introduction
Large-scale natural and human-initiated disasters are a constant concern throughout the world. Overthe past decade, planning and response to such contingencies have become key issues addressed by trans-portation research. Work in this area is to a great extent driven by the category of the disaster beingstudied which in turn determines other aspects such as the possibility of advanced warning, the extent ofthe damage as well as the level of uncertainty and fear that it evokes within the population. For example, ahurricane may affect a very large region while providing a long warning time. However, other events suchas earthquakes and nuclear detonations provide no warning whatsoever. Modeling and simulation systemshave been used to analyze the impact of such events on the population and transportation infrastructureunder various evacuation strategies and restoration scenarios.
1Corresponding author. Tel: 540-231-1377.Email address: [email protected]

2 Adiga et al. / Procedia - Social and Behavioral Sciences 00 (2013) 1–14
Here we focus on parts of a modeling environment employing disaggregated agent-based simulationmethods to model the collective behavior after the detonation of a nuclear device in downtown Wash-ington D.C. The population modeled in our study only captures those individuals located directly in thedowntown area that was impacted which we refer to as the detailed study area, or DSA. Here, the entiresystem is composed of the following modules: human behavior, health, transportation, communication,electrical power, and infrastructure damage. An overview of the modeling environment is given in (Barrettet al., 2013), while the behavior, health and communication modules have been covered in (Parikh et al.,2013; Chandan et al., 2013). Here, we describe the transportation module and related aspects of the behav-ior module. We are interested in how the behavioral options of agents can affect route and mode choices aswell as travel times which subsequently may influence health and network clearance time.
For the studied scenario, the prompt blast and radiation effects significantly damage the transportationsystem and cause power and communication failures. It impacts peoples’ health which in turn impacts theirbehavior and mobility. Also modeled is the human reaction to this extreme event which includes behaviorssuch as panic, efforts to reach family members (household reconstitution), aid & assist, and attempts toevacuate. This in turn may lead to traffic congestion in certain routes, which may have an adverse impacton the health conditions due to continued radiation exposure and effects of blast. In (Parikh et al., 2013;Chandan et al., 2013), the impact of emergency broadcasts has been analyzed using this system. In (Adigaet al., 2012), a sensitivity analysis of the transportation module was performed with respect to ambienttraffic density.
1.1. Related Work
During the last several decades, a number of computational models have been developed to analyzeand evaluate emergency evacuation plans. Examples include NETVAC, DYNEV, MASSVAC, TEDSS,IMDAS, OREMS, CEMPS and so on; see (Pel et al., 2012) and references therein. Usually, these modelsassume that the traffic flow and the network characteristics are static, i.e. determined at the time of theimpact. The network characteristics such as ambient traffic density and maximum travel speed may changesubstantially as a result of the crisis. Dynamic traffic management and control measures are introducedto incorporate these effects. For example, (Bish et al., 2013) studied the staging and routing strategieswhich attempt to manage travel demand in order to reduce or eliminate congestion, while (Kim & Shekhar,2005) consider contraflow, or lane reversals, as a potential remedy to solve the tremendous congestion byincreasing outbound evacuation route capacity. Some other dynamic simulation models integrate decisionsupport systems. For instance, (Lindell & Perry, 2012) consider the processing of information derivedfrom social and environmental cues. In addition, to simulate traffic conditions on a transportation networkin case of evacuation, it is unavoidable to make assumptions on how travelers may behave. As a result,psycho-behavioral research techniques are also included in this types of situations, see (Parikh et al., 2013;Pel et al., 2012; Flotterod et al., 2012; Lambert et al., 2012; Parlak et al., 2012) as examples. For anoverview of research in evacuation modeling and simulation and current trends, see the recent survey by(Murray-Tuite & Wolshon, 2013) and the references therein.
After the 9/11 attack, considerable attention has been focused on plans for sheltering or evacuating thepopulation of the U. S. national capital region in response to a human-initiated emergency such as a dirtybomb attack. A lot of researchers have conducted simulation experiments on such improvised nuclear dis-asters, and past studies have focused on physical and radiological effects of the blast, effect on human lifebased on static geographic distribution of population and evacuation policies and strategies (Buddemeieret al., 2011; Wein et al., 2010; Dombroski & Fischbeck, 2006; K., 2011; Homeland Security Council In-teragency Policy Coordination Subcommittee, 2009). However, these studies ignore the effects of humanbehavior and response to the event. Some other simulation models endow agents with traits based on psy-chological models, though they have not included infrastructural aspects (Pelechano et al., 2005; Pelechano& Badler, 2006; Barrett et al., 2012). As a matter of fact, human behavior and various infrastructural sys-tems are coupled, that is to say, damage to infrastructure such as buildings and roads influences populationmobility and behavioral responses that could result in an increase in travel time. On the other hand, theimpact of citizen’s actions creates a load on infrastructural systems that can also lead to traffic congestion.To the best of our knowledge, few modeling efforts consider the strong coupling that exists between massbehavior and critical infrastructures such as transportation, communication and power.

Adiga et al. / Procedia - Social and Behavioral Sciences 00 (2013) 1–14 3
1.2. Experiments and resultsWe considered the impact of three behavioral options (a) household reconstitution (HHR) with group
travel (GT), (b) crowd-following (CF) behavior and (c) travel mode constraints. Household reconstitutionmeans that the members of a household seeks to unite after initially being separated. Once reunited (fully orpartially), members of the household may travel together as a group to accomplish their next goal. Crowd-following refers to the behavior where individuals or groups choose route segments involving roads withlarger densities of pedestrians. In the travel mode choice experiments, we studied the effect of assigningdifferent mode choices to agents. Two common metrics were used to quantify the impact of each of thesebehaviors: (1) the number of agents who evacuate the DSA, and (2) their health status as a function of timeelapsed after the event.
Our computational experiments suggest that the HHR behavior can have a significant impact on routechoices of agents and in turn, evacuation time and health. One main factor contributing to this outcome isthat agents, especially in the absence of information, tend to stay longer in the DSA and even worse, movetowards ground zero to unite with family members. Clearly, this action leads to more radiation exposureas well delay in evacuation. Our findings are consistent with those of (Chandan et al., 2013) where thesame simulation system was used to study the effect of restoring communication rapidly, informing andinstructing people about the event through emergency broadcasts.
In the CF experiment, we observed that increasing the inclination of agents to follow links with higherpedestrian densities, makes people take the less optimal route in terms of travel time and therefore longerevacuation times which matches intuition. Also, we observed that the greater the inclination, the higherthe number of heavily loaded links. However, these are preliminary studies, and in future work it would bemore meaningful to incorporate additional quantitative validation steps.
In the travel mode choice experiments, some agents were assigned more flexible mode choices than theexisting ones and the effect on travel times and route assignments were observed.
Paper outline. In Section 2, we give a more careful outline of the scenario and the overall simulationmodel. This is followed by a detailed description of the transportation model in Section 3 covering thenetwork construction, router and delay computations. Some more details of the human behavior modulefollow in Section 4. The computational experiments investigating the impact of household reconstitutionbehavior, group travel, crowd-following and mode choice with our findings are described in Section 5.
2. Overall System Description
2.1. ScenarioThe scenario is based on the work of Buddemeier et al. (Buddemeier et al., 2011) and Wein et al.
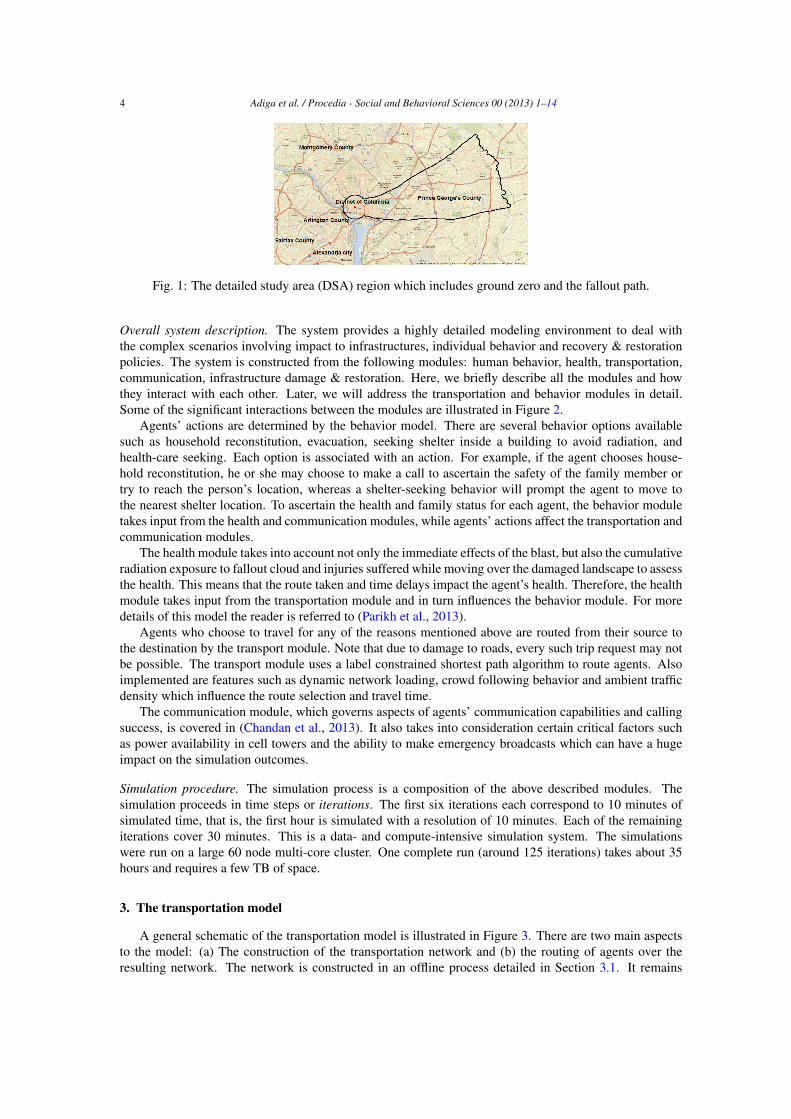
(Wein et al., 2010). A hypothetical nuclear detonation occurs at ground level on a working day at 11 a.m.in downtown Washington D.C. on the corner of 16th and K Street NW. The blast covers a circular areafrom ground zero and the radioactive fallout cloud spreads mainly eastward and east-by-northeastward.The simulation model focuses on the population inside the detailed study area (DSA) shown in Figure 1.The immediate effects of the blast include human casualties which occur due to burns, prompt radiationsickness, trauma from blast and falling structures and significant damage to infrastructure such as buildings,roads, communication and power systems. Even after these initial blast effects have tapered off, healthconditions deteriorate and casualties occur due to fallout contamination and radiation sickness. The entiresimulation model seeks to answer questions such as how human behavior and various policies affect thenumber of lives saved.
2.2. System ModelSynthetic population. A synthetic population of the Washington DC Metro Area is constructed based onthe work of (Barrett et al., 2010) and (Beckman et al., 1996) with extensions to include transient populations(such as tourists or business travelers) and dorm students. It is created based on statistical samples anddistributions of relevant demographic variables and contains information about home locations and dailyactivity patterns. The total size of the population in this region is over four million. In our simulationshowever, we limit our attention to the people in the DSA at the time of impact, a population of 730, 833agents, see (Parikh et al., 2013).
4 Adiga et al. / Procedia - Social and Behavioral Sciences 00 (2013) 1–14
Fig. 1: The detailed study area (DSA) region which includes ground zero and the fallout path.
Overall system description. The system provides a highly detailed modeling environment to deal withthe complex scenarios involving impact to infrastructures, individual behavior and recovery & restorationpolicies. The system is constructed from the following modules: human behavior, health, transportation,communication, infrastructure damage & restoration. Here, we briefly describe all the modules and howthey interact with each other. Later, we will address the transportation and behavior modules in detail.Some of the significant interactions between the modules are illustrated in Figure 2.
Agents’ actions are determined by the behavior model. There are several behavior options availablesuch as household reconstitution, evacuation, seeking shelter inside a building to avoid radiation, andhealth-care seeking. Each option is associated with an action. For example, if the agent chooses house-hold reconstitution, he or she may choose to make a call to ascertain the safety of the family member ortry to reach the person’s location, whereas a shelter-seeking behavior will prompt the agent to move tothe nearest shelter location. To ascertain the health and family status for each agent, the behavior moduletakes input from the health and communication modules, while agents’ actions affect the transportation andcommunication modules.
The health module takes into account not only the immediate effects of the blast, but also the cumulativeradiation exposure to fallout cloud and injuries suffered while moving over the damaged landscape to assessthe health. This means that the route taken and time delays impact the agent’s health. Therefore, the healthmodule takes input from the transportation module and in turn influences the behavior module. For moredetails of this model the reader is referred to (Parikh et al., 2013).
Agents who choose to travel for any of the reasons mentioned above are routed from their source tothe destination by the transport module. Note that due to damage to roads, every such trip request may notbe possible. The transport module uses a label constrained shortest path algorithm to route agents. Alsoimplemented are features such as dynamic network loading, crowd following behavior and ambient trafficdensity which influence the route selection and travel time.
The communication module, which governs aspects of agents’ communication capabilities and callingsuccess, is covered in (Chandan et al., 2013). It also takes into consideration certain critical factors suchas power availability in cell towers and the ability to make emergency broadcasts which can have a hugeimpact on the simulation outcomes.
Simulation procedure. The simulation process is a composition of the above described modules. Thesimulation proceeds in time steps or iterations. The first six iterations each correspond to 10 minutes ofsimulated time, that is, the first hour is simulated with a resolution of 10 minutes. Each of the remainingiterations cover 30 minutes. This is a data- and compute-intensive simulation system. The simulationswere run on a large 60 node multi-core cluster. One complete run (around 125 iterations) takes about 35hours and requires a few TB of space.
3. The transportation model
A general schematic of the transportation model is illustrated in Figure 3. There are two main aspectsto the model: (a) The construction of the transportation network and (b) the routing of agents over theresulting network. The network is constructed in an offline process detailed in Section 3.1. It remains

Adiga et al. / Procedia - Social and Behavioral Sciences 00 (2013) 1–14 5
CommunicationCollective behavior andinfrastructure statusdetermine call success
Behavior: HouseholdReconstitution
- Try to ascertain familystatus by calling/texting- Move towards family
TransportationCollective behavior andtransportation system
status determinecongestion and rate of
movement
HealthRoute selected and rateof movement determineexposure and health
status
Call outcomes
affect future
behaviorBehavior
determines
calling pattern
Behavior
determines
destination
selection
Route taken
determines
health status
Health status
affects future
behavior
Fig. 2: A schematic of the overall simulation system with all the prominent modules and their primaryinteractions. (courtesy (Parikh et al., 2013)).
unchanged throughout the simulation except for delays on links which can be affected by dynamic loading.In each iteration the transportation module queries a database which keeps track of the current data forthe agents. A trip request is constructed for each agent whose current location and desired destinationare different. It is a triple specifying the source, the destination, and the travel mode. The source anddestination are network nodes, and the travel mode specifies whether the agent has access to an automobileor not. The model permits group travel where an agent may follow a leader, in which case, the trip requestfor the agent will match that of the leader. Using the network and the delay information on each link, therouter computes the route corresponding to the trip request. The route is specified as a path of nodes andlinks labeled by travel mode.
3.1. The transportation network
The transportation network is constructed in an offline process as a union of several networks. Thenetworks included in this case were: (a) Road data (NAVTEQ) (b) Bus route data from the WashingtonMetropolitan Area Transit Authority (WMATA) and (c) Metro data (WMATA). From these three networks,we construct a synthetic network for walking by adding two links in either direction for each road link.Under normal circumstances, it may be unreasonable to permit walking on a highway, but for the scenarioconsidered, allowing this seems like a fair assumption. We also include a bi-directional walk link betweeneach WMATA bus/metro node to the nearest road node to allow for travel on all networks. We note thateven though one may walk on any road link, the opposite is not necessarily true. The three networks aboveand the walk links are combined and this gives us the undamaged transportation network. The network hasaround 50,000 nodes and 230,000 links. At the end of this process, each network edge has the followingkey attributes: the physical distance between its end nodes, the mode of travel, and the speed limit of thelink. In the case of an auto link, the speed limit is as given by NAVTEQ and for the walk links, the defaultspeed is 3 miles/hour (mph). For all other links the speeds were estimated.
Modeling damage. The damage due to the blast is quantified using displacement and rubble data estimatesprovided to us by project collaborators. Here displacement measures the difference in ground level beforeand after the detonation while rubble measures the amount of debris present after this. The displacement dvaries roughly in the range −54m ≤ d ≤ 0.3m. Based on the combined values of displacement and rubble,an affected link is either completely or partially damaged. The impact on travel speeds and link delaysare specific to the mode of transportation (e.g., auto or walk) and the damage level modulates the mode-specific speed on the link. For example, the damage level impacts an auto link more than the correspondingwalk link. If a link is sufficiently damaged, it cannot be used for any travel. We remark that the sensitivityanalysis in this paper does not involve travel on bus or metro lines.

6 Adiga et al. / Procedia - Social and Behavioral Sciences 00 (2013) 1–14
NetworkNavteq(street data)
WMATA(metro/bus data)
+
Walk links
DamageDelay
computation
NFA set
Router(Label constrained Dijkstra’s algorithm)
Agentlocation/route
database
Route
dynamic loading & follow-the-leader
Trip request(source
destinationtravel mode
)
Fig. 3: The transportation model encompasses network construction, modeling damage due to impact ofthe detonation (left) and label constrained route construction over this network (right). The database is theinterface between the transportation and other modules.
3.2. Routing
The route assigned to an agent depends not only on the link delays but also on what travel mode optionsare available. Also, we need to account for the fact that it is not easy to switch modes arbitrarily. To takethese into consideration, the routing is based on a regular language constrained shortest path algorithm,see (Barrett et al., 2007). It is defined formally below.
Regular-expression constrained route construction. Given an alphabet Σ (in our case, mode of travel oneach link), the router takes as input (1) a network whose edges have weights or delays and are Σ-labeled,(2) a regular grammar L ⊆ Σ∗ and gives the shortest path between source and destination complying withthe additional constraint that the word obtained by concatenating the labels of the path in their natural orderbelongs to L. The algorithm is an extension of the classical Dijkstra’s algorithm on an appropriately definedproduct network.
Methodology. A trip request consists of the triple (source, destination, travel mode). The source anddestination correspond to two nodes on the transportation network. In the current study there are twodefault modes (or regular grammars) for travel: auto and walk. These are not to be confused with labels onlinks. Assume that there is at least one route from the specified source to destination. If an agent requestsa trip with “walk” mode, then the router assigns a route with only walk links. If the agent requests “auto”mode, the router can assign routes involving both auto and walk links. However, the following restriction isapplied to the route assigned for this mode: The route links should follow the regular expression w∗a∗w∗ intheir natural ordering from source to destination. This means for example, the routes (waaaww) or (aaaaa)are valid while (waawa) is not. This is under a fair assumption that in a trip, after abandoning or leaving anautomobile, an agent will not have access to the same or a different automobile until he or she reaches thedestination. These restrictions on routes are specified as non-deterministic finite automata (NFA) and area part of the input to the router module. The NFAs corresponding to the travel modes described above areillustrated in Figure 4a. There are two other possible modes – bus and metro – that are not used becausewe assume that those services come to a halt inside the DSA region after the blast.
3.3. Computing link delay
As discussed in Section 3.1, the free flow speed, i.e. the speed in the absence of load, is set based onthe the travel mode (auto or walk), speed limits and number of lanes. Additionally, the model incorporatesdynamic link delays reflecting the current loads on the links and ambient traffic density. These features willbe described in the remainder of the section.

Adiga et al. / Procedia - Social and Behavioral Sciences 00 (2013) 1–14 7
Walk mode (NFA 1):
Auto mode (NFA 2):a w
aw w
w
(a)
ρlin −→
perceived
speed(e)−→
vwmin (=3.0 mph)
vCF
ρcrit (=160.934 people/mile)
(b)
Fig. 4: Some important features concerning route selection and delays: (a) Travel modes assigned as NFA’sto agents which determine the route assigned and (b) Effect of crowd-following phenomenon implementedas perceived increase in walking speed proportional to load (see (3.4)).
Ambient traffic density. The ambient traffic density ρ accounts for the population (several million) of theDSA surrounding region that will be present on the transportation network inside the DSA. In our model,it corresponds to the background automobile traffic of individuals outside our synthetic population, and inthe simulation it affects only the “auto” links. We assume that this density is a constant over the iterations.However, we use separate ρ-values for the links inside the DSA (ρin) and the links outside the DSA (ρout).The ambient density of a link e is denoted ρ(e) and equals either ρin or ρout, respectively. Both ρin and ρoutare between 0 and 1. We expect ρin to be smaller than ρout as most of the ambient traffic is expected tooccur outside the DSA region.
3.3.1. Dynamic network loadingIn the simulation process, loads on links are computed for each iteration and the load in the ith iteration
affects the delay in the (i + 1)th iteration. The load impacts the walk and auto modes differently. In theauto mode, the load is used to model traffic congestion and therefore, greater the load, greater the delay.In the walk mode, it is used to model crowd-following behavior; higher the load on a link, greater is thepropensity to choose that link. Denoting the load, length and free flow speed on the link e by λ(e), l(e) andv(e), respectively, the delays taking into account the ambient traffic density and dynamic network loadingis computed as follows:
Delay on an “auto” link. Let the free flow delay on a link e be denoted by t f (e) = l(e)/speed(e). The linkis divided into cells, each of size equal to the average distance around an automobile of 7.5 meters as donein the TRANSIMS model (Barrett et al., 2001). Let cells(e) and lanes(e) denote the number of cells andnumber of lanes on e. The effective car count during the current iteration is computed as
cars(e) = cells(e) × ρ(e) × lanes(e) + λ(e) ×t f (e)Tprev
, (3.1)
where Tprev is the duration of the previous iteration. In the above equation, the first and second termscorrespond to the ambient traffic density and dynamic network loading respectively. The factor t f (e)
Tprevdenotes
the fraction of time an automobile would have traveled on e during the previous iteration under free flowconditions. The effective background density is computed as:
ρeff =cars(e)
cells(e) × lanes(e). (3.2)
Finally, the delay on the link is computed as
t(e) =t f (e)
1 − ρeff
. (3.3)

8 Adiga et al. / Procedia - Social and Behavioral Sciences 00 (2013) 1–14
3.3.2. Crowd-following behaviorIt is well-observed that when faced with uncertainty people tend to follow the actions of others. Some of
the explanations for this behavior are social proof, i.e. “if lot of people are doing the same thing, then, theymust know something we don’t”, herding behavior (Pan, 2006) and sense of security. This phenomenonreaches extreme proportions in building evacuation when people blindly push through a narrow exit withdevastating consequences. Hence, it has been a subject of extensive research. In our scenario, however, weassume that links always have enough capacity and therefore, increased density does not lead to increaseddelay for the walkers.
In our model we bias walking links with many travelers to capture the crowd-following phenomenon.We have minimal and perceived maximal walk speeds vw
min and vCF , respectively. On a walk link withno other travelers, an individual will walk with speed vw
min. As the linear density of walkers increases,the walking speed is increased and is capped at vCF . However, this only influences the choice of theroute. Once a route is assigned, the delays are adjusted corresponding to the minimal walk speed vw
min. Thedetailed computation to determine the perceived delay on a walk link is done by first estimating the fractionf (e) of time spent on the given link as
f (e) = min{
1,l(e)
vwminTprev
},
and then by determining the linear traveler density along the walk link as
ρlin =λe(t − 1)
l(e)× f (e) .
Here λe(t − 1) is the number of walkers on the link in the previous iteration. Next, the perceived walkingspeed is computed as
perceived speed(e) = vwmin + (vCF − vw
min) ×min{
1,ρlin
ρcrit
}(3.4)
where ρcrit is the density parameter value at which maximal walking speed is realized; it is kept a constantequal to 160.934 people per mile in the system. This is illustrated in Figure 4b. Finally, the delay isdetermined as
t(e) =l(e)
perceived speed(e). (3.5)
4. The Behavior Model
The behavior model is responsible for selecting an action for each individual at each iteration. Anaction involves moving (a destination has to be specified) and calling (a callee has to be specified) andis selected in a two step process. First a high-level behavioral “option” is selected. Second, this optionspecifies action selection as a short program that takes into account the agent’s state and the state of itsenvironment. Six high-level behavioral options are modeled: household reconstitution, evacuation, shelter-seeking, healthcare-seeking, panic, and aid & assist.
Formally, the behavior model is specified as a decentralized Semi-Markov Decision Process (dec-SMDP) (Goldman & Zilberstein, 2004) using the framework of options (Sutton et al., 1999). We discussthis class of models below, though it should be noted that we are, at present, not doing any optimization.Thus, the individual agents are not trying to find optimal policies. They operate with fixed policies thatembody our best guess, based on the literature, of how people might behave in the event of such a disaster.
A decentralized MDP is a multi-agent version of the standard MDP, where each agent observes asubset of the full state of the system. If the agents have a way of combining their observations (throughcommunication, e.g.,), then the full state is available to them, and they can learn and plan in essentially thesame way as in a standard MDP. However, this is not the case in our simulation.
Note that in these models, all actions are atomic, that is each action takes exactly one time step toexecute, and each agent must make a decision at each time step which action to execute next. This is
Adiga et al. / Procedia - Social and Behavioral Sciences 00 (2013) 1–14 9
insufficient for specifying realistic high-level behavior. For example, we may want to specify that anagent looks for a family member until some other condition is met (he finds the family member, or gets aphone call from them, or he gets injured, etc.). To incorporate this level of description, we can include thenotion of options, which are temporally abstracted actions. In particular, an option is specified by a triplet:opt = 〈π : S × A → [0, 1], β : S + → [0, 1], I ⊆ S 〉 (Sutton et al., 1999), where π is a single-agent policywhich specifies a fixed policy to be followed until termination condition β is met. An option is availablein a state s if s ∈ I. S and A are the sets of states and actions respectively. A decentralized semi-MarkovDecision Process is a dec-MDP which includes options.
While the scale of the simulation is prohibitive for doing optimization using reinforcement learning inthe standard way, it should be noted that we are keeping track of agent health, which provides a naturalreward signal. A second desired outcome for an agent would be the safety of his/her family members.Thus, knowledge that household members are safe could be considered a component of a reward signal aswell.
In order to specify our aforementioned six high-level behaviors as options, we have to specify theirinitiation conditions, the action selection mechanism for each option, and their termination conditions.Complete details are given elsewhere (Parikh et al., 2013). Here we present the initiation conditions, sincethose will form the basis of an experiment.
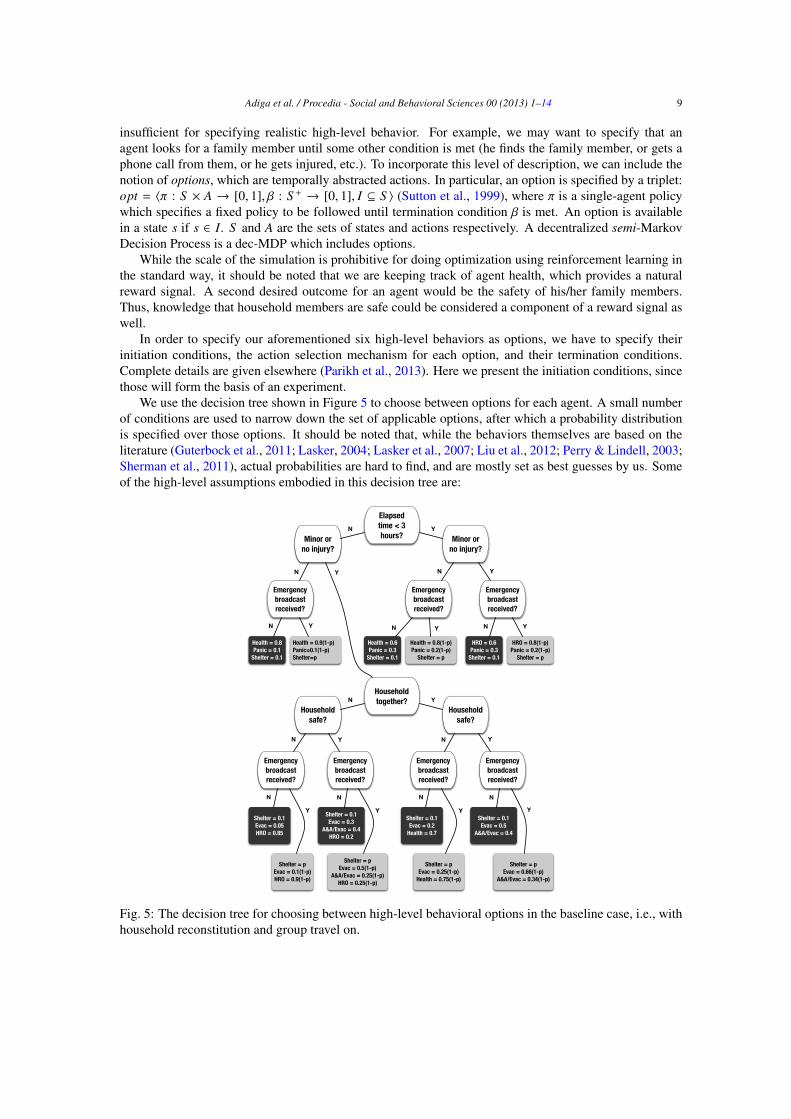
We use the decision tree shown in Figure 5 to choose between options for each agent. A small numberof conditions are used to narrow down the set of applicable options, after which a probability distributionis specified over those options. It should be noted that, while the behaviors themselves are based on theliterature (Guterbock et al., 2011; Lasker, 2004; Lasker et al., 2007; Liu et al., 2012; Perry & Lindell, 2003;Sherman et al., 2011), actual probabilities are hard to find, and are mostly set as best guesses by us. Someof the high-level assumptions embodied in this decision tree are:
Elapsed time < 3 hours? Minor or
no injury?
Emergency broadcast received?
Emergency broadcast received?
Minor or no injury?
Emergency broadcast received?
Household together?
HRO = 0.6Panic = 0.3
Shelter = 0.1
HRO = 0.8(1-p)Panic = 0.2(1-p)
Shelter = p
Health = 0.8(1-p)Panic = 0.2(1-p)
Shelter = p
Health = 0.6Panic = 0.3
Shelter = 0.1
Health = 0.9(1-p)Panic=0.1(1-p)Shelter=p
Health = 0.8Panic = 0.1
Shelter = 0.1
Household safe?
Household safe?
Emergency broadcast received?
Emergency broadcast received?
Emergency broadcast received?
Emergency broadcast received?
Shelter = pEvac = 0.66(1-p)
A&A/Evac = 0.34(1-p)
Shelter = 0.1Evac = 0.5
A&A/Evac = 0.4
Shelter = pEvac = 0.25(1-p)
Health = 0.75(1-p)
Shelter = 0.1Evac = 0.2
Health = 0.7
Shelter = pEvac = 0.5(1-p)
A&A/Evac = 0.25(1-p)HRO = 0.25(1-p)
Shelter = 0.1Evac = 0.3
A&A/Evac = 0.4HRO = 0.2
Shelter = pEvac = 0.1(1-p)HRO = 0.9(1-p)
Shelter = 0.1Evac = 0.05HRO = 0.85
N Y
N N
N
Y
Y Y
Y
NN
YN
YN YN
Y
N
Y
N
Y
N
YN
Y
Fig. 5: The decision tree for choosing between high-level behavioral options in the baseline case, i.e., withhousehold reconstitution and group travel on.

10 Adiga et al. / Procedia - Social and Behavioral Sciences 00 (2013) 1–14
• Panic naturally subsides in ∼3 hours.
• People who receive emergency broadcasts advising taking shelter are more likely to do so. We havemade this number a parameter, p, though in the present work, we assume p = 0.5 throughout.
• People who are injured or otherwise in poor health (due to radiation exposure, e.g.,) are more likelyto seek healthcare.
• People who aren’t in poor health will try to seek out their household members (in person as well asthrough phone calls).
We also assume that people who find their family members travel together with them thereafter. Also,people who are aiding others (in the aid & assist behavioral option) transport them to the nearest healthcarecenters. We refer to these two phenomena as “group travel”.
In prior work on modeling this scenario, the focus has been on the relative benefit of sheltering vs.evacuation (Wein et al., 2010). While this is an important question, it doesn’t take into account naturalhuman inclinations to seek family members (Drabek & Boggs, 1968; Liu et al., 2012) and to assist othersin distress (Perry & Lindell, 2003). The question we ask now is, what changes in outcomes happen dueto these two behaviors? Our approach to this problem is to modify our simulation to turn off group travel.This leads to a modified decision tree, as shown in Figure 6.
Elapsed time < 3 hours?
Minor or no injury?
Emergency broadcast received?
Emergency broadcast received?
Minor or no injury?
Emergency broadcast received?
HRO = 0.6Panic = 0.3
Shelter = 0.1
HRO = 0.8(1-p)Panic = 0.2(1-p)
Shelter = p
Health = 0.8(1-p)Panic = 0.2(1-p)
Shelter = p
Health = 0.6Panic = 0.3
Shelter = 0.1
Health = 0.9(1-p)Panic=0.1(1-p)
Shelter=p
Health = 0.8Panic = 0.1
Shelter = 0.1
Emergency broadcast received?
Evac = 1-pShelter = p
Evac = 0.9Shelter = 0.1
N Y
N N
N Y Y
Y
NNYNY
Y
Fig. 6: The reduced decision tree for choosing between high-level behavioral options, obtained by turningoff household reconstitution and group travel.
We conducted a simulation for each decision tree and Section 5.1 covers in detail the experiment setupand our inferences.
5. Experiments and results
We designed three experiments; (1) household reconstitution (HHR & GT), (2) crowd-following be-havior (CF) and (3) travel mode choice, each intended to study the effect of a specific behavioral option onevacuation times and health of the population inside the DSA. For comparison we used a common baselinescenario which corresponds to HHR & GT enabled, the walking speed vw
min = 3mph, the crowd followingbias vCF = 3mph (see Figure 4b) and mode choices auto and walk which correspond to NFAs 1 & 2 re-spectively in Figure 4a. The assignment of modes depends on the agent’s location. In the baseline case, ifthe agent is in the damaged area, then only walk mode is assigned and if outside the damaged area, withprobability p1 = 0.4 we assign walk mode and with remaining probability p2 = 0.6, auto mode (where theindices correspond to NFA numbers).
The parameters of communication, health and infrastructure damage modules are fixed throughout theexperiments. We used the following common metrics for comparison: (1) The number of agents outside theDSA region and (2) the number of agents dead or average radiation exposure (of agents outside one-mileradius) at the end of each iteration. In addition, depending on the experiment, we also looked at distancetraveled and distribution of load on links as was relevant to the experiment.

Adiga et al. / Procedia - Social and Behavioral Sciences 00 (2013) 1–14 11
5.1. Household-reconstitution and group travel
In this experiment, we compared two scenarios; with and without HHR & GT. The first case is thebaseline scenario which corresponds to the first tree (Figure 5) while the latter corresponds to Figure 6.The results are shown in Figure 7. The primary observation from Figures 7a and 7c is that when HHR
0
50k
100k
150k
200k
250k
300k
350k
400k
0 50 100 150 200 250 300
Age
nts
outs
ide
DSA
Minutes after the event
no GTbaseline
(a) Number evacuated.
120k
125k
130k
135k
140k
145k
150k
155k
160k
165k
0 50 100 150 200 250 300A
gent
sw
ith
heal
thst
atus
0Minutes after the event
no GTbaseline
(b) Number dead.
0
5
10
15
20
25
30
35
0 50 100 150 200 250 300
Aver
age
expo
sure
(cG
y)fo
rag
ents
outs
ide
1m
ilera
dius
Minutes after the event
no GTbaseline
(c) Average exposure.
0
5k
10k
15k
20k
25k
0 50 100 150 200 250 300
Age
nts
wit
hin
1m
ileof
GZ
who
star
ted
furt
her
Minutes after the event
no GTbaseline
(d) Number who approached within 1 mile.
Fig. 7: Household reconstitution and Group travel experiments: A comparison of outcomes of simulations with andwithout the HHR & GT feature.
& GT are disabled, we obtain a much more optimistic estimate of the rate at which people evacuate thearea and the health state of the agents respectively. It is easy to see that the two figures are related; theearlier the agents move out of the DSA, the lesser the exposure to radiation. Figure 7d throws more lighton this outcome. It looks at how many agents who were initially outside of one-mile radius of ground zeroapproached within this area in each iteration. We see that, in the base case the numbers are significantlyhigher. Clearly, this implies that these agents are trying to approach their household members and thereforerisking exposure and delayed exit out of the DSA.
We seek to explain our findings by viewing our transport module as a selfish router. Let us for the timebeing ignore dynamic loading and crowd-following behavior. We note that without HHR & GT, agents areon their own and in this case their best response to the event is to move out of the DSA. In this scenario, thetransportation module assigns to each agent the route with the least delay on the empty network. However,with these behaviors enabled, the aim of the agent is to still move out of the DSA, but subject to certainconstraints. In this case, the transportation module allocates the best possible route on the empty network,but with the added constraint that the route must visit a particular node (which happens to be the locationof a family member or a health care facility).

12 Adiga et al. / Procedia - Social and Behavioral Sciences 00 (2013) 1–14
0
20k
40k
60k
80k
100k
120k
140k
0 20 40 60 80 100 120 140 160 180
Age
nts
outs
ide
DSA
Minutes after the event
vCF = 3mphvCF = 5mphvCF = 10mphvCF = 20mph
(a) Number evacuated.
0
5
10
15
20
25
30
35
0 20 40 60 80 100 120 140 160 180
Aver
age
expo
sure
(cG
y)fo
rag
ents
outs
ide
1m
ilera
dius
Minutes after the event
vCF = 3mphvCF = 5mphvCF = 10mphvCF = 20mph
(b) Average radiation exposure.
0
5
10
15
20
25
1.0 1.5 2.0 2.5 3.0 3.5 4.0 4.5
At 40 minutes3mph5mph
10mph20mph
05
10152025303540
1.0 1.5 2.0 2.5 3.0 3.5 4.0 4.5 5.0
At 60 minutes3mph5mph
10mph20mph
0
50
100
150
200
250
300
2.0 4.0 6.0 8.0 10.0 12.0 14.0 16.0 18.0
At 120 minutes3mph5mph
10mph20mph
0
50
100
150
200
250
300
2.0 4.0 6.0 8.0 10.012.014.016.018.020.0
At 180 minutes3mph5mph
10mph20mph
(c) Load distribution at different time steps: The y-axis corresponds to number of links with load > x × 103 value.
Fig. 8: Crowd-following behavior: a comparison of outcomes for different perceived speeds (vCF).
5.2. Crowd-following behavior
The modeling of crowd-following phenomenon for the walk mode was described in Section 3.3.2 andillustrated in Figure 4b. We considered four maximal perceived walking speeds vCF = 3, 5, 10 and 20mphwhere 3mph corresponds to no CF. As in the previous experiments, we have plotted its effect on evacuationtimes and average exposure in Figures 8a and 8b respectively. In addition, we have also plotted a distribu-tion of heavily loaded links at the end of particular iterations (or time steps) to show how the loads evolvewith time in Figure 8c. The general trend is that higher the vCF , greater is the number of highly loadedlinks as well as the load on them. However, this is not true at all time steps and can be attributed to the factthat the mass movement evolves in different ways.
We note that in all our experiments, the agents were assigned shortest routes possible based on modechoice, network loads and background traffic conditions. This means that from an agent’s perspective, thebase case (vCF =3mph) corresponds to the scenario where he/she is aware of the best possible route to thepreferred destination. In the other cases, the agent prefers to take a route more traveled than the optimalone. Hence the increase in travel times. As noted earlier, these are preliminary results and require rigorousvalidation.
5.3. Travel mode constraints
In this section, we present results from an experiment involving one more mode choice, the “two-segment auto mode” specified by the third NFA in Figure 9a. If an agent is assigned this mode, it impliesthat in the particular trip, the agent may have an option of two automobiles in an assigned route. In ourexperiments, p1 remains the same as in the base case. If the agent is outside the damaged area, then,with probability 0 < p3 ≤ 0.6 we assign the two-segment auto mode and with the remaining probability(p2 = 0.6 − p3), we assign the auto mode. The results are in Figures 9b and 9c for p3 = 0.3, 0.6; p3 = 0corresponds to base case. We note that there is not much difference in the outcomes and our simulationsseem to be robust to reasonable changes in mode choice.
Acknowledgments We thank our external collaborators and members of the Network Dynamics and Sim-ulation Science Laboratory (NDSSL) for their suggestions and comments. This work has been partially

Adiga et al. / Procedia - Social and Behavioral Sciences 00 (2013) 1–14 13
a w
aw w
a w
a w
(a) Two-segment auto mode (NFA 3)
0
20k
40k
60k
80k
100k
120k
0 50 100 150 200 250 300
Age
nts
assi
gned
auto
mod
eou
tsid
eD
SA
Minutes after the event
p3 = 0p3 = 0.3p3 = 0.6
(b) Number evacuated.
1.2k
1.3k
1.4k
1.5k
1.6k
1.7k
1.8k
1.9k
2.0k
2.1k
2.2k
0 50 100 150 200 250 300A
gent
sas
sign
edau
tom
ode
wit
hhe
alth
stat
us0
Minutes after the event
p3 = 0p3 = 0.3p3 = 0.6
(c) Number dead.
Fig. 9: Mode choice: A comparison of outcomes.
supported by the following grants: DTRA Grant HDTRA1-11-1-0016 NSF NetSE Grant CNS-1011769,NSF SDCI Grant OCI-1032677, NIH MIDAS Grant 2U01GM070694-09, and DTRA CNIMS ContractHDTRA1-11-D-0016-0010.
References
Adiga, A., Mortveit, H. S., & Wu, S. (2012). Route stability in large-scale transportation models. In Workshop on MultiagentInteraction Networks, AAMAS’13.
Barrett, C., Beckman, R., Berkbigler, K., Bisset, K., Bush, B., Campbell, K., Eubank, S., Henson, K., Hurford, J., Kubicek, D. et al.(2001). Transims: Transportation analysis simulation system. Los Alamos National Laboratory Unclassified Report, .
Barrett, C., Beckman, R., Channakeshava, K., Huang, F., Kumar, V., Marathe, A., Marathe, M., & Pei, G. (2010). Cascading failures inmultiple infrastructures: From transportation to communication network. In Critical Infrastructure (CRIS), 2010 5th InternationalConference on (pp. 1–8). IEEE.
Barrett, C., Bisset, K., Chandan, S., Chen, J., Chungbaek, Y., Eubank, S., Evrenosoglu, Y., Lewis, B., Lum, K., Marathe, A. et al.(2013). Planning and response in the aftermath of a large crisis: an agent-based informatics framework. In R. Pasupathy, S.-H.Kim, R. H. A. Tolk, & M. E. Kuhl (Eds.), Winter Simulation Conference. WSC.
Barrett, C., Bisset, K., Jacob, R., Konjevod, G., Marathe, M. V., & Wagner, D. (2007). Label constrained shortest path algorithms:An experimental evaluation using transportation networks. Technical Report Technical report, Virginia Tech (USA), Arizona StateUniversity (USA), and Karlsruhe University (Germany).
Barrett, C., Channakeshava, K., Huang, F., Kim, J., Marathe, A., Marathe, M. V., Pei, G., Saha, S., Subbiah, B. S., & Vullikanti, A.K. S. (2012). Human initiated cascading failures in societal infrastructures. PloS one, 7, e45406.
Beckman, R., Baggerly, K., & McKay, M. (1996). Creating synthetic baseline populations. Transportation Research Part A: Policyand Practice, 30, 415–429.
Bish, D., Sherali, H., & Hobeika, A. (2013). Optimal evacuation planning using staging and routing. Journal of the OperationalResearch Society, .
Buddemeier, B. R., Valentine, J. E., Millage, K. K., & Brandt, L. D. (2011). National Capital Region: Key Response Planning Factorsfor the Aftermath of Nuclear Terrorism. Technical Report LLNL-TR-512111 Lawrence Livermore National Lab.
Chandan, S., Saha, S., Barrett, C., Eubank, S., Marathe, A., Marathe, M., Swarup, S., & Vullikanti, A. K. S. (2013). Modeling theinteraction between emergency communications and behavior in the aftermath of a disaster. In Social Computing, Behavioral-Cultural Modeling and Prediction (pp. 476–485). Springer.
Dombroski, M. J., & Fischbeck, P. S. (2006). An integrated physical dispersion and behavioral response model for risk assessmentof radiological dispersion device (RDD) events. Risk Analysis, 26, 501–514. URL: http://dx.doi.org/10.1111/j.1539-6924.2006.00742.x. doi:10.1111/j.1539-6924.2006.00742.x.
Drabek, T. E., & Boggs, K. S. (1968). Families in disaster: reactions and relatives. Journal of Marriage and the Family, 30, 443–451.Flotterod, G., Chen, Y., & Nagel, K. (2012). Behavioral calibration and analysis of a large-scale travel microsimulation. Networks
and Spatial Economics, 12, 481–502.Goldman, C. V., & Zilberstein, S. (2004). Decentralized control of cooperative systems: Categorization and complexity analysis.
Journal of Artificial Intelligence Research, 22, 143–174.

14 Adiga et al. / Procedia - Social and Behavioral Sciences 00 (2013) 1–14
Guterbock, T. M., Lambert, J. H., Bebel, R. A., & Parker, M. W. (2011). NCR Behavioral Survey 2011: Work, School or Home?Issues in Sheltering in Place during an Emergency. Technical Report Center for Survey Research, University of Virginia.
K., M. (2011). Modeling the effects of nuclear weapons in an urban setting. In Radiation countermeasures symposium An AFRRI50th Anniversary Event.
Kim, S., & Shekhar, S. (2005). Contraflow network reconfiguration for evacuation planning: a summary of results. In Proceedings ofthe 13th annual ACM international workshop on Geographic information systems (pp. 250–259). ACM.
Lambert, J. H., Parlak, A. I., Zhou, Q., Miller, J. S., Fontaine, M. D., Guterbock, T. M., Clements, J. L., & Thekdi, S. A. (2012).Understanding and managing disaster evacuation on a transportation network. Accident Analysis & Prevention, .
Lasker, R. D. (2004). Redefining Readiness: Terrorism Planning Through the Eyes of the Public. Center for the Advancementof Collaborative Strategies in Health, New York Academy of Medicine. URL: http://books.google.com/books?id=dvfgGgAACAAJ.
Lasker, R. D., Hunter, N. D., & Francis, S. E. (2007). With the Public’s Knowledge, We Can Make Sheltering in Place Possible. NewYork, NY: New York Academy of Medicine. URL: http://books.google.com/books?id=PUHQMwAACAAJ.
Lindell, M. K., & Perry, R. W. (2012). The protective action decision model: theoretical modifications and additional evidence. RiskAnalysis, 32, 616–632.
Liu, S., Murray-Tuite, P., & Schweitzer, L. (2012). Analysis of child pick-up during daily routines and for daytime no-noticeevacuations. Transportation Research Part A: Policy and Practice, 46, 48–67. URL: http://dx.doi.org/10.1016/j.tra.2011.09.003. doi:10.1016/j.tra.2011.09.003.
Murray-Tuite, P., & Wolshon, B. (2013). Evacuation transportation modeling: An overview of research, development, and practice.Transportation Research Part C: Emerging Technologies, 27, 25–45.
Pan, X. (2006). Computational modeling of human and social behaviors for emergency egress analysis. Ph.D. thesis StanfordUniversity.
Parikh, N., Swarup, S., Stretz, P. E., Rivers, C. M., Lewis, B. L., Marathe, M. V., Eubank, S. G., Barrett, C. L., Lum, K., & Chungbaek,Y. (2013). Modeling human behavior in the aftermath of a hypothetical improvised nuclear detonation. In Proceedings of the 2013international conference on Autonomous agents and multi-agent systems (pp. 949–956). International Foundation for AutonomousAgents and Multiagent Systems.
Parlak, A. I., Lambert, J. H., Guterbock, T. M., & Clements, J. L. (2012). Population behavioral scenarios influencing radiologicaldisaster preparedness and planning. Accident Analysis & Prevention, 48, 353–362.
Pel, A. J., Bliemer, M. C., & Hoogendoorn, S. P. (2012). A review on travel behaviour modelling in dynamic traffic simulation modelsfor evacuations. Transportation, 39, 97–123.
Pelechano, N., & Badler, N. I. (2006). Modeling crowd and trained leader behavior during building evacuation. Computer Graphicsand Applications, IEEE, 26, 80–86.
Pelechano, N., O’Brien, K., Silverman, B., & Badler, N. (2005). Crowd simulation incorporating agent psychological models, rolesand communication. Technical Report DTIC Document.
Perry, R. W., & Lindell, M. K. (2003). Understanding citizen response to disasters with implications for terrorism. Journal ofContingencies and Crisis Management, 11, 49–60.
Sherman, M. F., Peyrot, M., Magda, L. A., & Gershon, R. R. M. (2011). Modeling pre-evacuation delay by evacuees in WorldTrade Center towers 1 and 2 on September 11, 2001: A revisit using regression analysis. Fire Safety Journal, . URL: http://dx.doi.org/10.1016/j.firesaf.2011.07.001. doi:10.1016/j.firesaf.2011.07.001.
Homeland Security Council Interagency Policy Coordination Subcommittee (2009). Planning guidance for response to a nucleardetonation. Technical Report.
Sutton, R., Precup, D., & Singh, S. (1999). Between MDPs and semi-MDPs: A framework for temporal abstraction in reinforcementlearning. Artificial Intelligence, 112, 181–211.
Wein, L. M., Choi, Y., & Denuit, S. (2010). Analyzing evacuation versus shelter-in-place strategies after a terrorist nuclear detonation.Risk Analysis, 30, 1315–1327.