Embed Size (px)
Citation preview
LUND UNIVERSITY
PO Box 117221 00 Lund+46 46-222 00 00
Modelling large-scale evacuation of music festivals
Ronchi, Enrico; Nieto Uriz, Francisco; Criel, Xavier; Reilly, Paul
Published in:Case Studies in Fire Safety
DOI:10.1016/j.csfs.2015.12.002
2016
Link to publication
Citation for published version (APA):Ronchi, E., Nieto Uriz, F., Criel, X., & Reilly, P. (2016). Modelling large-scale evacuation of music festivals. CaseStudies in Fire Safety, 5, 11-19. https://doi.org/10.1016/j.csfs.2015.12.002
Total number of authors:4
General rightsUnless other specific re-use rights are stated the following general rights apply:Copyright and moral rights for the publications made accessible in the public portal are retained by the authorsand/or other copyright owners and it is a condition of accessing publications that users recognise and abide by thelegal requirements associated with these rights. • Users may download and print one copy of any publication from the public portal for the purpose of private studyor research. • You may not further distribute the material or use it for any profit-making activity or commercial gain • You may freely distribute the URL identifying the publication in the public portal
Read more about Creative commons licenses: https://creativecommons.org/licenses/Take down policyIf you believe that this document breaches copyright please contact us providing details, and we will removeaccess to the work immediately and investigate your claim.
Case Studies in Fire Safety 5 (2016) 11–19
Contents lists available at ScienceDirect
Case Studies in Fire Safety
journal homepage: www.elsevier .com/ locate /csfs
Modelling large-scale evacuation of music festivals
E. Ronchia,*, F. Nieto Uriza, X. Crielb, P. Reillyc
aDepartment of Fire Safety Engineering, Lund University, Box 118, 221 00 Lund, Swedenb Safety Centre Europe, Noorderlaan 133, 2030 Antwerp, Belgiumc[76_TD$DIFF]Information School, University of Sheffield, Regent Court, 211 Portobello, Sheffield S1 4DP, UK
A R T I C L E I N F O
Article history:
Received 28 October 2015Received in revised form 7 December 2015Accepted 8 December 2015Available online 30 December 2015Keywords:Emergency evacuationEvacuation modellingCrowd managementMusic festivalCascading effects
* corresponding author. Fax: +46 46 222E-mail address: [email protected]
http://dx.doi.org/10.1016/j.csfs.2015.12.0022214-398X/ã 2016 The Authors. Published
4612..se (E. R
by Elsev
A B S T R A C T
This paper explores the use of multi-agent continuous evacuation modelling forrepresenting large-scale evacuation scenarios at music festivals. A 65,000 people capacitymusic festival area was simulated using the model Pathfinder. Three evacuation scenarioswere developed in order to explore the capabilities of evacuation modelling during suchincidents, namely (1) a preventive evacuation of a section of the festival area containingapproximately 15,000 people due to a fire breaking out on a ship, (2) an escalating scenarioinvolving the total evacuation of the entire festival area (65,000 people) due to a bombthreat, and (3) a cascading scenario involving the total evacuation of the entire festival area(65,000 people) due to the threat of an explosion caused by a ship engine overheating. Thisstudy suggests that the analysis of the people-evacuation time curves produced byevacuation models, coupled with a visual analysis of the simulated evacuation scenarios,allows for the identification of the main factors affecting the evacuation process (e.g., delaytimes, overcrowding at exits in relation to exit widths, etc.) and potential measures thatcould improve safety.
ã 2016 The Authors. Published by Elsevier Ltd. All rights reserved.
1. Introduction
Music festivals present a set of challenges from the perspective of evacuation safety. For instance, very high peopledensities can be reached in proximity of the stages, thus creating potential issues associated with crushing and trampling[9,26]. Attendees are often unfamiliar with the evacuation routes, thus potentially increasing the time needed for way-finding during such incidents. Pre-evacuation behaviour itself (which [77_TD$DIFF]can be defined as the time needed to start thepurposivemovement towards a safe place [78_TD$DIFF][19]) may be affected by several variables such as the impact of social media [5,18]or levels of alcohol consumption [6].
Todayevacuation safetymeasures formusic festivals aremostly based on guidelines (rules of [79_TD$DIFF]thumb) discussing variablessuch as the width of available exit space depending on the number of people, maximum number of people per m2, etc. [10].Evacuation exercises to test festival evacuation plans are rarely done. Evacuation modelling to test festival evacuation plansand procedures are an easier way to evaluate and improve the safety of music festivals. However this technique is seldomused as organisers and local authorities rely on the current practice of evacuation guidelines.
Evacuationmodels can be used to obtain qualitative and quantitative information on evacuation times and space usage indifferent evacuation scenarios [7]. The behaviour of festival goers and members of staff can also be explored [16,28].
onchi).
ier Ltd. All rights reserved.
12 E. Ronchi et al. / Case Studies in Fire Safety 5 (2016) 11–19
A model study was developed in order to explore the potential of evacuation modelling for the simulation of musicfestival evacuation scenarios. In particular, the paper discusses the insights provided by the use of evacuation simulationstools, including what type of results can be obtained and how they can be used by event safety and public emergencyresponse managers. A fictional music festival was created, the characteristics of which were informed by a review of severalreal ones by the researchers. The music festival area is able to host up to 65,000 people and includes eleven stages. Threeevacuation scenarios were devised, in which different threats and available evacuation routes were assumed. Theconnections between variables in the model (number and location of exits, delay times, exit paths) have been investigated.
2. Method
Themethod employed in this studywas the application of evacuationmodelling techniques. The initial phase of the study[80_TD$DIFF]was therefore the selection of an appropriate evacuation model to simulate large-scale evacuation scenarios at a musicfestival. A review of the characteristics needed in evacuation models to simulate this type of scenarios was performed. Thisincluded the representation of large populations and high densities. Existing research on crowd modelling in [81_TD$DIFF]cases of large-scale evacuation is mostly based on modelling assumptions aimed at low computational cost (given the large number ofpeople involved), e.g., macroscopic simulations [3] or cellular automata [2]. The present study [82_TD$DIFF]sets out to simulate large-scale evacuation scenarios with a higher level of sophistication, i.e., adopting a multi-agent-based model with a continuousmodelling approach. The choice of the evacuation model employed in this study was made after an analysis of thecharacteristics of evacuationmodels as stated bymodel developers, e.g., themodel inventory available at www.evacmod.net[21] or presented in scientific reviews [7,14]. A set of simulations was performed using an agent-based continuous model—Pathfinder [27].
When possible, the input of the evacuationmodel was calibrated using experimental data rather than the default settingsof each model. This had the effect of making the evacuation scenarios as realistic as possible, while limiting the user effect[25], i.e., results affected by the choices of the modellers during the process of input calibration.
3. Model case study
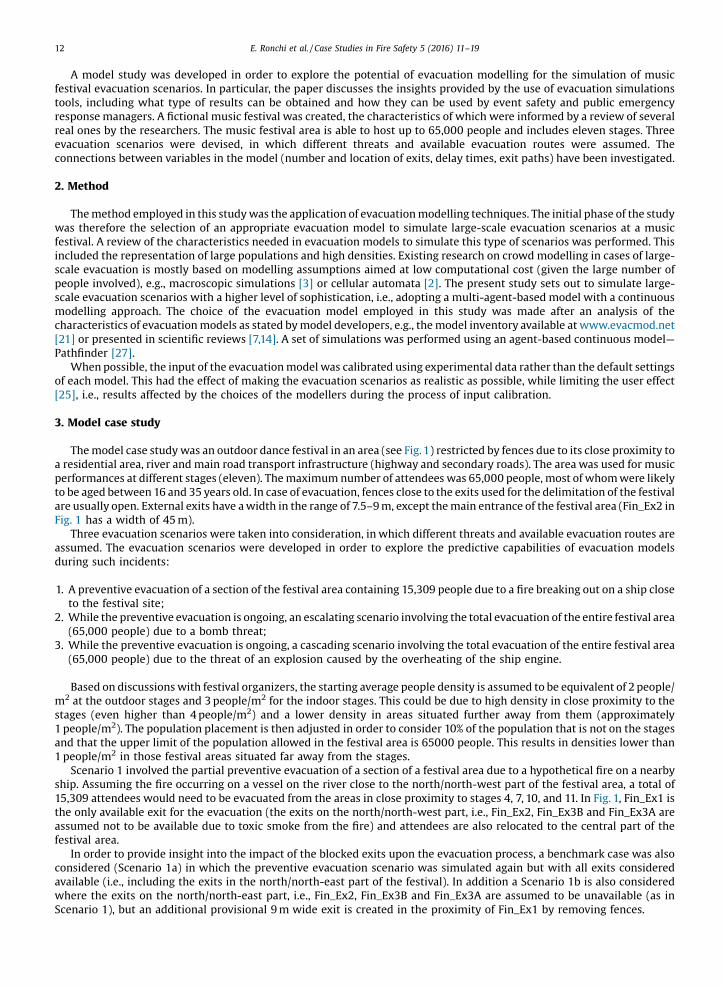
Themodel case studywas an outdoor dance festival in an area (see Fig.1) restricted by fences due to its close proximity toa residential area, river and main road transport infrastructure (highway and secondary roads). The areawas used for musicperformances at different stages (eleven). Themaximumnumber of attendees was 65,000 people, most of whomwere likelyto be aged between 16 and 35 years old. In case of evacuation, fences close to the exits used for the delimitation of the festivalare usually open. External exits have awidth in the range of 7.5–9m, except themain entrance of the festival area (Fin_Ex2 inFig. 1 has a width of 45m).
Three evacuation scenarios were taken into consideration, in which different threats and available evacuation routes areassumed. [83_TD$DIFF]The evacuation scenarios were developed in order to explore the predictive capabilities of evacuation modelsduring such incidents:
1.
A preventive evacuation of a section of the festival area containing 15,309 people due to a fire breaking out on a ship closeto the festival site;2.
While the preventive evacuation is ongoing, an escalating scenario involving the total evacuation of the entire festival area(65,000 people) due to a bomb threat;3.
While the preventive evacuation is ongoing, a cascading scenario involving the total evacuation of the entire festival area(65,000 people) due to the threat of an explosion caused by the overheating of the ship engine.Based on discussionswith festival organizers, the starting average people density is assumed [84_TD$DIFF]to be equivalent of 2 people/m2 at the outdoor stages and 3people/m2 for the indoor stages. This could be due to high density in close proximity to thestages (even higher than 4people/m2) and a lower density in areas situated further away from them (approximately1people/m2). The population placement is then adjusted in order to consider 10% of the population that is not on the stagesand that the upper limit of the population allowed in the festival area is 65000 people. This results in densities lower than1people/m2 in those festival areas situated far away from the stages.
Scenario 1 involved the partial preventive evacuation of a section of a festival area due to a hypothetical fire on a nearbyship. Assuming the fire occurring on a vessel on the river close to the north/north-west part of the festival area, a total of15,309 attendees would need to be evacuated from the areas in close proximity to stages 4, 7, 10, and 11. In Fig. 1, Fin_Ex1 isthe only available exit for the evacuation (the exits on the north/north-west part, i.e., Fin_Ex2, Fin_Ex3B and Fin_Ex3A areassumed [85_TD$DIFF]not to be available due to toxic smoke from the fire) and attendees are also relocated to the central part of thefestival area.
In order to provide insight into the impact of the blocked exits upon the evacuation process, a benchmark case was alsoconsidered (Scenario 1a) in which the preventive evacuation scenario was simulated again but with all exits consideredavailable (i.e., including the exits in the north/north-east part of the festival). In addition a Scenario 1b is also consideredwhere the exits on the north/north-east part, i.e., Fin_Ex2, Fin_Ex3B and Fin_Ex3A are assumed to be unavailable (as inScenario 1), but an additional provisional 9m wide exit is created in the proximity of Fin_Ex1 by removing fences.
E. Ronchi et al. / Case Studies in Fire Safety 5 (2016) 11–19 13
The two more complex scenarios (Scenarios 2 and 3) involved the total evacuation of the entire festival area, containingan estimated 65,000 people. In this case, all exits were available except Fin_Ex2, Fin_Ex3B and Fin_Ex3A (see Fig. 2).Attendees were expected to move to one of the available exits in order to leave the festival area (see all exits available inFig. 1).
Detailed information on the model case study, assumptions in use and subsequent results can be found in the full reportassociated with this paper [1].
3.1. Model input calibration
The physical abilities of people in the festival area were represented through their approximate unimpeded walkingspeed distributions (see Table 1). Two categories were used, namely “standard occupant” and people with locomotionimpairments [4]. This second category was used in order to represent people with both permanent and temporarylocomotion impairment. The unimpeded walking speeds were represented with truncated normal distributions in order toaccount for the variability of people abilities. Those values are derived from previous experimental research [4,13]. In total,30% of the attendees of the festival were assumed to have locomotion impairments.
The studies from [20] demonstrate that an appropriate representation of delay times can bemade through the use of log-normal distributions. Pre-evacuation delays are assumed based on previous real emergencies [11,15], existing literature onthe impact of social media during emergencies [5] and private communicationwith festival organizers and first responders.
[(Fig._1)TD$FIG]
Fig.1. Schematic two-dimensional representation of the festival area. Legend: STX= stagenumber, ExX= exit of stage number x, Fin_ExX=final exit numberx. The area in grey represents the area where people are initially located. The lines pointing north represent the exit paths. The rectangle indicates thestarting location of the threat and the blocked exits due to the threat. Stages 1, 2, 4, 5, 9 and 10 are outdoor with an initial population density of 2people/m2,stages 3, 6, 7, 8 and 11 are indoor and they have an initial population density of 3people/m2.
[(Fig._2)TD$FIG]
353 429 525803
2319
05001000150020002500
0 5000 10000 15000
Tim
e (s
)
People (n)
337 404 486 675
1463
05001000150020002500
0 5000 10000 15000
Tim
e (s
)
People (n)
350 422 512767
2020
05001000150020002500
0 5000 10000 15000
Tim
e (s
)
People (n)
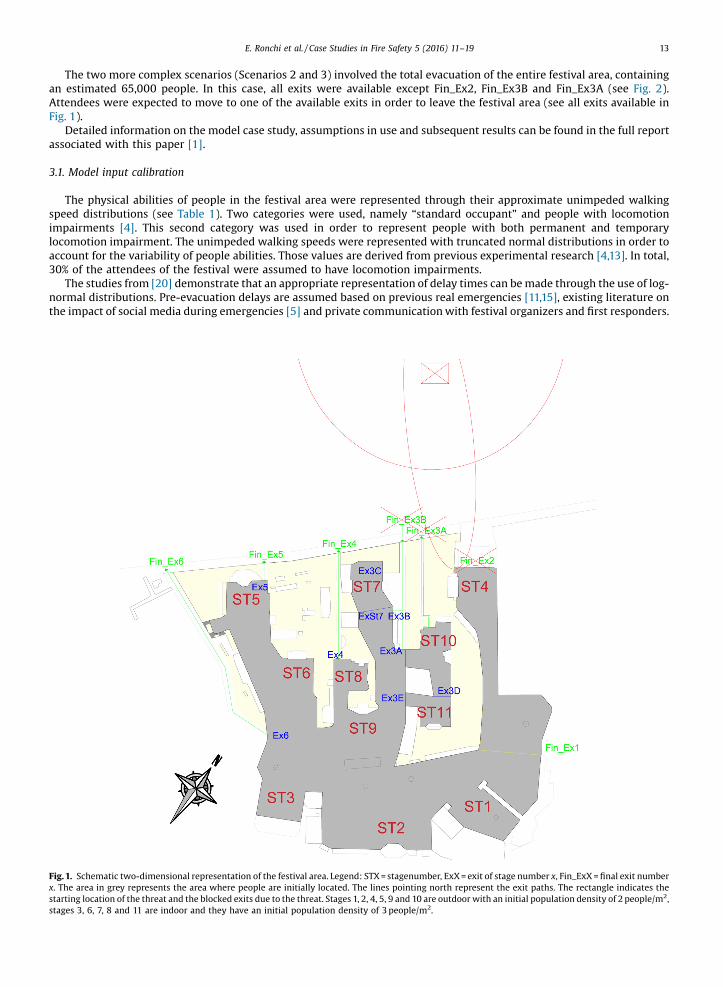
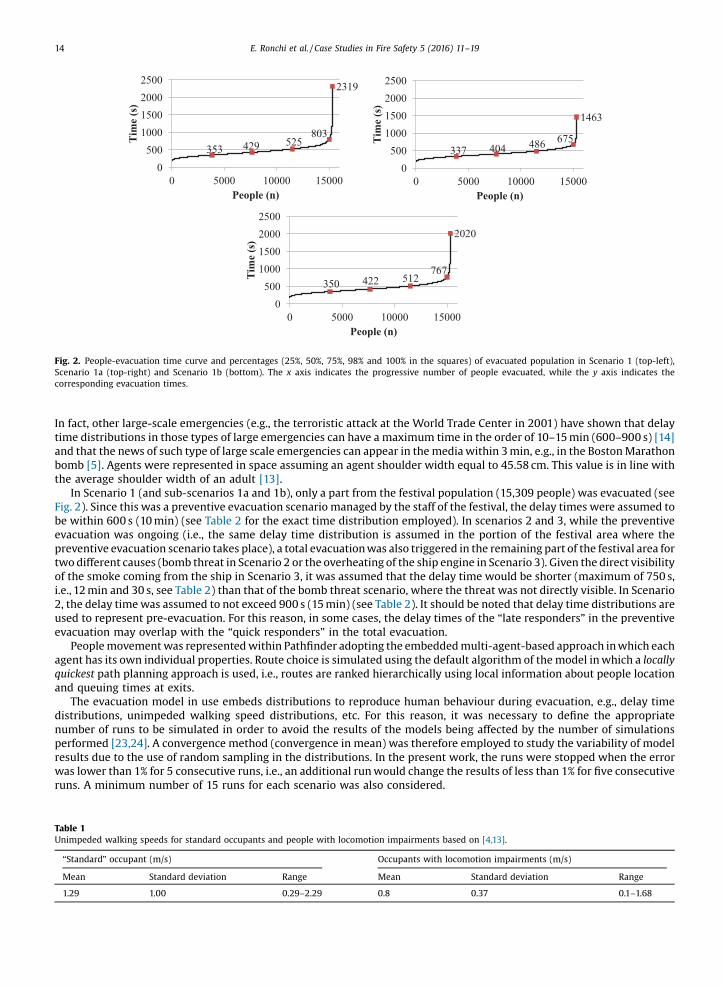
Fig. 2. People-evacuation time curve and percentages (25%, 50%, 75%, 98% and 100% in the squares) of evacuated population in Scenario 1 (top-left),Scenario 1a (top-right) and Scenario 1b (bottom [75_TD$DIFF]). The x axis indicates the progressive number of people evacuated, while the y axis indicates thecorresponding evacuation times.
14 E. Ronchi et al. / Case Studies in Fire Safety 5 (2016) 11–19
In fact, other large-scale emergencies (e.g., the terroristic attack at the World Trade Center in 2001) have shown that delaytime distributions in those types of large emergencies can have a maximum time in the order of 10–15min (600–900 s) [14]and that the news of such type of large scale emergencies can appear in themediawithin 3min, e.g., in the BostonMarathonbomb [5]. Agents were represented in space assuming an agent shoulder width equal to 45.58 cm. This value is in line withthe average shoulder width of an adult [13].
In Scenario 1 (and sub-scenarios 1a and 1b), only a part from the festival population (15,309 people) was evacuated (seeFig. 2). Since this was a preventive evacuation scenario managed by the staff of the festival, the delay times were assumed tobe within 600 s (10min) (see Table 2 for the exact time distribution employed). In scenarios 2 and 3, while the preventiveevacuation was ongoing (i.e., the same delay time distribution is assumed in the portion of the festival area where thepreventive evacuation scenario takes place), a total evacuationwas also triggered in the remaining part of the festival area fortwodifferent causes (bomb threat in Scenario 2 or the overheating of the ship engine in Scenario 3). Given the direct visibilityof the smoke coming from the ship in Scenario 3, it was assumed that the delay time would be shorter (maximum of 750 s,i.e., 12min and 30 s, see Table 2) than that of the bomb threat scenario, where the threat was not directly visible. In Scenario2, the delay timewas assumed to not exceed 900 s (15min) (see Table 2). It should be noted that delay time distributions areused to represent pre-evacuation. For this reason, in some cases, the delay times of the “late responders” in the preventiveevacuation may overlap with the “quick responders” in the total evacuation.
Peoplemovementwas representedwithin Pathfinder adopting the embeddedmulti-agent-based approach inwhich eachagent has its own individual properties. Route choice is simulated using the default algorithm of themodel inwhich a locallyquickest path planning approach is used, i.e., routes are ranked hierarchically using local information about people locationand queuing times at exits.
The evacuation model in use embeds distributions to reproduce human behaviour during evacuation, e.g., delay timedistributions, unimpeded walking speed distributions, etc. For this reason, it was necessary to define the appropriatenumber of runs to be simulated in order to avoid the results of the models being affected by the number of simulationsperformed [23,24]. A convergence method (convergence in mean) was therefore employed to study the variability of modelresults due to the use of random sampling in the distributions. In the present work, the runs were stopped when the errorwas lower than 1% for 5 consecutive runs, i.e., an additional runwould change the results of less than 1% for five consecutiveruns. A minimum number of 15 runs for each scenario was also considered.
Table 1Unimpeded walking speeds for standard occupants and people with locomotion impairments based on [4,13].
“Standard” occupant (m/s) Occupants with locomotion impairments (m/s)
Mean Standard deviation Range Mean Standard deviation Range
1.29 1.00 0.29–2.29 0.8 0.37 0.1–1.68
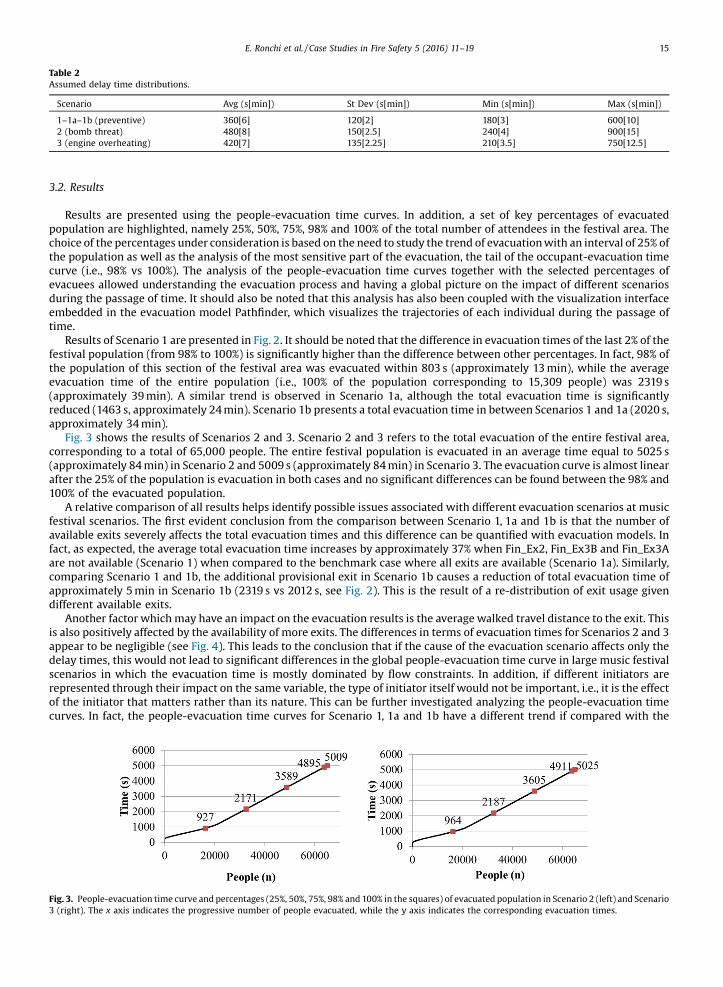
Table 2Assumed delay time distributions.
Scenario Avg (s[min]) St Dev (s[min]) Min (s[min]) Max (s[min])
1–1a–1b (preventive) 360[6] 120[2] 180[3] 600[10]2 (bomb threat) 480[8] 150[2.5] 240[4] 900[15]3 (engine overheating) 420[7] 135[2.25] 210[3.5] 750[12.5]
E. Ronchi et al. / Case Studies in Fire Safety 5 (2016) 11–19 15
3.2. Results
Results are presented using the people-evacuation time curves. In addition, a set of key percentages of evacuatedpopulation are highlighted, namely 25%, 50%, 75%, 98% and 100% of the total number of attendees in the festival area. Thechoice of the percentages under consideration is based on the need to study the trend of evacuationwith an interval of 25% ofthe population as well as the analysis of the most sensitive part of the evacuation, the tail of the occupant-evacuation timecurve (i.e., 98% vs 100%). The analysis of the people-evacuation time curves together with the selected percentages ofevacuees allowed understanding the evacuation process and having a global picture on the impact of different scenariosduring the passage of time. It should also be noted that this analysis has also been coupled with the visualization interfaceembedded in the evacuation model Pathfinder, which visualizes the trajectories of each individual during the passage oftime.
Results of Scenario 1 are presented in Fig. 2. It should be noted that the difference in evacuation times of the last 2% of thefestival population (from 98% to 100%) is significantly higher than the difference between other percentages. In fact, 98% ofthe population of this section of the festival area was evacuated within 803 s (approximately 13min), while the averageevacuation time of the entire population (i.e., 100% of the population corresponding to 15,309 people) was 2319 s(approximately 39min). A similar trend is observed in Scenario 1a, although the total evacuation time is significantlyreduced (1463 s, approximately 24min). Scenario 1b presents a total evacuation time in between Scenarios 1 and 1a (2020 s,approximately 34min).
Fig. 3 shows the results of Scenarios 2 and 3. Scenario 2 and 3 refers to the total evacuation of the entire festival area,corresponding to a total of 65,000 people. The entire festival population is evacuated in an average time equal to 5025 s(approximately 84min) in Scenario 2 and 5009 s (approximately 84min) in Scenario 3. The evacuation curve is almost linearafter the 25% of the population is evacuation in both cases and no significant differences can be found between the 98% and100% of the evacuated population.
A relative comparison of all results helps identify possible issues associated with different evacuation scenarios at musicfestival scenarios. The first evident conclusion from the comparison between Scenario 1, 1a and 1b is that the number ofavailable exits severely affects the total evacuation times and this difference can be quantified with evacuation models. Infact, as expected, the average total evacuation time increases by approximately 37% when Fin_Ex2, Fin_Ex3B and Fin_Ex3Aare not available (Scenario 1) when compared to the benchmark case where all exits are available (Scenario 1a). Similarly,comparing Scenario 1 and 1b, the additional provisional exit in Scenario 1b causes a reduction of total evacuation time ofapproximately 5min in Scenario 1b (2319 s vs 2012 s, see [86_TD$DIFF]Fig. 2). This is the result of a re-distribution of exit usage givendifferent available exits.
Another factor which may have an impact on the evacuation results is the averagewalked travel distance to the exit. Thisis also positively affected by the availability of more exits. The differences in terms of evacuation times for Scenarios 2 and 3appear to be negligible (see Fig. 4). This leads to the conclusion that if the cause of the evacuation scenario affects only thedelay times, this would not lead to significant differences in the global people-evacuation time curve in large music festivalscenarios in which the evacuation time is mostly dominated by flow constraints. In addition, if different initiators arerepresented through their impact on the same variable, the type of initiator itself would not be important, i.e., it is the effectof the initiator that matters rather than its nature. This can be further investigated analyzing the people-evacuation timecurves. In fact, the people-evacuation time curves for Scenario 1, 1a and 1b have a different trend if compared with the
[(Fig._3)TD$FIG]Fig. 3. People-evacuation time curve and percentages (25%, 50%, 75%, 98% and 100% in the squares) of evacuated population in Scenario 2 (left) and Scenario3 (right). The x axis indicates the progressive number of people evacuated, while the y axis indicates the corresponding evacuation times.
[(Fig._4)TD$FIG]
010002000300040005000
25 50 75 98 100
Eva
cuat
ion
time
(s)
% of evacuee
1 1a 1b 2 3
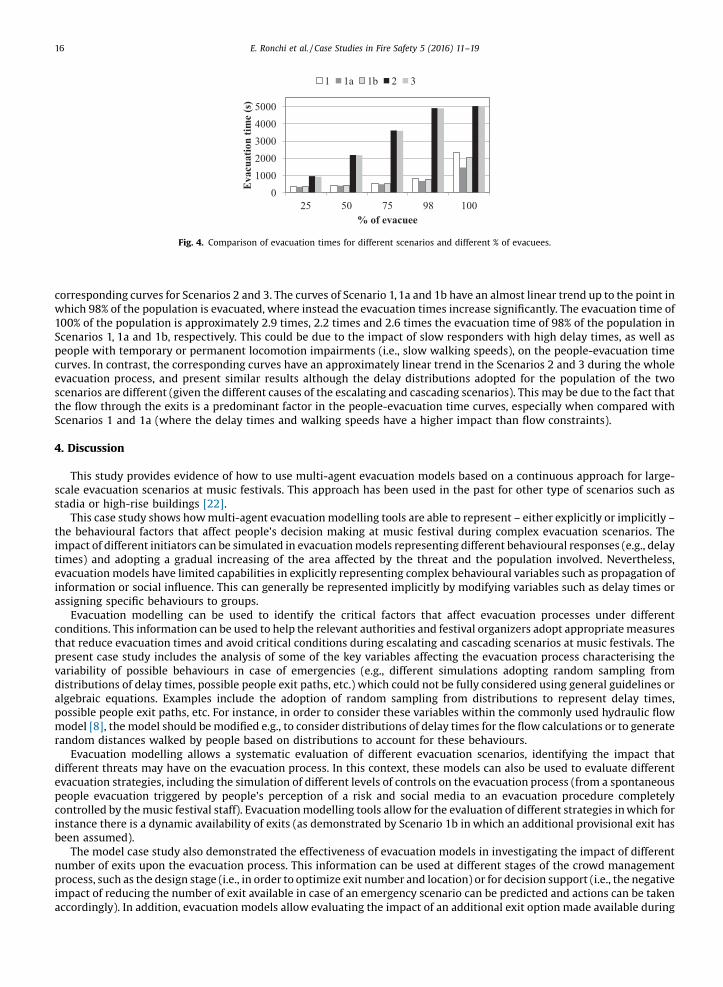
Fig. 4. Comparison of evacuation times for different scenarios and different % of evacuees.
16 E. Ronchi et al. / Case Studies in Fire Safety 5 (2016) 11–19
corresponding curves for Scenarios 2 and 3. The curves of Scenario 1,1a and 1b have an almost linear trend up to the point inwhich 98% of the population is evacuated, where instead the evacuation times increase significantly. The evacuation time of100% of the population is approximately 2.9 times, 2.2 times and 2.6 times the evacuation time of 98% of the population inScenarios 1, 1a and 1b, respectively. This could be due to the impact of slow responders with high delay times, as well aspeople with temporary or permanent locomotion impairments (i.e., slow walking speeds), on the people-evacuation timecurves. In contrast, the corresponding curves have an approximately linear trend in the Scenarios 2 and 3 during the wholeevacuation process, and present similar results although the delay distributions adopted for the population of the twoscenarios are different (given the different causes of the escalating and cascading scenarios). This may be due to the fact thatthe flow through the exits is a predominant factor in the people-evacuation time curves, especially when compared withScenarios 1 and 1a (where the delay times and walking speeds have a higher impact than flow constraints).
4. Discussion
This study provides evidence of how [87_TD$DIFF]to use multi-agent evacuation models based on a continuous approach for large-scale evacuation scenarios at music festivals. This approach has been used in the past for other type of scenarios such asstadia or high-rise buildings [22].
This case study shows howmulti-agent evacuationmodelling tools are able to represent – either explicitly or implicitly –
the behavioural factors that affect people's decision making at music festival during complex evacuation scenarios. Theimpact of different initiators can be simulated in evacuationmodels representing different behavioural responses (e.g., delaytimes) and adopting a gradual increasing of the area affected by the threat and the population involved. Nevertheless,evacuation models have limited capabilities in explicitly representing complex behavioural variables such as propagation ofinformation or social influence. This can generally be represented implicitly by modifying variables such as delay times orassigning specific behaviours to groups.
Evacuation modelling can be used to identify the critical factors that affect evacuation processes under differentconditions. This information can be used to help the relevant authorities and festival organizers adopt appropriatemeasuresthat reduce evacuation times and avoid critical conditions during escalating and cascading scenarios at music festivals. Thepresent case study includes the analysis of some of the key variables affecting the evacuation process characterising thevariability of possible behaviours in case of emergencies (e.g., different simulations adopting random sampling fromdistributions of delay times, possible people exit paths, etc.) which could not be fully considered using general guidelines oralgebraic equations. Examples include the adoption of random sampling from distributions to represent delay times,possible people exit paths, etc. For instance, in order to consider these variables within the commonly used hydraulic flowmodel [8], the model should bemodified e.g., to consider distributions of delay times for the flow calculations or to generaterandom distances walked by people based on distributions to account for these behaviours.
Evacuation modelling allows a systematic evaluation of different evacuation scenarios, identifying the impact thatdifferent threats may have on the evacuation process. In this context, these models can also be used to evaluate differentevacuation strategies, including the simulation of different levels of controls on the evacuation process (from a spontaneouspeople evacuation triggered by people’s perception of a risk and social media to an evacuation procedure completelycontrolled by themusic festival staff). Evacuationmodelling tools allow for the evaluation of different strategies inwhich forinstance there is a dynamic availability of exits (as demonstrated by Scenario 1b in which an additional provisional exit hasbeen assumed).
The model case study also demonstrated the effectiveness of evacuation models in investigating the impact of differentnumber of exits upon the evacuation process. This information can be used at different stages of the crowd managementprocess, such as the design stage (i.e., in order to optimize exit number and location) or for decision support (i.e., the negativeimpact of reducing the number of exit available in case of an emergency scenario can be predicted and actions can be takenaccordingly). In addition, evacuation models allow evaluating the impact of an additional exit option made available during
E. Ronchi et al. / Case Studies in Fire Safety 5 (2016) 11–19 17
the evacuation. The use of evacuation modelling during the design of crowd safety of a festival gives the possibility to makethorough evaluation of the possible safety issues associated with evacuation if compared with the use of guidelines whichgenerally provide running meters per number of attendees.
This paper suggests that the evaluation of the results of an evacuation model in a music festival should include the entirepeople-evacuation time curves (and studying specific flows at different exits when deemed necessary) rather than just thetotal evacuation time (as it is generally done in buildings). The reason is that the study of those curves can provide a morecomplete understanding on the evacuation process and give useful insights for possible counter-measures to avoid criticalconditions (e.g., overcrowding in certain areas, estimating the time in which people will queue at exits, etc.).
This type of analysis of evacuation model results allows for the differentiation of the scenarios in relation to the factorsaffecting the evacuation process (e.g., flow through doors, congestion levels, delay times, walking speeds and traveldistances, etc.). This can have positive implications for the counter-measures employed to solve critical conditions. Forinstance, scenarios inwhich flowconstraints at doors are found to be crucial (e.g., Scenarios 1 and 1a in themodel case studypresented in this paper) can be addressed by intervening on the number, width and location of the exits (as shown inScenario 1b of the presentmodel case study). The implementation of thesemodifications to the exits is fairly straightforwardin music festival scenarios (especially when compared to buildings) since the delimitation of the space is (at least partially)generally done throughmovable fences. This applies also to scenarios inwhichwalking distances to the exits are found to beimportant. In addition, this issuemay lead to consider the option to adoptmodifications on the crowdmanagement strategy.
In contrast, different types of intervention may be needed for those scenarios in which the delay times of the populationplay a key role in the total evacuation time. For example, these measures may require somemodifications to the emergencynotification strategy, changing the staff procedures for communicating with the festival attendees.
The use of an evacuation strategy that reduces the average total evacuation time does not necessarily lead to an increasedlevel of safety. The overall exposure to a threat may increase even if the total evacuation time is shorter, i.e., a critical zone ofthe festival area could becomemore exposed to a threat for a longer time. Evacuation models generally do not produce onlynumerical outputs concerning the evacuation times, flows and people densities, but they allow for the 2D or 3D visualizationof the entire evacuation process. This qualitative information (together with the people-evacuation time curve) can be usedto identify the variation in threat exposure in light of different factors such as the adopted evacuation strategy, exit and routeavailability, behavioural assumptions, etc. In this context, the graphic visualization of the evacuation process represents animportant benefit of using evacuation modelling tools over algebraic models or rule of thumbs.
In general, music festivals have different characteristics in terms of people density compared to theatres or stadia, whereeach person has its own location assigned. It is therefore very important that the allowed maximum density of each area isestimated for the purposes of evacuation safety. Additionally, the use of evacuation model predictions of people densitiesallows for the consideration of the level of comfort experienced by the festival attendees at the site.
This case study demonstrates that the case of a large-scale evacuation scenario involving multiple sub-scenariosassociated with evacuation safety can be investigated with evacuation modelling tools. Pre-planning with evacuationsimulation tools can improve successful safe egress [88_TD$DIFF][71_TD$DIFF]might inform event management and allow estimating the impact ofstaff actions or non-actions on successful safe egress. The present work represents an example of an effective use ofevacuation modelling tools for assisting decision making in case of incidents of different complexities, including cases inwhich escalating and cascading effects take place. For instance, the comparison between Scenarios 1 and 1bdemonstrates the possibilities of evacuation modelling for the evaluation of possible counter-measures to an evacuationincident and how an effective decision making of emergency responders (Scenario 1b in which an additional temporaryexit has been provided) can positively affect evacuation safety. This work exemplifies this issue for the specific case ofmusic festival scenario, but it is possible to extend the same principle to a variety of contexts in which large-scaleevacuation may occur.
5. Future research
The present work analyses the use of evacuation models to produce estimates of the people-evacuation time curves inrelation to different evacuation scenarios. Future research could focus on the merging of this analysis with the study of thepossible impact of the threat itself. For instance, if the threat has a direct impact on the evacuating population, e.g., thepresence of a toxic cloud affecting people behaviour, there would be the need to directly simulate the impact on theevacuation process. In other words, the coupling of dispersionmodelling, i.e., the prediction of gas concentrations caused byan explosion or a toxic release [17], and people movement simulation should be the focus of future research, followingexisting examples for evacuation in enclosures [13].
The results of this paper show that there is a need to analyse in more depth the possible impact of the behaviours of theevacuees in the case of escalating and cascading scenarios. In this context, several variablesmerit further analysis, such as thetraining received by staff, their availability, population types (e.g., different percentages of people with locomotionimpairments, people with different types of disabilities, etc.) and the number of attendees at festivals.
Some of the input values used for themodel variables have been based on scarce literature, thus future experimental dataor on-site observations would significantly improve the reliability of model results. For instance, scarce information isavailable on the response times of both festival organizers and attendees in case of evacuation scenario. This is alsoassociated with the low frequency of this type of emergencies [12], which often leads to extrapolate information from
18 E. Ronchi et al. / Case Studies in Fire Safety 5 (2016) 11–19
different types of events or drills. This problem can be partially solved by organizing large-scale (announced or un-announced) evacuation drills, although they are not common for such type of large-scale events.
6. Conclusion
This work explored the use of a multi-agent continuous evacuationmodelling approach to simulate a case study of large-scale evacuation scenarios at music festivals. Evacuation models had sufficient flexibility to represent the behaviouralaspects affecting the evacuation process during escalating and cascading scenarios. In particular, the study of the people-evacuation time curves produced by evacuation models, coupled with the visual analysis of the evacuation process, allowedfor the identification of the predominant factors affecting evacuation (e.g., delay times, flows through exits, etc.) andpotential measures that could improve safety levels. Future research should focus on data collection on human behaviour,the inclusion of level of comfort analysis within evacuation models, a more advanced representation of vulnerablepopulations, and a coupled analysis of the impact of gas concentrations produced with a dispersion model and peoplemovement and behaviours.
Acknowledgements
This work is part of the Seventh Framework Programme EU project CascEff—Modelling of dependencies and cascadingeffects for emergencymanagement in crisis situations, Grant agreement No: 607665. The CascEff project aims to improve theemergency response in incidents that involve cascading effects. The authors wish to acknowledge the members of theproject consortium. The authors also thank Bart Bruelemans, Wim Van de Vijver and Kris de Troch for their help in thedefinition of the festival model case study. The authors also thank Alexander Cedergren, Daniel Nilsson, Feng Xu and AndersLönnermark for their review of the manuscript before publication.
References
[1] F. Amon, S. Svensson, J. Lindström, E. Ronchi, P. Lindström, F. Nieto Uriz, D. Lange, X. Criel, A. Lönnermark, P. Reilly, Effects of Human Activities on theProgression and Development of Large Scale Crises, Report within the FP7 EU CascEff Project on Modelling of Dependencies and Cascading Effects forEmergency Management in Crisis Situations, SP Sverige, 2015.
[2] S. Bandini, F. Rubagotti, G. Vizzari, K. Shimura, A cellular automata basedmodel for pedestrian and group dynamics:motivations and first experiments,in: V. Malyshkin (Ed.), Parallel Computing Technologies, vol. 6873, Springer Berlin Heidelberg, Berlin, Heidelberg, 2011, pp. 125–139 Retrieved fromhttp://link.springer.com/10.1007/978-3-642-23178-0_11.
[3] N. Bellomo, C. Dogbé, On the modelling crowd dynamics from scaling to hyperbolic macroscopic models, Math. Models MethodsAppl. Sci. 1 (2008)1317–1345, doi:http://dx.doi.org/10.1142/s0218202508003054.
[4] K. Boyce, T. Shields, G. Silcock, Toward the characterization of building occupancies for fire safety engineering: capabilities of disabled people movinghorizontally and on an incline, Fire Technol. 35 (1) (1999) 51–67.
[5] C. Cassa, R. Chunara, K. Mandl, J.S. Brownstein, Twitter as a Sentinel in Emergency Situations: Lessons from the BostonMarathon Explosions, PLoS Curr.(2013) , doi:http://dx.doi.org/10.1371/currents.dis.ad70cd1c8bc585e9470046cde334ee4b.
[6] K.R. Chapman, F.J. Carmichael, J.E. Goode, Medical services for outdoor rock music festivals, Can. Med. Assoc. J. 126 (8) (1982) 935–938.[7] S. Gwynne, E.R. Galea,M. Owen, P.J. Lawrence, L. Filippidis, A reviewof themethodologies used in the computer simulation of evacuation from the built
environment, Build. Environ. 34 (6) (1999) 741–749, doi:http://dx.doi.org/10.1016/s0360-1323(98) 00057-2.[8] S.M.V. Gwynne, E. Rosenbaum, Employing the hydraulic model in assessing emergency movement, in: P.J. Di Nenno (Ed.), SFPE Hanbook of Fire
Protection Engineering, National Fire Protection Association, Quincy (MA), 2008.[9] P.J. Harding, M. Amos, S. Gwynne, Prediction and mitigation of crush conditions in emergency evacuations, in: W.W.F. Klingsch, C. Rogsch, A.
Schadschneider, M. Schreckenberg (Eds.), Pedestrian and Evacuation Dynamics 2008, Springer Berlin, Berlin, Heidelberg, 2010, pp. 233–246.[10] Health and Safety Executive, The Event Safety Guide: A Guide to Health, Safety and Welfare at Music and Similar Events, HSE Books, Norwich, 1999.[11] D. Helbing, P. Mukerji, Crowd disasters as systemic failures: analysis of the Love Parade disaster, EPJ Data Sci. 1 (1) (2012) , doi:http://dx.doi.org/
10.1140/epjds7.[12] N. Khakzad, G. Reniers, Using graph theory to analyze the vulnerability of process plants in the context of cascading effects, Reliab. Eng. Syst. Saf. (2015)
, doi:http://dx.doi.org/10.1016/j.ress.2015.04.015.[13] T. Korhonen, S. Hostikka, Fire Dynamics Simulator with Evacuation: FDS+ Evac Technical Reference and User’s Guide, VTT Technical Research Center of
Finland, 2009, pp. 19 (Working paper No. 119).[14] E.D. Kuligowski, R.D. Peacock, B.L. Hoskins, A Review of Building EvacuationModels, 2nd ed., NIST Technical Note 1680. National Institute of Standards
and Technology, 2010.[15] E.D. Kuligowski, D.S. Mileti, Modeling pre-evacuation delay by occupants inWorld Trade Center Towers 1 and 2 on September 11, 2001, Fire Saf. J. 44 (4)
(2009) 487–496, doi:http://dx.doi.org/10.1016/j.firesaf.2008.10.001.[16] E. Magnolo, L. Manenti, S. Manzoni, F. Sartori, Towards a MAS model for crowd simulation at pop-rock concerts exploiting ontologies and fuzzy logic,
Proc. of 10th workshop from Objects to Agents, WOA, Citeseer, 2009, pp. 9–10.[17] M.Markiewicz, A Review ofmathematical models for the atmospheric dispersion of heavy gases. Part I. a classification ofmodels, Ecol. Chem. Eng. S 19
(3) (2012) , doi:http://dx.doi.org/10.2478/v10216-011-0022-y.[18] L. Potts, Social media in disaster response: how experience architects can build for participation, Routledge, Taylor & Francis Group, New York, 2014.[19] G. Proulx, Movement of people: the evacuation timing, SFPE Handbook of Fire Protection Engineering, 3rd ed., National Fire Protection Association,
Quincy, MA (USA), 2002 pp. 3–341–3–366 (Chapter 3–13).[20] D.A. Purser, M. Bensilum, Quantification of behaviour for engineering design standards and escape time calculations, Safety Science 38 (2) (2001) 157–
182, doi:http://dx.doi.org/10.1016/s0925-7535(00)00066-7.[21] E. Ronchi, M. Kinsey, Evacuation models of the future: Insights from an online survey on user's experiences and needs, in: J. Capote (Ed.), et al.,
Presented at the Advanced Research Workshop Evacuation and Human Behaviour in Emergency Situations EVAC11, Santander, Spain, 2011.[22] E. Ronchi, D. Nilsson, Modelling total evacuation strategies for high-rise buildings, Build. Simul. 7 (2014) 73–87, doi:http://dx.doi.org/10.1007/s12273-
013-0132-9.[23] E. Ronchi, P.A. Reneke, R.D. Peacock, A method for the analysis of behavioural uncertainty in evacuation modelling, Fire Technol. 50 (6) (2014) 1545–
1571, doi:http://dx.doi.org/10.1007/s10694-013-0352-7.

E. Ronchi et al. / Case Studies in Fire Safety 5 (2016) 11–19 19
[24] E. Ronchi, E.D. Kuligowski, D. Nilsson, R.D. Peacock, P.A. Reneke, Assessing the verification and validation of building fire evacuation models, FireTechnol. (2014) , doi:http://dx.doi.org/10.1007/s10694-014-0432-3.
[25] E. Ronchi, Testing the predictive capabilities of evacuation models for tunnel fire safety analysis, Saf. Sci. 59 (0) (2013) 141–153, doi:http://dx.doi.org/10.1016/j.ssci.2013.05.008.
[26] R.A. Smith, L.B. Lim, Experiments to investigate the level of comfortable loads for people against crush barriers, Saf. Sci. 18 (4) (1995) 329–335, doi:http://dx.doi.org/10.1016/0925-7535(94)00052-5.
[27] Thunderhead Engineering. Verification and Validation—Pathfinder 2014.3.1208. (2014).[28] N. Wagner, V. Agrawal, An agent-based simulation system for concert venue crowd evacuation modeling in the presence of a fire disaster, Expert Syst.
Appl. 41 (6) (2014) 2807–2815, doi:http://dx.doi.org/10.1016/j.eswa.2013.10.013.