Embed Size (px)
Citation preview

Monthly Perspectives // March 2020
15 minutes
The Courage of Our Convictions Cometh the Reckoning
China’s Silver Lining Impact on the Outlook
Brad Simpson, Chief Wealth StrategistFixed IncomeEquitiesBeata Caranci, Chief Economist
22
The Courage of Our ConvictionsBrad Simpson, Chief Wealth Strategist and Head of PAIR
Does your mind rule your emotions, or do your emotions rule your mind?
For many of us, when faced with a great threat or uncertainty — such as the ultimate impact of the COVID-19 outbreak — it’s our emotions that are in charge. Author Daniel Goleman coined the term “amygdala hijacking” to describe what happens in times of stress, when this tiny, almond-shaped region deep inside our brain gets triggered. Think of it as the brain’s fire alarm; its primary purpose is to keep us alive when confronted by physical threats.
On one level, the COVID-19 pandemic certainly does qualify as a physical threat, but it also represents a serious financial threat, and rarely have we been hit with both simultaneously — so, for the amygdala, it’s like a five-alarm fire.
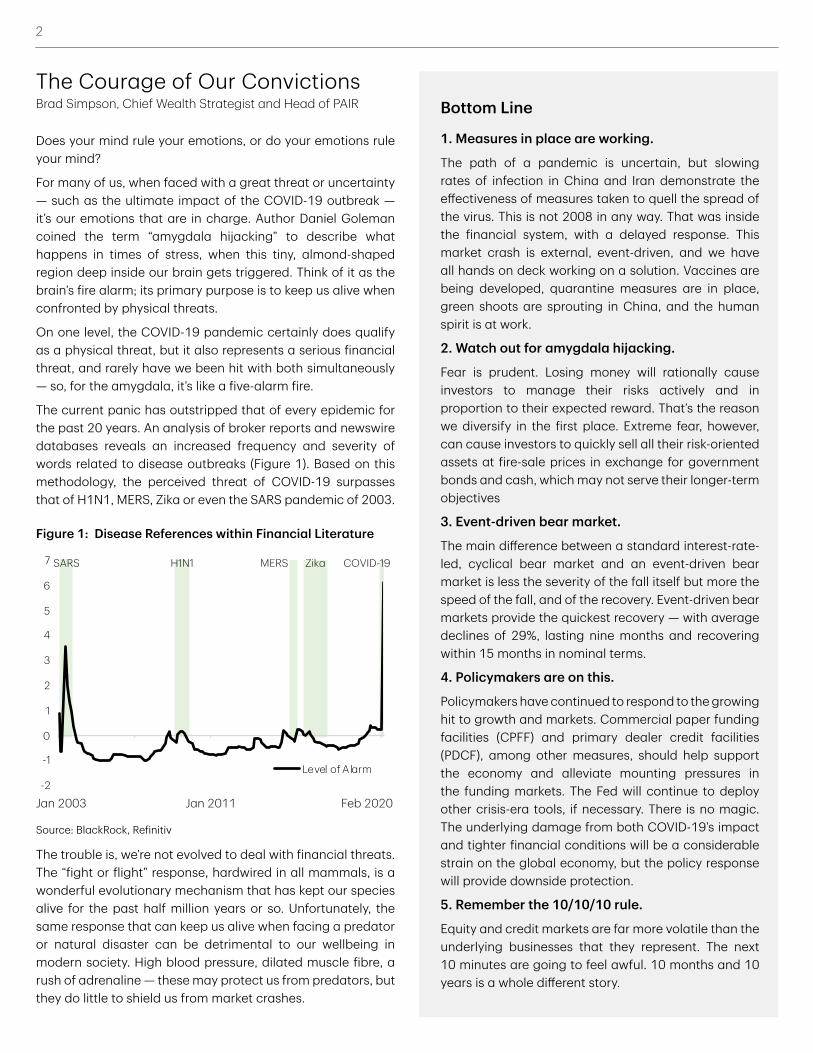
The current panic has outstripped that of every epidemic for the past 20 years. An analysis of broker reports and newswire databases reveals an increased frequency and severity of words related to disease outbreaks (Figure 1). Based on this methodology, the perceived threat of COVID-19 surpasses that of H1N1, MERS, Zika or even the SARS pandemic of 2003.
Bottom Line
1. Measures in place are working.
The path of a pandemic is uncertain, but slowing rates of infection in China and Iran demonstrate the effectiveness of measures taken to quell the spread of the virus. This is not 2008 in any way. That was inside the financial system, with a delayed response. This market crash is external, event-driven, and we have all hands on deck working on a solution. Vaccines are being developed, quarantine measures are in place, green shoots are sprouting in China, and the human spirit is at work.
2. Watch out for amygdala hijacking.
Fear is prudent. Losing money will rationally cause investors to manage their risks actively and in proportion to their expected reward. That’s the reason we diversify in the first place. Extreme fear, however, can cause investors to quickly sell all their risk-oriented assets at fire-sale prices in exchange for government bonds and cash, which may not serve their longer-term objectives
3. Event-driven bear market.
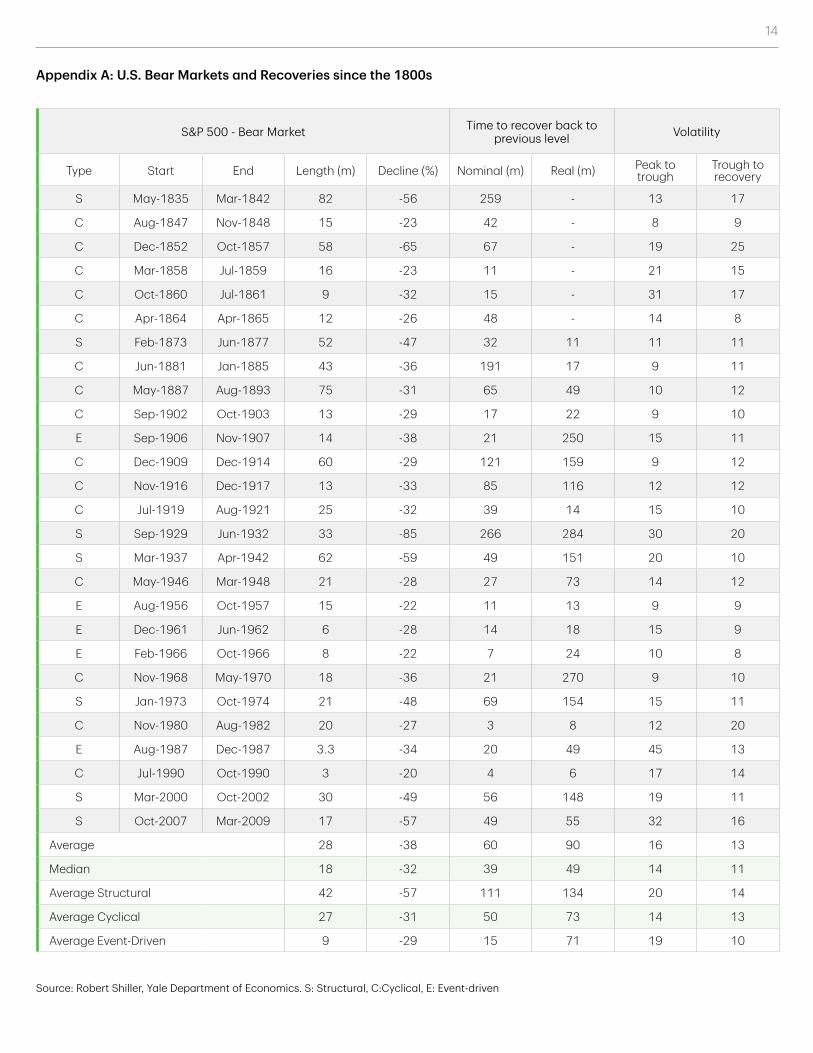
The main difference between a standard interest-rate-led, cyclical bear market and an event-driven bear market is less the severity of the fall itself but more the speed of the fall, and of the recovery. Event-driven bear markets provide the quickest recovery — with average declines of 29%, lasting nine months and recovering within 15 months in nominal terms.
4. Policymakers are on this.
Policymakers have continued to respond to the growing hit to growth and markets. Commercial paper funding facilities (CPFF) and primary dealer credit facilities (PDCF), among other measures, should help support the economy and alleviate mounting pressures in the funding markets. The Fed will continue to deploy other crisis-era tools, if necessary. There is no magic. The underlying damage from both COVID-19’s impact and tighter financial conditions will be a considerable strain on the global economy, but the policy response will provide downside protection.
5. Remember the 10/10/10 rule.
Equity and credit markets are far more volatile than the underlying businesses that they represent. The next 10 minutes are going to feel awful. 10 months and 10 years is a whole different story.
The trouble is, we’re not evolved to deal with financial threats. The “fight or flight” response, hardwired in all mammals, is a wonderful evolutionary mechanism that has kept our species alive for the past half million years or so. Unfortunately, the same response that can keep us alive when facing a predator or natural disaster can be detrimental to our wellbeing in modern society. High blood pressure, dilated muscle fibre, a rush of adrenaline — these may protect us from predators, but they do little to shield us from market crashes.
Figure 1: Disease References within Financial Literature
Source: BlackRock, Refinitiv
Jan 2003 Jan 2011 Feb 2020
SARS H1N1 MERS Zika COVID-19
-2
-1
0
1
2
3
4
5
6
7
01-Jan-03 01-Jan-07 01-Jan-11 01-Jan-15 01-Jan-19
Level of Alarm
3
Neuroscientists have shown that the amygdala sidesteps higher brain functions, including the ones we usually associate with reason. The key to being a disciplined investor, then, is the ability to override that fear response, which is easier said than done when volatility is at a historic peak. Aside from the real threats posed by COVID-19, investors must also contend with all the imaginary threats invented by an industry of fearmongers.
What am I talking about? Media pundits, celebrity analysts, investment gurus — these attention-seekers thrive in market turmoil. That’s why financial articles are full of hyperbolic words like “rout,” “rocketed,” “imploded” and “convulsed.” That’s why strategists and portfolio managers who have been making bearish predictions for a decade are coming out of the woodwork to say they were right all along. That’s why all the charts come with truncated vertical axes to exaggerate any small change. And, of course, that’s why palm-faced photos of distressed traders can be found everywhere.
Now let’s be clear here: having some constructive fear is prudent. The fear of losing money will rationally cause investors to manage their risks actively and in proportion to their expected reward. That’s the reason we diversify in the first place. Extreme fear, however, can cause investors to quickly sell all their risk-oriented assets at fire-sale prices in exchange for government bonds and cash, which may not serve their longer-term objectives. If we allow our amygdalas to drive our reaction to financial crises, we may eventually regret these decisions.
But how can we overcome such a primal instinct? The only way is to pull yourself away from the focus of your fears, get a broader perspective and then make reasonable decisions. In other words, you need to hand the keys over to your frontal cortex — the part of the brain that governs reason — and keep the amygdala from hijacking your decision-making process.
Let’s consider the facts as we know them:
First, we are definitely in a bear market. What does that mean? It’s a good question because, for some of us, it’s been a while since the last one; for others, this will be their first. There are three types of bear markets, each with its own triggers and distinct characteristics.
n Structural Bear: This version is the result of structural imbalances in the economy and often comes with financial bubbles. More often than not, there is a pricing mechanism, such as deflation, that follows.
n Cyclical Bear: In this variety, rising interest rates are the culprit, leading to an impending recession and declining profits. They are a natural function of the economic cycle.
n Event-driven Bear: This type of bear market begins with a shock to the system, something that you didn’t see coming. Trade wars, collapses or dislocations — the “Black Swan” events, so called for their rarity.
We think it’s pretty safe to say that the primary driver behind the current market volatility is the fear surrounding the COVID-19 outbreak, which would classify this as an event-driven bear market.
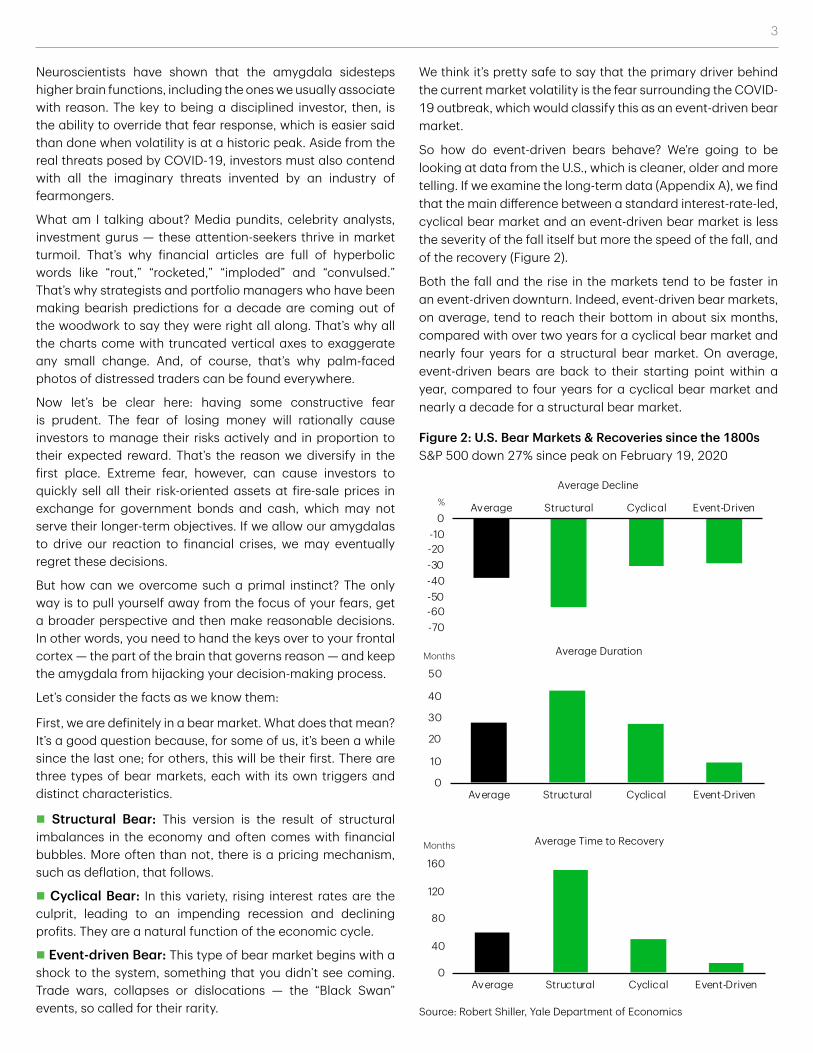
So how do event-driven bears behave? We’re going to be looking at data from the U.S., which is cleaner, older and more telling. If we examine the long-term data (Appendix A), we find that the main difference between a standard interest-rate-led, cyclical bear market and an event-driven bear market is less the severity of the fall itself but more the speed of the fall, and of the recovery (Figure 2).
Both the fall and the rise in the markets tend to be faster in an event-driven downturn. Indeed, event-driven bear markets, on average, tend to reach their bottom in about six months, compared with over two years for a cyclical bear market and nearly four years for a structural bear market. On average, event-driven bears are back to their starting point within a year, compared to four years for a cyclical bear market and nearly a decade for a structural bear market.
Figure 2: U.S. Bear Markets & Recoveries since the 1800sS&P 500 down 27% since peak on February 19, 2020
Source: Robert Shiller, Yale Department of Economics
0
10
20
30
40
50
Average Structural Cyclical Event-Driven
Average DurationMonths
0
40
80
120
160
Average Structural Cyclical Event-Driven
Average Time to RecoveryMonths
-70-60-50-40-30-20-10
0Average Structural Cyclical Event-Driven
Average Decline%
4
Markets Have Bears, Businesses Do Not
It’s also important to distinguish between financial markets, which can be volatile, and the stable underlying businesses that they represent, which collectively account for their aggregate market capitalization. Put another way, investors are more volatile than their investments.
At times like this, there are too many speculators and not enough investors. Back in the day, markets would correct in a big way and then investors would take advantage of prices that, based on fundamentals, suggested there was a bargain to be had. Today, liquidity comes from lines of code known as algorithms that are designed to push capital though ETFs, which act like financial pipelines, then reverse course every time an outcome is achieved.
While a hard number is difficult to come by, I would ballpark that 80% to 90% of trading is being done this way. This can cause strange accelerations and dramatic swings that become self-perpetuating as the algorithms compete with one other, pulling and pushing the markets with greater intensity as outcomes are achieved in ever shorter increments of time. So, we still rely on market fundamentals to create narratives, but I would contend that few investors, in the short term, are buying and selling securities based on these measures.
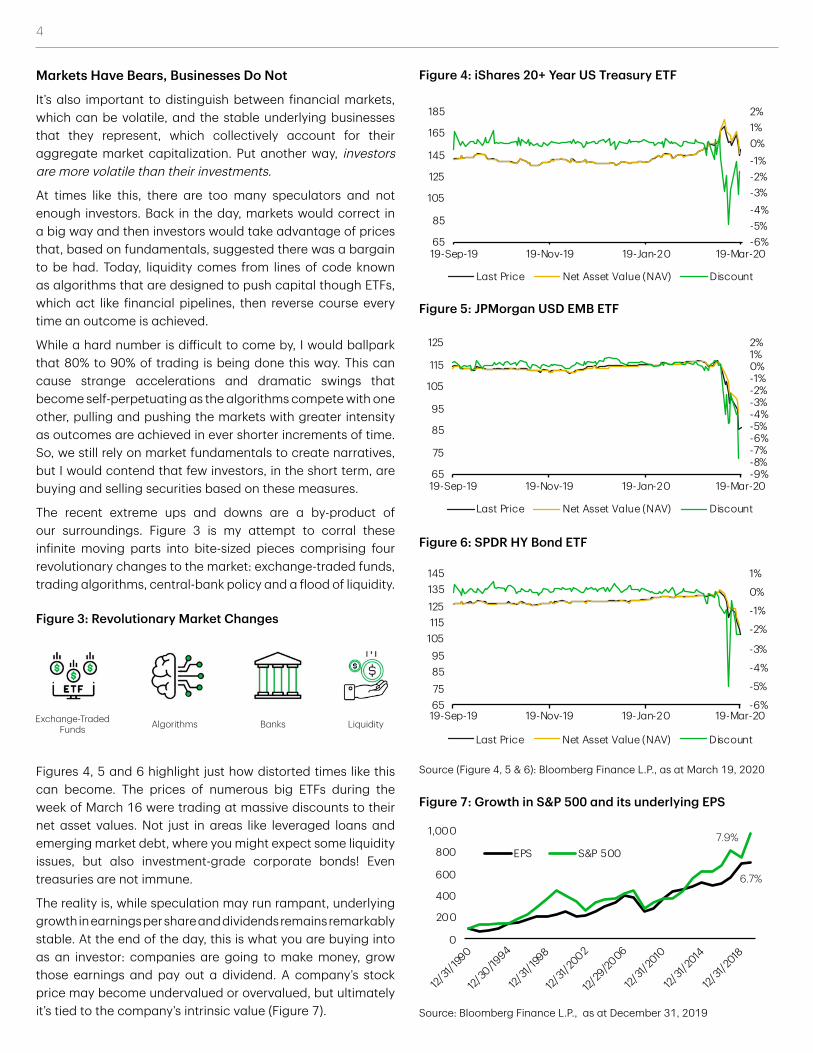
The recent extreme ups and downs are a by-product of our surroundings. Figure 3 is my attempt to corral these infinite moving parts into bite-sized pieces comprising four revolutionary changes to the market: exchange-traded funds, trading algorithms, central-bank policy and a flood of liquidity.
Figures 4, 5 and 6 highlight just how distorted times like this can become. The prices of numerous big ETFs during the week of March 16 were trading at massive discounts to their net asset values. Not just in areas like leveraged loans and emerging market debt, where you might expect some liquidity issues, but also investment-grade corporate bonds! Even treasuries are not immune.
The reality is, while speculation may run rampant, underlying growth in earnings per share and dividends remains remarkably stable. At the end of the day, this is what you are buying into as an investor: companies are going to make money, grow those earnings and pay out a dividend. A company’s stock price may become undervalued or overvalued, but ultimately it’s tied to the company’s intrinsic value (Figure 7).
Figure 3: Revolutionary Market Changes
Source (Figure 4, 5 & 6): Bloomberg Finance L.P., as at March 19, 2020
Figure 4: iShares 20+ Year US Treasury ETF
Figure 5: JPMorgan USD EMB ETF
Figure 6: SPDR HY Bond ETF
Source: Bloomberg Finance L.P., as at December 31, 2019
Figure 7: Growth in S&P 500 and its underlying EPS
0
200
400
600
800
1,000
12/31/
1990
12/30
/1994
12/31/
1998
12/31/
2002
12/29
/2006
12/31/
2010
12/31/
2014
12/31/
2018
EPS S&P 5007.9%
6.7%
-6%-5%-4%-3%-2%-1%0%1%2%
65
85
105
125
145
165
185
19-Sep-19 19-Nov-19 19-Jan-20 19-Mar-20
Last Price Net Asset Value (NAV) Discount
-9%-8%-7%-6%-5%-4%-3%-2%-1%0%1%2%
65
75
85
95
105
115
125
19-Sep-19 19-Nov-19 19-Jan-20 19-Mar-20
Last Price Net Asset Value (NAV) Discount
-6%
-5%
-4%
-3%
-2%
-1%
0%
1%
65758595
105115125135145
19-Sep-19 19-Nov-19 19-Jan-20 19-Mar-20
Last Price Net Asset Value (NAV) Discount
Exchange-Traded Funds Algorithms Banks Liquidity
5
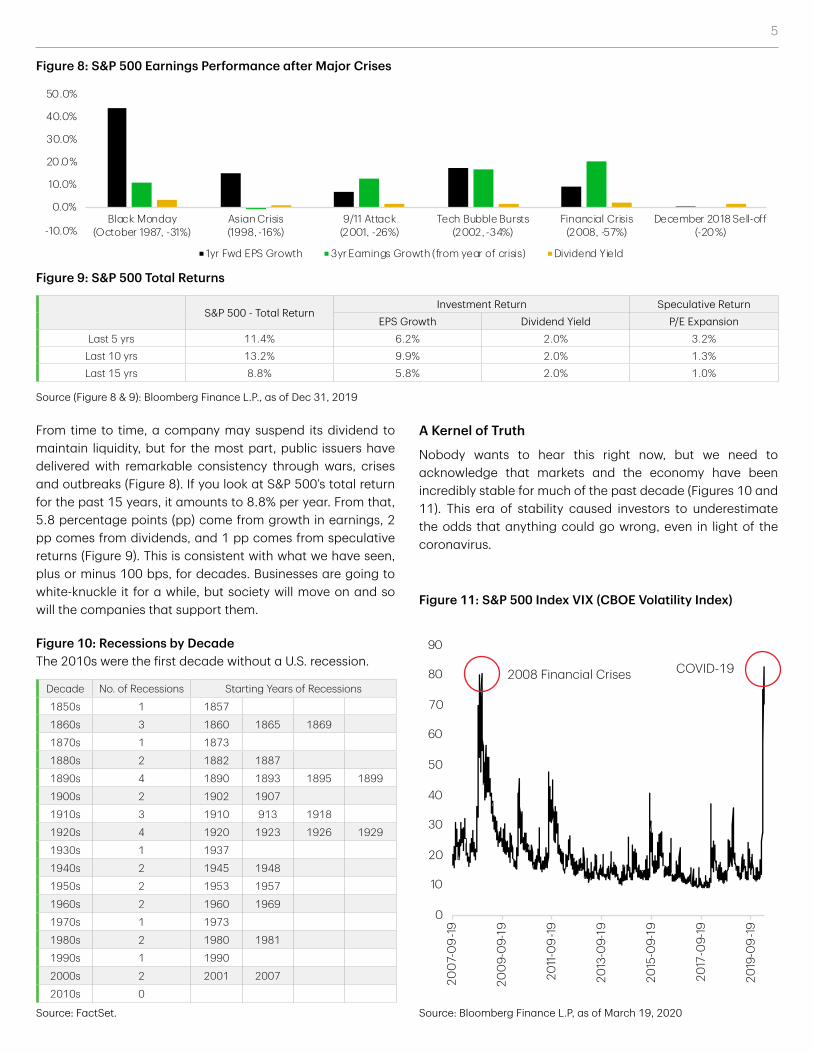
From time to time, a company may suspend its dividend to maintain liquidity, but for the most part, public issuers have delivered with remarkable consistency through wars, crises and outbreaks (Figure 8). If you look at S&P 500’s total return for the past 15 years, it amounts to 8.8% per year. From that, 5.8 percentage points (pp) come from growth in earnings, 2 pp comes from dividends, and 1 pp comes from speculative returns (Figure 9). This is consistent with what we have seen, plus or minus 100 bps, for decades. Businesses are going to white-knuckle it for a while, but society will move on and so will the companies that support them.
S&P 500 - Total ReturnInvestment Return Speculative Return
EPS Growth Dividend Yield P/E ExpansionLast 5 yrs 11.4% 6.2% 2.0% 3.2%
Last 10 yrs 13.2% 9.9% 2.0% 1.3%Last 15 yrs 8.8% 5.8% 2.0% 1.0%
Source (Figure 8 & 9): Bloomberg Finance L.P., as of Dec 31, 2019
Figure 8: S&P 500 Earnings Performance after Major Crises
Figure 9: S&P 500 Total Returns
Decade No. of Recessions Starting Years of Recessions
1850s 1 1857
1860s 3 1860 1865 1869
1870s 1 1873
1880s 2 1882 1887
1890s 4 1890 1893 1895 1899
1900s 2 1902 1907
1910s 3 1910 913 1918
1920s 4 1920 1923 1926 1929
1930s 1 1937
1940s 2 1945 1948
1950s 2 1953 1957
1960s 2 1960 1969
1970s 1 1973
1980s 2 1980 1981
1990s 1 1990
2000s 2 2001 2007
2010s 0
Figure 10: Recessions by DecadeThe 2010s were the first decade without a U.S. recession.
Figure 11: S&P 500 Index VIX (CBOE Volatility Index)
Source: FactSet.
A Kernel of Truth
Nobody wants to hear this right now, but we need to acknowledge that markets and the economy have been incredibly stable for much of the past decade (Figures 10 and 11). This era of stability caused investors to underestimate the odds that anything could go wrong, even in light of the coronavirus.
Source: Bloomberg Finance L.P, as of March 19, 2020
0
10
20
30
40
50
60
70
80
90
200
7-0
9-1
9
200
9-0
9-19
2011
-09
-19
2013
-09-
19
2015
-09-
19
2017
-09-
19
2019
-09
-19
2008 Financial Crises COVID-19
-10.0%
0.0%
10.0%
20.0%
30.0%
40.0%
50.0%
Black Monday(October 1987, -31%)
Asian Crisis(1998, -16%)
9/11 Attack(2001, -26%)
Tech Bubble Bursts(2002, -34%)
Financial Crisis(2008, -57%)
December 2018 Sell-off(-20%)
1yr Fwd EPS Growth 3yr Earnings Growth (from year of crisis) Dividend Yield
6
This is an example of representativeness bias, where investors tend to predict future outcomes based on present information. So, investors start to feel good about the economic news they’re reading, and they project today’s good news into a belief that tomorrow will be great. It’s a “kernel of truth” principle where one takes a partial truth and converts it into a full, and often brighter, truth.
Investors have been doing this for a long time now. There had been 129 months without a recession and 132 months without a 20% market correction, despite growing pressures on the system. The rise of protectionism in the U.S., ballooning tech valuations — these were largely shrugged off by complacent investors.
The converse, however, is also true for bad news, which is what we’re currently seeing. Bad news is being reflected by the incoming data, which becomes representative, which leads to a belief that things are going to go from bad to terrible to catastrophic. These are the two ends of a pendulum swing that we’ve been oscillating between for time immemorial.
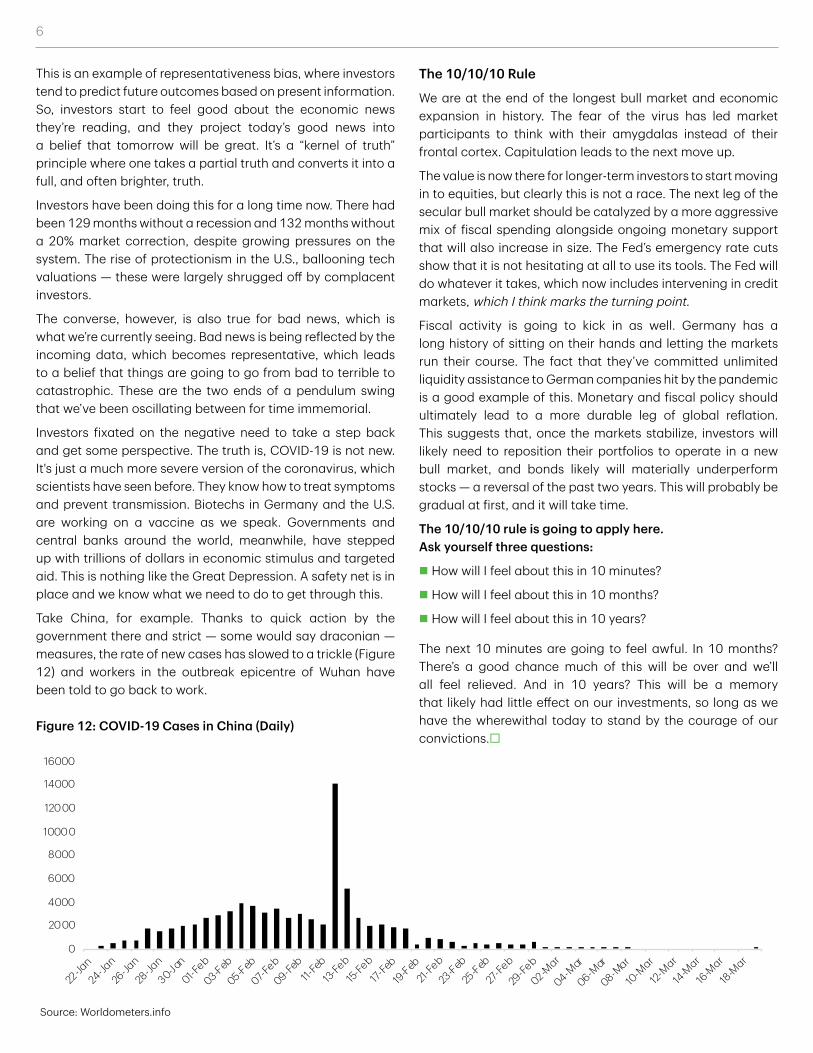
Investors fixated on the negative need to take a step back and get some perspective. The truth is, COVID-19 is not new. It's just a much more severe version of the coronavirus, which scientists have seen before. They know how to treat symptoms and prevent transmission. Biotechs in Germany and the U.S. are working on a vaccine as we speak. Governments and central banks around the world, meanwhile, have stepped up with trillions of dollars in economic stimulus and targeted aid. This is nothing like the Great Depression. A safety net is in place and we know what we need to do to get through this.
Take China, for example. Thanks to quick action by the government there and strict — some would say draconian — measures, the rate of new cases has slowed to a trickle (Figure 12) and workers in the outbreak epicentre of Wuhan have been told to go back to work.
The 10/10/10 Rule
We are at the end of the longest bull market and economic expansion in history. The fear of the virus has led market participants to think with their amygdalas instead of their frontal cortex. Capitulation leads to the next move up.
The value is now there for longer-term investors to start moving in to equities, but clearly this is not a race. The next leg of the secular bull market should be catalyzed by a more aggressive mix of fiscal spending alongside ongoing monetary support that will also increase in size. The Fed’s emergency rate cuts show that it is not hesitating at all to use its tools. The Fed will do whatever it takes, which now includes intervening in credit markets, which I think marks the turning point.
Fiscal activity is going to kick in as well. Germany has a long history of sitting on their hands and letting the markets run their course. The fact that they’ve committed unlimited liquidity assistance to German companies hit by the pandemic is a good example of this. Monetary and fiscal policy should ultimately lead to a more durable leg of global reflation. This suggests that, once the markets stabilize, investors will likely need to reposition their portfolios to operate in a new bull market, and bonds likely will materially underperform stocks — a reversal of the past two years. This will probably be gradual at first, and it will take time.
The 10/10/10 rule is going to apply here. Ask yourself three questions:
n How will I feel about this in 10 minutes?
n How will I feel about this in 10 months?
n How will I feel about this in 10 years?
The next 10 minutes are going to feel awful. In 10 months? There’s a good chance much of this will be over and we’ll all feel relieved. And in 10 years? This will be a memory that likely had little effect on our investments, so long as we have the wherewithal today to stand by the courage of our convictions.¨
Source: Worldometers.info
Figure 12: COVID-19 Cases in China (Daily)
0
2000
4000
6000
8000
10000
12000
14000
16000
22-Ja
n
24-Ja
n
26-Ja
n
28-Ja
n
30-Jan
01-Feb
03-Feb
05-Feb
07-Feb
09-Feb
11-Fe
b13-
Feb
15-Fe
b
17-Fe
b
19-Feb
21-Fe
b
23-Feb
25-Feb
27-Fe
b
29-Fe
b
02-Mar
04-Mar
06-Mar
08-Mar
10-M
ar
12-Mar
14-M
ar
16-M
ar
18-M
ar
7
Cometh the Reckoning Fixed Income Markets
The panic-selling that sunk valuations in late February and early March weren’t restricted to the risky equities markets. A frenzied flight to safety may have driven investors into sovereign bonds — pushing the yield on the 10-year Treasury down to an unimaginable low of 0.31% — but they didn’t stop there, also dragging investors out of the corporate side of the bond market.
Over the last week of February, investment-grade, high-yield and emerging-market corporate debt saw a net outflow of US$16.1-billion — the second biggest sell-off in the history of corporate debt. This was eclipsed only by the “Taper Tantrum” of 2013, when the Federal Reserve announced that it would be “tapering off” asset purchases under its quantitative easing program.
In a world that had already been teetering on the precipice of a global recession, the rise of a pandemic seems to have driven market participants into only the safest assets. Even the Fed’s emergency rate cuts have done little to calm frayed nerves. Investors are looking for support and, with rates already near zero in the U.S., they’re counting on the Fed to ramp up its quantitative easing program.
The good news for bond-market investors is that the Fed has been highly attuned to falling yields, and particularly yield curve inversions. In July 2019, a month after the 10-year yield fell below the three-month, the Fed responded with three 25-bps cuts before announcing in December that its “mid-cycle adjustment” was complete. This proved somewhat optimistic, although the Fed could not have foreseen the rise of COVID-19.
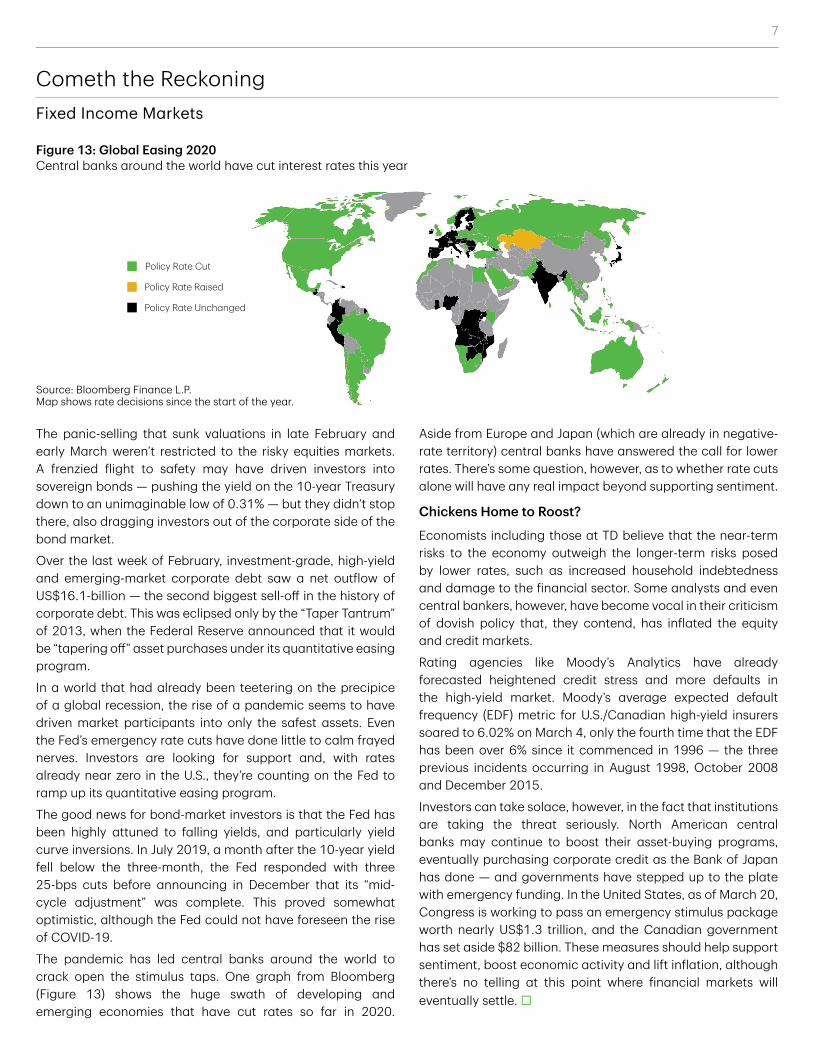
The pandemic has led central banks around the world to crack open the stimulus taps. One graph from Bloomberg (Figure 13) shows the huge swath of developing and emerging economies that have cut rates so far in 2020.
Aside from Europe and Japan (which are already in negative-rate territory) central banks have answered the call for lower rates. There’s some question, however, as to whether rate cuts alone will have any real impact beyond supporting sentiment.
Chickens Home to Roost?
Economists including those at TD believe that the near-term risks to the economy outweigh the longer-term risks posed by lower rates, such as increased household indebtedness and damage to the financial sector. Some analysts and even central bankers, however, have become vocal in their criticism of dovish policy that, they contend, has inflated the equity and credit markets.
Rating agencies like Moody’s Analytics have already forecasted heightened credit stress and more defaults in the high-yield market. Moody’s average expected default frequency (EDF) metric for U.S./Canadian high-yield insurers soared to 6.02% on March 4, only the fourth time that the EDF has been over 6% since it commenced in 1996 — the three previous incidents occurring in August 1998, October 2008 and December 2015.
Investors can take solace, however, in the fact that institutions are taking the threat seriously. North American central banks may continue to boost their asset-buying programs, eventually purchasing corporate credit as the Bank of Japan has done — and governments have stepped up to the plate with emergency funding. In the United States, as of March 20, Congress is working to pass an emergency stimulus package worth nearly US$1.3 trillion, and the Canadian government has set aside $82 billion. These measures should help support sentiment, boost economic activity and lift inflation, although there’s no telling at this point where financial markets will eventually settle. ¨
Figure 13: Global Easing 2020
Policy Rate Unchanged
Policy Rate Raised
Policy Rate Cut
Source: Bloomberg Finance L.P. Map shows rate decisions since the start of the year.
Central banks around the world have cut interest rates this year
8
China’s Silver Lining Equity Markets
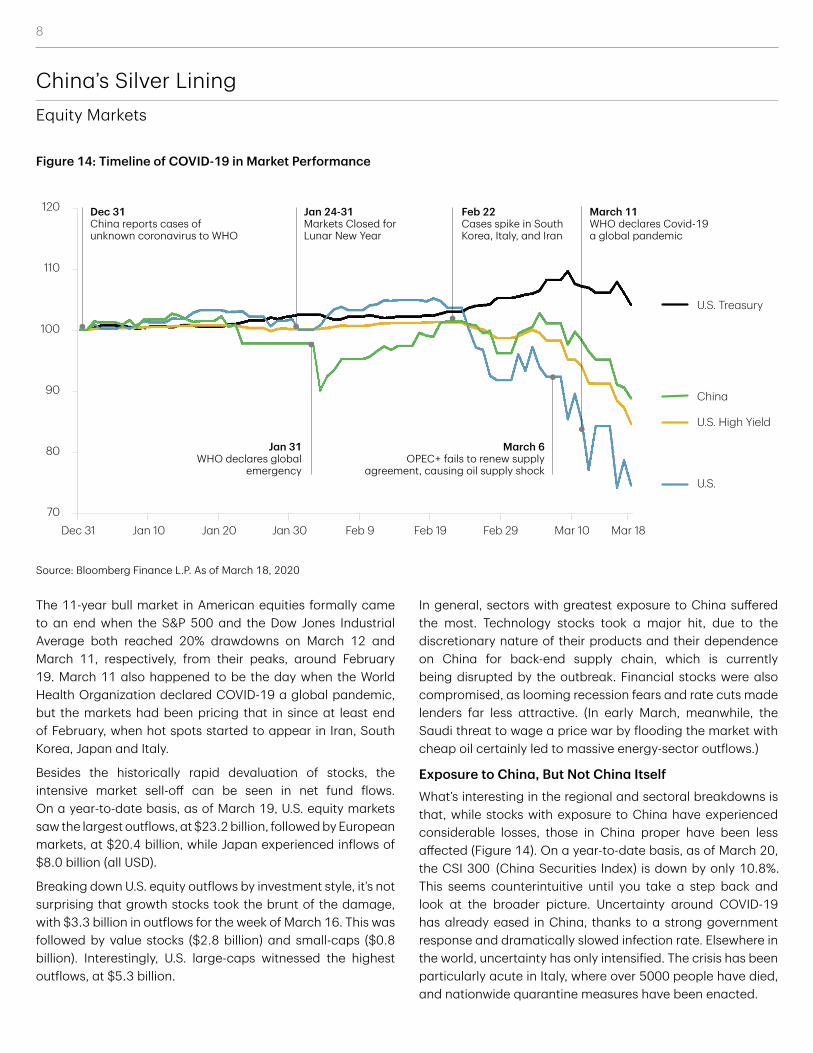
The 11-year bull market in American equities formally came to an end when the S&P 500 and the Dow Jones Industrial Average both reached 20% drawdowns on March 12 and March 11, respectively, from their peaks, around February 19. March 11 also happened to be the day when the World Health Organization declared COVID-19 a global pandemic, but the markets had been pricing that in since at least end of February, when hot spots started to appear in Iran, South Korea, Japan and Italy.
Besides the historically rapid devaluation of stocks, the intensive market sell-off can be seen in net fund flows. On a year-to-date basis, as of March 19, U.S. equity markets saw the largest outflows, at $23.2 billion, followed by European markets, at $20.4 billion, while Japan experienced inflows of $8.0 billion (all USD).
Breaking down U.S. equity outflows by investment style, it’s not surprising that growth stocks took the brunt of the damage, with $3.3 billion in outflows for the week of March 16. This was followed by value stocks ($2.8 billion) and small-caps ($0.8 billion). Interestingly, U.S. large-caps witnessed the highest outflows, at $5.3 billion.
In general, sectors with greatest exposure to China suffered the most. Technology stocks took a major hit, due to the discretionary nature of their products and their dependence on China for back-end supply chain, which is currently being disrupted by the outbreak. Financial stocks were also compromised, as looming recession fears and rate cuts made lenders far less attractive. (In early March, meanwhile, the Saudi threat to wage a price war by flooding the market with cheap oil certainly led to massive energy-sector outflows.)
Exposure to China, But Not China ItselfWhat’s interesting in the regional and sectoral breakdowns is that, while stocks with exposure to China have experienced considerable losses, those in China proper have been less affected (Figure 14). On a year-to-date basis, as of March 20, the CSI 300 (China Securities Index) is down by only 10.8%. This seems counterintuitive until you take a step back and look at the broader picture. Uncertainty around COVID-19 has already eased in China, thanks to a strong government response and dramatically slowed infection rate. Elsewhere in the world, uncertainty has only intensified. The crisis has been particularly acute in Italy, where over 5000 people have died, and nationwide quarantine measures have been enacted.
Source: Bloomberg Finance L.P. As of March 18, 2020
Figure 14: Timeline of COVID-19 in Market Performance
120
110
100
90
70
80
U.S. Treasury
U.S. High Yield
U.S.
China
Dec 31 Jan 10 Jan 20 Jan 30 Feb 9 Feb 19 Feb 29 Mar 10 Mar 18
Dec 31 China reports cases of unknown coronavirus to WHO
Jan 24-31 Markets Closed for Lunar New Year
Feb 22 Cases spike in South Korea, Italy, and Iran
March 6 OPEC+ fails to renew supply
agreement, causing oil supply shock
March 11WHO declares Covid-19 a global pandemic
Jan 31 WHO declares global
emergency
9
The Chinese government’s ability to enact strict public health protocols and its enormous infusion of liquidity has played a vital role in pacifying Chinese investors. The People’s Bank of China (PBoC) has pledged to pump $168 billion into its financial system. Under a “reverse repo” scheme, the PBoC has agreed to purchase a range of securities from investors seeking ready cash. Another reason Chinese stocks have been able to better weather the storm may come down to valuation; equities in emerging markets suffered a massive correction in December 2018. Emerging-market performance in 2019 lagged the S&P 500’s stellar performance of 30%. As of December 31, 2019, the forward price/earnings ratios for the S&P 500 and MSCI Emerging Market Index stood at 19.7x and 14.6x, respectively.
If there’s a silver lining to be found in all of this — and perhaps a modicum of hope — it’s in the leading indicator that the Chinese experience represents. On December 31, China
first alerted the World Health Organization of flu-like cases. Ten weeks later, the crisis has already abated and many workers in the quarantined epicentre of Wuhan have been told to go back to work. In fact, a few Chinese stocks have even posted record highs during this period.
Analysts have noted that Western nations like the U.S. can't impose the same kinds of restrictions as a centralized authoritarian regime like China, but recent examples suggest that this is not necessarily true. In Italy, the government has imposed quarantine-like measures across the entire nation. In the United States, the White House has restricted European travellers. Country by country, borders are closing and states of emergency are being instituted. With fiscal stimulus, monetary stimulus and pandemic protocols all coming on line simultaneously, there's anecdotal evidence and some hard data (see "The Courage of Our Convictions," above) to suggest the crisis may be over in a month or two. ¨
Impact on the Outlook Economics
Beata Caranci, SVP & Chief Economist, TD Economics
In late January, I wrote a piece outlining a thought framework on the economic transmission of COVID-19. At that time, it didn’t even have a name. This is a good time to revisit that framework with the benefit of some data and hindsight.
Financial markets are sitting at the nexus of peak uncertainty. News is rapidly evolving, literally from one day to the next. In that January article, I made several points that have since been reinforced.
Many analysts were using the SARS experience to gauge potential economic impact. Although that episode offers limited comparability to today's global scale of economic disruptions, it still proved to be a good reference on how the opaqueness surrounding the spread of the virus would worsen in the weeks ahead. (Check. This indeed has lived up to expectations.)
Markets always fear what they cannot accurately measure.(Check. The VIX surged north of the 60-threshold, consistent with the rapid stock-market correction of 25% from peak levels in February.)
Along this vein, we noted to expect bouts of volatility to persist. (Check. This has a low probability of abating in the very near term, not until data can confirm successful containment
within some of the highly impacted regions. This could then become a signal that the same success can be achieved in North America, imparting a relatively short-lived shock on corporate earnings and the economy.)
Also in the January Perspective, three pathways were identified to help monitor the transmission and depth of economic impacts. The first two pathways would be dependent on the success of China and other countries to limit its spread, combined with consideration of the economic reach of the impacted regions. This has evolved into largely a bad news story, with some glimmers of hope.
On the latter, China’s aggressive quarantine measures created a large near-term hit to economic activity. Early reads of February data are confirming an unprecedented downturn. China’s manufacturing PMI went into a freefall, hitting 35.7 in February. This is lower than the financial crisis experience (38.8). But, we hope this will mark the trough. The rapid decline in reported new virus cases is already prompting Chinese authorities to attempt to normalize operations by the end of this quarter. Absent another large breakout elsewhere in the country, we estimate that China’s economy will contract in the first quarter, which will mark a first in China's modern history.
10
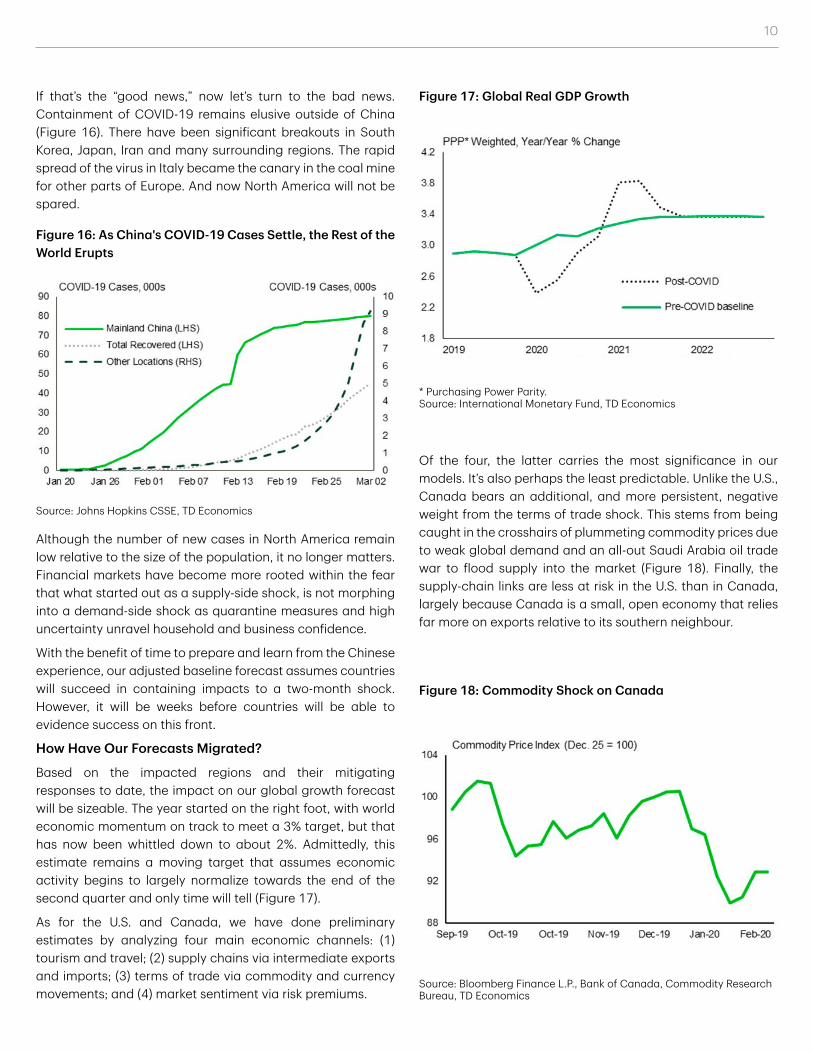
If that’s the “good news,” now let’s turn to the bad news. Containment of COVID-19 remains elusive outside of China (Figure 16). There have been significant breakouts in South Korea, Japan, Iran and many surrounding regions. The rapid spread of the virus in Italy became the canary in the coal mine for other parts of Europe. And now North America will not be spared.
Although the number of new cases in North America remain low relative to the size of the population, it no longer matters. Financial markets have become more rooted within the fear that what started out as a supply-side shock, is not morphing into a demand-side shock as quarantine measures and high uncertainty unravel household and business confidence.
With the benefit of time to prepare and learn from the Chinese experience, our adjusted baseline forecast assumes countries will succeed in containing impacts to a two-month shock. However, it will be weeks before countries will be able to evidence success on this front.
How Have Our Forecasts Migrated?
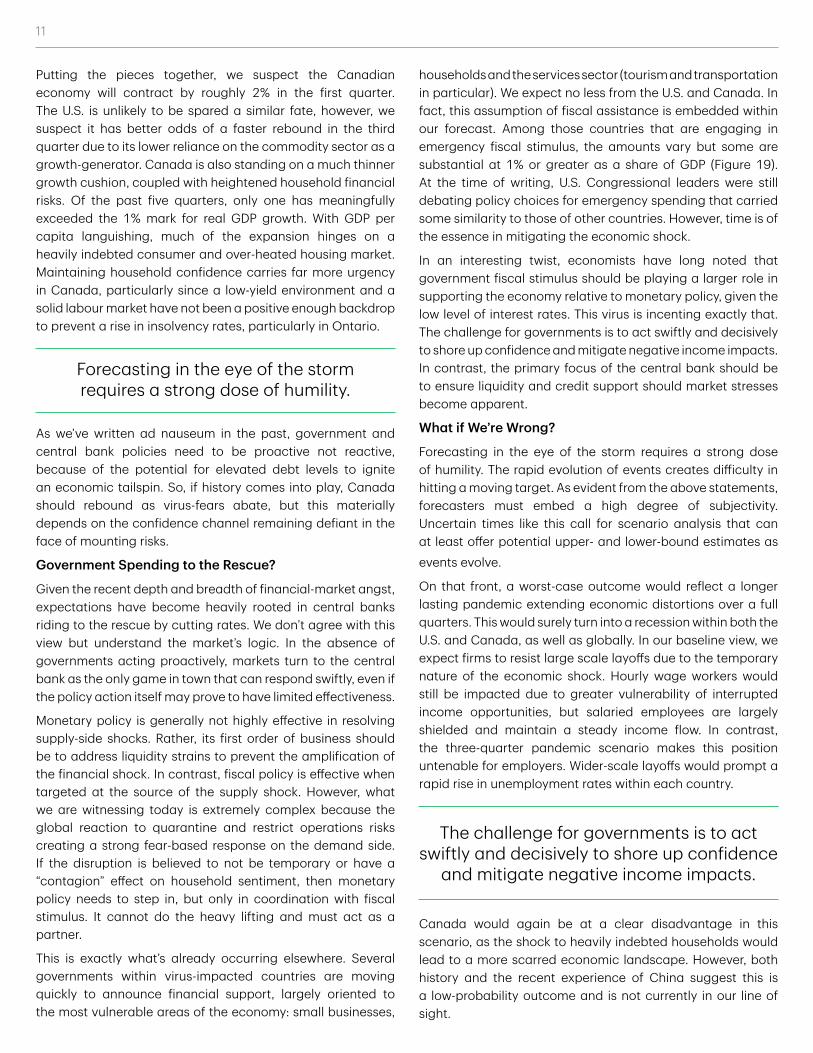
Based on the impacted regions and their mitigating responses to date, the impact on our global growth forecast will be sizeable. The year started on the right foot, with world economic momentum on track to meet a 3% target, but that has now been whittled down to about 2%. Admittedly, this estimate remains a moving target that assumes economic activity begins to largely normalize towards the end of the second quarter and only time will tell (Figure 17).
As for the U.S. and Canada, we have done preliminary estimates by analyzing four main economic channels: (1) tourism and travel; (2) supply chains via intermediate exports and imports; (3) terms of trade via commodity and currency movements; and (4) market sentiment via risk premiums.
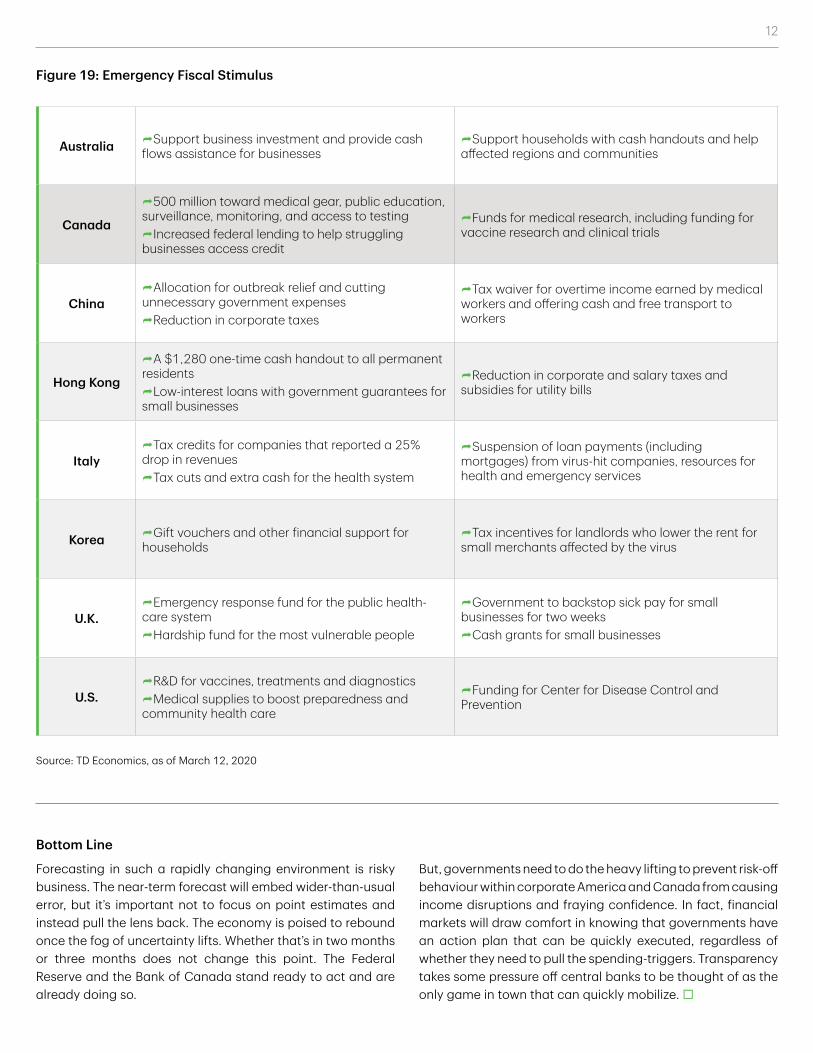
Of the four, the latter carries the most significance in our models. It’s also perhaps the least predictable. Unlike the U.S., Canada bears an additional, and more persistent, negative weight from the terms of trade shock. This stems from being caught in the crosshairs of plummeting commodity prices due to weak global demand and an all-out Saudi Arabia oil trade war to flood supply into the market (Figure 18). Finally, the supply-chain links are less at risk in the U.S. than in Canada, largely because Canada is a small, open economy that relies far more on exports relative to its southern neighbour.
Source: Johns Hopkins CSSE, TD Economics
Figure 16: As China's COVID-19 Cases Settle, the Rest of the World Erupts
* Purchasing Power Parity. Source: International Monetary Fund, TD Economics
Figure 17: Global Real GDP Growth
Source: Bloomberg Finance L.P., Bank of Canada, Commodity Research Bureau, TD Economics
Figure 18: Commodity Shock on Canada
11
Putting the pieces together, we suspect the Canadian economy will contract by roughly 2% in the first quarter. The U.S. is unlikely to be spared a similar fate, however, we suspect it has better odds of a faster rebound in the third quarter due to its lower reliance on the commodity sector as a growth-generator. Canada is also standing on a much thinner growth cushion, coupled with heightened household financial risks. Of the past five quarters, only one has meaningfully exceeded the 1% mark for real GDP growth. With GDP per capita languishing, much of the expansion hinges on a heavily indebted consumer and over-heated housing market. Maintaining household confidence carries far more urgency in Canada, particularly since a low-yield environment and a solid labour market have not been a positive enough backdrop to prevent a rise in insolvency rates, particularly in Ontario.
Forecasting in the eye of the storm requires a strong dose of humility.
As we’ve written ad nauseum in the past, government and central bank policies need to be proactive not reactive, because of the potential for elevated debt levels to ignite an economic tailspin. So, if history comes into play, Canada should rebound as virus-fears abate, but this materially depends on the confidence channel remaining defiant in the face of mounting risks.
Government Spending to the Rescue?
Given the recent depth and breadth of financial-market angst, expectations have become heavily rooted in central banks riding to the rescue by cutting rates. We don’t agree with this view but understand the market’s logic. In the absence of governments acting proactively, markets turn to the central bank as the only game in town that can respond swiftly, even if the policy action itself may prove to have limited effectiveness.
Monetary policy is generally not highly effective in resolving supply-side shocks. Rather, its first order of business should be to address liquidity strains to prevent the amplification of the financial shock. In contrast, fiscal policy is effective when targeted at the source of the supply shock. However, what we are witnessing today is extremely complex because the global reaction to quarantine and restrict operations risks creating a strong fear-based response on the demand side. If the disruption is believed to not be temporary or have a “contagion” effect on household sentiment, then monetary policy needs to step in, but only in coordination with fiscal stimulus. It cannot do the heavy lifting and must act as a partner.
This is exactly what’s already occurring elsewhere. Several governments within virus-impacted countries are moving quickly to announce financial support, largely oriented to the most vulnerable areas of the economy: small businesses,
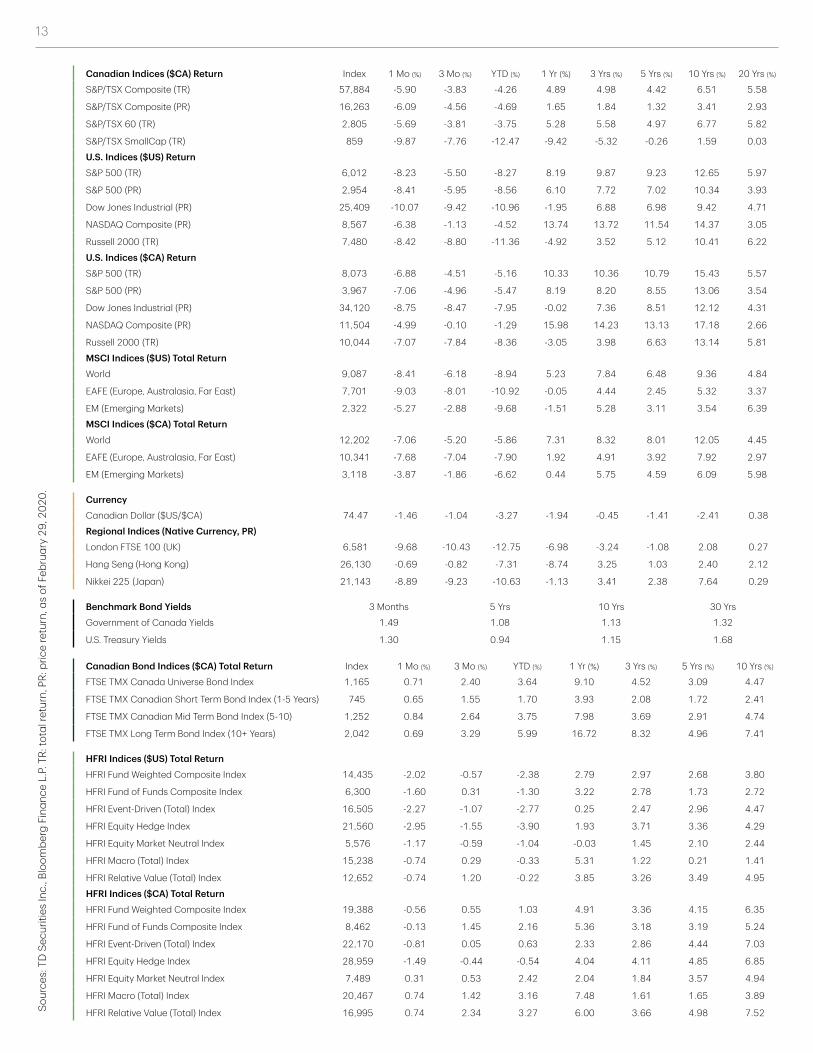
households and the services sector (tourism and transportation in particular). We expect no less from the U.S. and Canada. In fact, this assumption of fiscal assistance is embedded within our forecast. Among those countries that are engaging in emergency fiscal stimulus, the amounts vary but some are substantial at 1% or greater as a share of GDP (Figure 19). At the time of writing, U.S. Congressional leaders were still debating policy choices for emergency spending that carried some similarity to those of other countries. However, time is of the essence in mitigating the economic shock.
In an interesting twist, economists have long noted that government fiscal stimulus should be playing a larger role in supporting the economy relative to monetary policy, given the low level of interest rates. This virus is incenting exactly that. The challenge for governments is to act swiftly and decisively to shore up confidence and mitigate negative income impacts. In contrast, the primary focus of the central bank should be to ensure liquidity and credit support should market stresses become apparent.
What if We’re Wrong?
Forecasting in the eye of the storm requires a strong dose of humility. The rapid evolution of events creates difficulty in hitting a moving target. As evident from the above statements, forecasters must embed a high degree of subjectivity. Uncertain times like this call for scenario analysis that can at least offer potential upper- and lower-bound estimates as events evolve.
On that front, a worst-case outcome would reflect a longer lasting pandemic extending economic distortions over a full quarters. This would surely turn into a recession within both the U.S. and Canada, as well as globally. In our baseline view, we expect firms to resist large scale layoffs due to the temporary nature of the economic shock. Hourly wage workers would still be impacted due to greater vulnerability of interrupted income opportunities, but salaried employees are largely shielded and maintain a steady income flow. In contrast, the three-quarter pandemic scenario makes this position untenable for employers. Wider-scale layoffs would prompt a rapid rise in unemployment rates within each country.
The challenge for governments is to act swiftly and decisively to shore up confidence
and mitigate negative income impacts.
Canada would again be at a clear disadvantage in this scenario, as the shock to heavily indebted households would lead to a more scarred economic landscape. However, both history and the recent experience of China suggest this is a low-probability outcome and is not currently in our line of sight.
12
Bottom Line
Forecasting in such a rapidly changing environment is risky business. The near-term forecast will embed wider-than-usual error, but it’s important not to focus on point estimates and instead pull the lens back. The economy is poised to rebound once the fog of uncertainty lifts. Whether that’s in two months or three months does not change this point. The Federal Reserve and the Bank of Canada stand ready to act and are already doing so.
But, governments need to do the heavy lifting to prevent risk-off behaviour within corporate America and Canada from causing income disruptions and fraying confidence. In fact, financial markets will draw comfort in knowing that governments have an action plan that can be quickly executed, regardless of whether they need to pull the spending-triggers. Transparency takes some pressure off central banks to be thought of as the only game in town that can quickly mobilize. ¨
Australia ÌSupport business investment and provide cash flows assistance for businesses
ÌSupport households with cash handouts and help affected regions and communities
Canada
Ì500 million toward medical gear, public education, surveillance, monitoring, and access to testingÌIncreased federal lending to help struggling businesses access credit
ÌFunds for medical research, including funding for vaccine research and clinical trials
ChinaÌAllocation for outbreak relief and cutting unnecessary government expensesÌReduction in corporate taxes
ÌTax waiver for overtime income earned by medical workers and offering cash and free transport to workers
Hong Kong
ÌA $1,280 one-time cash handout to all permanent residentsÌLow-interest loans with government guarantees for small businesses
ÌReduction in corporate and salary taxes and subsidies for utility bills
ItalyÌTax credits for companies that reported a 25% drop in revenuesÌTax cuts and extra cash for the health system
ÌSuspension of loan payments (including mortgages) from virus-hit companies, resources for health and emergency services
Korea ÌGift vouchers and other financial support for households
ÌTax incentives for landlords who lower the rent for small merchants affected by the virus
U.K.ÌEmergency response fund for the public health-care systemÌHardship fund for the most vulnerable people
ÌGovernment to backstop sick pay for small businesses for two weeksÌCash grants for small businesses
U.S.ÌR&D for vaccines, treatments and diagnosticsÌMedical supplies to boost preparedness and community health care
ÌFunding for Center for Disease Control and Prevention
Source: TD Economics, as of March 12, 2020
Figure 19: Emergency Fiscal Stimulus
13
Canadian Indices ($CA) Return Index 1 Mo (%) 3 Mo (%) YTD (%) 1 Yr (%) 3 Yrs (%) 5 Yrs (%) 10 Yrs (%) 20 Yrs (%)
S&P/TSX Composite (TR) 57,884 -5.90 -3.83 -4.26 4.89 4.98 4.42 6.51 5.58
S&P/TSX Composite (PR) 16,263 -6.09 -4.56 -4.69 1.65 1.84 1.32 3.41 2.93
S&P/TSX 60 (TR) 2,805 -5.69 -3.81 -3.75 5.28 5.58 4.97 6.77 5.82
S&P/TSX SmallCap (TR) 859 -9.87 -7.76 -12.47 -9.42 -5.32 -0.26 1.59 0.03
U.S. Indices ($US) ReturnS&P 500 (TR) 6,012 -8.23 -5.50 -8.27 8.19 9.87 9.23 12.65 5.97
S&P 500 (PR) 2,954 -8.41 -5.95 -8.56 6.10 7.72 7.02 10.34 3.93
Dow Jones Industrial (PR) 25,409 -10.07 -9.42 -10.96 -1.95 6.88 6.98 9.42 4.71
NASDAQ Composite (PR) 8,567 -6.38 -1.13 -4.52 13.74 13.72 11.54 14.37 3.05
Russell 2000 (TR) 7,480 -8.42 -8.80 -11.36 -4.92 3.52 5.12 10.41 6.22
U.S. Indices ($CA) ReturnS&P 500 (TR) 8,073 -6.88 -4.51 -5.16 10.33 10.36 10.79 15.43 5.57
S&P 500 (PR) 3,967 -7.06 -4.96 -5.47 8.19 8.20 8.55 13.06 3.54
Dow Jones Industrial (PR) 34,120 -8.75 -8.47 -7.95 -0.02 7.36 8.51 12.12 4.31
NASDAQ Composite (PR) 11,504 -4.99 -0.10 -1.29 15.98 14.23 13.13 17.18 2.66
Russell 2000 (TR) 10,044 -7.07 -7.84 -8.36 -3.05 3.98 6.63 13.14 5.81
MSCI Indices ($US) Total ReturnWorld 9,087 -8.41 -6.18 -8.94 5.23 7.84 6.48 9.36 4.84
EAFE (Europe, Australasia, Far East) 7,701 -9.03 -8.01 -10.92 -0.05 4.44 2.45 5.32 3.37
EM (Emerging Markets) 2,322 -5.27 -2.88 -9.68 -1.51 5.28 3.11 3.54 6.39
MSCI Indices ($CA) Total ReturnWorld 12,202 -7.06 -5.20 -5.86 7.31 8.32 8.01 12.05 4.45
EAFE (Europe, Australasia, Far East) 10,341 -7.68 -7.04 -7.90 1.92 4.91 3.92 7.92 2.97
EM (Emerging Markets) 3,118 -3.87 -1.86 -6.62 0.44 5.75 4.59 6.09 5.98
Sour
ces:
TD
Sec
uriti
es In
c., B
loom
berg
Fin
ance
L.P
. TR:
tota
l ret
urn,
PR:
pric
e re
turn
, as
of F
ebru
ary
29, 2
020.
Benchmark Bond Yields 3 Months 5 Yrs 10 Yrs 30 Yrs
Government of Canada Yields 1.49 1.08 1.13 1.32
U.S. Treasury Yields 1.30 0.94 1.15 1.68
Canadian Bond Indices ($CA) Total Return Index 1 Mo (%) 3 Mo (%) YTD (%) 1 Yr (%) 3 Yrs (%) 5 Yrs (%) 10 Yrs (%)
FTSE TMX Canada Universe Bond Index 1,165 0.71 2.40 3.64 9.10 4.52 3.09 4.47
FTSE TMX Canadian Short Term Bond Index (1-5 Years) 745 0.65 1.55 1.70 3.93 2.08 1.72 2.41
FTSE TMX Canadian Mid Term Bond Index (5-10) 1,252 0.84 2.64 3.75 7.98 3.69 2.91 4.74
FTSE TMX Long Term Bond Index (10+ Years) 2,042 0.69 3.29 5.99 16.72 8.32 4.96 7.41
CurrencyCanadian Dollar ($US/$CA) 74.47 -1.46 -1.04 -3.27 -1.94 -0.45 -1.41 -2.41 0.38
Regional Indices (Native Currency, PR)London FTSE 100 (UK) 6,581 -9.68 -10.43 -12.75 -6.98 -3.24 -1.08 2.08 0.27
Hang Seng (Hong Kong) 26,130 -0.69 -0.82 -7.31 -8.74 3.25 1.03 2.40 2.12
Nikkei 225 (Japan) 21,143 -8.89 -9.23 -10.63 -1.13 3.41 2.38 7.64 0.29
HFRI Indices ($US) Total ReturnHFRI Fund Weighted Composite Index 14,435 -2.02 -0.57 -2.38 2.79 2.97 2.68 3.80
HFRI Fund of Funds Composite Index 6,300 -1.60 0.31 -1.30 3.22 2.78 1.73 2.72
HFRI Event-Driven (Total) Index 16,505 -2.27 -1.07 -2.77 0.25 2.47 2.96 4.47
HFRI Equity Hedge Index 21,560 -2.95 -1.55 -3.90 1.93 3.71 3.36 4.29
HFRI Equity Market Neutral Index 5,576 -1.17 -0.59 -1.04 -0.03 1.45 2.10 2.44
HFRI Macro (Total) Index 15,238 -0.74 0.29 -0.33 5.31 1.22 0.21 1.41
HFRI Relative Value (Total) Index 12,652 -0.74 1.20 -0.22 3.85 3.26 3.49 4.95
HFRI Indices ($CA) Total ReturnHFRI Fund Weighted Composite Index 19,388 -0.56 0.55 1.03 4.91 3.36 4.15 6.35
HFRI Fund of Funds Composite Index 8,462 -0.13 1.45 2.16 5.36 3.18 3.19 5.24
HFRI Event-Driven (Total) Index 22,170 -0.81 0.05 0.63 2.33 2.86 4.44 7.03
HFRI Equity Hedge Index 28,959 -1.49 -0.44 -0.54 4.04 4.11 4.85 6.85
HFRI Equity Market Neutral Index 7,489 0.31 0.53 2.42 2.04 1.84 3.57 4.94
HFRI Macro (Total) Index 20,467 0.74 1.42 3.16 7.48 1.61 1.65 3.89
HFRI Relative Value (Total) Index 16,995 0.74 2.34 3.27 6.00 3.66 4.98 7.52
14
S&P 500 - Bear Market Time to recover back to previous level Volatility
Type Start End Length (m) Decline (%) Nominal (m) Real (m) Peak to trough
Trough to recovery
S May-1835 Mar-1842 82 -56 259 - 13 17
C Aug-1847 Nov-1848 15 -23 42 - 8 9
C Dec-1852 Oct-1857 58 -65 67 - 19 25
C Mar-1858 Jul-1859 16 -23 11 - 21 15
C Oct-1860 Jul-1861 9 -32 15 - 31 17
C Apr-1864 Apr-1865 12 -26 48 - 14 8
S Feb-1873 Jun-1877 52 -47 32 11 11 11
C Jun-1881 Jan-1885 43 -36 191 17 9 11
C May-1887 Aug-1893 75 -31 65 49 10 12
C Sep-1902 Oct-1903 13 -29 17 22 9 10
E Sep-1906 Nov-1907 14 -38 21 250 15 11
C Dec-1909 Dec-1914 60 -29 121 159 9 12
C Nov-1916 Dec-1917 13 -33 85 116 12 12
C Jul-1919 Aug-1921 25 -32 39 14 15 10
S Sep-1929 Jun-1932 33 -85 266 284 30 20
S Mar-1937 Apr-1942 62 -59 49 151 20 10
C May-1946 Mar-1948 21 -28 27 73 14 12
E Aug-1956 Oct-1957 15 -22 11 13 9 9
E Dec-1961 Jun-1962 6 -28 14 18 15 9
E Feb-1966 Oct-1966 8 -22 7 24 10 8
C Nov-1968 May-1970 18 -36 21 270 9 10
S Jan-1973 Oct-1974 21 -48 69 154 15 11
C Nov-1980 Aug-1982 20 -27 3 8 12 20
E Aug-1987 Dec-1987 3.3 -34 20 49 45 13
C Jul-1990 Oct-1990 3 -20 4 6 17 14
S Mar-2000 Oct-2002 30 -49 56 148 19 11
S Oct-2007 Mar-2009 17 -57 49 55 32 16
Average 28 -38 60 90 16 13
Median 18 -32 39 49 14 11
Average Structural 42 -57 111 134 20 14
Average Cyclical 27 -31 50 73 14 13
Average Event-Driven 9 -29 15 71 19 10
Appendix A: U.S. Bear Markets and Recoveries since the 1800s
Source: Robert Shiller, Yale Department of Economics. S: Structural, C:Cyclical, E: Event-driven

15
The information contained herein has been provided by TD Wealth and is for information purposes only. The information has been drawn from sources believed to be reliable. Graphs and charts are used for illustrative purposes only and do not reflect future values or future performance of any investment. The information does not provide financial, legal, tax or investment advice. Particular investment, tax, or trading strategies should be evaluated relative to each individual’s objectives and risk tolerance.
Certain statements in this document may contain forward-looking statements (“FLS”) that are predictive in nature and may include words such as “expects”, “anticipates”, “intends”, “believes”, “estimates” and similar forward- looking expressions or negative versions thereof. FLS are based on current expectations and projections about future general economic, political and relevant market factors, such as interest and foreign exchange rates, equity and capital markets, the general business environment, assuming no changes to tax or other laws or government tregulation or catastrophic events. Expectations and projections about future events are inherently subject to risks and uncertainties, which may be unforeseeable. Such expectations and projections may be incorrect in the future. FLS are not guarantees of future performance. Actual events could differ materially from those expressed or implied in any FLS. A number of important factors including those factors set out above can contribute to these digressions. You should avoid placing any reliance on FLS.
TD Wealth represents the products and services offered by TD Waterhouse Canada Inc., TD Waterhouse Private Investment Counsel Inc., TD Wealth Private Banking (offered by The Toronto-Dominion Bank) and TD Wealth Private Trust (offered by The Canada Trust Company).
Source: London Stock Exchange Group plc and its group undertakings (collectively, the “LSE Group”). © LSE Group 2020. FTSE Russell is a trading name of certain of the LSE Group companies. “FTSE®”, “Russell®”, and “FTSE Russell®” are trademarks of the relevant LSE Group companies and are used by any other LSE Group company under license. “TMX®” is a trade mark of TSX, Inc. and used by the LSE Group under license. All rights in the FTSE Russell indexes or data vest in the relevant LSE Group company which owns the index or the data. Neither LSE Group nor its licensors accept any liability for any errors or omissions in the indexes or data and no party may rely on any indexes or data contained in this communication. No further distribution of data from the LSE Group is permitted without the relevant LSE Group company’s express written consent. The LSE Group does not promote, sponsor or endorse the content of this communication.
Bloomberg and Bloomberg.com are trademarks and service marks of Bloomberg Finance L.P., a Delaware limited partnership, or its subsidiaries. All rights reserved.
All trademarks are the property of their respective owners.
® The TD logo and other trade-marks are the property of The Toronto-Dominion Bank.